ethiopia extractive industries transparency initiative …€¦ · extractive industries...
TRANSCRIPT

This Report has been prepared at the request of the National Steering Committee (NSC) charged with the implementation of the Extractive Industries Transparency Initiative in Ethiopia. The views expressed in the report are those of the Independent Administrator and in no way reflect the official opinion of the NSC. This Report has been prepared exclusively for use by the NSC members and must not be used by other parties, nor for any purposes other than those for which it is intended.
ETHIOPIA EXTRACTIVE INDUSTRIES TRANSPARENCY
INITIATIVE (EEITI)
EEITI report for the year ended 7 July 2014
Final
February 2016
EEITI Report for the year ended 7 July 2014
Moore Stephens LLP | P a g e 2
Table of Contents
INTRODUCTION ..................................................................................................... 5
Extractive Industries Transparency Initiative (EITI) ........................................................ 5
EITI in Ethiopia............................................................................................................... 5
Objective ........................................................................................................................ 5
Nature and extent of our work ........................................................................................ 5
1. EXECUTIVE SUMMARY ................................................................................ 7
1.1. EITI scope ............................................................................................................ 7
1.2. Revenue generated from the extractive industries ................................................ 7
1.3. Production ............................................................................................................ 8
1.4. Completeness and Accuracy of Data ................................................................... 9
1.5. Reconciliation of cash flows ............................................................................... 10
2. APPROACH AND METHODOLOGY ........................................................... 12
2.1. Scoping study .................................................................................................... 12
2.2. Data collection ................................................................................................... 12
2.3. Reconciliation and investigation of discrepancies ............................................... 12
2.4. Reliability and credibility of data reported ........................................................... 13
2.5. Basis of reporting ............................................................................................... 14
3. CONTEXTUAL INFORMTION ON THE EXTRACTIVE INDUSTRIES ......... 15
3.1. Oil and Gas Sector ............................................................................................. 15
3.2. Mining sector in Ethiopia .................................................................................... 19
3.3. Collection and distribution of the extractive industries revenues ......................... 31
3.4. Beneficial ownership .......................................................................................... 34
3.5. State participation in the Extractive industries and SOEs ................................... 34
3.6. Audit and assurance practices in Ethiopia .......................................................... 35
4. DETERMINATION OF THE RECONCILIATION SCOPE ............................. 36
4.1. Selection of payment flows and information to be reported ................................ 36
4.2. Extractive companies ......................................................................................... 40
4.3. Government Entities ........................................................................................... 42
5. RECONCILIATION RESULTS ..................................................................... 43
6. REPORTED DATA ANALYSIS .................................................................... 58
7. RECOMMENDATIONS ................................................................................ 68
ANNEXES ............................................................................................................. 75
Annex 1: Employment figures in the reconciled companies .......................................... 76
Annex 2: List of licenses active during the reporting period 2013/14 ............................ 77

EEITI Report for the year ended 7 July 2014
Moore Stephens LLP | P a g e 3
Annex 3: Extractive companies profile ......................................................................... 87
Annex 4: Beneficial ownership ..................................................................................... 90
Annex 5: Reporting template and Supporting Schedule ............................................... 93
Annex 6: Production data by mineral and by company ............................................... 103
Annex 7: Payment flows description ........................................................................... 105
Annex 8: Detail of Licenses held by companies selected in the scope ....................... 108
Annex 9: List of extractive companies holding active licenses and not retained in the reconciliation scope ................................................................................................... 112
Annex 10: Reconciliation sheets by company ............................................................ 115
Annex 11: Minerals exported in 2013/14 .................................................................... 150
Annex 12: Data submission and reliability 2013/14 .................................................... 151
Annex 13: Persons contacted or involved in the scoping study .................................. 152

EEITI Report for the year ended 7 July 2014
Moore Stephens LLP | P a g e 4
LIST OF ABBREVIATIONS
2013/14 Ethiopian Fiscal Year 2006 (from 8 July 2013 to 7 July 2014)
ASM Artisanal and Small-scale Mining
CSA Central Statistical Agency of Ethiopia
CSO Civil Society Organization
EFY Ethiopian Fiscal Year
EEITI Ethiopian Extractive Industries Transparency Initiative
EITI Extractive Industries Transparency Initiative
ERCA Ethiopian Revenues and Customs Authority
ETB Ethiopian Birr (Ethiopian currency)
FDRE Federal Democratic Republic of Ethiopia
GDP Gross Domestic Product
MoF Ministry of Finance and Economic Co-operation (previously called Ministry of Finance and Economic Development)
MoM Ministry of Mines, Oil & Natural Gas ( previously called Ministry of Mines and Energy)
NBE National Bank of Ethiopia
NSC EEITI - National Steering Committee
OFAG Office of the Federal Auditor General
PAYE Pay As You Earn
SOC Extractive State Owned Companies
TIN Taxpayer Identification Number
ToR Terms of Reference
VAT Value Added Tax

EEITI Report for the year ended 7 July 2014
Moore Stephens LLP | P a g e 5
INTRODUCTION
Extractive Industries Transparency Initiative (EITI)1
The Extractive Industries Transparency Initiative (EITI) was first announced at the World Summit for Sustainable Development in Johannesburg in 2002 (the ‘Earth Summit 2002’), and officially launched in London in 2003. It was founded on the recognition that, while oil, gas and minerals can help to raise living standards across the world, in countries where these resources are not managed appropriately, this may often lead to corruption and conflict and, for many people, a lower quality of life.
The Extractive Industries Transparency Initiative is a global coalition of governments, companies and civil society working together to improve openness and accountable management of revenues from natural resources. EITI therefore promotes better governance in countries rich in oil, gas and mineral resources, and seeks to reduce the risk of diversion or misappropriation of funds generated by the development of a country’s extractive industries.
EITI in Ethiopia
The Ministry of Mines, Petroleum and Natural Gas, when it was formerly the Ethiopian Ministry of Mines & Energy committed to EITI and launched Ethiopian EITI (EEITI) in July 2009. The launching conference for the implementation of EITI in Ethiopia was held on 28 and 29 July 2009 in Adama town, Ethiopia, involving more than 100 participants from CSOs, extractive industries and Government Entities.
However, the EITI board has deferred the application of Ethiopia for the status of candidate seeking further explanations from the Government of Ethiopia with regards to the free and active participation of CSOs in the EEITI implementation.
Additionally, Ethiopia published in February 2013 a pilot reconciliation report for the period from 8 July 2009 to 7 July 2010 covering 16 companies.
On 19 March 2014, Ethiopia was admitted as an EITI Candidate country and must prepare its first EITI report within two years from becoming candidate. Validation will start within three years from the date of becoming a candidate.
To give legal backing to the work of EEITI and to institutionalise the EITI Process, a legislation (‘EEITI Proclamation’) is currently being prepared and would be presented to the respective organ for adoption.
Objective
The purpose of this assignment is to produce the first EITI Report for Ethiopia, to define the scope of the extractive industries in Ethiopia and to reconcile the data provided by extractive companies (hereafter referred to as “Companies”) with the data provided by relevant Government Ministries and Entities (hereafter referred to as “Government Entities”).
The overall objectives of the reconciliation exercise are to assist the Government of Ethiopia in identifying the positive contribution that the extractive industries are making to the economic and social development of the country and to realise their potential through improved resource governance that encompasses and fully implements the principles and criteria of the Extractive Industries Transparency Initiative.
Nature and extent of our work
We have performed our work in accordance with the International Auditing Standards applicable to Related Services (ISRS 4400 Engagements to perform agreed upon procedures regarding
1 Source: https://eiti.org/eiti

EEITI Report for the year ended 7 July 2014
Moore Stephens LLP | P a g e 6
Financial Information). The procedures performed were those set out in the terms of reference as approved by EEITI NSC.
The reconciliation procedures carried out were not designed to constitute an audit or review in accordance with International Standards on Auditing or International Standards on Review Engagements and as a result we do not express any assurance on the transactions beyond the explicit statements set out in this report. Had we performed additional procedures, other matters might have come to our attention that would have been reported to you.
The report consists of seven (7) chapters presented as follows:
Executive summary;
Approach and methodology of the reconciliation process;
Description of the contextual information on the extractive industries;
Determination of the reconciliation scope;
Reconciliation results;
Analysis of reported data; and
Findings and recommendations for improvement of future reconciliation processes.
Reported data disaggregated by individual companies, Government Entities and revenue streams, are included as appendices to the report. The amounts in this report are stated in Ethiopian Birr (ETB), unless otherwise stated.
Our report incorporates information received up to 4 December 2015. Any information received after this date has not been included in our report.

EEITI Report for the year ended 7 July 2014
Moore Stephens LLP | P a g e 7
1. EXECUTIVE SUMMARY
This report summarises information about the reconciliation of revenues from the extractive industries in Ethiopia as part of the implementation of the Extractive Industries Transparency Initiative (EITI). In this context, extractive companies and Government Entities report payments and collections respectively from the extractive industries for royalties, profit taxes, dividends, and other industry related payments.
1.1. EITI scope
This report covers payments made by extractive companies and revenues received by Government Entities and other material payments and benefits to Government Entities as detailed in Section 4.
It also includes contextual information about the extractive industries in accordance with EITI Requirement n°3. This information includes a summary description of the legal framework and fiscal regime; an overview of the extractive industries; the extractive industries’ contribution to the economy; production data; the State’s shareholding in extractive companies, revenue allocations and the sustainability of revenues, license registers and license allocations.
1.2. Revenue generated from the extractive industries
The receipts reported by the government between 8 July 2013 and 7 July 2014 (EFY 2006), after reconciliation, are shown below:
Structure of direct revenues of the extractive industries
Total revenues received from the extractive industries amounted to ETB 3,123 million in EFY 2006. ERCA accounted for 80.5% of the total revenue stream generated by the sector, followed by MoM and then MoF, accounting respectively for 12.8% and 2.9% of total extractive industry revenues. The breakdown of revenues is set out in the table below:
Government revenue
% of total payment
(ETB million)
Ethiopian Revenues and Customs Authority (ERCA) 2,514 80.5%
Ministry of Mines (MoM) 400 12.8%
Ministry of Finance and Economic Development (MoF) 87 2.9%
Regional Governments (RG)* 92 2.9%
Social contributions (SC) * 30 0.9%
Total extractive revenues 3,123 100.0%
Gold production 1,272 40.7%
Cement manufacturing 1,244 39.9%
Oil & Gas 279 8.9%
Salt production 19 0.6%
Construction 3 0.1%
Other mining 306 9.8%
Total extractives revenues 3,123 100.0%
* Unilaterally declared by companies retained in the reconciliation scope

EEITI Report for the year ended 7 July 2014
Moore Stephens LLP | P a g e 8
Figure 1: Structure of extractive industries revenues
Significance to Ethiopian economy
In accordance with the Central Statistical Agency of Ethiopia (CSA), the contribution of the extractive industries to the Gross Domestic Product (GDP) in the fiscal year 2013/14 amounted to ETB 7,881 million which represents about 1.2% of the GDP.
Based on the data collected in the course of the reconciliation exercise, the revenues collected from the extractive industries contributed 2.1% of the total revenues of the Government during the fiscal year 2013/14 as detailed in Section 3.2.7 of this report.
Based on the National Bank of Ethiopia’s data, the value of gold exported amounted to ETB 456 million, which represented about 14% of the total exports of the country:
Figure 3: Macro-economic indicators for the extractive sector (2013/14)
1.3. Production
Mineral production data for the reporting period received from MoM covered only six types of minerals. The data from reporting extractive companies included in the reconciliation scope provide a much larger array of minerals. Although, this does not ensure a full coverage of the extractive industries, the disclosure of the data provided by extractive companies for the purpose of the EITI
ERCA80.5%
MOM12.8%
MoF2.8%
RG2.9%
SC0.9%
306
3
19
279
1,244
1,272
Other mining
Construction
Salt production
Oil & Gas
Cement manufacturing
Gold production
BIRR 512 million
Revenue from extractive industriesETB 3,123 million
Contribution to the extractive industriesETB 3,123 million

EEITI Report for the year ended 7 July 2014
Moore Stephens LLP | P a g e 9
report gives a better view on the sector’s outputs compared to the official data. The table below details the production quantities and values during EFY 2006 by type of mineral as disclosed by the extractive companies included in the reconciliation scope:
Mineral Quantity (Tons)
Value of the production
(ETB million) %
Number of mining
licenses
Regions
Gold 4 2,845 82.5% 4 Oromia, Tigray
Limestone 3,640,470 233 6.7% 14 Oromia, Harari, Amhara
Salt 29,815 56 1.6% 4 Afar
Pumice 595,647 54 1.6% 9 Oromia and Amhara
Tantalite 107 52 1.5% 2 Oromia
Other - 208 6.1% 37 Oromia, Somali, Afar, Amhara,
Benshangul Gumuz
Total production value of reporting companies
3,448 100.0%
1.4. Completeness and Accuracy of Data
Comprehensiveness of the scope
According to the Constitution of Ethiopia, the Federal Republic comprises nine member states, which have their respective legislative, executive and judicial powers. NSC decided that regional Government Entities will not be requested to report data on extractive revenues. Payments made to regional governments have only been declared by extractive companies included in the reconciliation scope. As a result, we cannot ascertain that all revenues collected at the regional governments’ level are captured in the EITI Report.
NSC decided that the special small scale and artisanal mining sector could not be assessed and included in this report due to the lack of information on this sector at federal level. This lack of information is due to the scattered nature of the sector activities and to the fact that relating licenses are issued by local governments. The overall contribution of the artisanal gold producers to the country’s gold deposit could only be assessed from data available from the National Bank of Ethiopia, which acts as a clearing house for gold produced by artisanal miners.
Data submission
All extractive companies included in the reconciliation scope submitted reporting templates, except for companies listed in the table below. Receipts reported by Government Entities and relating to these companies amounted to ETB 10.13 million accounting for 0.32% of the total revenue of extractive industries:
N° Company Government receipts
(in ETB million)
1 ETNO Mining Plc 0.15
2 China Long Hoa Milla Construction Materials Plc 0.01
3 Hua Yi Cement Plc 2.13
4 Huang Shan Cement Plc 7.84
Total 10.13
Government Entities included in the reconciliation scope submitted their reporting templates.
However, details of shares owned by the Government (direct and indirect) in extractive companies were not available as well as detailed information on infrastructure provisions and barter arrangements involving mineral products entered into force during the period covered by this exercise. As a result, this information was included in this report through the confirmation of reporting companies.

EEITI Report for the year ended 7 July 2014
Moore Stephens LLP | P a g e 10
Data reliability
Selected companies
Falcon Petroleum failed to submit reporting templates signed by an authorised officer. Eighteen companies failed to submit reporting templates certified by an external auditor as detailed in Annex 12.
Government Entities
With regards to Government Entities, reporting templates were signed by an authorised officer and have not been certified by the Office of the General Auditor (OFAG) as decided by NSC.
1.5. Reconciliation of cash flows
According to the data collected from extractive companies and Government Entities, after reconciliation work, revenues generated from the extractive industries amounted to ETB 3,123 million. These revenues include reconciled revenue amounting to ETB 2,757 million and representing 88% of the total revenues and unilateral disclosures of companies amounting to ETB 121 million, which represented 4% of the extractive revenues in EFY 2006. The reconciled revenues detail by Government Entity and by Sector is set out in the table below:
Disclosure
Declared Government
revenue % of total payments
(ETB million)
Ethiopian Revenues and Customs Authority (ERCA) 2,279 73%
Ministry of Mines (MoM) 390 12%
Ministry of Finance and Economic Development (MoF) 88 3%
Reconciled revenues 2,757 88%
Unilateral disclosure of revenues by extractive companies 121 4%
Unilateral disclosure of revenues by Government 245 8%
Total extractive revenues 3,123 100%
Cash flows reconciliation
Moore Stephens has been contracted to produce the EEITI report and to reconcile tax and non-tax payments reported by extractive companies and Government Entities in order to identify and clarify any potential discrepancies in the declarations of reported payments.
EEITI Report for the year ended 7 July 2014
Moore Stephens LLP | P a g e 11
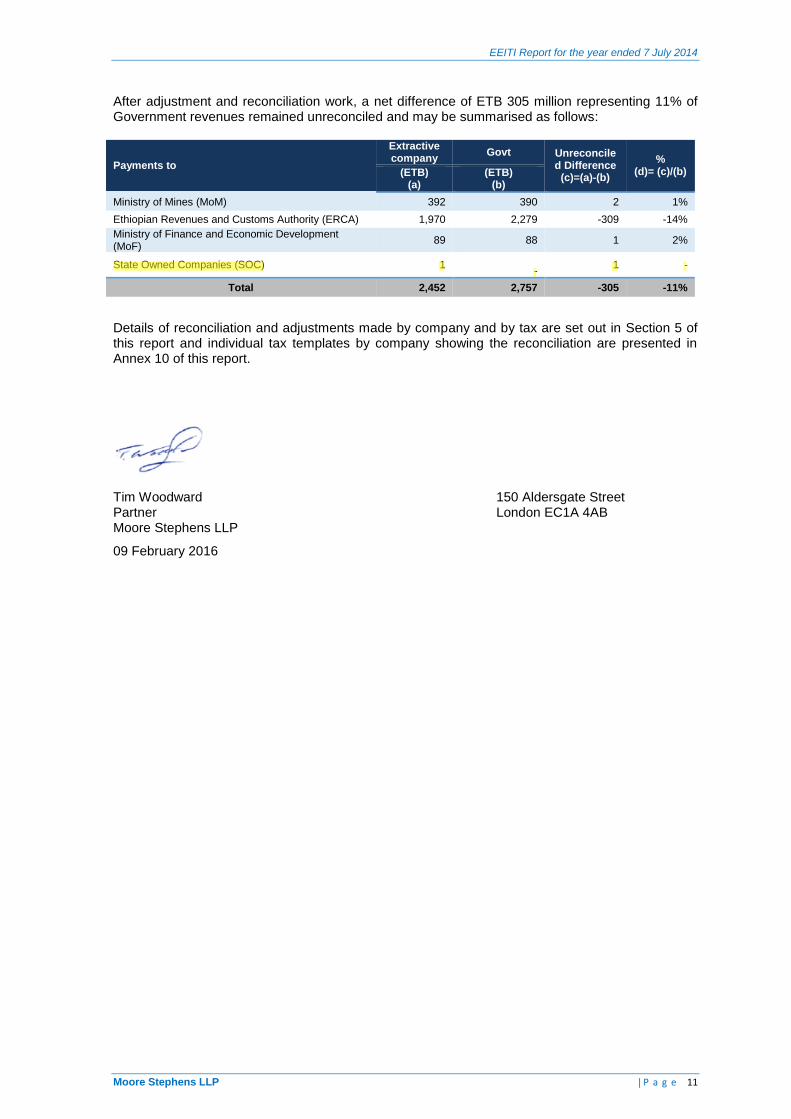
After adjustment and reconciliation work, a net difference of ETB 305 million representing 11% of Government revenues remained unreconciled and may be summarised as follows:
Payments to
Extractive company
Govt Unreconciled Difference
(c)=(a)-(b)
% (d)= (c)/(b) (ETB)
(a) (ETB)
(b)
Ministry of Mines (MoM) 392 390 2 1%
Ethiopian Revenues and Customs Authority (ERCA) 1,970 2,279 -309 -14%
Ministry of Finance and Economic Development (MoF)
89 88 1 2%
State Owned Companies (SOC) 1
- 1 -
Total 2,452 2,757 -305 -11%
Details of reconciliation and adjustments made by company and by tax are set out in Section 5 of this report and individual tax templates by company showing the reconciliation are presented in Annex 10 of this report.
Tim Woodward 150 Aldersgate Street Partner London EC1A 4AB Moore Stephens LLP
09 February 2016

EEITI Report for the year ended 7 July 2014
Moore Stephens LLP | P a g e 12
2. APPROACH AND METHODOLOGY
The reconciliation process consisted of the following steps:
preliminary analysis of the EITI reporting process to determine the scope, including the reporting templates, data collection procedures, and the schedule for publishing the EITI Report;
collection of payment data from Government Entities and extractive companies which provided the basis for reconciliation;
comparison of amounts reported by Government Entities and the extractive companies to determine if there were discrepancies between what the authorities reported as being received and the licensees report to have paid in taxes; and
contact with Government Entities and extractive companies to resolve discrepancies identified.
2.1. Scoping study
The financial flows to be included in the reconciliation and the Government Entities and companies which were required to report were determined by the EEITI NSC based on the scoping study conducted by Moore Stephens.
According to the ToR of our Engagement, we were required to carry out a scoping study which would determine the scope of the first EEITI Report, including a proposal of:
the materiality threshold for receipts and payments;
taxes and revenues to be covered;
companies and Government Entities required to report; and
assurances to be provided by reporting entities to ensure credibility of the data made available to us.
The scope of the EEITI report as decided by NSC during their meeting held on 13 October 2015 is described in Section 4 of this report.
2.2. Data collection
A standard reporting template and instructions were designed to facilitate the process for the reporting companies. The template was designed to include the revenue streams paid to each Government Entity and was formatted in such a way that companies can easily identify and determine the appropriate amounts to be disclosed. The reporting templates were sent electronically to the reporting entities.
The companies and Government Entities were required to report directly to the Independent Administrator and to whom they were also requested to direct any questions on the reporting templates.
Companies and Government Entities were requested to submit a breakdown of payments by date and by receipt in their supporting schedules.
NSC agreed that the deadline for submission of the certified reporting templates would be 30 October 2015.
2.3. Reconciliation and investigation of discrepancies
The process of reconciling the data and investigating discrepancies was carried out from 2 to 20 November 2015. In carrying out the reconciliation, we performed the following procedures:
Initial Reconciliation Procedures: Figures reported by extractive companies were compiled item by item and checked against figures reported by the Government Entities. As a result, all discrepancies identified have been listed item by item in relation to each Government Entity and company.

EEITI Report for the year ended 7 July 2014
Moore Stephens LLP | P a g e 13
In cases where the reported revenue from Government Entities agreed with a company reported payment, or with a deviation in the allowable variance described in the section below, the government figures were considered to be confirmed and no further action was undertaken.
In cases where the reported revenue from Government Entities did not agree with a company reported payment and the difference was not within the allowable variance, discrepancies were specified for each company and government reporting entity and the discrepancies were subject to further evaluation before completing the initial reconciliation report.
Reconciliation variance: As part of the reporting process, a variance threshold of ETB 20,000 was agreed to help determine an acceptable level of effort to spend in attempting to resolve discrepancies.
In the cases where the reported revenue from Government Entities did not agree with the company reported payment, and the discrepancies were at or below the variance threshold determined by NSC, the Independent Administrator concluded that the discrepancies were not material to the EEITI Report.
Follow-up procedures to investigate differences: In the case where material differences are noted, the Government Entities and the companies were asked to provide supporting documents and/or confirmation for any adjustment to the information provided on the original reporting templates.
We contacted the reporting entities and reviewed additional supporting documentation evidencing the payments reported. In the event that we were not able to identify the reasons for the differences through review of additional supporting evidence and contact with the reporting entities, we concluded that the discrepancies are “undetermined or unexplained”. The results of our work are presented in Section 5 of this report.
2.4. Reliability and credibility of data reported
For extractive companies
The Reporting Templates submitted by extractive companies selected in the reconciliation scope should be:
signed by a person authorised to represent the entity (Chief Financial Officer or Chief Executive Officer/Director);
supported by detail of payments reported; and
certified by a registered external auditor.
Companies were also requested to provide a copy of their audited financial statements, so that a review could be undertaken of the assurance procedures applicable to them, e.g. use of International Auditing Standards.
For Government Entities
The Reporting Templates submitted by Government Entities included in the reconciliation scope must be:
signed by a person authorised to represent the Government Entity;
accompanied by details of payments reported; and
certified by the Office of the Federal Auditor General.

EEITI Report for the year ended 7 July 2014
Moore Stephens LLP | P a g e 14
2.5. Basis of reporting
The reconciliation has been carried out on a cash accounting basis. NSC defined the period of reporting as Ethiopian Fiscal Year (EFY). For the 2013/14 EEITI Report, the reconciliation has been carried out on data from EFY 2006, which runs from 8 July 2013 to 7 July 2014. Accordingly, any payments made prior to 8 July 2013 were excluded, as well as payments made after 7 July 2014.
For payments made in other currencies, reporting entities were required to report in the currency of payment. Payments made in US Dollars have been converted to Ethiopian ETB at the average rate of 21.03 as published by the National Bank of Ethiopia (NBE).
2.5.1. Extractive companies
Extractive companies prepare their accounting records on the accruals basis, i.e. the tax expense is recognised at the time it is due rather than the time when it is paid. Only amounts actually paid during the period from 8 July 2013 to 7 July 2014 were considered in the reporting templates.
2.5.2. Government Entities
In respect of Government Entities, care has been taken to ensure that amounts shown on the “Payment/Receipt Report” included all receipts during the 2013/14 financial year, irrespective of whether or not the receipt was allocated in the Government Entity’s records against amounts due in the previous financial year.

EEITI Report for the year ended 7 July 2014
Moore Stephens LLP | P a g e 15
3. CONTEXTUAL INFORMATION ON THE EXTRACTIVE INDUSTRIES
3.1. Extractive sector in Ethiopia
Ethiopia is richly endowed with mineral resources and is one of the largest producers and exporters of Tantalum. In 2013/14, Ethiopia produced a variety of mineral commodities, including gold, salt, limestone, silver, precious and basic stones, marble, kaolin and dolomite. According to the Ministry of Mines, the oil and gas sector is still at the exploration phase.
The sectors covered by this report are:
- oil and gas exploration; and
- mining sector.
3.1. Oil and Gas Sector
3.1.1. General context of the oil and gas sector in Ethiopia
Over one-third of the surface area of Ethiopia is covered by the sedimentary rocks located in the basins of different geological time periods. The Basins formed in the Upper Paleozoic-Lower Mesozoic are known as: The Ogaden, Abay (Blue Nile) and Mekele Basins and those of the Upper Mesozoic to Middle Tertiary Basins are called the Gambela and Southern Rift Basins. Younger Tertiary rift grabens also occur all along the axis of the East African Rift System.
The oil and gas exploration history in Ethiopia dates back to the 1950s. After several oil field discoveries were made in the Middle East, there were high hopes for similar results in Ethiopia as some of the country’s geological formations resemble those of the Middle East. Despite the growing level of interest from exploration companies in Ethiopia and in its regional neighbours, Ethiopia is currently not yet a producer of oil or natural gas. In the country’s effort to develop its Oil and Gas sector, the Government signed a Production Sharing Agreement in 2003 with SI Tech International (SIL) which is a Jordanian company that failed to execute the project and the petroleum development license was revoked in 2006. Later in 2007, the Malaysian company Petronas acquired the Calub and Hilala gas fields and eight exploration blocks. However, the company relinquished all its concessions in Ethiopia and left the country in 2010.
The Ethiopian Ministry of Mines and the Petronas joint study highlighted that two most promising hydrocarbon areas in Ethiopia are the Gambella Basin and the Ogaden Basin. The Gambella Basin is located in the South West of the country, adjacent to the South Sudan border and it is an extension of South Sudan's prolific Melut Basin. The Gambella Block concession was entitled to South West Energy. The Ogaden basin covers an area of around 350,000 square kilometres and is formed from sedimentary rocks up to 10,000 meters thick. The first exploration in the basin was undertaken by Anglo-American’s Dudley Expedition in 1920. Currently, the basin is divided into 21 blocks and several concessions have been awarded to few companies which are Africa Oil Ethiopia B.V, Poly-GCL Petroleum Investments Ltd, South West Energy (HK) Ltd, New Age Ethiopia Ltd, and Delonex Energy which has been awarded the blocks recently in August 2014.
The Ethiopian sector of the East African Rift system extends for more than 1000 km in a North East-South West direction from the Afar depression, at Red Sea-Gulf of Aden junction and southwards to the Turkana depression. There are two main blocks Omo Rift Valley and the Adigala block in the East African Rift Valley System. The Adigala block in the North East of the Rift Valley, the Omo Rift basin in the South-West part of the Valley and the Gewane El-Wiha block have been awarded to New Age Ethiopia, Tullow Oil and respectively to Gaz Prom Bank (GPB) in late July 2014.
The Blue Nile basin called Abay Basin is in central Ethiopia and covers an area of approximately 63,000 square kilometres. It is currently divided into nine blocks, three of which namely Kon Abo, Were Ilu and Debrebrehane are located in Were-Ilu and have been awarded to Falcon Petroleum.
EEITI Report for the year ended 7 July 2014
Moore Stephens LLP | P a g e 16
3.1.2. Legal framework
The Ethiopian upstream oil and gas sector is regulated by three basic proclamations which are the Petroleum Operations Proclamation (N°295/1986), the Petroleum Income Tax Proclamation (N°226/1986) and the Petroleum Income Tax Amendment Proclamation (N°226/2000).
Under the Petroleum Operations Proclamation, the oil and gas industry in Ethiopia is regulated by the Ministry of Mines, which sets industry-specific policies, strategies and laws. The ministry is also the signatory of the Production Sharing Agreement (PSA) or the Modern Concession contract on behalf of the Government of Ethiopia.
The terms of the PSA’s are negotiable and form the basis of the licences. The legislative framework offers considerable flexibility to the Government in negotiating acceptable proceeds sharing terms with oil companies. Under the PSA, signature and production bonuses are negotiable. The contractor production share is also negotiable and tiered on production rate but should not exceed a maximum of 85% and should not be lower than 25%. Cost recovery limits are also negotiable.
3.1.3. Allocation of petroleum rights
The Petroleum Licensing and Administration Core Process (PLACP) is the section within the Ministry of Mines that oversees all activities related to petroleum operations in Ethiopia. It is composed of two main branches that are the Petroleum Licensing and the Contract Administration.
The major duties and responsibilities of the Petroleum Licensing and Administration are:
- organising and preparing bid documents for tendering exploration blocks and taking part in the screening and evaluation of final bid documents;
- undertaking negotiation with applicants in accordance with the Model Petroleum Production Sharing Agreement and Petroleum Operations and Income Tax Proclamations;
- performing promotional activities, by disseminating brochures, exhibiting posters and making presentations;
- monitoring and inspecting companies’ operations to ensure that the activities of a contractor are carried out in accordance with the signed agreement;
- providing support to contractors by communicating with other government institutions and offices;
- ensuring that financial terms of the signed agreements are fulfilled on a timely basis, namely rentals, royalties, bonuses and other payments;
- representing the Ministry at international and regional forums on petroleum upon the consent of the Minister or the State Minister; and
- keeping all petroleum data in a secure repository and making them accessible to relevant business partners, to academia and to staff engaged in research and development.
Licenses allocation process
Applications from individual companies as well as from groups of companies should be submitted to the Ministry of Mines in a sealed envelope delivered by registered mail or by hand without any application fee. One to one negotiation can be carried out for only a single interest and a bidding process will be launched in case of more than one company interest.
In the case of more than one company interest, the notice is published in the English version of the Ethiopian National Newspaper and on the MoM website
1, and bid documents can be collected from
MoM. The notice lasts for 45 days for submission and shall include the score cards to be used for the evaluation. While assessing applications, the Government shall focus, among others, on the following criteria:
1 http://www.mom.gov.et

EEITI Report for the year ended 7 July 2014
Moore Stephens LLP | P a g e 17
- the minimum exploration work and expenditure obligations;
- the economic benefits to the country, with emphasis on the profit oil sharing; and
- the applicant's proposal regarding natural gas.
The Minister of Mines reserves the right to accept or reject any proposal, without being obliged to justify his decision on the subject. All documents relating to an application are kept confidential by all parties and the Government may at its sole discretion invite a successful applicant for negotiation and signature.
In the case of one company interest, negotiation will be carried out between the company and MoM until agreement is reached on the fiscal terms and for articles of the Petroleum Agreement. The Agreement will be endorsed to the Council of Ministers for approval, then presented to the company & MoM for signature.
Types of rights
The Petroleum Operations Proclamation N°295 (1986) defines the rules and conditions of any arrangement between the Government and petroleum companies. The Minister has the power either by competitive bidding or, subject to the directives of the Council of Ministers, by direct negotiation enter into an Exclusive or a Non-Exclusive Petroleum Agreement
1:
- the Exclusive Petroleum Agreement confers a company the right to carry out petroleum operations in a particular area for up to four years for exploration activities and for up to twenty-five years for development and production activities. Extensions of four years and of ten years may respectively be granted for exploration; and for development and production. further extensions may be granted in accordance with Article 11 of Petroleum Operations Proclamation N°295 (1986); and
- the Non-Exclusive Petroleum Agreement authorises a company to carry out geological and geophysical surveys in a particular area for up to two years. The Minister may grant an extension of two additional years and further extensions may be granted in accordance with Article 11 of Petroleum Operations Proclamation N°295 (1986).
Public availability
Currently, the mining legislation does not set out any procedures or provisions to keep, maintain, retain and safeguard licenses in a public register. Information on license holders and license areas are therefore not publicly available. The Petroleum Agreement Model
2 is published on the MoM
website, however, signed Petroleum agreements are not currently publicly available. A legislation (‘EEITI Proclamation’) is currently being prepared and would be presented to the respective organ for adoption.
During the reporting period 2013/14, Poly-GCL blocks in Ogaden Basin signed a Petroleum Agreement with MoM. Further details on the recipient are presented in Section 3.1.5.
Transferability of rights
The Petroleum Operations Proclamation N°295 (1986) sets out state ownership of oil and gas and provides rights and conditions to explore, develop and produce oil and gas. This proclamation allows the transfer of part or all rights, obligations and interests under a petroleum agreement with the condition of prior written consent of the Minister. The terms and conditions of transfer, assignment or disposal shall be governed by the provisions of the petroleum agreement.
1 http://www.momines.gov.et/about-the-sector
2 http://www.momines.gov.et/about-the-sector

EEITI Report for the year ended 7 July 2014
Moore Stephens LLP | P a g e 18
3.1.4. Fiscal regime
The fiscal terms applicable to upstream petroleum activities in Ethiopia are governed primarily by the terms of the Petroleum Operations Proclamation (1986), the Petroleum Income Tax Proclamation (1986) and any PSA entered into as set out below:
- royalty, rentals and bonuses: a registered holder of a development licence must, under the Petroleum Operation Proclamation, pay a royalty and annual rentals to the government. The chargeable royalty rates may vary in accordance with the level of production and the rates are negotiable. Seemingly, the rates of annual rentals are negotiable and may vary in accordance with the exploration periods. All rates of royalties, annual rentals and bonuses shall be set and agreed in the Petroleum Agreement;
- taxation: the contractor is subject to income tax under the Petroleum Operations Income Tax Proclamation stating that any person engaged in petroleum operation under a petroleum agreement shall pay fifty percent (30%) income lax on its taxable income;
- where interest is paid on a loan, the lender shall be liable to income tax at the rate of 15% on the interest;
- loss during the accounting period may be carried forward to a maximum of 10 years;
- no income tax shall be chargeable on dividends paid to shareholder out of income derived from petroleum operations; and
- customs duties: under the Petroleum Operation Proclamation, all machinery, equipment, vehicles, materials, supplies, consumable items and moveable property imported for use in petroleum activities can be imported and exported free of all duties and taxes.
3.1.5. Prospective Projects
Ogaden Basin: in November 2013, POLY-GCL Petroleum Holdings Ltd, jointly set up by China POLY Group and GCL Group, signed oil and gas exploration and development contracts for 10 blocks (with an area of 117,151 km²) in the Ogaden Basin with the Ethiopian government. It is expected that POLY-GCL Petroleum Group Holdings Ltd will begin drilling for natural gas in development blocks in the South East by 2015 and that liquefied Gas exportation will start through neighbouring Djibouti by 2017. The Calub and Hilala fields located in the Ogaden Basin in South East Ethiopia have been estimated to have deposits of 4.7 trillion cubic feet (TCF) of natural gas and 13.6 million barrels of associated liquids discovered in the 1970s, for which commercial production and export is planned to commence by 2017.
Cross-Border Gas Pipeline: in February 2015, a Cross-Border Pipeline Agreement was drafted by the Ethio-Djibouti Joint Ministerial Meeting as released by POLY-GCL. The agreement states that POLY-GCL will cooperate in building a natural gas pipeline from the Ogaden Basin in Ethiopia to Djibouti, where the natural gas will be processed in a marine terminal and transported all over the world. The throughput capacity of the pipeline is planned to be of 4 billion cubic meters per year during the first phase of operation and the total length of the pipeline will be approximately 803 km.
Rift Valley: in the middle of 2014, GPB Global Resources, a unit of Russia’s state-owned Gazprombank Group, won approval from the government for a Production Sharing Agreement which covers exploration for seven years and 25 years for production. Investment for exploration will focus on conducting surveys and drilling test wells in a 42,000 square kilometres area in the Afar region as reported by Bloomberg. GPB reported in October 2014 that it has put up an international tender inviting companies for the provision of airborne geophysical surveys in its concession and that the US company, Bell Geospace, won the contract for the provision of airborne Full Tensor Gradiometry (FTG) and magnetic surveys in the Gewane-El Wiha Block.
EEITI Report for the year ended 7 July 2014
Moore Stephens LLP | P a g e 19
3.1.6. Oil and Gas Sector contribution to the Ethiopian economy
(i) Contribution to Employment
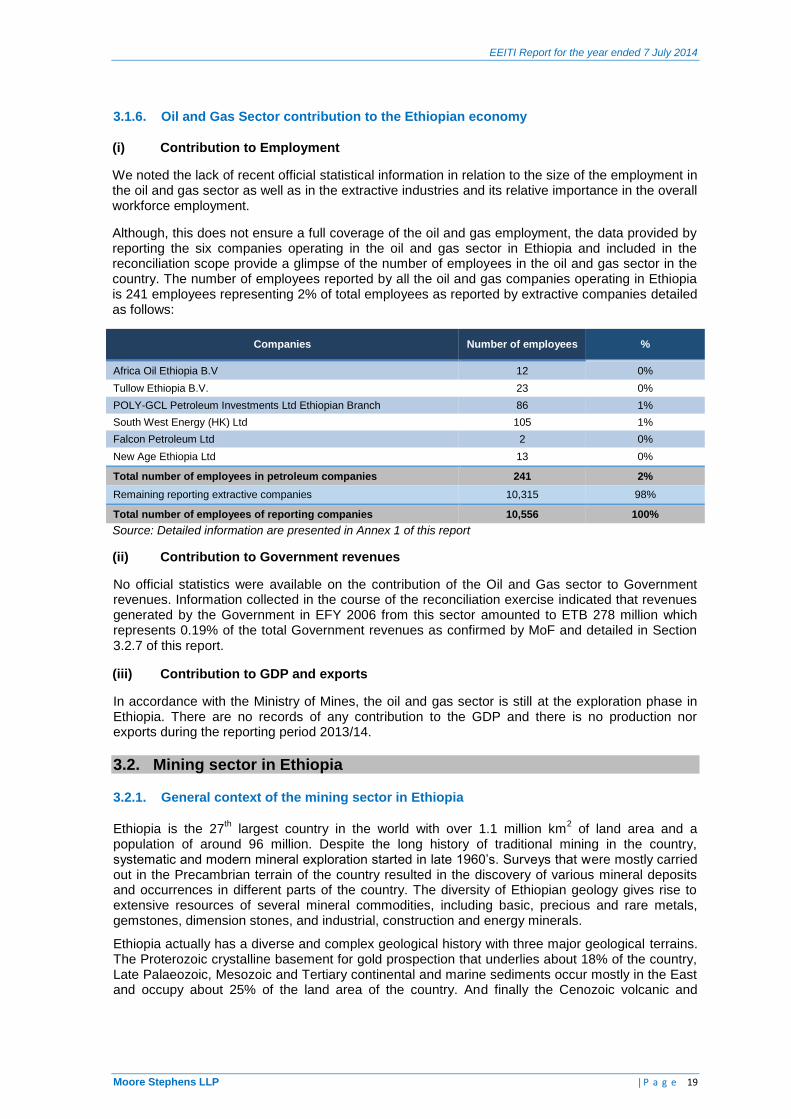
We noted the lack of recent official statistical information in relation to the size of the employment in the oil and gas sector as well as in the extractive industries and its relative importance in the overall workforce employment.
Although, this does not ensure a full coverage of the oil and gas employment, the data provided by reporting the six companies operating in the oil and gas sector in Ethiopia and included in the reconciliation scope provide a glimpse of the number of employees in the oil and gas sector in the country. The number of employees reported by all the oil and gas companies operating in Ethiopia is 241 employees representing 2% of total employees as reported by extractive companies detailed as follows:
Companies Number of employees %
Africa Oil Ethiopia B.V 12 0%
Tullow Ethiopia B.V. 23 0%
POLY-GCL Petroleum Investments Ltd Ethiopian Branch 86 1%
South West Energy (HK) Ltd 105 1%
Falcon Petroleum Ltd 2 0%
New Age Ethiopia Ltd 13 0%
Total number of employees in petroleum companies 241 2%
Remaining reporting extractive companies 10,315 98%
Total number of employees of reporting companies 10,556 100%
Source: Detailed information are presented in Annex 1 of this report
(ii) Contribution to Government revenues
No official statistics were available on the contribution of the Oil and Gas sector to Government revenues. Information collected in the course of the reconciliation exercise indicated that revenues generated by the Government in EFY 2006 from this sector amounted to ETB 278 million which represents 0.19% of the total Government revenues as confirmed by MoF and detailed in Section 3.2.7 of this report.
(iii) Contribution to GDP and exports
In accordance with the Ministry of Mines, the oil and gas sector is still at the exploration phase in Ethiopia. There are no records of any contribution to the GDP and there is no production nor exports during the reporting period 2013/14.
3.2. Mining sector in Ethiopia
3.2.1. General context of the mining sector in Ethiopia
Ethiopia is the 27th largest country in the world with over 1.1 million km
2 of land area and a
population of around 96 million. Despite the long history of traditional mining in the country, systematic and modern mineral exploration started in late 1960’s. Surveys that were mostly carried out in the Precambrian terrain of the country resulted in the discovery of various mineral deposits and occurrences in different parts of the country. The diversity of Ethiopian geology gives rise to extensive resources of several mineral commodities, including basic, precious and rare metals, gemstones, dimension stones, and industrial, construction and energy minerals.
Ethiopia actually has a diverse and complex geological history with three major geological terrains. The Proterozoic crystalline basement for gold prospection that underlies about 18% of the country, Late Palaeozoic, Mesozoic and Tertiary continental and marine sediments occur mostly in the East and occupy about 25% of the land area of the country. And finally the Cenozoic volcanic and

EEITI Report for the year ended 7 July 2014
Moore Stephens LLP | P a g e 20
sedimentary rocks, including those of the East African Rift Valley transects the country in a North-Easterly direction and underline the remaining 57% of the land of the country.
The most important extracted mineral in the country is gold. Gold has been produced from placer deposits for several thousand years and there is currently a hard-rock mining operation at Lega Dembi. Ethiopia is also one of the major world producers of tantalum, contributing 10% to the world’s production in 2012, according to the USGS 2012 Minerals Yearbook. The mineral is widely used in capacitors for computers and mobile phones and it is certainly an important component in modern technology. Relatively important amounts of tantalite are also produced from the Kenticha mine in the south of the country.
Small-scale production of a wide range of industrial mineral commodities is distributed throughout the country and there is also good potential for additional production for domestic markets, particularly in building and construction, lass and ceramics, and fertilizers. Since ancient times, marble has also been quarried for a variety of architectural and artistic purposes in Ethiopia. The country has marble deposits in several regional States including Harrar, Tigrai, Oromia, and Benishangul-Gumuz. Marble, potash, limestone, granite, coal and minerals used to produce cement are used by industries for the production of cement, marble, ceramic, paper and glass as well as fodder for cattle and poultry. Several of these minerals are also exported helping the country earn foreign currency.
Data from the Geological Survey of Ethiopia indicates the existence of potential in the Ethiopian soil for 31 types of minerals, as follows:
No. Mineral type Area of occurrence Resource/Reserve potential(tons)
1 Gold Adola, Myale, Metekel, Tulu kape, Dul, Odagodere, Benshangul, Akobo,Tigray
>200
2 Tantalum Adola/Keneticha 19435
3 Platinum Yubdo, Oromia 12,5
4 Copper Benshangul gumuz, Tigray Indications
5 Iron Bikilal, Melka arba and others 68,4M
6 Nickel Adola 17M
7 Manganese Afar/ Inkafala 207563
8 Molybdenum Benshangul gumuz Indications
9 Limestone Mekele, Abay, Butajira, Ogaden, Denakil, Diredawa, Harar >900M
10 Pumice Rift Valley many million tons
11 Gypsum Tigray, Oromia, Amhara 57,4M
12 Clay Mossobo, Diredawa, Melka jebdu, Debrebirhan, Burayu 21,6M
13 Scoria Rift Valley many million tons
14 Potash Afar 1,3B
15 Phosphate Bikilal, Melka arba 181M
16 Marble Daletti, Mora, Baruda, Bullen, Hulakuni, Tigray 100M
17 Granite Harrari, Meleka, Anger guttrn, Hamaressa, Tigray Babile 70M
18 Silica sand Mugher valley, jemme river 3,4M
19 Feldspar Adolla/Kenticha, Babile, Shebele 500000
20 Quartz Adolla/Kenticha, Somalie 400000
21 Dolomite Kenticha, Galetti, Harrari 2M
22 Kaolin Banbuawuha, komlcha, Hossaina, Ansho, Beles >20M
23 Datomite Adami tulu, Gidicho island, Abiyata, Shalla, Chefe Jilla >120M
24 Bentonite Afar (Gewane, Mille,Warsisa), Gidicho island 172M
25 Soda ash Ziway, Abiyata, Shala, Chitu) 460M
26 Salt Afdera, Asele lake, Afker, mega, Berahle 4,3B
27 Sulfur Afar (Dofan, Chibrit, Ali, Zariga) 6M

EEITI Report for the year ended 7 July 2014
Moore Stephens LLP | P a g e 21
No. Mineral type Area of occurrence Resource/Reserve potential(tons)
28 Graphite Moyale 460000
29 Kyanite Chembi/Kibremengist >10M
30 Talc Anno/Kibremengist 118175
31 Coal
Moye, Delbi, Yayu, Chilga, Gojeb, Mush, Sar wiha kunzila, >360M
Wuchale, Haik, Dese, Mersa, Arjo, Mendi, Kindo halal, Morka, Jeren, Lalosapo
Indications
Source: Geological survey of Ethiopia
However, the mining potential is still underexplored, as only about 62% of the country has been mapped geologically according to the Scoping Study of the Mining Supply Chain in Ethiopia
1,
carried out in 2014. The study foresees a considerable expansion of the sector in the medium and long term, driven by the increased interest of investors in the sector and the growth of the minerals exploration in the country.
3.2.2. Legal framework of the extractive industries
For several years Ethiopian mining law has put foreign mining companies off from participating in its mineral sector. Before the advent of the new economic policy of Ethiopia, private investments were not allowed in the mining sector during the period from 1974 to 1991 and the government was solely responsible for the exploration and development of the sector.
This situation ended in 1993 and in order to make the minerals sector more attractive to foreign investors, new mining laws and mining tax laws were enacted and constantly reviewed with a view to boost investment in the Ethiopian minerals sector.
In June 1993 new Mining and Mining Income Tax Proclamations were issued setting out the legal framework governing mineral exploration, exploitation, trading and taxation. Various mining regulations have been established subsequently to regulate mining activities. These mining regulations and rules are the Mining Proclamation (No 52/1993) as amended by Proclamations (No. 22/1996 and 118/1998), Mining Income Tax Proclamation (No. 53/1993), with its amendment proclamation (No. 23/1996) as amended to 802/1998, the Proclamation to promote and regulate transactions of precious minerals (Proclamation No. 651 /2009), the Proclamation for sustainable development of mineral resources (Mining Operations Proclamation No.678/2010), the mining operations amendment Proclamation (N° 816/2013), the Mining Operations Council of Ministers Regulations (N° 182/1994), and several directives.
3.2.3. Allocation of licenses
As per the reform issued in 1998 on Mining proclamations, the Federal Government’s MoM is responsible for granting and supervising large scale mining operations in addition to issuing prospecting, exploration and mining licenses for foreign investors and to those in joint venture with Ethiopian companies. The Federal Government’s Ministry is also responsible for issuing licenses reconnaissance, exploration, retention and mining licenses other than those to be issued by a regional State licensing authority and for issuing certificate of professional competence for professionals who wish to engage in consultancy services in the mining sector.
Regional State Licensing Authority is responsible of issuing artisanal mining licenses, reconnaissance, exploration and retention licenses with respect to construction and industrial minerals, small scale mining licenses for industrial minerals, small and large scale mining licenses for construction minerals and certificates of discovery for minerals other than strategic minerals.
1 by the Canadian advisory firm CRC Sogema

EEITI Report for the year ended 7 July 2014
Moore Stephens LLP | P a g e 22
Licenses allocation process
The Mining Operations Proclamation (No.678/2010) set the order of application processing. In this respect, applications for licenses have to be submitted to the Licensing Authority for the issuance, renewal or transfer of licenses accompanied by the documentation required by the Proclamation, regulations and directives and with the payment of the prescribed application fee. The Licensing Authority shall forthwith register and give receipt to the applicant once it is satisfied with the application. The following rules are generally applied unless otherwise determined:
- an application submitted for a large scale mining license takes precedence over those for small scale and artisanal mining licensees, and an application for small scale mining license takes precedence over those for artisanal mining licenses;
- the application is dealt with in the order of date of receipt if the Licensing Authority receives more than one application for licenses of the same status covering the same mineral and area; and
- where two or more applicants lodge applications for licenses of the same status at the same time covering the same mineral and area, the Licensing Authority constitutes a technical team to evaluate the applications and the priority shall be determined on the basis of the evaluation of the technical work plan, the financial proposal, and the technical competency of the applicants.
Types of Licenses
In accordance with the Mining Operations Proclamation No.678/2010, there are seven types of licenses and two certificates as follows:
Type License Period
Reconnaissance License Up to 1.5 year, non-exclusive and non-renewable
Exploration License Up to 3 years plus two Yearly renewals; may be permitted to two additional renewals under certain circumstances
Retention Licence Up to 3 years plus 3 years’ renewal possibility
Artisanal Mining Licence Up to 3 years plus 2x3 years renewals possibility
Small-Scale Mining License Up to 10 years plus 5 years’ renewal possibility
Special small scale mining license
Up to 10 years plus 5 years’ renewal possibility
Large-Scale Mining License Up to 20 years plus 10 years’ renewal possibility
Certificate of Discovery Up to 1.5 year, non-renewable
Certificate of Professional Competence
The validity period, renewal and revocation of a certificate of professional competence shall be prescribed by regulations
Transferability of Titles
The Mining Operations Proclamation (N°678/2010) sets out State ownership of minerals and provides rights and conditions to explore, develop and produce such minerals. The Proclamation groups minerals into several categories for the purpose of defining incentives, penalties, specialised skills development and mineral administration. The categories of minerals are as follows:
- construction minerals grouping any mineral directly or indirectly used as input for construction purposes such as marble, granite, limestone, basalt, sand, aggregate, ignimbrite and clay;
- industrial minerals including any mineral directly or indirectly used as industrial input such as kaolin, bentonite, quartz, coal, limestone, gypsum, pumice, clay and graphite;
- metallic minerals including any mineral such as iron, copper, zinc, lead, chromite, nickel and manganese;
- precious minerals including precious metallic mineral such as platinum, gold and silver or precious stones such as diamond, ruby, emerald and sapphire; and
- semi-precious minerals including gemstones that are used for jewellery such as opal, rhodolite, olivine, jadeite and lazurite.
EEITI Report for the year ended 7 July 2014
Moore Stephens LLP | P a g e 23
The above proclamation allows the transfer of licenses, other than reconnaissance and retention, with prior consent of the Licensing Authority. However, artisanal or special small scale mining licenses may only be transferred through inheritance.
Currently, the mining legislation does not set out any procedures or provisions to keep, maintain, retain and safeguard licenses in a public register. Information on license holders and license areas are therefore not publicly available. The list of the active licenses provided to us by the Ministry of Mines is attached at Appendix 2.
3.2.4. Fiscal regime
Royalties: on minerals are regulated by the Mining Operations Proclamation and are levied on ad valorem basis for precious metals at 7%, semi-precious metals at 6%, metallic minerals at 5%, industrial minerals at 4%, construction minerals at 3%, salt at 4% and geothermal at 2%.
Income tax: Applicable legislation under the fiscal regime for large scale mining licence is the Mining Income Tax Proclamation. The Proclamation provides details on licensing procedures, fees and fines. The fiscal regime is mainly defined by the 25% charge on taxable income generated from large mining, 10% dividend tax; and by several deductions and calculations of expenditure. Income tax and royalty rates applicable to artisanal, small scale and special small scale mining license holders are determined by the laws of the Regional States.
Free equity: The Government is also entitled according to article 72 of Mining Operations Proclamation (Amendment) No. 816/2013 to acquire without cost a participation interest of 5% in any large scale mining investment. Additional participation beyond the 5% free equity may also be provided to the Government by agreement with the licensee.
Custom duties: The Mining Operations Proclamation provides exemptions from custom duties on imports of several machinery and vehicles required for holders of exploration and mining licences. The Proclamation also provides exemptions from customs duties on exports of minerals produced by holders of artisanal, small scale and large scale mining licenses.
3.2.5. Prospective Projects
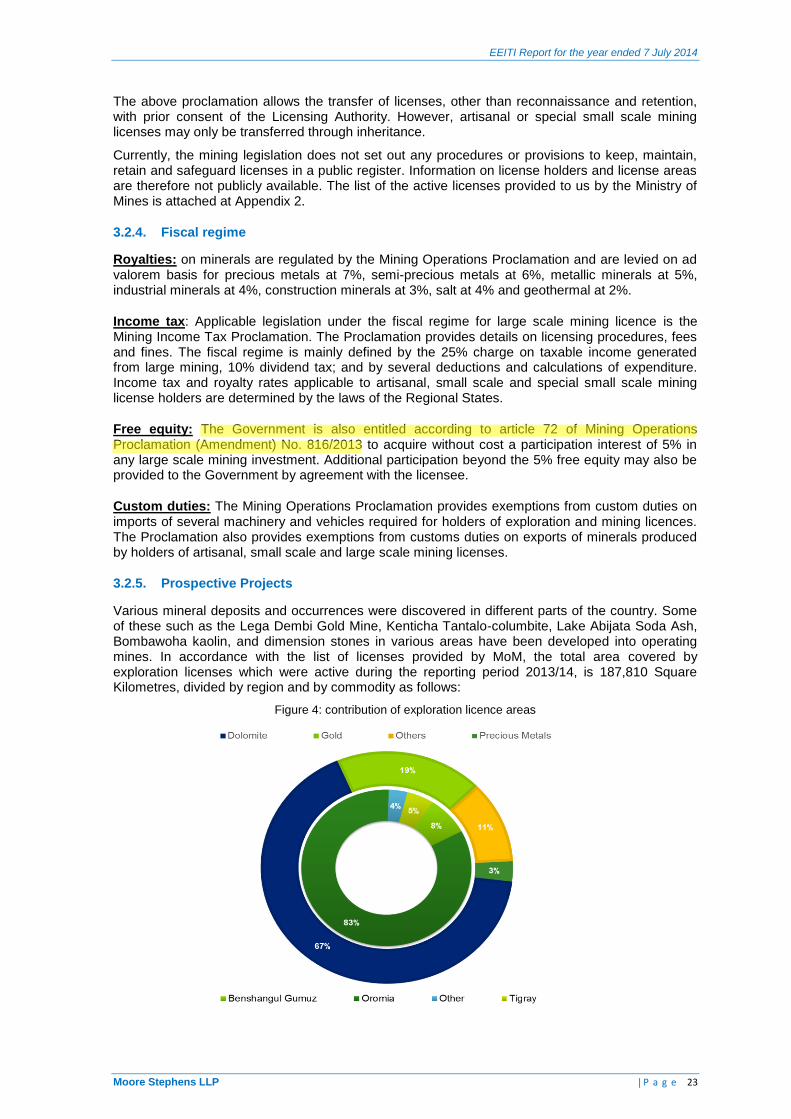
Various mineral deposits and occurrences were discovered in different parts of the country. Some of these such as the Lega Dembi Gold Mine, Kenticha Tantalo-columbite, Lake Abijata Soda Ash, Bombawoha kaolin, and dimension stones in various areas have been developed into operating mines. In accordance with the list of licenses provided by MoM, the total area covered by exploration licenses which were active during the reporting period 2013/14, is 187,810 Square Kilometres, divided by region and by commodity as follows:
Figure 4: contribution of exploration licence areas
EEITI Report for the year ended 7 July 2014
Moore Stephens LLP | P a g e 24
Lega dembi gold mine is the only modern primary gold mine operating in the country. It is a medium to large scale mine which produces approximately three tons of gold per year using Carbon in pulp (CIP) processing plant. The mine is currently operated by Midroc Gold Mine Plc which is a subsidiary of Midroc Ethiopia Investment Group of Saudi Arabia.
Tulu Kapi: is a gold project located in Western Ethiopia in the Oromia region at 500 km West of Addis Ababa. In accordance with the scoping study carried out by CRC Sogema, the deposit has approximately 1 million ounces of contained gold. The feasibility study of the project has been issued and the regulatory approvals were received in April 2013. Production is anticipated to start in late 2015 or early 2016, which will also target the export market.
Industrial minerals: some companies such as G&B Central Africa Resources, Saink Potash Mining and Canadian companies are on development and mining stages of various industrial minerals such as potash, cement raw materials and others. While BHP Billiton left Danakil Depression in 2012, Yara International carried out an independent feasibility study in February 2015, which confirmed significant potential to extract potash in the Danakil depression in North Eastern Ethiopia. An annual production of 2.75 million metric tonnes of potash over 23 years was identified by the study from these reserves (Kainite, Carnallite and Sylvinite) at Yara’s Danakil concession. The company aims to start mining activities in 2018, and is currently seeking equity partners to develop the project as published by Tom Zanki Cement production is likely to increase from 2013 through 2017 because of growth in the construction sector. In accordance with the Forbes Publication of June 2015, Dangote Cement is looking to build more cement plants across Africa to realise its ambition of reaching an annual production of 62 million tonnes by 2017. The production of clay, gypsum, limestone, and pumice is also expected to increase, in accordance to the Mineral Licensing and Administration Directorate, because of increased demand from cement plants; output of other construction materials is also likely to increase.
3.2.6. Artisanal, Small and Special Small Scale Mining sector in Ethiopia
(i) Overview
Hundreds of thousands of individuals and micro enterprises operating in the Artisanal Mining (AM) which is conducted with rudimentary tools, semi-mechanised operations and may use a variety of mechanised tools and simple equipment to complement the manual labour force. Gold, gemstones and tantalum generate the greatest potential for wealth generation from AM which constitutes an alternative livelihood to agriculture for a large number of people in rural parts of Ethiopia. According to MoM’s estimates, more than one million people are currently engaged in ASM Activities, including an estimated 300,000 to 350,000 engaged in gold mining, and an even bigger population of between 5 to 7 million people is believed to depend on mining for their livelihood.
The Mining Operations Proclamation (N°678/2010) and its subsequent amendment (N°. 816/2013) define three types of mining settings, namely: artisanal mining (AM), small-scale mining (SM) and special small-scale mining (SSM). Accordingly, artisanal mining is defined as a mining operation carried out by individuals or small and micro enterprises which is mostly of manual nature and does not involve the engagement of employed workers. And special small scale mining is defined as any mining operation of gemstones or placer resources of gold, silver, platinum or tantalum of which the annual run-off mine ore does not exceed volumes and quantities set in the Proclamation by type of mineral, and which is carried out by individuals or small and micro-enterprises which were holders of artisanal mining licenses and have sufficient financial capacity to use modern machineries and equipment in such operations. Finally, small scale (SM) mining carries a wider definition than SSM, as it refers to operations in a wider spectrum of minerals, which include in addition to precious and semi-precious minerals, metallic minerals, construction minerals, geothermal deposits and salt. Similarly, to SSM, size is an important factor in distinguishing this sector from large scale mining and to this effect the Mining Operations Proclamation sets clear upper limits of annual run off for each category of minerals that an operation should not exceed in order to be considered of small scale. On the other hand, applicants for an SM license are not subject to the condition required from SSM applicants of having previously held an artisanal mining license, and this is a major point that distinguishes between SM and SSM.
Further to the setting up of the legal framework for AM, the number of organised artisans has significantly increased, according to the Growth and Transformation Plan Annual Progress Report for EFY. 2012/13 issued by MoF. Accordingly, 75 new Artisanal Miners’ Cooperative Associations

EEITI Report for the year ended 7 July 2014
Moore Stephens LLP | P a g e 25
were set up in 2012-2013, which has increased the number of Cooperative Associations to 553, consisting of a total of 58,647 members.
AM in Ethiopia is for gold, gemstones and Tantalum. However, the majority of AM mining relates to alluvial gold sources derived originally from weathering and erosion effects from hard rock gold ore bodies as reported by CRC SOGEMA’s scoping study. There are more than sixty shear-zone hosting gold occurrences in geologic formations called Greenstone Belts. The main regions of greenstone belts are: ·
- Southern (including the Adola, Ageremariam and Moyale areas);
- Western (including the Akobo area); and
-Northern (Tigray area).
(ii) Types of licenses of transactions of precious minerals
In accordance to the Transaction of Precious Minerals Proclamation (No. 651/2009), there are three types of licences and two certificates as listed below:
- Precious minerals brokerage license: grants to the holder of the license the right to purchase, hold for sale purposes, transport and forthwith sale of precious minerals locally.
- Precious minerals crafting license: grants to the holder of the license the right to purchase, hold and transport precious minerals in an amount to be specified by directives of the Central Bank of Ethiopia, carry out smithery or lapidary and sell its product locally or abroad pursuant to the directives of the Bank. The holder of such License may engage in purchase or maintenance of used, broken or damaged jewelleries and report periodically every month about its activities.
- Precious minerals refining license: grants the license holder the right to engage in refining precious metallic minerals produced locally or imported.
- Precious Mineral Trade Certificate of competence: grants to the holder of the License the right to Purchase in bulk and retail sale of finished Precious Minerals locally.
- Precious Mineral Export Certificate of Competence: grants to the holder of the Certificate the right to purchase, hold, and export the following precious minerals pursuant to the directives of the Central Bank: gold and silver which are in their final shape; and other precious minerals in raw, semi processed or in their final state.
The artisanal mining sector could not be assessed and included in the reconciliation scope due to absence of comprehensive information on this sector at federal level. This absence of information is due to the scattered nature of the sector and to the fact that licenses for operators in this sector are issued by regional governments.
(iii) Artisanal mining production
The scale of artisanal mining production cannot be fully assessed given the informality of the majority of operations in this sector. Official statistics are only available on gold and gemstones production that are exported via the legal channels.

EEITI Report for the year ended 7 July 2014
Moore Stephens LLP | P a g e 26
Gold
In relation to gold produced in AM and SSM settings, NBE plays a focal role in the supply chain, given the obligations imposed by law on holders of AM and SSM licences to sell all gold produced to NBE via the bank’s licensed regional purchase centres. NBE acts as a clearing house by holding the gold it produces in stock or recording it in sales of gold in the international market.
Figure 5: Collecting process of gold and deposit
Buying gold by NBE
Transfer to deposit
The National Bank of Ethiopia (NBE) has been playing this role since 2009. A 5% premium above the daily official gold price is offered to producers when selling gold to NBE. Despite this incentive, illicit sale of gold to non-licensed buyers is still widespread. The table below presents the data on gold purchased by NBE during the period from 8 July 2012 to 7 July 2014:
N° Name of Purchase
Centre
Gold purchased 2012/2013
Gold purchased 2013/2014
Variance %
Grams
(a)
Million ETB
(b)
Grams
(c)
Million ETB
(d)
Grams
[(c)-(a)]/(a)
Million ETB
[(d)-(b)]/(b)
1 Hawassa Branch 3,303,093 3,031 2,906,579 2,198 -12% -27%
2 Jima Branch 1,359,790 1,180 - - -100% -100%
3 Mizan Teferi Branch - - 775,331 1,798 - -
4 Assossa Branch 1,007,091 918 1,088,490 847 8% -8%
5 Mekele Branch 254,102 103 - - -100% -100%
6 Endeselassie Branch
2,407,009 2,008 2,266,065 1,707 -6% -15%
Total 8,331,085 7,240 7,036,465 6,550 -16% -16%
Source: National Bank of Ethiopia
As depicted in the table above, gold supply to NBE has seen a decrease in volume between 2012/13 and 2013/14. It is however worth noting that since NBE’s role as a clearing house in 2009, the amount of gold supply has increased by almost 10 fold, from 735 kg to the current level of 7,036 kg.
However, in relation to the latter figure, we noted a significant discrepancy with the data provided by MoM for the same financial year. According to MoM gold production supplied to NBE in 2013/14 amounted to 8,386.84 Kg. Data provided by MoM shows the breakdown of gold supplied to NBE by region of origin, as follows:
On site buyer or producers
Licensed regional buyers
National Bank of Ethiopia
Refinery
Commerzbank

EEITI Report for the year ended 7 July 2014
Moore Stephens LLP | P a g e 27
Figure 6: Contribution to artisanal gold production …
Region
Contribution to gold
supply in 2012/13
Contribution to gold supply in
2013/14
Tigray 25% 26%
Oromyia 36% 40%
Behnsangul Gumeze
13% 13%
Gambela 14% 14%
South National and Nationality
9% 7%
Amhara 3% 0%
Total 100% 100%
Source: Artisanal Mining Directorate, MoM
Accordingly, Oromia and Tigray regions accounted for 40% and 27% of gold supplied to NBE in 2013 and 2014 respectively.
Gemstones
Unlike gold, gemstones are usually directly sold to exporters without intermediation from NBE. Gemstone artisanal mining is also quite significant. Gemstone deposits in Ethiopia include opal, fire opal, beryl (aquamarine, emerald), corundum (sapphire, ruby), garnet, period, tourmaline, apatite, obsidian, feldspars (amazonite, yellow orthoclase) and quartz (amethyst, citrine, chrysoprase, rock crystal, tourmalinated quartz, chalcedony, and a wide variety of agates and jasper. 90% of the value is however estimated to derive from opal mining at one locality in the North Wollo zone, according to the World Bank’s Strategic Assessment of the Ethiopian Mineral Sector report.
According to data supplied by MoM, production and values of gemstones production stemming from AM were as follows:
Mineral Production and value Production and value Variance %
2012/13 2013/14
Kg (a)
Million USD (b)
Kg (c)
Million USD (d)
Kg
[(c)-(a)]/(a) Million USD
[(d)-(b)]/(b)
Gemstone 16,523.32 8.20 25,078.26 12.24 52% 49%
Source: Artisanal Mining Directorate of MoM
A significant increase has been registered both in terms of volumes and income between 2012/13 and 2013/14.
Tantalum
It is mined from pegmatites and is located primarily in the central region of Ethiopia. Tantalum and gemstones account for only 0.7% of the value of gold
1.
1 CRC Sogem scoping study 2014
27%
40%
13%
14% 7%
Tigray
Oromyia
Behnsangul
Gumeze
Gambela
South
National and
Nationality

EEITI Report for the year ended 7 July 2014
Moore Stephens LLP | P a g e 28
3.2.7. Mining Sector contribution to the Ethiopian economy
(i) Large scale production
The industrial and large-scale mining sector comprises gold, tantalum, potash and other minerals such as industrial and construction minerals. Based on the figures made available by the MoM, the evolution of industrial scale production of major minerals for the last two years is set out as follows:
Mineral type Unit 2012/13 2013/14 Variance %
Gold (Industrial) K.G 4,151.36 3,262.42 -21.4%
Marble M3 3,806.94 3,797.10 -0.3%
Source: Ministry of Mines: mineral production and export data
Large scale industrial gold production decreased by 21.4% in 2013/14 compared to 2012/13. The only large-scale operational gold mine is owned by Midroc Gold Mine Plc and is located at Legadembi in the Adola region, approximately 500 km south of Addis Ababa. The production of marble is still approximately the same during the last couple of fiscal years.
As part of the reconciliation process, we have collected production volumes and values from the companies included in the scope. Based on the data reported by the companies and detailed in Annex 6 of this report, the production volumes and values for each type of mineral during the EFY 2006 can be summarised as follows:
Mineral
Quantity produced
Value of Production
(Tons) in ETB
Gold 4 2,844,998,060
Limestone 3,640,470 232,522,043
Clay 898,864 62,180,057
Salt 29,815 56,451,214
pumice 595,647 54,413,737
Tantalite 107 51,758,759
Gypsum 231,985 37,687,458
Soda Ash 3,896 22,965,997
Marble 42,623 20,370,545
Basalt 169,774 14,855,208
Silver 1 12,923,721
Kaolin 4,530 8,929,585
Sandstone 73,572 5,692,512
Iron ore 14,454 4,378,430
Aggregate & subbase - 4,019,820
Dolomite 15,824 2,679,754
Rhyolite 92,604 2,582,893
Weathered Basalt(Clay II) 28,165 1,915,215
Quarry - 1,530,473
Silica Sand 16,290 1,259,745
Quartz 3,358 650,295
Pozolana 45,248 135,744
Shale 66,569 133,138
Fieldspar 596 70,517
Other 13,090 3,228,426
Total production value confirmed by reporting companies in the reconciliation scope
3,448,333,345

EEITI Report for the year ended 7 July 2014
Moore Stephens LLP | P a g e 29
Tantalum is produced solely by Ethiopian Minerals Development S.C. (EMDSC) which exploits Tantalum concentrate in the Kenticha mine located in the Oromia Regional State in Guji zone. The mine operations have been on hold since 2013 due to the government's efforts to privatise it. In accordance with the scoping study of CRC Sogema, the Ethiopian Minerals Development has operated a medium-sized Tantalum open pit mine in West-Central Ethiopia until April 2013. This operation produced 200 tons per year of concentrate at a mining rate of about 36,000 tons per year of Tantalum dioxides (mining rate of around 120 tons/day*300 days). This volume of 36,000 tons is processed in a concentrator to produce 200 tonnes of concentrate and 200 tonnes of waste in the form of tailings. The concentrator is to be increased to produce 400 tonnes/year of tantalum concentrate from the mining operation.
(ii) Extractive industries Contribution to Gross Domestic Product (GDP)
The Central Statistical Agency of Ethiopia (CSA) produced a brief note on the Ethiopian fiscal year (EFY) 2006 on the national accounts statistical estimates, according to which the GDP has seen a growth of 8.6%, 10.5% and 9.9% in the respective fiscal years of 2011/12, 2012/13 and 2013/14.
Extractive industries contribution to GDP
2010/11 (million
ETB)
2011/12 (million
ETB)
2012/13 (million
ETB)
2013/14 (million
ETB)
2013/14 (%)
contribution
Mining & quarrying 6,810 7,675 8,157 7,881 1.2%
Others 508,269 551,946 610,171 671,885 98.8%
Gross Domestic Product at Constant Market Prices
515,079 559,622 618,328 679,766 100%
GDP Variation N-1/N (%) - 8.6% 10.5% 9.9% -
Source: Central Statistical Agency of Ethiopia: Brief Note on the 2006 (EFY)* NAS Estimates
The mining and quarrying sector is still under-developed, contributing only 1.2% to the GDP in EFY 2006. According to the CSA study, the contribution of the mining and quarrying sector to GDP has increased by 12.7% and 6.3% then decreased by 3.4% over the last three years respectively. Oil & gas sector is still at the exploration stage and no contribution to the GDP was recorded.
According to the Strategic Assessment of the Mineral Sector commissioned by MoM and the World Bank in 2014, the aim of the Government of Ethiopia is to increase the minerals sector’s contribution to 10% of GDP by 2020-2023.
(iii) Extractive industries Contribution to Exports
We set out in the table below the key exported commodities over the last three financial years. We note amongst others that gold exports represented 14% of the export earnings of the country for 2013/14.

EEITI Report for the year ended 7 July 2014
Moore Stephens LLP | P a g e 30
Figure 7: Contribution of gold exports
Major Export Items
2011/12 2012/13 2013/14
USD (‘000)
% USD (‘000)
% USD (‘000)
%
Coffee 833 26% 747 24% 714 22% Oilseeds 472 15% 444 14% 652 20% Gold 602 19% 579 19% 456 14% Chat 240 8% 271 9% 297 9% Pulses 160 5% 233 8% 251 8% Flower 197 6% 187 6% 200 6% Live Animals
207 7% 166 5% 187 6%
Products 110 3% 121 4% 130 4% Meat Products
79 2% 74 2% 75 2%
Fruits & Vegetables
45 1% 44 1% 46 1%
Others 207 7% 215 7% 247 8% Total 3,152 100% 3,081 100% 3,255 100%
Source: National Bank of Ethiopia – Annual report 2013-14
The contribution of other mining commodities to exports income is very minor, and therefore these were reported by the NBE under the category of “other” exports. The overall contribution of other exports did not exceed 8%, encompassing the value of all the country’s minor exported goods. The oil and gas sector is still at the exploration stage and no contribution to the national exports was recorded.
MoM’ records indicate that the major exported mining commodities after gold are Tantalum and marble as presented below:
Mineral type 2012/13
(Mil. USD) 2013/14
(Mil. USD)
Tantalum 4.00 3.26
Marble 0.15 0.44
Coal 0.01 0.00
Total 4.15 3.76 Source: Ministry of Mines – Mineral production and export data
Based on the data above, the contribution of other mining commodities to exports stood at 0.1% in both 2012/13 and 2013/14. Besides their impact on the trade balance of the country, mineral export is an important source of foreign currency. Their contribution in this respect has been estimated to be between 7% and 10% according to the Strategic Assessment of the Ethiopian Mineral Sector published by the World Bank in 2014.
(iv) Contribution to Employment
We noted the lack of official statistics in relation to the size of the employment in the extractive industries. Estimates found in recent studies published on the sector indicate that most of the mining workforce is employed in informal artisanal mining settings, and numbers could range between five hundred thousand and up to a million workers
1.
According to the employment figures submitted by the extractive companies selected in the reconciliation scope, the sector provides employment to about 10,556 individuals, of whom 10,234 i.e. around 97%, were Ethiopian citizens in 2013/14. Details of employee figures by company are reported in Annex 1.
1 Strengthening Artisanal Mining Communities in Rural Ethiopia ” Project by Yared Antonious ASM Programs, Team Leader
ASM
0%
10%
20%
30%
40%
50%
60%
70%
80%
90%
100%
2011/12 2012/13 2013/14
19.1% 18.8% 14.0%
80.9% 81.2% 86.0%
Other exported commodities Gold

EEITI Report for the year ended 7 July 2014
Moore Stephens LLP | P a g e 31
(v) Contribution to Government revenues
Based on the data collected in the course of the reconciliation exercise, the revenues collected from the extractive industries contributed 2.1% to the total revenues of the Federal Government during the fiscal year 2013/2014, as detailed in the table below:
Indicators Amount in 2013/2014
(in ETB) Contribution to Government
Revenues in %
Total Government revenues 147,075,278,727 100.00%
Oil & Gas Revenues 278,632,755 0,19%
Mining Revenues 2,844,445,787 1,93%
Total Extractive Revenues 3,123,078,542 2,12%
3.3. Collection and distribution of the extractive industries revenues
3.3.1. Budget process
Ethiopia has a well-established legal framework governing its budget system that derives from the 1995 Constitution of The Federal Democratic Republic of Ethiopia. The Constitution clearly defines the structure, division of powers and responsibilities between the State organs.
(i) Budget planning and formulation:
The MoF plays the key role in this process. It makes macro-economic and fiscal plans (forecasts) available for allocation to line ministries. It issues a budget guideline and gives indicative-spending ceilings. Each spending agency submits its proposal to MoF. The overall budget envelope finalised after the budget hearing process is submitted to the Council of Ministers for approval. The budget is subsequently presented to parliament and published.
MoF coordinates donor funding and matches resources with relevant projects. All donor funds are subject to the approval of the legislature and to normal budget reporting.
(ii) Budget approval:
The role of Parliament in general and that of the Budget and Finance Affairs Committee in particular is limited to ‘approving’ the budget prepared by MoF and the Council of Ministers. The House of the People’s representatives make the budget open through a public call on the media.
(iii) Audit of the Financial Statement of the Federal Government:
The Office of the Federal Auditor General (OFAG) was set up by Proclamation (No. 68/1997). The Auditor General is appointed upon the recommendation of the Prime Minister by the House of Peoples’ Representatives. OFAG is responsible for the inspection of the accounts of federal government entities. Its main task is to ensure that expenditures are made in accordance with the approved allocation for the fiscal year and submits to this effect a report to the House of Peoples’ Representatives.
The Federal Ethics and Anti-Corruption Commission was established by Proclamation (No 235/2001) as an Independent Federal Government Entity. Its main functions are combating corruption, investigating and prosecuting. The Commission is accountable to the Prime Minister and headed by a Commissioner supported by a Deputy Commissioner. Both are appointed by the House of Representatives upon nomination by the Prime Minister.
(iv) Audit of the Financial Statement of public enterprises:
The accounts of public enterprises are audited by independent accounting body of the Auditor General. The Auditor General submits its report to the House of Peoples’ Representatives. However, there is no evidence of systematic follow up of issues raised by the Auditor. Lack of resources and limited understanding about accountability among some members of the Budget and

EEITI Report for the year ended 7 July 2014
Moore Stephens LLP | P a g e 32
Finance Affairs Committee is considered as a barrier to maintain clear oversight of budget implementation. Some reports indicate that more stringent mechanisms are needed to ensure that public offices comply with requests and queries from the Auditor General and/or with recommendation mad by the House of Representatives regarding audit reports.
3.3.2. Revenue collection
(i) Revenues recorded in Federal budget
The contribution of mining revenues to the budget of Federal Democratic Republic of Ethiopia can be determined in the Consolidated Revenue accounts prepared by MoF. However, the tax generated from the sector may not be easily determined because the consolidated accounts inform only on the royalties received by MoM during the year. In principle, other revenues collected by ERCA are categorised into direct and indirect taxes and tax on Foreign Trade.
The other payments from the mining sector to MoF such as dividends and free equity are presented as other non-tax revenues.
The mining revenue collection framework can be represented diagrammatically as follows:

EEITI Report for the year ended 7 July 2014
Moore Stephens LLP | P a g e 33
Extractive
Companies
State
Governments
ERCA
Mining Income Tax
Excise tax
Budget
Allocation
MoF
Others material Payments (ERCA)
Value Added Tax
Capital Gains
PAYE
Free Equity
Dividends
Land Rentals
Royalties
License Fees
Signature & Production Bonus
MoM
Dividend Tax
Penalties & Interest
Annual Rentals
Training
Direct payments Transfers to regional governments Revenue allocation
Royalties
License Fees
Land Rentals
Excise tax
Personal Income tax (Pay As You Earn "PAYE")

EEITI Report for the year ended 7 July 2014
Moore Stephens LLP | P a g e 34
3.3.3. Extractive revenue transfers to regional level
In Ethiopia, the federal constitution declares that the federal government shall levy taxes and collect duties on sources reserved to it, and the states likewise exercise the same power with respect to sources that fall under their jurisdiction. Thus, the two tiers of government exercise their legislative and administrative powers within their respective taxation jurisdictions. As a result, the revenue generated from respective sources belongs exclusively to each level of government. The FDRE Constitution does not explicitly limit the powers of the states to alter the taxes or influence the tax bases. However, it provides general directives on taxation which they must consider in exercising their taxation powers.
The tax revenues are generally allocated to regional Governments based on a budget formula that is voted by the House of Federation, the upper house of the Federal Parliamentary Assembly. The taxes administered by the federal government include: employment tax from the employees of the federal government and its public enterprises and international organisations, federal stamp duties, monopoly tax, value added tax, national lottery, fees from licenses issued and services provided by organs of the federal government. This is in addition to the federal government‘s share on royalty and non-tax revenues on natural resources (mainly gold and natural gas).
In relation to large-scale mining and petroleum and gas operations, Article 98/3 of the Constitution stipulates that the Federal Government and the States shall jointly levy and collect taxes on incomes derived from such operations. The division of revenues derived from joint Federal and State tax sources is within the powers of the House of Federation according to Article 62/7 of the Constitution. The current revenue sharing ratios applicable for royalty and income tax stemming from large mine and petroleum and gas that were decided by the House of are as follows:
Royalties: 60% for Federal Government and 40% for Regional Government; and
Income tax: shared between the two levels on a 50/50 basis.
3.4. Beneficial ownership
Ethiopia does not currently have a publicly available register of the beneficial owners of the corporate entities that bid for, operate or invest in extractive assets.
At its October 2015 meeting, NSC agreed to disclose the beneficial ownership data for companies selected in the scope. The relating data were submitted by 26 companies as detailed in Appendix 4 of this report.
3.5. State participation in the Extractive industries and SOEs
FDRE’s Constitution stipulates that “the right to ownership of rural and urban land, as well as of all natural resources is exclusively vested in the State and in the people of Ethiopia”. The constitutional principle of custodianship of the country’s mineral resources by the Government was subsequently brought into effect by the Mining Operation Proclamation No.678/2010.
The Government is also entitled, according to Article 72 of the Mining Operations Proclamation (Amendment) No. 816/2013 to acquire without cost, a participation interest of 5% in any large scale mining investment. Additional participation beyond the 5% free equity may also be provided to the Government by agreement with the licensee. Companies operating under the Mining Operations Proclamation (Amendment) No. 816/2013 are required to transfer dividends relating to the 5% free equities to the MoF.
The rate for Government participation in small scale mining through the mechanisms of free equity and additional shareholding are within the jurisdiction of Regional States, and shall be determined by their laws.
During our scoping work, we noted the unavailability of the details of shares owned by the Government (direct and indirect) in extractive companies during the reporting period covered (EFY 2006). As a result, this information could not be assessed and included in the EEITI report. Four State Owned Enterprises operating in the extractive industries have been identified and required to

EEITI Report for the year ended 7 July 2014
Moore Stephens LLP | P a g e 35
report as detailed in Section 4.2.2 of this report. These companies are also subject to the fiscal regime detailed in Section 3.2.4. In this respect, State Owned Enterprises operating in the extractive industries are required to pay non-tax and tax payments to mining and tax authorities and to pay dividends to their shareholders.
3.6. Audit and assurance practices in Ethiopia
3.6.1. Extractive companies
The Commercial Code makes directors of companies responsible for preparation of financial statements, including consolidated financial statements for group companies, and for ensuring that an audit of the financial statements is conducted.
The Commercial Code provides that books and accounts shall be maintained as required in accordance with business practice and Ethiopian regulations including tax laws. However, there is no requirement to comply with any accounting standards system, and the financial statements required to be produced are composed of a balance sheet and a profit and loss account. In provisions for audit, there is no requirement to comply with auditing standards, no specified qualification of auditors, and no audit requirement for private limited companies with 20 or fewer shareholders; and companies may appoint more than one auditor at a time.
In the absence of a strong professional body and specifically dedicated institutions, OFAG regulates the accounting profession. The activities of OFAG in regulating the profession include licensing of all auditors in the country, issuing a Code of Ethics for Professional Accountants, and taking disciplinary measures on proven acts of misconduct by professional accountants.
Thus by implication extractive industries are expected to subject their financial statement to statutory audit at the end of every financial year. However, the financial statements are not available to the general public except in the case of listed companies.
3.6.2. Government Entities
In Ethiopia there is a special government entity – OFAG – the supreme audit institution, which carries out controls over the execution of the government’s budget and payment of taxes and other mandatory payments, including payments from Government Entities as described in the Section 3.3 above.
The Auditor General, appointed by the House of Peoples’ Representatives, shall audit and inspect the accounts of the different Government Entities, ministries and other agencies of the Federal Government to ensure that expenditure are properly accounted for activities carried out during the fiscal year and in accordance with the approved allocations. The Auditor General shall draw up and submit for approval to the House of Peoples’ Representatives in his office’s annual budget.

EEITI Report for the year ended 7 July 2014
Moore Stephens LLP | P a g e 36
4. DETERMINATION OF THE RECONCILIATION SCOPE
4.1. Selection of payment flows and information to be reported
The financial flows to be included in the reconciliation and the Government Entities and Companies which were required to report were determined by NSC based on the scoping study performed before the reconciliation work.
The description of each payment flow detailed below is defined in Appendix 7 of this report.
4.1.1. Non-tax revenue streams
Payment flows to the Ministry of Mines, Oil and Natural Gas (MoM)
According to relevant laws and regulations there are 8 categories of revenues which have to be levied by MoM from the oil, gas and mining companies. These taxes are set out in the table below:
Ref. Payment flows
1.1 Royalties
1.2 License Fees
1.3 Signature Bonus
1.4 Penalties
1.5 Land Rentals
1.6 Production bonuses
1.7 Sale of Petroleum Data Package
1.8 Other material payments to Mining Authority
NSC has decided to include all the identified tax revenue streams in the scope for the 2013/14 EITI Report without applying a materiality threshold.
Payment flows to the Ministry of Finance and Economic Cooperation (MoF)
The other non-tax revenue streams determined to be within the scope of the 2013/14 EEITI Report by NSC are payments made to MoF. NSC has decided to include all non-tax revenue streams in the scope of the 2013/14 EITI Report without applying a materiality threshold.
On the above, the following payments were selected in the scope of the 2013/14 EITI Report:
N° Payment flows
3.1 Free Equity
3.2 Dividends from State Owned Companies
3.3 Other material payments to MoF
4.1.2. Common law taxes
In accordance to relevant laws and regulations and data collected from ERCA there are 12 categories of taxes payable by oil, gas and mining companies to ERCA. These taxes are set out in the table below:
Ref. Payment flows
2.1 Income tax : Schedule C (Mining)
2.2 Income tax : Schedule C (Normal)
2.3 Withholding tax on payments
2.4 Custom duties
2.5 Dividend Tax

EEITI Report for the year ended 7 July 2014
Moore Stephens LLP | P a g e 37
Ref. Payment flows
2.6 Personal Income tax (Pay As You Earn "PAYE")
2.7 Capital gains
2.8 Value Added Tax (VAT)
2.9 Excise Tax
2.10 Penalties
2.11 Withholding tax on interest payments
2.12 Other material payments to ERCA
All of the above types of taxes were included in the reconciliation scope without applying a materiality threshold.
4.1.3. Payment to State Owned Companies
According to EITI Requirement 4.2 a, the EITI report must provide a comprehensive reconciliation of Government revenues and company payments, including payments to and from state-owned enterprises in accordance with the agreed scope.
Based on the pilot reconciliation report 2009-2010, we noted that state-owned companies hold shares in other mining companies and may receive dividends and other payments. Accordingly, NSC decided to include the following payment categories in the scope:
N° Payment flows
4.1 Dividends from Mining Companies
4.2 Other payments
4.1.4. Other information to be reported
(i) Payment to State Governments (regional payments)
According to relevant laws and regulations there are fees and charges paid by mining companies to Local Governments which are detailed as follows:
B- Unilateral company disclosures
6- Regional State Mining Authority
6.1 Royalties
6.2 License Fees
6.3 Penalties
6.4 Land Rentals
6.5 Signature Bonus
6.6 Production bonuses
6.7 Other material payments to Regional State Mining Authority
7- Regional State Tax Authority
7.2 Withholding tax on payments
7.3 Personal Income tax (Pay As You Earn "PAYE")
7.4 Excise tax
7.5 Other material payments to Regional State Tax Authority
These payments are presumed to be financially immaterial in the context of Ethiopia. However, these payments were included in the scope by NSC as they are important to the areas served by Regional Governments. These were included in the 2013/14 EITI scope through the unilateral disclosure of extractive companies, as it was not possible to reconcile them.
(ii) Infrastructure provisions and barter arrangements
According to interviews conducted during the scoping study, no payment flows related to barter arrangements involving infrastructure works as set out in EITI Requirement 9 (f) have been

EEITI Report for the year ended 7 July 2014
Moore Stephens LLP | P a g e 38
identified. However, companies were required to disclose infrastructure or barter arrangements as decided by NSC:
N° Payment flows
5.1 Total budget of the Engagement/Project
5.2 Value of engagements/project incurred from 08/07/2013 au 07/07/2014
5.3 Cumulated value of engagements/project incurred on 07/07/2014
(iii) Social payments
Companies were asked to disclose social expenditure incurred and were not included in the flows to be reconciled. The social payments were included in the 2013/14 EITI scope through the unilateral disclosure of extractive companies, in addition to distinguishing between the two types of social payments (mandatory and voluntary).
The social payments consist of all contributions made by extractive companies to promote local development and to finance social projects in line with the EITI Standard. This Standard encourages multi stakeholder groups to apply a high standard of transparency to social payments and transfers, the parties involved in the transactions and the materiality of these payments and transfers to other benefit streams, including the recognition that these payments may be reported even though it is not possible to reconcile them.
The Mining Operations Proclamation (Amendment) No. 816/2013 makes provision for mandatory social contributions through its Article 62, which stipulates that “Any mining licensee other than artisanal mining licensee and, as appropriate, an exploration licensee shall participate in community development plan, to be determined by the license area and by agreement, and shall allocate money for such expenses”.
These contributions can also be voluntary or non-voluntary and can be made in cash or in kind depending on individual contracts. This category includes, inter alia: health infrastructure, school infrastructure, road infrastructure, market gardening infrastructure, projects related to the promotion of the agriculture and the grants provided to the population.
These payments can be summarised as follows:
N° Payment flows
8.1 Voluntary Corporate Social Responsibility
8.2 Mandatory Social Responsibility
(iv) Quasi fiscal expenditure
According to the NSC decision, Government Entities and SOC selected in the scope were required to disclose all quasi fiscal expenditure.
(v) Production volumes and value
Companies selected in the EITI reconciliation scope were requested to disclose by the NSC decision total production volumes and the value of production by commodity, and, where relevant, by state/region through unilateral reporting.
(vi) Export volumes and values
Extractive companies were required to disclose their exports for the reconciliation period in the reporting templates by value, by commodity and by country of destination.
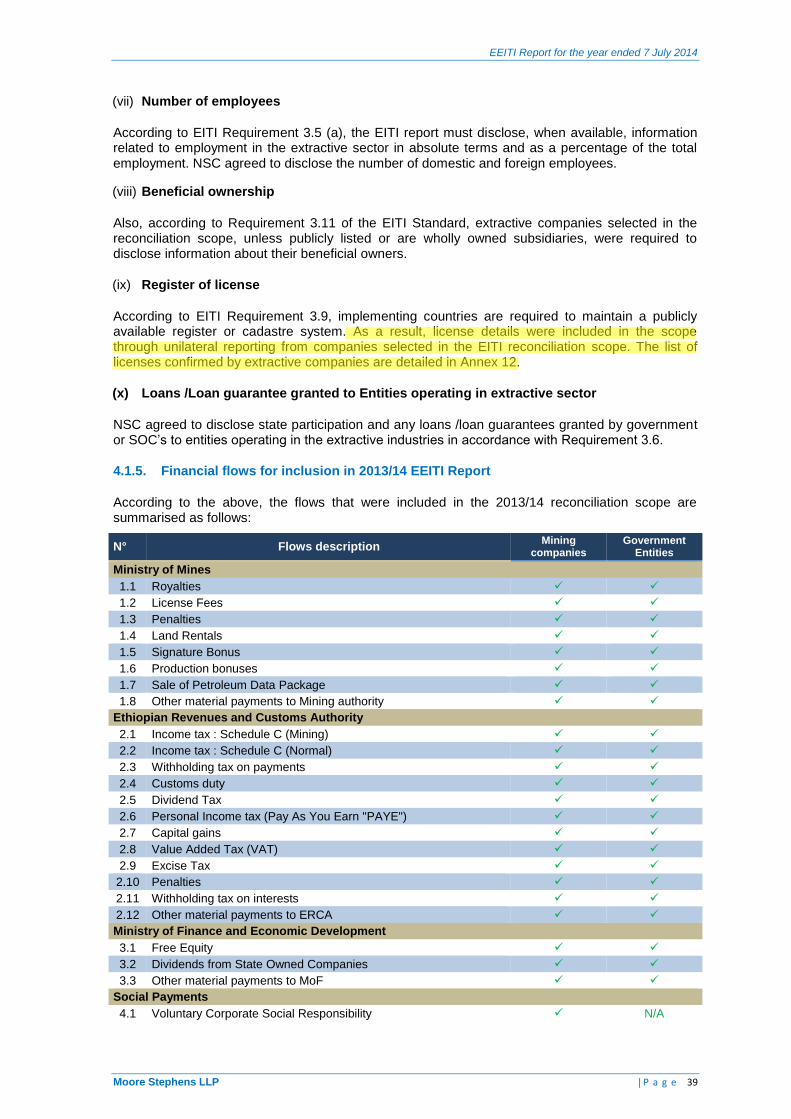
EEITI Report for the year ended 7 July 2014
Moore Stephens LLP | P a g e 39
(vii) Number of employees
According to EITI Requirement 3.5 (a), the EITI report must disclose, when available, information related to employment in the extractive sector in absolute terms and as a percentage of the total employment. NSC agreed to disclose the number of domestic and foreign employees.
(viii) Beneficial ownership
Also, according to Requirement 3.11 of the EITI Standard, extractive companies selected in the reconciliation scope, unless publicly listed or are wholly owned subsidiaries, were required to disclose information about their beneficial owners.
(ix) Register of license
According to EITI Requirement 3.9, implementing countries are required to maintain a publicly available register or cadastre system. As a result, license details were included in the scope through unilateral reporting from companies selected in the EITI reconciliation scope. The list of licenses confirmed by extractive companies are detailed in Annex 12.
(x) Loans /Loan guarantee granted to Entities operating in extractive sector
NSC agreed to disclose state participation and any loans /loan guarantees granted by government or SOC’s to entities operating in the extractive industries in accordance with Requirement 3.6.
4.1.5. Financial flows for inclusion in 2013/14 EEITI Report
According to the above, the flows that were included in the 2013/14 reconciliation scope are summarised as follows:
N° Flows description Mining
companies Government
Entities
Ministry of Mines
1.1 Royalties
1.2 License Fees
1.3 Penalties
1.4 Land Rentals
1.5 Signature Bonus
1.6 Production bonuses
1.7 Sale of Petroleum Data Package
1.8 Other material payments to Mining authority
Ethiopian Revenues and Customs Authority
2.1 Income tax : Schedule C (Mining)
2.2 Income tax : Schedule C (Normal)
2.3 Withholding tax on payments
2.4 Customs duty
2.5 Dividend Tax
2.6 Personal Income tax (Pay As You Earn "PAYE")
2.7 Capital gains
2.8 Value Added Tax (VAT)
2.9 Excise Tax
2.10 Penalties
2.11 Withholding tax on interests
2.12 Other material payments to ERCA
Ministry of Finance and Economic Development
3.1 Free Equity
3.2 Dividends from State Owned Companies
3.3 Other material payments to MoF
Social Payments
4.1 Voluntary Corporate Social Responsibility N/A

EEITI Report for the year ended 7 July 2014
Moore Stephens LLP | P a g e 40
N° Flows description Mining
companies Government
Entities
4.2 Mandatory Social Responsibility N/A
Infrastructure provisions and barter arrangements
5.1 Total budget of the Engagement/Project
5.2 Value of engagements/project incurred from 08/07/2013 au 07/07/2014
5.3 Cumulated value of engagements/project incurred on 07/07/2014
Payment to State Owned companies
6.1 Dividends from Mining Companies
6.2 Other payments
Payment to State Government
7.1 Land Rentals
7.2 Royalties paid by Holders of Small Scale Mining Licenses
7.3 License Fees
7.4 Penalties
7.5 Personal Income tax
7.6 Other material payments to State Government -
N/A: Not applicable
The description of each payment flow, rate and rules are set out in Annex 7 of this report.
4.2. Extractive companies
4.2.1. Oil and Gas Companies
Based on the information made available by MoM, there were no production activities carried out by companies during the period from 8
th July 2013 to 7
th July 2014. The Petroleum, Licensing and
Administration Directorate has confirmed that 6 operators have undertaken exploration activities in the country and already paid fees to MoM. The amounts of income collected are detailed as below:
Company Total revenue FY 13-14 Weight
(million USD) (%)
Poly GCL 9.98 87%
Tullow Oil 0.33 3%
Africa Oil Ethiopia 0.22 2%
Falcon Petroleum 0.13 1%
South West Energy 0.11 1%
New Age Ethiopia 0.7 6%
Total 11.47 100%
Given the limited number of companies in the oil and gas sector, NSC decided to include all the operators and exploration companies which made payments without applying the materiality threshold.
4.2.2. Mining Companies
The selection was based on a thorough review of the list of Private Sector Participants in the Ethiopian mining sector provided by the Mineral Licensing and Administration Directorate of MoM with a view to ensure that operators selected meet the EITI requirement and represent the Extractive Industries in Ethiopia.
Based on the available information during the scoping study, selection was therefore decided by NSC on the basis to the criteria set below:
all companies having paid royalties and/or declared production during the period from 8 July 2013 to 7 July 2014 have been selected for the 2013/14 EITI reconciliation exercise. 17 companies fulfilled this criterion as follows:
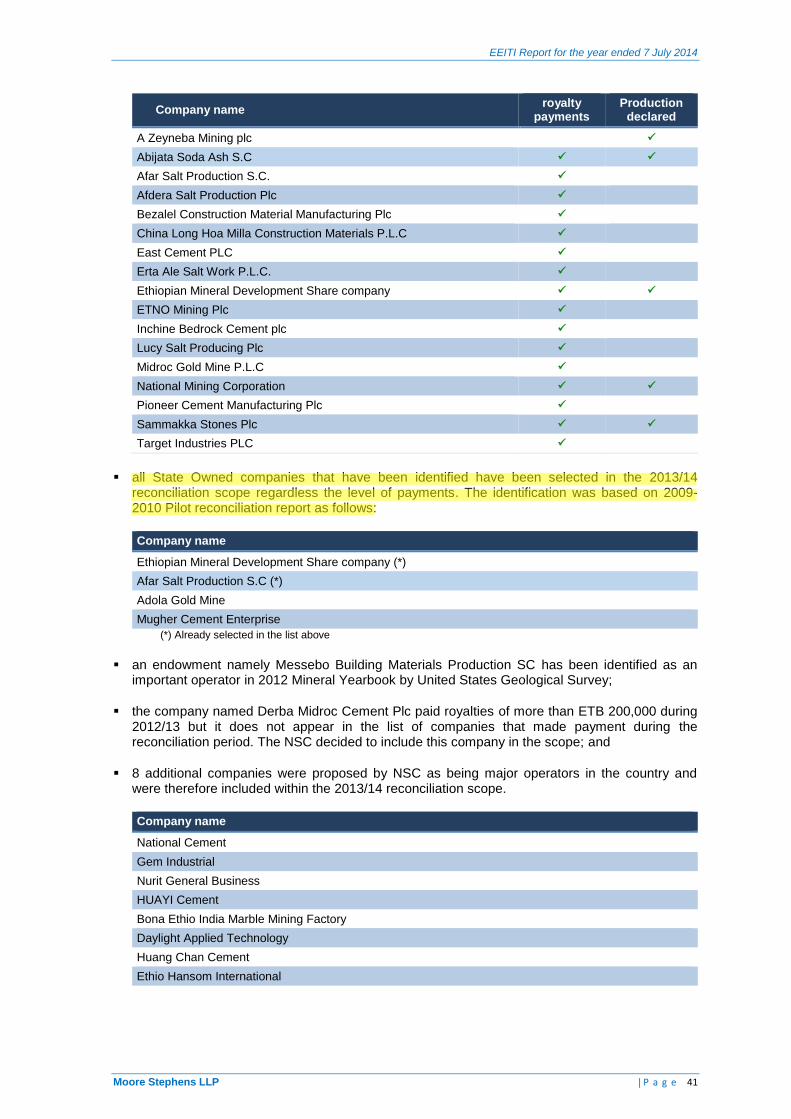
EEITI Report for the year ended 7 July 2014
Moore Stephens LLP | P a g e 41
Company name royalty
payments Production
declared
A Zeyneba Mining plc
Abijata Soda Ash S.C
Afar Salt Production S.C.
Afdera Salt Production Plc
Bezalel Construction Material Manufacturing Plc
China Long Hoa Milla Construction Materials P.L.C
East Cement PLC
Erta Ale Salt Work P.L.C.
Ethiopian Mineral Development Share company
ETNO Mining Plc
Inchine Bedrock Cement plc
Lucy Salt Producing Plc
Midroc Gold Mine P.L.C
National Mining Corporation
Pioneer Cement Manufacturing Plc
Sammakka Stones Plc
Target Industries PLC
all State Owned companies that have been identified have been selected in the 2013/14 reconciliation scope regardless the level of payments. The identification was based on 2009-2010 Pilot reconciliation report as follows:
Company name
Ethiopian Mineral Development Share company (*)
Afar Salt Production S.C (*)
Adola Gold Mine
Mugher Cement Enterprise
(*) Already selected in the list above
an endowment namely Messebo Building Materials Production SC has been identified as an important operator in 2012 Mineral Yearbook by United States Geological Survey;
the company named Derba Midroc Cement Plc paid royalties of more than ETB 200,000 during 2012/13 but it does not appear in the list of companies that made payment during the reconciliation period. The NSC decided to include this company in the scope; and
8 additional companies were proposed by NSC as being major operators in the country and were therefore included within the 2013/14 reconciliation scope.
Company name
National Cement
Gem Industrial
Nurit General Business
HUAYI Cement
Bona Ethio India Marble Mining Factory
Daylight Applied Technology
Huang Chan Cement
Ethio Hansom International

EEITI Report for the year ended 7 July 2014
Moore Stephens LLP | P a g e 42
According to the above, thirty-five (35) companies were selected for the 2013/14 reconciliation exercise. These companies are listed below:
Name of company Name of company
1. Oil & Gas
Africa Oil Ethiopia
2. Mining
Bezalel Construction Material Manufacturing Plc
Tullow Oil China Long Hoa Milla Construction Materials Plc
Poly-GCL A Zeyneba Mining plc
South West Energy Derba Midroc Cement PLC
Falcon Petroleum National Cement Sc
New Age Ethiopia JAM Industrial Plc.
2. Mining
Midroc Gold Mine Plc Nurit General Business Plc
Abijata Soda Ash SC Hua Yi Cement Plc
Pioneer Cement Manufacturing Plc
Bona Ethio-India Marble and Mining Factory Plc
Inchini Bedrock Cement plc Daylight Applied Technologies Plc
East Cement Plc Huang Shan Cement Plc
Erta Ale Salt Work Plc Ethiopian Hansom International Glass Plc
Afdera Salt Production Plc Messebo Building Materials Production SC
Lucy Salt Producing Plc
3. State Owned Companies
Ethiopian Mineral Development Share company
ETNO Mining Plc Afar Salt Production SC
Target Industries Plc Adola Gold Mine
Sammakka Stones Plc Mugher Cement Entreprise
National Mining Corporation
Based on the submission of the list of active licenses and the list of payments received by MoM, 173 private sector participants were identified out of which 35 were selected for the reconciliation exercise.
For the remaining 138 operators which hold extractive licenses but which were not selected in the reconciliation scope according to the approach detailed above, NSC decided the disclosure by Government Entities of the combined benefit stream from the companies holding an active license listed in Annex 9 in accordance with EITI Requirement 4.2.b.
4.3. Government Entities
Based on the scope above, the Government Entities which were required to report for the 2013/14 EITI Report are:
N° Central Government Entities
1 Ministry of Mines (MoM)
2 Ethiopian Revenues and Customs Authority (ERCA)
3 Ministry of Finance and Economic Development (MoF)
4 State Owned Companies (SOC) (*)
(*) SOC are also selected as Government Entity to disclose revenues received from other extractive companies

EEITI Report for the year ended 7 July 2014
Moore Stephens LLP | P a g e 43
5. RECONCILIATION RESULTS
We present below detailed results of our reconciliation exercise, as well as differences noted between amounts paid by extractive companies and amounts received by Government Entities. We have highlighted the amounts initially reported and the adjustments made following our reconciliation work, as well as the final amounts and unreconciled differences.
5.1. Payment Reconciliation between extractive Companies and Government Entities
5.1.1. Reconciliation by Extractive Company
The table below summarises the differences between the payments reported by extractive companies and receipts reported by Government Entities.
The table includes consolidated figures based on the reporting templates prepared by each extractive company and Government Entity, adjustments made by us following our reconciliation work and the residual, unreconciled differences. Detail of the adjustment treatment is presented in Section 5.2 of this report and in order to keep the report size reasonable, detailed reconciliation reports for each company are included in Annex 10 of this report.
Amounts in ETB
No. Company
Templates originally lodged Adjustments Final amounts
Extractive company
(a)
Govt (b)
Difference (c) =
(a - b)
Extractive company
(d)
Govt (e)
Difference (f) = (c-d)
Extractive company (g) = (a+d)
Govt (h) = (b+e)
Difference (i) = (g-h)
1 Africa Oil Ethiopia B.V 6,400,766 6,101,343 299,423 3,915 309,597 -305,682 6,404,681 6,410,940 -6,259
2 Tullow Ethiopia B.V. 18,773,302 18,654,265 119,036 43,800 200,707 -156,907 18,817,102 18,854,972 -37,871
3 POLY-GCL Petroleum Investments Ltd Ethiopian Branch
209,903,354 189,712,511 20,190,843 0 20,190,843 -20,190,843 209,903,354 209,903,354 0
4 SouthWest Energy (HK) Ltd 8,278,827 5,629,360 2,649,467 -2,182,872 466,789 -2,649,661 6,095,955 6,096,149 -194
5 Falcon Petroleum Ltd 1,632,397 1,631,198 1,199 0 0 0 1,632,397 1,631,198 1,199
6 NewAge Ethiopia Ltd 19,867,653 18,941,677 925,977 0 1,218,816 -1,218,816 19,867,653 20,160,493 -292,840
7 MIDROC Gold Mine Plc 1,233,153,532 1,176,948,596 56,204,935 -1,816,734 54,914,195 -56,730,929 1,231,336,797 1,231,862,791 -525,994
8 Ethiopian Mineral Development Sc
21,795,747 31,589,580 -9,793,833 4,347,171 -381,719 4,728,891 26,142,918 31,207,861 -5,064,942
9 Abijata-Shalla Soda Ash Sc 5,189,142 3,949,511 1,239,630 -3,194,179 -1,954,549 -1,239,630 1,994,962 1,994,962 0
10 Pioneer Cement Manufacturing Plc
38,550,378 32,688,221 5,862,157 204,911 548,477 -343,566 38,755,289 33,236,698 5,518,591
11 Afar Salt Production Sc 6,010,417 5,653,282 357,134 0 356,538 -356,538 6,010,417 6,009,821 596
12 Inchine Bedrock Cement Plc 0 603,125 -603,125 1,006,952 382,220 624,732 1,006,952 985,344 21,607
13 East Cement Sc 1,104,584 50,153,183 -49,048,599 644,104 299,197 344,907 1,748,688 50,452,380 -48,703,692
14 Erta Ale Salt Work Plc 2,834,905 2,639,696 195,208 -110,150 85,058 -195,208 2,724,755 2,724,755 0
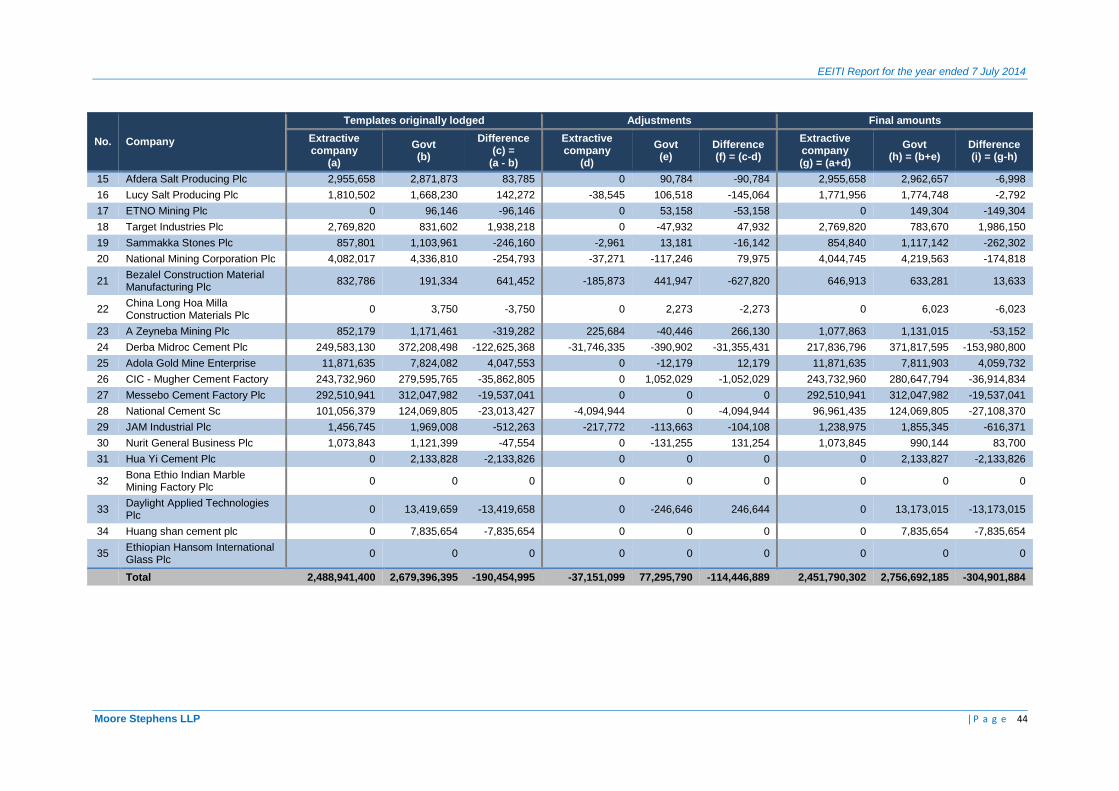
EEITI Report for the year ended 7 July 2014
Moore Stephens LLP | P a g e 44
No. Company
Templates originally lodged Adjustments Final amounts
Extractive company
(a)
Govt (b)
Difference (c) =
(a - b)
Extractive company
(d)
Govt (e)
Difference (f) = (c-d)
Extractive company (g) = (a+d)
Govt (h) = (b+e)
Difference (i) = (g-h)
15 Afdera Salt Producing Plc 2,955,658 2,871,873 83,785 0 90,784 -90,784 2,955,658 2,962,657 -6,998
16 Lucy Salt Producing Plc 1,810,502 1,668,230 142,272 -38,545 106,518 -145,064 1,771,956 1,774,748 -2,792
17 ETNO Mining Plc 0 96,146 -96,146 0 53,158 -53,158 0 149,304 -149,304
18 Target Industries Plc 2,769,820 831,602 1,938,218 0 -47,932 47,932 2,769,820 783,670 1,986,150
19 Sammakka Stones Plc 857,801 1,103,961 -246,160 -2,961 13,181 -16,142 854,840 1,117,142 -262,302
20 National Mining Corporation Plc 4,082,017 4,336,810 -254,793 -37,271 -117,246 79,975 4,044,745 4,219,563 -174,818
21 Bezalel Construction Material Manufacturing Plc
832,786 191,334 641,452 -185,873 441,947 -627,820 646,913 633,281 13,633
22 China Long Hoa Milla Construction Materials Plc
0 3,750 -3,750 0 2,273 -2,273 0 6,023 -6,023
23 A Zeyneba Mining Plc 852,179 1,171,461 -319,282 225,684 -40,446 266,130 1,077,863 1,131,015 -53,152
24 Derba Midroc Cement Plc 249,583,130 372,208,498 -122,625,368 -31,746,335 -390,902 -31,355,431 217,836,796 371,817,595 -153,980,800
25 Adola Gold Mine Enterprise 11,871,635 7,824,082 4,047,553 0 -12,179 12,179 11,871,635 7,811,903 4,059,732
26 CIC - Mugher Cement Factory 243,732,960 279,595,765 -35,862,805 0 1,052,029 -1,052,029 243,732,960 280,647,794 -36,914,834
27 Messebo Cement Factory Plc 292,510,941 312,047,982 -19,537,041 0 0 0 292,510,941 312,047,982 -19,537,041
28 National Cement Sc 101,056,379 124,069,805 -23,013,427 -4,094,944 0 -4,094,944 96,961,435 124,069,805 -27,108,370
29 JAM Industrial Plc 1,456,745 1,969,008 -512,263 -217,772 -113,663 -104,108 1,238,975 1,855,345 -616,371
30 Nurit General Business Plc 1,073,843 1,121,399 -47,554 0 -131,255 131,254 1,073,845 990,144 83,700
31 Hua Yi Cement Plc 0 2,133,828 -2,133,826 0 0 0 0 2,133,827 -2,133,826
32 Bona Ethio Indian Marble Mining Factory Plc
0 0 0 0 0 0 0 0 0
33 Daylight Applied Technologies Plc
0 13,419,659 -13,419,658 0 -246,646 246,644 0 13,173,015 -13,173,015
34 Huang shan cement plc 0 7,835,654 -7,835,654 0 0 0 0 7,835,654 -7,835,654
35 Ethiopian Hansom International Glass Plc
0 0 0 0 0 0 0 0 0
Total 2,488,941,400 2,679,396,395 -190,454,995 -37,151,099 77,295,790 -114,446,889 2,451,790,302 2,756,692,185 -304,901,884

EEITI Report for the year ended 7 July 2014
Moore Stephens LLP | P a g e 45
5.1.2. Reporting by revenue stream
The table below shows the total Basic Payments reported by extractive companies and Government entities, taking into account all adjustments:
Amounts in ETB
N° Description of Payment
Templates originally lodged Adjustments Final amounts
Extractive company
(a)
Govt (b)
Difference (c) = (a) - (b)
Extractive company
(d)
Govt (e)
Difference (f) = (d) - (e)
Extractive company
(g)
Govt (h)
Difference (i) = (g) - (h)
1- Payments to Ministry of Mines (MoM) 389,305,542 306,775,577 82,529,965 2,354,942 83,064,303 -80,709,361 391,660,484 389,839,879 1,820,604
1.1 Royalties paid 142,059,400 86,315,317 55,744,083 4,599,528 59,747,278 -55,147,750 146,658,928 146,062,595 596,333
1.2 License Fees 48,828 0 48,828 -23,514 9,941 -33,455 25,314 9,941 15,373
1.3 Penalties 99,823 810 99,014 -69,887 0 -69,887 29,936 810 29,126
1.4 Land Rentals 34,073,354 28,868,327 5,205,028 -2,151,185 3,020,957 -5,172,142 31,922,170 31,889,284 32,886
1.5 Signature Bonus 189,270,000 171,048,600 18,221,400 0 18,221,400 -18,221,400 189,270,000 189,270,000 0
1.6 Production bonuses 0 0 0 0 0 0 0 0 0
1.7 Sale of Petroleum Data Package 0 0 0 0 0 0 0 0 0
1.8 Other material payments to Mining authority 23,754,136 20,542,523 3,211,613 0 2,064,727 -2,064,727 23,754,136 22,607,250 1,146,886
2- Payments to Ethiopian Revenues and Customs Authority (ERCA)
2,009,461,667 2,295,078,382 -285,616,715 -39,506,041 -15,767,784 -23,738,257 1,969,955,627 2,279,310,599 -309,354,972
2.1 Income tax : Schedule C (Mining) 913,995,147 914,275,535 -280,388 -131,195 -15,769 -115,426 913,863,952 914,259,766 -395,814
2.2 Income tax : Schedule C (Normal) 48,593,708 62,842,081 -14,248,373 -790,274 -131,588 -658,687 47,803,434 62,710,494 -14,907,060
2.3 Withholding tax on payments 49,143,199 40,785,778 8,357,420 -1,835,442 -141,643 -1,693,799 47,307,757 40,644,136 6,663,621
2.4 Customs duty 101,831,347 200,985,919 -99,154,572 71,792 -182,219 254,011 101,903,139 200,803,700 -98,900,561
2.5 Dividend Tax 123,821,735 120,286,274 3,535,461 10,938 0 10,938 123,832,673 120,286,274 3,546,399
2.6 Personal Income tax (Pay As You Earn "PAYE")
43,462,489 43,393,213 69,277 -298,416 -153,613 -144,803 43,164,073 43,239,599 -75,527
2.7 Capital gains 0 0 0 0 0 0 0 0 0
2.8 Value Added Tax (VAT) 715,162,665 786,517,421 -71,354,756 -36,636,970 47,250 -36,684,220 678,525,695 786,564,671 -108,038,976
2.9 Excise Tax 17,756 25,504,068 -25,486,312 0 0 0 17,756 25,504,068 -25,486,312
2.10 Penalties 175,452 4,538,805 -4,363,353 -87,034 5,800 -92,834 88,418 4,544,605 -4,456,187
2.11 Withholding tax on interests (foreign debt) 0 0 0 0 0 0 0 0 0
2.12 Other material payments to ERCA 13,258,169 95,949,288 -82,691,119 190,561 -15,196,002 15,386,563 13,448,731 80,753,286 -67,304,555
3- Payments to Ministry of Finance and Economic Development (MoF)
89,113,979 77,542,436 11,571,543 0 9,999,271 -9,999,271 89,113,979 87,541,707 1,572,272

EEITI Report for the year ended 7 July 2014
Moore Stephens LLP | P a g e 46
N° Description of Payment
Templates originally lodged Adjustments Final amounts
Extractive company
(a)
Govt (b)
Difference (c) = (a) - (b)
Extractive company
(d)
Govt (e)
Difference (f) = (d) - (e)
Extractive company
(g)
Govt (h)
Difference (i) = (g) - (h)
3.1 Free Equity 74,074,719 72,476,204 1,598,515 0 0 0 74,074,719 72,476,204 1,598,515
3.2 Dividends from State Owned Companies 15,039,260 5,066,232 9,973,028 0 9,999,271 -9,999,271 15,039,260 15,065,503 -26,243
3.3 Other material payments to MoF 0 0 0 0 0 0 0 0 0
4- Payment to State Owned Companies (SOC) 1,060,212 0 1,060,212 0 0 0 1,060,212 0 1,060,212
4.1 Dividends from Mining Companies 0 0 0 0 0 0 0 0 0
4.2 Other payments 1,060,212 0 1,060,212 0 0 0 1,060,212 0 1,060,212
Total payments 2,488,941,400 2,679,396,395 -190,454,995 -37,151,099 77,295,790 -114,446,889 2,451,790,302 2,756,692,185 -304,901,884
Unadjusted residual differences are detailed in Section 5.4 of the present report.

EEITI Report for the year ended 7 July 2014
Moore Stephens LLP | P a g e 47
5.2. Adjustments
5.2.1. Extractive company adjustments
The adjustments were carried out on the basis of confirmations from extractive companies and Government Entities and were supported by adequate evidence wherever deemed appropriate. The adjustments made are detailed as follows:
Adjustments to extractive company payments Total Amount (in ETB)
Tax paid not reported (a) 5,504,286
Tax paid reported but outside the period covered (b) -39,011,460
Tax paid reported but outside the reconciliation scope (c) -1,669,704
Tax amount incorrectly reported -12,678
Tax debt reported but not paid 225,684
Tax incorrectly classified (d) 1,006,952
Tax related to activity other than mining (e) -3,194,179
Total added/deducted to amounts originally reported -37,151,099
(a) Taxes paid not reported
These are payment flows reported by Government Entities but not reported by Extractive companies. Adjustments were made on the basis of flag receipts or confirmations from the company. We set out in the table below a summary of the adjustments made to company payments:
Company Tax paid not reported (in ETB)
Ethiopian Mineral Development Sc (1) 4,347,171
East Cement Sc (2) 855,721
Pioneer Cement Manufacturing Plc 204,911
Tullow Ethiopia B.V. 43,800
Sammakka Stones Plc 23,873
JAM Industrial Plc 13,100
Bezalel Construction Material Manufacturing Plc 9,796
Africa Oil Ethiopia B.V 3,914
Lucy Salt Producing Plc 2,000
Total adjustments 5,504,286
(1) Ethiopian Mineral Development Sc has not reported the following payments in its original
reporting templates:
Tax Amount (in ETB)
1.1- Royalties paid 4,000,000
2.8- Value Added Tax (VAT) 269,652
2.12- Other material payments to ERCA 77,519
Total adjustments 4,347,171
(2) East Cement Sc did not report the following payments in its original reporting templates
Tax Amount (in ETB)
2.3- Withholding tax on payments 681,421
2.6- Personal Income tax (Pay As You Earn "PAYE") 174,300
Total adjustments 855,721
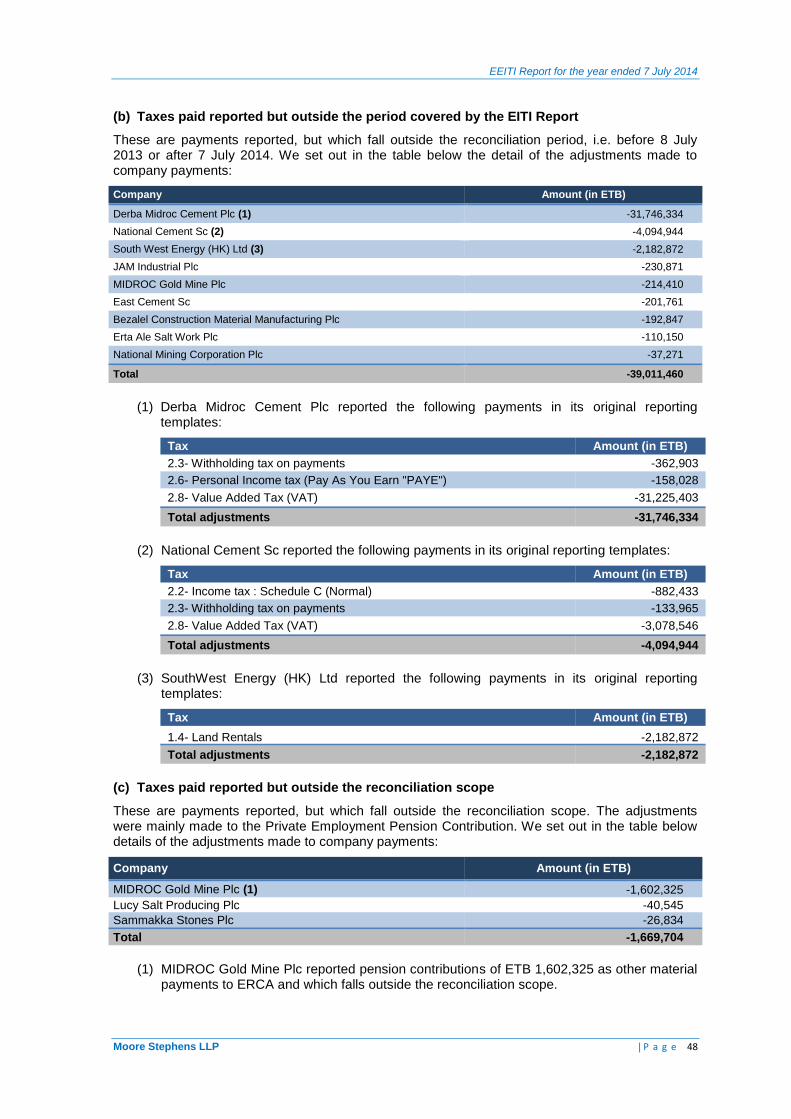
EEITI Report for the year ended 7 July 2014
Moore Stephens LLP | P a g e 48
(b) Taxes paid reported but outside the period covered by the EITI Report
These are payments reported, but which fall outside the reconciliation period, i.e. before 8 July 2013 or after 7 July 2014. We set out in the table below the detail of the adjustments made to company payments:
Company Amount (in ETB)
Derba Midroc Cement Plc (1) -31,746,334
National Cement Sc (2) -4,094,944
South West Energy (HK) Ltd (3) -2,182,872
JAM Industrial Plc -230,871
MIDROC Gold Mine Plc -214,410
East Cement Sc -201,761
Bezalel Construction Material Manufacturing Plc -192,847
Erta Ale Salt Work Plc -110,150
National Mining Corporation Plc -37,271
Total -39,011,460
(1) Derba Midroc Cement Plc reported the following payments in its original reporting templates:
Tax Amount (in ETB)
2.3- Withholding tax on payments -362,903
2.6- Personal Income tax (Pay As You Earn "PAYE") -158,028
2.8- Value Added Tax (VAT) -31,225,403
Total adjustments -31,746,334
(2) National Cement Sc reported the following payments in its original reporting templates:
Tax Amount (in ETB)
2.2- Income tax : Schedule C (Normal) -882,433
2.3- Withholding tax on payments -133,965
2.8- Value Added Tax (VAT) -3,078,546
Total adjustments -4,094,944
(3) SouthWest Energy (HK) Ltd reported the following payments in its original reporting templates:
Tax Amount (in ETB)
1.4- Land Rentals -2,182,872
Total adjustments -2,182,872
(c) Taxes paid reported but outside the reconciliation scope
These are payments reported, but which fall outside the reconciliation scope. The adjustments were mainly made to the Private Employment Pension Contribution. We set out in the table below details of the adjustments made to company payments:
Company Amount (in ETB)
MIDROC Gold Mine Plc (1) -1,602,325
Lucy Salt Producing Plc -40,545
Sammakka Stones Plc -26,834
Total -1,669,704
(1) MIDROC Gold Mine Plc reported pension contributions of ETB 1,602,325 as other material payments to ERCA and which falls outside the reconciliation scope.

EEITI Report for the year ended 7 July 2014
Moore Stephens LLP | P a g e 49
(d) Tax incorrectly classified
Inchine Bedrock Cement Plc reported incorrectly the following payments as to the Regional State instead of MoM:
Tax Amount (in ETB)
1.1- Royalties paid 975,265
1.4- Land Rentals 31,687
Total adjustments 1,006,952
(e) Taxes related to activity other than mining
Abijata-Shalla Soda Ash Sc reported that 80% of its activity as other than extractive. So all the following payments which are not specific to the extractive industries have been excluded:
Tax Amount (in ETB)
2.2 Income tax : Schedule C (Normal) -131,588
2.3 Withholding tax on payments -141,643
2.6 Personal Income tax (Pay As You Earn "PAYE") -166,887
2.8 Value Added Tax (VAT) -2,754,061
Total adjustments -3,194,179
5.2.2. Adjustments to Government Entity templates
The adjustments were carried out on the basis of confirmations received from extractive companies or from Government Entities and supported by flag receipts wherever deemed appropriate. These adjustments are detailed as follows:
Adjustments to Government payments Total Amount in ETB
Taxes received not reported (a) 15,087,137
Taxes received reported but outside the reconciliation scope (b) -14,941,308
Taxes amount incorrectly reported (c) 81 050 585
Taxes related to activity other than extractive (d) -3,900,624
Total added to amounts originally reported 77,295,790
(a) Taxes received not reported
These are payment flows reported by extractive companies but which were not reported by Government Entities. We set out in the table below a summary of the adjustments made to Government Entities’ initial reporting:
Revenue stream Government
Entity Amount (in ETB)
Royalties paid (1) MoM 1 994 962
License Fees MoM 3 186
Personal Income tax (Pay As You Earn "PAYE") ERCA 13 274
Value Added Tax (VAT) (2) ERCA 3 076 444
Dividends from State Owned Companies (3) MoF 9,999,271
Total
15,087,137
After examining details of revenues sent by Government Entities we noted that the amounts originally recorded in the reporting templates were incorrect. Several taxes were under-reported. We therefore made adjustments to reported payments based on confirmations from the companies and/or a review of the supporting documents (receipts):

EEITI Report for the year ended 7 July 2014
Moore Stephens LLP | P a g e 50
(1) The royalty revenue received from Abijata-Shalla Soda Ash Sc during the reporting period was not reported in the original reporting templates of MoM.
(2) VAT received from the following companies during the reporting period has not been declared by ERCA in its reporting templates:
Company Amount (in ETB)
Bezalel Construction Material Manufacturing Plc 450,747
MIDROC Gold Mine Plc 2,625,697
Total adjustments 3,076,444
(3) Dividends received from Mugher Cement Factory during the reporting period were not reported in the original reporting templates of MoF.
(b) Taxes paid reported but outside the reconciliation scope
These are payments reported but which fall outside of the reconciliation scope. The adjustments were exclusively made to the Private and Public Employment Pension Contributions which were adjusted as follows:
Revenue stream Government
Entity Amount (in ETB)
Other material payments to ERCA ERCA -14 941 308
Total -14 941 308
(c) Tax amount incorrectly reported
These are amounts which were incorrectly reported by Government Entities. We found that the most significant difference was incorrectly reported by MoM. We set out in the table below a summary of the adjustments made to Government Entities’ initial reporting:
Revenue stream Government
Entity
Amount (in ETB)
Royalties paid (1) MoM 57 752 315
License Fees MoM 6 755
Land Rentals (2) MoM 3 020 957
Signature Bonus (3) MoM 18 221 400
Other material payments to Mining authority (4) MoM 2 064 727
Income tax : Schedule C (Mining) ERCA -15 569
Total 81 050 585
(1) Royalty revenues received by MoM have been reported as being paid by the extractive companies to the regional states instead of being paid to MoM.
(2) Land rentals were mainly adjusted for exchange rate discrepancies for an amount of ETB 2,997,240.
(3) Signature bonus received from POLY-GCL Petroleum Investments Ltd Ethiopian Branch and reported by MoM was adjusted for exchange rate discrepancy.
(4) The adjustment of the training fees relates to exchange rate discrepancies.

EEITI Report for the year ended 7 July 2014
Moore Stephens LLP | P a g e 51
(d) Tax related to activity other than extractive activities
Abijata-Shalla Soda Ash Sc reported that 80% of its activity is other than extractive. So all the following payments which are not specific to the extractive industries have been adjusted:
Revenue stream Government
Entity
Amount
(in ETB)
Income tax : Schedule C (Mining) ERCA -200
Income tax : Schedule C (Normal) ERCA -131,588
Withholding tax on payments ERCA -141,643
Customs duty ERCA -182,219
Personal Income tax (Pay As You Earn "PAYE") ERCA -166,887
Value Added Tax (VAT) ERCA -3,023,193
Penalties ERCA -200
Other material payments to ERCA ERCA -254,694
Total -3,900,624
5.3. Unreconciled discrepancies
Following our adjustments, the total unreconciled discrepancies amounted to ETB (304,901,884) representing 11% of total payments reported by Government Entities. This is the sum of positive differences of ETB 24,847,600 and negative differences amounting to ETB -329,749,484. These unreconciled differences can be analysed as follows:
Differences
(in ETB)
Reporting template not submitted by the extractive company (a) -10,124,807
Missing extractive company detail per receipt number (b) 2,133,372
Tax not reported by the extractive company (c) -232,541,334
Tax not reported by the Government Entity (d) 22,690,301
Detail of expenditure could not be used (e) -87,083,343
Not material difference < KETB 20 23,927
Total differences -304,901,884
(a) Reporting template not submitted by the extractive company
This unreconciled difference relates to four (4) companies which failed to submit their reporting templates. The receipts reported by Government Entities in respect of these companies amounted to ETB -10 124 807 representing 0.41% of the total extractive sector revenue. Details of these differences by company are set out in the table below:
Company Amount (in ETB)
ETNO Mining Plc -149,304
China Long Hoa Milla Construction Materials Plc -6,022
Hua Yi Cement Plc -2,133,827
Huang shan cement plc -7,835,654
Total -10,124,807
(b) Missing extractive company detail per receipt number
These differences relate to Customs, VAT and Withholding taxes on payments declared by ERCA and amounting to ETB 2,133,372. In these cases, ERCA declared amounts which were lower than payments reported by companies. The companies were unable to provide the associated details of payments.

EEITI Report for the year ended 7 July 2014
Moore Stephens LLP | P a g e 52
(c) Tax not reported by the extractive companies
These differences are mainly related to taxes reported by ERCA. In most cases, we were unable to confirm from the companies the existence of those payments, given the lack of the receipt number of payments of custom duties, withholding taxes, excise tax and other material payments on importation declared by ERCA. We present in the table below a breakdown of unreconciled differences by company:
Revenue Stream Amount (in ETB)
1- Payments to Ministry of Mines (MoM) -15,777
Royalties paid -15,309
Penalties -468
2- Payments to Ethiopian Revenues and Customs Authority (ERCA) -227,459,324
Income tax : Schedule C (Mining) -1,600
Income tax : Schedule C (Normal) -6,373,022
Withholding tax on payments -869,002
Customs duty -60,444,872
Personal Income tax (Pay As You Earn "PAYE") -1,641,692
Value Added Tax (VAT) -89,798,390
Excise Tax -19,702,847
Penalties -3,132,589
Other material payments to ERCA -45,495,311
3- Payments to Ministry of Finance and Economic Development (MoF) -5,066,232
Dividends from State Owned Companies -5,066,232
Total -232,541,334
(d) Taxes not reported by Government Entities
These differences relate mainly to VAT and Dividends reported by companies and not confirmed by ERCA and MoF. We present in the table below a breakdown of unreconciled differences by tax:
Revenue Stream Amount (in ETB)
1- Payments to Ministry of Mines (MoM) 1 974 100
Royalties 750 218
License Fees 15 373
Penalties 29 936
Land Rentals 31 687
Other material payments to Mining authority 1 146 886
2- Payments to Ethiopian Revenues and Customs Authority (ERCA) 15,676,941
Withholding tax on payments 34,915
Dividend Tax 3,546,399
Personal Income tax (Pay As You Earn "PAYE") 1,538,351
Value Added Tax (VAT) 11,581,839
Excise Tax -1,024,563
3- Payments to Ministry of Finance and Economic Development (MoF) 5,039,260
Dividends from State Owned Companies 5,039,260
Total 22,690,301

EEITI Report for the year ended 7 July 2014
Moore Stephens LLP | P a g e 53
(e) Detail of expenditure could not be used
These differences relate to unreconciled amounts between details provided by ERCA and Companies. As presented in the table below these differences are mainly due to Customs Duty, VAT and Withholding Taxes on importation received by ERCA and not detailed by receipt number:
Revenue Stream Amount (in ETB)
2- Payments to Ethiopian Revenues and Customs Authority (ERCA) -87,083,343
Income tax : Schedule C (Normal) -6,939,198
Withholding tax on payments 8,514,244
Customs duty -37,926,939
Personal Income tax (Pay As You Earn "PAYE") 27,810
Value Added Tax (VAT) -24,197,056
Excise Tax -4,758,902
Penalties 3,713
Other material payments to ERCA -21,807,014
Total -87,083,343
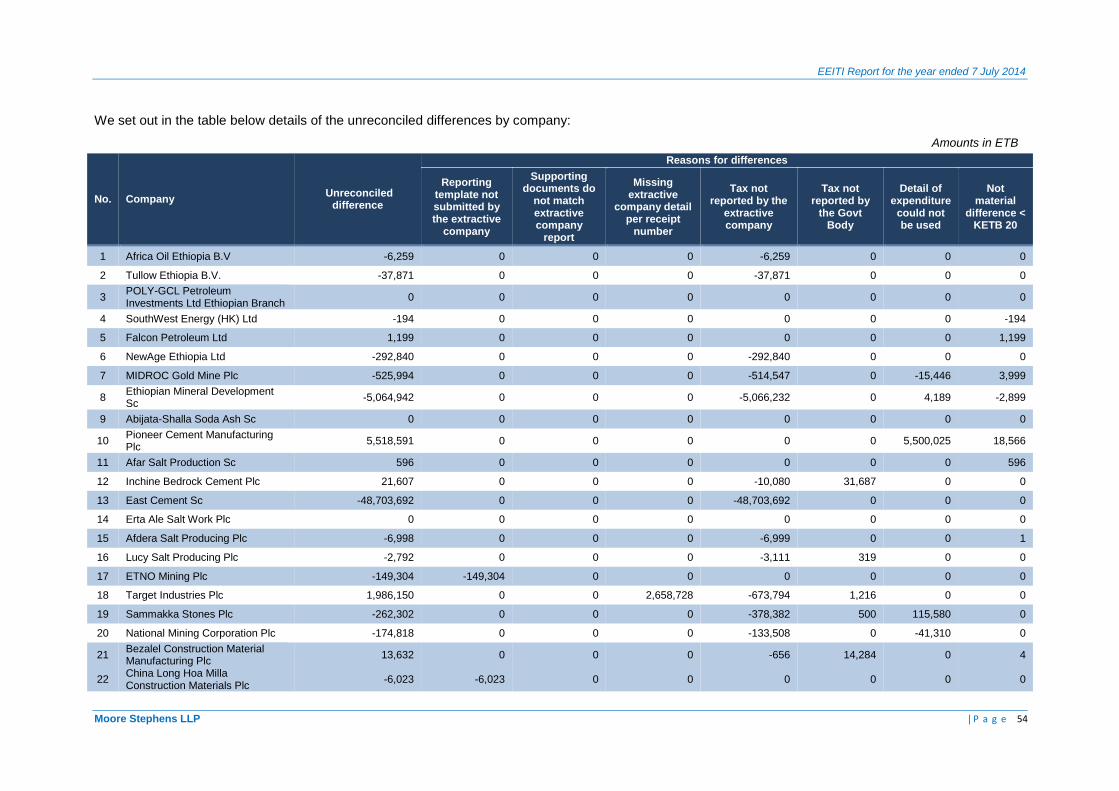
EEITI Report for the year ended 7 July 2014
Moore Stephens LLP | P a g e 54
We set out in the table below details of the unreconciled differences by company:
Amounts in ETB
No. Company Unreconciled
difference
Reasons for differences
Reporting template not submitted by the extractive
company
Supporting documents do
not match extractive company
report
Missing extractive
company detail per receipt
number
Tax not reported by the
extractive company
Tax not reported by
the Govt Body
Detail of expenditure
could not be used
Not material
difference < KETB 20
1 Africa Oil Ethiopia B.V -6,259 0 0 0 -6,259 0 0 0
2 Tullow Ethiopia B.V. -37,871 0 0 0 -37,871 0 0 0
3 POLY-GCL Petroleum Investments Ltd Ethiopian Branch
0 0 0 0 0 0 0 0
4 SouthWest Energy (HK) Ltd -194 0 0 0 0 0 0 -194
5 Falcon Petroleum Ltd 1,199 0 0 0 0 0 0 1,199
6 NewAge Ethiopia Ltd -292,840 0 0 0 -292,840 0 0 0
7 MIDROC Gold Mine Plc -525,994 0 0 0 -514,547 0 -15,446 3,999
8 Ethiopian Mineral Development Sc
-5,064,942 0 0 0 -5,066,232 0 4,189 -2,899
9 Abijata-Shalla Soda Ash Sc 0 0 0 0 0 0 0 0
10 Pioneer Cement Manufacturing Plc
5,518,591 0 0 0 0 0 5,500,025 18,566
11 Afar Salt Production Sc 596 0 0 0 0 0 0 596
12 Inchine Bedrock Cement Plc 21,607 0 0 0 -10,080 31,687 0 0
13 East Cement Sc -48,703,692 0 0 0 -48,703,692 0 0 0
14 Erta Ale Salt Work Plc 0 0 0 0 0 0 0 0
15 Afdera Salt Producing Plc -6,998 0 0 0 -6,999 0 0 1
16 Lucy Salt Producing Plc -2,792 0 0 0 -3,111 319 0 0
17 ETNO Mining Plc -149,304 -149,304 0 0 0 0 0 0
18 Target Industries Plc 1,986,150 0 0 2,658,728 -673,794 1,216 0 0
19 Sammakka Stones Plc -262,302 0 0 0 -378,382 500 115,580 0
20 National Mining Corporation Plc -174,818 0 0 0 -133,508 0 -41,310 0
21 Bezalel Construction Material Manufacturing Plc
13,632 0 0 0 -656 14,284 0 4
22 China Long Hoa Milla Construction Materials Plc
-6,023 -6,023 0 0 0 0 0 0
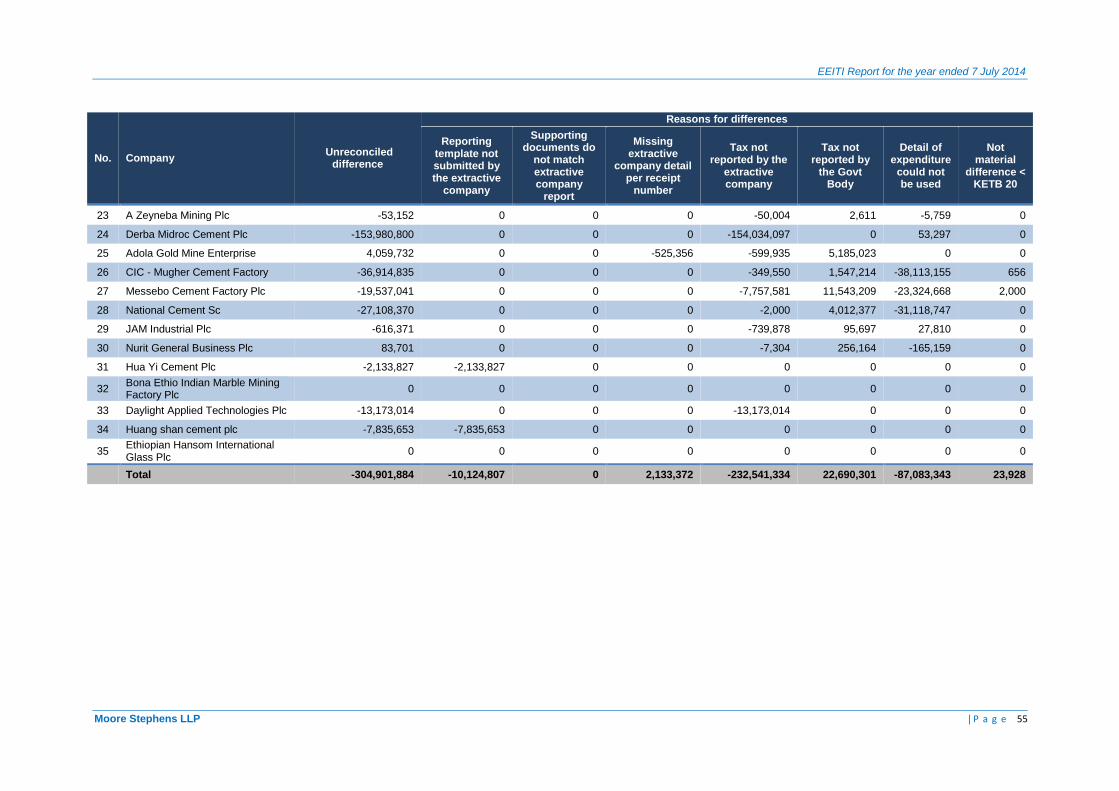
EEITI Report for the year ended 7 July 2014
Moore Stephens LLP | P a g e 55
No. Company Unreconciled
difference
Reasons for differences
Reporting template not submitted by the extractive
company
Supporting documents do
not match extractive company
report
Missing extractive
company detail per receipt
number
Tax not reported by the
extractive company
Tax not reported by
the Govt Body
Detail of expenditure
could not be used
Not material
difference < KETB 20
23 A Zeyneba Mining Plc -53,152 0 0 0 -50,004 2,611 -5,759 0
24 Derba Midroc Cement Plc -153,980,800 0 0 0 -154,034,097 0 53,297 0
25 Adola Gold Mine Enterprise 4,059,732 0 0 -525,356 -599,935 5,185,023 0 0
26 CIC - Mugher Cement Factory -36,914,835 0 0 0 -349,550 1,547,214 -38,113,155 656
27 Messebo Cement Factory Plc -19,537,041 0 0 0 -7,757,581 11,543,209 -23,324,668 2,000
28 National Cement Sc -27,108,370 0 0 0 -2,000 4,012,377 -31,118,747 0
29 JAM Industrial Plc -616,371 0 0 0 -739,878 95,697 27,810 0
30 Nurit General Business Plc 83,701 0 0 0 -7,304 256,164 -165,159 0
31 Hua Yi Cement Plc -2,133,827 -2,133,827 0 0 0 0 0 0
32 Bona Ethio Indian Marble Mining Factory Plc
0 0 0 0 0 0 0 0
33 Daylight Applied Technologies Plc -13,173,014 0 0 0 -13,173,014 0 0 0
34 Huang shan cement plc -7,835,653 -7,835,653 0 0 0 0 0 0
35 Ethiopian Hansom International Glass Plc
0 0 0 0 0 0 0 0
Total -304,901,884 -10,124,807 0 2,133,372 -232,541,334 22,690,301 -87,083,343 23,928

EEITI Report for the year ended 7 July 2014
Moore Stephens LLP | P a g e 56
We set out in the table below details of unreconciled amounts by type of payment:
Amounts in ETB
No. Revenue Stream Unreconciled
difference
Reasons for differences
Reporting template not
submitted by the
extractive company
Supporting documents
do not match
extractive company
report
Missing extractive company detail per
receipt number
Tax not reported by
the extractive company
Tax not reported by
the Govt Body
Detail of expenditure
could not be used
Not material
difference < KETB
20
1- Payments to Ministry of Mines (MoM) 1,820,604 -138,917 0 0 -15,777 1,974,100 0 1,199
1.1 Royalties paid 596,333 -138,576 0 0 -15,309 750,218 0 0
1.2 License Fees 15,373 0 0 0 0 15,373 0 0
1.3 Penalties 29,126 -341 0 0 -469 29,936 0 0
1.4 Land Rentals 32,886 0 0 0 0 31,687 0 1,199
1.5 Signature Bonus 0 0 0 0 0 0 0 0
1.6 Production bonuses 0 0 0 0 0 0 0 0
1.7 Sale of Petroleum Data Package 0 0 0 0 0 0 0 0
1.8 Other material payments to Mining authority 1,146,886 0 0 0 0 1,146,886 0 0
2- Payments to Ethiopian Revenues and Customs Authority (ERCA)
-309,354,972 -9,985,891 0 -525,356 -227,459,324 15,676,941 -87,083,343 22,001
2.1 Income tax : Schedule C (Mining) -395,814 -398,214 0 0 -1,600 0 0 4,000
2.2 Income tax : Schedule C (Normal) -14,907,060 -1,596,890 0 0 -6,373,022 0 -6,939,198 2,050
2.3 Withholding tax on payments 6,663,621 -1,035,048 0 0 -869,002 34,915 8,514,244 18,512
2.4 Customs duty -98,900,561 -3,307 0 -525,356 -60,444,872 0 -37,926,939 -87
2.5 Dividend Tax 3,546,399 0 0 0 0 3,546,399 0 0
2.6 Personal Income tax (Pay As You Earn "PAYE") -75,527 0 0 0 -1,641,692 1,538,351 27,810 4
2.7 Capital gains 0 0 0 0 0 0 0 0
2.8 Value Added Tax (VAT) -108,038,976 -5,622,415 0 0 -89,798,390 11,581,839 -24,197,056 -2,955
2.9 Excise Tax -25,486,312 0 0 0 -19,702,847 -1,024,563 -4,758,902 0
2.10 Penalties -4,456,187 -1,327,239 0 0 -3,132,589 0 3,713 -72
2.11 Withholding tax on interests (foreign debt) 0 0 0 0 0 0 0 0
2.12 Other material payments to ERCA -67,304,555 -2,778 0 0 -45,495,311 0 -21,807,014 548
3- Payments to Ministry of Finance and Economic Development 1,572,272 0 0 1,598,516 -5,066,232 5,039,260 0 728

EEITI Report for the year ended 7 July 2014
Moore Stephens LLP | P a g e 57
No. Revenue Stream Unreconciled
difference
Reasons for differences
Reporting template not
submitted by the
extractive company
Supporting documents
do not match
extractive company
report
Missing extractive company detail per
receipt number
Tax not reported by
the extractive company
Tax not reported by
the Govt Body
Detail of expenditure
could not be used
Not material
difference < KETB
20
(MoF)
3.1 Free Equity 1,598,515 0 0 1,598,516 0 0 0 -1
3.2 Dividends from State Owned Companies -26,243 0 0 0 -5,066,232 5,039,260 0 729
3.3 Other material payments to MoF 0 0 0 0 0 0 0 0
4- Payment to State Owned Companies (SOC) 1,060,212 0 0 1,060,212 0 0 0 0
4.1 Dividends from Mining Companies 0 0 0 0 0 0 0 0
4.2 Other payments 1,060,212 0 0 1,060,212 0 0 0 0
Total -304,901,884 -10,124,807 0 2,133,372 -232,541,334 22,690,301 -87,083,343 23,928

EEITI Report for the year ended 7 July 2014
Moore Stephens LLP | P a g e 58
6. REPORTED DATA ANALYSIS
6.1. Analysis of Government revenues
The reconciled Government revenue is the sum of receipts declared by MoM, ERCA, MoF, Regional Government (RG) and Social Contribution (SC).
6.1.1. Summary
This section resumes the total revenues reconciled, unilateral disclosure of revenues by company and unilateral disclosure of revenues by Government Entities.
Government Entities Amount declared
Adjustment (not extractive company) (*)
Amount adjusted
(ETB) (ETB) (ETB)
Reconciled figures 2,756,692,185 2,756,692,185
Unilateral disclosure of revenues by company 121,141,436
121,141,436
Unilateral disclosure of revenues by Government Entities 2,919,135,559 -2,673,890,639 245,244,920
Total extractive sector 5,796,969,181 -2,673,890,639 3,123,078,542
(*) We note that payments amounting to ETB (2,673,890,639) unilaterally declared by Government Entities (ERCA) do not relate to extractive companies and according the comments in Section 6.2. Accordingly, this amount was adjusted.
6.1.2. Analyses of payments by companies’ contribution
The analysis of Government revenues by companies’ contribution indicates that 5 companies contributed approximately to 79% of the total Government revenues for the Ethiopian fiscal year 8 July 2013 to 7 July 2014 and that MIDROC Gold Mine Plc accounts for almost 40% of the country’s extractive revenues for that period.
Figure 8: Top five companies’ contribution ……….
7%
40%
12% 9%
11%
21%
POLY-GCL
MIDROC GoldMinne
Derba MidrocCement
CIC - MugherCement F.
MesseboCement F.
Others
Company Government
receipts (in ETB) % of total payment
POLY-GCL Petroleum Investments Ltd Ethiopian Branch
209,903,354 7%
MIDROC Gold Mine Plc
1,260,581,562 40%
Derba Midroc Cement Plc
375,471,112 12%
CIC - Mugher Cement Factory
288,854,173 9%
Messebo Cement Factory Plc
344,800,568 11%
Others 643,467,772 21%
Total 3,123,078,542 100%

EEITI Report for the year ended 7 July 2014
Moore Stephens LLP | P a g e 59
6.1.3. Analysis by payment stream
The analysis of payment flows by contribution shows that the top five taxes represent 72% the total reconciled Government revenues from mining activities. We also note that Income tax accounts for 29% and VAT accounts for 25% of total government revenue.
Figure 9: Top five payment flows ………………..
Payment stream Government receipts (in
ETB)
% of total
payment
Income tax : Schedule C (Mining)
914,259,766 29%
Value Added Tax (VAT)
786,564,671 25%
Customs duty 200,803,700 6%
Signature Bonus 189,270,000 6%
Royalties paid 146,062,595 5%
Other 886,117,808 29%
Total 3,123,078,542 100%
6.1.4. Analysis of revenues by Government Entity
During the Ethiopian fiscal year from 8 July 2013 to 7 July 2014, ERCA collected the largest amount of taxes as shown in the table below:
Figure 10: Government Entities’ contribution …………
6.2. Unilateral disclosure of revenues by Government Entities
Government Entities were requested to disclose unilateral revenue streams collected from 138 companies not included within the reconciliation scope in accordance with EITI Requirement 4.2.b. Details of payments by Government Entity are set out in the table below:
29%
25% 7%
6%
5%
28%
Income tax
VAT
Customs
SignatureBonus
Royalties
Other
13%
81%
3% 3% 1%
MOM
ERCA
MoFED
RG
SC
Government Entity
Government receipts
(in ETB)
% of total payment
MOM 400,235,184 13%
ERCA 2,514,160,214 80%
MoF 87,541,707 3%
RG 91,527,476 3%
SC 29,613,960 1%
Total 3,123,078,542 100%

EEITI Report for the year ended 7 July 2014
Moore Stephens LLP | P a g e 60
Government Entities
Declared Government revenue
(in ETB)
Adjustment
(in ETB)
(not extractive company) (*)
Declared Government revenue
adjusted
(in ETB)
MOM 10,395,305
10,395,305
ERCA 2,908,740,254 -2,673,890,639 234,849,615
MoF 0 0 0
Total 2,919,135,559 -2,673,890,639 245,244,920
These revenues, detailed by company are:
Companies MOM ERCA MoF Adjustment
(not extractive company) (*)
Total
(in ETB)
AA Ethiopian Nutritional Foods Plc 67,262 67,262
AARTI Steel Plc 170,642,348 -170,642,348
Alisha Mining Plc 21,178 21,178
Allana Potash Afar Plc 2,121,917 2,121,917
Altau Resources Ltd 460,690 460,690
Ambo Nyamer Agro and Integrated Industries S.C.
69,604 69,604
Anpex Refining and Petro Chemicals Plc 311,451 311,451
Ascom Mining Ethiopia Plc 2,930,482 2,930,482
Benzu Gold Mining Ethiopia plc 36,632 36,632
Birbir Mining Development Private Limited Company
181,343 181,343
Birla Corporation Cement Manufacturing Plc 30,054 30,054
BRANTHAM INVESTMENT Ltd 495,236 495,236
Bullion Mining Plc 1,200 1,200
C.G.C Overseas Construction Ethiopia 279,771,837 -279,771,837
Capital Cement Milling and Packing Plc 41,365,306 -41,365,306
Capital Mining Plc 14,825 14,825
Circum Minerals Potash Ltd 610,865 610,865
Dangote Industries Ethiopia plc 19,641,674 19,641,674
Dashen Cement factory Plc 28,465,244 28,465,244
Dawit Gold Mining Enterprise 109,740 109,740
Delbi Coal Mining S.C. 10,952 10,952
Derba Lime and Chemicals Plc 244,160 244,160
Donia Gonda Mineral Resources Corp. Ltd 6,090 6,090
EL Mining PLC 102,799 102,799
EMD General Trading Plc 6,555 6,555
Ethiopotash B.V 2,331,384 2,331,384
Ezana Mining Developmrnt Plc 624,324 624,324
F.D.R.E Metals Enginering Corporation 2,182,111,149 -2,182,111,149
GP Resource Mining Plc 423,027 423,027
Henan Zhongzhou Institute of Geological & Mining Engineering Reconnaissance(Ethiopia Branch)
704,781 704,781
Janjam Industrial Plc 1,050,685 1,050,685
JEMA PLC 1,034,786 1,034,786
Jiangxi Coalfield Geological General Investigation Co.Ltd.
803,826 803,826
KEFI Minerals (Ethiopia) Ltd 41,930,182 41,930,182

EEITI Report for the year ended 7 July 2014
Moore Stephens LLP | P a g e 61
Companies MOM ERCA MoF Adjustment
(not extractive company) (*)
Total
(in ETB)
KRIPTO Mining and Chemicals Plc 387,510 387,510
Lagalola Gold Mining Exploration Plc 462,459 462,459
Lemmi Amare Gebre 95,988 95,988
Managem PLC 142,076 142,076
Melos Engineering and Trading Plc 56,296 56,296
MGM Gold Mines Plc 64,883 64,883
Modern Building Industries Plc 74,036,293 74,036,293
MRD Australia Mining and Construction Plc 92,186 92,186
MSP Steel Plc 2,682,810 2,682,810
Nankai Mining PLC 1,457,019 1,457,019
Nelvo International Minerals and Metals Plc 103,155 103,155
North Star Mining Plc 4,438 4,438
OMAR ALI ABDO (AFRICAN ORE) 40,411 40,411
Orecorp Minerals Plc 1,482,302 1,482,302
PS MINING Plc 1,922,766 1,922,766
Raj Mineral Exploration Service Plc 2,813,591 2,813,591
Rayan Investiment Plc 3,728,320 3,728,320
Red Fox International Investment Business Plc 7,835,076 7,835,076
Reykjavik Geothermal Consulting Co. 512,786 512,786
Rift Valley Gemstones Import & Export 9,754 9,754
Rift Valley Resources Limited 1,590 1,590
SEKOTA MINING Plc 204,839 204,839
Sheba Exploration Ltd. 3,879,229 3,879,229
Silur Minerals Exploration and Mining Plc 565,484 565,484
Sol_Tem Mining Plc 23,361 23,361
Sourish Marbles Plc 45,046 45,046
Stella Trading and Industry Plc 89,837 89,837
Stone Fields Construction Plc 92,883 92,883
Stratex East Africa Ltd 6,727,453 6,727,453
Teferi Mesfin Teshome 148 148
Teranter General Business (TGB) Plc 1,574 1,574
Three M Marble and Terrazzo Manufacturing Plc 2,647,611 2,647,611
Tigray Resources Incorporated Plc 79,034 79,034
Top Rock Mining Plc 278,827 278,827
Towchester Investment Company Ltd. 313,632 313,632
Transe-Africa Resource Corporation 140,692 140,692
Ture Dire Dawa Cement Factory Share Company 16,882,433 16,882,433
Turquois General Business Plc 43,326 43,326
YGE Mining Plc 59,551 59,551
Abdulla Al Salmi 525,203 525,203
CONTECH ENGINEERING COLLC 1,507,753 1,507,753
Revenue not disaggregated by company 8,362,349 8,362,349
Total 10,395,305 2,908,740,254 -2,673,890,639 245,244,920
(*) Further analysis was conducted of companies making payments above 0.5% of total reported by Government Entities in order to ensure that they are undertaking extractive activities. Seven companies making payments above 0.5% of total revenues were identified, out of them, we note that four (4) companies holding active licences were adjusted for the reasons below:

EEITI Report for the year ended 7 July 2014
Moore Stephens LLP | P a g e 62
- Capital Cement Milling and Packing Plc: has had an active Mining Licence since 30 January 2012 and made payments amounting to ETB 41,365,306 during the reporting period EFY 2006. The company confirmed by letter that it had yet to start extraction activities and that it is currently buying raw materials which it processes for sale. So despite the fact that the company holds an active mining licence, all its payments are from non-extractive activities and should therefore be excluded from the total revenues of the extractive industries;
- F.D.R.E Metals Engineering Corporation: has been awarded a large scale mining licence for coal in Oromia since 20 April 2012 and made payments amounting to ETB 2,182,111,149 during the reporting period. In accordance with publicly available information from the company’s website, it produces high value spare parts for machineries, industrial equipment and vehicles. The company did not pay any royalty payments during the reporting period and the majority (96%) of its payments declared by ERCA comes from custom duty payments. In accordance with confirmations from MoM, the activity of the company is non-extractive, therefore including the payments of F.D.R.E Metals Engineering Corporation in the unilateral revenues from the extractive industries would overstate extractive revenues;
- AARTI Steel Plc: has three (3) active exploration licences since 2012 for Coal, Limestone and Iron and has not yet started any extraction activities. The company made payments to ERCA amounting to ETB 170,642,348 which are from non-extractive industries and should therefore be excluded from the total revenues of the sector;
- C.G.C Overseas Construction Ethiopia: has an active exploration license in Oromia since 2009 for Precious and Rare Metals and made payments amounting to ETB 279,771,837 to ERCA during the reporting period. The company did not make any payments relating to the extractive industries during the reconciliation period, i.e. royalties and Schedule C income tax. All payments of this company are from non-extractive industries and should therefore be excluded from the total revenue of the extractive industries.
6.3. Unilateral disclosure of revenues by reporting companies
Extractive Companies were requested to disclose unilateral payments made to Regional State and any social contribution. Summary of reported the amount is set out in the table below:
Payment flows Amount (in ETB)
Contribution to total extractive
revenues %
Regional State Mining Authority 13,261,904 0%
Regional State Tax Authority 78,265,573 3%
Social Contributions 29,613,960 1%
Total Unilateral company disclosures 121,141,436 4%
Total extractive industries 3,123,078,542 100%
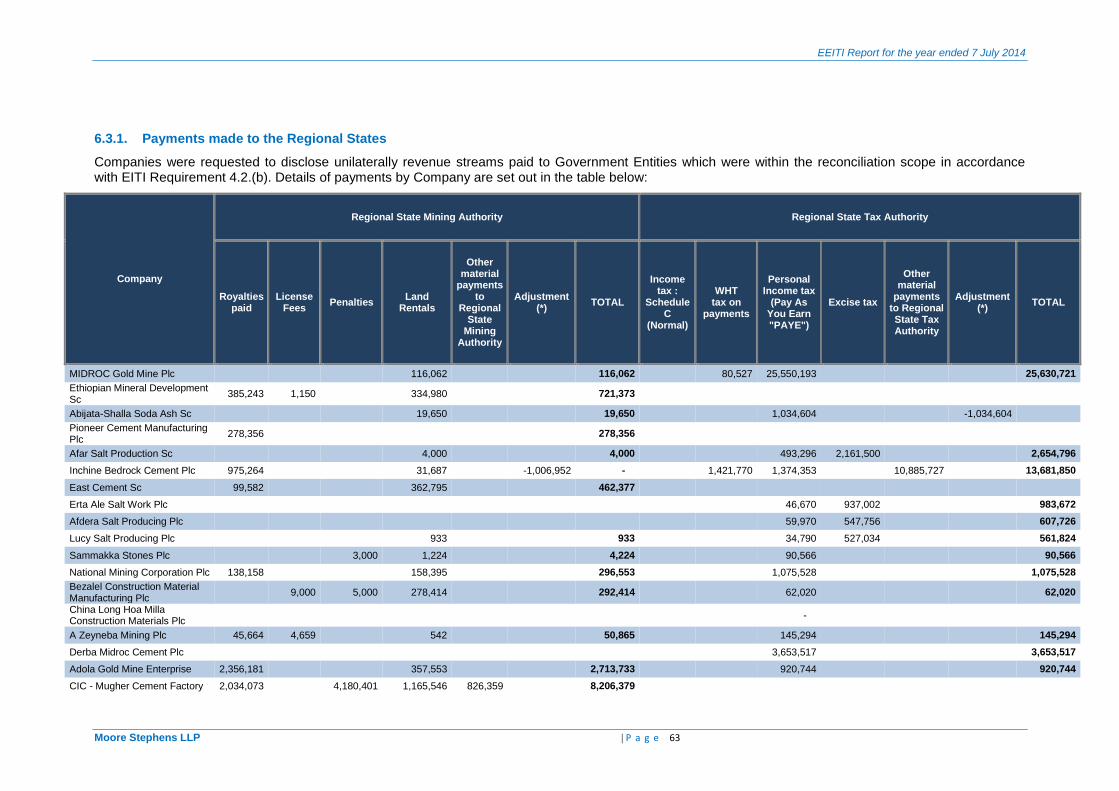
EEITI Report for the year ended 7 July 2014
Moore Stephens LLP | P a g e 63
6.3.1. Payments made to the Regional States
Companies were requested to disclose unilaterally revenue streams paid to Government Entities which were within the reconciliation scope in accordance with EITI Requirement 4.2.(b). Details of payments by Company are set out in the table below:
Company
Regional State Mining Authority Regional State Tax Authority
Royalties paid
License Fees
Penalties Land
Rentals
Other material
payments to
Regional State
Mining Authority
Adjustment (*)
TOTAL
Income tax :
Schedule C
(Normal)
WHT tax on
payments
Personal Income tax
(Pay As You Earn "PAYE")
Excise tax
Other material
payments to Regional State Tax Authority
Adjustment (*)
TOTAL
MIDROC Gold Mine Plc 116,062 116,062 80,527 25,550,193 25,630,721
Ethiopian Mineral Development Sc
385,243 1,150 334,980 721,373
Abijata-Shalla Soda Ash Sc 19,650 19,650 1,034,604 -1,034,604
Pioneer Cement Manufacturing Plc
278,356 278,356
Afar Salt Production Sc 4,000 4,000 493,296 2,161,500 2,654,796
Inchine Bedrock Cement Plc 975,264 31,687 -1,006,952 - 1,421,770 1,374,353 10,885,727 13,681,850
East Cement Sc 99,582 362,795 462,377
Erta Ale Salt Work Plc 46,670 937,002 983,672
Afdera Salt Producing Plc 59,970 547,756 607,726
Lucy Salt Producing Plc 933 933 34,790 527,034 561,824
Sammakka Stones Plc 3,000 1,224 4,224 90,566 90,566
National Mining Corporation Plc 138,158 158,395 296,553 1,075,528 1,075,528
Bezalel Construction Material Manufacturing Plc
9,000 5,000 278,414 292,414 62,020 62,020
China Long Hoa Milla Construction Materials Plc
-
A Zeyneba Mining Plc 45,664 4,659 542 50,865 145,294 145,294
Derba Midroc Cement Plc 3,653,517 3,653,517
Adola Gold Mine Enterprise 2,356,181 357,553 2,713,733 920,744 920,744
CIC - Mugher Cement Factory 2,034,073 4,180,401 1,165,546 826,359 8,206,379

EEITI Report for the year ended 7 July 2014
Moore Stephens LLP | P a g e 64
Company
Regional State Mining Authority Regional State Tax Authority
Royalties paid
License Fees
Penalties Land
Rentals
Other material
payments to
Regional State
Mining Authority
Adjustment (*)
TOTAL
Income tax :
Schedule C
(Normal)
WHT tax on
payments
Personal Income tax
(Pay As You Earn "PAYE")
Excise tax
Other material
payments to Regional State Tax Authority
Adjustment (*)
TOTAL
Messebo Cement Factory Plc 28,193,762 28,193,762
National Cement Sc 39,681 1,912 8,282 49,876
Bona Ethio Indian Marble Mining Factory Plc
1,481 2,073 3,554
Daylight Applied Technologies Plc
11,900 11,900
Ethiopian Hansom International Glass Plc
29,804 3,405 33,210 49,674 -49,674
Total 6,364,101 46,525 4,188,401 2,843,469 826,359 -1,006,952 13,261,904 49,674 1,502,297 62,736,787 4,173,292 10,887,800 -1,084,278 78,265,573
(*) Payments amounting to ETB -1,006,952 for the Regional State Mining Authority and of ETB -1,084,278 for the Regional State Tax Authority declared by companies do not relate to the extractive activities. Accordingly, we adjusted these amounts.
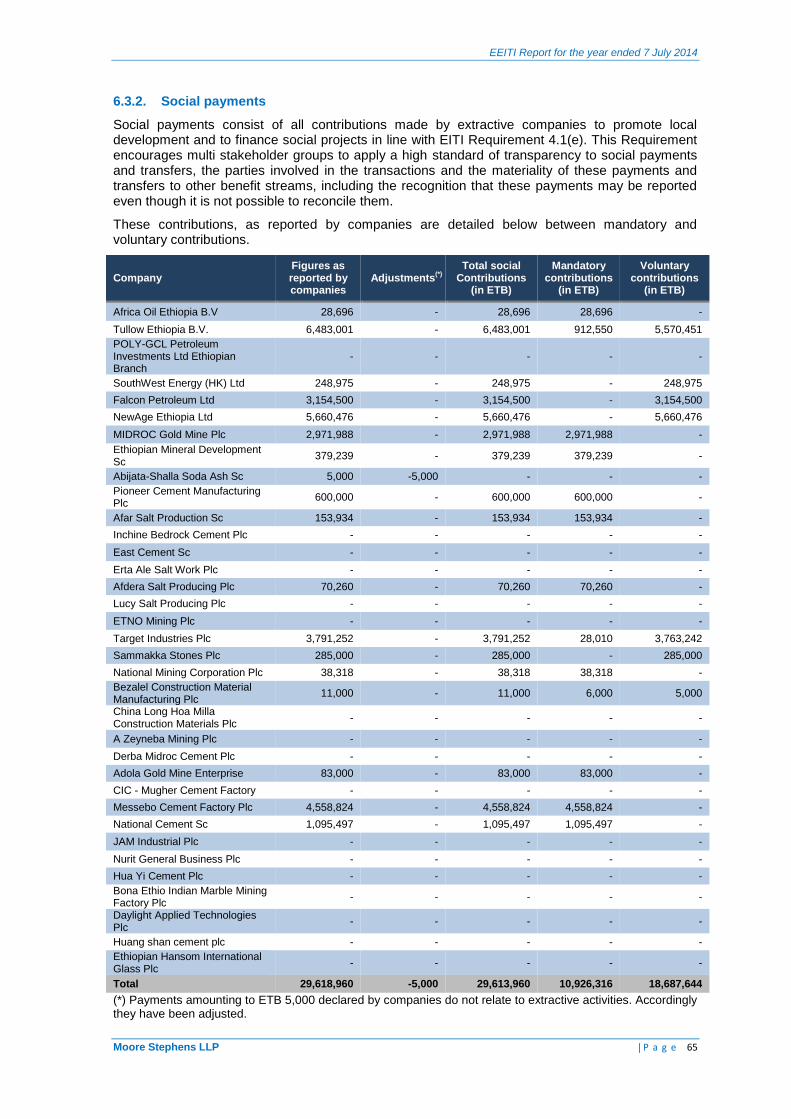
EEITI Report for the year ended 7 July 2014
Moore Stephens LLP | P a g e 65
6.3.2. Social payments
Social payments consist of all contributions made by extractive companies to promote local development and to finance social projects in line with EITI Requirement 4.1(e). This Requirement encourages multi stakeholder groups to apply a high standard of transparency to social payments and transfers, the parties involved in the transactions and the materiality of these payments and transfers to other benefit streams, including the recognition that these payments may be reported even though it is not possible to reconcile them.
These contributions, as reported by companies are detailed below between mandatory and voluntary contributions.
Company Figures as reported by companies
Adjustments(*)
Total social
Contributions (in ETB)
Mandatory contributions
(in ETB)
Voluntary contributions
(in ETB)
Africa Oil Ethiopia B.V 28,696 - 28,696 28,696 -
Tullow Ethiopia B.V. 6,483,001 - 6,483,001 912,550 5,570,451
POLY-GCL Petroleum Investments Ltd Ethiopian Branch
- - - - -
SouthWest Energy (HK) Ltd 248,975 - 248,975 - 248,975
Falcon Petroleum Ltd 3,154,500 - 3,154,500 - 3,154,500
NewAge Ethiopia Ltd 5,660,476 - 5,660,476 - 5,660,476
MIDROC Gold Mine Plc 2,971,988 - 2,971,988 2,971,988 -
Ethiopian Mineral Development Sc
379,239 - 379,239 379,239 -
Abijata-Shalla Soda Ash Sc 5,000 -5,000 - - -
Pioneer Cement Manufacturing Plc
600,000 - 600,000 600,000 -
Afar Salt Production Sc 153,934 - 153,934 153,934 -
Inchine Bedrock Cement Plc - - - - -
East Cement Sc - - - - -
Erta Ale Salt Work Plc - - - - -
Afdera Salt Producing Plc 70,260 - 70,260 70,260 -
Lucy Salt Producing Plc - - - - -
ETNO Mining Plc - - - - -
Target Industries Plc 3,791,252 - 3,791,252 28,010 3,763,242
Sammakka Stones Plc 285,000 - 285,000 - 285,000
National Mining Corporation Plc 38,318 - 38,318 38,318 -
Bezalel Construction Material Manufacturing Plc
11,000 - 11,000 6,000 5,000
China Long Hoa Milla Construction Materials Plc
- - - - -
A Zeyneba Mining Plc - - - - -
Derba Midroc Cement Plc - - - - -
Adola Gold Mine Enterprise 83,000 - 83,000 83,000 -
CIC - Mugher Cement Factory - - - - -
Messebo Cement Factory Plc 4,558,824 - 4,558,824 4,558,824 -
National Cement Sc 1,095,497 - 1,095,497 1,095,497 -
JAM Industrial Plc - - - - -
Nurit General Business Plc - - - - -
Hua Yi Cement Plc - - - - -
Bona Ethio Indian Marble Mining Factory Plc
- - - - -
Daylight Applied Technologies Plc
- - - - -
Huang shan cement plc - - - - -
Ethiopian Hansom International Glass Plc
- - - - -
Total 29,618,960 -5,000 29,613,960 10,926,316 18,687,644
(*) Payments amounting to ETB 5,000 declared by companies do not relate to extractive activities. Accordingly they have been adjusted.

EEITI Report for the year ended 7 July 2014
Moore Stephens LLP | P a g e 66
6.4. Regional Transfers
In accordance with EITI requirement 4.2 (e), where transfers between national and regional Government Entities relate to revenues generated by extractive industries and are mandated by a national constitution, statute or other sharing mechanism, the multi-stakeholder group is required to ensure that material transfers are disclosed in the EITI Reports.
According to the relevant laws and regulations Royalties are payable by oil, gas and mining companies. This tax should be distributed between the Federal and Regional States on the following basis:
Federal Government: 60%
Regional State: 40%
In this respect, the Ministry of Mines declared that the amount of royalties that has been transferred from the Federal State to State governments during the reporting period is ETB 57,693,088.
6.5. Analysis of production data
Extractive Companies were requested to disclose total production volumes and the value of production by commodity, and, when relevant, by state/region in accordance with EITI Requirement 3.5.(a). These productions, as reported by companies are detailed by company in Annex 6.
6.6. Analysis of export data
Seven (07) companies out of the 35 selected within the reconciliation scope have reported exports figures, as detailed below:
Companies Solid Minerals
Types Quantity (Tons)
FOB Value (in ETB)
Country of destination
MIDROC Gold Mine Plc Gold 3.633749 3,023,569,612 Zurich, Switzerland
Silver 1.055726 8,482,327 Zurich, Switzerland
Ethiopian Mineral Development Sc Tantalite 52 58,552,878 China, USA
Sammakka Stones Plc Marble block 35.25 593,265 India / China
National Mining Corporation Plc Marble Block 354.6 2,009,868 China
A Zeyneba Mining Plc Marble block 86.241 600,872 India / China
Derba Midroc Cement Plc Cement 35200 63,243,169 Kenya
Total 3,157,051,991
6.7. Beneficial ownership
Extractive Companies were requested to report the beneficial ownership in the reporting templates. A beneficial owner in respect of an extractive company means the natural person(s) who directly or indirectly ultimately owns or controls the corporate entity. Details of beneficial ownership by company are set out in the Annex 4.
.

EEITI Report for the year ended 7 July 2014
Moore Stephens LLP | P a g e 67
6.8. Infrastructure provisions and barter arrangements
Only CIC-Mugher Cement reported amounts as infrastructure provisions and barter arrangements without specifying the description of the engagement and the nature of the project.
Company
Description of the project
Location of the project
Terms of the Transaction Terms of
Transaction and legal
basis (Ref of the
Agreement, date of
signature, etc..)
Total budget of the
Engagement/Project
(ETB)
Value of engagements/pro
ject incurred from 08/07/2013
to 07/07/2014 (ETB)
Cumulated value of
engagements/project incurred on
07/07/2014 (ETB)
CIC - Mugher Cement Factory
Not communicated
Not communicated
824,274,551.28 243,637,258.00 238,454,953.97 Not communicated

EEITI Report for the year ended 7 July 2014
Moore Stephens LLP | P a g e 68
7. RECOMMENDATIONS
7.1 Reporting templates not adequately prepared by several stakeholders
We note that the reporting templates from extractive companies and Government Entities were not adequately prepared. We set out below several weaknesses noted during the fieldwork:
companies and Government Entities must report detailed payment flows by receipt number, as this information is necessary for reconciliation work. However, in several cases, companies reported figures aggregated by tax type and did not provide the required level of breakdown by receipt number. MoM was not able to provide the breakdown of license fees disaggregated by company. Details of payment flows reported by ERCA for import/export duties did not include the relevant receipt numbers associated with each of the payments;
no declaration was made by Government Entities on the Public Interest held in extractive companies as required in sheet 8 of the reporting templates;
several reporting templates submitted by companies did not include information on licences, beneficial ownership, export details, infrastructure provisions and barter arrangements; and
incompleteness of payment declarations of extractive companies: material amounts were not declared.
These shortcomings led to considerable delays and significant resources being involved to make sense of the figures before making adjustments to the amounts declared.
We recommend that the Ethiopia NSC ensures that reporting entities are made aware of the importance of the data they are providing and that due care and attention is paid during the preparation of these reporting templates.
7.2 Reliability of the data reports/ lack of assurance on reported data
As part of procedures set to ensure the reliability of the data reported to us in the reconciliation process, we requested reporting entities to provide a hard copy of their reporting templates, certified by an external auditor for extractive companies and by the Federal Auditor General for Government Entities, along with a copy of their latest audited financial statements. These requirements have been clearly set out during the training workshop as well as in the instructions which were sent to the reporting entities along with the reporting templates. We noted that:
- Falcon Petroleum failed to submit reporting templates signed by an authorised officer; and - eighteen companies failed to submit reporting templates certified by an external auditor as
detailed in Annex 12.
According to the EITI Requirements, the reliability of data is one of the most critical points for the evaluation of a country’s transparency and consequently one of the criteria to bear in mind during the country’s compliance process.
We recommend for the future that the instructions for next year’s reporting emphasize these matters and reporting entities should be urged to follow the instructions in the reporting process.
7.3 Licenses register
The EITI Standard requires implementing countries to maintain a publicly available register or cadastre system(s) with the following up to date and comprehensive information regarding each of the licenses pertaining to companies covered in the EITI Report:
i. Name(s) of license holder(s);
ii. Coordinates of the licensed area;
iii. Date of application, date of award and duration of the license; and
iv. In the case of production licenses, the commodity being produced.
We noted that the cadastre that has been presented to us has the following weaknesses:

EEITI Report for the year ended 7 July 2014
Moore Stephens LLP | P a g e 69
TIN numbers of the companies were not mentioned in the register in order to identify the companies. The only identification is the company name which can be misspelt and the TIN numbers of five license holders are still missing;
information on the license numbers were missing for 35 exploration licenses and for 39 mining licenses from the register extracted from the system;
the information on the area of the license perimeter was missing from the register extracted from the system for 2 exploration licenses which are for Rayan Investment Plc and YGE Mining Plc that have been awarded in September 2007 and January 2009 respectively;
companies that were licensed at the regional States level were not included in the register such as Mugher Cement Factory;
The completeness of the licenses registry system is extremely important to enable MoM to discharge its licensing authority duties and ensure an effective oversight of the extractive industries.
Therefore, remedial action needs to be taken as quickly as possible to address any gaps in the system. In this respect, we recommend that in the first place a thorough review is undertaken to ensure that it captures all existing licenses and all relevant details from each licence.
This should include the integration of TIN numbers of current license holders, as the unique identifier of companies, which enables an efficient tracking of tax collection and facilitates joint monitoring and communication between various tax authorities at the federal level.
Once the mining cadastre is comprehensive, an efficient procedure needs to be set to ensure that the cadastre is kept up to date and that all new information on licences is systematically recorded therein.
7.4 Budget comprehensiveness and transparency
The EITI standard requires that “the EITI Report should indicate which extractive industry revenues, are recorded in the national budget and whether these are cash or in-kind. Where revenues are not recorded in the national budget, the allocation of these revenues must be explained…”
According to the approved budget and actual revenue for the fiscal year 2013/2014 made available to us, the revenue gives a breakdown of royalty payments only and does not allow the recognition of total revenue from the extractive industries.
In order to improve the transparency and comprehensiveness of the budgeting process, we recommend that the Ministry of Finance to refine the revenues from the extractive sector as separate budgetary revenue and to consider whether the disaggregated amount or more information need to be disclosed in the budget.
7.5 Reporting deadlines not met by extractive companies
Workshop was hosted by the Independent Administrator on 14 October 2015 before sending the reporting templates to all reporting entities. NSC set the deadline for reporting template submission at 30 October 2015 and the deadline for responding to reconciliation queries at 27 November. However, we noted a lack of adherence to the agreed timeframe by reporting entities. We list out below instances of significant delays we came across in addition to cases where reporting entities failed to submit reporting templates altogether:
four companies failed to submit their reporting templates to date;
significant delays occurred in getting feedback and obtaining comments from most of the reporting companies for the reconciliation of discrepancies;
some extractive companies did not reply to our queries for additional required detail; and
ERCA did not respond to our queries on discrepancies identified with companies’ confirmation, on the list of receipts detail for importation duties and on our request for copy of receipts in order to confirm the relating payments with companies.

EEITI Report for the year ended 7 July 2014
Moore Stephens LLP | P a g e 70
This situation led to considerable delays in receiving adequate information on time and led to significant additional resources being required to try to contact officers and management in order to obtain the reporting templates. A significant amount of the discrepancies are explained by the lack of reporting templates from reporting entities which did not report on time, and by the lack of response from ERCA on clarification queries on the discrepancies identified and on our request of providing copies of the receipts for some companies in order to confirm the payment flows which were not declared by extractive companies.
We recommend that Ethiopia EITI raises awareness of reporting entities regarding the importance of the reconciliation process. NSC should undertake more effective outreach activities with civil companies, including through communication such as media, website and letters, informing stakeholders of the government’s progress implementing the EITI and disseminating the EITI Report.
We also recommend for the future that the timing of the reconciliation exercise is better planned in the years to come in order to avoid short and pressured deadlines. This is likely to promote better cooperation from reporting entities and they would provide better support to the Independent Administrator.
7.6 Lack of EITI Database
It appears that to date a comprehensive database of all extractive companies operating in the extractive industries is still to be completed by the Ethiopia EITI Secretariat. This is due to the fact that there is no formal communication with government entities with regards to the extractive companies operating in the sector. In some cases making contact with extractive companies can be difficult as no contact details are available.
We recommend that, in the first instance, the Secretariat should create its database following this first reconciliation exercise. The Secretariat should then liaise with the Governmental Entities to ensure it obtains adequate information regularly and updates its database accordingly. To this end, we believe it is vital that any new entrants to the extractive sector are registered with the EITI Secretariat as part of the process before or at the same time as they obtain their licence. A quarterly review with the Governmental Entities of the list of extractive companies licensed to operate in the sector is also recommended.
Each extractive company and Government Entity previously included in the reconciliation work must appoint a focal point to take responsibility for comprehensive EITI reporting and the reporting entity should notify the Secretariat of the name and contact details of that focal person.
7.7 Publication of statistics and information on the extractive industry
The EITI Standard stipulates the disclosure of contextual information of the activities and regulations in the extractive industries, including the disclosure of:
an overview of the extractive industries in terms of reserves, regions, current structure and size, significant exploration activities etc.;
contribution to the economy, with regards to employment and export levels;
government revenues generated by the extractive industries and funds earmarked for specific programmes / geographic regions and sub-national transfers; and
public information on license allocations, register of licensees, beneficial owners, contract terms, etc.
Currently, it seems that a comprehensive database of contextual information and statistics is yet to be completed at the level of the EEITI Secretariat. The contextual information in this report is referenced to different sources dispersed across public and often not publicly available information. Certain analyses were limited due to unavailability of statistical data on the sector such as employment, exports and GDP contribution.
In order to maintain accurate and comprehensive records of production, it is important to enable MoM produce reliable data for the EITI process, for assessing the companies’ liabilities in terms of royalties on production and subsequently monitoring their payments as well as the development of the extractive activities in the country. However we noted that the minerals’ production data held by MoM was not comprehensive of all types of minerals that were produced during the reconciliation

EEITI Report for the year ended 7 July 2014
Moore Stephens LLP | P a g e 71
period. Comparison with the data collected from companies in the scope has revealed significant gaps in the production volumes held by MoM. We also noted discrepancies between the data provided by NBE and MoM in relation to gold produced in AM and SSM settings and purchased by NBE.
In order to enhance the integrity, accuracy, reliability and accessibility of contextual information, we recommend that the EEITI Secretariat in conjunction with MoM, MoF and ERCA gather and update (at least annually) contextual information including: the industry potential, the contribution to the economy, the strategy for the sector, relevant events and facts, current regulations and upcoming changes, amongst others. We also recommend that MoM develops procedures and systems to collect and control production data declared by companies, in a manner that ensures the reliability and completeness of data and enhances the capacity of MoM to administer royalties and other non-tax payments. 7.8 Unclear practical segregation of taxation and licensing powers
Some stakeholders show unclear understanding of the segregation of roles and powers of each of the federal Government and the regional States exist with regards to licensing and tax collection.
With regards to the tax collection, we found instances:
- where companies that have been licensed by MoM and that are paying royalties to the Regional Governments (i.e. National Mining Corporation Plc, East Cement Sc, Pioneer Cement Manufacturing Plc, Ethiopian Mineral Development Sc). We believe that this is not in accordance to the legal framework providing that royalties are due to be paid to the government level which issued the license; and
- where companies not owned by the state such (i.e. Erta Ale Salt Work Plc, Afdera Salt Producing Plc, Lucy Salt Producing Plc) and a company owned by federal government (i.e. Afar Salt Production Sc) are paying excise taxes to the regional government. We believe that this is not in accordance to the Constitution stating that federal government shall levy and collect excise taxes on enterprises it owns and that regional governments shall levy and collect excise taxes on enterprises it owns.
With regards to the licensing competence, we also found cases:
- where licenses were issued at by MoM while it should have been issued by the regional state (i.e. small scale mining license for gypsum in the Somali region for an Ethiopian operator Pioneer Cement Manufacturing Plc, large scale mining license for clay in Oromia region for an Ethiopian operator Bezalel Construction Material Manufacturing Plc); and
- where regional state authorities did not allow extractive company holding a license from the federal authority to perform (i.e. Capital Cement Milling and Packing PLC which is holding a mining license for pumice since 2012 and could not use it).
There also appears to be some confusion at federal level with regards to the authority which is authorised to collect dividends from State Owned Companies. During the reconciliation work, we found that one company made dividend payments to MoF while another SOC paid dividends to the Ethiopian Privatisation Agency (Ethiopian Mineral Development Sc), which is under the authority of the Ministry of Public Enterprises.
We recommend further a review of the instances presented above and of the tax administration by implementing a sharing information system between the Federal and Regional level. This may ensure the detection of any irregularities and may allow the enforcement of the law with regards to Federal and Regional tax payment. This is vital in order in order to improve controls over extractive industries revenues, transparency and traceability of income.

EEITI Report for the year ended 7 July 2014
Moore Stephens LLP | P a g e 72
7.9 Lack of a centralised reporting and payment system
Payments of taxes and other revenues of the country are made in a decentralised way. Government receipts can be collected by Federal Ministries and by Regional Government Entities. In accordance with the Constitution of the country, there are nine member states and in spite of the number of revenue collectors there is no system in place to centralise and follow these revenues. There is no sharing of information between the federal and regional levels of government regarding the taxes that have been collected at each level. So there is no information at the Federal level on amounts paid to the Regional governments and on licenses awarded by the Regional authorities. As a result, payments made by extractive companies at the Regional States were not available at federal level, which led to a limitation of the EITI scope due to the lack of a centralised system of information on extractive tax revenues.
In accordance with Requirement 4.2 (d) the multi-stakeholder group decides whether direct payments, within the scope of the agreed benefit streams, from companies to regional Government Entities are material. Where payments are considered to be material, the multi-stakeholder group is required to ensure that company payments to regional Government Entities and the receipt of these payments are disclosed and reconciled in the EITI Report. In order to assess the level of materiality of payments to Regional States, only reporting companies retained in the reconciliation scope declared unilaterally tax and non-tax payments made to the Regional Governments. This represents three percent of the total revenue from the extractive industries and since that payments made to regional governments have only be declared by extractive companies included in the reconciliation scope, we cannot ascertain that all revenues collected at the regional governments’ level will be captured in the EITI Report. As a result, the percentage of payments to Regional Governments is therefore deemed to be more than three percent of the total revenue from the extractive industries.
Additionally, information on the shares owned by the Government in companies operating in the extractive sectors should be centralised and updated. It was noted that details of shares owned by the Government (direct and indirect) in extractive companies were not available at the Ministry of Finance nor at MOM levels. Also information on infrastructure provisions and barter arrangements involving mineral products entered into force during the reconciliation period was not centralised at any level of the Government. In order to address the lack of such centralised information, reporting entities were required to report this information in there reporting templates.
In order to enable the completeness of the EITI scope for future reconciliation exercises, we recommend the implementation of a reporting system which allows the centralisation of information regarding all extractive revenues, arrangements and state ownership at the Federal level. Joint working and information sharing between the federal and the regional levels of government is a key factor to the establishment and smooth running of such system.
7.10 Weaknesses in the non-tax administration/ Non collection of payments
MoM is the authority responsible for monitoring and collecting royalty payments at federal level. Royalties are levied on the value of sales of minerals produced based to the rates defined in Proclamation No. 678/2010 for each category of minerals. We noted that during the reconciliation period covered by this report, MoM did not collect royalty payments from three companies which hold large scale active licenses and undertook mineral production activities (i.e. A Zeyneba Mining Plc, Adola Gold Mine Enterprise, National Cement Sc, and Daylight Applied Technologies Plc).
Similarly, we noted that the provisions of Mining Operations Proclamation No. 816 which entitle the Government to 5% free equity in large scale mining investments were not enforced as only one company made free equity payments during the EFY 2006.
The lack of enforcement of laws results in lost revenues for the Government, and can lead to tax evasion. Rigorous monitoring systems and coordination between the various authorities is essential to ensure an effective enforcement system.
We recommend that a systematic follow up of companies is made on a regular basis to ensure that all fees due are collected on a timely basis. MoM should also enhance its tax administration and collection capacity to effectively discharge its duties and maximise tax collection.

EEITI Report for the year ended 7 July 2014
Moore Stephens LLP | P a g e 73
We recommend that MoF sets up a system for administering free equity payments, whereby an official request is made to ERCA annually to provide details of companies which have reported schedule C mining payments and are therefore supposed to allocate free equity to the Ethiopian Government. MoF should make an initial assessment of the liability of each company and contact them proactively to request payment. Proper follow up should be made subsequently to ensure that due payments are collected from the taxpayers.
7.11 Weaknesses in the accounting records of MoM
During the reconciliation work, we noted a case of significant delay between the payment transfer date and the date of the issue of the receipt for a land rental payment. The company made a bank transfer in July 2014, while the related accounting entry into MoM’s accounting system was recorded in February 2015. So the receipt was issued seven (7) months after receiving the payment. This led to the non-declaration by MoM of that particular payment flow in the reconciliation period closed at 7 July 2014. Interviews with relevant MoM staff have revealed that bank reconciliation is not systematically prepared at the end of each month. The delays in preparing the bank reconciliation were due to the fact that bank credit notes are not collected regularly from the bank. All of these delays result in a non-updated accounting system of MoM. This weakness can affect the quality of the data submitted for EITI reconciliation and lead to significant discrepancies.
Good accounting practice is crucial to producing data that it is timely and reliable and to meet the reporting requirements of EITI. Accounting records need to be maintained on a daily basis and discrepancies arising from bank reconciliations should be resolved in a timely manner.
7.12 Capacity building of Government Entities, the EITI Secretariat and private entities
The EITI Ethiopia Secretariat is currently staffed with four employees. It would appear, given the current work load, that the structure of the EITI Secretariat should be improved by recruiting additional resources. With the implementation of all EITI Requirements in relation to scope, coverage and information reliability, the challenges and requirements will increase considerably and a stronger structure of the Secretariat is imperative.
With regards to the payment flows monitoring detailed in Recommendation 8, the Departments responsible for Finance at MoM and MoF as well as officers responsible for payment collection and monitoring need to be strengthened technically by attending specialist training courses on administrative areas.
We also recommend that the structure of the EITI Secretariat is reinforced with at least the following positions:
Legal officer: responsible for the follow-up of the legal environment surrounding the EITI process in Ethiopia. The role of the Legal Officer should include a follow up of tax regulations and the extractive sector legal framework;
Statistics and data collection officer: responsible of setting up and updating regularly the EITI database (cf. findings No. 8). The Officer should be the EITI Secretariat counterpart for the extractive companies and Government Entities for the data collection during the reconciliation exercise; and
Administration assistant: for record keeping and liaison.
With regards to recommendation 7.1 we strongly recommend that a training workshop is always held prior to the dispatching of reporting templates. During this workshop, the reporting template is to be presented to all reporting entities and instructions and guidance notes should always be provided for the preparation of the payment reports.
7.13 Communications enhancement
We note that data available on the MoM’s website is not systematically translated into English including Directives, events and news. Additionally, several documents necessary for the EITI process are also still in Amharic and have not been translated into English such as the Federal Auditor General report on Government Entities’ accounts and official reporting templates submitted by them.

EEITI Report for the year ended 7 July 2014
Moore Stephens LLP | P a g e 74
We recommend that the EITI Ethiopian website includes a portal in both languages in which all data and documents published are translated into English to enable better dissemination to wider audiences.

EEITI Report for the year ended 7 July 2014
Moore Stephens LLP | P a g e 75
ANNEXES

EEITI Report for the year ended 7 July 2014
Moore Stephens LLP | P a g e 76
Annex 1: Employment figures in the reconciled companies
Companies
Average number of
direct domestic
employees (Local)
Average number of
direct domestic
employees (Non local)
Average number of
direct foreign
employees (Expatriates)
TOTAL
Africa Oil Ethiopia B.V 10 2 12
Tullow Ethiopia B.V. 20
3 23
POLY-GCL Petroleum Investments Ltd Ethiopian Branch 22 64 86
SouthWest Energy (HK) Ltd 98
7 105
Falcon Petroleum Ltd 0 1 1 2
NewAge Ethiopia Ltd 12
1 13
MIDROC Gold Mine Plc 1,353 35 1,388
Ethiopian Mineral Development Sc 909
5 914
Abijata-Shalla Soda Ash Sc 358 31 389
Pioneer Cement Manufacturing Plc 350
50 400
Afar Salt Production Sc 20 49 0 69
Inchine Bedrock Cement Plc 230
28 258
East Cement Sc 381 0 381
Erta Ale Salt Work Plc 120
0 120
Afdera Salt Producing Plc 19 0 19
Lucy Salt Producing Plc 0
30 30
ETNO Mining Plc NC NC NC 0
Target Industries Plc 25
25
Sammakka Stones Plc 30 5 10 45
National Mining Corporation Plc 288
0 288
Bezalel Construction Material Manufacturing Plc 100 20 2 122
China Long Hoa Milla Construction Materials Plc NC NC NC 0
A Zeyneba Mining Plc 45 5 50
Derba Midroc Cement Plc 933
0 933
Adola Gold Mine Enterprise 20 183 0 203
CIC - Mugher Cement Factory 1,478
1,478
Messebo Cement Factory Plc 1,747 30 1,777
National Cement Sc 1,176 11 31 1,218
JAM Industrial Plc 35 0 35
Nurit General Business Plc 34
0 34
Hua Yi Cement Plc NC NC 0
Bona Ethio Indian Marble Mining Factory Plc 4
0 4
Daylight Applied Technologies Plc 4 73 0 77
Huang shan cement plc NC
NC 0
Ethiopian Hansom International Glass Plc 20 20 18 58
9,841 393 322 10,556
NC: Not communicated
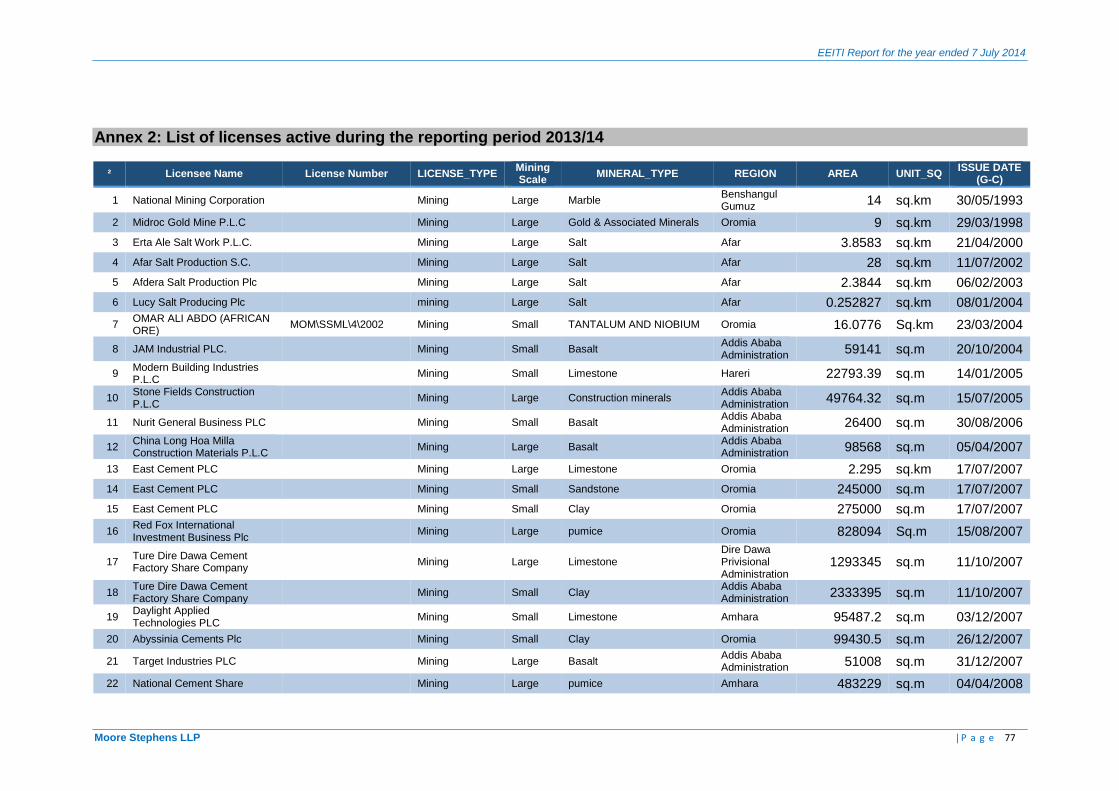
EEITI Report for the year ended 7 July 2014
Moore Stephens LLP | P a g e 77
Annex 2: List of licenses active during the reporting period 2013/14
² Licensee Name License Number LICENSE_TYPE Mining Scale
MINERAL_TYPE REGION AREA UNIT_SQ ISSUE DATE
(G-C)
1 National Mining Corporation
Mining Large Marble Benshangul Gumuz
14 sq.km 30/05/1993
2 Midroc Gold Mine P.L.C Mining Large Gold & Associated Minerals Oromia 9 sq.km 29/03/1998
3 Erta Ale Salt Work P.L.C.
Mining Large Salt Afar 3.8583 sq.km 21/04/2000
4 Afar Salt Production S.C. Mining Large Salt Afar 28 sq.km 11/07/2002
5 Afdera Salt Production Plc
Mining Large Salt Afar 2.3844 sq.km 06/02/2003
6 Lucy Salt Producing Plc mining Large Salt Afar 0.252827 sq.km 08/01/2004
7 OMAR ALI ABDO (AFRICAN ORE)
MOM\SSML\4\2002 Mining Small TANTALUM AND NIOBIUM Oromia 16.0776 Sq.km 23/03/2004
8 JAM Industrial PLC. Mining Small Basalt Addis Ababa Administration
59141 sq.m 20/10/2004
9 Modern Building Industries P.L.C
Mining Small Limestone Hareri 22793.39 sq.m 14/01/2005
10 Stone Fields Construction P.L.C
Mining Large Construction minerals Addis Ababa Administration
49764.32 sq.m 15/07/2005
11 Nurit General Business PLC
Mining Small Basalt Addis Ababa Administration
26400 sq.m 30/08/2006
12 China Long Hoa Milla Construction Materials P.L.C
Mining Large Basalt Addis Ababa Administration
98568 sq.m 05/04/2007
13 East Cement PLC
Mining Large Limestone Oromia 2.295 sq.km 17/07/2007
14 East Cement PLC Mining Small Sandstone Oromia 245000 sq.m 17/07/2007
15 East Cement PLC
Mining Small Clay Oromia 275000 sq.m 17/07/2007
16 Red Fox International Investment Business Plc
Mining Large pumice Oromia 828094 Sq.m 15/08/2007
17 Ture Dire Dawa Cement Factory Share Company
Mining Large Limestone Dire Dawa Privisional Administration
1293345 sq.m 11/10/2007
18 Ture Dire Dawa Cement Factory Share Company
Mining Small Clay Addis Ababa Administration
2333395 sq.m 11/10/2007
19 Daylight Applied Technologies PLC
Mining Small Limestone Amhara 95487.2 sq.m 03/12/2007
20 Abyssinia Cements Plc Mining Small Clay Oromia 99430.5 sq.m 26/12/2007
21 Target Industries PLC
Mining Large Basalt Addis Ababa Administration 51008 sq.m 31/12/2007
22 National Cement Share Mining Large pumice Amhara 483229 sq.m 04/04/2008
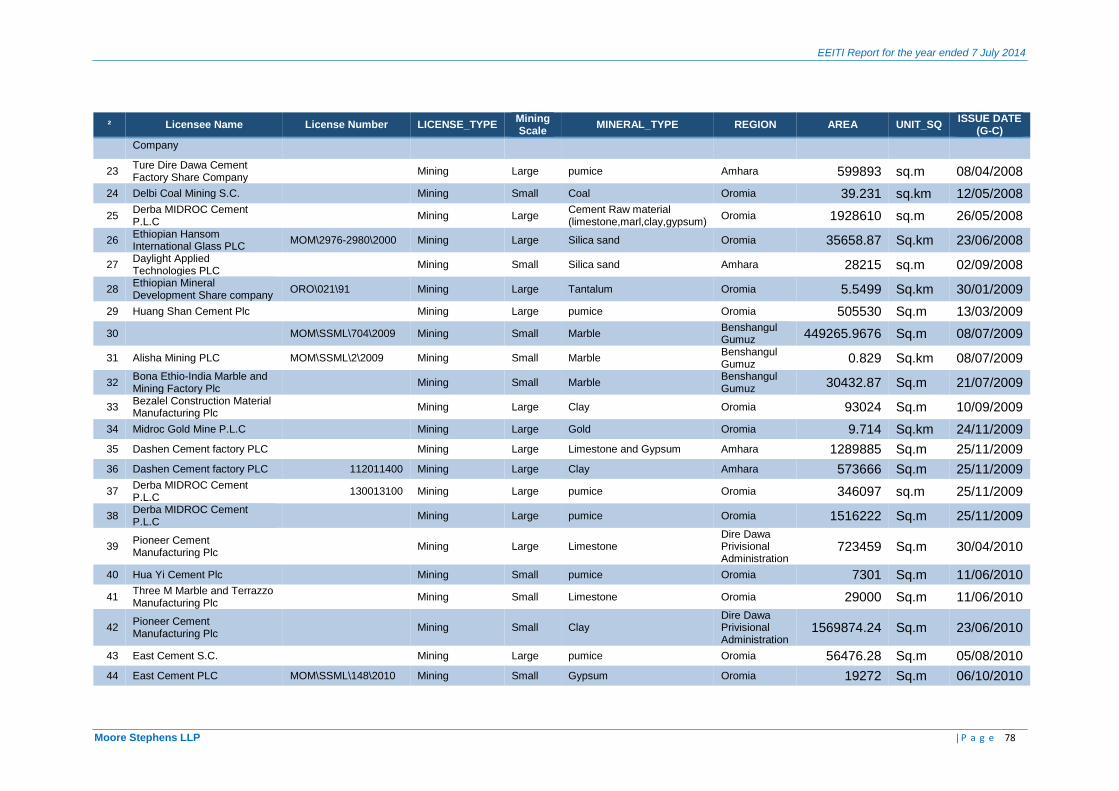
EEITI Report for the year ended 7 July 2014
Moore Stephens LLP | P a g e 78
² Licensee Name License Number LICENSE_TYPE Mining Scale
MINERAL_TYPE REGION AREA UNIT_SQ ISSUE DATE
(G-C)
Company
23 Ture Dire Dawa Cement Factory Share Company
Mining Large pumice Amhara 599893 sq.m 08/04/2008
24 Delbi Coal Mining S.C. Mining Small Coal Oromia 39.231 sq.km 12/05/2008
25 Derba MIDROC Cement P.L.C
Mining Large Cement Raw material (limestone,marl,clay,gypsum)
Oromia 1928610 sq.m 26/05/2008
26 Ethiopian Hansom International Glass PLC
MOM\2976-2980\2000 Mining Large Silica sand Oromia 35658.87 Sq.km 23/06/2008
27 Daylight Applied Technologies PLC
Mining Small Silica sand Amhara 28215 sq.m 02/09/2008
28 Ethiopian Mineral Development Share company
ORO\021\91 Mining Large Tantalum Oromia 5.5499 Sq.km 30/01/2009
29 Huang Shan Cement Plc
Mining Large pumice Oromia 505530 Sq.m 13/03/2009
30 MOM\SSML\704\2009 Mining Small Marble Benshangul Gumuz
449265.9676 Sq.m 08/07/2009
31 Alisha Mining PLC MOM\SSML\2\2009 Mining Small Marble Benshangul Gumuz
0.829 Sq.km 08/07/2009
32 Bona Ethio-India Marble and Mining Factory Plc
Mining Small Marble Benshangul Gumuz
30432.87 Sq.m 21/07/2009
33 Bezalel Construction Material Manufacturing Plc
Mining Large Clay Oromia 93024 Sq.m 10/09/2009
34 Midroc Gold Mine P.L.C Mining Large Gold Oromia 9.714 Sq.km 24/11/2009
35 Dashen Cement factory PLC
Mining Large Limestone and Gypsum Amhara 1289885 Sq.m 25/11/2009
36 Dashen Cement factory PLC 112011400 Mining Large Clay Amhara 573666 Sq.m 25/11/2009
37 Derba MIDROC Cement P.L.C
130013100 Mining Large pumice Oromia 346097 sq.m 25/11/2009
38 Derba MIDROC Cement P.L.C
Mining Large pumice Oromia 1516222 Sq.m 25/11/2009
39 Pioneer Cement Manufacturing Plc
Mining Large Limestone Dire Dawa Privisional Administration
723459 Sq.m 30/04/2010
40 Hua Yi Cement Plc Mining Small pumice Oromia 7301 Sq.m 11/06/2010
41 Three M Marble and Terrazzo Manufacturing Plc
Mining Small Limestone Oromia 29000 Sq.m 11/06/2010
42 Pioneer Cement Manufacturing Plc
Mining Small Clay Dire Dawa Privisional Administration
1569874.24 Sq.m 23/06/2010
43 East Cement S.C.
Mining Large pumice Oromia 56476.28 Sq.m 05/08/2010
44 East Cement PLC MOM\SSML\148\2010 Mining Small Gypsum Oromia 19272 Sq.m 06/10/2010

EEITI Report for the year ended 7 July 2014
Moore Stephens LLP | P a g e 79
² Licensee Name License Number LICENSE_TYPE Mining Scale
MINERAL_TYPE REGION AREA UNIT_SQ ISSUE DATE
(G-C)
45 A Zeyneba Mining plc MOM\SSML\701\2011 Mining Small Marble Benshangul Gumuz
37437.6548 Sq.m 14/10/2010
46 C.H.CLINKER MANUFACTURER PLC
MOM\LSML\311\2010 Mining Large Limestone Oromia 902972.68 Sq.m 09/11/2010
47 Pioneer Cement Manufacturing Plc
MOM\SSML\504\2010 Mining Small Gypsum Somali 740000 Sq.m 14/07/2011
48 Inchini Bedrock Cement plc MOM\LSML\54\2011 Mining Large Limestone Oromia 447794.44 Sq.km 01/08/2011
49 Abijata Soda Ash S.C MOM\LSML\163\2011 Mining Large Soda Ash Oromia 28.5896 Sq.km 16/09/2011
50 Derba MIDROC Cement P.L.C
MOM\LSML\71\2011 Mining Large Basalt Oromia 391400 Sq.m 23/01/2012
51 Derba MIDROC Cement P.L.C
MOM\SSML\73\2011 Mining Small Gypsum Oromia 389900 Sq.m 23/01/2012
52 Derba Lime and Chemicals PLC
MOM\LSML\72\2011 Mining Large Limestone Oromia 622724.9901 Sq.m 23/01/2012
53 Capital Cement Milling and Packing PLC
MOM\LSML\57\2011 Mining Large pumice Oromia 476223 Sq.m 30/01/2012
54 Sammakka Stones Plc MOM\LSML\657\2011 Mining Large Marble Benshangul Gumuz
1020000 Sq.m 30/01/2012
55 F.D.R.E Metals Enginering Corporation
MOM\LSML\86\2012 Mining Large Coal Oromia 139.3046 Sq.km 20/04/2012
56 Ezana Mining Developmrnt PLC
MOM\LSML\682\2011 Mining Large Gold Tigray 51200 Sq.m 27/12/2012
57 Adola Gold Mining Enterprise ORO\117\95 Mining Small Gold Oromia 38.89 Sq.km 16/02/2013
58 Sourish Marbles PLC MOM\LSML\230\2013 Mining Large Marble Benshangul Gumuz
277118.99 Sq.m 30/05/2013
59 Famu Industrial plc MOM\LSML\184\2010 Mining Large Gypsum Oromia 1.942 Sq.km 31/07/2013
60 Dangote Industries (Ethiopia) Plc
MOM\LSML\125\2013 Mining Large Limestone Oromia 3.7549 Sq.km 06/09/2013
61 Allana Potash Afar PLC MOM\LSML\224\2013 Mining Large Potash Afar 310.1953 Sq.km 08/10/2013
62 North Holdings Investment Inc MOM\LSML\208|2011 Mining Large Clay Amhara 1.37 Sq.km 26/12/2013
63 North Holdings Investment Inc MOM\LSML\207|2011 Mining Large Gypsum Amhara 749877 Sq.m 26/12/2013
64 North Holdings Investment Inc MOM\LSML\206|2011 Mining Large Limestone Amhara 2.45137 Sq.km 26/12/2013
65 Dangote Industries (Ethiopia) Plc
MOM\LSML\1\2013 Mining Large Clay Oromia 2.6695 Sq.km 24/04/2014
66 East Cement S.C. MOM\SSML\130\2013 Mining Small Silica sand Oromia 0.1386 Sq.km 24/04/2014
67 Habesha Cement Share Company
MOM\LSML\301\2013 Mining Large Clay Oromia 0.4022 Sq.km 19/05/2014
68 Habesha Cement Share Company
MOM\LSML\72\2013 Mining Large Limestone Oromia 0.4938 Sq.km 19/05/2014

EEITI Report for the year ended 7 July 2014
Moore Stephens LLP | P a g e 80
² Licensee Name License Number LICENSE_TYPE Mining Scale
MINERAL_TYPE REGION AREA UNIT_SQ ISSUE DATE
(G-C)
69 Habesha Cement Share Company
MOM\SSML\17\2013 Mining Small Gypsum Oromia 0.0834 Sq.km 19/05/2014
70 Habesha Cement Share Company
MOM\SSLM\20\2013 Mining Small Sand Stone Oromia 0.1521 Sq.km 19/05/2014
71 Midroc Gold Mine P.L.C
Exploration - Gold & Associated Minerals Oromia 17 sq.km 29/03/1998
72 KEFI Minerals (Ethiopia) Ltd MOM\EL\058-084\1996 Exploration - Gold & Platinum-Group Metals
Oromia 277 Sq.km 29/06/2004
73 Midroc Gold Mine P.L.C MOM\3-25\97 Exploration - Precious, Base & Rare Metals
Oromia 72.567 sq.km 04/03/2005
74 KEFI Minerals (Ethiopia) Ltd MOM\EL\127-128\97 Exploration - Gold & Platinum-Group Metals
Oromia 11 Sq.km 27/05/2005
75 Abyssinia Cements Plc
Exploration - Coal Oromia 20.535 sq.km 30/06/2006
76 MGM Gold Mines PLC Exploration - Gold Somali 90.265 Sq.km 14/11/2006
77 BULTI TESEMA MOM\EL\381\1999 Exploration - Gold & Associated Minerals Benshangul Gumuz and Oromia
13.52 Sq.km 23/11/2006
78 Rayan Investiment PLC Exploration - Limestone, Gypsum, Sandstone & Clay
Oromia 37.97 sq.km 24/11/2006
79 KEFI Minerals (Ethiopia) Ltd MOM\EL\032-045\1999 Exploration - Gold & Platinum-Group Metals
Oromia 274.77 Sq.km 20/12/2006
80 Harvest Mining P.L.C MOM\326-354\99 Exploration - Gold & Base Metals Tigray 521.1667 sq.km 11/01/2007
81 Benzu Gold Mining(Ethiopia)Plc
056-319/99(MOM\411\2011)
Exploration - Gold & Base Metals Benshangul Gumuz
4810.0828 Sq.km 25/01/2007
82 Tigray Resources Incorporated PLC
MOM\056-319\99 Exploration - Precious and Base Metals Tigray 348.4776 Sq.km 25/01/2007
83 Rayan Investiment PLC MOM\EL\326-331\2001 Exploration - Gold & Base Metals Benshangul Gumuz
170 Sq.Km 22/06/2007
84 Rayan Investiment PLC Exploration - Limestone, Clay and Gypsum
Dire Dawa Privisional Administration
171.0109 sq.km 03/08/2007
85 Stella Trading and Industry PLC
Exploration - Precious and Base Metals Gambella and SNNP
684.5 sq.km 23/08/2007
86 Rayan Investiment PLC MOM\EL\251\2007 Exploration - Gold & Base Metals Benshangul Gumuz
Sq.km 05/09/2007
87 Tigray Resources Incorporated PLC
MOM\0138-0182\2000 Exploration - Precious and Base Metals Tigray 274.126 Sq.m 14/10/2007
88 Yara Dallol B.V. MOM\0130-0134\2000 Exploration - Potash Afar 70 sq.km 19/10/2007
89 Ezana Mining Developmrnt PLC
TIG\EL\344\2008 Exploration - Gold & Base Metals Tigray 295.1355 Sq.km 24/01/2008
90 Ezana Mining Developmrnt PLC
TIG\EL\343\2008 Exploration - Gold & Base Metals Tigray 222.4671 Sq.km 24/01/2008

EEITI Report for the year ended 7 July 2014
Moore Stephens LLP | P a g e 81
² Licensee Name License Number LICENSE_TYPE Mining Scale
MINERAL_TYPE REGION AREA UNIT_SQ ISSUE DATE
(G-C)
91 Ezana Mining Developmrnt PLC
TIG\EL\342\2008 Exploration - Gold & Base Metals Tigray 134.1342 Sq.km 24/01/2008
92 Ezana Mining Developmrnt PLC
TIG\EL\371\2008 Exploration - Gold And Base Metals Tigray 120.146 Sq.km 24/01/2008
93 EL Mining PLC MOM\0320-0384\2000 Exploration - Gold and Associated Minerals
Oromia 1286 sq.km 18/02/2008
94 Rift Valley Gemstones Import & Export
ORO/486/2000 Exploration - Gold, Tantalum, Colombite & Lead & Base Metals
Oromia 38.07 Sq.km 27/03/2008
95 MYK Cement Industries PTE LTD (Ethiopian Branch)
Exploration - Limestone, gypsum , sandstone and marl
Oromia 70 sq.km 08/05/2008
96 Nejib Abba Biyya ORO/496/2008 Exploration - Gold & Base Metals Oromia 1441.83 Sq.km 09/05/2008
97 Nejib Abba Biyya ORO/497/2008 Exploration - Gold And Base Metals Oromia 770.64 Sq.km 09/05/2008
98 Ethiopian Mineral Development Share company
MOM\EL\313\2009 (old Lic.No.498/200)
Exploration - Copper & Related Minerals Oromia 128 Sq.km 09/05/2008
99 Metico Mining Plc
Exploration - Gold & Base Metals Benshangul Gumuz and Oromia
303.6218 Sq.km 12/05/2008
100 KRIPTO Mining and Chemicals PLC
2996-3000/2000 Exploration - Coal Oromia 84.88 sq.km 17/07/2008
101 KRIPTO Mining and Chemicals PLC
MOM\3131-3136\2000 Exploration - Gold, Base Metals and Chromite
Benshangul Gumuz
105.294 sq.km 20/08/2008
102 Circum Minerals Potash Ltd MOM\3137-3150\2000 Exploration - Potash Afar 324.6668 sq.km 21/08/2008
103 Ascom Mining Ethiopia Plc MOM\387-423\99 Exploration - Gold and Base Metals Benshangul Gumuz
731 sq.km 07/11/2008
104 Ezana Mining Developmrnt PLC
TIG\EL\362\2008 Exploration - Gold & Base Metals Tigray 1186.9947 Sq.km 18/12/2008
105 Harvest Mining P.L.C MOM\0246-0250\2001 Exploration - Precious & Base Metals Tigray 84.086 sq.km 19/12/2008
106 Rayan Investiment PLC Exploration - Gypsum Somali 28.42886 sq.km 22/12/2008
107 Rayan Investiment PLC MOM\298-317\2001 Exploration - coal Oromia 380 sq.km 23/12/2008
108 Nelvo International Minerals and Metals PLC
MOM\0319-0325\2001 Exploration - Limestone and Gypsum Oromia 123.21 sq.km 29/12/2008
109 Rayan Investiment PLC
Exploration - pumice Oromia 29 Sq.km 05/01/2009
110 Rayan Investiment PLC Exploration - Gold, Base Metals, Granite and Marble
Benshangul Gumuz
116 sq.km 06/01/2009
111 YGE Mining Plc ORO\EL\465\2009 Exploration - Tantalum Oromia
29/01/2009
112 Rayan Investiment PLC Exploration - Limestone and Clay Oromia 25.83 Sq.km 02/02/2009
113 YGE Mining Plc MOM\EL\66\2009 Exploration - Tantalum Oromia 20 Sq.m 06/02/2009
114 Habtamu Nemara ORO\570\2001 Exploration - Gold and Related Minerals Oromia & Beneshangul 140 Sq.km 13/02/2009

EEITI Report for the year ended 7 July 2014
Moore Stephens LLP | P a g e 82
² Licensee Name License Number LICENSE_TYPE Mining Scale
MINERAL_TYPE REGION AREA UNIT_SQ ISSUE DATE
(G-C)
Gumuz
115 C.G.C Overseas Construction Ethiopia
Exploration - Precious & Rare Metals Oromia 106.9226 Sq.km 18/02/2009
116 Red Fox Mining Plc 0358-0359/2001 Exploration - Gold and Associated Minerals
Oromia 28.6 Sq.km 04/04/2009
117 Rayan Investiment PLC
Exploration - Clay Oromia 4.89 Sq.km 19/06/2009
118 C.H.CLINKER MANUFACTURER PLC
Exploration - Limestone Oromia 23.36 Sq.km 01/07/2009
119 Rayan Investiment PLC
Exploration - Clay Dire Dawa Privisional Administration
9.13 Sq.km 03/07/2009
120 Loz Bez Mining Plc MOM\EL\130\2009 Exploration - Gold & Base Metals Tigray 967 Sq.km 08/07/2009
121 RUSSGOLD-Wuneya MINING PLC
ORO\EL\356\2010 Exploration - Gold, Platinum and Base metals
Oromia 201.62 Sq.km 24/07/2009
122 Sammakka Stones Plc Exploration - Marble Benshangul Gumuz
10.45 Sq.km 31/07/2009
123 Teranter General Business (TGB) PLC
ORO\EL\355\2009 Exploration - Precious and Base Metals Oromia 81 Sq.km 19/08/2009
124 RUSSGOLD-Wuney A MINING PLC
Exploration - Gold, platinum & Base metals
Oromia 262 Sq.km 23/10/2009
125 Stratex East Africa LTD MOM\EL\4326\2009 Exploration - Gold, siliver and Base metals Afar 2174.288 Sq.km 13/11/2009
126 Reykjavik Geothermal Consulting Co.
0132-0966/2002 Exploration - Geothermal Oromia and SNNP
16695.57 Sq.km 11/12/2009
127 C.H.CLINKER MANUFACTURER PLC
1004100500 Exploration - Clay Oromia 6.0795 Sq.km 01/01/2010
128 Sammakka Stones Plc Exploration - Marble Benshangul Gumuz
9.037 Sq.km 02/02/2010
129 Nelvo International Minerals and Metals PLC
Exploration - Gold And Base Metals Oromia 49.3594 Sq.km 17/02/2010
130 Access Capital Services S.C. AMH\EL\422\2010 Exploration - Iron Ore Amhara 233 Sq.km 03/03/2010
131 Donia Gonda Mineral Resources Corp. Ltd
MOM\EL\4359\2009 Exploration - Gold And Base Metals Benshangul Gumuz
756.961 Sq.km 19/03/2010
132 Sheba Exploration Ltd. MOM\EL\73\2010 (Old 1597-1602\2002)
Exploration - Gold And Base Metals Tigray 40.8532 Sq.km 19/03/2010
133 Inchini Bedrock Cement Plc
Exploration - Limestone Oromia 7.0683 Sq.km 20/04/2010
134 Towchester Investment Company Ltd.
MOM\EL\80\2010 Exploration - Gold & Base Metals Benshangul Gumuz
1342.7715 Sq.km 06/07/2010
135 Altau Resources Ltd
Exploration - Gold & related Minerals Benshangul Gumuz
917.8382 Sq.km 22/07/2010
136 BRANTHAM INVESTMENT LIMITED
(Old Lic. MOM\1879-1969)
Exploration - Gold & Base Metals Benshangul Gumuz 1804.4427 Sq.km 30/07/2010

EEITI Report for the year ended 7 July 2014
Moore Stephens LLP | P a g e 83
² Licensee Name License Number LICENSE_TYPE Mining Scale
MINERAL_TYPE REGION AREA UNIT_SQ ISSUE DATE
(G-C)
MOM\EL\81\2010
137 Anpex Refining and Petro Chemicals Plc
MOM\EL\4351\2009 Exploration - Coal Oromia and SNNP
44.42 Sq.km 24/08/2010
138 Stratex East Africa LTD MOM\EL\139\2010 Exploration - Precious and Base Metals Afar 1107.4353 Sq.km 14/09/2010
139 Birbir Mining Development Private Limited Company
ORO\EL\380\2010 Exploration - Gold & associated minerals Oromia 254 Sq.km 05/10/2010
140 Sol_Tem Mining PLC Exploration - Gold & Associated Minerals Benshangul Gumuz and Oromia
379.1783 Sq.km 14/10/2010
141 Midroc Gold Mine P.L.C MOM\EL\352\2010 Exploration - Base Metals, Gold, Iron and rare metals
Amhara and Benshangul Gumuz
127.4234 Sq.km 14/10/2010
142 KEFI Minerals (Ethiopia) Ltd MOM\EL\372\2010 Exploration - Gold & Platinum-Group Metals
Oromia 2.889 Sq.km 14/10/2010
143 Gobso Dillo mining plc 655/2003 Exploration - Gemstone Oromia 114.08 Sq.km 26/10/2010
144 ETNO Mining plc MOM\EL|262\2002 Exploration - Gold & Associated Minerals SNNP 538.6273 Sq.km 01/11/2010
145 Soressa general trading PLC MOM\EL|439\2010 Exploration - Coal Amhara 24 Sq.km 17/12/2010
146 Altau Resources Ltd MOM\EL\227\2010 Exploration - Gold and related Minerals Afar and Tigray
1043.6197 Sq.km 27/01/2011
147 Stratex East Africa LTD MOM\EL\509\2010 Exploration - Precious, Base Metals Afar 299.8394 Sq.km 23/02/2011
148 GP Resource Mining PLC MOM\EL\16\2011 Exploration - Gold & Related Minerals Benshangul Gumuz
412.2235 Sq.km 06/04/2011
149 Nubian Gold Exploration Ltd MOM\EL\55\2011 Exploration - Gold & Related Minerals Benshangul Gumuz
1953.5837 Sq.km 29/04/2011
150 Managem PLC MOM\EL\3053-3082\2000
Exploration - Precious, Base Metals Benshangul Gumuz
578.506 Sq.km 13/06/2011
151 Kinfe Tsegaye Beyene MOM\EL\52\2011 Exploration - Placer Gold Tigray 68.2638 Sq.km 14/06/2011
152 ELTAI Iron Mining PLC ORO\EL\388\2010 Exploration - Iron Ore Oromia 521.3494 Sq.km 16/06/2011
153 MRD Australia Mining and Construction Plc
MOM\EL\496\2010 Exploration - Silica sand Oromia 0.4382 Sq.km 11/07/2011
154 MRD Australia Mining and Construction Plc
MOM\EL\497\2010 Exploration - Limestone Oromia 1.673 Sq.km 11/07/2011
155 MRD Australia Mining and Construction Plc
MOM\EL\498\2010 Exploration - pumice Oromia 0.4417 Sq.km 11/07/2011
156 Orecorp Minerals Plc MOM\EL\243\2011 Exploration - Gold ,silver,copper,Lead,Zinc and Nickel
Oromia 230.9723 Sq.km 05/08/2011
157 Rift Valley Resources Limited MOM\EL\162\2011 Exploration - Gold and Associated Minerals
Oromia 945.489 Sq.km 10/08/2011

EEITI Report for the year ended 7 July 2014
Moore Stephens LLP | P a g e 84
² Licensee Name License Number LICENSE_TYPE Mining Scale
MINERAL_TYPE REGION AREA UNIT_SQ ISSUE DATE
(G-C)
158 Orecorp Minerals Plc MOM\EL\244\2011 Exploration - Gold, silver,copper,Lead,Zinc and nickel, Cr and Platinum
Oromia 305.3928 Sq.km 25/08/2011
159 Ato Dereje Bekele Gemeda MOM\EL\490\2011 Exploration - Gold & Base Metals Benshangul Gumuz and Oromia
150.4 Sq.km 07/09/2011
160
Henan Zhongzhou Institute of Geological and Mining Engineering Reconnaissance(Ethiopian Branch)
MOM\EL\98\2011 Exploration - Tantalum-Niobium Somali 321.3524 Sq.km 30/09/2011
161 Top Rock Mining PLC MOM\EL\497\2011 Exploration - Gold & Base Metals Tigray 1111.86 Sq.km 17/10/2011
162 Dr.Theodros Woudneh MOM\EL\453\2011 Exploration - Gold & Base Metals Benshangul Gumuz and Oromia
127.0287 Sq.km 31/10/2011
163 Dawit Gold Mining Enterprise MOM\EL\259\2011 Exploration - Gold & Base Metals Tigray 149.9611 Sq.km 30/01/2012
164 AARTI Steel Plc MOM\EL\447\2011 Exploration - Coal Oromia 240.5 Sq.km 13/03/2012
165 AARTI Steel Plc MOM\EL\448\2011 Exploration - Limestone Oromia 140.4521 Sq.km 13/03/2012
166 AARTI Steel Plc MOM\EL\450\2011 Exploration - Iron Oromia 45.7679 Sq.km 13/03/2012
167 Teranter General Bussiness (TGB) Plc
MOM\EL\442\2010 Exploration - Precious and Base Metals Oromia 269.06 Sq.km 16/03/2012
168 Lagalola Gold Mining Exploration PLC
MOM\EL\432\2011 Exploration - Gold & Associated Minerals Oromia and SNNP
29.5193 Sq.km 23/03/2012
169 Getachew Olani ORO\EL\290\2010 Exploration - Gold, Platinium and Base Metals
Oromia 19.2177 Sq.km 26/03/2012
170 Ascom Mining Ethiopia Plc MOM\EL\250\2011 Exploration - Gold And Base Metals Benshangul Gumuz and Oromia
1024.1746 Sq.km 26/03/2012
171 Henan Zhongzhou Inst/ of Geo. & Mine/Eng.Reco. (Eth. Branch)
MOM\EL\97\2011 Exploration - Gold Oromia 365.32 Sq.km 30/03/2012
172 Teferi Mesfin Teshome MOM\EL\687\2011 Exploration - Gold And Base Metals Tigray 684.5234 Sq.km 30/03/2012
173 Melos Engineering and Trading PLC
MOM|EL\261\2011 Exploration - Gold & Rare Earth Metals Oromia 116.7542 Sq.km 25/04/2012
174 Ezana Mining Developmrnt PLC
MOM\EL\185\2011 Exploration - Iron Ore Tigray 910 Sq.km 31/05/2012
175 Birla Corporation Cement Manufacturing PLC
MOM\EL\494\2011 Exploration - Coal Amhara 212 Sq.km 31/05/2012
176 GEOFIX Industrial & Construction Materials Production PLC
MOM\EL\14\2004 Exploration - Marble Benshangul Gumuz
14.64 Sq.km 12/07/2012

EEITI Report for the year ended 7 July 2014
Moore Stephens LLP | P a g e 85
² Licensee Name License Number LICENSE_TYPE Mining Scale
MINERAL_TYPE REGION AREA UNIT_SQ ISSUE DATE
(G-C)
177 Ezana Mining Developmrnt PLC
MOM\EL\170\2012 Exploration - Precious and Base Metals Tigray 1244.576 Sq.km 28/11/2012
178 Ezana Mining Developmrnt PLC
MOM\EL\608\2011 Exploration - Precious and Base Metals Tigray 133.7602 Sq.km 28/11/2012
179 PS MINING PLC MOM\EL\498\2011 Exploration - Gold & Base Metals Oromia 823.9084 Sq.km 10/12/2012
180 Reha Jemstone and Minerals Prospectors PLC
MOM\EL\151\2013 Exploration - Gemstone and Rare Earth Metal
Dire Dawa Privisional Administration
5.7381 Sq.km 25/02/2013
181 Raha Gemstone Minerals Prospectors PLC
MOM\EL\151\2013 Exploration - Rare Earth Minerals and Gemstones
Dire Dawa Privisional Administration
5.7381 Sq.km 25/02/2013
182 SEKOTA MINING PLC MOM\EL\57\2013 Exploration - Iron Ore Amhara 242 Sq.km 03/04/2013
183 YMG Gold Mining Pplc MOM\EL\92\2013 Exploration - Gold Oromia 0.27 Sq.km 29/06/2013
184 Producers' Cooperative ARTEL of Prospectors Novaya
MOM\EL\233\2011 Exploration - Primary Gold Oromia 48.678 Sq.km 11/07/2013
185 Nankai Mining PLC MOM\EL\82\2013 Exploration - Gold And Base Metals Oromia 273.3436 Sq.km 12/07/2013
186 Nankai Mining PLC MOM\EL\84\2013 Exploration - Gold And Base Metals Oromia 207.8925 Sq.km 12/07/2013
187 Nankai Mining PLC MOM\EL\83\2013 Exploration - Gold And Base Metals Oromia 138.4873 Sq.km 12/07/2013
188 Lemmi Amare Gebre MOM\EL\585\2011 Exploration - Gold & Base Metals Oromia 190.5046 Sq.km 01/11/2013
189 Mugher Cement Enterprise MOM\EL\129\2013 Exploration - Iron Ore Oromia 0.4143 Sq.km 29/11/2013
190 Turquois General Business Plc
MOM\EL\39\2011 Exploration - Gemstone Oromia 25.1886 Sq.km 20/12/2013
191 Web Gemstone Mining Plc MOM\EL\283\2013 Exploration - Gold & Base Metals Oromia 199.6809 Sq.km 30/12/2013
192 Wudnesh Minaleshewa MOM\EL\328\2011 Exploration - Gemstone and Rare Earth Metals
Oromia and SNNP
197.8256 Sq.km 30/12/2013
193 Belson Industrial Plc MOM\EL\304\2011 Exploration - Diatomite Oromia 2.9279 Sq.km 31/12/2013
194 Belson Industrial Plc MOM\EL\303\2011 Exploration - Dolomite Oromia 125121.8548 Sq.m 31/12/2013
195 Chochi Mining Plc MOM\EL\276\2013 Exploration - Gold Benshangul Gumuz and Oromia
187.5523 Sq.km 06/01/2014
196 MSP Steel Plc MOM\EL\\104\2013 Exploration - Magnetite-Illmenite, apatite & Associated Minerals
Benshangul Gumuz and Oromia
10.2436 Sq.km 21/01/2014
197 Managem PLC MOM\EL\158\2013 Exploration - Primary Gold and Base Metals
Benshangul Gumuz
176.1383 Sq.m 30/01/2014
198 Lucy Mining and Finding and Assessment Association PLC
MOM\EL\156\2013 Exploration - Quartz and Amethyst Tigray 4.7156 Sq.km 20/03/2014

EEITI Report for the year ended 7 July 2014
Moore Stephens LLP | P a g e 86
² Licensee Name License Number LICENSE_TYPE Mining Scale
MINERAL_TYPE REGION AREA UNIT_SQ ISSUE DATE
(G-C)
199 Janjam Industrial PLC MOM\EL\285\2013 Exploration - Gold & Base Metals Oromia 180.1361 Sq.km 20/03/2014
200 Aluvance PLC MOM\EL\663\2011 Exploration - Gold and Associated Minerals
Tigray 133.994 Sq.km 20/03/2014
201 EMD General Trading PLC MOM\El\651\2011 Exploration - Gold and Tantalum Oromia 9.1412 Sq.km 20/03/2014
202 Raj Mineral Exploration Service PLC
MOM\EL\256\2011 Exploration - Diatomite Oromia 4.2165 Sq.km 23/03/2014
203 Pazion Mining Plc MOM\EL\633\2011 Exploration - Primary Gold and Base Metals
Benshangul Gumuz
1260.8305 Sq.km 13/05/2014
204 Danest Mining PLC MOM\EL\76\2011 Exploration - Primery Gold and Base Metals
Oromia 307.8076 Sq.km 11/06/2014
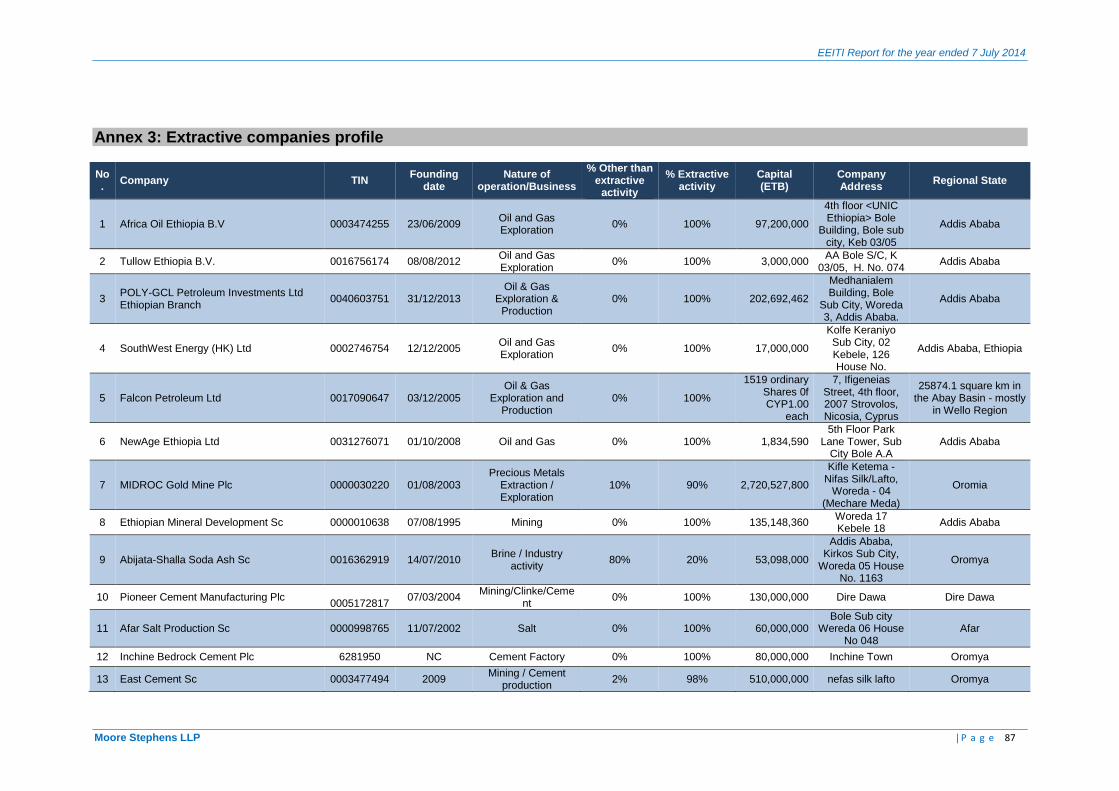
EEITI Report for the year ended 7 July 2014
Moore Stephens LLP | P a g e 87
Annex 3: Extractive companies profile
No.
Company TIN Founding
date Nature of
operation/Business
% Other than extractive
activity
% Extractive activity
Capital (ETB)
Company Address
Regional State
1 Africa Oil Ethiopia B.V 0003474255 23/06/2009 Oil and Gas Exploration
0% 100% 97,200,000
4th floor <UNIC Ethiopia> Bole
Building, Bole sub city, Keb 03/05
Addis Ababa
2 Tullow Ethiopia B.V. 0016756174 08/08/2012 Oil and Gas Exploration
0% 100% 3,000,000 AA Bole S/C, K
03/05, H. No. 074 Addis Ababa
3 POLY-GCL Petroleum Investments Ltd Ethiopian Branch
0040603751 31/12/2013 Oil & Gas
Exploration & Production
0% 100% 202,692,462
Medhanialem Building, Bole
Sub City, Woreda 3, Addis Ababa.
Addis Ababa
4 SouthWest Energy (HK) Ltd 0002746754 12/12/2005 Oil and Gas Exploration
0% 100% 17,000,000
Kolfe Keraniyo Sub City, 02 Kebele, 126 House No.
Addis Ababa, Ethiopia
5 Falcon Petroleum Ltd 0017090647 03/12/2005 Oil & Gas
Exploration and Production
0% 100%
1519 ordinary Shares 0f CYP1.00
each
7, Ifigeneias Street, 4th floor, 2007 Strovolos, Nicosia, Cyprus
25874.1 square km in the Abay Basin - mostly
in Wello Region
6 NewAge Ethiopia Ltd 0031276071 01/10/2008 Oil and Gas 0% 100% 1,834,590 5th Floor Park
Lane Tower, Sub City Bole A.A
Addis Ababa
7 MIDROC Gold Mine Plc 0000030220 01/08/2003 Precious Metals
Extraction / Exploration
10% 90% 2,720,527,800
Kifle Ketema - Nifas Silk/Lafto,
Woreda - 04 (Mechare Meda)
Oromia
8 Ethiopian Mineral Development Sc 0000010638 07/08/1995 Mining 0% 100% 135,148,360 Woreda 17 Kebele 18
Addis Ababa
9 Abijata-Shalla Soda Ash Sc 0016362919 14/07/2010 Brine / Industry
activity 80% 20% 53,098,000
Addis Ababa, Kirkos Sub City,
Woreda 05 House No. 1163
Oromya
10 Pioneer Cement Manufacturing Plc 0005172817
07/03/2004 Mining/Clinke/Ceme
nt 0% 100% 130,000,000 Dire Dawa Dire Dawa
11 Afar Salt Production Sc 0000998765 11/07/2002 Salt 0% 100% 60,000,000 Bole Sub city
Wereda 06 House No 048
Afar
12 Inchine Bedrock Cement Plc 6281950 NC Cement Factory 0% 100% 80,000,000 Inchine Town Oromya
13 East Cement Sc 0003477494 2009 Mining / Cement
production 2% 98% 510,000,000 nefas silk lafto Oromya

EEITI Report for the year ended 7 July 2014
Moore Stephens LLP | P a g e 88
No.
Company TIN Founding
date Nature of
operation/Business
% Other than extractive
activity
% Extractive activity
Capital (ETB)
Company Address
Regional State
14 Erta Ale Salt Work Plc 0000040314 01/04/2000 Mining 0% 100% 5,096,232 Ethiopia Addis Ababa
15 Afdera Salt Producing Plc 0000038433 16/03/1992 Extraction of Salt 0% 100% 6,000,000
Addis Ababa, Bole Sub City
Woreda 03 H.N 499
Addis Ababa
16 Lucy Salt Producing Plc 0000043699 07/11/2000 Salt 31% 69% 7,000,000 Ethiopia Addis Ababa
17 ETNO Mining Plc 0003510772 Not
Communicated
Not Communicated Not
Communicated
Not Communicate
d
Not Communicate
d
Not Communicated
Not Communicated
18 Target Industries Plc 0003756077 31/12/2007 Mining Not
Communicated
Not Communicate
d 10,000,000 Bole Addis Ababa
19 Sammakka Stones Plc 0006770153 29/04/2009 Mining 0% 100% 6,000,000
Addis Ababa, Bole Sub City ,
Sheger Building , 5th Floor, Room
No. 506 A, Kebele 03/05, Hose No.
2004/ 2005
Benishangul Gumuz
20 National Mining Corporation Plc 0000030090 01/03/1993 Mining 0% 100% 103,000,000
Kirkos K/Ketema Wereda 08. House NO
1163/201 Addis Ababa
Benshangul Gumze , Oromiya & Tigiray Regional States
21 Bezalel Construction Material Manufacturing Plc
0004920704 01/01/2009 Mining 0% 100% 15,000,000 Bole Sub City
house no 5379/09 Addis Ababa
22 China Long Hoa Milla Construction Materials Plc Not
Communicated
Not Communicated Not
Communicated
Not Communicate
d
Not Communicate
d
Not Communicated
Not Communicated
23 A Zeyneba Mining Plc 0016046161 13/10/2010 Marble Mining 0% 100% 23,314,000
A.A. Bole Subcity Kebele 03/05
Sheger Building H.No.501A
Assosa-Mendi
24 Derba Midroc Cement Plc 0002937443 15/02/2006 Cement Production 0% 100% 500,000,000 Addis Ababa
Kirkos Sub city Kebele 17/18
Addis Ababa
25 Adola Gold Mine Enterprise 0000044695 1934 E.C. Gold 0% 100% 63,754,820 Shakisso Oromia
26 CIC - Mugher Cement Factory 0000030088 1984 Manufacture of Non-
Metallic mineral products
0% 100% 266,726,953 Adaberga Oromia
27 Messebo Cement Factory Plc 0000047426 1999 Cement Production 0% 100% 3,993,846,914 Mekelle Tigray

EEITI Report for the year ended 7 July 2014
Moore Stephens LLP | P a g e 89
No.
Company TIN Founding
date Nature of
operation/Business
% Other than extractive
activity
% Extractive activity
Capital (ETB)
Company Address
Regional State
28 National Cement Sc 0002635431 2006 Cement Production 0% 100% 394,277,000 Dire
Dawa,Ethiopia Dire Dawa
Adminstration
29 JAM Industrial Plc 0002458007 20/10/2004 Quarry 5% 95% NC Ethiopia Addis Ababa
30 Nurit General Business Plc 0003228952 27/05/2007 Manufacture of non
metalic mineral producs N.E.C
0% 100% 10,000,000 A.A. sub city-Bole
wereda-12 Addis Ababa
31 Hua Yi Cement Plc 0005491295 Not
Communicated
Not Communicated Not
Communicated
Not Communicate
d
Not Communicate
d
Not Communicated
Not Communicated
32 Bona Ethio Indian Marble Mining Factory Plc
00004418719
21/07/2009 Mining 100% 0% 11,000,000
A.A Bole Subcity K-03/05
H.No.2004 &2005 Sheger Building 5th floor 501B
Addis Ababa
33 Daylight Applied Technologies Plc 0000034693 01/04/1994 Silica Sand and
Lime Stone mining for own consumption
0% 100% 457,082,995 Yeka K/K Woreda
13 Addis Ababa
34 Huang shan cement plc 0004861664 Not
Communicated
Not Communicated Not
Communicated
Not Communicate
d
Not Communicate
d
Not Communicated
Not Communicated
35 Ethiopian Hansom International Glass Plc 0000453720
6 01/06/2008 Mining / Sales 95% 5% 1,000,000 nefas sillk-laft Addis Ababa
Source: information provided by Extractive companies

EEITI Report for the year ended 7 July 2014
Moore Stephens LLP | P a g e 90
Annex 4: Beneficial ownership
N° Companies N° Name/Entity Level of
ownership Nationality of the
owner
Stock exchange quotations
(yes/no) Stock exchange
Owner (if the company's shares
are not quoted)
1 Africa Oil Ethiopia B.V 1 Africa Oil Corporation 50.00% Canada Yes TSE
2 Marathon Oil Corporation 50.00% United States Yes NYSE
2 Tullow Ethiopia B.V. 1 Tullow Oil PLC 100.00% UK Yes FTSE
3 POLY-GCL Petroleum Investments Ltd Ethiopian Branch
1 POLY GCL Petroleum Holding Ltd 100.00% BVI No No ZHU Gongshan
4 SouthWest Energy (HK) Ltd
1 SW Trustees Private Limited on behalf of SW Development Trust
29.19% Singapore No No NC
2 Persistency Private Equity Limited 14.85% BVI No No NC
3 Madalina Foundation 4.88% UK No No NC
4 VLTCM Ltd 4.51% Hong Kong No No NC
5 <5% holdings 46.57%
No No NC
5 Falcon Petroleum Ltd
1 Radhwan S Hadi 32.65% UK No No NC
2 Samuel L Mectalfe 32.65% UK No No NC
3 Hilsilk Limited 18.24% UK No No Andrew Shrager
4 Horizon Energy 16.46% UAE No No Rashed Al Suwaidi
6 NewAge Ethiopia Ltd 1 Newage Holdings Ltd 100.00% NC No No New Age African Global Energy Limited
7 MIDROC Gold Mine Plc
1 Ministry of Finance & Economic Development
2.00% Ethiopian No No
2 Shiek Mohammed Hussien Ali Alamoudi 80.00% Saudi Arabian No No
3 Mrs. Sophia Salah Al-Amoudi 18.00% Saudi Arabian No No
8 Ethiopian Mineral Development Sc 1 State Owned (State Government) 100.00% N/A N/A N/A N/A
9 Abijata-Shalla Soda Ash Sc
1 State Owned (Federal Government) 38.00% Ethiopian N/A N/A N/A
2 National Mining Corporation Plc. 31.07% Ethiopian No No
3 Seid Hussein ali 11.19% Ethiopian No No
4 Hassan H. Al-Amoudi 9.94% Ethiopian No No
5 Abdulah H. Al-Amoudi 9.94% Ethiopian No No
10 Pioneer Cement Manufacturing Plc 1 State Owned (Federal Government) 100.00% Ethiopian N/A N/A N/A
11 Afar Salt Production Sc
1 State Owned (Federal Government) 83.33% Ethiopian N/A N/A N/A
2 Ezana Mining Development Plc 3.98% Ethiopian NC NC NC
3 Saba Dimensional Stones Plc 11.67% Ethiopian NC NC NC
4 Guna Trading Plc 1.00% Ethiopian NC NC NC
5 Ato Tewodros Hagos 0.02% Ethiopian NC NC NC
12 Inchine Bedrock Cement Plc 1 Mr Jin Chao 57.00% Chaina NC NC NC

EEITI Report for the year ended 7 July 2014
Moore Stephens LLP | P a g e 91
N° Companies N° Name/Entity Level of
ownership Nationality of the
owner
Stock exchange quotations
(yes/no) Stock exchange
Owner (if the company's shares
are not quoted)
2 Mr Xiong Guowei 33.00% Chaina NC NC NC
3 Mr Dong Zhijun 10.00% Chaina NC NC NC
13 East Cement Sc
1 Mr. Lu Qiyuan 1.00% Chinese No No NC
2 Mr. Li Peihua 1.00% Chinese No No NC
3 Mr.Lu Qizhong 1.00% Chinese No No NC
4 China africa development fund 40.00% Chinese No No NC
5 jiangsu qiyuan Group Co.Ltd 57.00% Chinese No No NC
14 Erta Ale Salt Work Plc 1 Ato Tsegaye G/yessus 50.00% Ethiopian NC NC NC
2 Akaks Logistics PLc 50.00% Ethiopian NC NC NC
15 Afdera Salt Producing Plc
1 Dori Kebede 16.67% Ethiopian NC NC NC
2 Tsegaye T/Mariam 33.33% Ethiopian NC NC NC
3 Nazreth Tsegaye 16.67% Ethiopian NC NC NC
4 Haile Kebede 16.67% Ethiopian NC NC NC
5 Yodit Dori 16.67% Ethiopian NC NC NC
16 Lucy Salt Producing Plc 1 NC NC NC NC NC NC
17 ETNO Mining Plc 1 NC NC NC NC NC NC
18 Target Industries Plc 1 NC NC NC NC NC NC
19 Sammakka Stones Plc 1 Sriramoju Sambeswar Rao 50% India No No NC
2 Arigapudi Lakshmi Mani 50% India No No NC
20 National Mining Corporation Plc 1 Sheik Mohammed Hussen Ali Al Amoudi 70.00% Saudi Arabian NC NC NC
2 Hassen Hussen Ali Al Amoudi 30.00% Ethiopian NC NC NC
21 Bezalel Construction Material Manufacturing Plc
1 Hanna Tilahun 50.00% Ethiopian No NC NC
2 Messele Haile 50.00% Ethiopian No NC NC
22 China Long Hoa Milla Construction Materials Plc
1 NC NC NC NC NC NC
23 A Zeyneba Mining Plc
1 Ato Ali Abdulwehab Ali 37.00% Ethiopian Yes 8654
2 W/ro Zeyinba Abdulkadir Fato 12.88% Ethiopian Yes 3003
3 Mr.Sidarmull Chordia 3.60% India Yes 840
4 Asia International FZC 41.59% India Yes 9697
5 Jaikh Fabricast Engineering Pvt.Ltd 4.80% India Yes 1120
24 Derba Midroc Cement Plc 1 Sheh Mohamed Hussein Alamoudi 80.00% Saudi Arabian NC NC NC
2 Mrs Sofia Salah Alamoudi 20.00% Saudi Arabian NC NC NC
25 Adola Gold Mine Enterprise NC NC NC NC NC NC
26 CIC - Mugher Cement Factory
NC NC NC NC NC NC
27 Messebo Cement Factory Plc Endowment Fund for the Rehabilitation of Tigray (EFFORT)
100.00% Ethiopian NC NC NC

EEITI Report for the year ended 7 July 2014
Moore Stephens LLP | P a g e 92
N° Companies N° Name/Entity Level of
ownership Nationality of the
owner
Stock exchange quotations
(yes/no) Stock exchange
Owner (if the company's shares
are not quoted)
28 National Cement Sc
1 East Afirican Mininig Corpo. PLC 85.15% Ethiopian No NC NC
2 Mekonen Legesse 0.77% Ethiopian NC NC NC
3 Bzuayehu Tadelle 0.74% Ethiopian NC NC NC
4 East Afirican Group 0.20% Ethiopian No NC NC
5 Bizenu Investement 0.10% Ethiopian No NC NC
6 SGI Ethiopia Cement LtD 8.89% Britsh vergin Island No NC NC
7 EGTF Cement LTD 3.94% Britsh vergin Island No NC NC
8 Chanyalew Yilma 0.10% Ethiopian NC NC NC
9 Basso Assefa 0.10% Ethiopian NC NC NC
29 JAM Industrial Plc 1 Shek / Jemal Al Kasimm NC NC NC NC NC
2 Haji Mukhtar Khedir NC NC NC NC NC
30 Nurit General Business Plc 1 Khalid Ahmed Adus 40.00% Ethiopian No NC NC
2 Bassam Mahmoud Ibrahim 60.00% Jordanian No NC NC
31 Hua Yi Cement Plc NC NC NC NC NC NC
32 Bona Ethio Indian Marble Mining Factory Plc
1 Ato Ali Abuilwuhab Ali 60.00% Ethiopian Yes 6600
2 SDR International 40.00% Indian Yes 4400
33 Daylight Applied Technologies Plc 1 Mohammed Hussien AL Amudi 70% Saudi Araabia NC NC NC
2 Seid Hussien Ali 30% Ethiopian NC NC NC
34 Huang shan cement plc 1 NC NC NC NC NC NC
35 Ethiopian Hansom International Glass Plc
1 State Owned (Federal Government) 5.00% Ethiopian N/A N/A N/A
2 CGC Overseas Construction Lompany Limited
57.00% NC No NC NC
3 China-African Development Fund Company Limited
38.00% NC No NC NC
NA: Not Applicable
NC: Not communicated
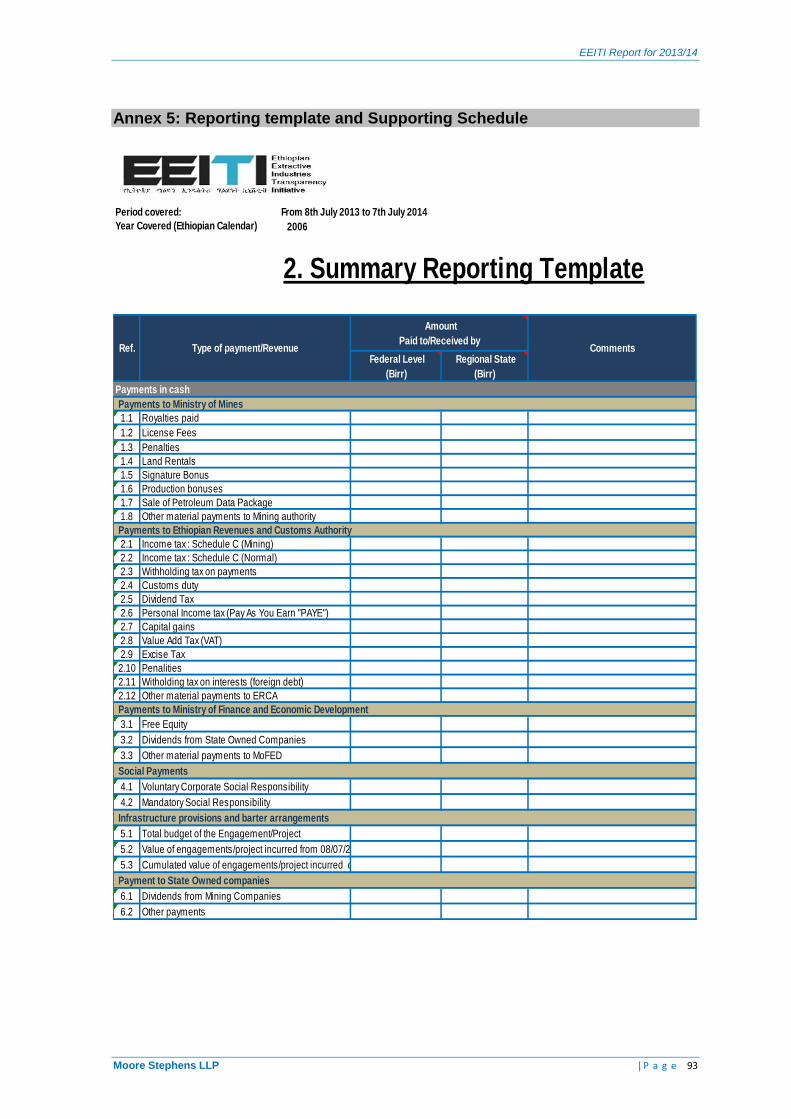
EEITI Report for 2013/14
Moore Stephens LLP | P a g e 93
Annex 5: Reporting template and Supporting Schedule
Period covered: From 8th July 2013 to 7th July 2014
2006
2. Summary Reporting Template
Federal Level
(Birr)
Regional State
(Birr)
Payments in cash
1.1
1.2
1.3
1.4
1.5
1.6
1.7
1.8
2.1
2.2
2.3
2.4
2.5
2.6
2.7
2.8
2.9
2.10
2.11
2.12
3.1
3.2
3.3
4.1
4.2
5.1
5.2
5.3
6.1
6.2
Year Covered (Ethiopian Calendar)
Payments to Ministry of Mines
Payments to Ethiopian Revenues and Customs Authority
Payments to Ministry of Finance and Economic Development
Social Payments
Free Equity
Personal Income tax (Pay As You Earn "PAYE")
Value Add Tax (VAT)
Capital gains
Infrastructure provisions and barter arrangements
Payment to State Owned companies
Income tax : Schedule C (Normal)
Other payments
Dividends from Mining Companies
Dividends from State Owned Companies
Other material payments to ERCA
Ref. Type of payment/Revenue Comments
Amount
Paid to/Received by
Royalties paid
License Fees
Penalties
Land Rentals
Sale of Petroleum Data Package
Income tax : Schedule C (Mining)
Withholding tax on payments
Production bonuses
Other material payments to Mining authority
Dividend Tax
Value of engagements/project incurred from 08/07/2013 to 07/07/2014
Cumulated value of engagements/project incurred on 07/07/2014
Excise Tax
Penalities
Witholding tax on interests (foreign debt)
Total budget of the Engagement/Project
Voluntary Corporate Social Responsibility
Customs duty
Mandatory Social Responsibility
Other material payments to MoFED
Signature Bonus

EEITI Report for 2013/14
Moore Stephens LLP | P a g e 94

EEITI Report for 2013/14
Moore Stephens LLP | P a g e 95
Détail des paiements
Period covered: From 8th July 2013 to 7th July 2014
Year Covered (Ethiopian Calendar) 2006
3. Payment flow details (by receipt number)
Name of the company
Paid to/Received by
Federal Government
Paid to/Received by
Regional State
Total 0 0
Payment description / tax name Date
Name of the
Government Agency
receiving the payment
Receipt No. Comments if any
Amount in (Birr)
-

EEITI Report for 2013/14
Moore Stephens LLP | P a g e 96
Period covered: From 8th July 2013 to 7th July 2014
2006
4. Social payment details
A. Social contributions mandated by law or the contract
Amount
(Birr)Date
Description of
the contribution
in kind
Cost incurred during the
year
0 0
B. Voluntary social contributions
Amount
(Birr)Date
Description of
the contribution
in kind
Cost incurred during the
year
Total 0 0
Year Covered (Ethiopian Calendar)
Reference of Law or
contract
Beneficiary
Regional State
& Woreda of
the beneficiary
Payments in cash Payment in kind
Name and function of
beneficiary
Regional State
& Woreda of
the beneficiary
Payments in cash Payments in kind (Project)
Total

EEITI Report for 2013/14
Moore Stephens LLP | P a g e 97
Period covered: From 8th July 2013 to 7th July 2014
2006
5. Production details
Month Mineral Type Royalty (Birr) Quantity (Tons)Value of the
production (in Birr)
License
Number
Regional
State
0 0
Year Covered (Ethiopian Calendar)
Total
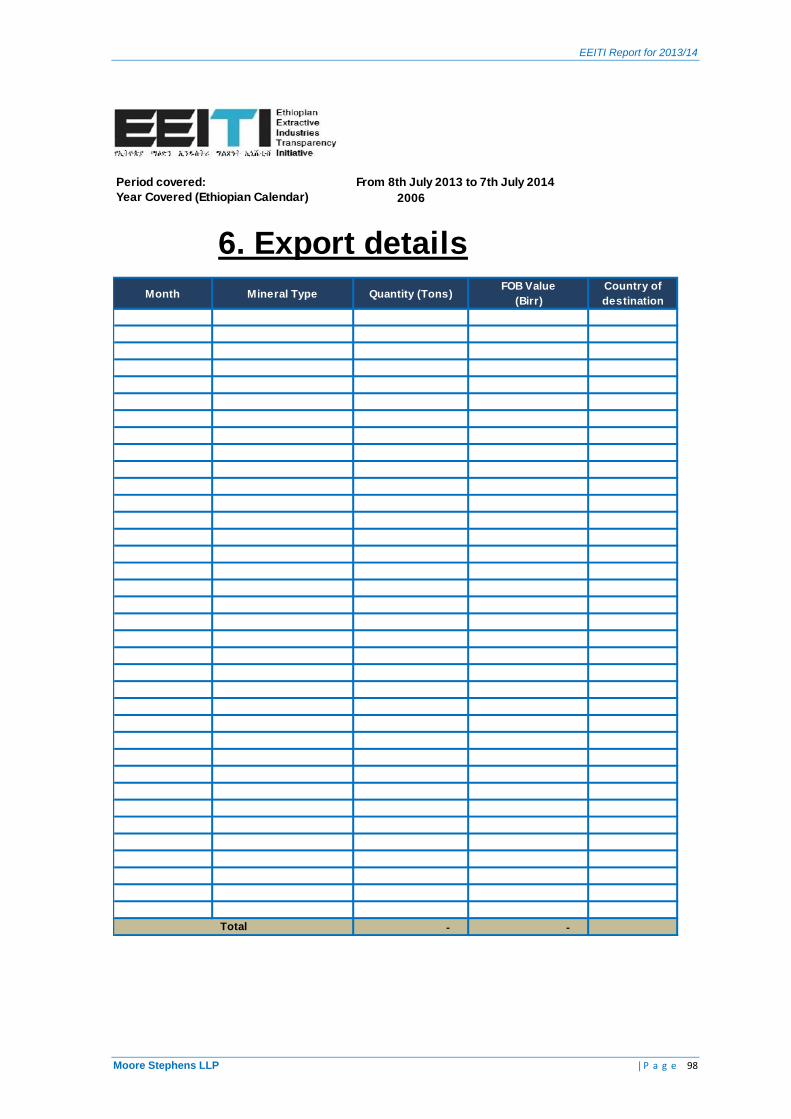
EEITI Report for 2013/14
Moore Stephens LLP | P a g e 98
Period covered: From 8th July 2013 to 7th July 2014
2006
6. Export details
Month Mineral Type Quantity (Tons)FOB Value
(Birr)
Country of
destination
- -
Year Covered (Ethiopian Calendar)
Total

EEITI Report for 2013/14
Moore Stephens LLP | P a g e 99
Period covered: From 8th July 2013 to 7th July 2014
2006
7. Beneficial ownership
Ownership as at 7 July 2014 N° Name/Entity % Interest
Nationality
of the
owner
Stock exchange
Listed entity
(yes/no)
Stock exchange (if
the company's
shares are quoted)
Owner (if the company's
shares are not quoted)
State Owned (Federal Government) 1
State Owned (State Government) 2
1
2
3
4
5
0% The total should be 100%
* The declaration below is intended only for the Private Shareholders not listed
Private stackholder (1) :
Identity of the beneficial owner
Date when beneficial
interest was acquired
Means of contact
1 [residential/service address]
[Full name as it appears on national identify card] [other contact details]
[Date of birth and/or national identify number]
[Nationality]
[Country of residence] [number
of shares]
[% of shares] [% of direct
voting rights]
[% of indirect
voting rights]
[Where control over
the company is
exercised through
other means, details
should be provided
here.]
[residential/service address]
[Full name as it appears on national identify card] [other contact details]
[Date of birth and/or national identify number]
[Nationality]
[Country of residence] [number
of shares]
[% of shares] [% of direct
voting rights]
[% of indirect
voting rights]
[Where control over
the company is
exercised through
other means, details
should be provided
here.]
Are any of the beneficial ow ners a Politically Exposed Person (PEP)** ?
□ Yes. Name: ______________.Public off ice position and role: Date w hen off ice w as assumed: / / Date w hen off ice w as left, if
applicable:_ /__/___
□ No.
By shares By % of voting rights Other
[date]
Information about how ownership is held or control over the company is
exercised
By shares By % of voting rights Other
[date]
% of private ownership
Year Covered (Ethiopian Calendar)

EEITI Report for 2013/14
Moore Stephens LLP | P a g e 100
Period covered: From 8th July 2013 to 7th July 2014
2006
8. Public Interest
Extractive Company
/Joint Venture
% Interest
08/07/2013% Interest 07/07/2014
Nature of the
transaction
Value of the
transaction in
(Birr)
Terms of transaction
(cash payments or
loan ..)
Beneficiary of the
transaction
(co unterparty )
State if there is
responsibility to
cover the project
expenses ?
terms attached
to their equity stake
In case of change in the % interest (including Free equity) Engagements attached to the equity stake
Year Covered (Ethiopian Calendar)

EEITI Report for 2013/14
Moore Stephens LLP | P a g e 101
Period covered: From 8th July 2013 to 7th July 2014
2006
9. Infra prov & Barter arrange
Total budget of the
Engagement/Project
Value of
engagements/project
incurred from 08/07/2013
to 07/07/2014
Cumulated value of
engagements/project
incurred on 07/07/2014
0 0 0Total
Description of the
project
Location of the
project
Terms of the TransactionTerms of Transaction and
legal basis (Ref of the
Agreement, date of
signature, etc..)
Year Covered (Ethiopian Calendar)

EEITI Report for 2013/14
Moore Stephens LLP | P a g e 102
Period covered: From 8th July 2013 to 7th July 2014
2006
10. Quasi-fiscal expenditures
Amount (Birr) Date
Description (activities undertaken,
beneficiaries, objectives,
outcomes ..)
Project cost incurred
during the period from
8 July 2013 to 7 July
2014
0 0
Year Covered (Ethiopian Calendar)
Beneficiary
Identity
Beneficiary
Location
Cash Payments In Kind payments (Projects)
Purpose of payment
("Resettlement" or
"Sustainability")
Total
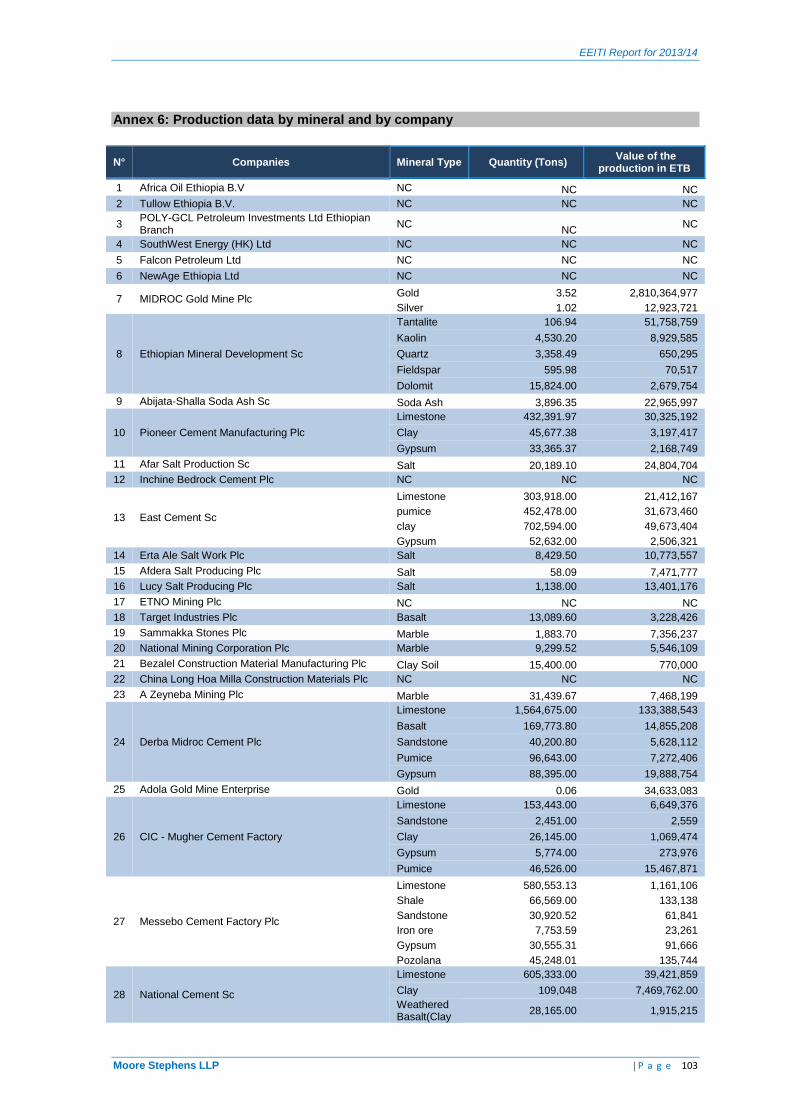
EEITI Report for 2013/14
Moore Stephens LLP | P a g e 103
Annex 6: Production data by mineral and by company
N° Companies Mineral Type Quantity (Tons) Value of the
production in ETB
1 Africa Oil Ethiopia B.V NC NC NC
2 Tullow Ethiopia B.V. NC NC NC
3 POLY-GCL Petroleum Investments Ltd Ethiopian Branch
NC NC
NC
4 SouthWest Energy (HK) Ltd NC NC NC
5 Falcon Petroleum Ltd NC NC NC
6 NewAge Ethiopia Ltd NC NC NC
7 MIDROC Gold Mine Plc Gold 3.52 2,810,364,977
Silver 1.02 12,923,721
8 Ethiopian Mineral Development Sc
Tantalite 106.94 51,758,759
Kaolin 4,530.20 8,929,585
Quartz 3,358.49 650,295
Fieldspar 595.98 70,517
Dolomit 15,824.00 2,679,754
9 Abijata-Shalla Soda Ash Sc Soda Ash 3,896.35 22,965,997
10 Pioneer Cement Manufacturing Plc
Limestone 432,391.97 30,325,192
Clay 45,677.38 3,197,417
Gypsum 33,365.37 2,168,749
11 Afar Salt Production Sc Salt 20,189.10 24,804,704
12 Inchine Bedrock Cement Plc NC NC NC
13 East Cement Sc
Limestone 303,918.00 21,412,167
pumice 452,478.00 31,673,460
clay 702,594.00 49,673,404
Gypsum 52,632.00 2,506,321
14 Erta Ale Salt Work Plc Salt 8,429.50 10,773,557
15 Afdera Salt Producing Plc Salt 58.09 7,471,777
16 Lucy Salt Producing Plc Salt 1,138.00 13,401,176
17 ETNO Mining Plc NC NC NC
18 Target Industries Plc Basalt 13,089.60 3,228,426
19 Sammakka Stones Plc Marble 1,883.70 7,356,237
20 National Mining Corporation Plc Marble 9,299.52 5,546,109
21 Bezalel Construction Material Manufacturing Plc Clay Soil 15,400.00 770,000
22 China Long Hoa Milla Construction Materials Plc NC NC NC
23 A Zeyneba Mining Plc Marble 31,439.67 7,468,199
24 Derba Midroc Cement Plc
Limestone 1,564,675.00 133,388,543
Basalt 169,773.80 14,855,208
Sandstone 40,200.80 5,628,112
Pumice 96,643.00 7,272,406
Gypsum 88,395.00 19,888,754
25 Adola Gold Mine Enterprise Gold 0.06 34,633,083
26 CIC - Mugher Cement Factory
Limestone 153,443.00 6,649,376
Sandstone 2,451.00 2,559
Clay 26,145.00 1,069,474
Gypsum 5,774.00 273,976
Pumice 46,526.00 15,467,871
27 Messebo Cement Factory Plc
Limestone 580,553.13 1,161,106
Shale 66,569.00 133,138
Sandstone 30,920.52 61,841
Iron ore 7,753.59 23,261
Gypsum 30,555.31 91,666
Pozolana 45,248.01 135,744
28 National Cement Sc
Limestone 605,333.00 39,421,859
Clay 109,048 7,469,762.00
Weathered Basalt(Clay
28,165.00 1,915,215

EEITI Report for 2013/14
Moore Stephens LLP | P a g e 104
N° Companies Mineral Type Quantity (Tons) Value of the
production in ETB
II)
Iron ore 6,700.00 4,355,169
Gypsum 21,263.00 12,757,992
Rhyolite 92,604.00 2,582,893
29 JAM Industrial Plc Quarry 8 898 M3 1,530,473
30 Nurit General Business Plc Aggregate & subbase
32473.91 M3 4,019,820
31 Hua Yi Cement Plc NC NC NC
32 Bona Ethio Indian Marble Mining Factory Plc NC NC NC
33 Daylight Applied Technologies Plc
Limestone 24.00 25,200
Silica Sand 14.00 13,860
Limestone 132.00 138,600
34 Huang shan cement plc NC NC NC
35 Ethiopian Hansom International Glass Plc silica sand 16,276 1,245,885

EEITI Report for 2013/14
Moore Stephens LLP | P a g e 105
Annex 7: Payment flows description
Ref Payment flows Description
Ministry of Mines, Oil & Natural Gas
1.1 Royalties paid to Federal Government
Payment made each mining license holder based on the sales price of the commercial transactions of the minerals produced in accordance with the Mineral Proclamation N°678-2010
1.2 License Fees This payment is made for the issuance and renewal of licenses in accordance with Mining Operations Council of Ministers Regulations 182/1994
1.3 Penalties This payment is made by any extractive companies that contravenes or fails to comply with any order, provision of a proclamation, regulations, directives or the terms and conditions of a license or permit
1.4 Land Rentals
A licensee is required to pay annually in advance a rental for area covered by a lease. The rates of rentals have been specified in the Mining Operations Council of Ministers Regulations No. 182/1994. The rentals are usually paid to regional governments
1.5 Signature Bonus
This payment is made by companies operating in Oil & Gas sector to the Ministry of Mines, Oil & Natural Gas within a period of time after the effective date of the Production Sharing Agreement signed between the government and the company. The signature bonus is generally made in USD currency
1.6 Production bonuses
A company shall pay to the Minister of Mines a amounts namely "Production bonunes" when production of crude oil attains for the specified periods of time some levels that are defined in the Production Sharing Agreement
1.7 Sale of Petroleum Data Package
Payment made by extractive company to the Ministry of Mines, Oil & Natural Gas in exchange with any strudy or data package that the MoM will share with the extractive company
1.8 Other material payments to Mining authority
Any other payment made to the Mining Authority, in either the Federal level or the Regional State level, and that exceeds ETB 500,000
Ethiopian Revenues and Customs Authority
2.1 Income tax : Schedule C (Mining)
Any payment made to either the Federal or Regional level as being a Mining Income Tax as defined by the Mining Operations Proclamation N°678/2010. A Mining Income tax is paid: - by any holder of a large scale mining license in accordance with the Mining Income Tax Proclamation No. 53/1993 as amended which set it at 25% of taxable income; and - by holders of artisanal and small scale mining licenses shall be determined by the laws of the states.
2.2 Income tax : Schedule C (Normal)
Payment made for income tax on profit from any industrial, commercial, professional or vocational activity or any other activity recognised as trade by the Commercial Code of Ethiopia and carried on by any person for profit.
2.3 Withholding tax on payments
Any payment relating to any kind of tax that was withheld by the
extractive company when paying third parties and that has been paid to the government
2.4 Customs duty
Custom duties are payments made by extrative companies and that are relating to taxes imposed on the imports and exports of goods and services. Dutiy amounts paid on commodities depend on the class of such commodities in accordance to the Proclamation No. 38/1993
2.5 Dividend Tax
These payments are relating to taxes on dividends that are separatly paid by the extractive company to the government when these payments are not already reported in another payment flow such as the income tax above or the withholding tax above
2.6 Personal Income tax (Pay As You Earn "PAYE")
These are payments relating to the income tax of the own staff of the extractive companies. These income tax on salaries are withheld by the extractive companies and paid to the Federal or Regional government
2.7 Capital gains Capital gains tax are paid on capital nature gain such as plants, building, factory or office, and shares of companies
2.8 Value Added Tax (VAT) Payments made in accordance to the Value Added Tax (VAT) Proclamation N°285/2002 as amended. The VAT is charged on the supply of goods and services by registered persons, and on the

EEITI Report for 2013/14
Moore Stephens LLP | P a g e 106
Ref Payment flows Description
importation of goods and services into Ethiopia and services
2.9 Excise Tax
Excise tax is a payment made on certain goods specified under the Schedule to the Excise Tax Proclamation, when imported and when produced locally. The excise tax rate varies from 10% to 100% on the cost of production, or CIF (“cost-insurance-freight”)
2.10 Penalties This payment is made, to either Federal or Regional State lever, by any extractive companies that contravenes or fails to comply with any provision or conditions of the tax regulation
2.11 Withholding tax on interest payments
When extractive companies are paying interests on a foreign currency debt, the extractive companies withhold part of the interest as a Withholding tax on interest and pay it to the government in accordance to Article 36 of the Income Tax Proclamation 286/2002.
2.12 Other material payments to ERCA
Any other payment made to ERCA and that exceeds ETB 500,000
Ministry of Finance and Economic Co-operation
3.1 Free Equity
These are the proceeds of participation interest aquired without cost by the government in any large scale or small scale mining. This participation is possible because the government may government may acquire without cost a participation interest of five percent of any large scale or small scale mining investment
3.2 Dividends from State Owned Companies
These are the proceeds of various investments in the State Owned Companies accruing to the Government. This participation of the government is possible because the Government may undertake mining operations that are vital for the overall economic growth either by itself or in partnership with private investors
3.3 Other material payments to MoF
Any other payment made to MoF and that exceeds 500,000 Birr
Social Payments
4.1 Voluntary Corporate Social Responsibility
These contributions are voluntary and can be made in cash or in kind depending on individual contracts. It includes all voluntary contributions made by extractive companies to promote local development and to finance social projects such as inter alia: health infrastructure, school infrastructure, road infrastructure, market gardening infrastructure, projects related to the promotion of the agriculture and the grants provided to the population
4.2 Mandatory Social Responsibility
These contributions are mandatory and can be made in cash or in kind depending on individual contracts. It includes all voluntary contributions made by extractive companies to promote local development and to finance social projects such as inter alia: health infrastructure, school infrastructure, road infrastructure, market gardening infrastructure, projects related to the promotion of the agriculture and the grants provided to the population
Infrastructure provisions and barter arrangements
5.1 Total budget of the Engagement/Project
Total budgeted amount of the entire project within the infrastructure provisions and barter arrangements. "Infrastructure provisions and barter arrangements" include any agreements, or sets of agreements between the extractive company and the government (Federal or Regional State), involving the provision of goods and services, including loans, grants and infrastructure works, in full or partial exchange for oil, gas or mining exploration or production concessions or physical delivery of such commodities
5.2
Value of engagements/project incurred from 08/07/2013 to 07/07/2014
Total amount of all costs incured for all Project under any infrastructure provisions or barter arrangements during the reconciliation period starting from 08/07/2013 to 07/07/2014
5.3 Cumulated value of engagements/project incurred on 07/07/2014
Total amount of all costs incured for all Project under any infrastructure provisions or barter arrangements during the reconciliation period starting from the beginning of the Project until 07/07/2014
Payment to State Owned companies

EEITI Report for 2013/14
Moore Stephens LLP | P a g e 107
Ref Payment flows Description
6.1 Dividends from Mining Companies
These are the proceeds of various investments of the State Owned Companies (SOC) in the extractive companies. The amount received by SOC is dependent on its shareholding in the paying entity
6.2 Other payments Any other payment made to SOC and that exceeds 500,000 Birr

EEITI Report for 2013/14
Moore Stephens LLP | P a g e 108
Annex 8: Detail of Licenses held by companies selected in the scope
N° Company Commodity extracted
Number of
Licence/Lease
Licence type
Licence number or Blocks awarded
Status of the lease
Issue date Duration Regional
State Local / Woreda
1 Africa Oil Ethiopia B.V
Oil and Gaz 1 Exploration Rift Basin Area Block Active 21/02/2013 3 years Arba Minch Arba Minch
2 Tullow Ethiopia B.V.
Oil and Gaz 1 Exploration South Omo Block Active 15/01/2008 14/01/2017 SNNPRS South Omo
3
POLY-GCL Petroleum Investments Ltd Ethiopian Branch
Oil and Gaz
5
Exploration Calub & Hilala Active 16/11/2013 Appraisal 2
+2 years Somali Debeweyn,Gode,
Oil and Gaz Exploration Block 3 & 4 Active 16/11/2013 Exploration
up to 8 years
Somali Dolo Odo,Chereti,Goro
Baqaqsa
Oil and Gaz Exploration Block 11 & 15 Active 16/11/2013 Exploration
up to 8 years
Somali Gode,Dabeweyn,Denan,Kedri
dehar,Shilabo
Oil and Gaz Exploration Block 12 & 16 Active 16/11/2013 Exploration
up to 8 years
Somali Adadle,Bare,KalafoMustahil
Oil and Gaz Exploration Block 17 and 20 Active 16/11/2013 Exploration
up to 8 years
Somali Danot/Warder/Boh
4 SouthWest Energy (HK) Ltd
Oil and Gaz 1 Exploration 020/2/3257/98 Active 25/03/2005 10.5 Years Addis Ababa 02
5 Falcon Petroleum Ltd
Oil and Gaz 1 Exploration
Petroleum Production Sharing Agreement of
Blocks AB1, AB4 and AB7 of the Abay Basin ("PPSA")
Active 08/07/2008 8 years Wello
6 NewAge Ethiopia Ltd
Oil and Gaz 2
Exploration Block 7&8 Active July 11,2007 Ethiopian Somali
Oil and Gaz Exploration Adigala Block Active July 11,2007 Ethiopian Somali
7 MIDROC Gold Mine Plc
Precious Metals
6
Mining 43 Blocks Active 29/03/1998 20 Years Oromia Oddo Shakisso
Precious Metals Mining 0111/2002 Active 24/11/2009 20 Years Oromia Oddo Shakisso
Gold, Base Metal Exploration MOM/EL\ 3 - 25\97 Active 05/03/2005 10 Years Oromia Oddo Shakisso
Gold, Base Metal, Iron Exploration MOM\026 - 124\97 Active 21/03/2005 13 Years Benishangul Bullen
Gold, Base Metals, Iron, Chromite, Phosphate
Exploration MOM\EL\352\2010 Active 04/10/2010 15 Years Benishangul /
Amhara Debate/Gwangua
Precious Metals Exploration MOM\EL\500\2010 Active 12/02/2015 3 Years Oromia Oddo Shakisso
8 Ethiopian Mineral Development
Tantalum 1 Mining MT/AA/14/673/127301/2007 Active 02/07/2007 Addis Ababa Bole

EEITI Report for 2013/14
Moore Stephens LLP | P a g e 109
N° Company Commodity extracted
Number of
Licence/Lease
Licence type
Licence number or Blocks awarded
Status of the lease
Issue date Duration Regional
State Local / Woreda
Sc
9 Abijata-Shalla Soda Ash Sc
Soda Ash 1 Mining MOM/LSML/163/2011 Active 16/09/2011 15/09/2031 Oromiya Adami Tulu Jido
10
Pioneer Cement Manufacturing Plc
Limestone
3
Mining 1616-1619/2002 Active 30/4/2010 29/4/2030 Addis Ababa A/Ketema
Clay Mining 1629-1707/2002 Active 23/6/2010 22/6/2020 Addis Ababa A/Ketema
Gypsum Mining MOM\SSML\504\2010 Active 14/7/2011 13/7/2021 Addis Ababa A/Ketema
11 Afar Salt Production Sc
Salt 1 Salt 006/94 Active 11/07/2002 20 Years Afar Afdera
12 Inchine Bedrock Cement Plc
NC NC NC NC NC NC NC NC NC
13 East Cement Sc
Gypsum
4
Mining MOM/SSML/148/2010 Active 06/10/2010 10 years Oromia Filklik
Pumice Mining 1971/2010 Active 05/08/2010 10 years Oromia Dire/Chalo
Clay Mining 455/99 Active 04/07/2010 10 years Oromia Gandashano
Limestone Mining 452/99 Active 04/06/2010 10 years Oromia Amuma Mechara
14 Erta Ale Salt Work Plc
Salt 1 Mining 020/92 Active 09/08/2010 10 Years Afar Afdera
15 Afdera Salt Producing Plc
Salt 1 Mining 080/95 Active 06/2/2003 20 Years Afar Afdera
16 Lucy Salt Producing Plc
Salt 1 Mining 058/96 Active 01/08/2004 20 Years Afar Afdera
17 ETNO Mining Plc
NC NC NC NC NC NC NC NC NC
18 Target Industries Plc
Basalt 1 Mining 686/2010 NC 02/01/2006 NC Bole Woreda 03
19 Sammakka Stones Plc
Marble
3
Exploration 0426-0427/2001 Inactiv
e 31/07/2009 30/07/2012
Benishangul Gumuz
Kamashi
Marble Mining MOM\LSML\657\2011 Active 30/01/2012 29/01/2034 Benishangul
Gumuz Kamashi
Marble Mining MOM\LSML\300\2013 Active 08/10/2015 19/08/2035 Benishangul
Gumuz Kamashi
20
National Mining Corporation Plc
Marble
3
Mining 14/706/29789/2004 Active October,08
2013 upto
May,2023
Benshangul Gumuz
Administration Oda Beldaglu
Gold & Base Metal Exploration 121/148/88 Active 2005 E.C Three Year Oromiya Dawa Digati
Gold & Base Metal Exploration 149-161/88 Active 2005 E.C Three Year Tigray Workamba
21
Bezalel Construction Material Manufacturing Plc
Clay Soil 1 Mining 1197/2001 Active 2001 15 years Oromia

EEITI Report for 2013/14
Moore Stephens LLP | P a g e 110
N° Company Commodity extracted
Number of
Licence/Lease
Licence type
Licence number or Blocks awarded
Status of the lease
Issue date Duration Regional
State Local / Woreda
22
China Long Hoa Milla Construction Materials Plc
NC NC NC NC NC NC NC NC NC
23 A Zeyneba Mining Plc
Marble 1 Mining MOM/SSML/701/2011 Active 13/10/2010 13/10/2020 Benshangul
Gumuz
24 Derba Midroc Cement Plc
Limesone,marle,Gypsum,SST
5
Mining 2966-2975/2000 Active 19/05/2008 10 years Oromia Sululta
Pumice Mining 0122-0129/2002 Inactiv
e 25/11/2009 20 Years Oromia Bora
Pumice Mining 0130-0131/2002 Active 25/11/2009 20 Years Oromia Dugda
Basalt Mining MOM/LSML/71/2011 Active 23/01/2012 20 Years Oromia Sululta
Gypsum Mining MOM/SSML/73/2011 Active 23/01/2012 20 Years Oromia Sululta
25 Adola Gold Mine Enterprise
Gold 1 Mining 4 Active 17/02/2013 5 years Ormia Seba Boru
26 CIC - Mugher Cement Factory
Limestone/Sandstone/Clay/Gypsum/Pumice 1 Mining 14/706/145516/2006 Active 23/08/1984 31 Years Oromia Adaberga
27 Messebo Cement Factory Plc
Limestone/Sandstone/Gypsum
6
Mining MN/IO/00196 Active 26/04/2004 5 years Tigray NC
Limestone/Sandstone/Gypsum Mining MN/GyI/012003 Active 23/03/2011 10 years Tigray NC
Limestone/Sandstone/Gypsum Mining MN/SST/01/2003 Active 03/05/2011 5 years Tigray NC
Limestone/Sandstone/Gypsum Mining MN/POZ/0198 Active 10/10/2005 Tigray NC
Limestone/Sandstone/Gypsum Exploration EXP/POZZ/01/97 Active 27/10/2004 3 Years Tigray NC
Limestone/Sandstone/Gypsum Exploration EX/IM/003/96 Active 04/06/2004 5 Years Tigray NC
28 National Cement Sc
Limestone
10
Mining Dire 27/34/2004 Active 22/07/2004
E.C 10 Years
Dire Dawa Adminstration
Dire Dawa
Limestone Mining Dire 27/811/2004 Active 9/1/2004
E.C 5 years
Dire Dawa Adminstration
Dire Dawa
Clay Mining Dire 27/684/2004 Active 8/7/2003
E.C 10 Years
Dire Dawa Adminstration
Gedenser D.D wereda
Weathered Basalt(Clay 2) Mining ILD/1123/2005 Active 01/06/2015
E.C 10 Years Somali
Gypsum Mining ILD/988/2005 Active 11/03/2005
E.C 5 years Somali Aysha Dewele
Gypsum Mining Dewele new site Inactiv
e 14/12/2002
E.C 10 Years Somali Aysha Dewele
Pumice Mining 0464-0466/2000 Active 25/03/2008
E.C 10 Years Afar Methara
Rhyolite Mining Dire 27/54/2005 Active 29/01/2005
E.C 10 Years
Dire Dawa Adminstration
Ija aneni
Iron ore Mining ILD/1123/2005 Inactiv 12/11/2006 3 Years Somali Halcho

EEITI Report for 2013/14
Moore Stephens LLP | P a g e 111
N° Company Commodity extracted
Number of
Licence/Lease
Licence type
Licence number or Blocks awarded
Status of the lease
Issue date Duration Regional
State Local / Woreda
e E.C
Iron ore Mining ILD/1123/2006 Inactiv
e 12/11/2006
E.C 3 Years Somali Garman
29 JAM Industrial Plc
Quarry 1 Mining 2087-2089/98 Active 20/10/2004 10 Years Addis Ababa 13
30 Nurit General Business Plc
NC NC NC NC NC NC NC NC NC
31 Hua Yi Cement Plc
NC NC NC NC NC NC NC NC NC
32
Bona Ethio Indian Marble Mining Factory Plc
Marble Block 1 Mining 0413-0414/2001 Inactiv
e 21/07/2009 20/07/2019
Benshangul Gumz
Daleti
33
Daylight Applied Technologies Plc
Silica Sand
2
Mining SSMIN3158-3159/199 NC 01/09/2007 NC NC NC
Lime Stone Mining SSMIN0190-0193 NC 25/11/2008 NC NC NC
34 Huang shan cement plc
NC NC NC NC NC NC NC NC NC
35
Ethiopian Hansom International Glass Plc
None 1 Mining 686/2010 Inactiv
e NC NC Addis Ababa NC

EEITI Report for the year ended 7 July 2014
Moore Stephens LLP | P a g e 112
Annex 9: List of extractive companies holding active licenses and not retained in the reconciliation scope
N° TIN Number Name of company
1 22714069 0898649 B.C Ltd
2 15709322 AA Ethiopian Nutritional Foods PLC
3 5706123 AARTI Steel Plc
4 936202 Abay Natural Resources Development Plc.
5 294477 Abyssinia Cements Plc
6 3727103 Access Capital Services S.C.
7 29221754 Alisha Mining PLC
8 16765154 Allana Potash Afar PLC
9 16357577 Altau Resources Ltd
10 16964850 Aluvance Plc
11 16368228 Ambo Nyamer Agro and Integrated Industries S.C.
12 5961284 Anpex Refining and Petro Chemicals Plc
13 TIN to be found Aroma Mining Plc
14 4840095 Ascom Mining Ethiopia Plc
15 #N/A Ato Dereje Bekele Gemeda
16 14280907 Belson Industrial Plc
17 16022729 Benzu Gold Mining Ethiopia plc
18 16022757 Benzu Mining Resources Ethiopia PLC
19 23905273 Birbir Mining Development Private Limited Company
20 21421545 Birla Corporation Cement Manufacturing PLC
21 22025255 BRANTHAM INVESTMENT LIMITED
22 26275440 Bullion Mining PLC
23 22358838 BULTI TESEMA
24 37598 C.G.C Overseas Construction Ethiopia
25 5412705 C.H.CLINKER MANUFACTURER PLC
26 16065661 Capital Cement Milling and Packing PLC
27 26274990 Capital Mining PLC
28 39103774 Chochi Mining Plc
29 5954743 Circum Minerals Potash Ltd
30 40778603 Danest Mining PLC
31 4224329 Dangote Industries Ethiopia plc
32 4447271 Dashen Cement factory PLC
33 21930152 Dawit Gold Mining Enterprise
34 358091 DAWRO ESARA PLC
35 16458487 Defo Trading Plc
36 3606228 Delbi Coal Mining S.C.
37 6920101 Derba Lime and Chemicals PLC
38 16173347 Donia Gonda Mineral Resources Corp. Ltd
39 Not avialable Dr.Abera Getahun
40 17051500 Dr.Theodros Woudneh
41 4809281 EL Mining PLC
42 41204207 ELTAI Iron Mining PLC
43 16079934 EMD General Trading PLC
44 28600149 Ethiopotash B.V
45 47467 Ezana Mining Developmrnt PLC
46 12814908 F.D.R.E Metals Enginering Corporation
47 16272997 Famu Industrial plc
48 exploration Fantaye Denu Nonno
49 16884846 Fuga Resources Plc
50 30220291 GEOFIX Industrial & Construction Materials Production PLC

EEITI Report for the year ended 7 July 2014
Moore Stephens LLP | P a g e 113
N° TIN Number Name of company
51 2876423 Getachew Olani
52 terminated Gobso Dillo mining plc
53 17543524 GP Resource Mining PLC
54 4138851 Gui Family Tantalum-Niobium East Africa Ltd
55 45536333 Habesha Cement Share Company
56 2738025 Habtamu Nemara
57 16981046 Haro Petroleum Corporation
58 3650180 Harvest Mining P.L.C
59 16065197 Henan Zhongzhou Institute of Geological & Mining Engineering Reconnaissance(Ethiopia Branch)
60 3253494 Ibrahim Adem Yesuf
61 22036187 Iris Mining PLC
62 5507887 Janjam Industrial PLC
63 1798284 JEMA PLC
64 5946624 Jiangxi Coalfield Geological General Investigation Co.Ltd.
65 956313 KEFI Minerals (Ethiopia) Ltd
66 22645422 Khanij Resources DMCC
67 16408383 Kinfe Tsegaye Beyene
68 4570237 KRIPTO Mining and Chemicals PLC
69 37784824 Lagalola Gold Mining Exploration PLC
70 22765130 Lemmi Amare Gebre
71 17051500 Loz Bez Mining Plc
72 26178311 Lucy Mining and Finding and Assessment Association PLC
73 22340531 Managem PLC
74 30355133 Melos Engineering and Trading PLC
75 16991724 Metico Mining Plc
76 6880388 MGM Gold Mines PLC
77 221083 Modern Building Industries P.L.C
78 6880799 MRD Australia Mining and Construction Plc
79 29232089 MSP Steel Plc
80 5110563 MYK Cement Industries PTE LTD (Ethiopian Branch)
81 30235969 Nankai Mining PLC
82 TIN to be found Nejib Abba Biyya
83 4882067 Nelvo International Minerals and Metals PLC
84 20502176 Newmba Gold Mining PLC
85 1747169 North Holdings Investment Inc
86 16978184 North Star Mining Plc
87 16670677 Nubian Gold Exploration Ltd
88 4407792 OMAR ALI ABDO (AFRICAN ORE)
89 17283737 Orecorp Minerals Plc
90 23742852 Pazion Mining Plc
91 37089182 Producers' Cooperative ARTEL of Prospectors Novaya
92 17604610 PS MINING PLC
93 16724148 Qiantang Inchini Cement Product Plc
94 37621964 Raha Gemstone Minerals Prospectors PLC
95 16026737 Raj Mineral Exploration Service PLC
96 2652081 Rayan Investiment PLC
97 4428246 Red Fox International Investment Business Plc
98 5283637 Red Fox Mining Plc
99 37427109 Reha Jemstone and Minerals Prospectors PLC
100 16906283 Reykjavik Geothermal Consulting Co.
101 30368744 Rift Resources PLC
102 2582278 Rift Valley Gemstones Import & Export
103 16846310 Rift Valley Resources Limited

EEITI Report for the year ended 7 July 2014
Moore Stephens LLP | P a g e 114
N° TIN Number Name of company
104 23405687 Rockfeller Hughes Corp.
105 12334547 RUSSGOLD-Wuney A MINING PLC
106 37782515 SEKOTA MINING PLC
107 4726423 Sheba Exploration Ltd.
108 4387919 Shiny Mining
109 23874950 Silur Minerals Exploration and Mining PLC
110 22494623 Sol_Tem Mining PLC
111 14832482 Soressa general trading PLC
112 39314811 Sourish Marbles PLC
113 16209256 Square Quart Mining PLC
114 4431215 Stella Trading and Industry PLC
115 3078100 Stone Fields Construction P.L.C
116 5498340 Stratex East Africa LTD
117 8504810 Teferi Mesfin Teshome
118 5402188 Teranter General Business (TGB) PLC
119 2710179 Tesfaye Ayichew
120 terminated Tewlde Weldeabezgi
121 4624346 Three M Marble and Terrazzo Manufacturing Plc
122 terminated Thunderbird potash Ethiopia plc
123 22040841 Tigray Resources Incorporated PLC
124 26274697 Top Rock Mining PLC
125 22025319 Towchester Investment Company Ltd.
126 16758667 Transe-Africa Resource Corporation
127 3403151 Ture Dire Dawa Cement Factory Share Company
128 10796591 Turquois General Business Plc
129 4387921 United Mining P.L.C
130 23664733 Web Gemstone Mining Plc
131 1123460 Wudnesh Minaleshewa
132 28600149 Yara Dallol B.V.
133 16803804 YCJM Resource Limited
134 16349580 YGE Mining Plc
135 11015_FIC YMG Gold Mining Pplc
136 4521063 Zhong E Mining PLC
137 Not avialable Abdulla Al Salmi
138 Not avialable CONTECH ENGINEERING COLLC

EEITI Report for the year ended 7 July 2014
Moore Stephens LLP | P a g e 115
Annex 10: Reconciliation sheets by company
Company name: Africa Oil Ethiopia B.V Reporting period: 2013/14
Original Adjust Final Original Adjust Final
A- Direct Payments/Revenues 6,400,766 3,915 6,404,681 6,101,343 309,597 6,410,940 (6,259)
1- Payments to Ministry of Mines (MoM) 4,628,198 - 4,628,198 4,238,642 389,557 4,628,198 -
1.1 Royalties paid - - - - - - -
1.2 License Fees - - - - - - -
1.3 Penalties - - - - - - -
1.4 Land Rentals 3,576,698 - 3,576,698 3,275,647 301,052 3,576,698 -
1.5 Signature Bonus - - - - - - -
1.6 Production bonuses - - - - - - -
1.7 Sale of Petroleum Data Package - - - - - - -
1.8 Other material payments to Mining authority 1,051,500 - 1,051,500 962,995 88,505 1,051,500 -
1,772,568 3,915 1,776,483 1,862,702 (79,960) 1,782,742 (6,259)
2.1 Income tax : Schedule C (Mining) - - - - - - -
2.2 Income tax : Schedule C (Normal) - - - - - - -
2.3 Withholding tax on payments 219,743 - 219,743 219,743 - 219,743 -
2.4 Customs duty - 1,541 1,541 1,541 - 1,541 -
2.5 Dividend Tax - - - - - - -
2.6 Personal Income tax (Pay As You Earn "PAYE") 1,552,825 - 1,552,825 1,552,825 - 1,552,825 -
2.7 Capital gains - - - - - - -
2.8 Value Add Tax (VAT) - - - 6,260 - 6,260 (6,260) Tax not reported by the extractive company
2.9 Excise Tax - - - 378 - 378 (378) Tax not reported by the extractive company
2.10 Penalities - - - - - - -
2.11 Witholding tax on interests (foreign debt) - - - - - - -
2.12 Other material payments to ERCA - 2,374 2,374 81,955 (79,960) 1,995 379 Tax not reported by the extractive company
- - - - - - -
3.1 Free Equity - - - - - - - -
3.2 Dividends from State Ow ned Companies - - - - - - - -
3.3 Other material payments to MoFED - - - - - - - -
4- Payment to State Owned Companies (SOC) - - - - - - -
4.1 Dividends from Mining Companies - - - - - - - -
4.2 Other payments - - - - - - - -
Total payments 6,400,766 3,915 6,404,681 6,101,343 309,597 6,410,940 (6,259)
B- Unilateral company disclosures 28,696 - 28,696 - - - 28,696
6- Regional State Mining Authority - - - - - - -
7- Regional State Tax Authority - - - - - - -
8- Social Contributions 28,696 - 28,696 - - - 28,696
8.1 Voluntary Corporate Social Responsibility 28,696 - 28,696 - - 28,696
8.2 Mandatory Social Responsibility - - - - - -
Per GovernmentFinal difference CommentN° Description of Payment
Per Company
2- Payments to Ethiopian Revenues and Customs
Authority (ERCA)
3- Payments to Ministry of Finance and Economic
Development (MoFED)
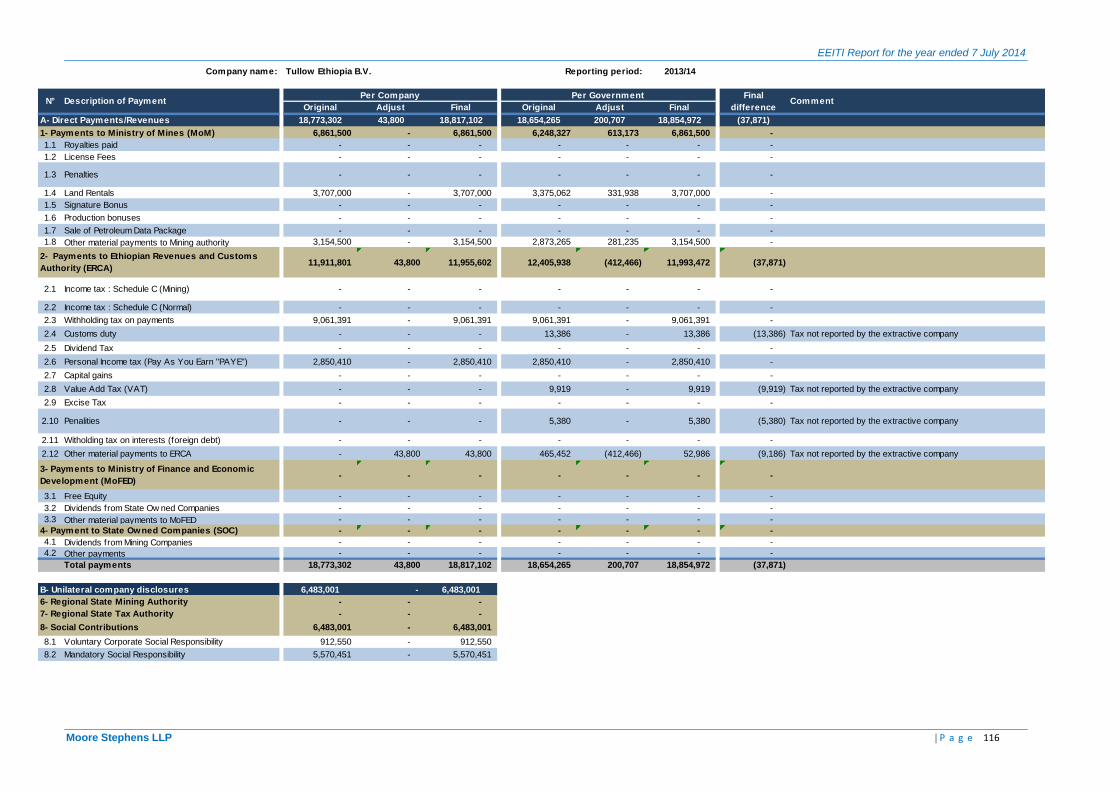
EEITI Report for the year ended 7 July 2014
Moore Stephens LLP | P a g e 116
Company name: Tullow Ethiopia B.V. Reporting period: 2013/14
Original Adjust Final Original Adjust Final
A- Direct Payments/Revenues 18,773,302 43,800 18,817,102 18,654,265 200,707 18,854,972 (37,871)
1- Payments to Ministry of Mines (MoM) 6,861,500 - 6,861,500 6,248,327 613,173 6,861,500 -
1.1 Royalties paid - - - - - - -
1.2 License Fees - - - - - - -
1.3 Penalties - - - - - - -
1.4 Land Rentals 3,707,000 - 3,707,000 3,375,062 331,938 3,707,000 -
1.5 Signature Bonus - - - - - - -
1.6 Production bonuses - - - - - - -
1.7 Sale of Petroleum Data Package - - - - - - -
1.8 Other material payments to Mining authority 3,154,500 - 3,154,500 2,873,265 281,235 3,154,500 -
11,911,801 43,800 11,955,602 12,405,938 (412,466) 11,993,472 (37,871)
2.1 Income tax : Schedule C (Mining) - - - - - - -
2.2 Income tax : Schedule C (Normal) - - - - - - -
2.3 Withholding tax on payments 9,061,391 - 9,061,391 9,061,391 - 9,061,391 -
2.4 Customs duty - - - 13,386 - 13,386 (13,386) Tax not reported by the extractive company
2.5 Dividend Tax - - - - - - -
2.6 Personal Income tax (Pay As You Earn "PAYE") 2,850,410 - 2,850,410 2,850,410 - 2,850,410 -
2.7 Capital gains - - - - - - -
2.8 Value Add Tax (VAT) - - - 9,919 - 9,919 (9,919) Tax not reported by the extractive company
2.9 Excise Tax - - - - - - -
2.10 Penalities - - - 5,380 - 5,380 (5,380) Tax not reported by the extractive company
2.11 Witholding tax on interests (foreign debt) - - - - - - -
2.12 Other material payments to ERCA - 43,800 43,800 465,452 (412,466) 52,986 (9,186) Tax not reported by the extractive company
- - - - - - -
3.1 Free Equity - - - - - - -
3.2 Dividends from State Ow ned Companies - - - - - - -
3.3 Other material payments to MoFED - - - - - - -
4- Payment to State Owned Companies (SOC) - - - - - - -
4.1 Dividends from Mining Companies - - - - - - -
4.2 Other payments - - - - - - -
Total payments 18,773,302 43,800 18,817,102 18,654,265 200,707 18,854,972 (37,871)
B- Unilateral company disclosures 6,483,001 - 6,483,001 - - - 6,483,001
6- Regional State Mining Authority - - - - - - -
7- Regional State Tax Authority - - - - - - -
8- Social Contributions 6,483,001 - 6,483,001 - - - 912,550
8.1 Voluntary Corporate Social Responsibility 912,550 - 912,550 - - 912,550
8.2 Mandatory Social Responsibility 5,570,451 - 5,570,451 - - 5,570,451
Per Government Final
differenceCommentN° Description of Payment
Per Company
2- Payments to Ethiopian Revenues and Customs
Authority (ERCA)
3- Payments to Ministry of Finance and Economic
Development (MoFED)
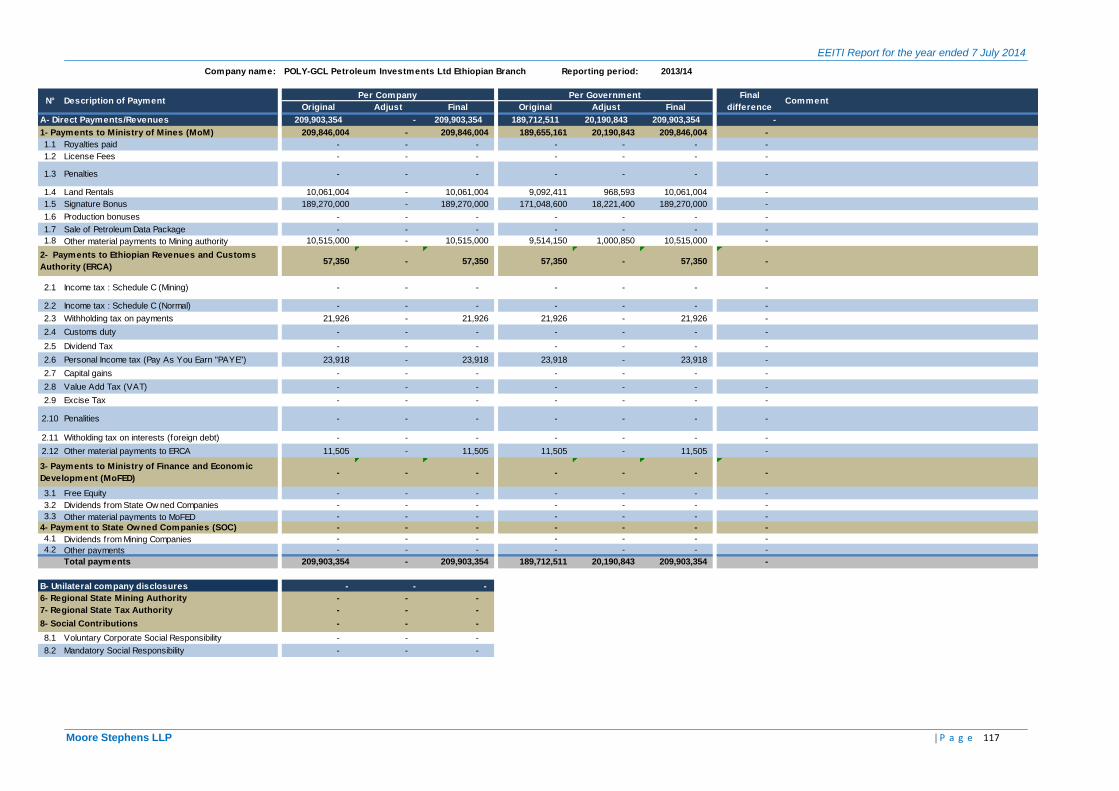
EEITI Report for the year ended 7 July 2014
Moore Stephens LLP | P a g e 117
Company name: POLY-GCL Petroleum Investments Ltd Ethiopian Branch Reporting period: 2013/14
Original Adjust Final Original Adjust Final
A- Direct Payments/Revenues 209,903,354 - 209,903,354 189,712,511 20,190,843 209,903,354 -
1- Payments to Ministry of Mines (MoM) 209,846,004 - 209,846,004 189,655,161 20,190,843 209,846,004 -
1.1 Royalties paid - - - - - - -
1.2 License Fees - - - - - - -
1.3 Penalties - - - - - - -
1.4 Land Rentals 10,061,004 - 10,061,004 9,092,411 968,593 10,061,004 -
1.5 Signature Bonus 189,270,000 - 189,270,000 171,048,600 18,221,400 189,270,000 -
1.6 Production bonuses - - - - - - -
1.7 Sale of Petroleum Data Package - - - - - - -
1.8 Other material payments to Mining authority 10,515,000 - 10,515,000 9,514,150 1,000,850 10,515,000 -
57,350 - 57,350 57,350 - 57,350 -
2.1 Income tax : Schedule C (Mining) - - - - - - -
2.2 Income tax : Schedule C (Normal) - - - - - - -
2.3 Withholding tax on payments 21,926 - 21,926 21,926 - 21,926 -
2.4 Customs duty - - - - - - -
2.5 Dividend Tax - - - - - - -
2.6 Personal Income tax (Pay As You Earn "PAYE") 23,918 - 23,918 23,918 - 23,918 -
2.7 Capital gains - - - - - - -
2.8 Value Add Tax (VAT) - - - - - - -
2.9 Excise Tax - - - - - - -
2.10 Penalities - - - - - - -
2.11 Witholding tax on interests (foreign debt) - - - - - - -
2.12 Other material payments to ERCA 11,505 - 11,505 11,505 - 11,505 -
- - - - - - -
3.1 Free Equity - - - - - - -
3.2 Dividends from State Ow ned Companies - - - - - - -
3.3 Other material payments to MoFED - - - - - - -
4- Payment to State Owned Companies (SOC) - - - - - - -
4.1 Dividends from Mining Companies - - - - - - -
4.2 Other payments - - - - - - -
Total payments 209,903,354 - 209,903,354 189,712,511 20,190,843 209,903,354 -
B- Unilateral company disclosures - - - - - - -
6- Regional State Mining Authority - - - - - - -
7- Regional State Tax Authority - - - - - - -
8- Social Contributions - - - - - - -
8.1 Voluntary Corporate Social Responsibility - - - - - -
8.2 Mandatory Social Responsibility - - - - - -
Per Government Final
differenceCommentN° Description of Payment
Per Company
2- Payments to Ethiopian Revenues and Customs
Authority (ERCA)
3- Payments to Ministry of Finance and Economic
Development (MoFED)

EEITI Report for the year ended 7 July 2014
Moore Stephens LLP | P a g e 118
Company name: SouthWest Energy (HK) Ltd Reporting period: 2013/14
Original Adjust Final Original Adjust Final
A- Direct Payments/Revenues 8,278,827 (2,182,872) 6,095,955 5,629,360 466,789 6,096,149 (194)
1- Payments to Ministry of Mines (MoM) 8,207,715 (2,182,872) 6,024,843 5,558,054 466,789 6,024,843 -
1.1 Royalties paid - - - - - - -
1.2 License Fees - - - - - - -
1.3 Penalties - - - - - - -
1.4 Land Rentals 3,475,965 (2,182,872) 1,293,093 1,173,056 120,037 1,293,093 -
1.5 Signature Bonus - - - - - - -
1.6 Production bonuses - - - - - - -
1.7 Sale of Petroleum Data Package - - - - - - -
1.8 Other material payments to Mining authority 4,731,750 - 4,731,750 4,384,998 346,752 4,731,750 -
71,113 - 71,113 71,307 - 71,307 (194)
2.1 Income tax : Schedule C (Mining) - - - - - - -
2.2 Income tax : Schedule C (Normal) - - - - - - -
2.3 Withholding tax on payments 71,113 - 71,113 71,113 - 71,113 -
2.4 Customs duty - - - 86 - 86 (86) Not material difference < KETB 20
2.5 Dividend Tax - - - - - - -
2.6 Personal Income tax (Pay As You Earn "PAYE") - - - - - - -
2.7 Capital gains - - - - - - -
2.8 Value Add Tax (VAT) - - - 56 - 56 (56) Not material difference < KETB 20
2.9 Excise Tax - - - - - - -
2.10 Penalities - - - - - - -
2.11 Witholding tax on interests (foreign debt) - - - - - - -
2.12 Other material payments to ERCA - - - 52 - 52 (52) Not material difference < KETB 20
- - - - - - -
3.1 Free Equity - - - - - - -
3.2 Dividends from State Ow ned Companies - - - - - - -
3.3 Other material payments to MoFED - - - - - - -
4- Payment to State Owned Companies (SOC) - - - - - - -
4.1 Dividends from Mining Companies - - - - - - -
4.2 Other payments - - - - - - -
Total payments 8,278,827 (2,182,872) 6,095,955 5,629,360 466,789 6,096,149 (194)
B- Unilateral company disclosures 248,975 - 248,975 - - - 248,975
6- Regional State Mining Authority - - - - - - -
7- Regional State Tax Authority - - - - - - -
8- Social Contributions 248,975 - 248,975 - - - -
8.1 Voluntary Corporate Social Responsibility - - - - - -
8.2 Mandatory Social Responsibility 248,975 - 248,975 - - 248,975
Per Government Final
differenceCommentN° Description of Payment
Per Company
2- Payments to Ethiopian Revenues and Customs
Authority (ERCA)
3- Payments to Ministry of Finance and Economic
Development (MoFED)

EEITI Report for the year ended 7 July 2014
Moore Stephens LLP | P a g e 119
Company name: Falcon Petroleum Ltd Reporting period: 2013/14
Original Adjust Final Original Adjust Final
A- Direct Payments/Revenues 1,632,397 - 1,632,397 1,631,198 - 1,631,198 1,199
1- Payments to Ministry of Mines (MoM) 1,632,397 0 1,632,397 1,631,198 0 1,631,198 1,199
1.1 Royalties paid - - - - - - -
1.2 License Fees - - - - - - -
1.3 Penalties - - - - - - -
1.4 Land Rentals 1,632,397 - 1,632,397 1,631,198 - 1,631,198 1,199 Not material difference < KETB 20
1.5 Signature Bonus - - - - - - -
1.6 Production bonuses - - - - - - -
1.7 Sale of Petroleum Data Package - - - - - - -
1.8 Other material payments to Mining authority - - - - - - -
0 0 0 0 0 0 0
2.1 Income tax : Schedule C (Mining) - - - - - - -
2.2 Income tax : Schedule C (Normal) - - - - - - -
2.3 Withholding tax on payments - - - - - - -
2.4 Customs duty - - - - - - -
2.5 Dividend Tax - - - - - - -
2.6 Personal Income tax (Pay As You Earn "PAYE") - - - - - - -
2.7 Capital gains - - - - - - -
2.8 Value Add Tax (VAT) - - - - - - -
2.9 Excise Tax - - - - - - -
2.10 Penalities - - - - - - -
2.11 Witholding tax on interests (foreign debt) - - - - - - -
2.12 Other material payments to ERCA - - - - - - -
0 0 0 0 0 0 0
3.1 Free Equity - - - - - - -
3.2 Dividends from State Ow ned Companies - - - - - - -
3.3 Other material payments to MoFED - - - - - - -
4- Payment to State Owned Companies (SOC) 0 0 0 0 0 0 0
4.1 Dividends from Mining Companies - - - - - - -
4.2 Other payments - - - - - - -
Total payments 1,632,397 - 1,632,397 1,631,198 - 1,631,198 1,199
B- Unilateral company disclosures 3,154,500 - 3,154,500 - - - 3,154,500
6- Regional State Mining Authority 0 0 0 - - - -
7- Regional State Tax Authority 0 0 0 - - - -
8- Social Contributions 3,154,500 0 3,154,500 - - - -
8.1 Voluntary Corporate Social Responsibility - - - - - -
8.2 Mandatory Social Responsibility 3,154,500 - 3,154,500 - - 3,154,500
2- Payments to Ethiopian Revenues and Customs
Authority (ERCA)
3- Payments to Ministry of Finance and Economic
Development (MoFED)
Per Government Final
differenceCommentN° Description of Payment
Per Company

EEITI Report for the year ended 7 July 2014
Moore Stephens LLP | P a g e 120
Company name: NewAge Ethiopia Ltd Reporting period: 2013/14
Original Adjust Final Original Adjust Final
A- Direct Payments/Revenues 19,867,653 - 19,867,653 18,941,677 1,218,816 20,160,493 (292,840)
1- Payments to Ministry of Mines (MoM) 14,751,073 - 14,751,073 13,128,068 1,623,005 14,751,073 -
1.1 Royalties paid - - - - - - -
1.2 License Fees - - - - - - -
1.3 Penalties - - - - - - -
1.4 Land Rentals 11,596,573 - 11,596,573 10,320,952 1,275,621 11,596,573 -
1.5 Signature Bonus - - - - - - -
1.6 Production bonuses - - - - - - -
1.7 Sale of Petroleum Data Package - - - - - - -
1.8 Other material payments to Mining authority 3,154,500 - 3,154,500 2,807,116 347,384 3,154,500 -
5,116,580 - 5,116,580 5,813,609 (404,189) 5,409,420 (292,840)
2.1 Income tax : Schedule C (Mining) - - - - - - -
2.2 Income tax : Schedule C (Normal) 1,241,004 - 1,241,004 1,241,004 - 1,241,004 (0) Not material difference < KETB 20
2.3 Withholding tax on payments 3,875,576 - 3,875,576 3,875,576 - 3,875,576 (0) Not material difference < KETB 20
2.4 Customs duty - - - 99,900 - 99,900 (99,900) Tax not reported by the extractive company
2.5 Dividend Tax - - - - - - -
2.6 Personal Income tax (Pay As You Earn "PAYE") - - - - - - -
2.7 Capital gains - - - - - - -
2.8 Value Add Tax (VAT) - - - 99,629 - 99,629 (99,629) Tax not reported by the extractive company
2.9 Excise Tax - - - - - - -
2.10 Penalities - - - - - - -
2.11 Witholding tax on interests (foreign debt) - - - - - - -
2.12 Other material payments to ERCA - - - 497,500 (404,189) 93,311 (93,311) Tax not reported by the extractive company
- - - - - - -
3.1 Free Equity - - - - - - -
3.2 Dividends from State Ow ned Companies - - - - - - -
3.3 Other material payments to MoFED - - - - - - -
4- Payment to State Owned Companies (SOC) - - - - - - -
4.1 Dividends from Mining Companies - - - - - - -
4.2 Other payments - - - - - - -
Total payments 19,867,653 - 19,867,653 18,941,677 1,218,816 20,160,493 (292,840)
B- Unilateral company disclosures 5,660,476 - 5,660,476 - - - 5,660,476
6- Regional State Mining Authority - - - - - - -
7- Regional State Tax Authority - - - - - - -
8- Social Contributions 5,660,476 - 5,660,476 - - - -
8.1 Voluntary Corporate Social Responsibility - - - - - -
8.2 Mandatory Social Responsibility 5,660,476 - 5,660,476 - - 5,660,476
Per GovernmentFinal difference CommentN° Description of Payment
Per Company
2- Payments to Ethiopian Revenues and Customs
Authority (ERCA)
3- Payments to Ministry of Finance and Economic
Development (MoFED)

EEITI Report for the year ended 7 July 2014
Moore Stephens LLP | P a g e 121
Company name: MIDROC Gold Mine Plc Reporting period: 2013/14
Original Adjust Final Original Adjust Final
A- Direct Payments/Revenues 1,233,153,532 (1,816,734) 1,231,336,797 1,176,948,596 54,914,195 1,231,862,791 (525,994)
1- Payments to Ministry of Mines (MoM) 134,722,707 - 134,722,707 80,831,884 53,890,823 134,722,707 -
1.1 Royalties paid 134,719,807 - 134,719,807 80,831,884 53,887,923 134,719,807 -
1.2 License Fees 2,900 - 2,900 - 2,900 2,900 -
1.3 Penalties - - - - - - -
1.4 Land Rentals - - - - - - -
1,025,954,622 (1,816,734) 1,024,137,888 1,023,640,508 1,023,372 1,024,663,880 (525,993)
2.1 Income tax : Schedule C (Mining) 891,854,212 - 891,854,212 891,850,212 - 891,850,212 4,000 Not material difference < KETB 20
2.2 Income tax : Schedule C (Normal) - - - - - - -
2.3 Withholding tax on payments 4,479,624 (1,888,350) 2,591,274 2,951,585 - 2,951,585 (360,312) Tax not reported by the extractive company
2.4 Customs duty 2,811 - 2,811 11,417 - 11,417 (8,605) Detail of expenditure could not be used
2.5 Dividend Tax 118,353,850 - 118,353,850 118,353,850 - 118,353,850 -
2.6 Personal Income tax (Pay As You Earn "PAYE") 6,970,971 16,840 6,987,810 6,987,810 - 6,987,810 -
2.7 Capital gains - - - - - - -
2.8 Value Add Tax (VAT) 2,625,697 - 2,625,697 6,841 2,625,697 2,632,538 (6,841) Detail of expenditure could not be used
2.9 Excise Tax - - - - - - -
2.10 Penalities 16,840 (16,840) - - - - -
2.11 Witholding tax on interests (foreign debt) - - - - - - -
2.12 Other material payments to ERCA 1,650,618 71,616 1,722,234 3,478,794 (1,602,325) 1,876,469 (154,235) Tax not reported by the extractive company
72,476,203 - 72,476,203 72,476,204 - 72,476,204 (1)
3.1 Free Equity 72,476,203 - 72,476,203 72,476,204 - 72,476,204 (1) Not material difference < KETB 20
4- Payment to State Owned Companies (SOC) - - - - - - -
Total payments 1,233,153,532 (1,816,734) 1,231,336,797 1,176,948,596 54,914,195 1,231,862,791 (525,994)
B- Unilateral company disclosures 28,718,771 - 28,718,771 - - - 28,522,181
6- Regional State Mining Authority 116,062 - 116,062 - - - -
6.1 Royalties paid - - - - - -
6.2 License Fees - - - - - -
6.3 Penalties - - - - - -
6.4 Land Rentals 116,062 - 116,062 - - 116,062
7- Regional State Tax Authority 25,630,721 - 25,630,721 - - - 80,527
7.1 Income tax : Schedule C (Normal) - - - - - -
7.2 Withholding tax on payments 80,527 - 80,527 - - 80,527
7.3 Personal Income tax (Pay As You Earn "PAYE") 25,550,193 - 25,550,193 - - 25,550,193
8- Social Contributions 2,971,988 - 2,971,988 - - - 2,971,988
8.1 Voluntary Corporate Social Responsibility 2,971,988 - 2,971,988 - - 2,971,988
8.2 Mandatory Social Responsibility - - - - - -
2- Payments to Ethiopian Revenues and Customs
Authority (ERCA)
3- Payments to Ministry of Finance and Economic
Development (MoFED)
Per Government Final
differenceCommentN° Description of Payment
Per Company

EEITI Report for the year ended 7 July 2014
Moore Stephens LLP | P a g e 122
Company name: Ethiopian Mineral Development Sc Reporting period: 2013/14
Original Adjust Final Original Adjust Final
A- Direct Payments/Revenues 21,795,747 4,347,171 26,142,918 31,589,580 (381,719) 31,207,861 (5,064,942)
1- Payments to Ministry of Mines (MoM) 30,472 4,000,000 4,030,472 2,400,000 1,630,472 4,030,472 -
1.1 Royalties paid - 4,000,000 4,000,000 2,400,000 1,600,000 4,000,000 -
1.2 License Fees 6,755 - 6,755 - 6,755 6,755 -
1.3 Penalties - - - - - - -
1.4 Land Rentals 23,717 - 23,717 - 23,717 23,717 -
1.5 Signature Bonus - - - - - - -
1.6 Production bonuses - - - - - - -
21,765,275 347,171 22,112,446 24,123,348 (2,012,192) 22,111,156 1,290
2.1 Income tax : Schedule C (Mining) 14,819,845 - 14,819,845 14,819,845 - 14,819,845 -
2.2 Income tax : Schedule C (Normal) - - - - - - -
2.3 Withholding tax on payments 606,831 - 606,831 606,831 - 606,831 -
2.4 Customs duty 390,013 - 390,013 177,970 - 177,970 212,043 Detail of expenditure could not be used
2.5 Dividend Tax - - - - - - -
2.6 Personal Income tax (Pay As You Earn "PAYE") 5,948,587 - 5,948,587 5,948,587 - 5,948,587 -
2.7 Capital gains - - - - - - -
2.8 Value Add Tax (VAT) - 269,652 269,652 272,551 - 272,551 (2,899) Not material difference < KETB 20
2.9 Excise Tax - - - - - - -
2.10 Penalities - - - - - - -
2.11 Witholding tax on interests (foreign debt) - - - - - - -
2.12 Other material payments to ERCA - 77,519 77,519 2,297,565 (2,012,192) 285,373 (207,854) Detail of expenditure could not be used
- - - 5,066,232 - 5,066,232 (5,066,232)
3.1 Free Equity - - - - - - -
3.2 Dividends from State Ow ned Companies - - - 5,066,232 - 5,066,232 (5,066,232) Tax not reported by the extractive company
4- Payment to State Owned Companies (SOC) - - - - - - -
Total payments 21,795,747 4,347,171 26,142,918 31,589,580 (381,719) 31,207,861 (5,064,942)
B- Unilateral company disclosures 1,100,611 - 1,100,611 - - - 765,631
6- Regional State Mining Authority 721,373 - 721,373 - - - 385,243
6.1 Royalties paid 385,243 - 385,243 - - 385,243
6.2 License Fees 1,150 - 1,150 - - 1,150
6.3 Penalties - - - - - -
6.4 Land Rentals 334,980 - 334,980 - - 334,980
7- Regional State Tax Authority - - - - - - -
8- Social Contributions 379,239 - 379,239 - - - 379,239
8.1 Voluntary Corporate Social Responsibility 379,239 - 379,239 - - 379,239
2- Payments to Ethiopian Revenues and Customs
Authority (ERCA)
3- Payments to Ministry of Finance and Economic
Development (MoFED)
Per Government Final
differenceCommentN° Description of Payment
Per Company

EEITI Report for the year ended 7 July 2014
Moore Stephens LLP | P a g e 123
Company name: Abijata-Shalla Soda Ash Sc Reporting period: 2013/14
Original Adjust Final Original Adjust Final
A- Direct Payments/Revenues 5,189,142 (3,194,179) 1,994,962 3,949,511 (1,954,549) 1,994,962 -
1- Payments to Ministry of Mines (MoM) 1,994,962 - 1,994,962 - 1,994,962 1,994,962 -
1.1 Royalties paid 1,994,962 - 1,994,962 - 1,994,962 1,994,962 -
1.2 License Fees - - - - - - -
1.3 Penalties - - - - - - -
1.4 Land Rentals - - - - - - -
1.5 Signature Bonus - - - - - - -
1.6 Production bonuses - - - - - - -
3,194,179 (3,194,179) - 3,949,511 (3,949,511) - -
2.1 Income tax : Schedule C (Mining) - - - 200 (200) - -
2.2 Income tax : Schedule C (Normal) 131,588 (131,588) - 131,588 (131,588) - -
2.3 Withholding tax on payments 141,643 (141,643) - 141,643 (141,643) - -
2.4 Customs duty - - - 182,219 (182,219) - -
2.5 Dividend Tax - - - - - - -
2.6 Personal Income tax (Pay As You Earn "PAYE") 166,887 (166,887) - 166,887 (166,887) - -
2.7 Capital gains - - - - - - -
2.8 Value Add Tax (VAT) 2,754,062 (2,754,062) - 3,023,193 (3,023,193) - -
2.9 Excise Tax - - - - - - -
2.10 Penalities - - - 200 (200) - -
2.11 Witholding tax on interests (foreign debt) - - - - - - -
2.12 Other material payments to ERCA - - - 303,582 (303,582) - -
- - - - - - -
4- Payment to State Owned Companies (SOC) - - - - - - -
Total payments 5,189,142 (3,194,179) 1,994,962 3,949,511 (1,954,549) 1,994,962 -
B- Unilateral company disclosures 1,059,254 (1,039,604) 19,650 - - - -
6- Regional State Mining Authority 19,650 - 19,650 - - - -
6.1 Royalties paid - - - - - -
6.2 License Fees - - - - - -
6.3 Penalties - - - - - -
6.4 Land Rentals 19,650 - 19,650 - - 19,650
7- Regional State Tax Authority 1,034,604 (1,034,604) - - - - -
7.1 Income tax : Schedule C (Normal) - - - - - -
7.2 Withholding tax on payments - - - - - -
7.3 Personal Income tax (Pay As You Earn "PAYE") 1,034,604 (1,034,604) - - - -
8- Social Contributions 5,000 (5,000) - - - - -
8.1 Voluntary Corporate Social Responsibility 5,000 (5,000) - - - -
Per GovernmentFinal difference CommentN° Description of Payment
Per Company
2- Payments to Ethiopian Revenues and Customs
Authority (ERCA)
3- Payments to Ministry of Finance and Economic
Development (MoFED)

EEITI Report for the year ended 7 July 2014
Moore Stephens LLP | P a g e 124
Company name: Pioneer Cement Manufacturing Plc Reporting period: 2013/14
Original Adjust Final Original Adjust Final
A- Direct Payments/Revenues 38,550,378 204,911 38,755,289 32,688,221 548,477 33,236,698 5,518,591
1- Payments to Ministry of Mines (MoM) 1,127,161 - 1,127,161 578,684 548,477 1,127,161 -
1.1 Royalties paid 1,127,161 - 1,127,161 578,684 548,477 1,127,161 -
1.2 License Fees - - - - - - -
1.3 Penalties - - - - - - -
1.4 Land Rentals - - - - - - -
1.5 Signature Bonus - - - - - - -
1.6 Production bonuses - - - - - - -
1.7 Sale of Petroleum Data Package - - - - - - -
1.8 Other material payments to Mining authority - - - - - - -
37,423,217 204,911 37,628,128 32,109,537 - 32,109,537 5,518,591
2.1 Income tax : Schedule C (Mining) - - - - - - -
2.2 Income tax : Schedule C (Normal) 10,326,076 - 10,326,076 10,326,026 - 10,326,026 50 Not material difference < KETB 20
2.3 Withholding tax on payments 3,476,310 - 3,476,310 3,457,794 - 3,457,794 18,516 Not material difference < KETB 20
2.4 Customs duty - 70,251 70,251 77,516 - 77,516 (7,264) Detail of expenditure could not be used
2.5 Dividend Tax - - - - - - -
2.6 Personal Income tax (Pay As You Earn "PAYE") - - - - - - -
2.7 Capital gains - - - - - - -
2.8 Value Add Tax (VAT) 23,620,831 69,542 23,690,373 18,144,914 - 18,144,914 5,545,458 Detail of expenditure could not be used
2.9 Excise Tax - - - - - - -
2.10 Penalities - - - - - - -
2.11 Witholding tax on interests (foreign debt) - - - - - - -
2.12 Other material payments to ERCA - 65,117 65,117 103,286 - 103,286 (38,169) Detail of expenditure could not be used
- - - - - - -
4- Payment to State Owned Companies (SOC) - - - - - - -
Total payments 38,550,378 204,911 38,755,289 32,688,221 548,477 33,236,698 5,518,591
B- Unilateral company disclosures 878,356 - 878,356 - - - 878,356
6- Regional State Mining Authority 278,356 - 278,356 - - - 278,356
6.1 Royalties paid 278,356 - 278,356 - - 278,356
7- Regional State Tax Authority - - - - - - -
8- Social Contributions 600,000 - 600,000 - - - 600,000
8.1 Voluntary Corporate Social Responsibility 600,000 - 600,000 - - 600,000
8.2 Mandatory Social Responsibility - - - - - -
Per Government Final
differenceCommentN° Description of Payment
Per Company
2- Payments to Ethiopian Revenues and Customs
Authority (ERCA)
3- Payments to Ministry of Finance and Economic
Development (MoFED)

EEITI Report for the year ended 7 July 2014
Moore Stephens LLP | P a g e 125
Company name: Afar Salt Production Sc Reporting period: 2013/14
Original Adjust Final Original Adjust Final
A- Direct Payments/Revenues 6,010,417 - 6,010,417 5,653,282 356,538 6,009,821 596
1- Payments to Ministry of Mines (MoM) 1,008,302 - 1,008,302 604,981 403,321 1,008,302 -
1.1 Royalties paid 1,008,302 - 1,008,302 604,981 403,321 1,008,302 -
1.2 License Fees - - - - - - -
1.3 Penalties - - - - - - -
1.4 Land Rentals - - - - - - -
1.5 Signature Bonus - - - - - - -
1.6 Production bonuses - - - - - - -
1.7 Sale of Petroleum Data Package - - - - - - -
1.8 Other material payments to Mining authority - - - - - - -
5,002,115 - 5,002,115 5,048,301 (46,782) 5,001,519 596
2.1 Income tax : Schedule C (Mining) 875,148 - 875,148 875,148 - 875,148 -
2.2 Income tax : Schedule C (Normal) - - - - - -
2.3 Withholding tax on payments 170,477 - 170,477 170,481 - 170,481 (4) Not material difference < KETB 20
2.4 Customs duty 58,781 - 58,781 58,781 - 58,781 (0) Not material difference < KETB 20
2.5 Dividend Tax - - - - - -
2.6 Personal Income tax (Pay As You Earn "PAYE") 387,508 - 387,508 387,508 - 387,508 -
2.7 Capital gains - - - - - -
2.8 Value Add Tax (VAT) 3,436,222 38,208 3,474,430 3,474,429 - 3,474,429 0 Not material difference < KETB 20
2.9 Excise Tax - - - - - -
2.10 Penalities - - - - - -
2.11 Witholding tax on interests (foreign debt) - - - - - -
2.12 Other material payments to ERCA 73,979 (38,208) 35,771 81,953 (46,782) 35,171 600 Not material difference < KETB 20
- - - - - - -
4- Payment to State Owned Companies (SOC) - - - - - - -
Total payments 6,010,417 - 6,010,417 5,653,282 356,538 6,009,821 596
B- Unilateral company disclosures 2,812,730 - 2,812,730 - - - 647,230
6- Regional State Mining Authority 4,000 - 4,000 - - - -
6.1 Royalties paid - - - - - -
6.2 License Fees - - - - - -
6.3 Penalties - - - - - -
6.4 Land Rentals 4,000 - 4,000 - - 4,000
7- Regional State Tax Authority 2,654,796 - 2,654,796 - - - -
7.1 Income tax : Schedule C (Normal) - - - - - -
7.2 Withholding tax on payments - - - - - -
7.3 Personal Income tax (Pay As You Earn "PAYE") 493,296 - 493,296 - - 493,296
7.4 Excise duty 2,161,500 - 2,161,500 - - 2,161,500
8- Social Contributions 153,934 - 153,934 - - - 153,934
8.1 Voluntary Corporate Social Responsibility 153,934 - 153,934 - - 153,934
Per GovernmentFinal difference CommentN° Description of Payment
Per Company
2- Payments to Ethiopian Revenues and Customs
Authority (ERCA)
3- Payments to Ministry of Finance and Economic
Development (MoFED)
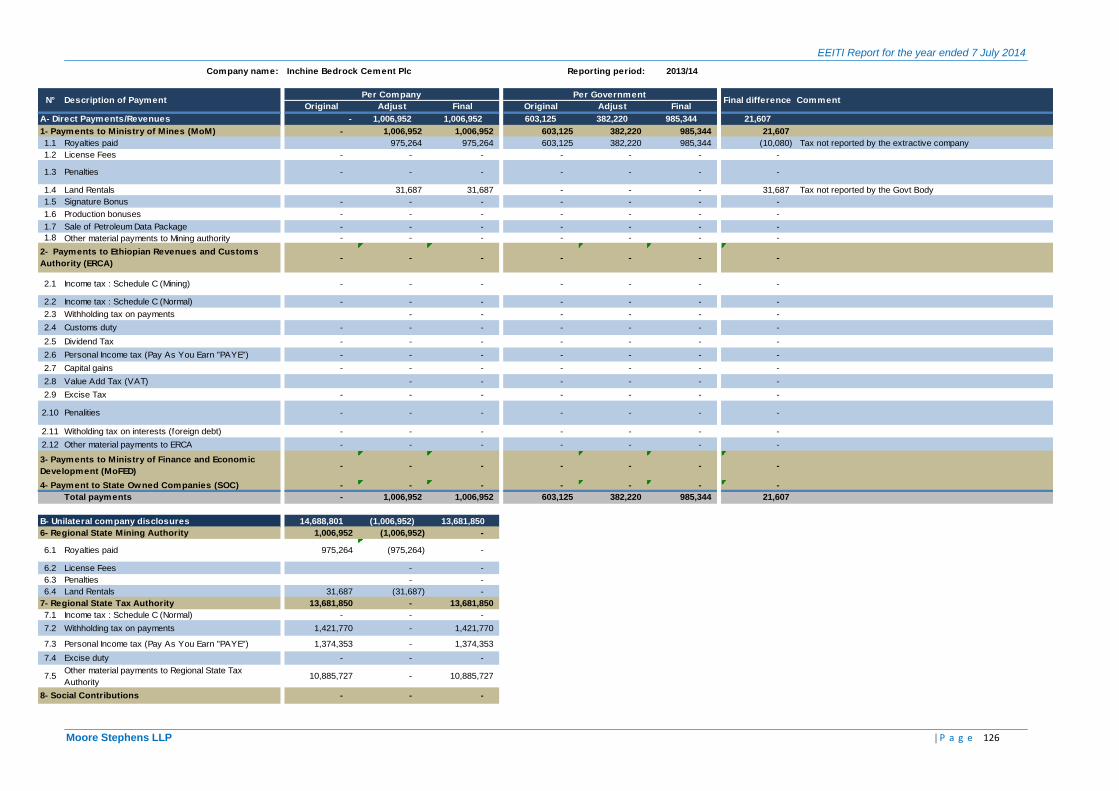
EEITI Report for the year ended 7 July 2014
Moore Stephens LLP | P a g e 126
Company name: Inchine Bedrock Cement Plc Reporting period: 2013/14
Original Adjust Final Original Adjust Final
A- Direct Payments/Revenues - 1,006,952 1,006,952 603,125 382,220 985,344 21,607
1- Payments to Ministry of Mines (MoM) - 1,006,952 1,006,952 603,125 382,220 985,344 21,607
1.1 Royalties paid 975,264 975,264 603,125 382,220 985,344 (10,080) Tax not reported by the extractive company
1.2 License Fees - - - - - - -
1.3 Penalties - - - - - - -
1.4 Land Rentals 31,687 31,687 - - - 31,687 Tax not reported by the Govt Body
1.5 Signature Bonus - - - - - - -
1.6 Production bonuses - - - - - - -
1.7 Sale of Petroleum Data Package - - - - - - -
1.8 Other material payments to Mining authority - - - - - - -
- - - - - - -
2.1 Income tax : Schedule C (Mining) - - - - - - -
2.2 Income tax : Schedule C (Normal) - - - - - - -
2.3 Withholding tax on payments - - - - - -
2.4 Customs duty - - - - - - -
2.5 Dividend Tax - - - - - - -
2.6 Personal Income tax (Pay As You Earn "PAYE") - - - - - - -
2.7 Capital gains - - - - - - -
2.8 Value Add Tax (VAT) - - - - - -
2.9 Excise Tax - - - - - - -
2.10 Penalities - - - - - - -
2.11 Witholding tax on interests (foreign debt) - - - - - - -
2.12 Other material payments to ERCA - - - - - - -
- - - - - - -
4- Payment to State Owned Companies (SOC) - - - - - - -
Total payments - 1,006,952 1,006,952 603,125 382,220 985,344 21,607
B- Unilateral company disclosures 14,688,801 (1,006,952) 13,681,850 - - - 1,374,353
6- Regional State Mining Authority 1,006,952 (1,006,952) - - - - -
6.1 Royalties paid 975,264 (975,264) - - - -
6.2 License Fees - - - - -
6.3 Penalties - - - - -
6.4 Land Rentals 31,687 (31,687) - - - -
7- Regional State Tax Authority 13,681,850 - 13,681,850 - - - 1,421,770
7.1 Income tax : Schedule C (Normal) - - - - - -
7.2 Withholding tax on payments 1,421,770 - 1,421,770 - - 1,421,770
7.3 Personal Income tax (Pay As You Earn "PAYE") 1,374,353 - 1,374,353 - - 1,374,353
7.4 Excise duty - - - - - -
7.5Other material payments to Regional State Tax
Authority10,885,727 - 10,885,727 - - 10,885,727
8- Social Contributions - - - - - - -
2- Payments to Ethiopian Revenues and Customs
Authority (ERCA)
3- Payments to Ministry of Finance and Economic
Development (MoFED)
Per GovernmentFinal difference CommentN° Description of Payment
Per Company

EEITI Report for the year ended 7 July 2014
Moore Stephens LLP | P a g e 127
Company name: East Cement Sc Reporting period: 2013/14
Original Adjust Final Original Adjust Final
A- Direct Payments/Revenues 1,104,584 644,104 1,748,688 50,153,183 299,197 50,452,380 (48,703,692)
1- Payments to Ministry of Mines (MoM) 1,104,584 (211,617) 892,967 535,780 357,187 892,967 0
1.1 Royalties paid 1,104,584 (211,617) 892,967 535,780 357,187 892,967 0 Not material difference < KETB 20
1.2 License Fees - - - - - - -
1.3 Penalties - - - - - - -
1.4 Land Rentals - - - - - - -
1.5 Signature Bonus - - - - - - -
1.6 Production bonuses - - - - - - -
1.7 Sale of Petroleum Data Package - - - - - - -
1.8 Other material payments to Mining authority - - - - - - -
- 855,721 855,721 49,617,403 (57,990) 49,559,413 (48,703,692)
2.1 Income tax : Schedule C (Mining) - - - - - - -
2.2 Income tax : Schedule C (Normal) - - - - - - -
2.3 Withholding tax on payments - 681,420 681,420 681,420 - 681,420 -
2.4 Customs duty - - - 1,310,166 - 1,310,166 (1,310,166) Tax not reported by the extractive company
2.5 Dividend Tax - - - - - - -
2.6 Personal Income tax (Pay As You Earn "PAYE") - 174,300 174,300 174,300 - 174,300 -
2.7 Capital gains - - - - - - -
2.8 Value Add Tax (VAT) - - - 46,985,347 - 46,985,347 (46,985,347) Tax not reported by the extractive company
2.9 Excise Tax - - - - - - -
2.10 Penalities - - - - - - -
2.11 Witholding tax on interests (foreign debt) - - - - - - -
2.12 Other material payments to ERCA - - - 466,169 (57,990) 408,179 (408,179) Tax not reported by the extractive company
- - - - - - -
4- Payment to State Owned Companies (SOC) - - - - - - -
Total payments 1,104,584 644,104 1,748,688 50,153,183 299,197 50,452,380 (48,703,692)
B- Unilateral company disclosures 462,377 - 462,377 - - - 99,582
6- Regional State Mining Authority 462,377 - 462,377 - - - 99,582
6.1 Royalties paid 99,582 - 99,582 - - 99,582
6.2 License Fees - - - - - -
6.3 Penalties - - - - - -
6.4 Land Rentals 362,795 - 362,795 - - 362,795
7- Regional State Tax Authority - - - - - - -
8- Social Contributions - - - - - - -
2- Payments to Ethiopian Revenues and Customs
Authority (ERCA)
3- Payments to Ministry of Finance and Economic
Development (MoFED)
Per GovernmentFinal difference CommentN° Description of Payment
Per Company
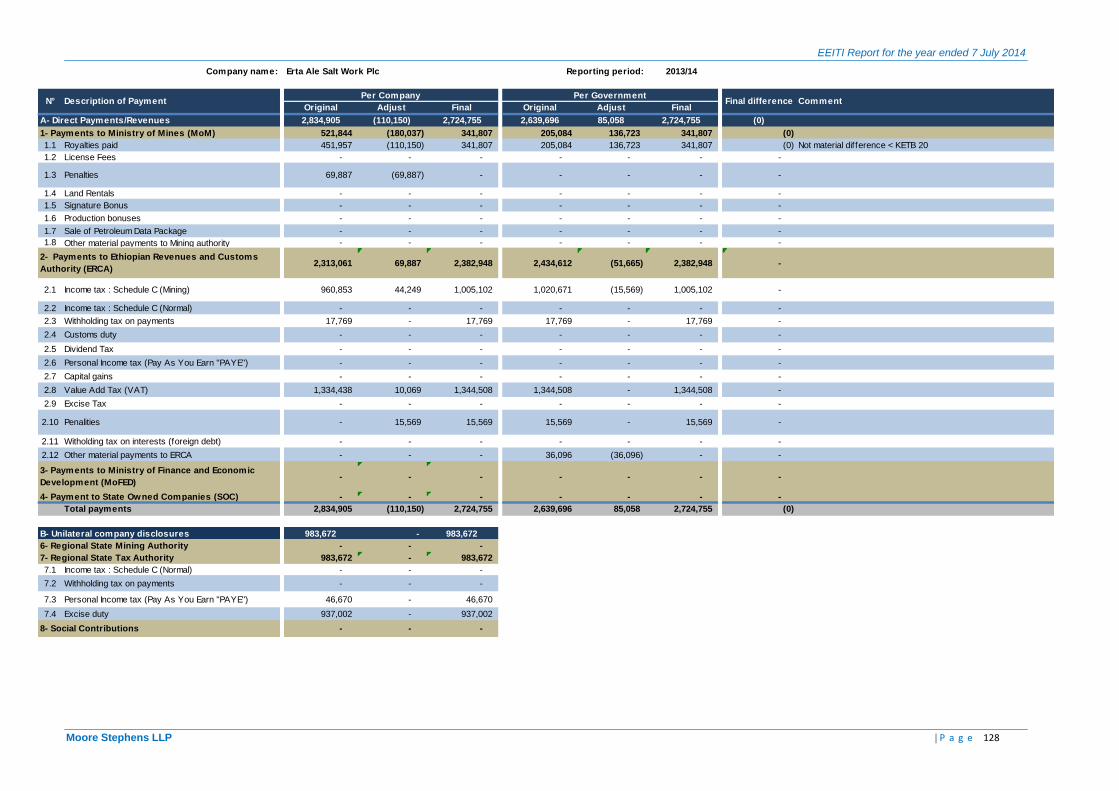
EEITI Report for the year ended 7 July 2014
Moore Stephens LLP | P a g e 128
Company name: Erta Ale Salt Work Plc Reporting period: 2013/14
Original Adjust Final Original Adjust Final
A- Direct Payments/Revenues 2,834,905 (110,150) 2,724,755 2,639,696 85,058 2,724,755 (0)
1- Payments to Ministry of Mines (MoM) 521,844 (180,037) 341,807 205,084 136,723 341,807 (0)
1.1 Royalties paid 451,957 (110,150) 341,807 205,084 136,723 341,807 (0) Not material difference < KETB 20
1.2 License Fees - - - - - - -
1.3 Penalties 69,887 (69,887) - - - - -
1.4 Land Rentals - - - - - - -
1.5 Signature Bonus - - - - - - -
1.6 Production bonuses - - - - - - -
1.7 Sale of Petroleum Data Package - - - - - - -
1.8 Other material payments to Mining authority - - - - - - -
2,313,061 69,887 2,382,948 2,434,612 (51,665) 2,382,948 -
2.1 Income tax : Schedule C (Mining) 960,853 44,249 1,005,102 1,020,671 (15,569) 1,005,102 -
2.2 Income tax : Schedule C (Normal) - - - - - - -
2.3 Withholding tax on payments 17,769 - 17,769 17,769 - 17,769 -
2.4 Customs duty - - - - - - -
2.5 Dividend Tax - - - - - - -
2.6 Personal Income tax (Pay As You Earn "PAYE") - - - - - - -
2.7 Capital gains - - - - - - -
2.8 Value Add Tax (VAT) 1,334,438 10,069 1,344,508 1,344,508 - 1,344,508 -
2.9 Excise Tax - - - - - - -
2.10 Penalities - 15,569 15,569 15,569 - 15,569 -
2.11 Witholding tax on interests (foreign debt) - - - - - - -
2.12 Other material payments to ERCA - - - 36,096 (36,096) - -
- - - - - - -
4- Payment to State Owned Companies (SOC) - - - - - - -
Total payments 2,834,905 (110,150) 2,724,755 2,639,696 85,058 2,724,755 (0)
B- Unilateral company disclosures 983,672 - 983,672 - - - 46,670
6- Regional State Mining Authority - - - - - - -
7- Regional State Tax Authority 983,672 - 983,672 - - - -
7.1 Income tax : Schedule C (Normal) - - - - - -
7.2 Withholding tax on payments - - - - - -
7.3 Personal Income tax (Pay As You Earn "PAYE") 46,670 - 46,670 - - 46,670
7.4 Excise duty 937,002 - 937,002 - - 937,002
8- Social Contributions - - - - - - -
Per GovernmentFinal difference CommentN° Description of Payment
Per Company
2- Payments to Ethiopian Revenues and Customs
Authority (ERCA)
3- Payments to Ministry of Finance and Economic
Development (MoFED)

EEITI Report for the year ended 7 July 2014
Moore Stephens LLP | P a g e 129
Company name: Afdera Salt Producing Plc Reporting period: 2013/14
Original Adjust Final Original Adjust Final
A- Direct Payments/Revenues 2,955,658 - 2,955,658 2,871,873 90,784 2,962,657 (6,998)
1- Payments to Ministry of Mines (MoM) 313,646 - 313,646 188,188 125,459 313,646 -
1.1 Royalties paid 313,646 - 313,646 188,188 125,459 313,646 -
1.2 License Fees - - - - - - -
1.3 Penalties - - - - - - -
1.4 Land Rentals - - - - - - -
1.5 Signature Bonus - - - - - - -
1.6 Production bonuses - - - - - - -
1.7 Sale of Petroleum Data Package - - - - - - -
1.8 Other material payments to Mining authority - - - - - - -
2,642,012 - 2,642,012 2,683,685 (34,675) 2,649,010 (6,998)
2.1 Income tax : Schedule C (Mining) 1,131,348 - 1,131,348 1,131,348 - 1,131,348 -
2.2 Income tax : Schedule C (Normal) - - - - - - -
2.3 Withholding tax on payments 2,296 202 2,498 2,498 - 2,498 0 Not material difference < KETB 20
2.4 Customs duty - - - - - - -
2.5 Dividend Tax 301,795 10,938 312,733 312,733 - 312,733 0 Not material difference < KETB 20
2.6 Personal Income tax (Pay As You Earn "PAYE") 56,030 81 56,111 60,909 - 60,909 (4,798) Tax not reported by the extractive company
2.7 Capital gains - - - - - - -
2.8 Value Add Tax (VAT) 1,134,999 4,323 1,139,322 1,139,322 - 1,139,322 0 Not material difference < KETB 20
2.9 Excise Tax - - - - - - -
2.10 Penalities 15,544 (15,544) (0) 2,201 - 2,201 (2,201) Tax not reported by the extractive company
2.11 Witholding tax on interests (foreign debt) - - - - - - -
2.12 Other material payments to ERCA - - - 34,675 (34,675) - -
- - - - - - -
4- Payment to State Owned Companies (SOC) - - - - - - -
Total payments 2,955,658 - 2,955,658 2,871,873 90,784 2,962,657 (6,998)
B- Unilateral company disclosures 677,986 - 677,986 - - - 130,230
6- Regional State Mining Authority - - - - - - -
7- Regional State Tax Authority 607,726 - 607,726 - - - -
7.1 Income tax : Schedule C (Normal) - - - - - -
7.2 Withholding tax on payments - - - - - -
7.3 Personal Income tax (Pay As You Earn "PAYE") 59,970 - 59,970 - - 59,970
7.4 Excise duty 547,756 - 547,756 - - 547,756
8- Social Contributions 70,260 - 70,260 - - - 70,260
8.1 Voluntary Corporate Social Responsibility 70,260 - 70,260 - - 70,260
Per Government Final
differenceCommentN° Description of Payment
Per Company
2- Payments to Ethiopian Revenues and Customs
Authority (ERCA)
3- Payments to Ministry of Finance and Economic
Development (MoFED)
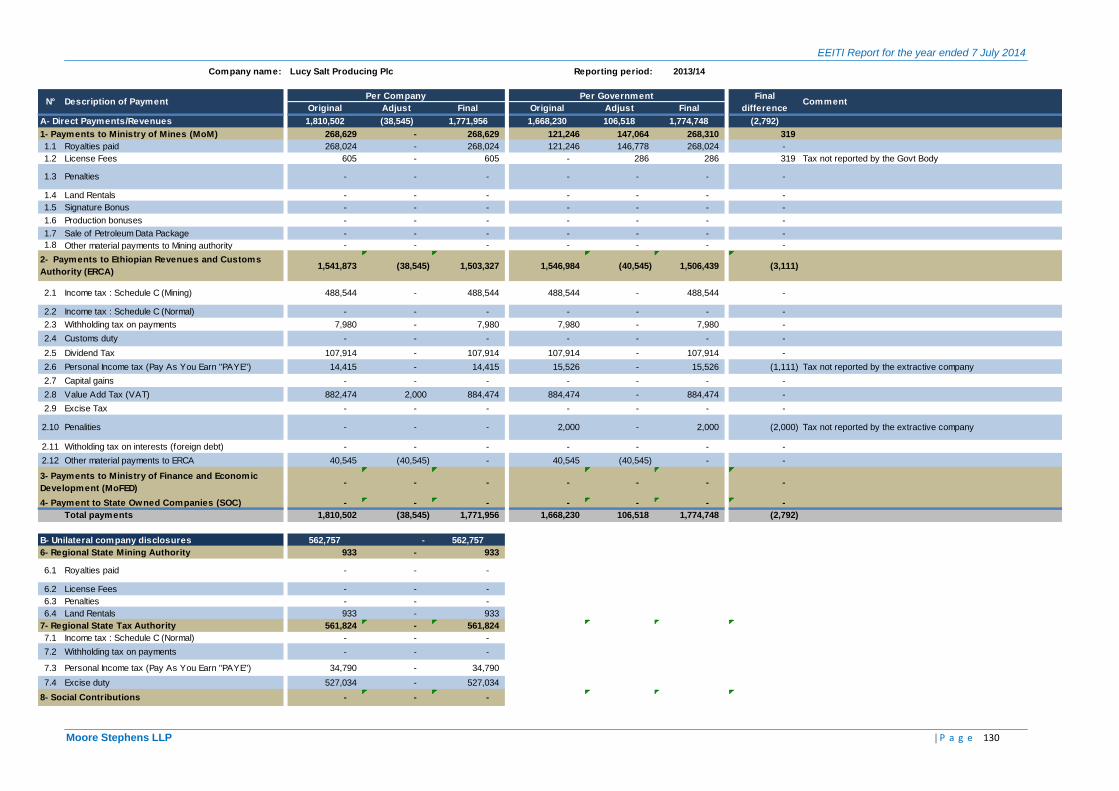
EEITI Report for the year ended 7 July 2014
Moore Stephens LLP | P a g e 130
Company name: Lucy Salt Producing Plc Reporting period: 2013/14
Original Adjust Final Original Adjust Final
A- Direct Payments/Revenues 1,810,502 (38,545) 1,771,956 1,668,230 106,518 1,774,748 (2,792)
1- Payments to Ministry of Mines (MoM) 268,629 - 268,629 121,246 147,064 268,310 319
1.1 Royalties paid 268,024 - 268,024 121,246 146,778 268,024 -
1.2 License Fees 605 - 605 - 286 286 319 Tax not reported by the Govt Body
1.3 Penalties - - - - - - -
1.4 Land Rentals - - - - - - -
1.5 Signature Bonus - - - - - - -
1.6 Production bonuses - - - - - - -
1.7 Sale of Petroleum Data Package - - - - - - -
1.8 Other material payments to Mining authority - - - - - - -
1,541,873 (38,545) 1,503,327 1,546,984 (40,545) 1,506,439 (3,111)
2.1 Income tax : Schedule C (Mining) 488,544 - 488,544 488,544 - 488,544 -
2.2 Income tax : Schedule C (Normal) - - - - - - -
2.3 Withholding tax on payments 7,980 - 7,980 7,980 - 7,980 -
2.4 Customs duty - - - - - - -
2.5 Dividend Tax 107,914 - 107,914 107,914 - 107,914 -
2.6 Personal Income tax (Pay As You Earn "PAYE") 14,415 - 14,415 15,526 - 15,526 (1,111) Tax not reported by the extractive company
2.7 Capital gains - - - - - - -
2.8 Value Add Tax (VAT) 882,474 2,000 884,474 884,474 - 884,474 -
2.9 Excise Tax - - - - - - -
2.10 Penalities - - - 2,000 - 2,000 (2,000) Tax not reported by the extractive company
2.11 Witholding tax on interests (foreign debt) - - - - - - -
2.12 Other material payments to ERCA 40,545 (40,545) - 40,545 (40,545) - -
- - - - - - -
4- Payment to State Owned Companies (SOC) - - - - - - -
Total payments 1,810,502 (38,545) 1,771,956 1,668,230 106,518 1,774,748 (2,792)
B- Unilateral company disclosures 562,757 - 562,757 - - - 34,790
6- Regional State Mining Authority 933 - 933 - - - -
6.1 Royalties paid - - - - - -
6.2 License Fees - - - - - -
6.3 Penalties - - - - - -
6.4 Land Rentals 933 - 933 - - 933
7- Regional State Tax Authority 561,824 - 561,824 - - - -
7.1 Income tax : Schedule C (Normal) - - - - - -
7.2 Withholding tax on payments - - - - - -
7.3 Personal Income tax (Pay As You Earn "PAYE") 34,790 - 34,790 - - 34,790
7.4 Excise duty 527,034 - 527,034 - - 527,034
8- Social Contributions - - - - - - -
Per Government Final
differenceCommentN° Description of Payment
Per Company
2- Payments to Ethiopian Revenues and Customs
Authority (ERCA)
3- Payments to Ministry of Finance and Economic
Development (MoFED)

EEITI Report for the year ended 7 July 2014
Moore Stephens LLP | P a g e 131
Company name: ETNO Mining Plc Reporting period: 2013/14
Original Adjust Final Original Adjust Final
A- Direct Payments/Revenues - - - 96,146 53,158 149,304 (149,304)
1- Payments to Ministry of Mines (MoM) - - - 79,736 53,158 132,894 (132,894)
1.1 Royalties paid - - 79,736 53,158 132,894 (132,894) Reporting template not submitted by the extractive company
1.2 License Fees - - - - -
1.3 Penalties - - - - -
1.4 Land Rentals - - - - -
1.5 Signature Bonus - - - - -
1.6 Production bonuses - - - - -
1.7 Sale of Petroleum Data Package - - - - -
1.8 Other material payments to Mining authority - - - - -
- - - 16,410 - 16,410 (16,410)
2.1 Income tax : Schedule C (Mining) - - - - -
2.2 Income tax : Schedule C (Normal) - - - - -
2.3 Withholding tax on payments - - 16,410 - 16,410 (16,410) Reporting template not submitted by the extractive company
2.4 Customs duty - - - - -
2.5 Dividend Tax - - - - -
2.6 Personal Income tax (Pay As You Earn "PAYE") - - - - -
2.7 Capital gains - - - - -
2.8 Value Add Tax (VAT) - - - - -
2.9 Excise Tax - - - - -
2.10 Penalities - - - - -
2.11 Witholding tax on interests (foreign debt) - - - - -
2.12 Other material payments to ERCA - - - - -
- - - - - - -
3.1 Free Equity - - - - -
3.2 Dividends from State Ow ned Companies - - - - -
3.3 Other material payments to MoFED - - - - -
4- Payment to State Owned Companies (SOC) - - - - - - -
4.1 Dividends from Mining Companies - - - - -
4.2 Other payments - - - - -
Total payments - - - 96,146 53,158 149,304 (149,304)
B- Unilateral company disclosures - - - - - - -
6- Regional State Mining Authority - - - - - - -
7- Regional State Tax Authority - - - - - - -
8- Social Contributions - - - - - - -
2- Payments to Ethiopian Revenues and Customs
Authority (ERCA)
3- Payments to Ministry of Finance and Economic
Development (MoFED)
Per GovernmentFinal difference CommentN° Description of Payment
Per Company
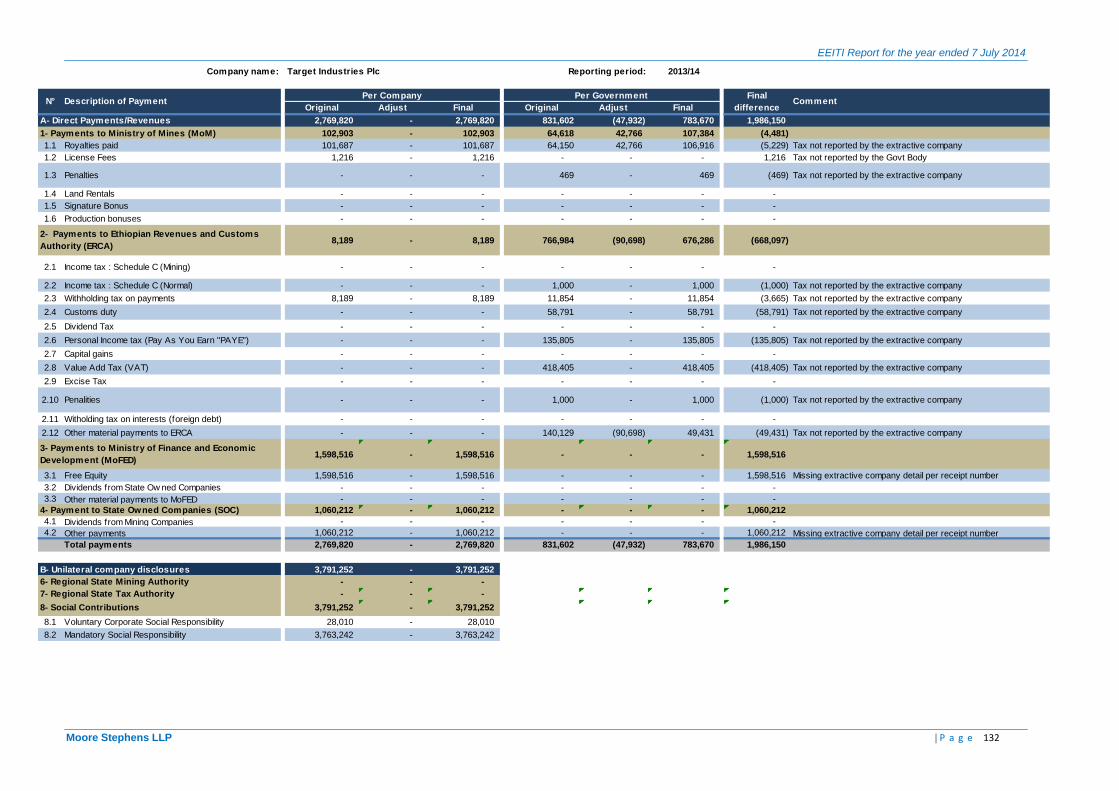
EEITI Report for the year ended 7 July 2014
Moore Stephens LLP | P a g e 132
Company name: Target Industries Plc Reporting period: 2013/14
Original Adjust Final Original Adjust Final
A- Direct Payments/Revenues 2,769,820 - 2,769,820 831,602 (47,932) 783,670 1,986,150
1- Payments to Ministry of Mines (MoM) 102,903 - 102,903 64,618 42,766 107,384 (4,481)
1.1 Royalties paid 101,687 - 101,687 64,150 42,766 106,916 (5,229) Tax not reported by the extractive company
1.2 License Fees 1,216 - 1,216 - - - 1,216 Tax not reported by the Govt Body
1.3 Penalties - - - 469 - 469 (469) Tax not reported by the extractive company
1.4 Land Rentals - - - - - - -
1.5 Signature Bonus - - - - - - -
1.6 Production bonuses - - - - - - -
8,189 - 8,189 766,984 (90,698) 676,286 (668,097)
2.1 Income tax : Schedule C (Mining) - - - - - - -
2.2 Income tax : Schedule C (Normal) - - - 1,000 - 1,000 (1,000) Tax not reported by the extractive company
2.3 Withholding tax on payments 8,189 - 8,189 11,854 - 11,854 (3,665) Tax not reported by the extractive company
2.4 Customs duty - - - 58,791 - 58,791 (58,791) Tax not reported by the extractive company
2.5 Dividend Tax - - - - - - -
2.6 Personal Income tax (Pay As You Earn "PAYE") - - - 135,805 - 135,805 (135,805) Tax not reported by the extractive company
2.7 Capital gains - - - - - - -
2.8 Value Add Tax (VAT) - - - 418,405 - 418,405 (418,405) Tax not reported by the extractive company
2.9 Excise Tax - - - - - - -
2.10 Penalities - - - 1,000 - 1,000 (1,000) Tax not reported by the extractive company
2.11 Witholding tax on interests (foreign debt) - - - - - - -
2.12 Other material payments to ERCA - - - 140,129 (90,698) 49,431 (49,431) Tax not reported by the extractive company
1,598,516 - 1,598,516 - - - 1,598,516
3.1 Free Equity 1,598,516 - 1,598,516 - - - 1,598,516 Missing extractive company detail per receipt number
3.2 Dividends from State Ow ned Companies - - - - - - -
3.3 Other material payments to MoFED - - - - - - -
4- Payment to State Owned Companies (SOC) 1,060,212 - 1,060,212 - - - 1,060,212
4.1 Dividends from Mining Companies - - - - - - -
4.2 Other payments 1,060,212 - 1,060,212 - - - 1,060,212 Missing extractive company detail per receipt number
Total payments 2,769,820 - 2,769,820 831,602 (47,932) 783,670 1,986,150
B- Unilateral company disclosures 3,791,252 - 3,791,252 - - - 3,791,252
6- Regional State Mining Authority - - - - - - -
7- Regional State Tax Authority - - - - - - -
8- Social Contributions 3,791,252 - 3,791,252 - - - 28,010
8.1 Voluntary Corporate Social Responsibility 28,010 - 28,010 - - 28,010
8.2 Mandatory Social Responsibility 3,763,242 - 3,763,242 - - 3,763,242
2- Payments to Ethiopian Revenues and Customs
Authority (ERCA)
3- Payments to Ministry of Finance and Economic
Development (MoFED)
Per Government Final
differenceCommentN° Description of Payment
Per Company

EEITI Report for the year ended 7 July 2014
Moore Stephens LLP | P a g e 133
Company name: Sammakka Stones Plc Reporting period: 2013/14
Original Adjust Final Original Adjust Final
A- Direct Payments/Revenues 857,801 (2,961) 854,840 1,103,961 13,181 1,117,142 (262,302)
1- Payments to Ministry of Mines (MoM) 109,049 (23,514) 85,535 51,021 34,014 85,035 500
1.1 Royalties paid 85,035 - 85,035 51,021 34,014 85,035 -
1.2 License Fees 24,014 (23,514) 500 - - - 500 Tax not reported by the Govt Body
1.3 Penalties - - - - - - -
1.4 Land Rentals - - - - - - -
1.5 Signature Bonus - - - - - - -
748,752 20,553 769,305 1,052,940 (20,833) 1,032,107 (262,802)
2.1 Income tax : Schedule C (Mining) - - - 1,600 - 1,600 (1,600) Tax not reported by the extractive company
2.2 Income tax : Schedule C (Normal) - - - - - - -
2.3 Withholding tax on payments 16,030 - 16,030 19,350 - 19,350 (3,320) Tax not reported by the extractive company
2.4 Customs duty 234,642 - 234,642 119,063 - 119,063 115,580 Detail of expenditure could not be used
2.5 Dividend Tax - - - - - - -
2.6 Personal Income tax (Pay As You Earn "PAYE") 100,286 - 100,286 126,387 - 126,387 (26,101) Tax not reported by the extractive company
2.7 Capital gains - - - - - - -
2.8 Value Add Tax (VAT) 384,491 14,984 399,476 580,652 - 580,652 (181,177) Tax not reported by the extractive company
2.9 Excise Tax - - - - - - -
2.10 Penalities 13,303 (3,320) 9,983 33,998 - 33,998 (24,015) Tax not reported by the extractive company
2.11 Witholding tax on interests (foreign debt) - - - - - - -
2.12 Other material payments to ERCA - 8,888 8,888 171,890 (20,833) 151,057 (142,168) Tax not reported by the extractive company
- - - - - - -
4- Payment to State Owned Companies (SOC) - - - - - - -
Total payments 857,801 (2,961) 854,840 1,103,961 13,181 1,117,142 (262,302)
B- Unilateral company disclosures 379,790 - 379,790 - - - 375,566
6- Regional State Mining Authority 4,224 - 4,224 - - - -
6.1 Royalties paid - - - - - -
6.2 License Fees - - - - - -
6.3 Penalties 3,000 - 3,000 - - 3,000
6.4 Land Rentals 1,224 - 1,224 - - 1,224
7- Regional State Tax Authority 90,566 - 90,566 - - - -
7.1 Income tax : Schedule C (Normal) - - - - - -
7.2 Withholding tax on payments - - - - - -
7.3 Personal Income tax (Pay As You Earn "PAYE") 90,566 - 90,566 - - 90,566
8- Social Contributions 285,000 - 285,000 - - - -
8.1 Voluntary Corporate Social Responsibility - - - - - -
8.2 Mandatory Social Responsibility 285,000 - 285,000 - - 285,000
Per Government Final
differenceCommentN° Description of Payment
Per Company
2- Payments to Ethiopian Revenues and Customs
Authority (ERCA)
3- Payments to Ministry of Finance and Economic
Development (MoFED)

EEITI Report for the year ended 7 July 2014
Moore Stephens LLP | P a g e 134
Company name: National Mining Corporation Plc Reporting period: 2013/14
Original Adjust Final Original Adjust Final
A- Direct Payments/Revenues 4,082,017 (37,271) 4,044,745 4,336,810 (117,246) 4,219,563 (174,818)
1- Payments to Ministry of Mines (MoM) 43,447 - 43,447 26,068 17,379 43,447 -
1.1 Royalties paid 43,447 - 43,447 26,068 17,379 43,447 -
1.2 License Fees - - - - - - -
1.3 Penalties - - - - - - -
1.4 Land Rentals - - - - - - -
1.5 Signature Bonus - - - - - - -
1.6 Production bonuses - - - - - - -
4,038,570 (37,271) 4,001,298 4,310,741 (134,625) 4,176,116 (174,818)
2.1 Income tax : Schedule C (Mining) 91,243 (37,271) 53,972 53,972 - 53,972 -
2.2 Income tax : Schedule C (Normal) - - - - - - -
2.3 Withholding tax on payments 89,258 - 89,258 89,258 - 89,258 -
2.4 Customs duty 68,164 - 68,164 94,546 - 94,546 (26,381) Detail of expenditure could not be used
2.5 Dividend Tax - - - - - - -
2.6 Personal Income tax (Pay As You Earn "PAYE") 711,040 - 711,040 824,345 13,274 837,619 (126,579) Tax not reported by the extractive company
2.7 Capital gains - - - - - - -
2.8 Value Add Tax (VAT) 2,999,441 - 2,999,441 3,014,370 - 3,014,370 (14,929) Detail of expenditure could not be used
2.9 Excise Tax - - - - - - -
2.10 Penalities - - - 4,500 - 4,500 (4,500) Tax not reported by the extractive company
2.11 Witholding tax on interests (foreign debt) - - - - - - -
2.12 Other material payments to ERCA 79,423 - 79,423 229,751 (147,899) 81,852 (2,429) Tax not reported by the extractive company
- - - - - - -
3.3 Other material payments to MoFED - - - - - - -
4- Payment to State Owned Companies (SOC) - - - - - - -
Total payments 4,082,017 (37,271) 4,044,745 4,336,810 (117,246) 4,219,563 (174,818)
B- Unilateral company disclosures 1,410,398 - 1,410,398 - - - 1,252,004
6- Regional State Mining Authority 296,553 - 296,553 - - - 138,158
6.1 Royalties paid 138,158 - 138,158 - - 138,158
6.2 License Fees - - - - - -
6.3 Penalties - - - - - -
6.4 Land Rentals 158,395 - 158,395 - - 158,395
7- Regional State Tax Authority 1,075,528 - 1,075,528 - - - -
7.1 Income tax : Schedule C (Normal) - - - - - -
7.2 Withholding tax on payments - - - - - -
7.3 Personal Income tax (Pay As You Earn "PAYE") 1,075,528 - 1,075,528 - - 1,075,528
8- Social Contributions 38,318 - 38,318 - - - 38,318
8.1 Voluntary Corporate Social Responsibility 38,318 - 38,318 - - 38,318
Per Government Final
differenceCommentN° Description of Payment
Per Company
2- Payments to Ethiopian Revenues and Customs
Authority (ERCA)
3- Payments to Ministry of Finance and Economic
Development (MoFED)
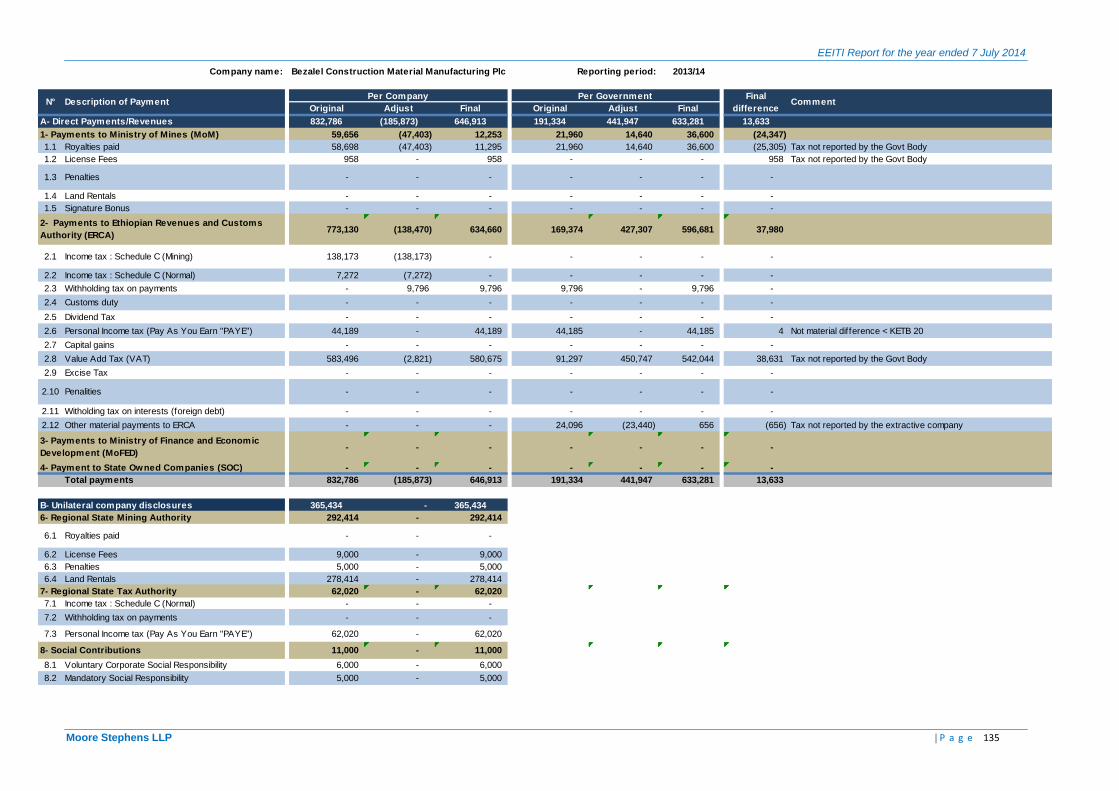
EEITI Report for the year ended 7 July 2014
Moore Stephens LLP | P a g e 135
Company name: Bezalel Construction Material Manufacturing Plc Reporting period: 2013/14
Original Adjust Final Original Adjust Final
A- Direct Payments/Revenues 832,786 (185,873) 646,913 191,334 441,947 633,281 13,633
1- Payments to Ministry of Mines (MoM) 59,656 (47,403) 12,253 21,960 14,640 36,600 (24,347)
1.1 Royalties paid 58,698 (47,403) 11,295 21,960 14,640 36,600 (25,305) Tax not reported by the Govt Body
1.2 License Fees 958 - 958 - - - 958 Tax not reported by the Govt Body
1.3 Penalties - - - - - - -
1.4 Land Rentals - - - - - - -
1.5 Signature Bonus - - - - - - -
773,130 (138,470) 634,660 169,374 427,307 596,681 37,980
2.1 Income tax : Schedule C (Mining) 138,173 (138,173) - - - - -
2.2 Income tax : Schedule C (Normal) 7,272 (7,272) - - - - -
2.3 Withholding tax on payments - 9,796 9,796 9,796 - 9,796 -
2.4 Customs duty - - - - - - -
2.5 Dividend Tax - - - - - - -
2.6 Personal Income tax (Pay As You Earn "PAYE") 44,189 - 44,189 44,185 - 44,185 4 Not material difference < KETB 20
2.7 Capital gains - - - - - - -
2.8 Value Add Tax (VAT) 583,496 (2,821) 580,675 91,297 450,747 542,044 38,631 Tax not reported by the Govt Body
2.9 Excise Tax - - - - - - -
2.10 Penalities - - - - - - -
2.11 Witholding tax on interests (foreign debt) - - - - - - -
2.12 Other material payments to ERCA - - - 24,096 (23,440) 656 (656) Tax not reported by the extractive company
- - - - - - -
4- Payment to State Owned Companies (SOC) - - - - - - -
Total payments 832,786 (185,873) 646,913 191,334 441,947 633,281 13,633
B- Unilateral company disclosures 365,434 - 365,434 - - - 82,020
6- Regional State Mining Authority 292,414 - 292,414 - - - -
6.1 Royalties paid - - - - - -
6.2 License Fees 9,000 - 9,000 - - 9,000
6.3 Penalties 5,000 - 5,000 - - 5,000
6.4 Land Rentals 278,414 - 278,414 - - 278,414
7- Regional State Tax Authority 62,020 - 62,020 - - - -
7.1 Income tax : Schedule C (Normal) - - - - - -
7.2 Withholding tax on payments - - - - - -
7.3 Personal Income tax (Pay As You Earn "PAYE") 62,020 - 62,020 - - 62,020
8- Social Contributions 11,000 - 11,000 - - - 6,000
8.1 Voluntary Corporate Social Responsibility 6,000 - 6,000 - - 6,000
8.2 Mandatory Social Responsibility 5,000 - 5,000 - - 5,000
Per Government Final
differenceCommentN° Description of Payment
Per Company
2- Payments to Ethiopian Revenues and Customs
Authority (ERCA)
3- Payments to Ministry of Finance and Economic
Development (MoFED)

EEITI Report for the year ended 7 July 2014
Moore Stephens LLP | P a g e 136
Company name: China Long Hoa Milla Construction Materials Plc Reporting period: 2013/14
Original Adjust Final Original Adjust Final
A- Direct Payments/Revenues - - - 3,750 2,273 6,023 (6,023)
1- Payments to Ministry of Mines (MoM) - - - 3,750 2,273 6,023 (6,023)
1.1 Royalties paid - - 3,409 2,273 5,682 (5,682) Reporting template not submitted by the extractive company
1.2 License Fees - - - - -
1.3 Penalties - - 341 - 341 (341) Reporting template not submitted by the extractive company
1.4 Land Rentals - - - - -
1.5 Signature Bonus - - - - -
1.6 Production bonuses - - - - -
1.7 Sale of Petroleum Data Package - - - - -
1.8 Other material payments to Mining authority - - - - -
- - - - - - -
2.1 Income tax : Schedule C (Mining) - - - - -
2.2 Income tax : Schedule C (Normal) - - - - -
2.3 Withholding tax on payments - - - - -
2.4 Customs duty - - - - -
2.5 Dividend Tax - - - - -
2.6 Personal Income tax (Pay As You Earn "PAYE") - - - - -
2.7 Capital gains - - - - -
2.8 Value Add Tax (VAT) - - - - -
2.9 Excise Tax - - - - -
2.10 Penalities - - - - -
2.11 Witholding tax on interests (foreign debt) - - - - -
2.12 Other material payments to ERCA - - - - -
- - - - - - -
3.1 Free Equity - - - - -
3.2 Dividends from State Ow ned Companies - - - - -
3.3 Other material payments to MoFED - - - - -
4- Payment to State Owned Companies (SOC) - - - - - - -
4.1 Dividends from Mining Companies - - - - -
4.2 Other payments - - - - -
Total payments - - - 3,750 2,273 6,023 (6,023)
B- Unilateral company disclosures - - - - - - -
6- Regional State Mining Authority - - - - - - -
7- Regional State Tax Authority - - - - - - -
8- Social Contributions - - - - - - -
2- Payments to Ethiopian Revenues and Customs
Authority (ERCA)
3- Payments to Ministry of Finance and Economic
Development (MoFED)
Per GovernmentFinal difference CommentN° Description of Payment
Per Company
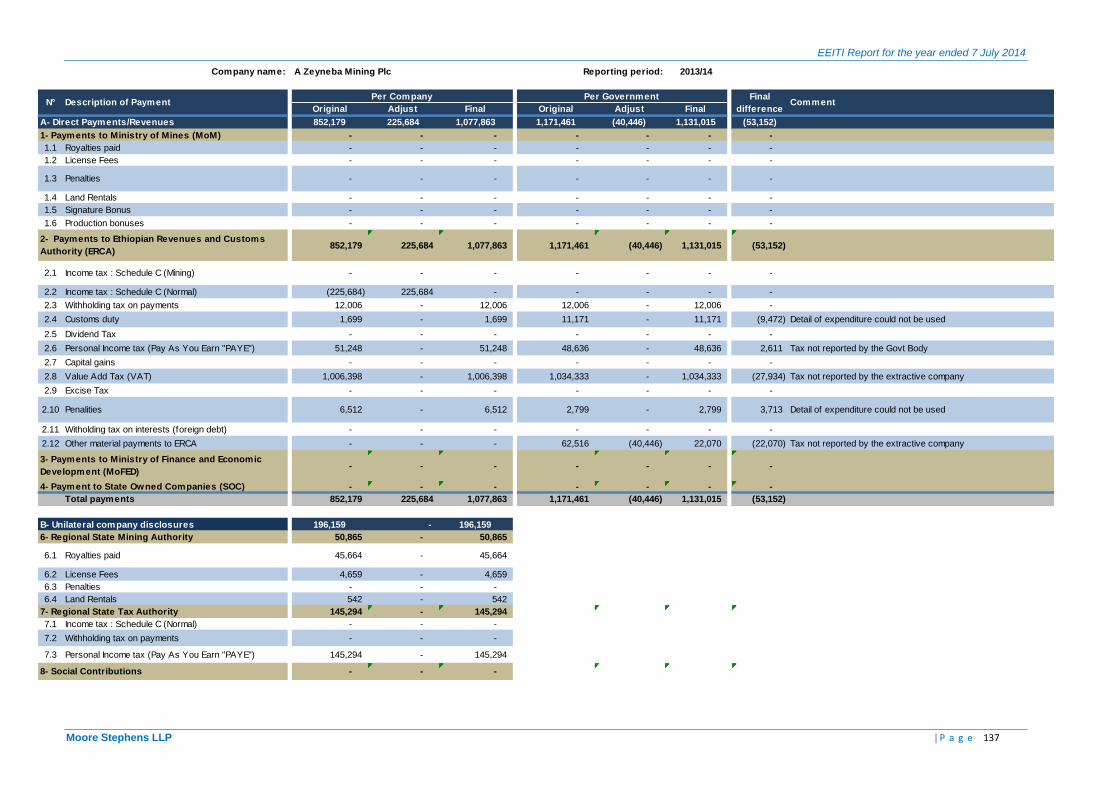
EEITI Report for the year ended 7 July 2014
Moore Stephens LLP | P a g e 137
Company name: A Zeyneba Mining Plc Reporting period: 2013/14
Original Adjust Final Original Adjust Final
A- Direct Payments/Revenues 852,179 225,684 1,077,863 1,171,461 (40,446) 1,131,015 (53,152)
1- Payments to Ministry of Mines (MoM) - - - - - - -
1.1 Royalties paid - - - - - - -
1.2 License Fees - - - - - - -
1.3 Penalties - - - - - - -
1.4 Land Rentals - - - - - - -
1.5 Signature Bonus - - - - - - -
1.6 Production bonuses - - - - - - -
852,179 225,684 1,077,863 1,171,461 (40,446) 1,131,015 (53,152)
2.1 Income tax : Schedule C (Mining) - - - - - - -
2.2 Income tax : Schedule C (Normal) (225,684) 225,684 - - - - -
2.3 Withholding tax on payments 12,006 - 12,006 12,006 - 12,006 -
2.4 Customs duty 1,699 - 1,699 11,171 - 11,171 (9,472) Detail of expenditure could not be used
2.5 Dividend Tax - - - - - - -
2.6 Personal Income tax (Pay As You Earn "PAYE") 51,248 - 51,248 48,636 - 48,636 2,611 Tax not reported by the Govt Body
2.7 Capital gains - - - - - - -
2.8 Value Add Tax (VAT) 1,006,398 - 1,006,398 1,034,333 - 1,034,333 (27,934) Tax not reported by the extractive company
2.9 Excise Tax - - - - - - -
2.10 Penalities 6,512 - 6,512 2,799 - 2,799 3,713 Detail of expenditure could not be used
2.11 Witholding tax on interests (foreign debt) - - - - - - -
2.12 Other material payments to ERCA - - - 62,516 (40,446) 22,070 (22,070) Tax not reported by the extractive company
- - - - - - -
4- Payment to State Owned Companies (SOC) - - - - - - -
Total payments 852,179 225,684 1,077,863 1,171,461 (40,446) 1,131,015 (53,152)
B- Unilateral company disclosures 196,159 - 196,159 - - - 195,617
6- Regional State Mining Authority 50,865 - 50,865 - - - 45,664
6.1 Royalties paid 45,664 - 45,664 - - 45,664
6.2 License Fees 4,659 - 4,659 - - 4,659
6.3 Penalties - - - - - -
6.4 Land Rentals 542 - 542 - - 542
7- Regional State Tax Authority 145,294 - 145,294 - - - -
7.1 Income tax : Schedule C (Normal) - - - - - -
7.2 Withholding tax on payments - - - - - -
7.3 Personal Income tax (Pay As You Earn "PAYE") 145,294 - 145,294 - - 145,294
8- Social Contributions - - - - - - -
Per Government Final
differenceCommentN° Description of Payment
Per Company
2- Payments to Ethiopian Revenues and Customs
Authority (ERCA)
3- Payments to Ministry of Finance and Economic
Development (MoFED)
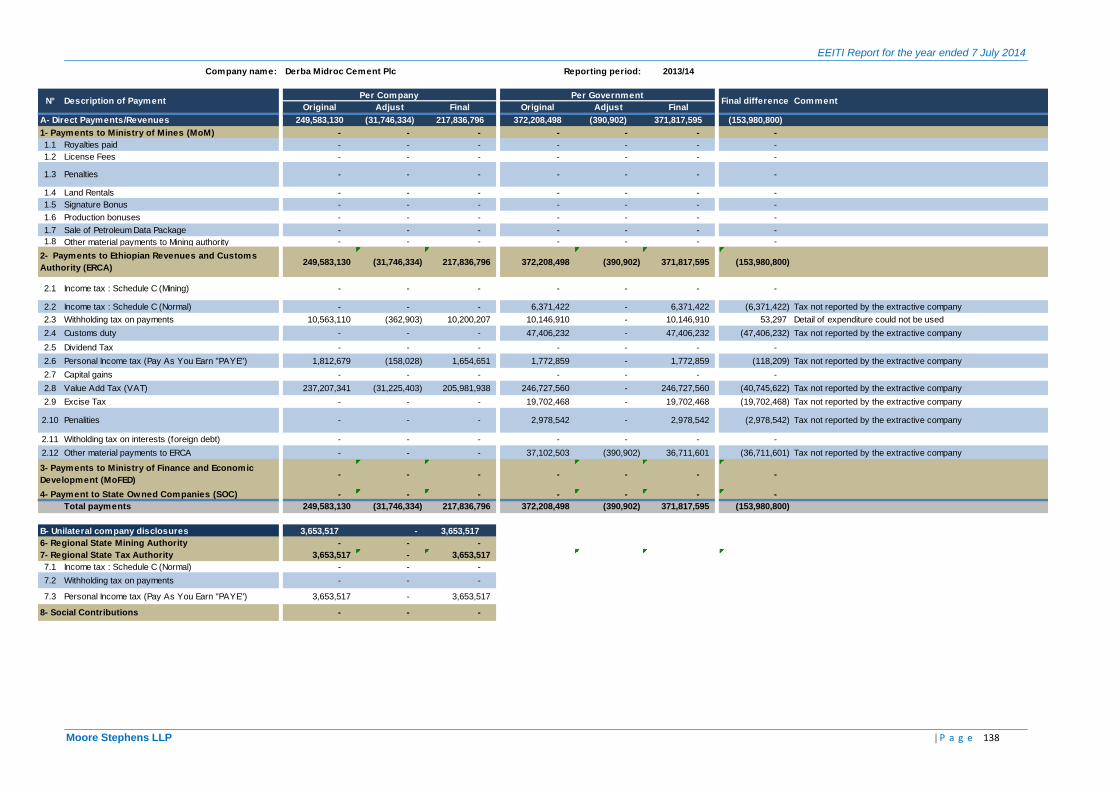
EEITI Report for the year ended 7 July 2014
Moore Stephens LLP | P a g e 138
Company name: Derba Midroc Cement Plc Reporting period: 2013/14
Original Adjust Final Original Adjust Final
A- Direct Payments/Revenues 249,583,130 (31,746,334) 217,836,796 372,208,498 (390,902) 371,817,595 (153,980,800)
1- Payments to Ministry of Mines (MoM) - - - - - - -
1.1 Royalties paid - - - - - - -
1.2 License Fees - - - - - - -
1.3 Penalties - - - - - - -
1.4 Land Rentals - - - - - - -
1.5 Signature Bonus - - - - - - -
1.6 Production bonuses - - - - - - -
1.7 Sale of Petroleum Data Package - - - - - - -
1.8 Other material payments to Mining authority - - - - - - -
249,583,130 (31,746,334) 217,836,796 372,208,498 (390,902) 371,817,595 (153,980,800)
2.1 Income tax : Schedule C (Mining) - - - - - - -
2.2 Income tax : Schedule C (Normal) - - - 6,371,422 - 6,371,422 (6,371,422) Tax not reported by the extractive company
2.3 Withholding tax on payments 10,563,110 (362,903) 10,200,207 10,146,910 - 10,146,910 53,297 Detail of expenditure could not be used
2.4 Customs duty - - - 47,406,232 - 47,406,232 (47,406,232) Tax not reported by the extractive company
2.5 Dividend Tax - - - - - - -
2.6 Personal Income tax (Pay As You Earn "PAYE") 1,812,679 (158,028) 1,654,651 1,772,859 - 1,772,859 (118,209) Tax not reported by the extractive company
2.7 Capital gains - - - - - - -
2.8 Value Add Tax (VAT) 237,207,341 (31,225,403) 205,981,938 246,727,560 - 246,727,560 (40,745,622) Tax not reported by the extractive company
2.9 Excise Tax - - - 19,702,468 - 19,702,468 (19,702,468) Tax not reported by the extractive company
2.10 Penalities - - - 2,978,542 - 2,978,542 (2,978,542) Tax not reported by the extractive company
2.11 Witholding tax on interests (foreign debt) - - - - - - -
2.12 Other material payments to ERCA - - - 37,102,503 (390,902) 36,711,601 (36,711,601) Tax not reported by the extractive company
- - - - - - -
4- Payment to State Owned Companies (SOC) - - - - - - -
Total payments 249,583,130 (31,746,334) 217,836,796 372,208,498 (390,902) 371,817,595 (153,980,800)
B- Unilateral company disclosures 3,653,517 - 3,653,517 - - - 3,653,517
6- Regional State Mining Authority - - - - - - -
7- Regional State Tax Authority 3,653,517 - 3,653,517 - - - -
7.1 Income tax : Schedule C (Normal) - - - - - -
7.2 Withholding tax on payments - - - - - -
7.3 Personal Income tax (Pay As You Earn "PAYE") 3,653,517 - 3,653,517 - - 3,653,517
8- Social Contributions - - - - - - -
Per GovernmentFinal difference CommentN° Description of Payment
Per Company
2- Payments to Ethiopian Revenues and Customs
Authority (ERCA)
3- Payments to Ministry of Finance and Economic
Development (MoFED)

EEITI Report for the year ended 7 July 2014
Moore Stephens LLP | P a g e 139
Company name: Adola Gold Mine Enterprise Reporting period: 2013/14
Original Adjust Final Original Adjust Final
A- Direct Payments/Revenues 11,871,635 - 11,871,635 7,824,082 (12,179) 7,811,903 4,059,732
1- Payments to Ministry of Mines (MoM) 1,146,886 - 1,146,886 - - - 1,146,886
1.1 Royalties paid - - - - - - -
1.2 License Fees - - - - - - -
1.3 Penalties - - - - - - -
1.4 Land Rentals - - - - - - -
1.5 Signature Bonus - - - - - - -
1.6 Production bonuses - - - - - - -
1.7 Sale of Petroleum Data Package - - - - - - -
1.8 Other material payments to Mining authority 1,146,886 - 1,146,886 - - - 1,146,886 Tax not reported by the Govt Body
5,685,489 - 5,685,489 7,824,082 (12,179) 7,811,903 (2,126,414)
2.1 Income tax : Schedule C (Mining) 3,635,781 - 3,635,781 3,635,781 - 3,635,781 -
2.2 Income tax : Schedule C (Normal) - - - - - - -
2.3 Withholding tax on payments 421,035 - 421,035 386,120 - 386,120 34,915 Tax not reported by the Govt Body
2.4 Customs duty - - - 525,356 - 525,356 (525,356) Missing extractive company detail per receipt number
2.5 Dividend Tax 1,511,778 - 1,511,778 1,511,778 - 1,511,778 -
2.6 Personal Income tax (Pay As You Earn "PAYE") 13,590 - 13,590 16,524 - 16,524 (2,934) Tax not reported by the extractive company
2.7 Capital gains - - - - - - -
2.8 Value Add Tax (VAT) - - - 459,362 - 459,362 (459,362) Tax not reported by the extractive company
2.9 Excise Tax - - - 1,036,037 - 1,036,037 (1,036,037) Tax not reported by the Govt Body
2.10 Penalities - - - 35 - 35 (35) Tax not reported by the extractive company
2.11 Witholding tax on interests (foreign debt) - - - - - - -
2.12 Other material payments to ERCA 103,305 - 103,305 253,088 (12,179) 240,909 (137,604) Tax not reported by the extractive company
5,039,260 - 5,039,260 - - - 5,039,260
3.1 Free Equity - - - - - - -
3.2 Dividends from State Ow ned Companies 5,039,260 - 5,039,260 - - - 5,039,260 Tax not reported by the Govt Body
4- Payment to State Owned Companies (SOC) - - - - - - -
Total payments 11,871,635 - 11,871,635 7,824,082 (12,179) 7,811,903 4,059,732
B- Unilateral company disclosures 3,717,477 - 3,717,477 - - - 3,359,924
6- Regional State Mining Authority 2,713,733 - 2,713,733 - - - 2,356,181
6.1 Royalties paid 2,356,181 - 2,356,181 - - 2,356,181
6.2 License Fees - - - - - -
6.3 Penalties - - - - - -
6.4 Land Rentals 357,553 - 357,553 - - 357,553
7- Regional State Tax Authority 920,744 - 920,744 - - - -
7.1 Income tax : Schedule C (Normal) - - - - - -
7.2 Withholding tax on payments - - - - - -
7.3 Personal Income tax (Pay As You Earn "PAYE") 920,744 - 920,744 - - 920,744
8- Social Contributions 83,000 - 83,000 - - - 83,000
8.1 Voluntary Corporate Social Responsibility 83,000 - 83,000 - - 83,000
Per Government Final
differenceCommentN° Description of Payment
Per Company
2- Payments to Ethiopian Revenues and Customs
Authority (ERCA)
3- Payments to Ministry of Finance and Economic
Development (MoFED)

EEITI Report for the year ended 7 July 2014
Moore Stephens LLP | P a g e 140
Company name: CIC - Mugher Cement Factory Reporting period: 2013/14
Original Adjust Final Original Adjust Final
A- Direct Payments/Revenues 243,732,960 - 243,732,960 279,595,765 1,052,029 280,647,794 (36,914,834)
1- Payments to Ministry of Mines (MoM) - - - - - - -
1.1 Royalties paid - - - - - - -
1.2 License Fees - - - - - - -
1.3 Penalties - - - - - - -
1.4 Land Rentals - - - - - - -
1.5 Signature Bonus - - - - - - -
233,732,960 - 233,732,960 279,595,765 (8,947,242) 270,648,523 (36,915,563)
2.1 Income tax : Schedule C (Mining) - - - - - - -
2.2 Income tax : Schedule C (Normal) 3,832,463 - 3,832,463 23,691,132 - 23,691,132 (19,858,668) Detail of expenditure could not be used
2.3 Withholding tax on payments 1,793,234 - 1,793,234 2,142,784 - 2,142,784 (349,550) Tax not reported by the extractive company
2.4 Customs duty 8,908,648 - 8,908,648 11,505,681 - 11,505,681 (2,597,032) Detail of expenditure could not be used
2.5 Dividend Tax - - - - - - -
2.6 Personal Income tax (Pay As You Earn "PAYE") 21,699,363 - 21,699,363 20,163,623 - 20,163,623 1,535,740 Tax not reported by the Govt Body
2.7 Capital gains - - - - - - -
2.8 Value Add Tax (VAT) 186,146,111 - 186,146,111 195,120,619 - 195,120,619 (8,974,508) Detail of expenditure could not be used
2.9 Excise Tax 17,756 - 17,756 6,282 - 6,282 11,474 Tax not reported by the Govt Body
2.10 Penalities 36,590 - 36,590 36,662 - 36,662 (72) Not material difference < KETB 20
2.11 Witholding tax on interests (foreign debt) - - - - - - -
2.12 Other material payments to ERCA 11,298,794 - 11,298,794 26,928,982 (8,947,242) 17,981,740 (6,682,946) Detail of expenditure could not be used
10,000,000 - 10,000,000 - 9,999,271 9,999,271 729
3.1 Free Equity - - - - - - -
3.2 Dividends from State Ow ned Companies 10,000,000 - 10,000,000 - 9,999,271 9,999,271 729 Not material difference < KETB 20
4- Payment to State Owned Companies (SOC) - - - - - - -
Total payments 243,732,960 - 243,732,960 279,595,765 1,052,029 280,647,794 (36,914,834)
B- Unilateral company disclosures 8,206,379 - 8,206,379 - - - 2,034,073
6- Regional State Mining Authority 8,206,379 - 8,206,379 - - - 2,034,073
6.1 Royalties paid 2,034,073 - 2,034,073 - - 2,034,073
6.2 License Fees - - - - - -
6.3 Penalties 4,180,401 - 4,180,401 - - 4,180,401
6.4 Land Rentals 1,165,546 - 1,165,546 - - 1,165,546
6.5 Signature Bonus - - - - - -
6.6 Production bonuses - - - - - -
6.7 Sale of Petroleum Data Package - - - - - -
6.8Other material payments to Regional State Mining
Authority826,359 - 826,359 - - 826,359
7- Regional State Tax Authority - - - - - - -
8- Social Contributions - - - - - - -
Per GovernmentFinal difference CommentN° Description of Payment
Per Company
2- Payments to Ethiopian Revenues and Customs
Authority (ERCA)
3- Payments to Ministry of Finance and Economic
Development (MoFED)

EEITI Report for the year ended 7 July 2014
Moore Stephens LLP | P a g e 141
Company name: Messebo Cement Factory Plc Reporting period: 2013/14
Original Adjust Final Original Adjust Final
A- Direct Payments/Revenues 292,510,941 - 292,510,941 312,047,982 - 312,047,982 (19,537,041)
1- Payments to Ministry of Mines (MoM) - - - - - - -
1.1 Royalties paid - - - - - - -
1.2 License Fees - - - - - - -
1.3 Penalties - - - - - - -
1.4 Land Rentals - - - - - - -
1.5 Signature Bonus - - - - - - -
292,510,941 - 292,510,941 312,047,982 - 312,047,982 (19,537,041)
2.1 Income tax : Schedule C (Mining) - - - - - - -
2.2 Income tax : Schedule C (Normal) 16,100,324 - 16,100,324 16,098,324 - 16,098,324 2,000 Not material difference < KETB 20
2.3 Withholding tax on payments 10,617,462 - 10,617,462 2,859,881 - 2,859,881 7,757,581 Detail of expenditure could not be used
2.4 Customs duty 70,630,162 - 70,630,162 101,712,411 - 101,712,411 (31,082,249) Detail of expenditure could not be used
2.5 Dividend Tax - - - - - - -
2.6 Personal Income tax (Pay As You Earn "PAYE") - - - - - - -
2.7 Capital gains - - - - - - -
2.8 Value Add Tax (VAT) 195,162,994 - 195,162,994 183,619,785 - 183,619,785 11,543,208 Tax not reported by the Govt Body
2.9 Excise Tax - - - - - - -
2.10 Penalities - - - - - - -
2.11 Witholding tax on interests (foreign debt) - - - - - - -
2.12 Other material payments to ERCA - - - 7,757,581 - 7,757,581 (7,757,581) Tax not reported by the extractive company
- - - - - - -
4- Payment to State Owned Companies (SOC) - - - - - - -
Total payments 292,510,941 - 292,510,941 312,047,982 - 312,047,982 (19,537,041)
B- Unilateral company disclosures 32,752,586 - 32,752,586 - - - 32,752,586
6- Regional State Mining Authority - - - - - - -
7- Regional State Tax Authority 28,193,762 - 28,193,762 - - - -
7.1 Income tax : Schedule C (Normal) - - - - - -
7.2 Withholding tax on payments - - - - - -
7.3 Personal Income tax (Pay As You Earn "PAYE") 28,193,762 - 28,193,762 - - 28,193,762
8- Social Contributions 4,558,824 - 4,558,824 - - - 4,558,824
8.1 Voluntary Corporate Social Responsibility 4,558,824 - 4,558,824 - - 4,558,824
2- Payments to Ethiopian Revenues and Customs
Authority (ERCA)
3- Payments to Ministry of Finance and Economic
Development (MoFED)
Per Government Final
differenceCommentN° Description of Payment
Per Company

EEITI Report for the year ended 7 July 2014
Moore Stephens LLP | P a g e 142
Company name: National Cement Sc Reporting period: 2013/14
Original Adjust Final Original Adjust Final
A- Direct Payments/Revenues 101,056,379 (4,094,944) 96,961,435 124,069,805 - 124,069,805 (27,108,370)
1- Payments to Ministry of Mines (MoM) 465,978 - 465,978 - - - 465,978
1.1 Royalties paid 453,598 - 453,598 - - - 453,598 Tax not reported by the Govt Body
1.2 License Fees 12,380 - 12,380 - - - 12,380 Tax not reported by the Govt Body
1.3 Penalties - - - - - - -
1.4 Land Rentals - - - - - - -
1.5 Signature Bonus - - - - - - -
1.6 Production bonuses - - - - - - -
1.7 Sale of Petroleum Data Package - - - - - - -
1.8 Other material payments to Mining authority - - - - - - -
100,590,401 (4,094,944) 96,495,458 124,069,805 - 124,069,805 (27,574,348)
2.1 Income tax : Schedule C (Mining) - - - - - - -
2.2 Income tax : Schedule C (Normal) 17,039,404 (882,433) 16,156,971 3,237,501 - 3,237,501 12,919,471 Detail of expenditure could not be used
2.3 Withholding tax on payments 3,460,121 (133,965) 3,326,157 2,622,791 - 2,622,791 703,365 Detail of expenditure could not be used
2.4 Customs duty 21,532,512 - 21,532,512 26,015,315 - 26,015,315 (4,482,802) Detail of expenditure could not be used
2.5 Dividend Tax 3,546,399 - 3,546,399 - - - 3,546,399 Tax not reported by the Govt Body
2.6 Personal Income tax (Pay As You Earn "PAYE") - - - - - - -
2.7 Capital gains - - - - - - -
2.8 Value Add Tax (VAT) 55,011,965 (3,078,546) 51,933,419 72,594,763 - 72,594,763 (20,661,345) Detail of expenditure could not be used
2.9 Excise Tax - - - 4,758,902 - 4,758,902 (4,758,902) Detail of expenditure could not be used
2.10 Penalities - - - 2,000 - 2,000 (2,000) Tax not reported by the extractive company
2.11 Witholding tax on interests (foreign debt) - - - - - - -
2.12 Other material payments to ERCA - - - 14,838,533 - 14,838,533 (14,838,533) Detail of expenditure could not be used
- - - - - - -
4- Payment to State Owned Companies (SOC) - - - - - - -
Total payments 101,056,379 (4,094,944) 96,961,435 124,069,805 - 124,069,805 (27,108,370)
B- Unilateral company disclosures 1,145,372 - 1,145,372 - - - 1,137,090
6- Regional State Mining Authority 49,876 - 49,876 - - - 39,681
6.1 Royalties paid 39,681 - 39,681 - - 39,681
6.2 License Fees 1,912 - 1,912 - - 1,912
6.3 Penalties - - - - - -
6.4 Land Rentals 8,282 - 8,282 - - 8,282
7- Regional State Tax Authority - - - - - - -
8- Social Contributions 1,095,497 - 1,095,497 - - - 1,095,497
8.1 Voluntary Corporate Social Responsibility 1,095,497 - 1,095,497 - - 1,095,497
2- Payments to Ethiopian Revenues and Customs
Authority (ERCA)
3- Payments to Ministry of Finance and Economic
Development (MoFED)
Per Government Final
differenceCommentN° Description of Payment
Per Company

EEITI Report for the year ended 7 July 2014
Moore Stephens LLP | P a g e 143
Company name: JAM Industrial Plc Reporting period: 2013/14
Original Adjust Final Original Adjust Final
A- Direct Payments/Revenues 1,456,745 (217,771) 1,238,974 1,969,008 (113,663) 1,855,345 (616,371)
1- Payments to Ministry of Mines (MoM) 102,264 (6,567) 95,697 - - - 95,697
1.1 Royalties paid 102,264 (6,567) 95,697 - - - 95,697 Tax not reported by the Govt Body
1.2 License Fees - - - - - - -
1.3 Penalties - - - - - - -
1.4 Land Rentals - - - - - - -
1.5 Signature Bonus - - - - - - -
1.6 Production bonuses - - - - - - -
1.7 Sale of Petroleum Data Package - - - - - - -
1.8 Other material payments to Mining authority - - - - - - -
1,354,481 (211,204) 1,143,277 1,969,008 (113,663) 1,855,345 (712,068)
2.1 Income tax : Schedule C (Mining) - - - - - - -
2.2 Income tax : Schedule C (Normal) 96,818 5,334 102,152 102,752 - 102,752 (600) Tax not reported by the extractive company
2.3 Withholding tax on payments - - - 249 - 249 (249) Tax not reported by the extractive company
2.4 Customs duty - - - - - - -
2.5 Dividend Tax - - - - - - -
2.6 Personal Income tax (Pay As You Earn "PAYE") 886,294 (164,722) 721,572 693,763 - 693,763 27,810 Detail of expenditure could not be used
2.7 Capital gains - - - - - - -
2.8 Value Add Tax (VAT) 284,704 15,083 299,788 954,330 (6,000) 948,330 (648,542) Tax not reported by the extractive company
2.9 Excise Tax - - - - - - -
2.10 Penalities 86,664 (66,900) 19,765 104,180 6,000 110,180 (90,415) Tax not reported by the extractive company
2.11 Witholding tax on interests (foreign debt) - - - - - - -
2.12 Other material payments to ERCA - - - 113,735 (113,663) 72 (72) Tax not reported by the extractive company
- - - - - - -
3.1 Free Equity - - - - - - -
3.2 Dividends from State Ow ned Companies - - - - - - -
3.3 Other material payments to MoFED - - - - - - -
4- Payment to State Owned Companies (SOC) - - - - - - -
4.1 Dividends from Mining Companies - - - - - - -
4.2 Other payments - - - - - - -
Total payments 1,456,745 (217,771) 1,238,974 1,969,008 (113,663) 1,855,345 (616,371)
B- Unilateral company disclosures - - - - - - -
6- Regional State Mining Authority - - - - - - -
7- Regional State Tax Authority - - - - - - -
8- Social Contributions - - - - - - -
Per Government Final
differenceCommentN° Description of Payment
Per Company
2- Payments to Ethiopian Revenues and Customs
Authority (ERCA)
3- Payments to Ministry of Finance and Economic
Development (MoFED)
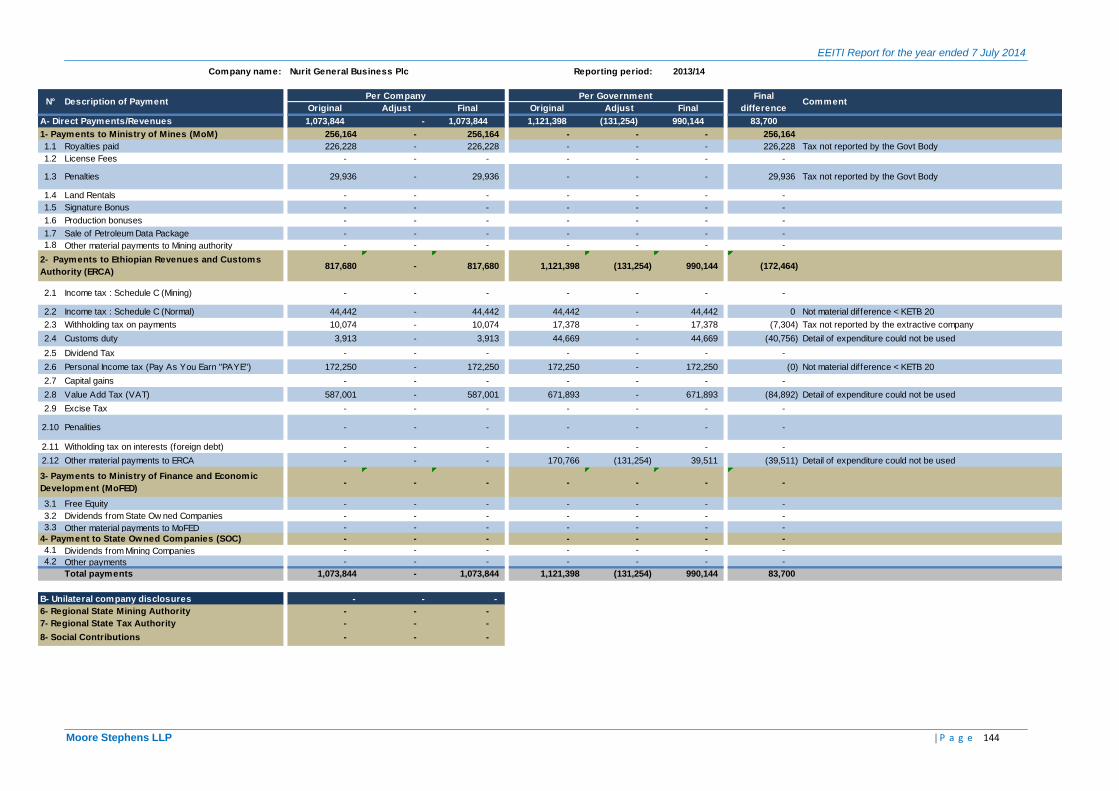
EEITI Report for the year ended 7 July 2014
Moore Stephens LLP | P a g e 144
Company name: Nurit General Business Plc Reporting period: 2013/14
Original Adjust Final Original Adjust Final
A- Direct Payments/Revenues 1,073,844 - 1,073,844 1,121,398 (131,254) 990,144 83,700
1- Payments to Ministry of Mines (MoM) 256,164 - 256,164 - - - 256,164
1.1 Royalties paid 226,228 - 226,228 - - - 226,228 Tax not reported by the Govt Body
1.2 License Fees - - - - - - -
1.3 Penalties 29,936 - 29,936 - - - 29,936 Tax not reported by the Govt Body
1.4 Land Rentals - - - - - - -
1.5 Signature Bonus - - - - - - -
1.6 Production bonuses - - - - - - -
1.7 Sale of Petroleum Data Package - - - - - - -
1.8 Other material payments to Mining authority - - - - - - -
817,680 - 817,680 1,121,398 (131,254) 990,144 (172,464)
2.1 Income tax : Schedule C (Mining) - - - - - - -
2.2 Income tax : Schedule C (Normal) 44,442 - 44,442 44,442 - 44,442 0 Not material difference < KETB 20
2.3 Withholding tax on payments 10,074 - 10,074 17,378 - 17,378 (7,304) Tax not reported by the extractive company
2.4 Customs duty 3,913 - 3,913 44,669 - 44,669 (40,756) Detail of expenditure could not be used
2.5 Dividend Tax - - - - - - -
2.6 Personal Income tax (Pay As You Earn "PAYE") 172,250 - 172,250 172,250 - 172,250 (0) Not material difference < KETB 20
2.7 Capital gains - - - - - - -
2.8 Value Add Tax (VAT) 587,001 - 587,001 671,893 - 671,893 (84,892) Detail of expenditure could not be used
2.9 Excise Tax - - - - - - -
2.10 Penalities - - - - - - -
2.11 Witholding tax on interests (foreign debt) - - - - - - -
2.12 Other material payments to ERCA - - - 170,766 (131,254) 39,511 (39,511) Detail of expenditure could not be used
- - - - - - -
3.1 Free Equity - - - - - - -
3.2 Dividends from State Ow ned Companies - - - - - - -
3.3 Other material payments to MoFED - - - - - - -
4- Payment to State Owned Companies (SOC) - - - - - - -
4.1 Dividends from Mining Companies - - - - - - -
4.2 Other payments - - - - - - -
Total payments 1,073,844 - 1,073,844 1,121,398 (131,254) 990,144 83,700
B- Unilateral company disclosures - - - - - - -
6- Regional State Mining Authority - - - - - - -
7- Regional State Tax Authority - - - - - - -
8- Social Contributions - - - - - - -
Per Government Final
differenceCommentN° Description of Payment
Per Company
2- Payments to Ethiopian Revenues and Customs
Authority (ERCA)
3- Payments to Ministry of Finance and Economic
Development (MoFED)

EEITI Report for the year ended 7 July 2014
Moore Stephens LLP | P a g e 145
Company name: Hua Yi Cement Plc Reporting period: 2013/14
Original Adjust Final Original Adjust Final
A- Direct Payments/Revenues - - - 2,133,827 - 2,133,827 (2,133,827)
1- Payments to Ministry of Mines (MoM) - - - - - - -
1.1 Royalties paid - - - - -
1.2 License Fees - - - - -
1.3 Penalties - - - - -
1.4 Land Rentals - - - - -
1.5 Signature Bonus - - - - -
1.6 Production bonuses - - - - -
1.7 Sale of Petroleum Data Package - - - - -
1.8 Other material payments to Mining authority - - - - -
- - - 2,133,827 - 2,133,827 (2,133,827)
2.1 Income tax : Schedule C (Mining) - - - - -
2.2 Income tax : Schedule C (Normal) - - 1,800 - 1,800 (1,800) Reporting template not submitted by the extractive company
2.3 Withholding tax on payments - - 350,467 - 350,467 (350,467) Reporting template not submitted by the extractive company
2.4 Customs duty - - 2,440 - 2,440 (2,440) Reporting template not submitted by the extractive company
2.5 Dividend Tax - - - - -
2.6 Personal Income tax (Pay As You Earn "PAYE") - - - - -
2.7 Capital gains - - - - -
2.8 Value Add Tax (VAT) - - 1,775,270 - 1,775,270 (1,775,270) Reporting template not submitted by the extractive company
2.9 Excise Tax - - - - -
2.10 Penalities - - 1,800 - 1,800 (1,800) Reporting template not submitted by the extractive company
2.11 Witholding tax on interests (foreign debt) - - - - -
2.12 Other material payments to ERCA - - 2,050 - 2,050 (2,050) Reporting template not submitted by the extractive company
- - - - - - -
3.1 Free Equity - - - - -
3.2 Dividends from State Ow ned Companies - - - - -
3.3 Other material payments to MoFED - - - - -
4- Payment to State Owned Companies (SOC) - - - - - - -
4.1 Dividends from Mining Companies - - - - -
4.2 Other payments - - - - -
Total payments - - - 2,133,827 - 2,133,827 (2,133,827)
B- Unilateral company disclosures - - - - - - -
6- Regional State Mining Authority - - - - - - -
7- Regional State Tax Authority - - - - - - -
8- Social Contributions - - - - - - -
2- Payments to Ethiopian Revenues and Customs
Authority (ERCA)
3- Payments to Ministry of Finance and Economic
Development (MoFED)
Per Government Final
differenceCommentN° Description of Payment
Per Company
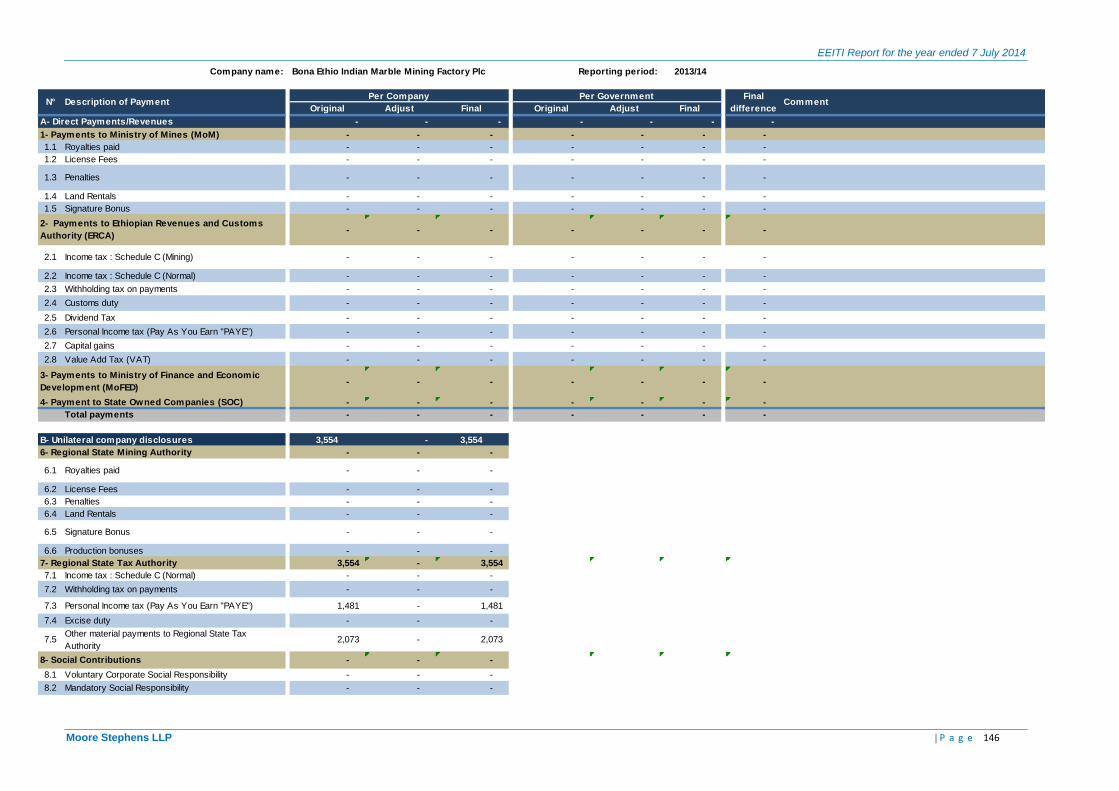
EEITI Report for the year ended 7 July 2014
Moore Stephens LLP | P a g e 146
Company name: Bona Ethio Indian Marble Mining Factory Plc Reporting period: 2013/14
Original Adjust Final Original Adjust Final
A- Direct Payments/Revenues - - - - - - -
1- Payments to Ministry of Mines (MoM) - - - - - - -
1.1 Royalties paid - - - - - - -
1.2 License Fees - - - - - - -
1.3 Penalties - - - - - - -
1.4 Land Rentals - - - - - - -
1.5 Signature Bonus - - - - - - -
- - - - - - -
2.1 Income tax : Schedule C (Mining) - - - - - - -
2.2 Income tax : Schedule C (Normal) - - - - - - -
2.3 Withholding tax on payments - - - - - - -
2.4 Customs duty - - - - - - -
2.5 Dividend Tax - - - - - - -
2.6 Personal Income tax (Pay As You Earn "PAYE") - - - - - - -
2.7 Capital gains - - - - - - -
2.8 Value Add Tax (VAT) - - - - - - -
- - - - - - -
4- Payment to State Owned Companies (SOC) - - - - - - -
Total payments - - - - - - -
B- Unilateral company disclosures 3,554 - 3,554 - - - 1,481
6- Regional State Mining Authority - - - - - - -
6.1 Royalties paid - - - - - -
6.2 License Fees - - - - - -
6.3 Penalties - - - - - -
6.4 Land Rentals - - - - - -
6.5 Signature Bonus - - - - - -
6.6 Production bonuses - - - - - -
7- Regional State Tax Authority 3,554 - 3,554 - - - -
7.1 Income tax : Schedule C (Normal) - - - - - -
7.2 Withholding tax on payments - - - - - -
7.3 Personal Income tax (Pay As You Earn "PAYE") 1,481 - 1,481 - - 1,481
7.4 Excise duty - - - - - -
7.5Other material payments to Regional State Tax
Authority2,073 - 2,073 - - 2,073
8- Social Contributions - - - - - - -
8.1 Voluntary Corporate Social Responsibility - - - - - -
8.2 Mandatory Social Responsibility - - - - - -
2- Payments to Ethiopian Revenues and Customs
Authority (ERCA)
3- Payments to Ministry of Finance and Economic
Development (MoFED)
Per Government Final
differenceCommentN° Description of Payment
Per Company

EEITI Report for the year ended 7 July 2014
Moore Stephens LLP | P a g e 147
Company name: Daylight Applied Technologies Plc Reporting period: 2013/14
Original Adjust Final Original Adjust Final
A- Direct Payments/Revenues - - - 13,419,659 (246,645) 13,173,015 (13,173,015)
1- Payments to Ministry of Mines (MoM) - - - - - - -
1.1 Royalties paid - - - - - - -
1.2 License Fees - - - - - - -
1.3 Penalties - - - - - - -
1.4 Land Rentals - - - - - - -
1.5 Signature Bonus - - - - - - -
1.6 Production bonuses - - - - - - -
1.7 Sale of Petroleum Data Package - - - - - - -
1.8 Other material payments to Mining authority - - - - - - -
- - - 13,419,659 (246,645) 13,173,015 (13,173,015)
2.1 Income tax : Schedule C (Mining) - - - - - - -
2.2 Income tax : Schedule C (Normal) - - - - - - -
2.3 Withholding tax on payments - - - 144,602 - 144,602 (144,602) Tax not reported by the extractive company
2.4 Customs duty - - - 11,556,398 - 11,556,398 (11,556,398) Tax not reported by the extractive company
2.5 Dividend Tax - - - - - - -
2.6 Personal Income tax (Pay As You Earn "PAYE") - - - 1,226,155 - 1,226,155 (1,226,155) Tax not reported by the extractive company
2.7 Capital gains - - - - - - -
2.8 Value Add Tax (VAT) - - - 216,193 - 216,193 (216,193) Tax not reported by the extractive company
2.9 Excise Tax - - - - - - -
2.10 Penalities - - - 22,500 - 22,500 (22,500) Tax not reported by the extractive company
2.11 Witholding tax on interests (foreign debt) - - - - - - -
2.12 Other material payments to ERCA - - - 253,812 (246,645) 7,167 (7,167) Tax not reported by the extractive company
- - - - - - -
3.1 Free Equity - - - - - - -
3.2 Dividends from State Ow ned Companies - - - - - - -
3.3 Other material payments to MoFED - - - - - - -
4- Payment to State Owned Companies (SOC) - - - - - - -
Total payments - - - 13,419,659 (246,645) 13,173,015 (13,173,015)
B- Unilateral company disclosures 11,900 - 11,900 - - - 11,900
6- Regional State Mining Authority 11,900 - 11,900 - - - 11,900
6.1 Royalties paid 11,900 - 11,900 - - 11,900
7- Regional State Tax Authority - - - - - - -
8- Social Contributions - - - - - - -
Per Government Final
differenceCommentN° Description of Payment
Per Company
2- Payments to Ethiopian Revenues and Customs
Authority (ERCA)
3- Payments to Ministry of Finance and Economic
Development (MoFED)

EEITI Report for the year ended 7 July 2014
Moore Stephens LLP | P a g e 148
Company name: Huang shan cement plc Reporting period: 2013/14
Original Adjust Final Original Adjust Final
A- Direct Payments/Revenues - - - 7,835,654 - 7,835,654 (7,835,654)
1- Payments to Ministry of Mines (MoM) - - - - - - -
1.1 Royalties paid - - - - -
1.2 License Fees - - - - -
1.3 Penalties - - - - -
1.4 Land Rentals - - - - -
1.5 Signature Bonus - - - - -
1.6 Production bonuses - - - - -
1.7 Sale of Petroleum Data Package - - - - -
1.8 Other material payments to Mining authority - - - - -
- - - 7,835,654 - 7,835,654 (7,835,654)
2.1 Income tax : Schedule C (Mining) - - 398,214 - 398,214 (398,214) Reporting template not submitted by the extractive company
2.2 Income tax : Schedule C (Normal) - - 1,595,090 - 1,595,090 (1,595,090) Reporting template not submitted by the extractive company
2.3 Withholding tax on payments - - 668,171 - 668,171 (668,171) Reporting template not submitted by the extractive company
2.4 Customs duty - - 867 - 867 (867) Reporting template not submitted by the extractive company
2.5 Dividend Tax - - - - -
2.6 Personal Income tax (Pay As You Earn "PAYE") - - - - -
2.7 Capital gains - - - - -
2.8 Value Add Tax (VAT) - - 3,847,145 - 3,847,145 (3,847,145) Reporting template not submitted by the extractive company
2.9 Excise Tax - - - - -
2.10 Penalities - - 1,325,439 - 1,325,439 (1,325,439) Reporting template not submitted by the extractive company
2.11 Witholding tax on interests (foreign debt) - - - - -
2.12 Other material payments to ERCA - - 728 - 728 (728) Reporting template not submitted by the extractive company
- - - - - - -
3.1 Free Equity - - - - -
3.2 Dividends from State Ow ned Companies - - - - -
3.3 Other material payments to MoFED - - - - -
4- Payment to State Owned Companies (SOC) - - - - - - -
4.1 Dividends from Mining Companies - - - - -
4.2 Other payments - - - - -
Total payments - - - 7,835,654 - 7,835,654 (7,835,654)
B- Unilateral company disclosures - - - - - - -
6- Regional State Mining Authority - - - - - - -
7- Regional State Tax Authority - - - - - - -
8- Social Contributions - - - - - - -
N° Description of PaymentPer Company Per Government Final
differenceComment
2- Payments to Ethiopian Revenues and Customs
Authority (ERCA)
3- Payments to Ministry of Finance and Economic
Development (MoFED)

EEITI Report for the year ended 7 July 2014
Moore Stephens LLP | P a g e 149
Company name: Ethiopian Hansom International Glass Plc Reporting period: 2013/14
Original Adjust Final Original Adjust Final
A- Direct Payments/Revenues - - - - - - -
1- Payments to Ministry of Mines (MoM) - - - - - - -
1.1 Royalties paid - - - - - - -
1.2 License Fees - - - - - - -
1.3 Penalties - - - - - - -
1.4 Land Rentals - - - - - - -
1.5 Signature Bonus - - - - - - -
1.6 Production bonuses - - - - - - -
1.7 Sale of Petroleum Data Package - - - - - - -
1.8 Other material payments to Mining authority - - - - - - -
- - - - - - -
2.1 Income tax : Schedule C (Mining) - - - - - - -
2.2 Income tax : Schedule C (Normal) - - - - - - -
2.3 Withholding tax on payments - - - - - - -
2.4 Customs duty - - - - - - -
2.5 Dividend Tax - - - - - - -
2.6 Personal Income tax (Pay As You Earn "PAYE") - - - - - - -
2.7 Capital gains - - - - - - -
2.8 Value Add Tax (VAT) - - - - - - -
2.9 Excise Tax - - - - - - -
2.10 Penalities - - - - - - -
2.11 Witholding tax on interests (foreign debt) - - - - - - -
2.12 Other material payments to ERCA - - - - - - -
- - - - - - -
4- Payment to State Owned Companies (SOC) - - - - - - -
Total payments - - - - - - - -
B- Unilateral company disclosures 82,883 (49,674) 33,210 - - - 29,804
6- Regional State Mining Authority 33,210 - 33,210 - - - -
6.1 Royalties paid - - - - - -
6.2 License Fees 29,804 - 29,804 - - 29,804
6.3 Penalties - - - - - -
6.4 Land Rentals 3,405 - 3,405 - - 3,405
7- Regional State Tax Authority 49,674 (49,674) - - - - -
7.1 Income tax : Schedule C (Normal) 49,674 (49,674) - - - -
8- Social Contributions - - - - - - -
2- Payments to Ethiopian Revenues and Customs
Authority (ERCA)
3- Payments to Ministry of Finance and Economic
Development (MoFED)
Per Government Final
differenceCommentN° Description of Payment
Per Company
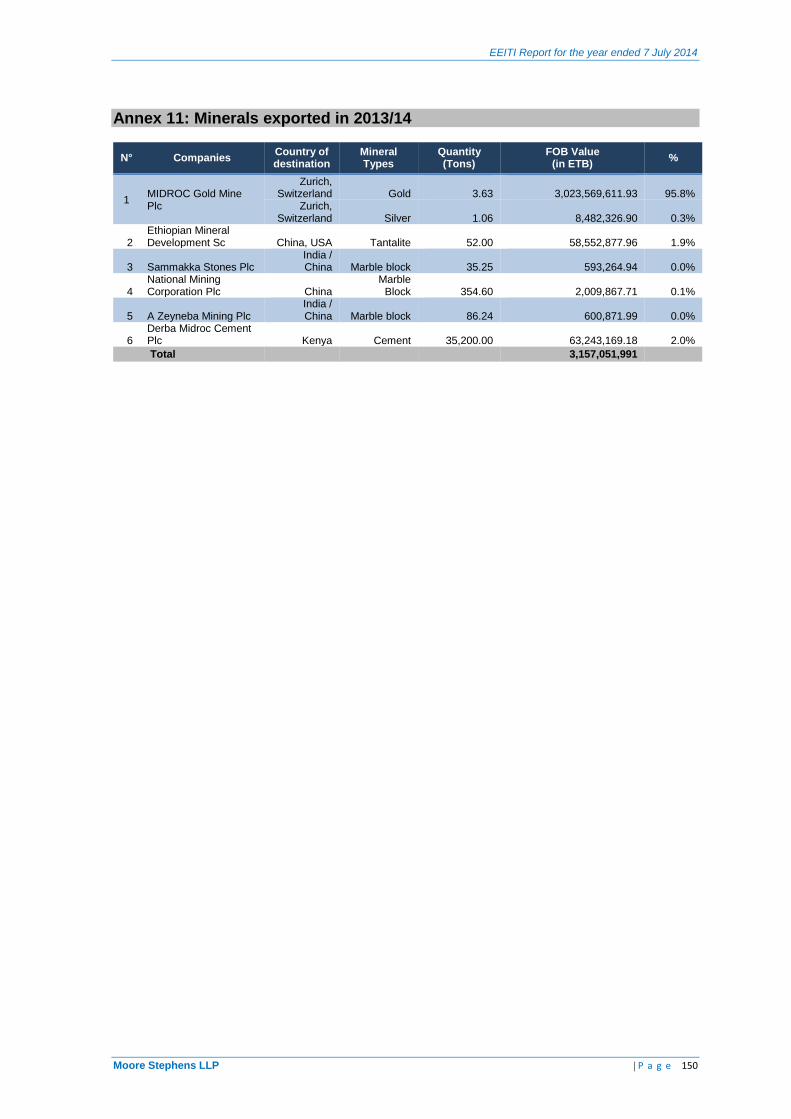
EEITI Report for the year ended 7 July 2014
Moore Stephens LLP | P a g e 150
Annex 11: Minerals exported in 2013/14
N° Companies Country of destination
Mineral Types
Quantity (Tons)
FOB Value (in ETB)
%
1 MIDROC Gold Mine Plc
Zurich, Switzerland Gold
3.63
3,023,569,611.93 95.8%
Zurich, Switzerland Silver
1.06
8,482,326.90 0.3%
2 Ethiopian Mineral Development Sc China, USA Tantalite
52.00
58,552,877.96 1.9%
3 Sammakka Stones Plc India / China Marble block
35.25
593,264.94 0.0%
4 National Mining Corporation Plc China
Marble Block
354.60
2,009,867.71 0.1%
5 A Zeyneba Mining Plc India / China Marble block
86.24
600,871.99 0.0%
6 Derba Midroc Cement Plc Kenya Cement
35,200.00
63,243,169.18 2.0%
Total 3,157,051,991
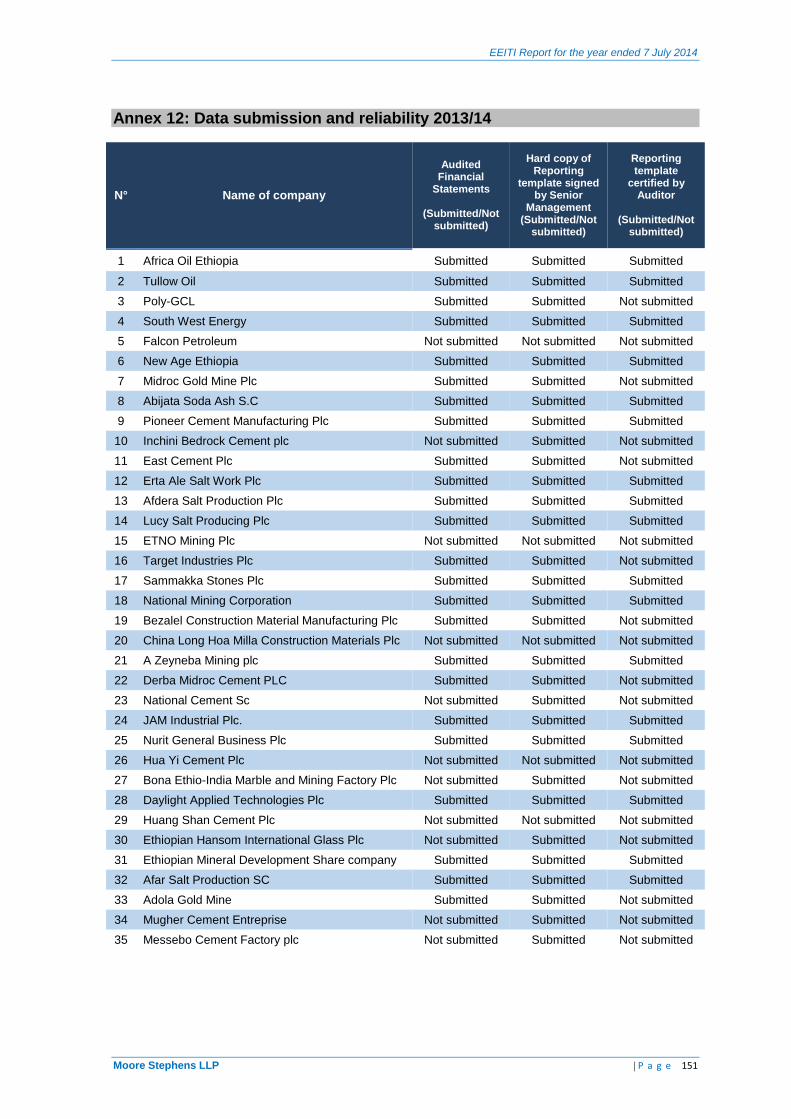
EEITI Report for the year ended 7 July 2014
Moore Stephens LLP | P a g e 151
Annex 12: Data submission and reliability 2013/14
N° Name of company
Audited Financial
Statements
(Submitted/Not submitted)
Hard copy of Reporting
template signed by Senior
Management (Submitted/Not
submitted)
Reporting template
certified by Auditor
(Submitted/Not
submitted)
1 Africa Oil Ethiopia Submitted Submitted Submitted
2 Tullow Oil Submitted Submitted Submitted
3 Poly-GCL Submitted Submitted Not submitted
4 South West Energy Submitted Submitted Submitted
5 Falcon Petroleum Not submitted Not submitted Not submitted
6 New Age Ethiopia Submitted Submitted Submitted
7 Midroc Gold Mine Plc Submitted Submitted Not submitted
8 Abijata Soda Ash S.C Submitted Submitted Submitted
9 Pioneer Cement Manufacturing Plc Submitted Submitted Submitted
10 Inchini Bedrock Cement plc Not submitted Submitted Not submitted
11 East Cement Plc Submitted Submitted Not submitted
12 Erta Ale Salt Work Plc Submitted Submitted Submitted
13 Afdera Salt Production Plc Submitted Submitted Submitted
14 Lucy Salt Producing Plc Submitted Submitted Submitted
15 ETNO Mining Plc Not submitted Not submitted Not submitted
16 Target Industries Plc Submitted Submitted Not submitted
17 Sammakka Stones Plc Submitted Submitted Submitted
18 National Mining Corporation Submitted Submitted Submitted
19 Bezalel Construction Material Manufacturing Plc Submitted Submitted Not submitted
20 China Long Hoa Milla Construction Materials Plc Not submitted Not submitted Not submitted
21 A Zeyneba Mining plc Submitted Submitted Submitted
22 Derba Midroc Cement PLC Submitted Submitted Not submitted
23 National Cement Sc Not submitted Submitted Not submitted
24 JAM Industrial Plc. Submitted Submitted Submitted
25 Nurit General Business Plc Submitted Submitted Submitted
26 Hua Yi Cement Plc Not submitted Not submitted Not submitted
27 Bona Ethio-India Marble and Mining Factory Plc Not submitted Submitted Not submitted
28 Daylight Applied Technologies Plc Submitted Submitted Submitted
29 Huang Shan Cement Plc Not submitted Not submitted Not submitted
30 Ethiopian Hansom International Glass Plc Not submitted Submitted Not submitted
31 Ethiopian Mineral Development Share company Submitted Submitted Submitted
32 Afar Salt Production SC Submitted Submitted Submitted
33 Adola Gold Mine Submitted Submitted Not submitted
34 Mugher Cement Entreprise Not submitted Submitted Not submitted
35 Messebo Cement Factory plc Not submitted Submitted Not submitted
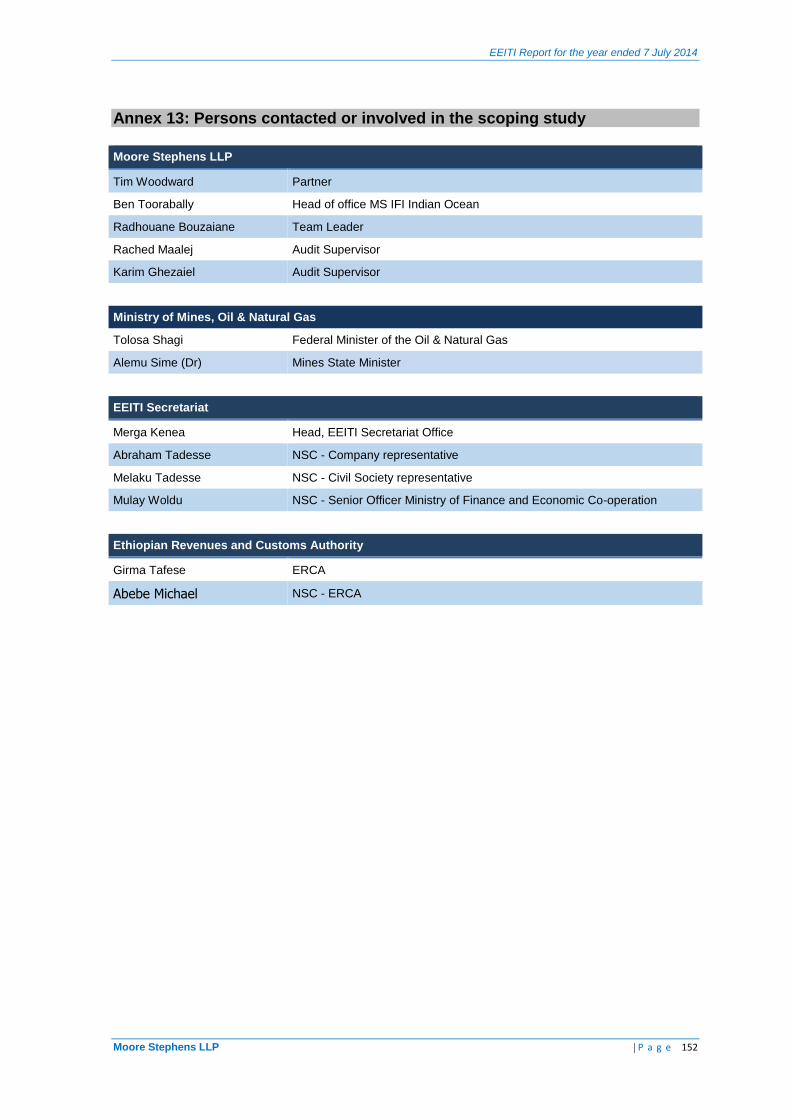
EEITI Report for the year ended 7 July 2014
Moore Stephens LLP | P a g e 152
Annex 13: Persons contacted or involved in the scoping study
Moore Stephens LLP
Tim Woodward Partner
Ben Toorabally Head of office MS IFI Indian Ocean
Radhouane Bouzaiane Team Leader
Rached Maalej Audit Supervisor
Karim Ghezaiel Audit Supervisor
Ministry of Mines, Oil & Natural Gas
Tolosa Shagi Federal Minister of the Oil & Natural Gas
Alemu Sime (Dr) Mines State Minister
EEITI Secretariat
Merga Kenea Head, EEITI Secretariat Office
Abraham Tadesse NSC - Company representative
Melaku Tadesse NSC - Civil Society representative
Mulay Woldu NSC - Senior Officer Ministry of Finance and Economic Co-operation
Ethiopian Revenues and Customs Authority
Girma Tafese ERCA
Abebe Michael NSC - ERCA