ethnicity data online resource - … · ethnicity data online resource ... new zealand’s ethnic...
TRANSCRIPT

Ethnicity Data Online Resource Providing a range of facts and figures, presented for the first time with a focus on ethnicity
DEMOGRAPHIC OVERVIEW
New Zealand’s Ethnic Diversity The ethnic composition of New Zealand’s population has changed dramatically since the 1940s, largely as a result of changes to immigration policy. A history of immigration to New Zealand. (http://www.teara.govt.nz/en/history-of-immigration) . The UK, Australia and the Pacific are traditional sources of migrants to New Zealand; however, the 1990s saw a significant increase in migration from Asia. An emerging group of migrants from the Middle East, Latin America and Africa made up about one percent of the New Zealand population by 2006. In the 2006 Census, the New Zealand population consisted of more than 200 ethnicities.
Projected population growth
Between now and 2026 the Asian, Māori and Pacific communities are all projected to grow faster than the New Zealand population overall.
All ethnic populations will increase numerically, but their relative percentages of the New Zealand population are projected to change considerably. The Asian population is expected to show the largest relative growth of all ethnic groups, averaging three percent a year. Natural increase (births minus deaths) of the population is set to decline gradually as the population begins to age and fertility rates remain stable. Net migration (arrivals minus departures) will become an increasingly significant factor in population growth (Ministry of Social Development, 2010, The Social Report 2010, Wellington, pp. 10-11). The growth in the Asian population to 2026 is expected to be driven largely by the numbers migrating here, with natural increase a secondary factor. In contrast, Māori and Pacific population growth will be mainly driven by higher fertility rates combined with a youthful age structure (Statistics New Zealand April 2010, Hot off the Press: National ethnic population projections).
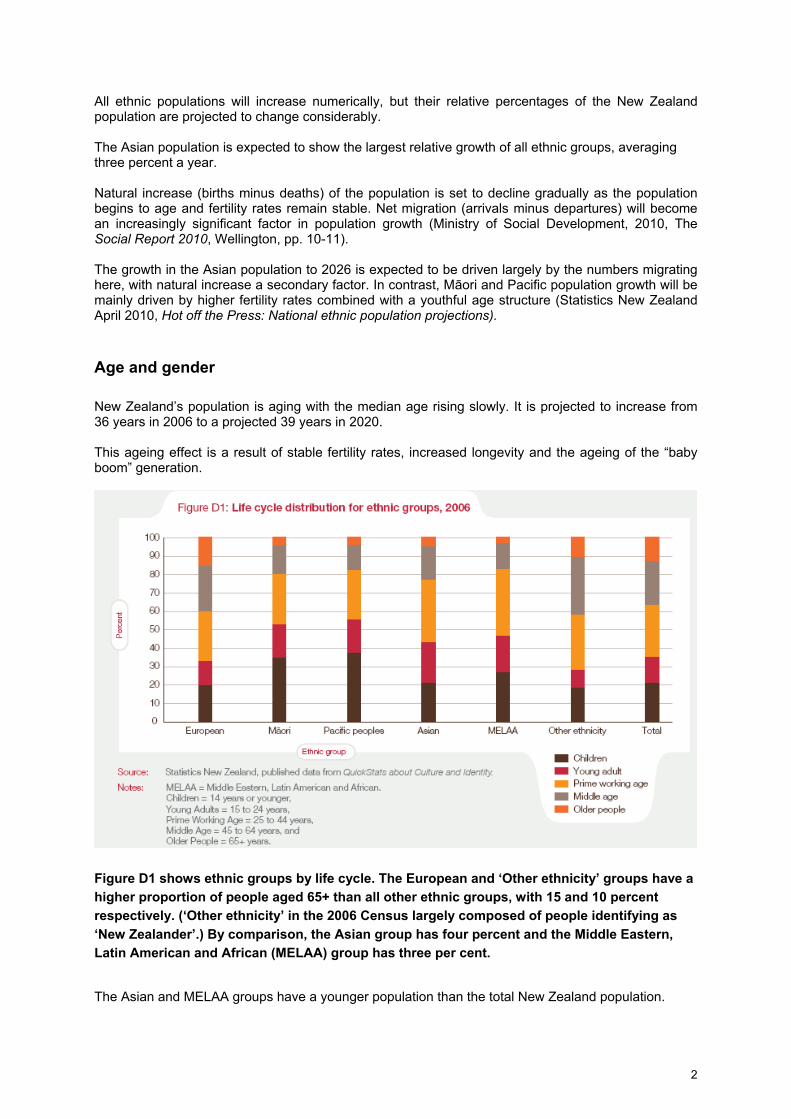
Age and gender New Zealand’s population is aging with the median age rising slowly. It is projected to increase from 36 years in 2006 to a projected 39 years in 2020. This ageing effect is a result of stable fertility rates, increased longevity and the ageing of the “baby boom” generation.
Figure D1 shows ethnic groups by life cycle. The European and ‘Other ethnicity’ groups have a higher proportion of people aged 65+ than all other ethnic groups, with 15 and 10 percent respectively. (‘Other ethnicity’ in the 2006 Census largely composed of people identifying as ‘New Zealander’.) By comparison, the Asian group has four percent and the Middle Eastern, Latin American and African (MELAA) group has three per cent.
The Asian and MELAA groups have a younger population than the total New Zealand population.
2
Thirty-five percent of the New Zealand population is aged 24 and under, while almost 50 per cent of the Asian and MELAA populations are in this age bracket. Māori and Pacific ethnic groups have larger proportions of children under 14 years of age than MELAA, Asian, European and ‘Other’ groups. In 2006 fertility rates for the major ethnic groups (based on the mother’s ethnicity) were 1.5 births per woman for the Asian ethnic group, 1.9 births for European women, 2.8 births for Māori women, and 3.0 for Pacific women in 2006 (Statistics NZ (January 2011), Demographic Trends: 2010). Fertility rates are calculated using live births over a three year period centred on a Census year. These can be accessed from the Births tables (http://www.stats.govt.nz/browse_for_stats/population/births/births-tables.aspx) on the Statistics NZ website. The gender ratio of males and females is generally equal in the New Zealand population. This is similar for all ethnic groups.
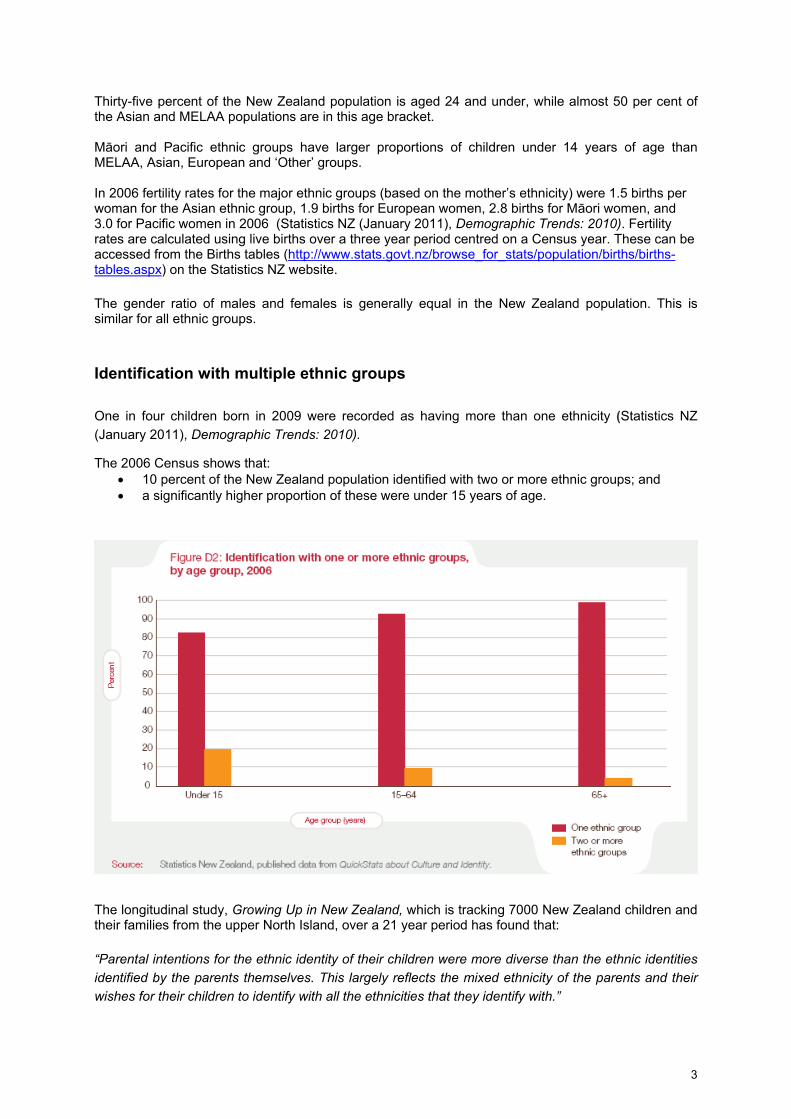
Identification with multiple ethnic groups One in four children born in 2009 were recorded as having more than one ethnicity (Statistics NZ (January 2011), Demographic Trends: 2010).
The 2006 Census shows that: • 10 percent of the New Zealand population identified with two or more ethnic groups; and • a significantly higher proportion of these were under 15 years of age.
The longitudinal study, Growing Up in New Zealand, which is tracking 7000 New Zealand children and their families from the upper North Island, over a 21 year period has found that: “Parental intentions for the ethnic identity of their children were more diverse than the ethnic identities identified by the parents themselves. This largely reflects the mixed ethnicity of the parents and their wishes for their children to identify with all the ethnicities that they identify with.”
3

(Morton, S.M.B., et. al., (2010), Growing Up in New Zealand: A longitudinal study of New Zealand children and their families. Report 1: Before we are born, p. ix.)
Regional distribution of New Zealand’s ethnic population Auckland is New Zealand’s most ethnically diverse city: Asians make up 20 per cent of its population, Pacific peoples 14 per cent and Maori 11 per cent. The Asian population of Auckland is expected to increase to 33 per cent by 2021 (Statistics NZ (January 2011), Demographic Trends: 2010). About two-thirds of that growth is projected to occur in the four cities of the Auckland region.
Figure D3 shows that more than 50 per cent of the total Asian and MELAA ethnic populations in New Zealand are based in Auckland. Ninety per cent of Asians live in the four most populated regions in New Zealand, with the MELAA group close behind with 85 percent. In contrast, 63 per cent of Europeans live in the four most populated regions in New Zealand.
Other regions The projected growth in the ethnic population is expected to take place largely in the North Island and will increase the ethnic diversity of many regions. In contrast, in Southland one percent of the population is Asian.
Urbanisation (Information about Urbanisation in New Zealand has been sourced from Statistics NZ urban/rural profiles: http://www.stats.govt.nz/browse_for_stats/people_and_communities/geographic-areas/urban-rural-profile-update.aspx)
4

Worldwide more and more people are living and working in urban, rather than rural, areas. New Zealand is following this global trend:
• 71 per cent of the population is based in the main urban centres • 14 per cent is in rural areas.
Asian, MELAA and Pacific peoples are more heavily concentrated in main urban centres, with over 90 percent for each ethnic group. The figure for Europeans and Māori is 69 and 65 per cent respectively.
Migrants and Refugees Nearly one in four people living in New Zealand in 2006 were born overseas.
Figure D4 shows, the proportion of people living in New Zealand who were born overseas has increased from 16 percent in 1991 to 23 percent in 2006.
In the Organisation of Economic Co-operation and Development (OECD), New Zealand, at 23 per cent, has the fourth highest proportion of people born overseas. The OECD average is 12 per cent. Twenty-four per cent of Australia’s population has been born overseas.
5

Table D2 shows that people who were born overseas are most likely to come from England, China, Australia, Samoa and India.
The number of people from China and India has increased significantly in recent years. The total proportion of those from the Asian continent increased from 24 percent in 2001 to 29 percent in 2006, the same proportion as those from the UK/Irish Republic. The rapid change in New Zealand’s ethnic population is highlighted by the number of those born overseas who have lived in this country for less than a decade.
• In 2006, 47 percent of people born overseas had been here for less than 10 years • Of those born in Asia, 67 percent had lived in New Zealand for less than 10 years.
Refugees in New Zealand (Information for this section comes from: Department of Labour (2010), Mangere Refugee Resettlement Centre: First Steps to a New Future) New Zealand began a formal resettlement policy for refugees in the mid 1940s. 1944: The first separate official statistic for refugees is recorded with the arrival of 800 people from Poland – the majority being orphaned children. 1977: New Zealand accepts its first quota of Indochinese ‘boat people’. 1980: Refugees from South East Asia begin arriving. 1997: By now, Ethiopian, Somali, Assyrian and Sudanese refugees have started to arrive. 2001: The first refugees from Afghanistan are accepted.
6

Table D3 shows some of the countries of origin of New Zealand’s refugee population. The greatest numbers of refugees have come from Cambodia, Vietnam, Iraq, Somalia, Afghanistan, Burma, Laos and Ethiopia.
Languages In 2006, 18 percent of people spoke two or more languages.
7

Table D4 shows the most commonly spoken languages in New Zealand are English, Māori, Chinese and Samoan. Furthermore, the prevalence of Hindi speakers almost doubled from 22,749 in 2001 to 44,589 speakers in 2006. There has also been a steady rise in people speaking Afrikaans, Spanish and Korean languages.
The first results from the Growing Up in New Zealand study show that 32 per cent of parents are able to converse with their children in two languages, and about five per cent can converse in three languages or more. The study predicts that families will be increasingly bilingual and multilingual. (Morton, S.M.B., et. al., (2010), Growing Up in New Zealand: A longitudinal study of New Zealand children and their families. Report 1: Before we are born, p. 31)
Faith New Zealand remains a largely Christian-based society. There are many other faiths that people practice, however, their numbers as a percentage of all faiths is still very small, at 7 percent. The number of people identifying themselves as Christian has dropped by five percent in the ten years to 2006. In the same period, most other religions have experienced large percentage increases, but the overall numbers still remain small.
• Buddhism, saw an 86 percent, increase to 1.39 percent of total population • Hinduism, a 152 percent, increase to 1.72 percent of total population • Islam, a 166 percent increase to 0.95 percent.
8

Figure D5 shows that 54 percent of the total population identify as Christian, followed by “No faith” (35 percent). People who identified as Christians had the highest numbers for all ethnic groups (Pacific Peoples had the highest with 80 percent). MELAA and Pacific Peoples were less likely to specify “No faith” than Europeans, Māori and Asians. Asian and MELAA ethnic groups have a wider scope of faiths represented than Europeans, Māori and Pacific Peoples.
9

APPENDIX A
Further Demographic Data
The New Zealand Government Population and Sustainable Development website, www.population.govt.nz provides access to New Zealand population statistics published by a wide range of government departments and agencies. The website is a multi-agency collaboration between Statistics NZ, Department of Labour, Ministry of Economic Development and the Ministry of Social Development.
The website provides access to information about New Zealand's population by subject: • Estimates, counts and projections (the three main kinds of population information). • Population structure (age, sex and ethnicity and people’s living circumstances including
marriages and divorces, families and households). • Population groups (information about major ethnic groups, children, youth, women and
older people). • Migration (how New Zealand's population changes when people enter or leave).
Statistics New Zealand
Demographic Trends The main reference volume on population and related statistics, Demographic Trends is released annually, and provides commentaries on major demographic indicators of the New Zealand population. The topics covered are: population change and structure, births, marriages, divorces, deaths, life expectancy, international travel and migration, sub-national population estimates, and national and sub-national demographic projections. http://www.stats.govt.nz/browse_for_stats/population/estimates_and_projections/demographic-trends-2010.aspx
Asia New Zealand Foundation
Outlook Series This series includes a number of papers that provide information about Asian ethnic communities in New Zealand’s main cities, such as information on immigration history and a range of reasons for the particular Asian demographic profile for each city. The papers include:
Outlook 10 - Asians in Wellington: Changing the ethnic profile of the capital city.
Outlook 09 - Asians in Dunedin: Not a New Story
Outlook 08 - Asians in Christchurch: The 'Most British' City Diversifies
Outlook 07 - Asians in New Zealand: Implications of a Changing Demography
Outlook 06 - Diverse Auckland: The Face of New Zealand in the 21st Century?
http://www.asianz.org.nz/our-work/knowledge-and-research/outlook-series
10

Demographic data on Youth
Department of Labour
Migrant and Refugee Youth in New Zealand: Statistical Profile, 1996 to 2007 This report provides an analysis of Immigration approval data (1998-2007) and Census data (1996, 2001 and 2006) and covers a range of characteristics and key outcomes including immigration approval trends, demographic data, ethnic identity, English language ability, labour force and study participation, location in New Zealand, and living arrangements. The report highlights areas where youth born overseas differ from those born in New Zealand and identifies trends over three censuses. The analysis is intended to inform future research and policy development. http://www.dol.govt.nz/pdfs/mrynz.pdf
Ministry of Youth Development
Youth Statistics: A Statistical Profile of Young New Zealanders The site provides key demographic information at the national level - who young people are, where they live, who they live with, and what they are doing. Detailed information about youth wellbeing over more than fifty indicators in nine core domains is also presented, including the themes covered by the 1in4 report (as well as many others). Key findings include: young people (aged 12 to 24) are less likely to have two parents who live together, and a growing number of youth have blended family relationships; they are more ethnically diverse and have grown up with greater exposure to different cultures; and gender roles and responsibilities are more flexible, providing young people with greater choices and opportunities. http://www.youthstats.myd.govt.nz/
11

12