ethyl glucuronide, ethyl sulfate and acetone as biomarkers
TRANSCRIPT

80
Ain Shams Journal of Forensic Medicine and Clinical Toxicology
July 2019, 33: 80-91
Ethyl Glucuronide, Ethyl Sulfate and Acetone as Biomarkers for Alcohol Based Hand Sanitizers Chronic Exposure in Health Care Workers
Ghada N. Mansour1 and Dina S. El-rafey2
1 Department of Forensic Medicine & Clinical Toxicology. 2 Department of Community, Environmental and Occupational medicine Department.
Faculty of Medicine, Zagazig university, Zagazig, Egypt.
All rights reserved.
Abstract Introduction: health care workers (HCWs) are exposed to alcohols during hand antisepsis by both
dermal contact and inhalation. This study aimed to assess the ethanol and isopropanol (ISOP)
absorption in HCWs due to alcohol based hand sanitizers (ABHSs) use in real work conditions and
to characterize the highest measurable concentrations of ethyl glucuronide (EtG) and ethyl sulfate
(EtS) that could be produced by ABHSs use in order to recommend appropriate threshold
concentrations specific enough to eliminate the possibility of false positive results due to incidental
exposures to ethanol in Egypt.
Subject and Methods: ethanol and ISOP absorption were assessed in 74 HCWs using ABHSs
during regular 8-hours working shift through measuring urinary concentrations of ethanol and its
metabolites ethyl glucuronide (EtG) and ethyl sulfate (EtS) before the ABHSs use and for the
following 24 hours as well as blood ISOP and its metabolite acetone were measured before ABHSs
use and at the end of 8-hours shift.
Results: the highest maximum median urinary ethanol (8.75 mg/L), EtG (538.93 ng/mL) and EtS
(62 ng/mL) as well as blood ISOP (4.9 mg/L) and acetone (6.32 mg/L) concentrations were
recorded in group III (excessive ABHSs use), all these parameters returned to base line within 24
hours. Parameters were correlated to frequency, quantity of ABHSs used. EtG was correlated
positively to the concentration of ethanol in ABHSs.
Conclusion: ABHSs use generated measurable levels of ethanol, EtG and EtS in urine as well as
ISOP and acetone in blood. their concentrations decrease to baseline levels within 24 hours (not
accumulated). EtG cut off of 1000 ng/ml and EtS cut off 100ng/ml seemed to be more promising in
identification of incidental alcohol use in HCWs. Measuring EtS with EtG might be useful in
incidental ethanol exposure.
Key words ABHSs, Ethyl glucuronide, Ethyl sulfate, Isopropanol, Ethanol.
Introduction and hygiene products are heavily used in
everyday life (Chan & Chan, 2018) especially
in the healthcare setting where the routine use
of such products is a major aspect of modern infection
control procedures (Bolon, 2016).
Alcohol-based hand sanitizers (ABHSs) are
always preferred because of its greater effectiveness
(Centre for Health Protection, 2017). Since ABHSs
mostly contain ethanol, iso-propyl alcohol (ISOP), n-
propyl alcohol, or their combinations (Pires et al.,
2017), the health care workers (HCWs) are exposed to
the applied alcohols during hand antisepsis not only by
dermal contact, but also by inhalation (Arndt et al.,
2014).
Concerns about high alcohols absorption have
been raised that may adversely affect HCWs (WHO,
2009). In the 2015, FDA indicated that, their
administrative record for the safety of ABHSs is
incomplete with respect to the human pharmacokinetic
studies under maximal use conditions when applied
topically and the effect of formulation on dermal
absorption (Maier et al. 2015).
Alcohols biomarkers are physiological
indicators of alcohol exposure, among the available
direct biomarker are ethyl glucuronide (EtG) and ethyl
sulfate (EtS) which are minor non-oxidative direct
biomarkers of ethanol (SAMHSA, 2012).
Ethyl glucuronide (EtG) and ethyl sulfate
(EtS) are usually measured in urine and become
H

81 Mansour and El-rafey / Ain Shams J Forensic Med Clin Toxicol, July 2019 (33): 80-91
positive shortly after exposure to alcohol and may
remain detectable in urine for 1 to 2 days (Litten et al.,
2010).
During past years most data on alcohols
absorption after hand antisepsis were obtained from
standardized experimental studies under controlled
conditions (Gessner et al., 2016), assessing only
ethanol or propanols absorption but not in real
exposure during regular work where health care
workers use mixed ABHSs made up of at least two
different alcohols, typically ethanol and ISOP
(Bessonneau et al.,2010).
Aim of the work This study aimed to: first; to assess the ethanol
and ISOP absorption in HCWs following frequent
application of two ABHSs containing ethanol and
ISOP in two different concentrations during regular 8-
hours working shift through measuring serial urinary
concentrations of ethanol and its metabolites EtG and
EtS at the beginning of an 8-hours working shift and
every 2 hours for the following 24 hours and measuring
ISOP and its metabolite acetone in blood at the
beginning and at the end of 8-hours working shift and
the relation of these parameters to the frequency,
quantity and alcohols concentrations of ABHSs used.
Second; to characterize the highest measurable
concentrations of EtG and EtS that could be produced
by ABHSs use in order to recommend appropriate
threshold concentrations specific enough to eliminate
the possibility of false positive results due to incidental
exposures to ethanol in Egypt.
Subjects and methods 1- Study design:
A comparative cross sectional study was conducted on
74 HCWs in private hospitals and clinics in Cairo-
Egypt during the period from June 2016 to June 2018.
Previously arranged semi structured interview was
conducted with all participants in their workplace to fill
a designed questionnaire. Participants were instructed
to refrain from any ethanol intake or use as well as
household disinfectants 24 hours before the study day
and for the next 48 hours after repeatedly using ABHSs
during a single 8-hour working shift. Prohibition of
alcohol intake included consumption of alcoholic
beverages, grape juice, apple juice, malt beer or
alcohol-free beer, nonalcoholic energy drinks, and the
use of alcohol-containing cosmetics such as aftershave,
mouthwash, eye makeup remover, shave lotions, and
ethanol-based aerosol product.
Sample size calculation: it was calculated
using Open-Epi according to the following; the mean
value of urinary ethanol among low users was
1.53±0.65 and among excessive users was 1.95±0.5, so
at power of study 80% and CI 95% the sample size was
calculated to be 60 users, 30 as low users and 30 as
excessive users. Another 14 subjects with intermediate
user were chosen as a confirmative of the relation
between the measured parameters and both the
frequency and amount of ABHSs used. Therefore, the
total subjects were 74 HCWs.
2- Data Collection:
A structured questionnaire was used, based on those of
other relevant studies and also guidelines on Hand
Hygiene in Health Care (WHO, 2009). The
questionnaire composed of three main parts:
Socio-demographic and occupational data:
age, sex, weight, education, residence, marital status,
pregnancy or lactation in female, medical history,
special habits, prescribed medication usage, Usage of
alcohol containing cosmetics and its frequency,
duration of work, working days/weak, working hours
/day.
Professional practice data: the type of hand
sanitizer frequently used, frequency of use/working
hours, amount/use, frequency of hand wash/ working
hours, usage of waterproof coverage of wounded skin,
eating and drinking at workplace and the use of neutral
pH soap before eating or drinking.
Symptoms related to hand sanitizers use:
respiratory tract irritation (cough, sneezing and chest
tightness) and skin irritation (redness, dryness, itching,
cracking, and bleeding).
Ventilation of work place: existence of odors
more than 10 minutes after use, strong odors away
from the source, remaining of product odors in the
morning in working place and presence of air
conditions or extractors.
3- Subjects:
Seventy-four healthy HCWs were chosen to be
involved in this study according to the data collected
from the questionnaire, they had the same working
hours (8 hours/shift) and working days (6 days/week),
with matched socio-economic standard and nutritional
habits and nonsmokers with no special habits.
Exclusion criteria:
History of ethanol use disorder.
Obsessive-compulsive disorder involving
hand washing.
Hepatic or renal dysfunction, diabetes
mellitus, and symptoms of urinary tract
infection.
Pregnant or lactating women.
Usage of alcohol containing cosmetics or
medications in any form within 24 hours
before or on the day of the study.
Positive first urine specimen withdrawn
before ABHSs use for EtG and EtS (>500
ng/mL and 100 ng/mL respectively)
(Andresen et al., 2018).
All participants were informed about the study aim and
research design. An informed consent was obtained
from those who agree to participate. Reassurance of
confidentially was confirmed. All data were
documented by a code, rather than participant's name.
According to mood of use, subjects were
divided into 3 groups:
Group I (low use group): including 30 HCWs with
mild use of ABHSs (10-19 times /shift).
Group II (intermediate use group): including 14
HCWs with moderate use of ABHSs (20-29 times
/shift).
Group III (excessive use group): including 30 HCWs
with excessive use of ABHSs (≥ 30 times /shift).
82 Mansour and El-rafey / Ain Shams J Forensic Med Clin Toxicol, July 2019 (33): 80-91
According to ABHSs used, subjects were
divided into 2 groups:
Group A: including 37 HCWs using ABHSs type A.
Group B: including 37 HCWs using ABHSs type B.
4- Hand rubs used: Two commercially hygienic hand rubs were found to
be commonly used by participants and were tested in
this study:
Hand rub A: consists of ethanol 80% and
ISOP 45%.
Hand rub B: consists of ethanol 65% and
ISOP 60%.
The hand rubs did not contain any fragrance or dye but
a mixture of skin care components.
5- Methods:
Sample collection:
A) Blood samples collection:
ISOP and its metabolite acetone were measured in
HCWs' blood before the first use of ABHSs and at the
end of 8-hour working shift. Five ml of peripheral
venous blood in EDTA tube were taken from HCWs
under complete aseptic conditions. Skin antisepsis was
performed with an alcohol-free skin antiseptic (7.5%
povidone-iodine solution). Blood samples were stored
at -4ºC and were processed within 12 hours of
collection.
B) Urine samples collection:
Ethanol and its metabolites EtG and EtS were
measured in HCWs’ midstream urine obtained before
any ABHSs exposure and every two hours until the
following 24 hours. HCWs collected their urine
samples themselves and noted the time of passing urine
on each sample. To exclude subsequent enzyme
activity samples were protected from sunlight by
collecting them in polystyrene boxes and stored at 4ºC
up to a maximum of 24 hours (Baranowski et al., 2008
and Helander et al., 2007).
Procedures:
A. Chemical analysis of ethanol, ISOP and
acetone concentrations in biological
samples: Analysis was performed using Gas Chromatography
(GC) in a modification of the method described by
Roemhild et al. (1998)
Sample preparation:
One mL of sample (blood for ISOP and acetone or
urine for ethanol) or standard and 0.5 g of anhydrous
Na2SO4 were filled in 1.5-mL head space vials and
incubated for 45 minutes at 75ºC, then 2.5 mL was
injected directly into GC with time interval of 0.5
minute.
Instruments and GC conditions:
Gas chromatography (modification of Römhild by
Head-space injection with flame-ionization detection).
The chromatographic conditions were an injector
temperature of 150ºC, a detector temperature of 250ºC,
a column temperature program of 40ºC for 8 minutes,
followed by a ramp of 3ºC/minute to 120ºC (0 minutes)
and then 30ºC/minute to 230ºC (5 minutes). Nitrogen
(5.0) served as the carrier gas at a rate of
1.45mL/minute (21.9 cm/s).
Linearity and calibration:
For each measurement, calibration was performed
according to the method of the external standard with 3
calibration points (Medidrug BGS-S, levels 1-3;
Medichem, Steinenbronn, Germany) and custom-made
standards in water which were used for control
standards. The method’s detection limits were 0.14
mg/L for ethanol, 0.03 mg/L for ISOP, and 0.01 mg/L
for acetone. For all measurements, quality controls
were performed using certified reference material
(Medidrug BGS 2/05 S-Plus; Medichem). Calibration
with external or self-made standard was needed if the
sample concentration did not lie in the calibration level.
b. Chemical analysis of EtG and EtS concentrations
in urine: EtG and EtS quantitation in subjects' urine samples was
performed using high-performance liquid
chromatography tandem mass spectrometry (LC-MS-
MS) instrument according to Albermann et al., (2012).
Chemical and reagents: EtG/EtS and d5-EtG/d5-EtS (Lipomed, Arlesheim,
Switzerland), Methanol, acetonitrile, and formic acid
(98%) (Merck, Darmstadt, Germany). Water was
purified with a NANO pure Diamond Analytic Water
Purification System D11901 (Barnstead, Dubuque, IA).
Stock solutions of EtG and EtS (both 1 g/L) as well as
of d5-EtG and d5-EtS (both 5 g/L) were prepared in
methanol by weighing separately. All solutions were
stored at –20C. Standards used for calibration were
prepared by spiking blank urine at 0.025, 0.05, 0.1,
0.25, 0.5, 1, and 2 mg/L. Quality control samples were
prepared at 0.1, 0.35, 0.5, and 1.5 mg/L. All working
solutions were stored in a refrigerator (2-8ºC).
Sample preparation:
For protein precipitation, 20 µL of the internal standard
[methanolic solution of d5-EtG and d5-EtS (both 2.5
µL /mL)] and 280 µL methanol were added to a 100
µL urine sample. The samples were vortexed for a
short time and centrifuged (12,000 rpm for 5 min).
Then 300 µL of the supernatant were separated and
evaporated to dryness under a stream of nitrogen at
40ºC. The dried extracts were reconstituted with 600
µL of 0.1% aqueous formic acid and 10 µL aliquots
were injected directly into injected into LC-MS-MS.
Instruments and LC-MS-MS conditions:
Analyses were performed on a Shimadzu LC-20A
Series system (Shimadzu, Duisburg, Germany)
interfaced to a 4000 Q-Trap (Applied
Biosystems/Sciex, Darmstadt, Germany) with an
electrospray Turbo V Ion source in negative mode. The
ESI source settings were: ion-spray voltage, – 4500 V;
source temperature, 4508C; nebulation and heating gas,
(N2), 60 psi and 50 psi, respectively. A mobile phase
of water containing 0.1% of formic acid (solvent A)
and acetonitrile (solvent B) was used with a flow rate
of 0.2 mL/min, and the following gradient program
was used: 100% A for 6 min; switch to 100% B over 1
min and hold for 2 min; back to 100% A over 1 min
and hold for 4 min. Using a tee mixer, acetonitrile was
added post-column (0.1 mL/min) to enhance analyte
ionization. Detection of the ions was performed in
multiple reaction monitoring (MRM) mode, using the
following precursor to product ion transitions: EtG
221/75 (target), 221/85 (qualifier 1), 221/113 (qualifier
83 Mansour and El-rafey / Ain Shams J Forensic Med Clin Toxicol, July 2019 (33): 80-91
2); d5-EtG: 226/85 (target), 226/75 (qualifier); EtS
125/97 (target), 125/ 80 (qualifier 1), 125/64 (qualifier
2); d5-EtS: 130/98 (target), and 130/ 80 (qualifier). The
expected relative peak areas of the transitions for EtG
and EtS are: 221/75:221/85:221/113 100:100:60 and
125/ 97:125/80:125/64 100:30:1, respectively. Analysis
of the collected data was carried out with Analyst
software (Version 1.4.2, Applied Biosystems/Sciex,
Darmstadt, Germany).
Linearity and calibration:
Calibration was evaluated by analyzing six replicates
of spiked urine samples with EtG and EtS at 0.025,
0.05, 0.1, 0.25, 0.5, 1.0, and 2.0 mg/L. Based on the
EtG/EtS calibrator, concentrations at 0.010, 0.015,
0.020, 0.025, and 0.030 mg/L were used; the limits of
detection (LOD) and the limits of quantitation (LOQ)
were calculated according to the German Industrial
norm DIN 32645.The results were: EtG 0.005 mg/L
(LOD) and 0.019 mg/L (LOQ) and EtS 0.005 mg/L
(LOD) and 0.015 mg/L (LOQ).
To minimize the physiological variations in urinary
excretion, creatinine was measured by the Jaffe method
using an Abbott Architect instrument (Abbott
Laboratories, Abbott Park, IL, USA), and every EtG
and EtS levels was normalized with respect to 100
mg/dL of excreted creatinine (Dahl et al., 2002 and
Goll et al., 2002).
Statistical analysis:
The collected data were computerized and statistically
analyzed using SPSS program (Statistical Package for
Social Science) version 25.0. Qualitative data were
represented as frequencies and relative percentages.
Chi square test was used to calculate difference
between qualitative variables. Quantitative data were
expressed as mean ± SD (Standard deviation), median
and interquartile range (IQR). Mann Whitney test was
used to calculate difference between quantitative
variables in two groups in not normally distributed
data. ANOVA test (F) was used to calculate difference
between quantitative variables in more than two groups
in normally distributed data and Kruskal Wallis test
(K) in not normally distributed data. Post hook LSD
used to compare between groups. Spearman’s
correlation coefficient (r) was used to calculate
correlation between different quantitative variables.
Results considered to be significant when p value <
0.05 and highly significant when p value < 0.01.
Results 1. Demographic data of the participants:
Seventy-four healthy participants were chosen to be
involved in this study with the following demographic
data:
Age: aged from 25-46 years.
Sex: 38 females and 36 males.
Occupation: 14 laboratory staff members, 15
surgeons, 15 dentists, 19 nurses, and 11
pediatricians.
Weight: weigh from 64-95 Kg.
Working period: from 1-15 years.
Working 8 hours/shift for 6 shifts/week.
There were a non-significant differences as regard the
previously mentioned items between the all groups.
The mean values of the frequency of ABHSs use/8
hours shift and the amount of ABHSs/ each use in the
three groups is shown in table (1). A highly significant
differences were found between the three groups with a
highly significant increase in group III when compared
to both group I and II as regard the frequency of
ABHSs use/8 hours shift (table 1). There was a non-
significant difference between both groups A and B as
regard the previous two parameters (p= 0.32, p=0.58
respectively).
As regard the respiratory and dermal symptoms related
to ABHSs use, there was a highly significant difference
between the three groups as regard respiratory
symptoms with a significant increase in group III in
comparison to group I and II, while a non-significant
difference was found as regard dermal symptoms.
When group A and B were compared to each other, a
non-significant difference was found as regard
respiratory symptoms, and a highly significant increase
in group B as regard dermal symptoms as shown in
table (2).
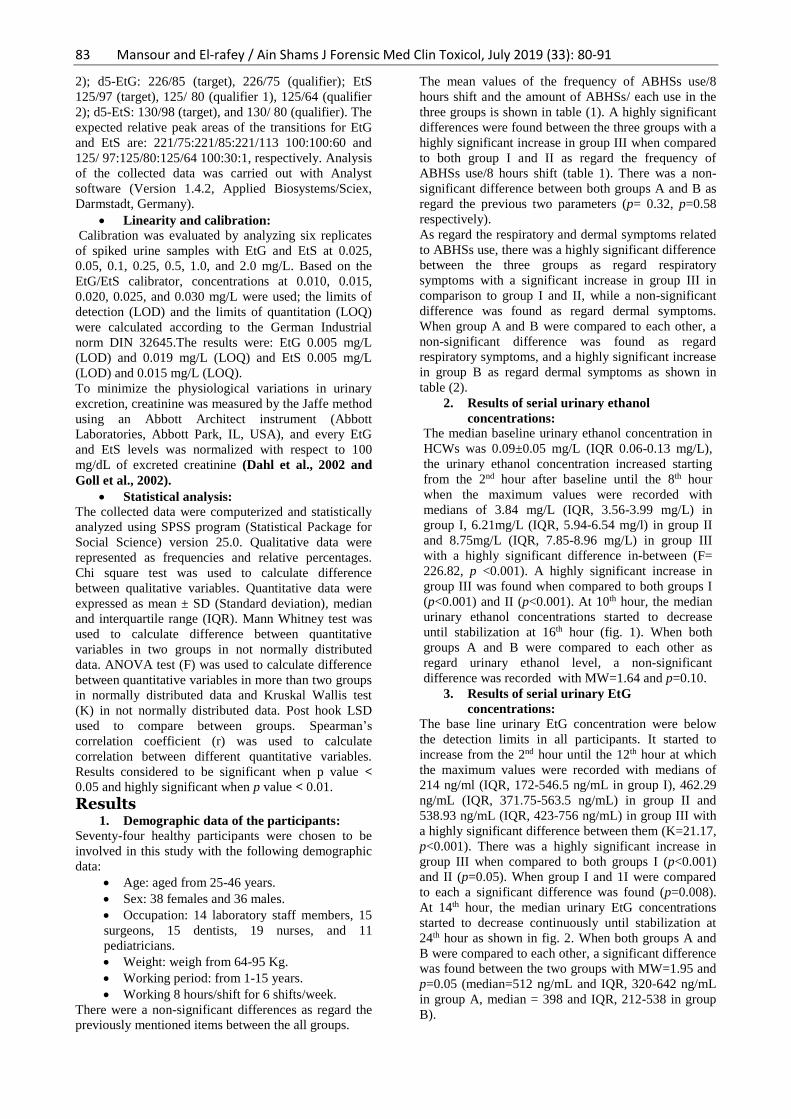
2. Results of serial urinary ethanol
concentrations:
The median baseline urinary ethanol concentration in
HCWs was 0.09±0.05 mg/L (IQR 0.06-0.13 mg/L),
the urinary ethanol concentration increased starting
from the 2nd hour after baseline until the 8th hour
when the maximum values were recorded with
medians of 3.84 mg/L (IQR, 3.56-3.99 mg/L) in
group I, 6.21mg/L (IQR, 5.94-6.54 mg/l) in group II
and 8.75mg/L (IQR, 7.85-8.96 mg/L) in group III
with a highly significant difference in-between (F=
226.82, p <0.001). A highly significant increase in
group III was found when compared to both groups I
(p<0.001) and II (p<0.001). At 10th hour, the median
urinary ethanol concentrations started to decrease
until stabilization at 16th hour (fig. 1). When both
groups A and B were compared to each other as
regard urinary ethanol level, a non-significant
difference was recorded with MW=1.64 and p=0.10.
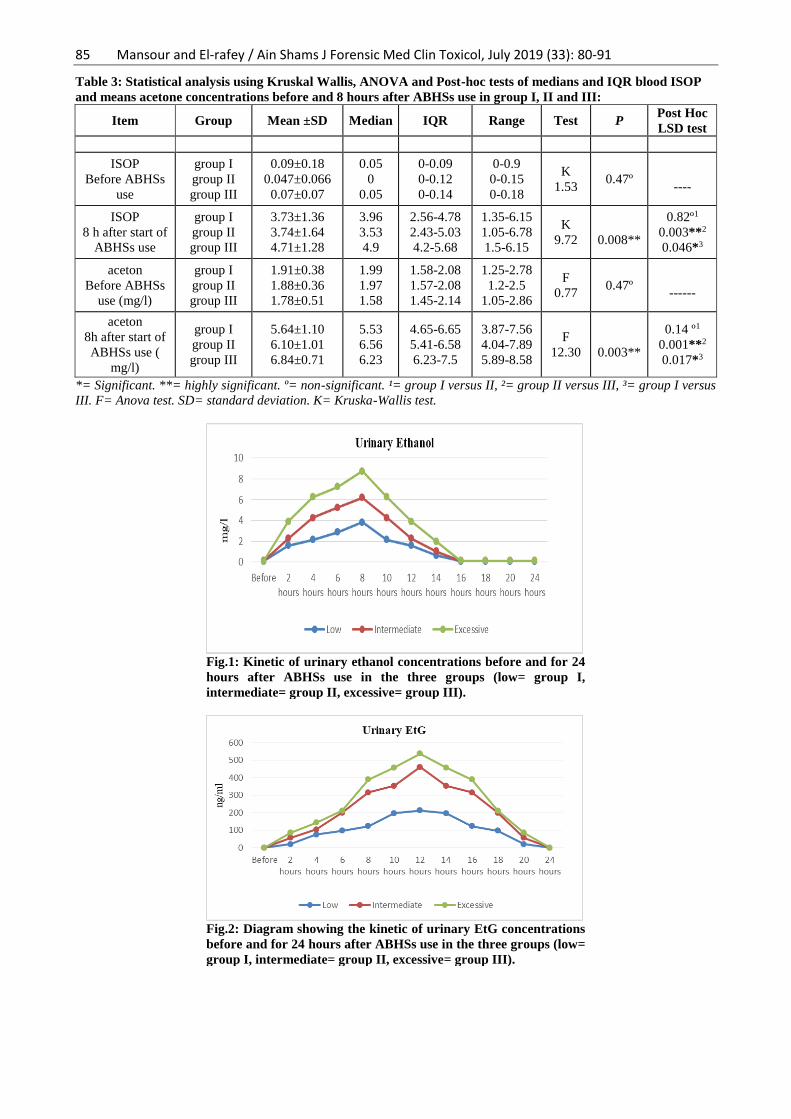
3. Results of serial urinary EtG
concentrations:
The base line urinary EtG concentration were below
the detection limits in all participants. It started to
increase from the 2nd hour until the 12th hour at which
the maximum values were recorded with medians of
214 ng/ml (IQR, 172-546.5 ng/mL in group I), 462.29
ng/mL (IQR, 371.75-563.5 ng/mL) in group II and
538.93 ng/mL (IQR, 423-756 ng/mL) in group III with
a highly significant difference between them (K=21.17,
p<0.001). There was a highly significant increase in
group III when compared to both groups I (p<0.001)
and II (p=0.05). When group I and 1I were compared
to each a significant difference was found (p=0.008).
At 14th hour, the median urinary EtG concentrations
started to decrease continuously until stabilization at
24th hour as shown in fig. 2. When both groups A and
B were compared to each other, a significant difference
was found between the two groups with MW=1.95 and
p=0.05 (median=512 ng/mL and IQR, 320-642 ng/mL
in group A, median = 398 and IQR, 212-538 in group
B).

84 Mansour and El-rafey / Ain Shams J Forensic Med Clin Toxicol, July 2019 (33): 80-91
4. Results of serial urinary EtS
concentrations:
The base line urinary EtS concentration were below
the detection limits in all participants. It started to
increase from the 2nd hour until the 12th hour at which
the maximum values were recorded with medians of
27.5 ng/mL (IQR, 0-68 ng/mL) in group I, 66.7
ng/mL (IQR, 0-77.5 ng/mL) in group II and 68 ng/mL
(IQR, 59-78.25 ng/mL) in group III respectively with
a highly significant difference between them
(K=11.02, p=0.004). There was a highly significant
increase in group III when compared to both groups I
(p<0.001) and II (p=0.05). When group I and 1I were
compared to each a non-significant difference was
found (p=0.07). At 14th hour, the median urinary EtS
concentrations started to decrease continuously until
stabilization at 24th hour (fig. 3). When both groups
A and B were compared to each other, a non-
significant difference was recorded (MW=59,
p=0.65).
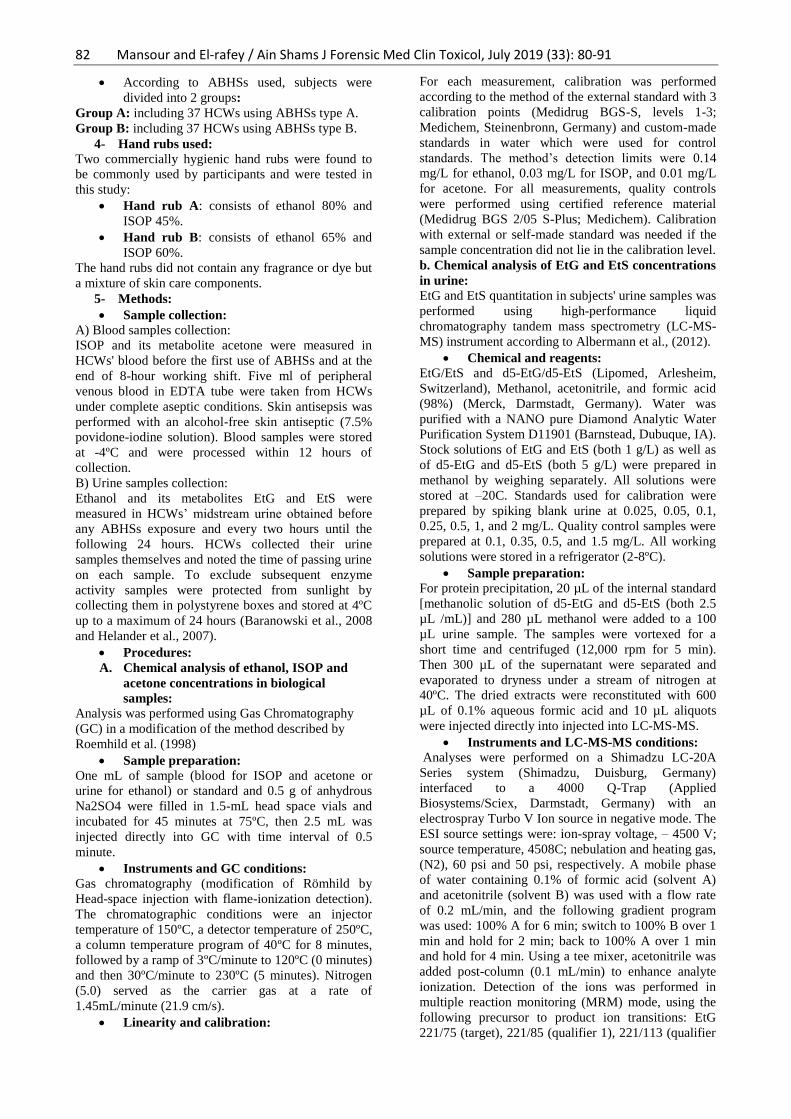
5. Results of blood ISOP and acetone
concentrations:
The participants medians baseline concentrations of
blood ISOP and means of acetone were recorded in
table (3). At the 8th hour, both blood ISOP and acetone
concentrations increased in the three groups with a
highly significant difference between them (table 3 &
fig. 4). There was a highly significant increase in group
III when compared to both groups I and II. When group
I and II were compared to each a non-significant
difference was found as shown in table (3). When both
groups A and B were compared to each other, no
significant difference was found.
The urinary ethanol and its metabolites EtG and EtS
levels were positively correlated to the frequency of
use of ABHSs with r=0.924 & p<0.001, r= 0.523 & p<
0.001 and r= 0.352 &p= 0.002 respectively. As well as
to the amount of ABHSs used with r=0.510 & p<0.001,
r= 0.288 & p< 0.013 and r= 0.306 & p= 0.008. A
positive correlation was found between blood ISOP
levels and the amount of ABHSs used (r=0.284 &
p=0.014) and a negative correlation to the frequency of
ABHSs used (r=0.149 & p=0.206). On the other hand,
a positive correlation was found between blood acetone
levels and the frequency of ABHSs used (r=0.357 &
p=0.002) and a negative correlation to the amount of
ABHSs used (r=0.219& p=0.61).
Table 1: Statistical analysis by one way Anova and LSD tests between means of frequency and amount of
ABHSs/8 hours shift in group I, II and III
Item Groups Mean±SD F P Post Hoc LSD test
Frequency/ 8 hours shift (n) GroupI
Group II
Group III
16.23± 2.16
24.43± 3.16
33.90± 2.78
339.9
0.001**
<0.001**¹
<0.001**²
<0.001**³
Amount of ABHS/ one use (ml) Group I
Group II
Group III
9.83± 3.82
8.57± 3.63
15.50± 3.79
23.6
0.001**
0.306 º¹
<0.001**²
<0.001**³
ABHSs= alcohol based hand sanitizers. n=number. **= highly significant. º= non-significant. ¹= group I versus II, ²=
group II versus III, ³= group I versus III. F= Anova test. SD= standard deviation.
Table 2: Statistical analysis by Chi-squared and LSD tests between HCWs in group I, II and III as well as
between HCWs in group A and B as regard respiratory and dermal symptoms related to ABHSs use:
Symptoms N
Groups
χ2
P
Post
Hoc
LSD
test
Groups
χ2
P
Post Hoc LSD test
I
(t=30)
II
(t=14)
III
(t=30)
A
(t=37)
B
(t=37)
Respiratory
symptoms
n
%
12
40%
7
50%
24
80%
0.39
10
4.13
0.03*
0.53 º¹
0.002**²
0.04*³
20
54.1%
23
62.2% 0.50 0.48º
NS
Dermal
Symptoms
n
%
17
56.7%
7
50.0%
19
63.3%
0.17
0.28
0.70
0.3º NS 16
43.2%
27
73% 6.72 0.01*
0.02*1 0.04*2
0.001**3
n=number. ml= milliliters. *= significant. **= highly significant. º= non-significant. ¹= group I versus II, ²= group II
versus III, ³= group I versus III. F= Fisher's Exact test. SD= standard deviation. χ2= Chi-squared test. NS= not
significant.
85 Mansour and El-rafey / Ain Shams J Forensic Med Clin Toxicol, July 2019 (33): 80-91
Table 3: Statistical analysis using Kruskal Wallis, ANOVA and Post-hoc tests of medians and IQR blood ISOP
and means acetone concentrations before and 8 hours after ABHSs use in group I, II and III:
Item Group Mean ±SD Median IQR Range Test P Post Hoc
LSD test
ISOP
Before ABHSs
use
group I
group II
group III
0.09±0.18
0.047±0.066
0.07±0.07
0.05
0
0.05
0-0.09
0-0.12
0-0.14
0-0.9
0-0.15
0-0.18
K
1.53
0.47º
----
ISOP
8 h after start of
ABHSs use
group I
group II
group III
3.73±1.36
3.74±1.64
4.71±1.28
3.96
3.53
4.9
2.56-4.78
2.43-5.03
4.2-5.68
1.35-6.15
1.05-6.78
1.5-6.15
K
9.72
0.008**
0.82º1
0.003**2
0.046*3
aceton
Before ABHSs
use (mg/l)
group I
group II
group III
1.91±0.38
1.88±0.36
1.78±0.51
1.99
1.97
1.58
1.58-2.08
1.57-2.08
1.45-2.14
1.25-2.78
1.2-2.5
1.05-2.86
F
0.77
0.47º
------
aceton
8h after start of
ABHSs use (
mg/l)
group I
group II
group III
5.64±1.10
6.10±1.01
6.84±0.71
5.53
6.56
6.23
4.65-6.65
5.41-6.58
6.23-7.5
3.87-7.56
4.04-7.89
5.89-8.58
F
12.30
0.003**
0.14 º1
0.001**2
0.017*3
*= Significant. **= highly significant. º= non-significant. ¹= group I versus II, ²= group II versus III, ³= group I versus
III. F= Anova test. SD= standard deviation. K= Kruska-Wallis test.
Fig.1: Kinetic of urinary ethanol concentrations before and for 24
hours after ABHSs use in the three groups (low= group I,
intermediate= group II, excessive= group III).
Fig.2: Diagram showing the kinetic of urinary EtG concentrations
before and for 24 hours after ABHSs use in the three groups (low=
group I, intermediate= group II, excessive= group III).

86 Mansour and El-rafey / Ain Shams J Forensic Med Clin Toxicol, July 2019 (33): 80-91
Fig.3: Diagram showing the kinetic of urinary EtS concentrations
before and for 24 hours after ABHSs use in the three groups (low=
group I, intermediate= group II, excessive= group III).
Fig.4: A bar chart showing the medians concentration of
ISOP before and 8 hours after ABHSs use in the three groups
(low= group I, intermediate= group II, excessive= group III).
Fig.5: A bar chart showing the median acetone
concentrations before and 8 hours after ABHSs use in the
three groups (low= group I, intermediate= group II,
excessive= group III).
Discussion During hand rubbing, HCWs are exposed to different
types of alcohols (e.g., ethanol, ISOP and n-propanol)
via inhalation and dermal contact (Bessonneau et al.,
2010). The number of ABHSs used varies markedly,
depending on the nature of the clinical activity, the
hospital setting, or the HCWs adherence with hands
hygiene programs (Pittet et al., 2000).
In this study the absorption of ethanol and
ISOP were assessed in HCWs in real exposure to two
ABHSs containing both alcohols in different
concentrations during regular 8-hours working shift. As
regard respiratory and dermal symptoms related to
ABHSs use, HCWs in group III complained from
respiratory symptoms in the form of irritation, sneezing
and cough more significant than group I and II, while
87 Mansour and El-rafey / Ain Shams J Forensic Med Clin Toxicol, July 2019 (33): 80-91
the three groups complained from dermal symptoms in
the form of dryness, redness and itching with the same
degree. When the two types of hand sanitizer A and B
were compared to each other as regard respiratory
symptoms, a non-significant difference was found,
while, a highly significant increase in group B (with
higher concentration of ISOP 60%) was found as
regard dermal symptoms. This may indicate that, the
respiratory symptoms were mainly increased in relation
to frequency and quantity of ABHSs regardless the
concentration, while the dermal symptoms were
prominent in higher ISOP concentration in ABHSs.
This may be explained by the greater ISOP dermal
absorption which might be attributed to the higher
dermal permeability coefficient of ISOP (1,350
cm/hour) (Below et al., 2012). ABHSs users are
exposed to alcohols via both inhalation and dermal
routes, as alcohols are volatile organic oxygenated
species, water soluble, and highly mobile (INRS,
2007). Cumulative occupational exposures to well-
known irritants, such as ISOP can cause respiratory and
dermal irritations (Tonini et al., 2009).
These results were consistent with Larson et
al. (2006) who stated that approximately 25% of nurses
reported symptoms or signs of dermatitis on their
hands, and 85% gave a history of skin problems and
reported that frequent and repeated use of hand hygiene
products are an important cause of chronic irritant
contact dermatitis among HCWs. Frequent hand
washing with lipid-dissolving alcohols, progressively
depletes surface lipids, then penetrate into the
superficial skin layers leading to skin damage
(Kownatzki, 2003). Furthermore, Cartner et al. (2016)
compared the effects of three different alcoholic
formulations on skin, over 2 weeks, applied daily at
standard application rates (20 times per day) and
reported that ISOP caused significant skin damage
whereas ethanol did not.
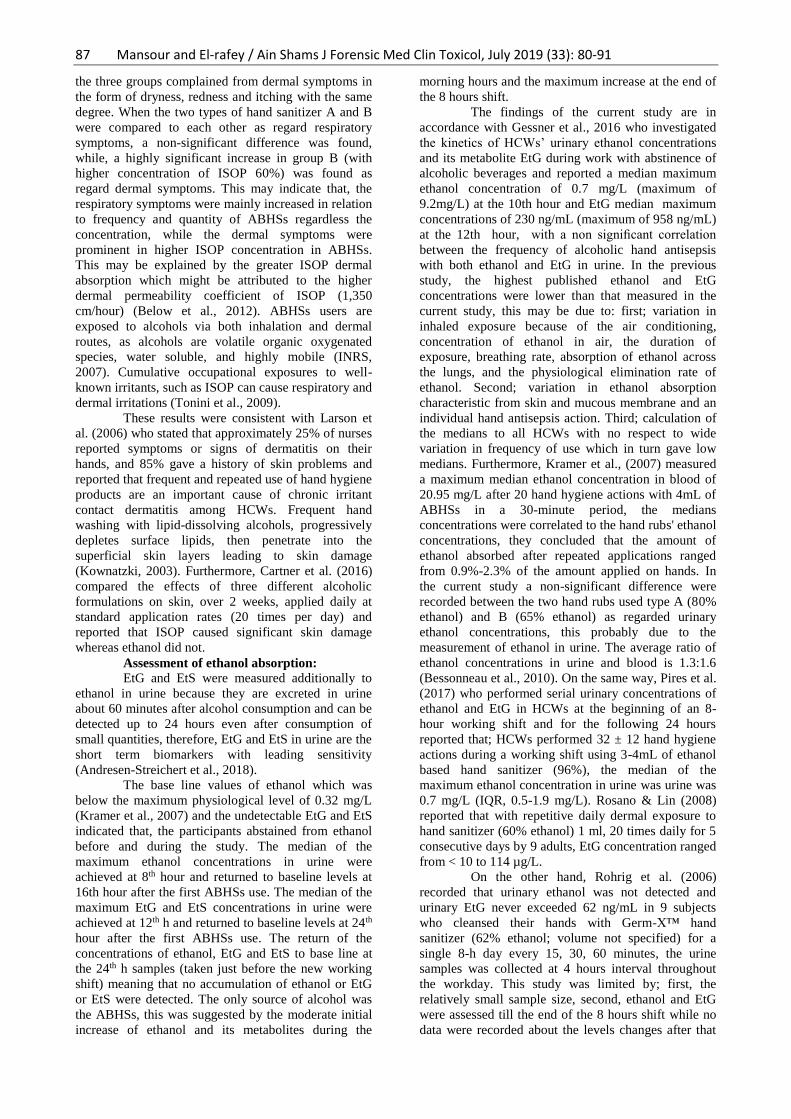
Assessment of ethanol absorption:
EtG and EtS were measured additionally to
ethanol in urine because they are excreted in urine
about 60 minutes after alcohol consumption and can be
detected up to 24 hours even after consumption of
small quantities, therefore, EtG and EtS in urine are the
short term biomarkers with leading sensitivity
(Andresen-Streichert et al., 2018).
The base line values of ethanol which was
below the maximum physiological level of 0.32 mg/L
(Kramer et al., 2007) and the undetectable EtG and EtS
indicated that, the participants abstained from ethanol
before and during the study. The median of the
maximum ethanol concentrations in urine were
achieved at 8th hour and returned to baseline levels at
16th hour after the first ABHSs use. The median of the
maximum EtG and EtS concentrations in urine were
achieved at 12th h and returned to baseline levels at 24th
hour after the first ABHSs use. The return of the
concentrations of ethanol, EtG and EtS to base line at
the 24th h samples (taken just before the new working
shift) meaning that no accumulation of ethanol or EtG
or EtS were detected. The only source of alcohol was
the ABHSs, this was suggested by the moderate initial
increase of ethanol and its metabolites during the
morning hours and the maximum increase at the end of
the 8 hours shift.
The findings of the current study are in
accordance with Gessner et al., 2016 who investigated
the kinetics of HCWs’ urinary ethanol concentrations
and its metabolite EtG during work with abstinence of
alcoholic beverages and reported a median maximum
ethanol concentration of 0.7 mg/L (maximum of
9.2mg/L) at the 10th hour and EtG median maximum
concentrations of 230 ng/mL (maximum of 958 ng/mL)
at the 12th hour, with a non significant correlation
between the frequency of alcoholic hand antisepsis
with both ethanol and EtG in urine. In the previous
study, the highest published ethanol and EtG
concentrations were lower than that measured in the
current study, this may be due to: first; variation in
inhaled exposure because of the air conditioning,
concentration of ethanol in air, the duration of
exposure, breathing rate, absorption of ethanol across
the lungs, and the physiological elimination rate of
ethanol. Second; variation in ethanol absorption
characteristic from skin and mucous membrane and an
individual hand antisepsis action. Third; calculation of
the medians to all HCWs with no respect to wide
variation in frequency of use which in turn gave low
medians. Furthermore, Kramer et al., (2007) measured
a maximum median ethanol concentration in blood of
20.95 mg/L after 20 hand hygiene actions with 4mL of
ABHSs in a 30-minute period, the medians
concentrations were correlated to the hand rubs' ethanol
concentrations, they concluded that the amount of
ethanol absorbed after repeated applications ranged
from 0.9%-2.3% of the amount applied on hands. In
the current study a non-significant difference were
recorded between the two hand rubs used type A (80%
ethanol) and B (65% ethanol) as regarded urinary
ethanol concentrations, this probably due to the
measurement of ethanol in urine. The average ratio of
ethanol concentrations in urine and blood is 1.3:1.6
(Bessonneau et al., 2010). On the same way, Pires et al.
(2017) who performed serial urinary concentrations of
ethanol and EtG in HCWs at the beginning of an 8-
hour working shift and for the following 24 hours
reported that; HCWs performed 32 ± 12 hand hygiene
actions during a working shift using 3-4mL of ethanol
based hand sanitizer (96%), the median of the
maximum ethanol concentration in urine was urine was
0.7 mg/L (IQR, 0.5-1.9 mg/L). Rosano & Lin (2008)
reported that with repetitive daily dermal exposure to
hand sanitizer (60% ethanol) 1 ml, 20 times daily for 5
consecutive days by 9 adults, EtG concentration ranged
from < 10 to 114 µg/L.
On the other hand, Rohrig et al. (2006)
recorded that urinary ethanol was not detected and
urinary EtG never exceeded 62 ng/mL in 9 subjects
who cleansed their hands with Germ-X™ hand
sanitizer (62% ethanol; volume not specified) for a
single 8-h day every 15, 30, 60 minutes, the urine
samples was collected at 4 hours interval throughout
the workday. This study was limited by; first, the
relatively small sample size, second, ethanol and EtG
were assessed till the end of the 8 hours shift while no
data were recorded about the levels changes after that
88 Mansour and El-rafey / Ain Shams J Forensic Med Clin Toxicol, July 2019 (33): 80-91
as it might increase as the current study where the
maximum EtG concentrations were achieved 12 hours
after ABHSs first use.
Assessment of ISOP absorption:
The endogenous level of ISOP depends
mainly on diet and disease states, it is elevated in
alcoholics, starvation and low-calorie diet which favors
reduction of acetone to ISOP (Below et al., 2012),
these conditions are excluded in the current study.
Acetone is the most abundant endogenous volatile
organic compound in humans generated during
ketogenesis from fatty acid breakdown (Jones, 2000),
in the current study.
At the 8th hour both blood ISOP and acetone
concentrations increased in the three groups with a
significant maximum increase in group III. The blood
ISOP levels were dependent on the amount of ABHSs
used, while blood acetone levels were dependent on the
frequency. Both parameters were independent of the
type of hand rub used.The results of the current study
are consistent with Below et al. (2012) who measured
peak median blood ISOP levels of 5.3 mg/L after
hygienic hand rubs and 10.0 mg/L after surgical hand
rubs, and stated that; only minimal amounts of ISOP
are absorbed through the use of hand rubs, ethanol has
less toxicity and lower dermal absorption than ISOP,
and more easily metabolized by ADH. Furthermore,
Turner et al. (2004) reported measurable blood ISOP
levels (range 0.5-1.8 mg/l) in nine subjects of ten
healthy adult volunteers applied an ISOP-containing
hand rub to their hands every 10 min over a 4 h period.
The measured levels in the current study are more than
that measured by Turner et al. (2004) who had a small
sample size only 10 participant using hand sanitizer
containing only ISOP for only 4 hours.
On the other hand, Brown et al. (2007)
reported undetectable serum ISOP level after 10 to 13
min post exposure in 20 HCWs used ABHSs 30 times
during a 1h period. This study had the following
limitations; the routine alcohol consumption of the
HCWs was not assessed as well as the intensive
ABHSs were used for only 1h. Elevated urinary
acetone is a possible marker of exposure to ISOP
(Below et al., 2012). ISOP is converted into acetone by
oxidation with class I isoenzymes of hepatic alcohol
dehydrogenase, Then it is mainly excreted unchanged
in breath and urine and to some extent oxidized by
cytochrome P450-enzymes, but this is a relatively slow
detoxification mechanism (Jones, 2000).
EtG and EtS cut offs:
In the current study, at 12th hour post ABHSs
first use; all participants had a maximum urinary EtG
levels ≥100 ng/ml while, 30 (40.5%) of them had
urinary EtG levels ≥500 ng/ml (7 subjects in group I, 4
subjects in group II and 19 subjects in group III) and no
subject exceeds the 1000 ng/ml. EtS was detected in
fewer subjects than EtG, it was not detectable in 21
participants (28.4%). One participant (1.3%) had EtS
level of 34 ng/ml, 52 participants (70.3%) had levels ≥
50 ng/ml while no participant exceeded 100 ng/ml. The
urinary EtG and EtS levels were correlated to the
frequency and the amount of ABHSs used but not to
urinary ethanol levels.
The results of the current study were
consistent with Salomone et al. (2018) who analyzed
EtG in urine after ABHSs use by one subject for 20
times a day, for 4 consecutive weeks, simulating a
workplace situation, the data obtained showed a
significant absorption of ethanol which produced
urinary EtG concentrations higher than the cut-offs
normally used for clinical and forensic analyses (either
100 and 500 ng/ml) and concluded that the continuous
use of alcohol-based hand disinfectants can lead to a
positive EtG in urine. Furthermore, Reisfield et al.
(2011) measured urinary EtG and EtS following
sustained application of hand sanitizer (62% ethanol)
every 5 min for 10 hours in three consecutive days, the
urine specimens were obtained at the beginning and
end of each day of the study and reported that, 72.7%
produced urinary EtG concentrations above 500 ng/ml;
46.4% produced EtG concentrations above 1000 ng/ml;
and 9% produced urinary EtG concentration exceeding
2000 ng/mL, while no subject produced a urinary EtS
≥100 ng/ml. Apart from oxidative metabolism, the
phase II metabolite EtG (0.02-0.06% of the ingested
alcohol) and EtS (0.010-0.016%) are created from
alcohol to a minor extent (Andresen-Streichert et al.,
2018). Sulfation of ethanol may be a pathway that
produces significant quantities of EtS only when the
ethanol concentration is high enough to saturate
alcohol dehydrogenase and glucuronosyl transferase
pathways, this may explain the participants with
positive EtG and negative EtS, thus it is better to
measure both EtG and EtS as it might be useful in
discriminating between ethanol consumption and
incidental exposure to ethanol-containing products
(Reisfield et al., 2011).
On the other hand, Gessner et al. (2016)
reported a relative independency of the EtG
concentration and the number of hand antisepsis
actions. Levels of EtG can vary dramatically between
individuals who consume the same amount of alcohol
as much as 200 fold, there are likely individuals in the
population that are "hyperproducers" of EtG and have
much higher levels following exposure to alcohol,
including incidental exposure (SAMHSA, 2012). This
is because of the variation in the genetic polymorphism
of the enzyme UDP-glucuronosyl-transferase which is
responsible for the process of glucuronidation, a major
part of phase II metabolism (Gessner et al., 2016).
The sensitivity EtG and EtS in urine depends
on alcohol quantity, time interval between sample
collection and alcohol intake as well as the cut-off level
of the method applied, however, the disadvantage of
the very high sensitivity of this method is that the
EtG/EtS levels in urine do not allow to distinguish
between a binge drinking event several days ago and a
potentially minor alcohol exposure as highly
concentrated ethanol-based disinfection solutions (60-
96%) (Andresen-Streichert, et al., 2018). Most
monitoring programs use empirically adjusted upper
limits of 500 or 1000 ng/mL for EtG in urine, above
which incidental exposure is ruled out the [Substance
Abuse and Mental Health Services Administration
(SAMHSA) Advisory (2012)]. Unlike EtG, EtS cutoffs
are not yet universally agreed upon while, the proposed

89 Mansour and El-rafey / Ain Shams J Forensic Med Clin Toxicol, July 2019 (33): 80-91
cutoff value for EtS ranges from 50 to 200 ng/ml
(Albermann et al., 2012).
Conclusion From the results of the current study we can
conclude that, the repeated application of ABHSs in
HCWs' daily routine generates measurable levels of
ethanol and its metabolites EtG and EtS in urine as
well as ISOP and its metabolite acetone in blood which
indicated the absorption of ethanol and ISOP and their
subsequent degradation with rapid decrease of their
concentrations to baseline levels within 24 hours (not
accumulated). These parameters were positively
correlated to frequency and quantity of ABHSs used.
The measured blood ISOP concentrations
were below the toxic levels in humans. EtG was the
only parameters correlated positively to the
concentration of ethanol in ABHSs. Not only the
excessive use of ABHSs but also low and intermediate
exposures produced urinary EtG concentrations that
exceeded 500 ng/ml while, EtS concentrations did not
exceed 100 ng/ml in all use mood. The EtG threshold
of 1000 ng/ml and EtS threshold of 100ng/ml seemed
to be more promising to distinguish between
intentional ethanol use and incidental exposure to
ethanol based hand sanitizers. Measuring EtS with EtG
might be useful in identification of incidental exposure
to ethanol hand sanitizers.
Recommendations From the results of the current study, ABHSs in HCWs
can produce urinary concentrations of EtG that, by
current standards, may be interpreted as intentional
ethanol use so, further studies are needed to confirm
the cut offs recommended in this study to distinguish
between intentional alcohol intake and incidental
ethanol exposure in HCWs. With the growing interest
in Egypt to the employees' screening for drug of abuse,
it is thought that urinary EtG may be added to the
screening tests, in this case an occupations as HCWs
using ethanol incidentally will benefit from the cut off
settings to avoid false accusations. With exposure to
alcohols mainly via inhalation further researches are
recommended to determine contamination levels of
alcohols especially ISOP in the environment of HCWs'
workplace.
It is also recommended to conduct large scale
studies on certain vulnerable individuals such as
pregnant women, individuals with known liver disease
or alcohol dehydrogenase and/or aldehyde
dehydrogenase genetic deficiencies for risk
assessment.; assess the potential adverse effects caused
by long-term exposure to ABHSs, especially that
contains ISOP.
References Albermann, ME, Musshoff, F and Madea, B (2012): A
High-Performance Liquid Chromatographic-
Tandem Mass Spectrometric Method for the
Determination of Ethyl Glucuronide and Ethyl
Sulfate in Urine Validated According to
Forensic Guidelines. Journal of
Chromatographic Science. 50(1):51-56.
Andresen-Streichert, H, Müller, A, Glahn, A, et al.
(2018): Alcohol Biomarkers in Clinical and
Forensic Contexts. Deutsches Ärzteblatt
International Dtsch Arztebl Int. 115(18): 309-
15.
Arndt, T, Schröfel, S, Güssregen, B, et al. (2014):
Inhalation but not transdermal resorption of
hand sanitizer ethanol causes positive ethyl
glucuronide findings in urine. Forensic Sci Int.
237:126-30.
Baranowski, S, Halter, CC, Serr, A, et al. (2008): In
vitro study of bacterial degradation of ethyl
glucuronide and ethyl sulfate. Int J Legal
Med.122(5):389-93.
Below, H, Partecke, I, Huebner, NO, et al. (2012):
Dermal and pulmonary absorption of propan-
1-ol and propan-2-ol from hand rubs.
American Journal of Infection Control. 40(3):
250-7.
Bessonneau, V, Clément, M and Thomas O (2010):
Can Intensive Use of Alcohol-Based Hand
Rubs Lead to Passive Alcoholization?. Int J
Environ Res Public Health. 7(8):3038-50.
Bolon MK (2016): Hand hygiene: An update. Infect
Dis Clin North Am. 30(3):591-607.
Brown, TL, Gamon, S, Tester, P, et al. (2007): Can
Alcohol-Based Hand-Rub Solutions Cause
You To Lose Your Driver’s License?
Comparative Cutaneous Absorption of
Various Alcohols. Antimicrobial Agents and
chemotherapy. 51(3):1107-08.
Cartner, T, Brand, N, Tian, K, et al. (2017): Effect of
different alcohols on stratum corneum
kallikrein 5 and phospholipase A2 together
with epidermal keratinocytes and skin
irritation. International Journal of Cosmetic
Science. 39(2):1-9.
Centre for Health Protection (2017): Guidelines for
hand hygiene. Available at:
https://www.chp.gov.hk/files/pdf/guidelines_f
or_hand_hygiene.pdf.
Chan, P and Chan, Y (2018): Methanol as an unlisted
Ingredient in Supposedly Alcohol-Based Hand
Rub Can Pose Serious Health Risk. Int J
Environ Res Public Health. 15(7):1440.
Dahl, H, Stephanson, N, Beck, O, et al. (2002):
Comparison of urinary excretion
characteristics of ethanol and ethyl
glucuronide. J Anal Toxicol. 26(4): 201-4.
Gessner, S, Below, E, Diedrich, S, et al. (2016):
Ethanol and ethyl glucuronide urine
concentrations after ethanol-based hand
antisepsis with and without permitted alcohol
consumption American Journal of Infection
Control. 44(9): 999-1003.
Goll, M, Schmitt, G, Ganssmann, B, et al. (2002):
Excretion profiles of ethyl glucuronide in
human urine after internal dilution. J Anal
Toxicol. 26(5): 262-6.
Helander, A, Olsson, I and Dahl, H (2007): Post-
collection synthesis of ethyl glucuronide by
bacteria in urine may cause false identification
of alcohol consumption. Clin Chem.
53(10):1855-7.

90 Mansour and El-rafey / Ain Shams J Forensic Med Clin Toxicol, July 2019 (33): 80-91
Institut National de Recherche et de Sécurité (INRS)
(2007): Ethanol; fiche toxicologique FT 48;
INRS: Paris, France.
Jones, AW (2000): Elimination Half-Life of Acetone
in Humans: Case Reports and Review of the
Literature. Journal of Analytical toxicology.
24(1):8-10.
Kownatzki, E (2003): Hand hygiene and skin health. J
Hosp Infect. 55(4): 239-45.
Kramer, A, Below, H, Bieber, N, et al. (2007):
Quantity of ethanol absorption after excessive
hand disinfection using three commercially
available hand rubs is minimal and below
toxic levels for humans. BMC Infectious
Diseases. 7:117.
Larson, E, Girard, R, Pessoa-Silva, CL, et al. (2006):
Skin reactions related to hand hygiene and
selection of hand hygiene products by the
Association for Professionals in Infection
Control and Epidemiology, Inc. 34(10): 635-
727.
Litten, RZ, Bradley, AM, and Moss, HB (2010):
Alcohol biomarkers in applied settings:
Recent advances and future research
opportunities. Alcoholism: Clinical and
Experimental Research. 34(6):955-967.
Maier, A, Ovesen, LJ, Allen, LC, et al.(2015): Safety
assessment for ethanol-based topical antiseptic
use by health care workers: Evaluation of
developmental toxicity potential . Regulatory
Toxicology and Pharmacology. 73(1): 248-64.
Pires, D, Bellissimo-Rodrigues, F and Pittet, D (2017):
Ethanol-based handrubs: Safe for patients and
health care workers . American Journal of
Infection Control. 44(8): 858-9.
Pittet, D, Hugonnet, S, Harbarth, S, et al. (2000):
Effectiveness of a hospital-wide program to
improve compliance with hand hygiene,
Infection Control Program. Lancet.
356(9238):1307-12.
Reisfield, GM, Goldberger, AB, Crews, OB, et al.
(2011): Ethy lGlucuronide, EthylSulfate, and
Ethanol in Urine after Sustained Exposure to
an Ethanol-Based Hand Sanitizer. Journal of
Analytical Toxicology. 35(2):85-91.
Roemhild, W, Krause D, Bartels, H, et al. (1998):
Congener analysis by means of “headspace”
GC/MS. Blutalkohol. 35(1):10-8.
Rohrig, TP, Huber, C, Goodson, L, et al. (2006):
Detection of ethylglucuronide in urine
following the application of Germ-X. J Anal
Toxicol. 30(9):703-4.
Rosano, TG and Lin, J (2008): Ethyl glucuronide
excretion in humans following oral
administration of and dermal exposure to
ethanol. J Anal Toxicol. 32(8): 594-600.
Salomone, A, Bozzo, A, Corcia, D, et al. (2018):
Occupational Exposure to Alcohol-Based
Hand Sanitizers: The Diagnostic Role of
Alcohol Biomarkers in Hair. Journal of
Analytical Toxicology. 42(3):157-162.
Substance Abuse and Mental Health Services
Administration (SAMHSA) advisory (2012):
The role of biomarkers in the treatment of
alcohol use disorders. HHS Publication No.
(SMA) 12-4686, First Printed 2006, Revised
2012. 11(2):1-8.
Tonini, S, Dellabianca, A, Costa, CM, et al. (2009):
Irritant vocal cord dysfunction and
occupational bronchial asthma: differential
diagnosis in a health care worker. Int J Occup
Med Environ Health. 22(4), 401-406.
Turner, P , Saeed, B, and Kelsey, MC (2004): Dermal
absorption of isopropyl alcohol from a
commercial hand rub: implications for its use
in hand decontamination. J Hosp Infect.
56(4):287-90.
World Health Organization (WHO) (2009): Guidelines
on Hand Hygiene in Health Care. First Global
Patient Safety Challenge: Clean Care is Safer
Care; WHO: Geneva, Switzerland,. Available
at:
http://whqlibdoc.who.int/publications/2009/97
89241597906_eng.pdf.

91 Mansour and El-rafey / Ain Shams J Forensic Med Clin Toxicol, July 2019 (33): 80-91
الملخص العربي
يرع المستوي المحية: المؤشرات الحيويه لامتصاص الكحوليات نتيجة الاستخدام المستمر لمطهرات اليدين في افراد الرعاية الص الايثيل سلفات و لايثيل علوكورونيدل
2دينا سامع الرفاعي و 1غادة نبيل منصور
كذلك عن طريق ملامسة الجلد و (ABHSs) أثناء استخدام مطهر اليدين من الكحوليات هعد لأنواع يتعرض افراد الرعاية الصحية قددمة:المطهرات اليدين الي لمالتعرض نتيجةفي افراد الرعاية الصحية (ISOP)الإيثانول والأيزوبروبانول كل من هذه الدراسة إلى تقييم امتصاص هدفت .الاستنشاق
التركيزات تتعدي في البول وهل هذه (EtSإيثيل سلفات ) ( وEtG) إيثيل جلوكورونيد كل منتركيزات لك وكذ تحتوي علي هذين النوعين من الكحوليات .او في الطب الشرعي العلاجية للأغراضسواء للإيثانولالمسموح بها لتحديد تعاطي الفرد النسبة
و للاستخدام ساعة التالية 24ولمدة مطهر اليدين قبل استخدام في البول EtSوEtG به الخاصةونواتج الايض الايثانول تم قياس طريقدة ال مل: .خلال نوبة العمل العادية ABHSsاستخدام منساعات 8في الدم قبل وبعد ونواتج الايض الخاصة به )الاسيتون(ISOP وكذلك
في ISOPنانوغرام / مل( وكذلك 62) EtS نانوغرام / مل( و 538.93) EtG ، (ملغم / لتر )8.75للإيثانول اعلي تركيزتم قياس: النتائج في لتعود كل هذه المعاملات لمستواها الاساسي ( ABHSsملغم / لتر( في المجموعة الثالثة )الإفراط في استخدام 6.32ملغ / لتر( و الأسيتون ) 4.9الدم )
.ABHSsإيجابيا بتركيز الإيثانول في EtGالمستخدمة. ارتبط ABHSsة كميو كذلك بعدد مرات الاستعمالت املاساعة. وارتبطت المع 24غضون والأسيتون في الدم. ISOPفي البول وكذلك EtSو EtGقابلة للقياس من الإيثانول ، يؤدي الي تركيزات ABHSs استخدام: الخلاصة
في البول بعد استخدام مطهرات اليدين المحتوية علي EtGؤدي قياس قد ي ساعة )غير متراكمة(. 24إلى مستويات خط الأساس خلال هذه التركيزاتتنخفض (cut off >1000 ng/mLاستخدام نسبه ايجابيه عالية قد يكون مما يؤدي الي اعتقاد خاطئ بتناول هذا الشخص للكحول.كحول الي نتائج ايجابيه
(EtG قياس الي جانبEtS الي بالإضافة EtG وتفرقته عن تعاطي الكحولللإيثانول العرضي عرض التعلي التعرف مفيدًا في. مصر. - لزقازيقا ةجامع -كليه الطب البشرى - م الإكلينكيةقسم الطب الشرعي والسمو 1
مصر. - جامعة الزقازيق -كلية الطب-قسم الصحة العامة والبيئة وطب الصناعات 2