ettevõtlus eestis / business in estonia
DESCRIPTION
Ettevõtlus Eestis / Business in Estonia www.stat.eeTRANSCRIPT

Teatmik annab ülevaate erinevatel aladel tegutsevatest ettevõtetest ja nende arengust aastani 2007.
The reference book provides an overview of enterprises and their development by economic activities up to the year 2007.
ISBN 978-9985-74-467-3
ETTEVÕTLUS EESTISBusiness in Estonia
ETTEVÕTLUS EESTIS. BUSINESS IN ESTONIA
Saateks
See taskuteatmik on järg 2004. aastal esimest korda lugejani jõudnud väljaandele. Kogumikku on koondatud väike, kuid oluline osa andmetest, mis iseloomustavad Eesti ettevõtete fi nants-majanduslikku tegevust aastani 2007 (k.a).
Ettevõtlus hõlmab mittefi nantsteenuseid tootvaid äriühinguid, fi nantsvahendusäriühinguid ja füüsilisest isikust ettevõtjaid. Taskuteatmiku kokkupanekul on rõhuasetus äriühingutel, samuti antakse ülevaade fi nantsvahendusäriühingutest (peatükk „Pangad, elu- ja kahjukindlustus, fondivalitsejad”).
Peale selle pakub taskuteatmik huvitavat infot ettevõtete demograafi a, infotehnoloogia arengu, teadus- ja arendustegevuse ning keskkonnakaitsekulutuste, samuti ettevõtluse globaliseerumise kohta. Lisaks on sisse toodud ka rahvusvaheline võrdlus, et tarbija saaks tõmmata paralleele teiste riikidega.
Inforohkel ajastul esitatakse taskuteatmikus selgeid ja lihtsaid diagramme ning tabeleid, mis peaksid huvi pakkuma kõigile, kes igapäevaelus vähem või rohkem ettevõtluse teemaga kokku puutuvad.
Detailsema andmestikuga on võimalik tutvust teha statistika andmebaasis Statistikaameti veebilehel www.stat.ee rubriigis „Statistika”.
Meeldivat statistikaga tutvumist
Ene Saareoja Ettevõtlusstatistika osakonna juhataja
ForewordThis pocket-sized reference book “Ettevõtlus Eestis. Business in Estonia“ is a follow-up to the 2004 edition which was the fi rst publication in this series. The publication provides a minor but essential share of information about the fi nancial activities of enterprises in Estonia until the year 2007 (included).
Entrepreneurship embraces non-fi nancial corporations, fi nancial corporations and sole proprietors. In this reference book, corporations have mainly been brought into focus. Moreover, an overview of fi nancial corporations has been provided (chapter “Banks, life and non-life insurance, fund management companies“).
In addition, the publication provides useful information about business demography, development of information technology, research and development, environmental protection expenditures as well as about globalisation of entrepreneurship. Besides that, a comparison of countries has been added allowing to draw parallels with other countries.
In our information-abundant era, the publication presents simple and clear-cut diagrams and tables that should be of interest to everybody who in their everyday life have something to do with business.
More detailed information is available in the Statistical Database located under the heading “Statistics” on the website of Statistics Estonia www.stat.ee.
Pleasant contacts with statistics!
Ene Saareoja Head of Enterprise Statistics Department
2 ETTEVÕTLUS EESTIS. BUSINESS IN ESTONIA
Teatmik annab ülevaate äriühingute tegevusest kuni aastani 2007 tegevusala järgi, pakub infot ettevõtete demograafi a, infotehnoloogia arengu, teadus- ja arendustegevuse, innovaatilisuse ning keskkonnakaitsekulutuste, samuti ettevõtluse internatsionaliseerumise kohta.
Koostanud Statistkaameti ettevõtlusstatistika osakond (Ene Saareoja,tel 625 9230, e-post: [email protected]; Tiina Pärson, tel 625 9233, e-post: [email protected]).
The reference book provides an overview of the activity of commercial undertak-ings until the year 2007 by economic activities, presents information about business demography, development of information technology, research and development, innovation and environmental protection expenditures as well as about globalisa-tion of entrepreneurship.
Compiled by the Enterprise Statistics Department of Statistics Estonia (Ene Saareoja, tel +372 625 9230, email: [email protected]; Tiina Pärson, tel +372 625 9233, email: [email protected]).
Märkide seletus
Explanation of symbols
… andmeid ei ole saadud või need on avaldamiseks ebakindlad data not available or too uncertain for publication
x andmete avaldamist ei võimalda andmekaitse data are confi dential
0 näitaja väärtus väiksem kui pool kasutatud mõõtühikust0,0 magnitude less than half of the unit employed0,00
ISBN 978-9985-74-467-3
Autoriõigus/Copyright: Statistikaamet, 2009Kaanefoto autoriõigus/Copyright to cover photo: Bulls
Väljaande andmete kasutamisel või tsiteerimisel palume viidata allikaleWhen using or quoting the data included in this issue, please indicate the source
3ETTEVÕTLUS EESTIS. BUSINESS IN ESTONIA
Sisukord
Contents
Üldandmed 4Ettevõtluse demograafi a 16Väliskaubandus 20Teadus- ja arendustegevus 22Innovatsioon 26Infotehnoloogia 27Töötlev tööstus 29Ehitus 37Transport 41Äriteenindus 45Kaubandus 49Pangad, elu- ja kahjukindlustus, fondivalitsejad 54Kontsernid 55Välisriikide kontrollitud ettevõtted 58Selgitused 59
General data 4Business demography 16Foreign trade 20
Research and development 22Innovation 26Information technology 27Manufacturing 29Construction 37Transport 41Business services 45Trade 49Banks, life and non-life insurance, fund management companies 54Enterprise groups 55Foreign controlled enterprises 58Explanations 62

4 ETTEVÕTLUS EESTIS. BUSINESS IN ESTONIA
ÜLDANDMED GENERAL DATA
Ettevõtete arv, 1995, 2000–2007 a, b
Number of enterprises, 1995, 2000–2007 a, b
Keskmine töötajate arv, 1995, 2000–2007 Average number of employees, 1995, 2000–2007
a Siin ja edaspidi ainult äriühingute andmed.b Andmed ei hõlma fi nantsvahendusäriühinguid.a Here and herinafter only the data of commercial undertakings.b Data of fi nanacial undertakings are excluded.
Tuhat — Thousands
Tuhat — Thousands

5ETTEVÕTLUS EESTIS. BUSINESS IN ESTONIA
ÜLDANDMED GENERAL DATA
Müügitulu, 1995, 2000–2007Net sales, 1995, 2000–2007
Lisandväärtus, 2000–2007Value added, 2000–2007
6 ETTEVÕTLUS EESTIS. BUSINESS IN ESTONIA
ÜLDANDMED GENERAL DATA
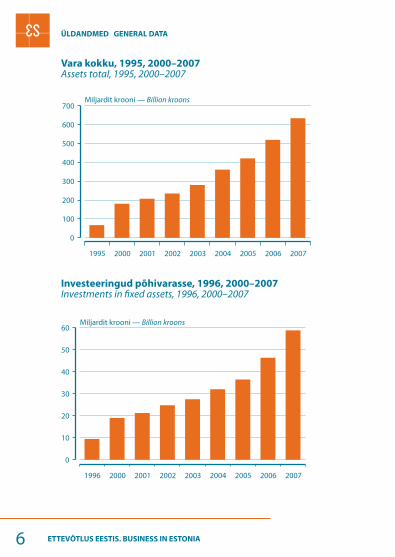
Vara kokku, 1995, 2000–2007Assets total, 1995, 2000–2007
Investeeringud põhivarasse, 1996, 2000–2007Investments in fi xed assets, 1996, 2000–2007

7ETTEVÕTLUS EESTIS. BUSINESS IN ESTONIA
ÜLDANDMED GENERAL DATA
Lisandväärtus jooksevhindades institutsionaalse sektori järgi, 1995, 2000, 2005–2007Value added at current prices by institutional sector, 1995, 2000, 2005–2007
Ettevõtete lisandväärtus tegevusala järgi, 2007Value added of enterprises by economic activity, 2007
Teised tegevusalada
Other activitiesa
14%
Business services
Trade
a Teised tegevusalad — põllundus, metsandus, kalandus, mäetööstus, elektrienergia-, gaasi- ja veevarustus, hotellid ja restoranid, haridus, tervishoid, muu teenindus.a Other activities — agriculture, forestry and fi shing, mining, electri-city, gas and water supply, hotels and restaurants, education, health, other service activities.
8 ETTEVÕTLUS EESTIS. BUSINESS IN ESTONIA
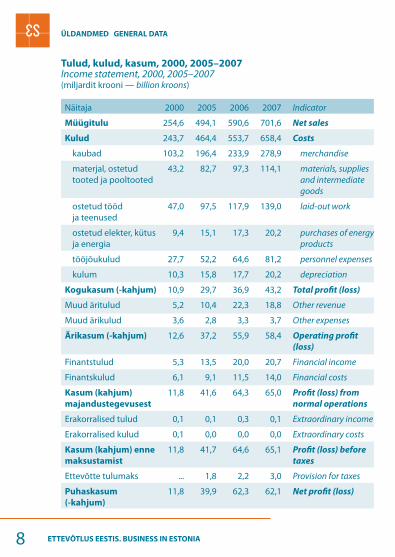
Tulud, kulud, kasum, 2000, 2005–2007Income statement, 2000, 2005–2007 (miljardit krooni — billion kroons)
ÜLDANDMED GENERAL DATA
Näitaja 2000 2005 2006 2007 Indicator
Müügitulu 254,6 494,1 590,6 701,6 Net sales
Kulud 243,7 464,4 553,7 658,4 Costs
kaubad 103,2 196,4 233,9 278,9 merchandise
materjal, ostetud tooted ja pooltooted
43,2 82,7 97,3 114,1 materials, supplies and intermediate goods
ostetud tööd ja teenused
47,0 97,5 117,9 139,0 laid-out work
ostetud elekter, kütus ja energia
9,4 15,1 17,3 20,2 purchases of energy products
tööjõukulud 27,7 52,2 64,6 81,2 personnel expenses
kulum 10,3 15,8 17,7 20,2 depreciation
Kogukasum (-kahjum) 10,9 29,7 36,9 43,2 Total profi t (loss)
Muud äritulud 5,2 10,4 22,3 18,8 Other revenue
Muud ärikulud 3,6 2,8 3,3 3,7 Other expenses
Ärikasum (-kahjum) 12,6 37,2 55,9 58,4 Operating profi t
(loss)
Finantstulud 5,3 13,5 20,0 20,7 Financial income
Finantskulud 6,1 9,1 11,5 14,0 Financial costs
Kasum (kahjum)
majandustegevusest
11,8 41,6 64,3 65,0 Profi t (loss) from
normal operations
Erakorralised tulud 0,1 0,1 0,3 0,1 Extraordinary income
Erakorralised kulud 0,1 0,0 0,0 0,0 Extraordinary costs
Kasum (kahjum) enne
maksustamist
11,8 41,7 64,6 65,1 Profi t (loss) before
taxes
Ettevõtte tulumaks ... 1,8 2,2 3,0 Provision for taxes
Puhaskasum
(-kahjum)
11,8 39,9 62,3 62,1 Net profi t (loss)
9ETTEVÕTLUS EESTIS. BUSINESS IN ESTONIA
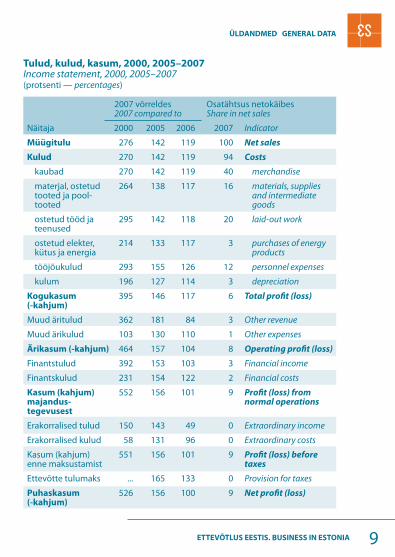
Tulud, kulud, kasum, 2000, 2005–2007Income statement, 2000, 2005–2007 (protsenti — percentages)
2007 võrreldes2007 compared to
Osatähtsus netokäibes Share in net sales
Näitaja 2000 2005 2006 2007 Indicator
Müügitulu 276 142 119 100 Net sales
Kulud 270 142 119 94 Costs
kaubad 270 142 119 40 merchandise
materjal, ostetud tooted ja pool-tooted
264 138 117 16 materials, supplies and intermediate goods
ostetud tööd ja teenused
295 142 118 20 laid-out work
ostetud elekter, kütus ja energia
214 133 117 3 purchases of energy products
tööjõukulud 293 155 126 12 personnel expenses
kulum 196 127 114 3 depreciation
Kogukasum (-kahjum)
395 146 117 6 Total profi t (loss)
Muud äritulud 362 181 84 3 Other revenue
Muud ärikulud 103 130 110 1 Other expenses
Ärikasum (-kahjum) 464 157 104 8 Operating profi t (loss)
Finantstulud 392 153 103 3 Financial income
Finantskulud 231 154 122 2 Financial costs
Kasum (kahjum) majandus-tegevusest
552 156 101 9 Profi t (loss) from normal operations
Erakorralised tulud 150 143 49 0 Extraordinary income
Erakorralised kulud 58 131 96 0 Extraordinary costs
Kasum (kahjum) enne maksustamist
551 156 101 9 Profi t (loss) before taxes
Ettevõtte tulumaks ... 165 133 0 Provision for taxes
Puhaskasum (-kahjum)
526 156 100 9 Net profi t (loss)
ÜLDANDMED GENERAL DATA

10 ETTEVÕTLUS EESTIS. BUSINESS IN ESTONIA
ÜLDANDMED GENERAL DATA
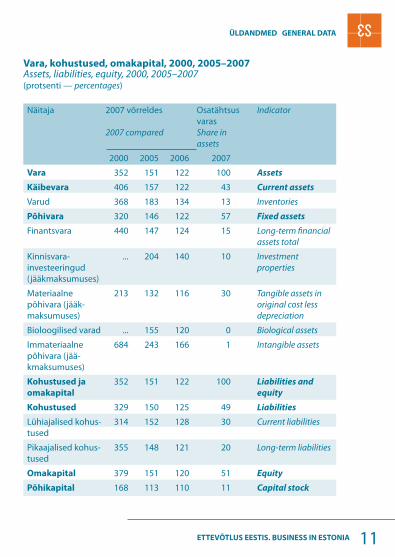
Vara, kohustused, omakapital, 2000, 2005–2007Assets, liabilities, equity, 2000, 2005–2007(miljardit krooni — billion kroons)
Näitaja 2000 2005 2006 2007 Indicator
Vara 180,0 421,2 518,8 634,1 Assets
Käibevara 67,5 174,5 224,2 273,6 Current assets
Varud 21,8 43,9 59,7 80,2 Inventories
Põhivara 112,5 246,8 294,7 360,5 Fixed assets
Finantsvara 21,5 64,7 76,4 94,9 Long-term fi nan-cial assets total
Kinnisvara-investeeringud (jääkmaksumuses)
... 31,8 46,5 64,9 Investment properties
Materiaalne põhivara (jääkmaksumuses)
90,1 146,1 166,0 192,1 Tangible assets in original cost less depreciation
Bioloogilised varad ... 1,7 2,2 2,7 Biological assets
Immateriaalne põhivara (jääkmaksumuses)
0,9 2,4 3,6 5,9 Intangible assets
Kohustused
ja omakapital
180,0 421,2 518,8 634,1 Liabilities and
equity
Kohustused 94,9 207,5 249,5 312,1 Liabilities
Lühiajalised kohus-tused
59,8 123,3 146,5 187,7 Current liabilities
Pikaajalised kohus-tused
35,1 84,3 103,0 124,5 Long-term liabilities
Omakapital 85,1 213,7 269,3 322,0 Equity
Põhikapital 40,5 60,1 62,0 68,1 Capital stock
11ETTEVÕTLUS EESTIS. BUSINESS IN ESTONIA
ÜLDANDMED GENERAL DATA
Vara, kohustused, omakapital, 2000, 2005–2007Assets, liabilities, equity, 2000, 2005–2007(protsenti — percentages)
Näitaja 2007 võrreldes
2007 compared
Osatähtsus varas Share in assets
Indicator
2000 2005 2006 2007
Vara 352 151 122 100 Assets
Käibevara 406 157 122 43 Current assets
Varud 368 183 134 13 Inventories
Põhivara 320 146 122 57 Fixed assets
Finantsvara 440 147 124 15 Long-term fi nancial assets total
Kinnisvara-investeeringud (jääkmaksumuses)
... 204 140 10 Investment properties
Materiaalne põhivara (jääk-maksumuses)
213 132 116 30 Tangible assets in original cost less depreciation
Bioloogilised varad ... 155 120 0 Biological assets
Immateriaalne põhivara (jää-kmaksumuses)
684 243 166 1 Intangible assets
Kohustused ja
omakapital
352 151 122 100 Liabilities and
equity
Kohustused 329 150 125 49 Liabilities
Lühiajalised kohus-tused
314 152 128 30 Current liabilities
Pikaajalised kohus-tused
355 148 121 20 Long-term liabilities
Omakapital 379 151 120 51 Equity
Põhikapital 168 113 110 11 Capital stock
12 ETTEVÕTLUS EESTIS. BUSINESS IN ESTONIA
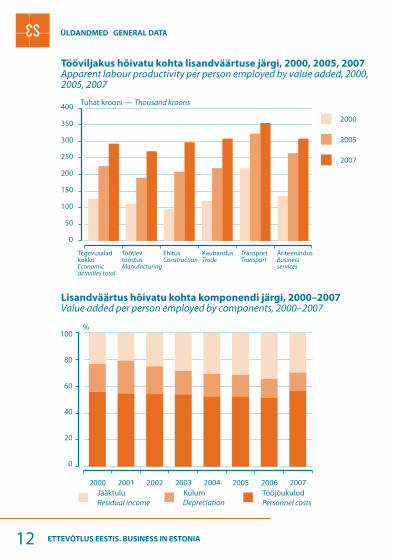
Tööviljakus hõivatu kohta lisandväärtuse järgi, 2000, 2005, 2007Apparent labour productivity per person employed by value added, 2000, 2005, 2007
Lisandväärtus hõivatu kohta komponendi järgi, 2000–2007Value added per person employed by components, 2000–2007
Tegevusalad kokku Economic activities total
Töötlev tööstus Manufacturing
Ehitus Construction
Kaubandus Trade
Transport Transport
Äriteenindus Business services
Depreciation
ÜLDANDMED GENERAL DATA
13ETTEVÕTLUS EESTIS. BUSINESS IN ESTONIA
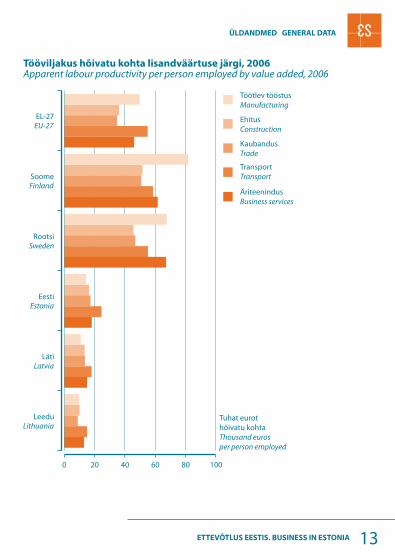
Tööviljakus hõivatu kohta lisandväärtuse järgi, 2006 Apparent labour productivity per person employed by value added, 2006
Tuhat eurot hõivatu kohtaThousand euros per person employed
ÜLDANDMED GENERAL DATA

14 ETTEVÕTLUS EESTIS. BUSINESS IN ESTONIA
ÜLDANDMED GENERAL DATA
Ettevõtete arv, müügitulu, tööga hõivatud isikute arv ja lisand-väärtus ettevõtte suurusgrupi järgi, 2007 Number of enterprises, net sales, number of persons employed and value added by size of enterprise, 2007
Ettevõtete arv
Number of enterprisesMüügitulu
Net sales
Tööga hõivatud isikute arv
Number of persons employedLisandväärtus
Value added
Large enterprises
15ETTEVÕTLUS EESTIS. BUSINESS IN ESTONIA
ÜLDANDMED GENERAL DATA
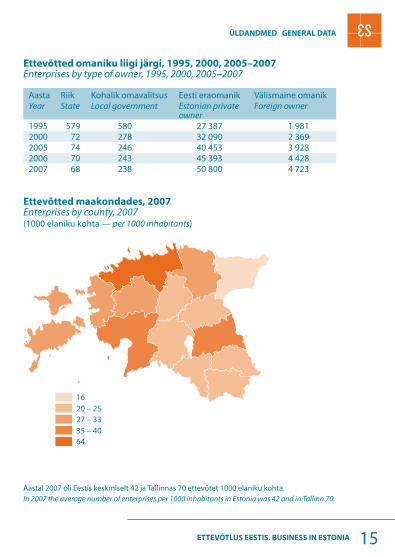
Ettevõtted omaniku liigi järgi, 1995, 2000, 2005–2007Enterprises by type of owner, 1995, 2000, 2005–2007
Aasta Riik Kohalik omavalitsus Eesti eraomanik Välismaine omanikYear State Local government Estonian private
ownerForeign owner
1995 579 580 27 387 1 9812000 72 278 32 090 2 3692005 74 246 40 453 3 9282006 70 243 45 393 4 4282007 68 238 50 800 4 723
Ettevõtted maakondades, 2007Enterprises by county, 2007(1000 elaniku kohta — per 1000 inhabitants)
Aastal 2007 oli Eestis keskmiselt 42 ja Tallinnas 70 ettevõtet 1000 elaniku kohta.In 2007 the average number of enterprises per 1000 inhabitants in Estonia was 42 and in Tallinn 70.
16 ETTEVÕTLUS EESTIS. BUSINESS IN ESTONIA
ETTEVÕTLUSE DEMOGRAAFIA BUSINESS DEMOGRAPHY
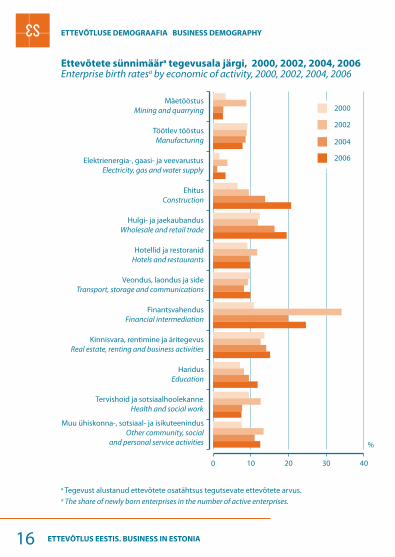
Ettevõtete sünnimäära tegevusala järgi, 2000, 2002, 2004, 2006Enterprise birth ratesa by economic of activity, 2000, 2002, 2004, 2006
a Tegevust alustanud ettevõtete osatähtsus tegutsevate ettevõtete arvus.a The share of newly born enterprises in the number of active enterprises.
17ETTEVÕTLUS EESTIS. BUSINESS IN ESTONIA
ETTEVÕTLUSE DEMOGRAAFIA BUSINESS DEMOGRAPHY
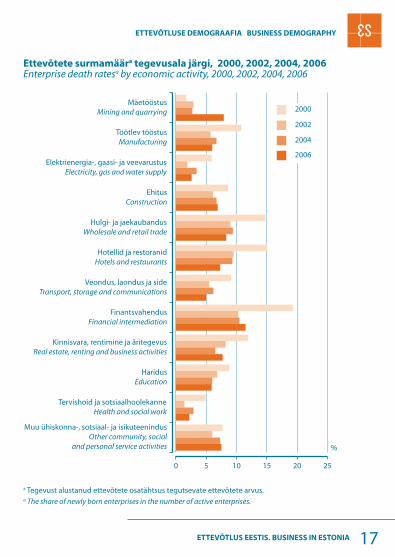
Ettevõtete surmamäära tegevusala järgi, 2000, 2002, 2004, 2006 Enterprise death ratesa by economic activity, 2000, 2002, 2004, 2006
a Tegevust alustanud ettevõtete osatähtsus tegutsevate ettevõtete arvus.a The share of newly born enterprises in the number of active enterprises.
Muu ühiskonna-, sotsiaal- ja isikuteenindus
Other community, social
and personal service activities
Tervishoid ja sotsiaalhoolekanne
Health and social work
Haridus
Education
Kinnisvara, rentimine ja äritegevus
Real estate, renting and business activities
Finantsvahendus
Financial intermediation
Veondus, laondus ja side
Transport, storage and communications
Hotellid ja restoranid
Hotels and restaurants
Hulgi- ja jaekaubandus
Wholesale and retail trade
Ehitus
Construction
Elektrienergia-, gaasi- ja veevarustus
Electricity, gas and water supply
Töötlev tööstus
Manufacturing
Mäetööstus
Mining and quarrying
0 5 10 15 20 25
2000
2002
2004
2006
%

18 ETTEVÕTLUS EESTIS. BUSINESS IN ESTONIA
ETTEVÕTLUSE DEMOGRAAFIA BUSINESS DEMOGRAPHY
Tegevust alustanud ettevõtted palgatud töötajate arvu järgi, 2000, 2002, 2004, 2006 Newly born enterprises by number of employees, 2000, 2002, 2004, 2006
Tegevuse lõpetanud ettevõtted palgatud töötajate arvu järgi, 2000, 2002, 2004, 2006 Dead enterprises by number of employees, 2000, 2002, 2004, 2006
Vähemalt 1010 or more
Vähemalt 1010 or more

19ETTEVÕTLUS EESTIS. BUSINESS IN ESTONIA
ETTEVÕTLUSE DEMOGRAAFIA BUSINESS DEMOGRAPHY
2002. aastal tegevust alustanud ettevõtete elujõulisus tegevusala järgi, 2003–2006 Survival rates of enterprises born in 2002 by economic activity, 2003–2006
2003 2005
20 ETTEVÕTLUS EESTIS. BUSINESS IN ESTONIA
VÄLISKAUBANDUS FOREIGN TRADE
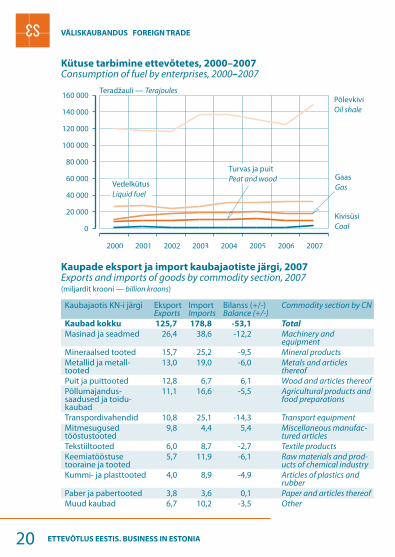
Kütuse tarbimine ettevõtetes, 2000–2007 Consumption of fuel by enterprises, 2000–2007
Kaupade eksport ja import kaubajaotiste järgi, 2007 Exports and imports of goods by commodity section, 2007(miljardit krooni — billion kroons)
Teradžauli — Terajoules
Kaubajaotis KN-i järgi EksportExports
ImportImports
Bilanss (+/-)Balance (+/-)
Commodity section by CN
Kaubad kokku 125,7 178,8 -53,1 Total
Masinad ja seadmed 26,4 38,6 -12,2 Machinery and equipment
Mineraalsed tooted 15,7 25,2 -9,5 Mineral productsMetallid ja metall-tooted
13,0 19,0 -6,0 Metals and articles thereof
Puit ja puittooted 12,8 6,7 6,1 Wood and articles thereofPõllumajandus-saadused ja toidu-kaubad
11,1 16,6 -5,5 Agricultural products and food preparations
Transpordivahendid 10,8 25,1 -14,3 Transport equipmentMitmesugused tööstustooted
9,8 4,4 5,4 Miscellaneous manufac-tured articles
Tekstiiltooted 6,0 8,7 -2,7 Textile productsKeemiatööstuse tooraine ja tooted
5,7 11,9 -6,1 Raw materials and prod-ucts of chemical industry
Kummi- ja plasttooted 4,0 8,9 -4,9 Articles of plastics and rubber
Paber ja pabertooted 3,8 3,6 0,1 Paper and articles thereofMuud kaubad 6,7 10,2 -3,5 Other
21ETTEVÕTLUS EESTIS. BUSINESS IN ESTONIA
VÄLISKAUBANDUS FOREIGN TRADE
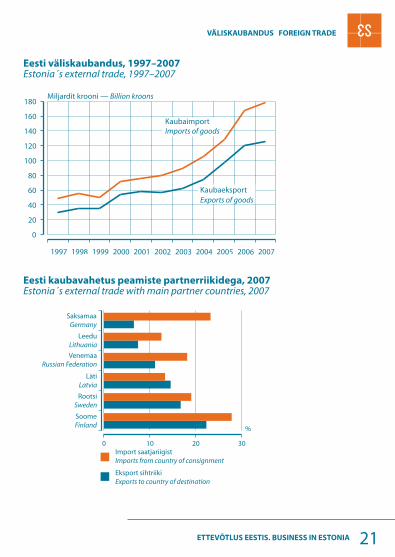
Eesti väliskaubandus, 1997–2007 Estonia´s external trade, 1997–2007
Eesti kaubavahetus peamiste partnerriikidega, 2007 Estonia´s external trade with main partner countries, 2007
Miljardit krooni — Billion kroons
KaubaimportImports of goods
VenemaaRussian Federation
22 ETTEVÕTLUS EESTIS. BUSINESS IN ESTONIA
TEADUS- JA ARENDUSTEGEVUS RESEARCH AND DEVELOPMENT
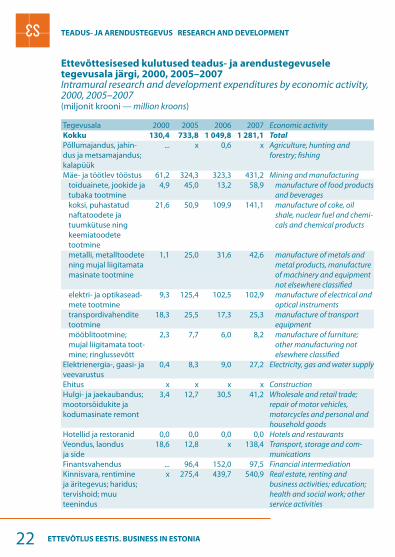
Ettevõttesisesed kulutused teadus- ja arendustegevusele tegevusala järgi, 2000, 2005–2007 Intramural research and development expenditures by economic activity, 2000, 2005–2007(miljonit krooni — million kroons)
Tegevusala 2000 2005 2006 2007 Economic activityKokku 130,4 733,8 1 049,8 1 281,1 Total
Põllumajandus, jahin-dus ja metsamajandus; kalapüük
... x 0,6 x Agriculture, hunting and forestry; fi shing
Mäe- ja töötlev tööstus 61,2 324,3 323,3 431,2 Mining and manufacturingtoiduainete, jookide ja tubaka tootmine
4,9 45,0 13,2 58,9 manufacture of food products and beverages
koksi, puhastatud naftatoodete ja tuumkütuse ning keemiatoodete tootmine
21,6 50,9 109,9 141,1 manufacture of coke, oil shale, nuclear fuel and chemi-cals and chemical products
metalli, metalltoodete ning mujal liigitamata masinate tootmine
1,1 25,0 31,6 42,6 manufacture of metals and metal products, manufacture of machinery and equipment not elsewhere classifi ed
elektri- ja optikasead-mete tootmine
9,3 125,4 102,5 102,9 manufacture of electrical and optical instruments
transpordivahendite tootmine
18,3 25,5 17,3 25,3 manufacture of transport equipment
mööblitootmine; mujal liigitamata toot-mine; ringlussevõtt
2,3 7,7 6,0 8,2 manufacture of furniture; other manufacturing not elsewhere classifi ed
Elektrienergia-, gaasi- ja veevarustus
0,4 8,3 9,0 27,2 Electricity, gas and water supply
Ehitus x x x x ConstructionHulgi- ja jaekaubandus; mootorsõidukite ja kodumasinate remont
3,4 12,7 30,5 41,2 Wholesale and retail trade; repair of motor vehicles, motorcycles and personal and household goods
Hotellid ja restoranid 0,0 0,0 0,0 0,0 Hotels and restaurantsVeondus, laondus ja side
18,6 12,8 x 138,4 Transport, storage and com-munications
Finantsvahendus ... 96,4 152,0 97,5 Financial intermediationKinnisvara, rentimine ja äritegevus; haridus; tervishoid; muu teenindus
x 275,4 439,7 540,9 Real estate, renting and business activities; education; health and social work; other service activities
23ETTEVÕTLUS EESTIS. BUSINESS IN ESTONIA
TEADUS- JA ARENDUSTEGEVUS RESEARCH AND DEVELOPMENT
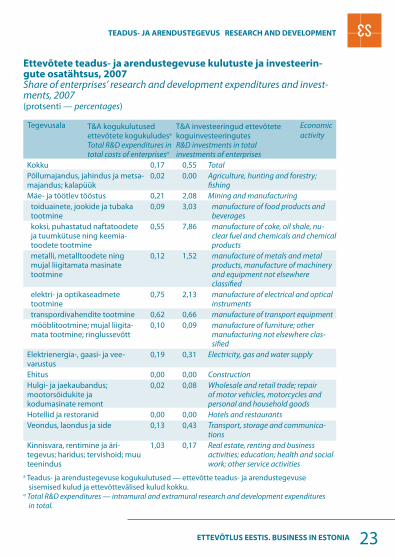
Ettevõtete teadus- ja arendustegevuse kulutuste ja investeerin-gute osatähtsus, 2007Share of enterprises’ research and development expenditures and invest-ments, 2007(protsenti — percentages)
a Teadus- ja arendustegevuse kogukulutused — ettevõtte teadus- ja arendustegevuse sisemised kulud ja ettevõttevälised kulud kokku.a Total R&D expenditures — intramural and extramural research and development expenditures
in total.
T&A kogukulutused ettevõtete kogukuludesa Total R&D expenditures in total costs of enterprisesa
T&A investeeringud ettevõtete koguinvesteeringutes R&D investments in total investments of enterprises
Kokku 0,17 0,55 TotalPõllumajandus, jahindus ja metsa-majandus; kalapüük
0,02 0,00 Agriculture, hunting and forestry; fi shing
Mäe- ja töötlev tööstus 0,21 2,08 Mining and manufacturingtoiduainete, jookide ja tubaka tootmine
0,09 3,03 manufacture of food products and beverages
koksi, puhastatud naftatoodete ja tuumkütuse ning keemia-toodete tootmine
0,55 7,86 manufacture of coke, oil shale, nu-clear fuel and chemicals and chemical products
metalli, metalltoodete ning mujal liigitamata masinate tootmine
0,12 1,52 manufacture of metals and metal products, manufacture of machinery and equipment not elsewhere classifi ed
elektri- ja optikaseadmete tootmine
0,75 2,13 manufacture of electrical and optical instruments
transpordivahendite tootmine 0,62 0,66 manufacture of transport equipmentmööblitootmine; mujal liigita-mata tootmine; ringlussevõtt
0,10 0,09 manufacture of furniture; other manufacturing not elsewhere clas-sifi ed
Elektrienergia-, gaasi- ja vee-varustus
0,19 0,31 Electricity, gas and water supply
Ehitus 0,00 0,00 ConstructionHulgi- ja jaekaubandus; mootorsõidukite ja kodumasinate remont
0,02 0,08 Wholesale and retail trade; repair of motor vehicles, motorcycles and personal and household goods
Hotellid ja restoranid 0,00 0,00 Hotels and restaurantsVeondus, laondus ja side 0,13 0,43 Transport, storage and communica-
tionsKinnisvara, rentimine ja äri-tegevus; haridus; tervishoid; muu teenindus
1,03 0,17 Real estate, renting and business activities; education; health and social work; other service activities
Tegevusala Economic activity
24 ETTEVÕTLUS EESTIS. BUSINESS IN ESTONIA
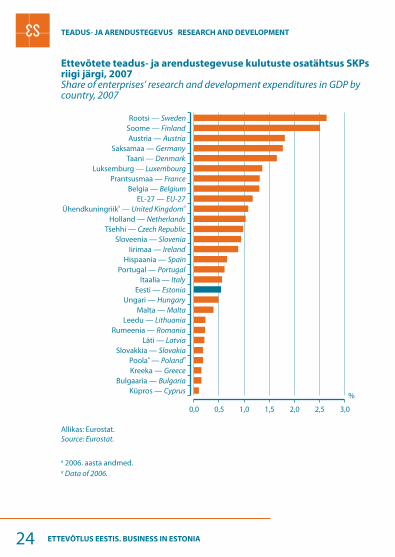
TEADUS- JA ARENDUSTEGEVUS RESEARCH AND DEVELOPMENT
Ettevõtete teadus- ja arendustegevuse kulutuste osatähtsus SKPs riigi järgi, 2007Share of enterprises’ research and development expenditures in GDP by country, 2007
a 2006. aasta andmed.a Data of 2006.
Allikas: Eurostat.Source: Eurostat.
25ETTEVÕTLUS EESTIS. BUSINESS IN ESTONIA
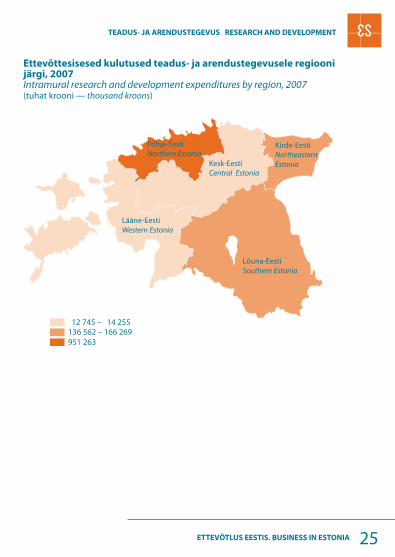
Ettevõttesisesed kulutused teadus- ja arendustegevusele regiooni järgi, 2007Intramural research and development expenditures by region, 2007(tuhat krooni — thousand kroons)
Põhja-EestiNorthern Estonia
Kirde-EestiNortheastern EstoniaKesk-Eesti
Central Estonia
Lääne-EestiWestern Estonia
Lõuna-EestiSouthern Estonia
TEADUS- JA ARENDUSTEGEVUS RESEARCH AND DEVELOPMENT
26 ETTEVÕTLUS EESTIS. BUSINESS IN ESTONIA
INNOVATSIOON INNOVATION
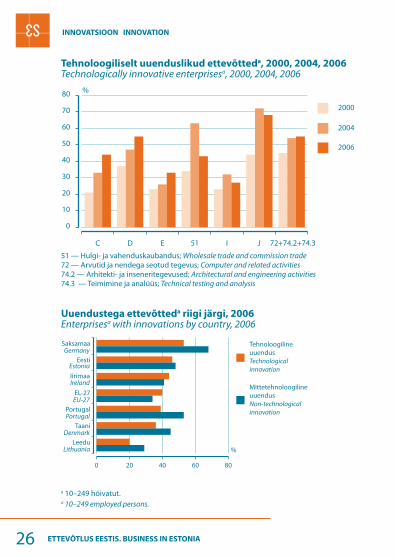
Tehnoloogiliselt uuenduslikud ettevõtteda, 2000, 2004, 2006Technologically innovative enterprisesa, 2000, 2004, 2006
Uuendustega ettevõtteda riigi järgi, 2006Enterprisesa with innovations by country, 2006
a 10–249 hõivatut.a 10–249 employed persons.
51 — Hulgi- ja vahenduskaubandus; Wholesale trade and commission trade72 — Arvutid ja nendega seotud tegevus; Computer and related activities74.2 — Arhitekti- ja inseneritegevused; Architectural and engineering activities74.3 — Teimimine ja analüüs; Technical testing and analysis

27ETTEVÕTLUS EESTIS. BUSINESS IN ESTONIA
Interneti-ühenduse ja veebileheküljega vähemalt 10 hõivatuga ettevõttedª, 2004–2008 jaanuarEnterprisesª with 10 or more employed persons with Internet and websites in, 2004– January 2008
ID-kaarti kasutavad vähemalt 10 hõivatuga ettevõtted, jaanuar 2008 Enterprises with 10 or more employed persons using ID cards, January 2008
ª Tegevusalad: töötlev tööstus; ehitus; hulgi- ja jaekaubandus; mootorsõidukite, mootorrataste, isiklike tarbeesemete ning kodumasinate remont; hotellid ja restoranid; veondus, laondus ja side; kinnisvara, rentimine ja äritegevus; muu ühiskonna-, sotsiaal- ja isikuteenindus.ª Activities: manufacturing; construction; wholesale and retail trade; repair of motor vehicles, motorcycles and personal and household goods; hotels and restaurants; transport, storage and communication; real estate, renting and business activities; other community, social and personal service activities.
-
INFOTEHNOLOOGIA INFORMATION TECHNOLOGY

28 ETTEVÕTLUS EESTIS. BUSINESS IN ESTONIA
Interneti-ühendus ja lairibaühendus ettevõtetesª riigi järgi, jaanuar 2008 Internet and broadband connections in enterprisesª by country, January 2008 (vähemalt 10 hõivatuga ettevõtted — enterprises with 10 or more employees)
ª Tegevusalad: töötlev tööstus; ehitus; hulgi- ja jaekaubandus; mootorsõidukite, mootorrataste, isiklike tarbeesemete ning kodumasinate remont; hotellid ja restoranid; veondus, laondus ja side; kinnisvara, rentimine ja äritegevus; muu ühiskonna-, sotsiaal- ja isikuteenindus.ª Economic activities: manufacturing; construction; wholesale and retail trade; repair of motor vehicles, motorcycles and personal and household goods; hotels and restaurants; transport, stor-age and communication; real estate, renting and business activities; other community, social and personal service activities.
INFOTEHNOLOOGIA INFORMATION TECHNOLOGY
Allikas/Source: Eurostat.
29ETTEVÕTLUS EESTIS. BUSINESS IN ESTONIA
TÖÖTLEV TÖÖSTUS MANUFACTURING
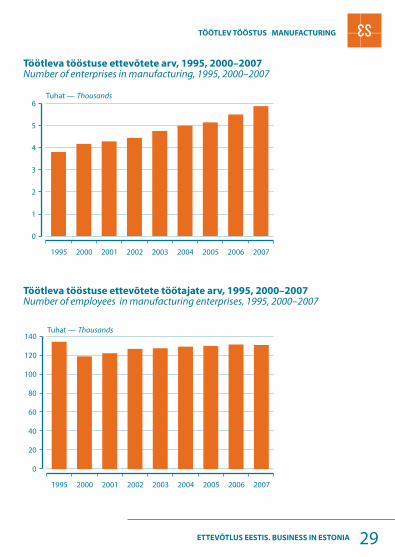
Töötleva tööstuse ettevõtete arv, 1995, 2000–2007Number of enterprises in manufacturing, 1995, 2000–2007
Töötleva tööstuse ettevõtete töötajate arv, 1995, 2000–2007Number of employees in manufacturing enterprises, 1995, 2000–2007
30 ETTEVÕTLUS EESTIS. BUSINESS IN ESTONIA
TÖÖTLEV TÖÖSTUS MANUFACTURING
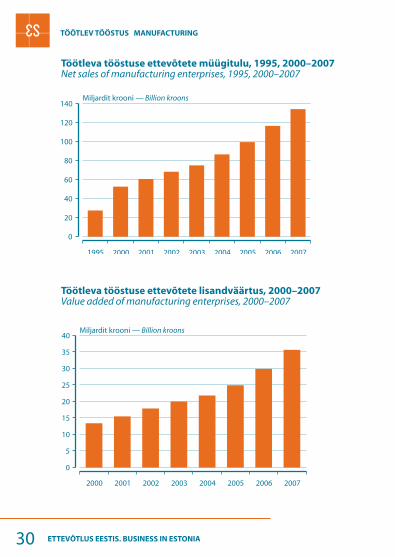
Töötleva tööstuse ettevõtete müügitulu, 1995, 2000–2007 Net sales of manufacturing enterprises, 1995, 2000–2007
Töötleva tööstuse ettevõtete lisandväärtus, 2000–2007Value added of manufacturing enterprises, 2000–2007
31ETTEVÕTLUS EESTIS. BUSINESS IN ESTONIA
TÖÖTLEV TÖÖSTUS MANUFACTURING
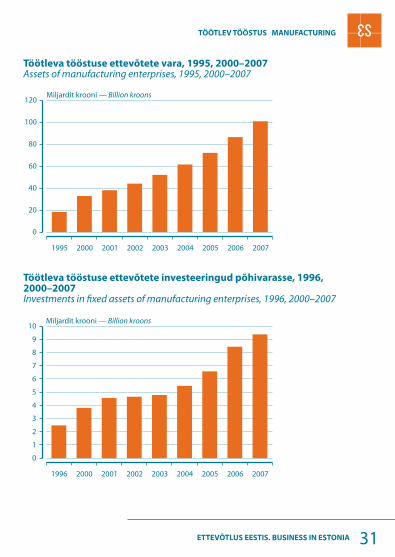
Töötleva tööstuse ettevõtete vara, 1995, 2000–2007Assets of manufacturing enterprises, 1995, 2000–2007
Töötleva tööstuse ettevõtete investeeringud põhivarasse, 1996, 2000–2007Investments in fi xed assets of manufacturing enterprises, 1996, 2000–2007
32 ETTEVÕTLUS EESTIS. BUSINESS IN ESTONIA
TÖÖTLEV TÖÖSTUS MANUFACTURING
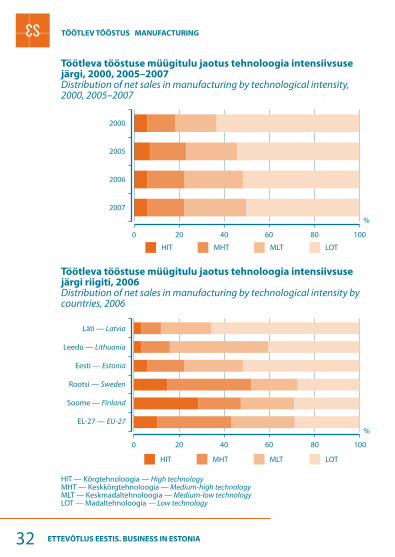
Töötleva tööstuse müügitulu jaotus tehnoloogia intensiivsuse järgi, 2000, 2005–2007Distribution of net sales in manufacturing by technological intensity, 2000, 2005–2007
Töötleva tööstuse müügitulu jaotus tehnoloogia intensiivsuse järgi riigiti, 2006Distribution of net sales in manufacturing by technological intensity by countries, 2006
HIT — Kõrgtehnoloogia — High technologyMHT — Keskkõrgtehnoloogia — Medium-high technologyMLT — Keskmadaltehnoloogia — Medium-low technologyLOT — Madaltehnoloogia — Low technology
Läti — Latvia
Leedu — Lithuania
Eesti — Estonia
Rootsi — Sweden
Soome — Finland
EL-27 — EU-27
33ETTEVÕTLUS EESTIS. BUSINESS IN ESTONIA
TÖÖTLEV TÖÖSTUS MANUFACTURING
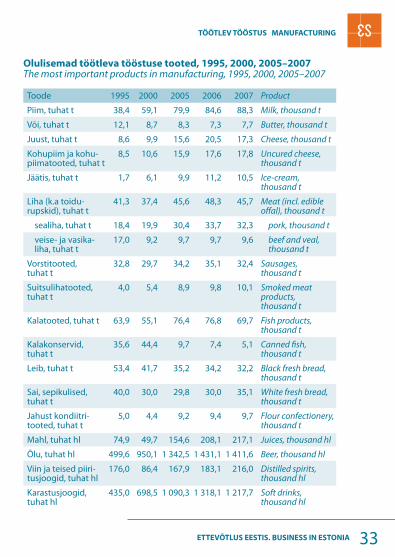
Olulisemad töötleva tööstuse tooted, 1995, 2000, 2005–2007The most important products in manufacturing, 1995, 2000, 2005–2007
Toode 1995 2000 2005 2006 2007 Product
Piim, tuhat t 38,4 59,1 79,9 84,6 88,3 Milk, thousand t
Või, tuhat t 12,1 8,7 8,3 7,3 7,7 Butter, thousand t
Juust, tuhat t 8,6 9,9 15,6 20,5 17,3 Cheese, thousand t
Kohupiim ja kohu-piimatooted, tuhat t
8,5 10,6 15,9 17,6 17,8 Uncured cheese, thousand t
Jäätis, tuhat t 1,7 6,1 9,9 11,2 10,5 Ice-cream, thousand t
Liha (k.a toidu-rupskid), tuhat t
41,3 37,4 45,6 48,3 45,7 Meat (incl. edible off al), thousand t
sealiha, tuhat t 18,4 19,9 30,4 33,7 32,3 pork, thousand t
veise- ja vasika-liha, tuhat t
17,0 9,2 9,7 9,7 9,6 beef and veal, thousand t
Vorstitooted, tuhat t
32,8 29,7 34,2 35,1 32,4 Sausages, thousand t
Suitsulihatooted, tuhat t
4,0 5,4 8,9 9,8 10,1 Smoked meat products, thousand t
Kalatooted, tuhat t 63,9 55,1 76,4 76,8 69,7 Fish products, thousand t
Kalakonservid, tuhat t
35,6 44,4 9,7 7,4 5,1 Canned fi sh, thousand t
Leib, tuhat t 53,4 41,7 35,2 34,2 32,2 Black fresh bread, thousand t
Sai, sepikulised, tuhat t
40,0 30,0 29,8 30,0 35,1 White fresh bread, thousand t
Jahust kondiitri-tooted, tuhat t
5,0 4,4 9,2 9,4 9,7 Flour confectionery, thousand t
Mahl, tuhat hl 74,9 49,7 154,6 208,1 217,1 Juices, thousand hl
Õlu, tuhat hl 499,6 950,1 1 342,5 1 431,1 1 411,6 Beer, thousand hl
Viin ja teised piiri-tusjoogid, tuhat hl
176,0 86,4 167,9 183,1 216,0 Distilled spirits, thousand hl
Karastusjoogid, tuhat hl
435,0 698,5 1 090,3 1 318,1 1 217,7 Soft drinks, thousand hl
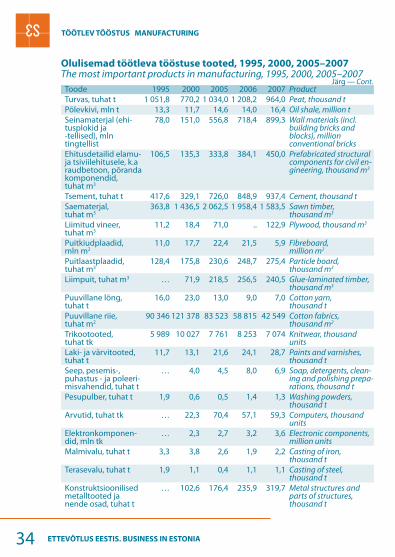
34 ETTEVÕTLUS EESTIS. BUSINESS IN ESTONIA
TÖÖTLEV TÖÖSTUS MANUFACTURING
Olulisemad töötleva tööstuse tooted, 1995, 2000, 2005–2007The most important products in manufacturing, 1995, 2000, 2005–2007
Toode 1995 2000 2005 2006 2007 ProductTurvas, tuhat t 1 051,8 770,2 1 034,0 1 208,2 964,0 Peat, thousand tPõlevkivi, mln t 13,3 11,7 14,6 14,0 16,4 Oil shale, million tSeinamaterjal (ehi-tusplokid ja -tellised), mln tingtellist
78,0 151,0 556,8 718,4 899,3 Wall materials (incl.building bricks and blocks), million conventional bricks
Ehitusdetailid elamu- ja tsiviilehitusele, k.a raudbetoon, põranda komponendid, tuhat m3
106,5 135,3 333,8 384,1 450,0 Prefabricated structural components for civil en-gineering, thousand m3
Tsement, tuhat t 417,6 329,1 726,0 848,9 937,4 Cement, thousand tSaematerjal, tuhat m3
363,8 1 436,5 2 062,5 1 958,4 1 583,5 Sawn timber, thousand m3
Liimitud vineer, tuhat m3
11,2 18,4 71,0 .. 122,9 Plywood, thousand m3
Puitkiudplaadid, mln m2
11,0 17,7 22,4 21,5 5,9 Fibreboard, million m2
Puitlaastplaadid, tuhat m3
128,4 175,8 230,6 248,7 275,4 Particle board, thousand m3
Liimpuit, tuhat m3 … 71,9 218,5 256,5 240,5 Glue-laminated timber, thousand m3
Puuvillane lõng, tuhat t
16,0 23,0 13,0 9,0 7,0 Cotton yarn, thousand t
Puuvillane riie, tuhat m2
90 346 121 378 83 523 58 815 42 549 Cotton fabrics, thousand m2
Trikootooted, tuhat tk
5 989 10 027 7 761 8 253 7 074 Knitwear, thousand units
Laki- ja värvitooted, tuhat t
11,7 13,1 21,6 24,1 28,7 Paints and varnishes, thousand t
Seep, pesemis-, puhastus - ja poleeri-misvahendid, tuhat t
… 4,0 4,5 8,0 6,9 Soap, detergents, clean-ing and polishing prepa-rations, thousand t
Pesupulber, tuhat t 1,9 0,6 0,5 1,4 1,3 Washing powders, thousand t
Arvutid, tuhat tk … 22,3 70,4 57,1 59,3 Computers, thousand units
Elektronkomponen-did, mln tk
… 2,3 2,7 3,2 3,6 Electronic components, million units
Malmivalu, tuhat t 3,3 3,8 2,6 1,9 2,2 Casting of iron, thousand t
Terasevalu, tuhat t 1,9 1,1 0,4 1,1 1,1 Casting of steel, thousand t
Konstruktsioonilised metalltooted ja nende osad, tuhat t
… 102,6 176,4 235,9 319,7 Metal structures and parts of structures, thousand t
Järg — Cont.
35ETTEVÕTLUS EESTIS. BUSINESS IN ESTONIA
TÖÖTLEV TÖÖSTUS MANUFACTURING
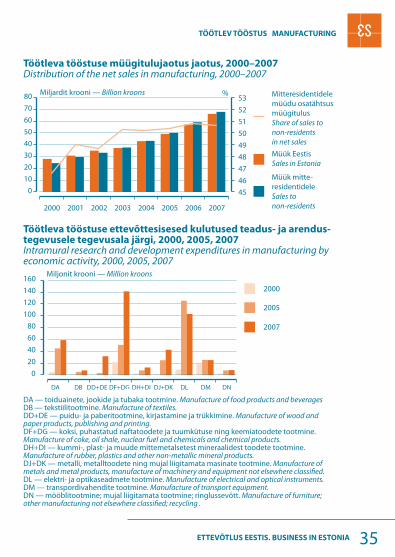
Töötleva tööstuse müügitulujaotus jaotus, 2000–2007Distribution of the net sales in manufacturing, 2000–2007
Töötleva tööstuse ettevõttesisesed kulutused teadus- ja arendus-tegevusele tegevusala järgi, 2000, 2005, 2007Intramural research and development expenditures in manufacturing by economic activity, 2000, 2005, 2007
DA — toiduainete, jookide ja tubaka tootmine. Manufacture of food products and beveragesDB — tekstiilitootmine. Manufacture of textiles.DD+DE — puidu- ja paberitootmine, kirjastamine ja trükkimine. Manufacture of wood and paper products, publishing and printing.DF+DG — koksi, puhastatud naftatoodete ja tuumkütuse ning keemiatoodete tootmine. Manufacture of coke, oil shale, nuclear fuel and chemicals and chemical products.DH+DI — kummi-, plast- ja muude mittemetalsetest mineraalidest toodete tootmine.Manufacture of rubber, plastics and other non-metallic mineral products.DJ+DK — metalli, metalltoodete ning mujal liigitamata masinate tootmine. Manufacture of metals and metal products, manufacture of machinery and equipment not elsewhere classifi ed.DL — elektri- ja optikaseadmete tootmine. Manufacture of electrical and optical instruments.DM — transpordivahendite tootmine. Manufacture of transport equipment.DN — mööblitootmine; mujal liigitamata tootmine; ringlussevõtt. Manufacture of furniture; other manufacturing not elsewhere classifi ed; recycling .
36 ETTEVÕTLUS EESTIS. BUSINESS IN ESTONIA
TÖÖTLEV TÖÖSTUS MANUFACTURING
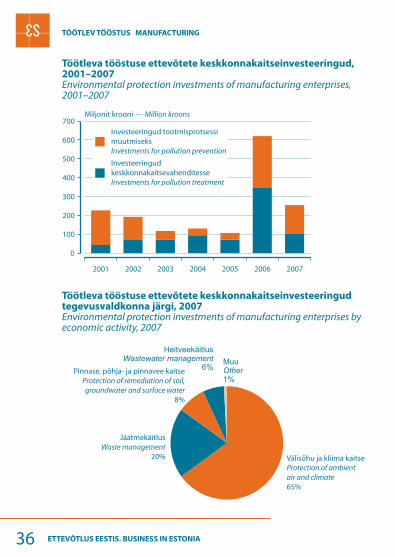
Töötleva tööstuse ettevõtete keskkonnakaitseinvesteeringud, 2001–2007Environmental protection investments of manufacturing enterprises, 2001–2007
Töötleva tööstuse ettevõtete keskkonnakaitseinvesteeringud tegevusvaldkonna järgi, 2007Environmental protection investments of manufacturing enterprises by economic activity, 2007

37ETTEVÕTLUS EESTIS. BUSINESS IN ESTONIA
EHITUS CONSTRUCTION
Ehitusettevõtete arv, 1995, 2000–2007Number of construction enterprises, 1995, 2000–2007
Ehitusettevõtete töötajate arv, 1995, 2000–2007Number of employees in construction enterprises, 1995, 2000–2007
38 ETTEVÕTLUS EESTIS. BUSINESS IN ESTONIA
EHITUS CONSTRUCTION
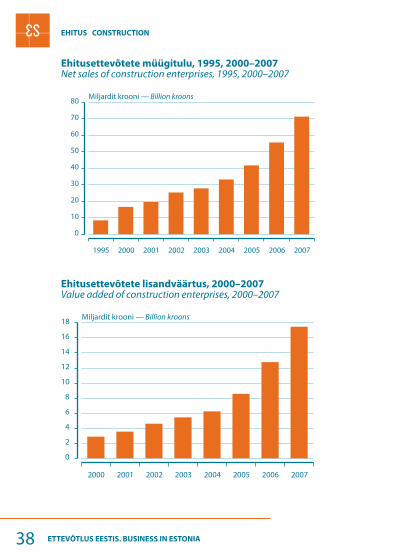
Ehitusettevõtete müügitulu, 1995, 2000–2007Net sales of construction enterprises, 1995, 2000–2007
Ehitusettevõtete lisandväärtus, 2000–2007Value added of construction enterprises, 2000–2007
39ETTEVÕTLUS EESTIS. BUSINESS IN ESTONIA
EHITUS CONSTRUCTION
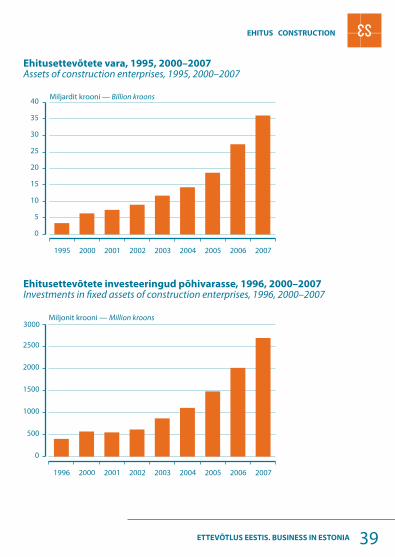
Ehitusettevõtete vara, 1995, 2000–2007Assets of construction enterprises, 1995, 2000–2007
Ehitusettevõtete investeeringud põhivarasse, 1996, 2000–2007Investments in fi xed assets of construction enterprises, 1996, 2000–2007
Miljonit krooni — Million kroons3000
40 ETTEVÕTLUS EESTIS. BUSINESS IN ESTONIA
EHITUS CONSTRUCTION
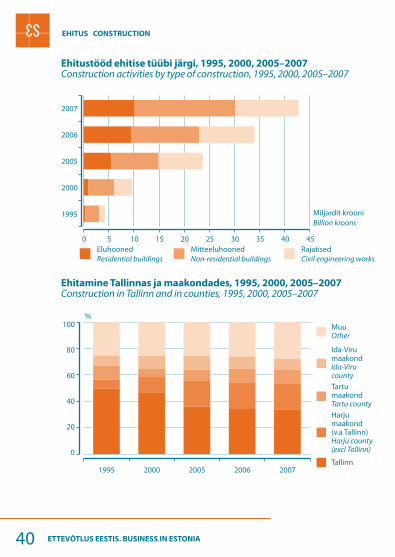
Ehitustööd ehitise tüübi järgi, 1995, 2000, 2005–2007Construction activities by type of construction, 1995, 2000, 2005–2007
Ehitamine Tallinnas ja maakondades, 1995, 2000, 2005–2007Construction in Tallinn and in counties, 1995, 2000, 2005–2007

41ETTEVÕTLUS EESTIS. BUSINESS IN ESTONIA
TRANSPORT TRANSPORT
Transpordiettevõtete arv, 1995, 2000–2007Number of transport enterprises, 1995, 2000–2007
Transpordiettevõtete töötajate arv, 1995, 2000–2007Number of employees in transport enterprises, 1995, 2000–2007
44,6
1995 2000 2001 2002 2003 2004 2005 2006 2007
0
1
2
3
4
5Tuhat — Thousands
42 ETTEVÕTLUS EESTIS. BUSINESS IN ESTONIA
TRANSPORT TRANSPORT
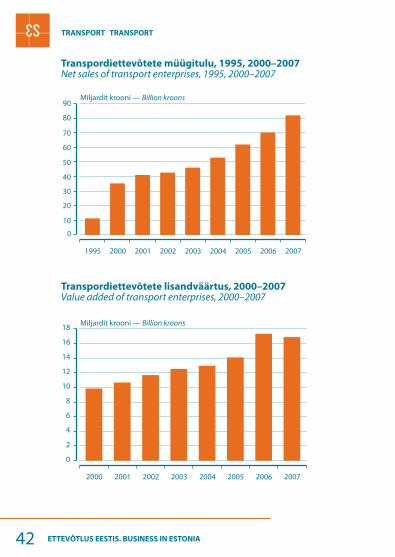
Transpordiettevõtete müügitulu, 1995, 2000–2007Net sales of transport enterprises, 1995, 2000–2007
Transpordiettevõtete lisandväärtus, 2000–2007Value added of transport enterprises, 2000–2007
90
80
70
60
50
40
30
20
10
43ETTEVÕTLUS EESTIS. BUSINESS IN ESTONIA
TRANSPORT TRANSPORT
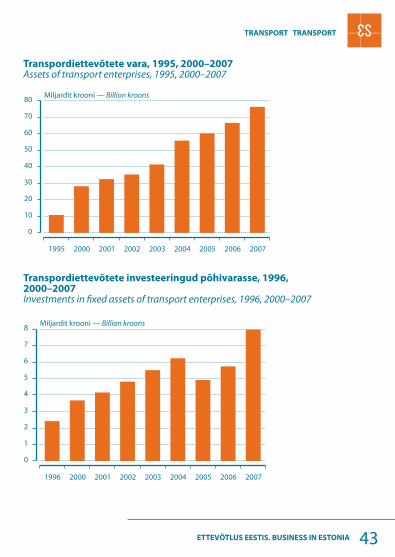
Transpordiettevõtete vara, 1995, 2000–2007Assets of transport enterprises, 1995, 2000–2007
Transpordiettevõtete investeeringud põhivarasse, 1996, 2000–2007Investments in fi xed assets of transport enterprises, 1996, 2000–2007

44 ETTEVÕTLUS EESTIS. BUSINESS IN ESTONIA
TRANSPORT TRANSPORT
Sõitjavedu sõiduliigi järgi, 1980, 1985, 1990, 1995, 2000, 2005–2007Passenger transport by type of transport, 1980, 1985, 1990, 1995, 2000, 2005–2007
Kaubavedu sõiduliigi järgi, 1980, 1985, 1990, 1995, 2000, 2005–2007Transport of goods by type of transport, 1980, 1985, 1990, 1995, 2000, 2005–2007
45ETTEVÕTLUS EESTIS. BUSINESS IN ESTONIA
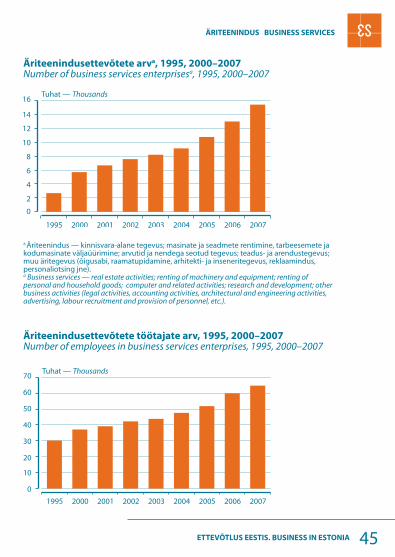
ÄRITEENINDUS BUSINESS SERVICES
Äriteenindusettevõtete arva, 1995, 2000–2007Number of business services enterprisesa, 1995, 2000–2007
Äriteenindusettevõtete töötajate arv, 1995, 2000–2007Number of employees in business services enterprises, 1995, 2000–2007
a Äriteenindus — kinnisvara-alane tegevus; masinate ja seadmete rentimine, tarbeesemete ja kodumasinate väljaüürimine; arvutid ja nendega seotud tegevus; teadus- ja arendustegevus; muu äritegevus (õigusabi, raamatupidamine, arhitekti- ja inseneritegevus, reklaamindus, personaliotsing jne).a Business services — real estate activities; renting of machinery and equipment; renting of personal and household goods; computer and related activities; research and development; other business activities (legal activities, accounting activities, architectural and engineering activities, advertising, labour recruitment and provision of personnel, etc.).
46 ETTEVÕTLUS EESTIS. BUSINESS IN ESTONIA
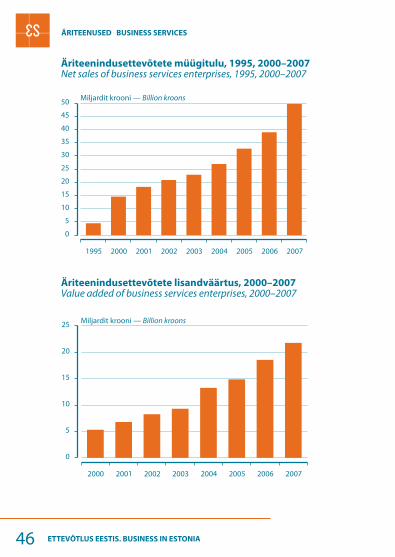
ÄRITEENUSED BUSINESS SERVICES
Äriteenindusettevõtete müügitulu, 1995, 2000–2007Net sales of business services enterprises, 1995, 2000–2007
Äriteenindusettevõtete lisandväärtus, 2000–2007Value added of business services enterprises, 2000–2007
47ETTEVÕTLUS EESTIS. BUSINESS IN ESTONIA
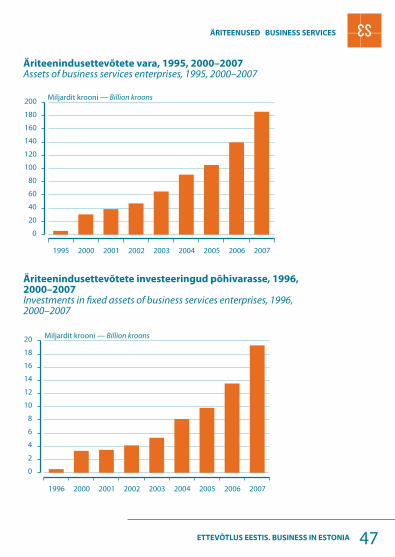
Äriteenindusettevõtete vara, 1995, 2000–2007Assets of business services enterprises, 1995, 2000–2007
Äriteenindusettevõtete investeeringud põhivarasse, 1996, 2000–2007Investments in fi xed assets of business services enterprises, 1996, 2000–2007
ÄRITEENUSED BUSINESS SERVICES
48 ETTEVÕTLUS EESTIS. BUSINESS IN ESTONIA
ÄRITEENUSED BUSINESS SERVICES
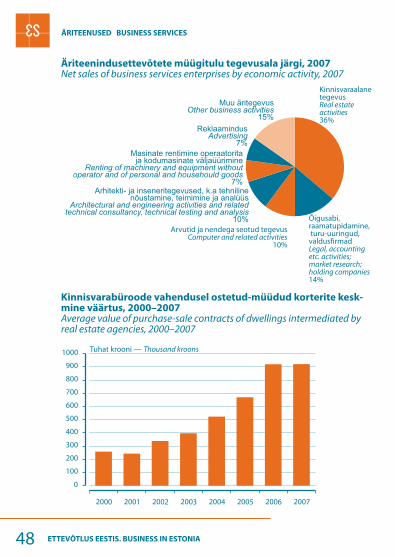
Äriteenindusettevõtete müügitulu tegevusala järgi, 2007Net sales of business services enterprises by economic activity, 2007
Kinnisvarabüroode vahendusel ostetud-müüdud korterite kesk-mine väärtus, 2000–2007Average value of purchase-sale contracts of dwellings intermediated by real estate agencies, 2000–2007
49ETTEVÕTLUS EESTIS. BUSINESS IN ESTONIA
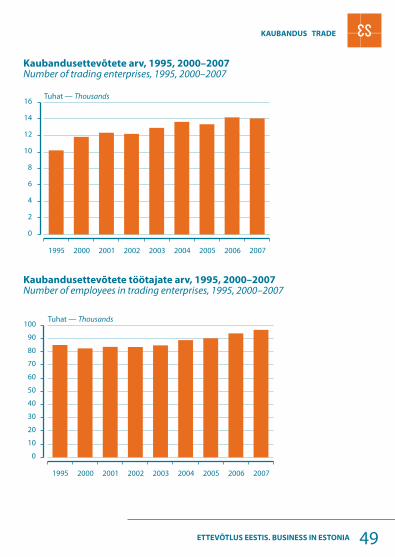
KAUBANDUS TRADE
Kaubandusettevõtete töötajate arv, 1995, 2000–2007Number of employees in trading enterprises, 1995, 2000–2007
Kaubandusettevõtete arv, 1995, 2000–2007Number of trading enterprises, 1995, 2000–2007

50 ETTEVÕTLUS EESTIS. BUSINESS IN ESTONIA
KAUBANDUS TRADE
Kaubandusettevõtete lisandväärtus, 2000–2007Value added of trading enterprises, 2000–2007
Kaubandusettevõtete müügitulu, 1995, 2000–2007Net sales of trading enterprises, 1995, 2000–2007

51ETTEVÕTLUS EESTIS. BUSINESS IN ESTONIA
KAUBANDUS TRADE
Kaubandusettevõtete vara, 1995, 2000–2007Assets of trading enterprises, 1995, 2000–2007
Kaubandusettevõtete investeeringud põhivarasse, 1996, 2000–2007Investments in fi xed assets of trading enterprises, 1996, 2000–2007
52 ETTEVÕTLUS EESTIS. BUSINESS IN ESTONIA
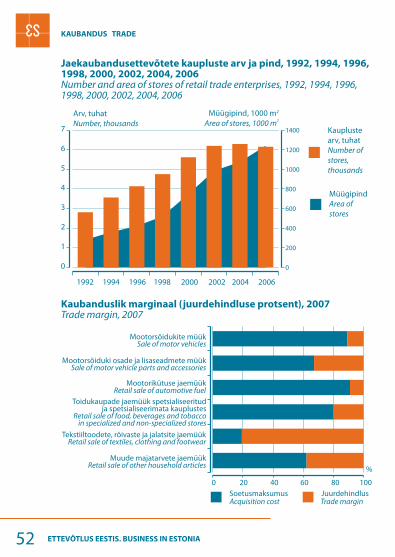
Jaekaubandusettevõtete kaupluste arv ja pind, 1992, 1994, 1996, 1998, 2000, 2002, 2004, 2006Number and area of stores of retail trade enterprises, 1992, 1994, 1996, 1998, 2000, 2002, 2004, 2006
Kaubanduslik marginaal (juurdehindluse protsent), 2007Trade margin, 2007
, 1000 m2
Retail sale of automotive fuel
Acquisition cost Trade margin
KAUBANDUS TRADE
53ETTEVÕTLUS EESTIS. BUSINESS IN ESTONIA
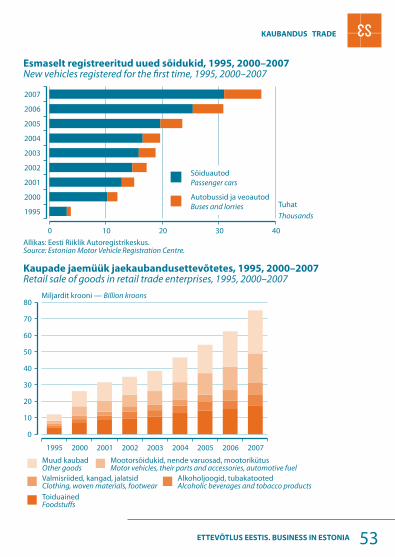
Esmaselt registreeritud uued sõidukid, 1995, 2000–2007New vehicles registered for the fi rst time, 1995, 2000–2007
Kaupade jaemüük jaekaubandusettevõtetes, 1995, 2000–2007Retail sale of goods in retail trade enterprises, 1995, 2000–2007
KAUBANDUS TRADE
1995 2000 2001 2002 2003 2004 2005 2006 2007
0
10
20
30
40
50
60
70
80
ToiduainedFoodstuffs
Alkoholjoogid, tubakatootedAlcoholic beverages and tobacco products
Valmisriided, kangad, jalatsidClothing, woven materials, footwear
Mootorsõidukid, nende varuosad, mootorikütusMotor vehicles, their parts and accessories, automotive fuel
Muud kaubadOther goods
Miljardit krooni — Billion kroons
Allikas: Eesti Riiklik Autoregistrikeskus. Source: Estonian Motor Vehicle Registration Centre.
54 ETTEVÕTLUS EESTIS. BUSINESS IN ESTONIA
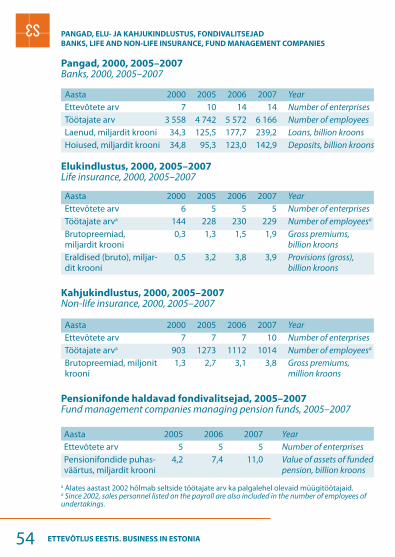
Pangad, 2000, 2005–2007Banks, 2000, 2005–2007
Elukindlustus, 2000, 2005–2007Life insurance, 2000, 2005–2007
Kahjukindlustus, 2000, 2005–2007Non-life insurance, 2000, 2005–2007
Pensionifonde haldavad fondivalitsejad, 2005–2007Fund management companies managing pension funds, 2005–2007
Aasta 2000 2005 2006 2007 YearEttevõtete arv 7 10 14 14 Number of enterprisesTöötajate arv 3 558 4 742 5 572 6 166 Number of employeesLaenud, miljardit krooni 34,3 125,5 177,7 239,2 Loans, billion kroonsHoiused, miljardit krooni 34,8 95,3 123,0 142,9 Deposits, billion kroons
Aasta 2000 2005 2006 2007 YearEttevõtete arv 6 5 5 5 Number of enterprisesTöötajate arva 144 228 230 229 Number of employeesa
Brutopreemiad, miljardit krooni
0,3 1,3 1,5 1,9 Gross premiums, billion kroons
Eraldised (bruto), miljar-dit krooni
0,5 3,2 3,8 3,9 Provisions (gross), billion kroons
Aasta 2000 2005 2006 2007 YearEttevõtete arv 7 7 7 10 Number of enterprisesTöötajate arva 903 1273 1112 1014 Number of employeesa
Brutopreemiad, miljonit krooni
1,3 2,7 3,1 3,8 Gross premiums, million kroons
Aasta 2005 2006 2007 YearEttevõtete arv 5 5 5 Number of enterprisesPensionifondide puhas-väärtus, miljardit krooni
4,2 7,4 11,0 Value of assets of funded pension, billion kroons
PANGAD, ELU- JA KAHJUKINDLUSTUS, FONDIVALITSEJAD
BANKS, LIFE AND NON-LIFE INSURANCE, FUND MANAGEMENT COMPANIES
a Alates aastast 2002 hõlmab seltside töötajate arv ka palgalehel olevaid müügitöötajaid.a Since 2002, sales personnel listed on the payroll are also included in the number of employees of undertakings.
55ETTEVÕTLUS EESTIS. BUSINESS IN ESTONIA
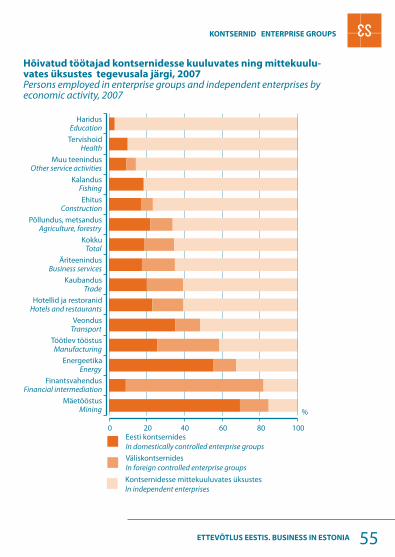
Hõivatud töötajad kontsernidesse kuuluvates ning mittekuulu-vates üksustes tegevusala järgi, 2007Persons employed in enterprise groups and independent enterprises by economic activity, 2007
KONTSERNID ENTERPRISE GROUPS
56 ETTEVÕTLUS EESTIS. BUSINESS IN ESTONIA
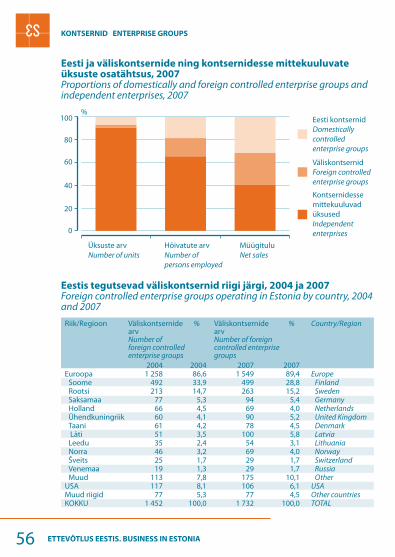
Eesti ja väliskontsernide ning kontsernidesse mittekuuluvate üksuste osatähtsus, 2007Proportions of domestically and foreign controlled enterprise groups and independent enterprises, 2007
Eestis tegutsevad väliskontsernid riigi järgi, 2004 ja 2007Foreign controlled enterprise groups operating in Estonia by country, 2004 and 2007
Riik/Regioon Väliskontsernide arv Number of foreign controlled enterprise groups
% Väliskontsernide arv Number of foreign controlled enterprise groups
% Country/Region
2004 2004 2007 2007Euroopa 1 258 86,6 1 549 89,4 Europe
Soome 492 33,9 499 28,8 FinlandRootsi 213 14,7 263 15,2 SwedenSaksamaa 77 5,3 94 5,4 GermanyHolland 66 4,5 69 4,0 NetherlandsÜhendkuningriik 60 4,1 90 5,2 United KingdomTaani 61 4,2 78 4,5 Denmark Läti 51 3,5 100 5,8 LatviaLeedu 35 2,4 54 3,1 LithuaniaNorra 46 3,2 69 4,0 NorwayŠveits 25 1,7 29 1,7 SwitzerlandVenemaa 19 1,3 29 1,7 RussiaMuud 113 7,8 175 10,1 Other
USA 117 8,1 106 6,1 USAMuud riigid 77 5,3 77 4,5 Other countriesKOKKU 1 452 100,0 1 732 100,0 TOTAL
KONTSERNID ENTERPRISE GROUPS
57ETTEVÕTLUS EESTIS. BUSINESS IN ESTONIA
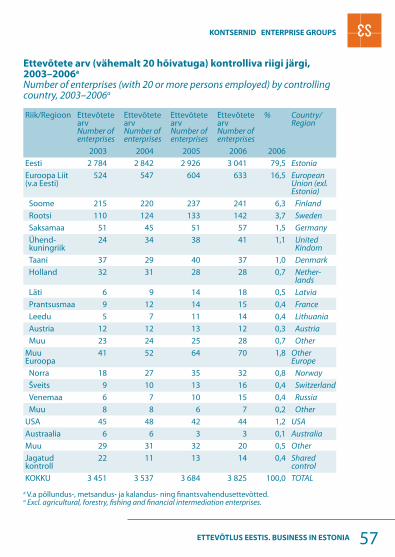
Ettevõtete arv (vähemalt 20 hõivatuga) kontrolliva riigi järgi, 2003–2006a
Number of enterprises (with 20 or more persons employed) by controlling country, 2003–2006a
Riik/Regioon Ettevõtete arv Number of enterprises
Ettevõtete arv Number of enterprises
Ettevõtete arv Number of enterprises
Ettevõtete arv Number of enterprises
% Country/ Region
2003 2004 2005 2006 2006Eesti 2 784 2 842 2 926 3 041 79,5 EstoniaEuroopa Liit (v.a Eesti)
524 547 604 633 16,5 European Union (exl. Estonia)
Soome 215 220 237 241 6,3 FinlandRootsi 110 124 133 142 3,7 SwedenSaksamaa 51 45 51 57 1,5 GermanyÜhend-kuningriik
24 34 38 41 1,1 United Kindom
Taani 37 29 40 37 1,0 DenmarkHolland 32 31 28 28 0,7 Nether-
landsLäti 6 9 14 18 0,5 LatviaPrantsusmaa 9 12 14 15 0,4 FranceLeedu 5 7 11 14 0,4 LithuaniaAustria 12 12 13 12 0,3 AustriaMuu 23 24 25 28 0,7 Other
Muu Euroopa
41 52 64 70 1,8 Other Europe
Norra 18 27 35 32 0,8 NorwayŠveits 9 10 13 16 0,4 SwitzerlandVenemaa 6 7 10 15 0,4 RussiaMuu 8 8 6 7 0,2 Other
USA 45 48 42 44 1,2 USAAustraalia 6 6 3 3 0,1 AustraliaMuu 29 31 32 20 0,5 OtherJagatud kontroll
22 11 13 14 0,4 Shared control
KOKKU 3 451 3 537 3 684 3 825 100,0 TOTAL
a V.a põllundus-, metsandus- ja kalandus- ning fi nantsvahendusettevõtted.a Excl. agricultural, forestry, fi shing and fi nancial intermediation enterprises.
KONTSERNID ENTERPRISE GROUPS
58 ETTEVÕTLUS EESTIS. BUSINESS IN ESTONIA
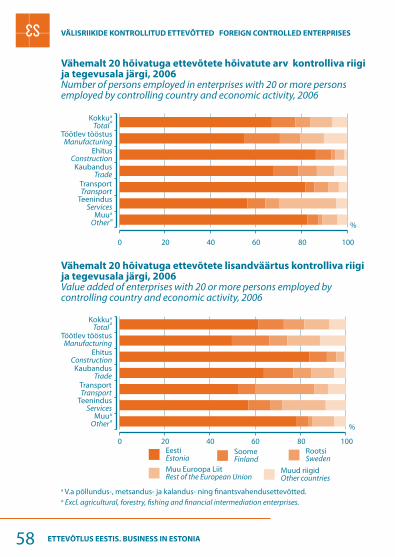
Vähemalt 20 hõivatuga ettevõtete hõivatute arv kontrolliva riigi ja tegevusala järgi, 2006Number of persons employed in enterprises with 20 or more persons employed by controlling country and economic activity, 2006
Vähemalt 20 hõivatuga ettevõtete lisandväärtus kontrolliva riigi ja tegevusala järgi, 2006Value added of enterprises with 20 or more persons employed by controlling country and economic activity, 2006
a V.a põllundus-, metsandus- ja kalandus- ning fi nantsvahendusettevõtted.a Excl. agricultural, forestry, fi shing and fi nancial intermediation enterprises.
a
aa
a
a
aa
a
VÄLISRIIKIDE KONTROLLITUD ETTEVÕTTED FOREIGN CONTROLLED ENTERPRISES
59ETTEVÕTLUS EESTIS. BUSINESS IN ESTONIA
SELGITUSED EXPLANATIONS
Selgitused
Ettevõtted — tegutsevate ettevõtete arv ehk ettevõtted, kellel oli aruandeperioodil fi nants-majanduslik tegevus (müügitulu, kulud jne). Väljaanne hõlmab vaid äriühingute (aktsiaseltsid, osaühingud, täisühingud, usaldusühingud, tulundusühistud) andmeid.
Tööga hõivatud isikud — kõik ettevõttes töötavad isikud (k.a omanikud ja nende tasuta töötavad pereliikmed, täis- või osaajaga töötajad, ajutiselt töölt puuduvad isikud, töö-võtulepinguga töötavad isikud), olenemata nende töönädala pikkusest. Tööga hõivatud isikute arvu mõõdetakse aastakeskmisena.
Töötajad — ettevõttes tööandjaga kokkuleppe (lepingu) alusel töötavad isikud, kes saavad töö eest rahalist tasu (palk, töötasu, preemia, tükitöötasu, kompensatsioon). Töötajate arvu mõõdetakse aastakeskmisena.
Müügitulu — nii põhi- kui ka kõrvaltegevusena valmistatud toodete, teenuste ja kaupade müügist saadud või saadaolev tulu, mis ei hõlma käibemaksu ega aktsiise.
Lisandväärtus — toodang rahalises väärtuses, millest on maha arvatud vahetarbimine; tootmisprotsessis lisandunud väärtus.
Investeeringud põhivarasse — aruandeperioodil soetatud ehitiste, maa, masinate, seadmete, transpordivahendite, sisseseade ja muu inventari maksumus; uusehituse ning olemasoleva põhivara laiendamise, rekonstrueerimise ja renoveerimise puhul ka tehtud tööde maksumus; investeeringud immateriaalsesse põhivarasse ja väärisesemetesse.
Tööviljakus — loodud lisandväärtus tööga hõivatud isiku kohta (lisandväärtuse ja tööga hõivatud isikute arvu suhe).
Ettevõtte sünd — ettevõtte tegutsemiseks vajalike tootmistegurite (tööjõud, maa, kapital) kombinatsiooni loomine tingimusel, et teised ettevõtted ei osale selles sündmuses.
Ettevõtte surm — ettevõtte tegutsemiseks vajalike tootmistegurite (tööjõud, maa, kapital) kombinatsiooni likvideerimine tingimusel, et teised ettevõtted ei osale selles sündmuses.
Eksport — Eestis toodetud ja välismaalt sisse toodud kaupade väljavedu, ajutiseks töötle-miseks sisse toodud kaupade taasväljavedu ning välisriikide vee- ja õhusõidukite varude tarned. Ei hõlma transiiti ega teenuseid.
Import — kaupade sissevedu Eestisse sisetarbimiseks ja välismaale edasimüügiks, taasvälja-veo kohustusega ajutine sissevedu töötlemise eesmärgil ning taassissevedu pärast töötlemist väljaspool Eestit. Ei hõlma transiiti ega teenuseid.
Kombineeritud nomenklatuur ehk KN — Euroopa Liidus kasutatav väliskaubanduse kau-pade klassifi kaator, mis jaguneb kaubajaotisteks ja -gruppideks.
Teadus- ja arendustegevus — loov süstemaatiline töö, mille eesmärk on uute teadmiste saamine ja nende teadmiste rakendamine uute materjalide, toodete ja seadmete tootmiseks, protsesside, süsteemide ja teenuste juurutamiseks või nende oluliseks täiustamiseks.
60 ETTEVÕTLUS EESTIS. BUSINESS IN ESTONIA
SELGITUSED EXPLANATIONS
Tehnoloogiline uuendus — uus või oluliselt täiustatud toode või protsess.
Mittetehnoloogiline uuendus — organisatsiooni- või turundusuuendus.
Tehnoloogiliselt uuenduslik ettevõte — viimase kolme aasta jooksul tehnoloogilise uuenduse eesmärgil innovaatiliselt tegutsenud ettevõte.
Lairiba- ehk püsiühendus — pidev Interneti-ühendus (ADSL, kaabelmodem jne). Vastu-pidiselt sissehelistamisteenusele on lairibaühenduse korral ka infoedastuskiirus suurem.
Kontsern — juriidiliselt või fi nantsiliselt seotud ettevõtete assotsiatsioon, kuhu kuuluvad emaettevõte ja tema otseselt või kaudselt kontrollitavad ettevõtted.
Kontroll ettevõtte üle — kontroll eksisteerib, kui teisel üksusel on ettevõtte hääleõiguslikest aktsiatest või osakutest üle 50% või kui teisel üksusel on ettevõtte tegevus- ja fi nantspoliitika üle mõjuvõim muul viisil.
Omaniku liik — ettevõtjate klassifi tseerimise alus, lähtudes nende kapitaliosalusest (häälte-enamuse kuuluvusest) äriühingus. Kui äriühingus on riigi ja kohaliku omavalitsuse kapitali-osalus 50% või suurem, on tegemist avaliku sektoriga. Erasektorisse kuulub äriühing juhul, kui Eesti Vabariigil või kohalikul omavalitsusel ei ole äriühingus kapitaliosalust või kui see on alla 50%.
EMTAK — Eesti majanduse tegevusalade klassifi kaator, mis on välja töödatud Euroopa Liidu tegevusalade klassifi kaatori NACE alusel. Selles taskuteadmikus on tegevusala määramise alus EMTAK 2003.
A — Põllumajandus, jahindus ja metsamajandus
B — Kalandus
C — Mäetööstus
D — Töötlev tööstus
E — Elektrienergia-, gaasi- ja veevarustus
F — Ehitus
G — Kaubandus (hulgi- ja jaemüük; mootorsõidukite, mootorrataste ja isiklike tarbeesemete ning kodumasinate remont)
H — Hotellid ja restoranid
I — Transport (veondus, laondus ja side)
J — Finantsvahendus
K — Äriteenindus (kinnisvara-, üürimis- ja äritegevus)
M — Haridus
N — Tervishoid ja sotsiaalhoolekanne
O — Muu ühiskonna-, sotsiaal- ja isikuteenindus
61ETTEVÕTLUS EESTIS. BUSINESS IN ESTONIA
Tehnoloogia intensiivsus EMTAK-i koodid
Kõrgtehnoloogia 24.4+30+32.1+32.2+33+35.3
Keskkõrgtehnoloogia (24-24.4)+29+31+32.3+34+35.2
Keskmadaltehnoloogia 23+25+26+27+28+35.1+35.4+35.5+(36-36.1)
Madaltehnoloogia 15+16+17+18+19+20+21+22+36.1+37
SELGITUSED EXPLANATIONS
Suurusgruppidesse jaotatakse ettevõtted rahvusvaheliselt järgmiselt:
mikroettevõtted — alla 10 tööga hõivatud isikuga ettevõtted;
väikeettevõtted — 10–49 tööga hõivatud isikuga ettevõtted;
keskmised ettevõtted — 50–249 tööga hõivatud isikuga ettevõtted;
suurettevõtted — vähemalt 250 tööga hõivatud isikuga ettevõtted.
62 ETTEVÕTLUS EESTIS. BUSINESS IN ESTONIA
SELGITUSED EXPLANATIONS
Explanations
Number of enterprises — enterprises, which were economically active in the reference period (had sales, expenditure, etc.). The publication includes information only about commercial under-takings — public and private limited companies, general and limited partnerships, commercial associations.
Number of persons employed — total number of persons who work in the enterprise (incl. work-ing proprietors and unpaid family members, full- and part-time employees, persons temporarily absent from work, persons employed under contract for services), irrespective of the length of their working week. The number of persons employed is measured as an annual average.
Number of employees — persons who work for an employer and who have a contract of employ-ment and receive compensation in the form of wages, salaries, fees, gratuities, piecework pay or remuneration in kind. Number of employees is measured as an annual average.
Net sales — income from the sale of products, goods and services received or to be received, which does not include VAT and excises.
Value added — the value of output less the value of intermediate consumption; the measure of the contribution to GDP made by an individual producer, industry or sector.
Investments in fi xed assets — the cost of buildings, equipment, machinery, vehicles, installa-tion, etc. purchased in the reference period; in the case of construction and reconstruction of the existing fi xed assets, it includes also the cost of work done; investments in intangible goods and in valuables.
Apparent labour productivity — the value added generated on average per person employed (calculated as value added divided by the number of persons employed).
Birth of enterprise — the creation of a combination of production factors with the restriction that no other enterprises are involved in the event.
Death of enterprise — the dissolution of a combination of production factors with the restriction that no other enterprises are involved in the event.
Exports — exportation of goods produced in Estonia and imported from a foreign country, re-exportation after inward processing and supplies for foreign vessels and aircraft stores. Exports exclude transit and services.
Imports — importation of goods into Estonia for domestic consumption and for resale to a foreign country, imports for inward processing with notifi cation of intended return and re-imports after processing outside of Estonia. Imports exclude transit and services.
CN, i.e. Combined Nomenclature — the classifi cation used within the European Union for collecting and processing foreign trade data. This classifi cation is based on the “Harmonised com-modity description and coding system” (HS) which covers all products that can be the subject of an international transaction and simultaneously have a physical dimension.
Research and development — an activity undertaken for the purpose of discovering or develop-ing new products, including improved versions or qualities of existing products, or discovering or developing new or more effi cient processes of production.
Technological innovation — new or signifi cantly improved product or process.
Non-technological innovation — organisational or marketing innovation.
Technologically innovative enterprise — enterprise engaged during last three years in the innovation activities aimed at technological innovation.
Broadband — high-quality communication connections with the Internet such as cable, ADSL and other kinds of DSL connections.
Enterprise group — an association of enterprises bound together by legal and/or fi nancial links.
63ETTEVÕTLUS EESTIS. BUSINESS IN ESTONIA
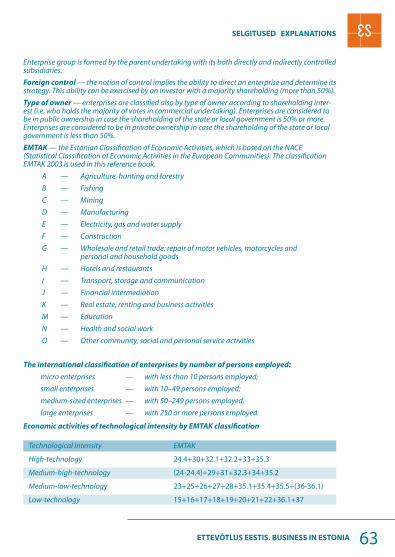
Enterprise group is formed by the parent undertaking with its both directly and indirectly controlled subsidiaries.
Foreign control — the notion of control implies the ability to direct an enterprise and determine its strategy. This ability can be exercised by an investor with a majority shareholding (more than 50%).
Type of owner — enterprises are classifi ed also by type of owner according to shareholding inter-est (i.e. who holds the majority of votes in commercial undertaking). Enterprises are considered to be in public ownership in case the shareholding of the state or local government is 50% or more. Enterprises are considered to be in private ownership in case the shareholding of the state or local government is less than 50%.
EMTAK — the Estonian Classifi cation of Economic Activities, which is based on the NACE (Statistical Classifi cation of Economic Activities in the European Communities). The classifi cation EMTAK 2003 is used in this reference book.
A — Agriculture, hunting and forestry
B — Fishing
C — Mining
D — Manufacturing
E — Electricity, gas and water supply
F — Construction
G — Wholesale and retail trade; repair of motor vehicles, motorcycles and personal and household goods
H — Hotels and restaurants
I — Transport, storage and communication
J — Financial intermediation
K — Real estate, renting and business activities
M — Education
N — Health and social work
O — Other community, social and personal service activities
The international classifi cation of enterprises by number of persons employed:
micro enterprises — with less than 10 persons employed;
small enterprises — with 10–49 persons employed;
medium-sized enterprises — with 50–249 persons employed;
large enterprises — with 250 or more persons employed.
Economic activities of technological intensity by EMTAK classifi cation
SELGITUSED EXPLANATIONS
Technological intensity EMTAK
High-technology 24.4+30+32.1+32.2+33+35.3
Medium-high-technology (24-24.4)+29+31+32.3+34+35.2
Medium-low-technology 23+25+26+27+28+35.1+35.4+35.5+(36-36.1)
Low-technology 15+16+17+18+19+20+21+22+36.1+37
Toimetanud Liis HaugasInglise keel: Heli TaarasteKüljendus: Uku NurgesKaanekujundus: Maris Valk
Edited by Liis HaugasEnglish by Heli TaarasteLayout by Uku NurgesCover design by Maris Valk
Kirjastanud Statistikaamet,Endla 15, 15174 Tallinn,Trükkinud Ofset OÜ,Paldiski mnt 25, 10612 Tallinn
Aprill 2009
Published by Statistics Estonia,15 Endla Str, 15174 TallinnPrinted by Ofset Ltd,25 Paldiski Rd, 10612 Tallinn
April 2009