eu fp 6 project sspi-ct-2003/503614 with dg rtd insea · the insea approach was designed to...
TRANSCRIPT

EU FP 6 Project SSPI-CT-2003/503614 with DG RTD
INSEA
Integrated Sink Enhancement Assessment
STREP Policy Support and Anticipating Scientific and Technological Needs
SUSDEV 3.1.1
SUSDEV 3.1.1.2
DELIVERABLE D3 (T30) FINAL REPORT
EXECUTIVE SUMMARY !!DRAFT!!
Due date of deliverable: September 2006 Version: August 2006 Start date of project: 1 January 2004 Duration: 30 Months Organization name of lead contractor for this deliverable: International Institute for Applied Systems Analysis (IIASA)
Dissemination Level PU Public PP Restricted to other programme participants (including the Commission Services) RE Restricted to a group specified by the consortium (including the Commission Services) X CO Confidential, only for members of the consortium (including the Commission Services)
Contents Contents ........................................................................................................................................... 2 Authors ............................................................................................................................................ 3 Executive Summary......................................................................................................................... 4 1 Introduction and Overview...................................................................................... 9 2 Bio-Physical Modeling (for EU 25) ...................................................................... 10
2.1 EPIC Model: Biophysical process modeling for EU 25: Concept, data, methods, and results.....................................................................................................................10
2.2 EFEM-DNDC & AROPAj: GHG Abatement and Carbon Sequestration Costs in Agriculture: Economic Assessment Using Farm Models......................................16
3 Forest Modeling..................................................................................................... 23 3.1 DIMA Model: Geographically explicit global modeling of land-use change, carbon
sequestration, and biomass supply ........................................................................23 3.2 PICUS Model, OSKAR Model: Estimating potential forest production, biomass and
carbon storage for EU countries 2005 - 2150........................................................25 3.3 Biomass conversion technology ....................................................................................31
4 Economic Modeling .............................................................................................. 36 4.1 FASOM: The European Forest and Agricultural Sector Optimization Model..............36
5 Policy Implications ................................................................................................ 40 5.1 The INSEA (Deliverables) results in the context of KP, IPCC, CDM, JI, and linking
LULUCF credits, AFOLU – post 2012, and REDD .............................................40 References ..................................................................................................................................... 48
2

Authors Contributing to the INSEA Final Report (in alphabetical order) E. Angenendt, K. Aoki, G. Armstrong, J. Balkovic, Benítez, P., D. Blank, R. Bujnovsky, S. De Cara, O. Franklin, P.-A. Jayet, F. Kraxner, S. Leduc, M. J. Lexer, I. McCallum, E. Moltchanova, B. Müller, M. Obersteiner, K. Poltarska, E. Rametsteiner, W. Rammer, D. Rokityanskiy, E. Schmid, U. A. Schneider, D. E. Schwab, R. Seidl, R. Skalsky, K. Strassmann, Y. Yamagata, J. Yan, J. Zeddies, et al.
3

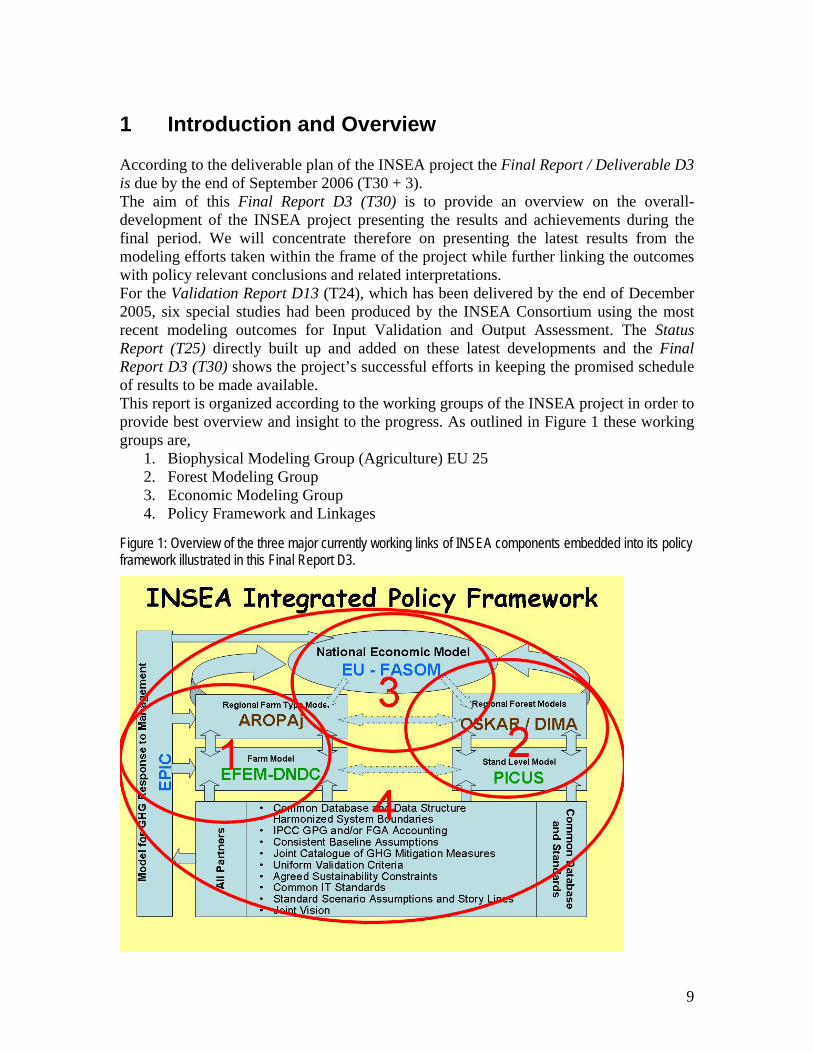
Executive Summary The INSEA approach was designed to strengthen the European Research Area (ERA), by integration within the project, but also creating a platform for further integration with researchers outside the INSEA consortium. The project’s objective was to develop a scientifically sound analytical tool to assess economic and environmental effects for enhancing carbon sinks and greenhouse gas abatement measures on agricultural and forest lands. The explicit goal of the Integrated Sink Enhancement Assessment was to implement LULUCF activities under the Kyoto Protocol and beyond. Figure 1 illustrates the interaction between the common database and the models developed and used within INSEA which are operating on different scales of analysis. At the projects micro-, meso-, and macro-level, forestry and agriculture modeling is carried out in parallel in order to use and determine interactions.
Figure 1 Overview of project integration of models developed and used within INSEA along with different levels of aggregation and sectors. The entire array of tasks aiming at developing a common database and standards for the assessment of GHG mitigation measures was a joint effort where effectively all participants contributed. The creation of a common database was further made available to all the partners and partial outside sharing was facilitated.
4

At the micro-level (farm and stand level), agricultural (biophysical) modeling was carried out with an individual farm model on GHG management on the agricultural side (EFEM-DNDC). In Baden Wuerttemberg (as a case study) GHG emissions and abatement costs have been compared between AROPA-GHG and EFEM. The results indicate that, for a carbon value of 20 €/tCO2eq, the estimated reduction in emissions ranges between 2.4% and 5.3% of the baseline BW agricultural emissions. For the national level (Germany), alternative tillage practices and carbon sequestration in agriculture was also assessed with the economic-ecological model EFEM (Farm Economic Assessment of Soil Carbon Enhancement). Herein, the INSEA network was used in regard to data provision and linkages to other models thereby integrating site-specific conditions into the analyses. Results indicate that conservation tillage practices as a means to enhance carbon stocks in soils can be promoted vastly with relatively low incentives. In Germany, a compensation payment of 20 €/ha would suffice to balance the economic losses occurring due to an 80 % obligation for conservation tillage on arable land. A carbon tax on SOC emissions turns out to be a payment if carbon is sequestered. Under equality aspects it seems nevertheless complicated to develop an appropriate promotion tool since the impact on a farm’s gross margin is widely dependent on natural conditions and rotations. In principle, EFEM verification and calibration for the soil carbon scenarios are made difficult since there’s only little information on the present distribution of conservation tillage. For the forestry bio-physical modeling at INSEA’s micro-level a forest-plot model (PICUS) was used for simulating forest dynamics on time-scales relevant for forest succession. The forest plot level model, PICUS v1.3 mainly focused on sink enhancement and especially emphasized on the linkage between the micro- and meso-level modeling in forestry. First, PICUS was compared to the grid based biophysical TsuBiMo (meso-scale). Secondly, PICUS was used for validating/evaluating and linking to the biophysical OSKAR model (meso-scale) which has been newly developed based on the resulting experience from the previous comparisons with TsuBiMo. At the agricultural meso-level (regional/national level) modeling within INSEA, the results from the farm models have been checked for consistency with the regional results from the model AROPAj. In addition, the interplay between these two models, both of which are based on data from the European Farm Accountancy Data Network, helped also to quantify the GHG mitigation implications of Common Agricultural Policy. For mitigation of greenhouse gas emissions in EU agriculture, AROPAj was used to assess the costs of reducing agricultural emissions and enhancing carbon sinks in agricultural soils. Marginal abatement costs of agricultural emissions were assessed and the mitigation potential of carbon-friendly tillage practices analyzed. Results indicate that without any specific incentive to adopt alternative tillage practices, agricultural emissions are reduced by 4% at a 20 €/tCO2eq price. Marginal abatement cost heterogeneity is found to be an important feature both between and within regions. If carbon sequestration is rewarded, the total abatement reaches 6.2% of agricultural emissions at a 20 €/tCO2eq price.
5

In addition to the model runs with AROPAj, the biophysical process model EPIC (Environmental Policy Integrated Climate) has been used to predict changes in crop yields, sediment transport (SDT), and soil organic carbon (SOC) in Baden-Württemberg (BW), Germany, in order to assess the impacts of measures to combat erosion and decline of soil organic matter (Environmental and economic impact analysis of alternative management practices). The results were then linked to economic FADN (Farm Accountancy Data Network) data to compute the direct net economic impact on farm incomes implied by the adoption of alternative tillage and management systems (conventional tillage, reduced tillage, minimum tillage, introduction of winter cover crops). The agronomics and GHG implications of management change to enhance sinks or reduce GHG emissions in the agricultural sector was then quantified with the latest version of EPIC and DNDC. A tool has been developed that is capable in analyzing biophysical impacts of alternative management practices and biomass production systems at EU25 scale. The tool was validated against measured soil profile data from the Slovakian soil information system and applied to analyze the production and environmental impacts of alternative tillage systems (i.e. reduced and minimum tillage systems), and biomass production systems (i.e. miscanthus and poplar coppice) in EU25. The simulation results suggested that there is a substantial potential to sequester soil organic carbon and to reduce nitrous oxide emissions using more soil conserving tillage systems. On the forestry side at the meso-level modeling, the OSKAR Model was developed as a forest production and management model for global use. For global application in cooperation with other models, the limitations on the model formulation are largely determined by input data availability and calculation speed. Particular requirements for the developed OSKAR Model were that it should be able to incorporate effects of management, such as thinning, and climate change scenarios. This newly developed OSKAR Model has been compared with the PICUS Model (micro-level). The results indicated that, when comparing the slopes of thinned stands in relation to their un-thinned counterparts, the thinning effects in both the models are nearly identical, indicating a generally good agreement of the models. Moreover, simulated stem number under managed conditions showed a good agreement at the end of the simulation period despite larger differences in the first harvesting intervention. This suggested a comparable density-related behavior of the models in terms of the interaction of thinning and natural mortality. Consequently, the OSKAR Model was applied on the region/national level (France) for predicting carbon and production in forests within the period of 2005-2150 and also to assess the effects of management scenarios. The results indicated that biomass carbon and, to a lesser extent, dead wood carbon is higher the longer the rotation period. The average harvests are less affected by the rotation period. The 20% thinning scenario in the OSKAR Model gives slightly more total harvests than the 50% thinning program. The next step was to carry out stand-alone simulations for EU countries. The results indicated that in general total biomass volumes are lower than estimated by FAO (2006), which could be a result of different allometric expansion factors or that some unmanaged forests were not included in the EFI dataset which has been used by the OSKAR Model.
6

The harvest estimations are mostly higher or similar to the FAO numbers and indicate that for some countries (France, Poland, Sweden) there is a potential to increase harvest within the next hundred years. Looking at the effect of different management scenarios it is clear that carbon storage will be increased by increasing the harvest age and by protecting old forests. However, increasing harvest age also leads to substantial reduction in harvests for the next 50 years. Protection of old forest only initially reduces harvest while the effect on harvests is small over a longer time period, indicating that this is a promising option for increasing carbon storage. This scenario is also likely to provide benefits for biodiversity. The OSKAR model was then used for simulating new stands starting each 5 year period for all species regarded as suitable for every region in order to establish full linkage to the FASOM Model (macro-level). As a second meso-level forestry model, the spatially explicit Dynamic Integrated Model of Forestry and Alternative Land Use (DIMA) was developed within the INSEA framework to quantify the economic potential of global forests, explicitly modeling the interactions and feedbacks between ecosystems and anthropogenic land-use activities. DIMA has been used to determine whether carbon sequestration policies - such as those that promote afforestation and discourage deforestation (i.e., avoided deforestation) - could present a significant contribution to the global portfolio of climate change mitigation options, as well as their likely spatial effects on land use. The objective was to model the effects of policies designed to induce landowners to change land use and management patterns with a view to sequester carbon or to reduce deforestation. The modeling results showed that carbon sequestration policies—such as those that promote afforestation and discourage deforestation—could contribute to a significant part of the global portfolio of efficient climate mitigation policies, dependent upon carbon prices. Results from DIMA further depicted that in one of the scenarios considered (A2r) the share of globally avoided deforestation grows exponentially with the carbon price, from 5% to 75% of the predicted deforestation. Among further contributions under the auspices of INSEA in the field of biomass for bioenergy (black liquor gasification, auto-caustization, carbon capture and permanent storage (BECS), etc.), a model for identifying the biomass demands for competitive Methanol production and power plants has been developed. Model calculations predict that for a 200 MWbiomass power plant, it is possible to produce methanol, from poplar coming from an area of 50 km of radius around the power plant and to deliver it to cities in an area of 67 km of radius at for a maximum price of 1.0 €/Lgasoline equivalent. According to the achieved results, and by applying good efficiency and high load hours of the power plant, as well as reasonable wood costs and a strategic position, the methanol price can become competitive in the transport sector. On the joint-INSEA macro-level modeling (national/EU level), to which all lower modeling levels are linked to, the European Agricultural and Forest Sector Model (EUFASOM) has been developed as a tool for policy analysis. It shows that the economic potentials of land based carbon emission mitigation are smaller than often advocated technical potentials. Lower abatement results from land scarcity and price changes.
7

This state-of-the-art model represents an integrated tool for the simulation of complex policy impacts in the agricultural and forestry sectors. As such EUFASOM will be useful for policy design and negotiations, i.e. on international post Kyoto climate policies. Further EUFASOM actions include a) addition of bioenergy chains within the European Non-food Agriculture (ENFA) project, b) integration of detailed agricultural data from the EU new member states, c) integrated policy scenarios analysis within the whole network of INSEA tools, and d) communication of analysis results. Policy Implications The Final INSEA report concludes with a summary of the relevant policy implications and policy – relevant findings from all INSEA Deliverables.
8
1 Introduction and Overview According to the deliverable plan of the INSEA project the Final Report / Deliverable D3 is due by the end of September 2006 (T30 + 3). The aim of this Final Report D3 (T30) is to provide an overview on the overall-development of the INSEA project presenting the results and achievements during the final period. We will concentrate therefore on presenting the latest results from the modeling efforts taken within the frame of the project while further linking the outcomes with policy relevant conclusions and related interpretations. For the Validation Report D13 (T24), which has been delivered by the end of December 2005, six special studies had been produced by the INSEA Consortium using the most recent modeling outcomes for Input Validation and Output Assessment. The Status Report (T25) directly built up and added on these latest developments and the Final Report D3 (T30) shows the project’s successful efforts in keeping the promised schedule of results to be made available. This report is organized according to the working groups of the INSEA project in order to provide best overview and insight to the progress. As outlined in Figure 1 these working groups are,
1. Biophysical Modeling Group (Agriculture) EU 25 2. Forest Modeling Group 3. Economic Modeling Group 4. Policy Framework and Linkages
Figure 1: Overview of the three major currently working links of INSEA components embedded into its policy framework illustrated in this Final Report D3.
9

2 Bio-Physical Modeling (for EU 25)
2.1 EPIC Model: Biophysical process modeling for EU 25: Concept, data, methods, and results Objectives The objective is to develop within the INSEA project an integrated biophysical process modeling framework that is capable to address production and environmental impacts of alternative land use and management practices for food and non-food crop production systems in EU25. Policy analysts are increasingly using computer intensive modeling systems to consistently analyze the complex relationship between policy instruments, the reaction of individual decision makers and the consequences for economic and environmental indicators. An adequate delineation and aggregation approach is essential, because the heterogeneity of natural resources, management practices, and individual decision making would imply literally millions of model applications (Putman et al., 1988; Rosenberg et al., 1992; Haan et al., 1995; Atwood et al., 2000; Schmid, 2001). Consequently, complex landscapes with heterogeneous land management have to be stratified into homogeneous units, i.e. Homogenous Response Units (HRU). In general, an increasing number of HRUs may better portray the natural and management heterogeneity in a region and may also improve the model performance at aggregate levels. The natural homogeneity (HRU) basically relates to similar physical and chemical conditions including weather, soils, topography, and eventually management practices. The challenge is to delineate a number of representatives HRUs for a given region that sufficiently depicts the heterogeneity of natural resource endowments and processes. A spatially and temporally indexed common activity based unit (e.g. hectares, animal heads) assures the linkage between outputs and inputs of biophysical process models and economic optimization models. The HRU delineation procedure usually involves statistical or/and GIS based methods (e.g. cluster analysis) by merging weather, soil, topographic, land use, and management information. Each HRU is simulated with the field-scale model EPIC (Environmental Policy Integrated Climate; Williams et al., 1995). EPIC delivers production and environmental indicators on a per hectare base (crop yield in t/ha, sediment transport in t/ha, nitrogen leaching in kg/ha, carbon sequestered in kg/ha, etc.), which describe attributes of production activities (among cost and revenue items) that are usually used in economic mathematical programming models (e.g. EUFASOM, AROPAj, EFEM). In the INSEA project, the biophysical process modeling framework has been applied to analyze the production and environmental impacts of alternative tillage systems (i.e. reduced and minimum tillage systems), and biomass production systems (i.e. miscanthus and poplar coppice). In particular, potentials of sequestering organic carbon in soils through reduced or minimum tillage systems have been analyzed as well as their impacts on crop yields and nitrous oxide emissions. The effects of alternative tillage systems have been put in relation to the effects of conventional tillage systems, which serves as reference or base-run scenario.
10

Data and Methods The biophysical process model EPIC has specific data requirements with respect to weather, soil, topography, and land use management practices. To fulfill the minimum of requirements, data from various sources, mostly provided by JRC, EUROSTAT, IIASA, and other institutions, are processed in GIS and relational Data Base environment. The concept of Homogeneous Response Units integrates input data processing, the EPIC simulation framework, and EPIC output data processing for economic modeling or dynamic comparative analyses. It also solves how data of different character, scales and aggregation levels can be consistently merged and linked to the EPIC-GIS workspace. Only those parameters of landscape, which are relatively stable over time (even under climate change) and are hardly adjustable by farmers, were selected to create the raster of HRUs for EU25 (i.e. elevation, slope, soil texture, soil depth, and stoniness). In total, 1,084 HRUs for EU25 were delineated as the unique combinations of elevation, slope, soil texture, soil depth and volume-of-stones categories (figure 1). The next step is to mask the layer of HRUs with land cover categories, irrigation coverage, and NUT2 regions – by which the Individual Simulation Units (ISU) are obtained. For each ISU, initial values for soil and topography parameters from GIS archive are calculated in GIS environment. The concept of HRU/ISU for biophysical process modeling at EU25 aims to find an image of a likely field, which we could consider as typical for an ISU. We construct an image of a representative field, which reflects available data at scale 1:1,000,000 with likely site conditions and management practices, and we extrapolate the field impacts uniformly to the entire ISU. The effects and impacts of site and management practices for an ISU are therefore expected as field-size effects.
Figure 1: Delineation of Homogeneous Response Units for EU25
11
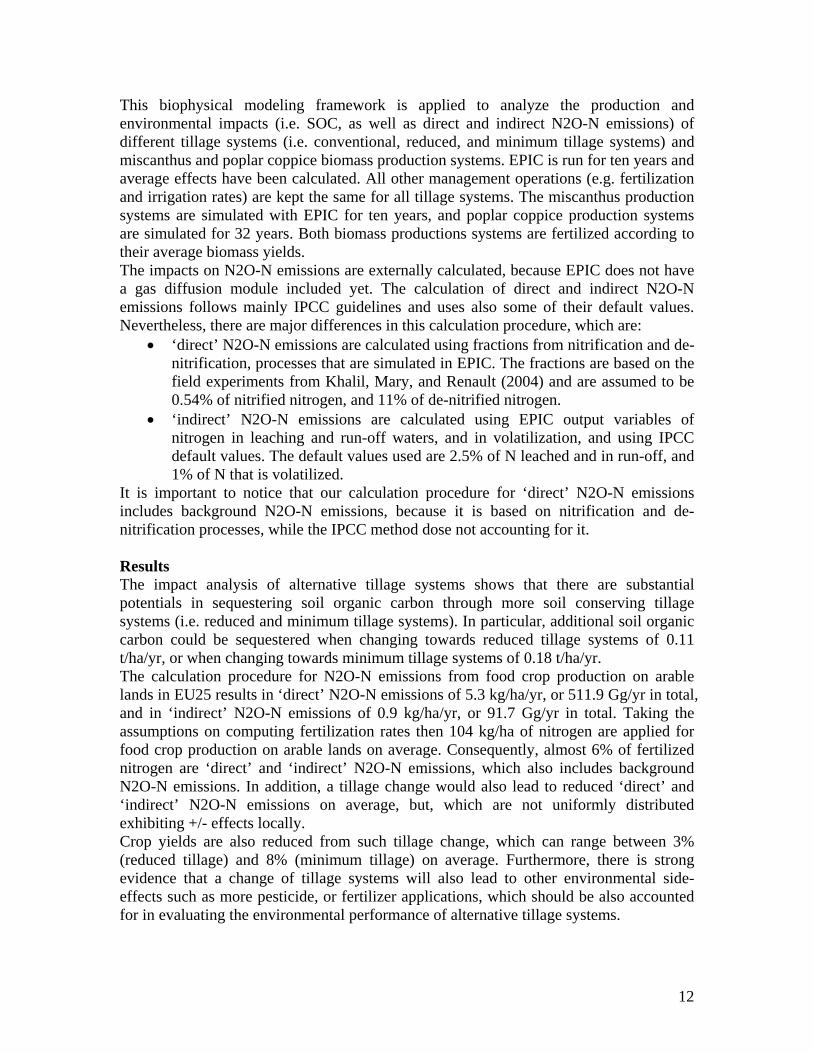
This biophysical modeling framework is applied to analyze the production and environmental impacts (i.e. SOC, as well as direct and indirect N2O-N emissions) of different tillage systems (i.e. conventional, reduced, and minimum tillage systems) and miscanthus and poplar coppice biomass production systems. EPIC is run for ten years and average effects have been calculated. All other management operations (e.g. fertilization and irrigation rates) are kept the same for all tillage systems. The miscanthus production systems are simulated with EPIC for ten years, and poplar coppice production systems are simulated for 32 years. Both biomass productions systems are fertilized according to their average biomass yields. The impacts on N2O-N emissions are externally calculated, because EPIC does not have a gas diffusion module included yet. The calculation of direct and indirect N2O-N emissions follows mainly IPCC guidelines and uses also some of their default values. Nevertheless, there are major differences in this calculation procedure, which are:
• ‘direct’ N2O-N emissions are calculated using fractions from nitrification and de-nitrification, processes that are simulated in EPIC. The fractions are based on the field experiments from Khalil, Mary, and Renault (2004) and are assumed to be 0.54% of nitrified nitrogen, and 11% of de-nitrified nitrogen.
• ‘indirect’ N2O-N emissions are calculated using EPIC output variables of nitrogen in leaching and run-off waters, and in volatilization, and using IPCC default values. The default values used are 2.5% of N leached and in run-off, and 1% of N that is volatilized.
It is important to notice that our calculation procedure for ‘direct’ N2O-N emissions includes background N2O-N emissions, because it is based on nitrification and de-nitrification processes, while the IPCC method dose not accounting for it. Results The impact analysis of alternative tillage systems shows that there are substantial potentials in sequestering soil organic carbon through more soil conserving tillage systems (i.e. reduced and minimum tillage systems). In particular, additional soil organic carbon could be sequestered when changing towards reduced tillage systems of 0.11 t/ha/yr, or when changing towards minimum tillage systems of 0.18 t/ha/yr. The calculation procedure for N2O-N emissions from food crop production on arable lands in EU25 results in ‘direct’ N2O-N emissions of 5.3 kg/ha/yr, or 511.9 Gg/yr in total, and in ‘indirect’ N2O-N emissions of 0.9 kg/ha/yr, or 91.7 Gg/yr in total. Taking the assumptions on computing fertilization rates then 104 kg/ha of nitrogen are applied for food crop production on arable lands on average. Consequently, almost 6% of fertilized nitrogen are ‘direct’ and ‘indirect’ N2O-N emissions, which also includes background N2O-N emissions. In addition, a tillage change would also lead to reduced ‘direct’ and ‘indirect’ N2O-N emissions on average, but, which are not uniformly distributed exhibiting +/- effects locally. Crop yields are also reduced from such tillage change, which can range between 3% (reduced tillage) and 8% (minimum tillage) on average. Furthermore, there is strong evidence that a change of tillage systems will also lead to other environmental side-effects such as more pesticide, or fertilizer applications, which should be also accounted for in evaluating the environmental performance of alternative tillage systems.
12

Figure2:: Changes in topsoil organic carbon (top left), in dry matter crop yields (top right), in ‘direct’ N2O-N
(down left), and in ‘indirect’ N2O-N (down right) emissions on arable lands in EU25 when shifting from conventional to reduced tillage systems
13

Exemplarily, the spatial biophysical impacts when shifting from conventional to reduced tillage systems on (i) topsoil organic carbon, (ii) dry matter crop yields, (iii) ‘direct’ and (iv) ‘indirect N2O-N emissions on arable lands in EU25 are shown in figure 2. In the figure, the impacts on SOC reflect changes over ten years of simulation, whereas the remaining ones reflect average annual changes. The impact analysis of biomass production systems shows that the risk in producing biomass yields (expressed as standard deviations) from miscanthus is higher than for poplar coppice, but in case of biomass yield expectations (expressed as means), it is exactly the opposite. The average estimated dry matter biomass yield for miscanthus is 11.6 t/ha, and that for poplar coppice is 6.7 t/ha. The environmental results indicate that miscanthus productions systems have lower ‘direct’ N2O-N emissions but higher ‘indirect’ N2O-N emission than poplar coppice production systems. In particular, the estimated average ‘direct’ N2O-N emissions are for miscanthus production systems 2.8 kg/ha/yr, or 275.2 Gg/yr in total, and for poplar coppice production systems 3.0 kg/ha/yr, or 293.9 Gg/yr in total. The estimated average ‘indirect’ N2O-N emissions are for miscanthus production systems 0.8 kg/ha/yr, or 77.1 Gg/yr in total, and for poplar coppice production systems 0.4 kg/ha/yr, or 36.1 Gg/yr in total. Based on assumptions, the average annual nitrogen fertilization rates for miscanthus are about 86 kg/ha and for poplar coppice about 23 kg/ha. This implies that on average 4.2% of total N-fertilizer are emitted as N2O-N in miscanthus production systems, and even 14.8% in poplar coppice productions systems. Discussion We have developed a tool that is capable of analyzing biophysical impacts of alternative management practices and biomass production systems at EU25 scale. Such a tool is highly valuable to carry-out comparative dynamic analyses in evaluating alternative natural resource management options with respect to their impacts on production and environment, but also provides a consistent link to economic optimization models, which aim to find the optimal combination of alternative land use and management options. Nevertheless, the validity of the tool needs to be further tested with respect to its data inputs and simulation results. In this respect, Balkovic et al. 2006 have validated initial soil organic contents from the European Soil Map (Map of organic carbon in topsoils in Europe) by using the profile database from Soil Information System of Slovakia (AISOP), which includes soil attributes of 17,741 agricultural soil profiles Slovakia. This analysis shows that the European Soil Map data significantly overestimates carbon resources of arable land in Slovakia. These data generally accords with distribution rules respecting natural differences; however a significant number of highly overestimated pixels bias SOC values, which is problematic when using them as initials for bio-physical process modeling. This lack can be partially eliminated when SOC values are averaged and aggregated to a finite number of homogeneous response units (HRU). In such a case, a relatively good fit between measured values (AISOP) and European Soil Map data can be obtained, indicating that European data sources succeed in describing the general gradient. However, SOC stocks calculated through HRU processing are still overestimated. A combination of preparatory biophysical process simulations and appropriate assumptions (reference of OC values in soil profile) could improve the quality of input data, which are generally available at European scales. They also show that the bio-
14

physical process modeling framework using INSEA data could provide impacts on SOC under alternative tillage systems, which are relatively consistent with impacts being simulated from Slovakian data sources (AISOP). The effects on SOC from a change in conventional tillage systems to reduced or minimum tillage systems are, in relative terms, similar between the Slovakian soil databases and the INSEA database for Slovakia.
15

2.2 EFEM-DNDC & AROPAj: GHG Abatement and Carbon Sequestration Costs in Agriculture: Economic Assessment Using Farm Models Overview The contribution of agriculture to GHG emissions in Europe—although smaller than that of the energy or transport sectors—is significant. Moreover, agriculture is the major emitting sector for methane and nitrous oxide, two gases covered by the Kyoto Protocol. Additional abatements in agriculture may thus contribute to lower the overall costs of reaching a given mitigation target. This sector has thus drawn increasing attention in the mitigation debate in the recent years. This report presents the methodology used to assess the costs of reducing agricultural emissions and/or enhancing carbon sinks in agricultural soils. This assessment relies on farm respective farm-type economic models that describe the optimal supply choices of farmers. Figure 1 shows the linkage with other INSEA model types, as well as the data flow between these models.
Figure 2: Overview of INSEA linkages and data flow
State of the Art Modeling approaches that have been used to assess the costs of reducing agricultural net emissions differ in scale, aggregation level (sector, region, farm), and in the way market feedbacks are integrated and technology is represented. General equilibrium models usually operate at highly aggregated level (agricultural sector, groups of countries). They also rely on a stylized representation of the technology (see for instance Böhringer et al, 2005). Long-run economic impacts are thus captured, but interactions between emission sources are—to a certain extent—overlooked and important sources of abatement cost
16

heterogeneity tend to be under-estimated. Partial equilibrium models (e.g. Saunders and Wreford, 2005) or models that combine market clearing mechanisms and an explicit description of the technology and policy constraints (McCarl and Schneider, 2001; Pérez Domínguez, 2005) are generally more disaggregated (products, countries or regions). However, important sources of heterogeneity remain hidden. By contrast, farm models capture the interactions between the various emission sources that occur at the farm level and offer a description of the diversity of technological and policy constraints faced by farmers. But, as they rely on constant input and output prices (price-taker assumption at the farm level), such models are complement, rather than substitute, to more aggregated economic models. Examples of farm models applied to GHG abatement cost assessments include De Cara and Jayet (2000), Angenendt et al (2004), and De Cara et al (2005).
Two main ways of reducing net agricultural emissions have been explored in the literature: (i) the reduction of GHG emissions and (ii) the enhancement of carbon sinks (either in agricultural soils or above-ground biomass). With a few exceptions (McCarl and Schneider, 2001), these two options have been studied separately. At farm level, interactions between abatement and carbon sequestration strategies may be important. Comprehensive assessments are thus needed.
Given the uncertainty and the variability that characterize the processes governing agricultural emissions, emission accounting is admittedly a challenging task. The IPCC (2001) offers a consistent and relatively simple method to account for agricultural GHG emissions. This method has been used in Pérez Domínguez (2005) and De Cara et al (2005) among others. However, the capability of the IPCC approach to fully reflect the diversity of the underlying emission processes has been questioned (see Freibauer, 2003 and discussion in De Cara et al, 2005). An alternative option is to rely on space- and management-dependant emission factors or carbon sequestration rates obtained from biophysical models, such as EPIC (McCarl and Schneider, 2001). Such biophysical models are able to simulate environmental outputs over a wide range of climatic, soil, and management conditions.
Objectives In this part of the report, the focus is on economic decisions at the farm level, with a particular emphasis on the heterogeneity of abatement costs over space and types of farming. Marginal abatement cost curves help identifying economic abatement potential. Moreover, the heterogeneity of abatement costs is important for the design of economic instruments (see De Cara et al, 2005 for a discussion). The objectives are thus threefold: (i) to assess the range of marginal abatement costs including both GHG agricultural emissions and/or carbon sinks enhancement; (ii) to analyze the heterogeneity of abatement costs over space and types of farming; (iii) to examine the role of alternative management practices with respect to their potential contribution to the overall mitigation effort.
Methods Results are based on two mixed integer and linear-programming models (EFEM and AROPA-GHG). These models both describe the annual supply choices of a number of (groups of) farms that are representative of the farmers' population at the chosen modeling scale. Farmers' economic decisions (crop area allocation, animal numbers, and adoption of alternative management) are assumed to result from gross margin
17

maximization with respect to production constraints. These constraints define the feasible production set at the farm level and reflect technological and policy constraints (availability of fixed input factors, policy constraints, animal feeding and livestock demography). Given the level of disaggregation, farmers are assumed to be price takers. Input and output prices are therefore kept constant. Representative farms are chosen in order to capture the diversity of the conditions of production, products, and types of farming. Results from the modeling of representative farms are then scaled up to the regional level using FADN weights (AROPA-GHG, up-scaling at the FADN region level), or calibrated weights to match regional statistics (EFEM, up-scaling at the NUTS-II level).
Methane and nitrous oxide emissions1 as well as carbon sequestration are endogenously
computed in both models, relying on the IPCC methodology and/or outputs of a biophysical model (EPIC). Marginal abatement cost curves are derived by assigning a monetary value to (net) emissions. GHG emissions thus become a costly input for farmers, whereas carbon sequestration contributes to increase gross margins. The quantity of abatement farmers would be willing to supply is obtained as a function of the value attached to one ton of CO
2eq.
The first part of the report is devoted to the exposition of the results obtained for Baden-Württemberg, Germany. Baden-Württemberg has been chosen as a case study region within INSEA, as this region is covered by both EFEM and AROPA-GHG and therefore provides an interesting common ground for comparison purposes. In this comparison (first paper of this report), the focus is on marginal abatement costs for methane and nitrous oxide emissions only. The second paper examines the impacts of crop management (conventional, minimum, and reduced tillage; winter cover crops) on environmental and economic results for Baden-Württemberg agriculture. A particular emphasis is put on impacts of management on soil organic carbon, yields, and production costs associated with both conventional and alternative tillage practices. Changes in crop yields and environmental outputs were determined through simulations of EPIC, a biophysical model. To adequately account for the natural and farming heterogeneity, these simulations were based on the concept of homogenous response units (HRU), which were defined to account for weather, soil and topographical differences. Combining this information with economic data for Baden-Württemberg from FADN and a cost analysis of each examined management practice, the net impacts on farm income of adoption of alternative tillage practices are computed for each management system and each sample farm. The distribution of these income impacts is discussed.
The second part of the report considers the potential extent of alternative tillage practices under the constraints imposed by natural conditions and farm structure. For the economic assessment of scenarios an updated version of the farm type based EFEM is used. Although EFEM already combines economic and ecological aspects of agriculture refinement and enlarged accuracy are obtained by coupling EFEM with the biophysical model EPIC. A methodological approach to integrate site-specific soil organic carbon
1 Agricultural carbon dioxide emissions from fossil fuel and energy use are also accounted for in EFEM, but not in AROPA-GHG.
18

levels and sequestration rates along with site-specific yield impacts into the economic EFEM is presented. The results of this part refer to Germany.
The third part of the report presents the results for the EU-15. A revised and updated version of AROPA-GHG is used to derive EU15-wide marginal abatement cost curves. The model is also augmented to account for carbon sequestration. This draws on the cost analysis undertaken for Baden-Württemberg and on region- and crop-dependant carbon sequestration rates and changes in yields from 10-year EPIC simulations. The choice of switching away from conventional tillage to minimum or reduced tillage depends on the net impact on gross margin at farm level and on the monetary value attached to one ton of CO
2eq. Adoption of minimum or reduced tillage practices is made endogenous for each
farm type.
Results Comparison of Baden-Württemberg results from EFEM and AROPA-GHG Differences between EFEM and AROPA-GHG include farm-type definition, scale, resolution, regional aggregation procedure, emission accounting, and the way crop management are modeled. When compared on a consistent basis, the two models provide very close estimates of the total GHG baseline emissions (about 5 MtCO2eq), although they show some differences in the repartition between methane and nitrous oxide. For a carbon value of 20 €/tCO2eq, the estimated reduction in emissions is 2.4 % (EFEM) and 5.3 % (AROPA-GHG) of baseline emissions. This difference illustrates the importance of modeling choices in abatement cost estimates since the number of choices varies between both models. At 50 €/tCO2eq, results from the two models are closer to each other and indicate a reduction of slightly below 10 %. The marginal abatement costs curves for Baden-Württemberg are shown in Figure 2 along with other EU-15 estimates.
Alternative tillage practices in Baden-Württemberg The impacts of adoption of alternative tillage practices can be decomposed into change in production costs, crop yields, and environmental indicators (sediment transport, soil organic carbon). Examined alternative management practices are (i) minimum tillage (no-till), (ii) reduced tillage (mulch seeding), and (iii) conventional tillage associated with winter cover crops. When compared to conventional tillage, all alternative management systems reduce sediment transport (highest absolute reduction potentials in high erosion risk areas) and increase soil organic carbon (highest relative sequestration potential in low soil organic carbon soils). For most crops, yields are negatively affected in the short run by alternative management systems. The yield loss is lower in the long run as crops benefit from increasing organic carbon. The net average loss in income is 8.7, 10.2, and 35.3 €/ha/y for reduced tillage, minimum tillage, and conventional tillage with cover crops, respectively. Per-hectare change in net income varies widely between farms and areas. Net losses associated with reduced tillage are the lowest on average. Minimum tillage provides higher environmental benefits with respect to both carbon sequestration and sediment transport and can be even more profitable for some farms. The third alternative system –conventional tillage associated with winter cover crops– appears to be more costly and provides lower environmental benefits.
Alternative tillage practices and carbon sequestration in Germany
19

EPIC simulations of SOC and yields affected by switching from conventional to conservation tillage systems revealed the high sensitivity to natural conditions. On the other hand, examined soil protective tillage systems have never decreased initial soil organic carbon contents, thus suggesting public subsidizing of such technologies. Economic analysis showed that even a slight economic incentive leads towards a relatively large increase in the adoption of alternative tillage. For Germany a payment of 20 €/ha would suffice to compensate farmers for economic losses implied by an obligation to apply conservation tillage to 80 % of arable lands (Figure 2, right). The competitiveness of alternative practices is highly diverse. The estimated distributions for the baseline range from 0 to nearly 75 % in Germany (Figure 2, left).
Figure 3: Shares of Conservation Tillage in Baseline and with an 80 % obligation
Besides natural conditions the differences in the distribution of conservation tillage are due to farm-type specific conditions, herein to mention rotational constraints, above all. Farms with a high percentage of tuber crops and few humus accumulating crops in their rotation would loose over proportionally, because yield decrease for tuber crops is over average.
Analyzing a scenario where farmers had to pay 12 €/t of soil carbon emitted and on the opposite would receive a premium of 12 €/t for sequestered carbon all farmers could increase total gross margin. Nevertheless, the per ton SOC sequestration costs are very diverse. In Baden-Württemberg they range from 106.15 €/t (app. 29 €/t CO2) to gains of 30.50 €/t (app.8.33 €/t CO2). At the same time the highest yearly increase of carbon stocks in Baden-Württemberg is at 1.57 t/ha. For the farm types with the high costs per ton of carbon a yearly decrease of soil carbon of around 0.2 t/ha was simulated.
Abatement and sequestration costs in the EU-15 As for emissions of methane and nitrous oxide emissions, the method described above was extended to the EU-15 using a revised and updated version of AROPA-GHG. Figure 3 shows how the resulting marginal abatement curve for the EU-15 compares with previous estimates in the literature.
20
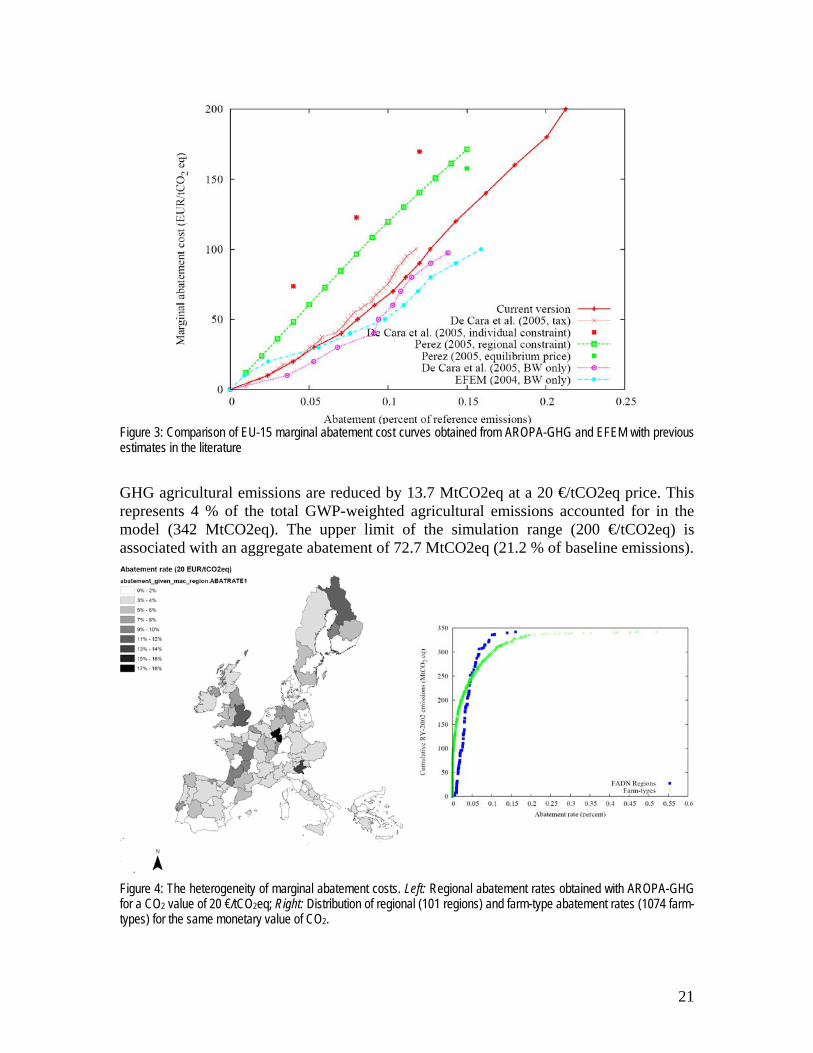
Figure 3: Comparison of EU-15 marginal abatement cost curves obtained from AROPA-GHG and EFEM with previous estimates in the literature
GHG agricultural emissions are reduced by 13.7 MtCO2eq at a 20 €/tCO2eq price. This represents 4 % of the total GWP-weighted agricultural emissions accounted for in the model (342 MtCO2eq). The upper limit of the simulation range (200 €/tCO2eq) is associated with an aggregate abatement of 72.7 MtCO2eq (21.2 % of baseline emissions).
Figure 4: The heterogeneity of marginal abatement costs. Left: Regional abatement rates obtained with AROPA-GHG for a CO2 value of 20 €/tCO2eq; Right: Distribution of regional (101 regions) and farm-type abatement rates (1074 farm-types) for the same monetary value of CO2.
21

The heterogeneity of marginal abatement costs is important both between and within regions. Regional abatement rates range from 0 to 18 % for a CO2 value of 20 €/tCO2eq (see Figure 4, left) and from 2 to 38 % for 200 €/tCO2eq). Figure 4 (right) shows the regional and farm-type distributions of abatement rates for a CO2 value of 20 €/tCO2eq. The distance between the two cumulative curves shows the importance of infra-regional heterogeneity. This heterogeneity has important policy implications. Uniform quantity instruments (e.g. a flat abatement rate target applied to each farmer), even if designed by region, would involve an ineffective distribution of abatements among farmers. Cost-savings permitted by market-based economic instruments are thus potentially high.
Figure 5 (left) shows the aggregate abatement supply and its decomposition by emission sources under conventional tillage (reduction in GHG emissions only). If carbon sequestration resulting from (sustained) adoption of alternative systems is accounted for and rewarded accordingly, it becomes profitable for some farmers to switch away from conventional tillage. When made endogenous at the farm level, adoption of alternative management provides farmers with an additional means of reducing their net emissions through additional carbon sequestration. At 20 €/tCO2eq, the results indicate that an additional 7.8 MtCO2eq abatement is obtained as carbon sequestration, out of which 4.6 and 3.2 MtCO2eq come from reduced and minimum tillage, respectively (see Figure 5, right). At this price, abatements of methane and nitrous oxide are only slightly lower than under only conventional tillage. The aggregate abatement rate thus reaches 6.2 % of baseline agricultural emissions.
Figure 5: EU-15 abatement supply as a function of the CO2 value. Left: Reduction in methane and nitrous oxide emissions only (base tillage management, CO2 value ranging from 0 to 200 €/tCO2eq); Right: Reduction in methane and nitrous oxide and additional carbon sequestration (endogenous adoption of tillage practices, CO2 value ranging from 0 to 100 €/tCO2eq).
22

3 Forest Modeling
3.1 DIMA Model: Geographically explicit global modeling of land-use change, carbon sequestration, and biomass supply The detailed sensitivity assessment of the DIMA Model is presented in Rokityanskyi et al. (2006). The paper includes 100-year runs linked to the IIASA-MESSAGE Model and the obtained modeling results (SRES –Scenario Applications) are taken up by the climate modeling community IPCC-Working Group 1 for contributing to the 4th IPCC Assessment Report. Further, this work is well coordinated with the EMF- Land-Use Group and results have been presented at the EMF Meeting in Washington, 1-3 March 2006.
This contribution to the forest modeling part within the INSEA framework aims to determine whether carbon sequestration policies—such as those that promote afforestation and discourage deforestation (i.e., avoided deforestation)—could present a significant contribution to the global portfolio of climate change mitigation options, as well as their likely spatial effects on land use. The objective is to model the effects of policies designed to induce landowners to change land use and management patterns with a view to sequester carbon or to reduce deforestation.
The approach uses the spatially explicit Dynamic Integrated Model of Forestry and Alternative Land Use (DIMA) to quantify the economic potential of global forests, explicitly modeling the interactions and feedbacks between ecosystems and anthropogenic land-use activities. The model chooses which of the land-use processes (afforestation, reforestation, deforestation, or conservation and management options) would be applied in a specific location, based on land prices, cost of forest production and harvesting, site productivity, population density, and estimates of economic growth.
The approach is relevant in that it (1) couples a revised and updated version of the Special Report on Emissions Scenarios with the dynamic development of climate policy implications (including carbon and bioenergy prices) through integration with the Model for Energy Supply Strategy Alternatives and their General Environmental Impact (MESSAGE); (2) is spatially explicit on a 0.5 degree grid; and (3) is constrained by guaranteeing food security and land for urban development. As outputs, DIMA produces 100-year forecasts of land-use change, carbon sequestration, impacts of carbon incentives (i.e., avoided deforestation), biomass for bioenergy, and climate policy impacts.
The modeling results indicate that carbon sequestration policies—such as those that promote afforestation and discourage deforestation—could contribute to a significant part of the global portfolio of efficient climate mitigation policies (see Figure 1 and 2), dependent upon carbon prices. Results from DIMA show that in one of the scenarios considered (A2r) the share of globally avoided deforestation grows exponentially with the carbon price, from 5% to 75% of the predicted deforestation.
23

Figure 1. Carbon implications (MtC/grid) from avoided deforestation using a dynamic carbon price projected by MESSAGE in 2090–2100 in A2r.
Figure 2. Cumulative biomass production (EJ/grid) for bioenergy between 2000 and 2100 at the energy price supplied by MESSAGE based on the revised IPCC SRES A2r scenario.
24

3.2 PICUS Model, OSKAR Model: Estimating potential forest production, biomass and carbon storage for EU countries 2005 - 2150 Aims and purpose The forestry model OSKAR (Franklin et al. 2006) was developed to provide the necessary forestry data input for the economic land use optimization model FASOM. To enable FASOM to select optimal forestry alternatives, the OSKAR model predicts potential development of forest biomass, carbon storage, forestry production and forestry costs in response to management alternatives, such as thinning schemes, choice of species and method of regeneration. The OSKAR model is also used stand-alone to simulate “biological” forest carbon and production potentials in EU, independent of FASOM. Model Structure A forest stand model (see below) is used to create growth predictions of the individual forest cohorts given by the initial inventory data (EFI database, Schelhaas 1999) for all EU countries. Each cohort of existing forest is specified by region, species and initial age and is followed from 2005 to 2150. In addition, a number of alternative management scenarios are evaluated for each of the cohorts (Fig. 1). To handle regeneration and allocation of new forest land, growth predictions for potential new forests of all species and management scenario combinations are created. In summary, growth scenarios are produced to cover all possible alternatives of forestry management (thinning schemes, choice of species) for each region. Dead wood accumulation and decomposition are tracked for each scenario. The forest growth is controlled by different factors operating at different levels. A general productivity (NPPpotential , derived from inventory data and a climate driven NPP model) operates on a regional scale. The growth response to NPPpotential is then dependent on species specific growth parameters. At the bottom level, the growth of the individual cohorts is dependent on current biomass and density (number of trees per area). Density changes through thinning and time of harvest are the major management controls.
25

Output data:year biomass dead wood harvests costs2000 x x x x2001
...2100
age cohort0-10 y10-20y...>150y
scenario12...
speciessprucebeech...
Region
NPPpotential (climate)species growth response
management effects
biomass/density effects
Output data:year biomass dead wood harvests costs2000 x x x x2001
...2100
age cohort0-10 y10-20y...>150y
scenario12...
speciessprucebeech...
Region
NPPpotential (climate)species growth response
management effects
biomass/density effects
pre set thinning scenarios density effects calibrated with literature data
pre-estimated from yield table data
Simulation step 1Absolute values estimated from inventory dataClimate change effect from LPJ simulation
Simulation step 2simulate all forest cohorts for all scenariosbased on NPPpotential and pre-estimated species parameters
Output data:year biomass dead wood harvests costs2000 x x x x2001
...2100
age cohort0-10 y10-20y...>150y
scenario12...
speciessprucebeech...
Region
NPPpotential (climate)species growth response
management effects
biomass/density effects
Output data:year biomass dead wood harvests costs2000 x x x x2001
...2100
age cohort0-10 y10-20y...>150y
scenario12...
speciessprucebeech...
Region
NPPpotential (climate)species growth response
management effects
biomass/density effects
pre set thinning scenarios density effects calibrated with literature data
pre-estimated from yield table data
Simulation step 1Absolute values estimated from inventory dataClimate change effect from LPJ simulation
Simulation step 2simulate all forest cohorts for all scenariosbased on NPPpotential and pre-estimated species parameters
Fig. 1. Structure of forestry model, levels of organization (region, species, scenario, cohort, year), the entry of controlling factors and how they are handled by the model Forest stand model Basic growth and self thinning The modeling of stand growth is based on a semi-empirical logistic differential equation for stem growth per hectare for un-thinned stands (Franklin et al. 2006a):
(1) , where B is stem biomass, C(x) is a scaling function, p is a site productivity (potential NPP) parameter and all other parameters are dependent only on species. The species parameters were estimated for all important European species using yield tables (JRC 2005) and for some mixtures of species. p integrates effects of climate and site productivity and controls both the initial increment and the maximum potential biomass of the stand. Initial values of p are estimated for each region and species from inventory data, while the temporal changes due to climate change are estimated by the LPJ model (Sitch et al. 2003) using the b1 IPCC climate change scenario (IPCC 2001). For the initiation of a stand through planting, species specific seedling mass and number of plants per hectare are used. For natural regeneration a time lag (due to plant size difference) is added. To estimate branches, leaves and roots, allometric functions (Marklund 1988) are used.
26

Self thinning To model the number of trees and the effects of the changes in stand density during the development of a stand, a self-thinning equation is used (Franklin et al. 2006b). For stands growing at maximum density (fully closed stands) b k Na
⋅ (2) ,where N is number of trees and b is the biomass of the average tree. The number of trees is decreasing as the average tree and the total stand biomass is increasing. a is assumed to be -3/2 for all species (Yoda et al. 1963). It can be shown that this leads to production of dead trees proportional to the increment of live biomass, where the proportionality constant depends on the relative size of the trees that dies compared to those surviving. Using the PICUS model (Seidl et al. 2005) this constant was estimated to between 0.5 and 0.25. The factor k was estimated using yield tables and was found to vary between species and increase with productivity. Dead wood – soil carbon The modeling of dead material only includes wood because the effect of forestry management on leaf and fine root litter are assumed to be small, and in case of land use changes, too uncertain. Furthermore, while stem wood is removed at thinning and harvest, fine litter is usually left on the site. The decomposition of dead wood is modeled by a turnover rate, which is a function of potential NPP and changes with time due to the effect of climate change. The relation between potential NPP and decomposition rate was derived from a global NPP model and a global decomposition model (Osnabrueck model, Esser 1991). Different decomposition rates are used for coniferuous and deciduous species (Franklin et al. 2006a). Thinning management Thinning causes reduction of density and reduction in resource use and competition, which have two effects. First, the total stand production (not increment) is reduced although the individual growth for remaining trees is increased. Second, the self-thinning mortality is reduced (Fig. 2). Thus, the total effect of a thinning operation on increment depends on the relative strength of these two effects. For a moderate thinning, the avoided self-thinning usually more than compensates for the reduction in total stand production so that increment is enhanced. In this case, the relative density of the thinned stand increases with time and may eventually approach a fully closed stand (a stand at maximum density). The thinning effect model allows thinning of trees with a larger or smaller size than the average tree. Selection of smaller trees will
27
relative density
self-
thin
ning
relative density
self-
thin
ning
stan
d gr
owth
relative density
stan
d gr
owth
relative density
Fig 2. Effects of thinning (reduction of relative density)

amplify the effect of increased individual tree size and diameter in thinned compared to un-thinned stands (Franklin et al. 2006b). Harvesting Because the FASOM model determines the time of harvest based on costs and value of products, the OSKAR simulations for FASOM do not include harvesting. However, for the stand-alone OSKAR simulations, harvesting was based on the principle of maximum biomass production. This means that the stands are harvested and replanted at the age which would maximize stem wood production over time. Shorter and longer rotation periods were also evaluated by proportional decrease or increase of the harvesting age (Franklin et al. 2006a). Management costs For thinning, harvest and planting operations, capital and material cost are calculated as well as the fuel consumption and the amount of labor time. These properties are based on the productivity and price of the forwarding and harvesting machines, which is a function of the volume of the harvested trees. The productivity is generally higher for larger than for smaller trees. Thinnings have slightly higher costs per harvested volume than final harvests because of lower productivity. The costs of planting mainly depend on the number of trees planted (1000-5000 per hectare), the seedling price and required protection for the young stands (Franklin et al. 2006a). Model Evaluation The model approach is inter alia evaluated by means of simulations with a hybrid forest patch model at plot level. The main objectives of the comparison experiment are (i) to assess the ability of the OSKAR model to simulate forests over an extended ecological gradient and (ii) to evaluate simulated productivity and response to different management regimes against the results of the plot level model PICUS v1.42 (Seidl et al. 2005, Seidl et al. 2006). The evaluation experiment was carried out on inventory plots of the Austrian Forest Inventory (AFI) (cf. Schadauer et al. 2006) over multiple ecological gradients, ranging from the pannonic, warm and dry eastern parts of Austria to the lower subalpine vegetation belt of the eastern Alps. Four main European tree species (Norway spruce (Picea abies L. Karst), Scots pine (Pinus sylvestris L.), beech (Fagus sylvatica L.) and Pedunculate oak (Quercus robur L.)) are studied on 40 inventory plots over a 100 year simulation period, starting from generic young stands. On every plot three management strategies are simulated: light, frequent thinning from below (MS1), selective thinning from above (MS2) and a do nothing variant used for the calibration of OSKAR input NPP. Results show that, with regard to simulated productivity, the models differ already in the calibration series, mainly due to diverging assumptions on potential NPP in OSKAR and the calibration set simulated with PICUS (PICUS:OSKAR over all simulated plots and species: adj. R²=0.783). However, the correspondence of the models only decreases slightly in the managed strategies (MS1: adj. R²=0.779; MS2: adj. R²=0.738). Furthermore, both the mean thinned volume over all simulations and the standing stock at the end of the simulation period simulated with OSKAR agree well to PICUS results
28

(maximum difference: -11.6% for thinned volume under strategy MS2). However, major differences are revealed with regard to structural aspects of the simulated management interventions and stands between the models. Average stem numbers per hectare at the end of the simulation period were lower in OSKAR compared to PICUS (up to –49.6% under management strategy MS1). In conclusion, the evaluation of the OSKAR model by means of a comparison with a detailed stand level model revealed satisfactory results with regard to simulated productivity and management response of OSKAR, but points to limitations of the approach in simulating stand structures. Furthermore, the crucial importance of the external NPP input used in OSKAR is emphasized by the evaluation study. Simulations The EFI forest inventory database (Schelhaas et al. 1999) contains data on volume and increment for all species and age classes per region (1-20 regions per country). The inventory is used to initiate the forest simulations and to estimate the initial productivity and density (and thinning regime) for all stands, defined by region, species and age cohort. The change in productivity due to climate change over time is modeled for each region by the LPJ model. The dead wood was initiated for each stand by running the model for two rotations with the estimated thinning regime, initial productivity and harvest age to maximize stem wood production. The development for all stands was simulated for three different thinning levels, 1) no thinning, 2) estimated current thinning and 3) >25% thinning, which means that for all stand where estimated thinning was less than 25%, 25% volume removal at each thinning was applied. The first thinning occurs just before the stand reaches maximum growth rate and each following thinning occurs when the stand density is recovered to 90% of maximum density. The size of the thinned trees was 80% of the average tree size. In addition to the existing forests, to cover all possible alternatives for the FASOM model, new stands starting each 5 year period were simulated for all species regarded as suitable for every region. For the stand-alone OSKAR simulations, in addition to the thinning scenarios, three harvesting scenarios were applied: 1) maximum sustainable yield, 2) 20% earlier harvest 3) 20% later harvest. Furthermore, in combination with all a harvest and rotation scenarios an old forest protection scenario was evaluated. In this scenario all stands that were more than 50% older than the optimal harvest age (7% of total forest area in EU) were considered old and protected from all management (Franklin et al. 2006a). Results and discussion The simulation results for input into FASOM and the selected optimal forestry management are discussed elsewhere. Stand-alone simulations results for EU countries in general shows lower total volumes than estimated by FAO (2006), which could be a result of different allometric expansion factors or that some unmanaged forests were not included in the EFI dataset. The harvest estimations are mostly higher or similar to the
29

FAO numbers and indicate that for some countries (France, Poland, Sweden) there is a potential to increase harvest within the next hundred years (Fig. 3) (Franklin et al. 2006a).
5
10
15
20
25
30
Austria
Czech R
epublic
Denm
ark
Estonia
Finland
France
Germ
any
Hungary
Ireland
Italy
Latvia
Lithuania
Luxembourg
Netherlands
Poland
Portugal
Slovak Republic
Slovenia
Sweden
United Kingdom
2005
FAO 2005
2005-2100
2005-2100protect oldforest
MtC
Fig 3. Predicted harvests 2005, FAO 2005 numbers, predicted sustainable harvests on average for the period 2005-2100, and predicted harvest when old forests (> 50% older than optimal harvest age = 7% of total forest area) are protected. Looking at the effect of different management scenarios it is clear that carbon storage will be increased by increasing the harvest age and by protecting old forests. However, increasing harvest age also leads to substantial reduction in harvests for the next 50 years. Protection of old forest only initially reduces harvest while the effect on harvests is small over a longer time period (Fig 4), indicating that this is a promising option for increasing carbon storage. This scenario is also likely to provide benefits for biodiversity.
0
1000
2000
3000
4000
5000
6000
7000
8000
2000 2020 2040 2060 2080 2100 2120 2140
0
50
100
150
200
250
300
2000 2020 2040 2060 2080 2100 2120 2140
Biomass
MtC
harvest allharvest stemprotect old forest
Dead wood
A B year
Fig 4. Carbon (Mt) in EU forests in A) Biomass and dead wood and B) harvests. Biomass carbon is increased while harvest are only initially decreased for the old forest protection scenario (dashed line) compared to the “normal” harvest stem everywhere scenario (dark solid line).
year
30

3.3 Biomass conversion technology Introduction and Objectives The methanol production by gasification is an attractive technology. Methanol mixed with 15% gasoline appears to be an alternative to fossil fuels for the transport sector. Produced from the gasification of wood, its production is considered as sustainable. The bioenergy chain -harvesting, biomass transportation, methanol production by gasification, methanol transportation and methanol distribution to the costumer- is described and for each part of the chain costs are estimated. One geographical application is studied in the county of Baden-Württemberg in Germany. This study is based on the works from Sørensen, 20050, and Hamelinck et al, 20010. Method The calculations are performed for two power plants of 200 MWbiomass each situated at 48.15˚N, 9.5˚E, and 49˚N, 9˚E. The first one (plant A) is situated closer to high production of biomass and the second one (plant B) is located closer to a high demand area. Based on cost minimization, one will determine the biomass needed to provide the power plant in poplar and the cities that will be supplied in methanol. The different parameters and their values are presented in Table 1. Moreover in order to study the influence of different parameters on the final methanol price, a sensitivity analysis based on a 26-1V factorial design is studied. The different parameters and their extreme values are presented in Table 2. Results The results on the 2 power plants are presented in
Table 3, and Figure 4. These power plants are able to supply 147 gas stations per year, which corresponds to the cities situated in a radius of 67 km (1.3 million inhabitants) from the power plant, using trees within a circle of 50 km of radius (
Figure 5). From the sensitivity analysis, four parameters have great influence. The plant efficiency has the strongest influence on the methanol price; differences in the technology can increase the methanol price by a factor 2. The wood cost is the second most influencing parameter; variation of the wood cost from 15 to 60 €/m3 can influence the final price by
31

70 %. And the load hours of the plant and the road to direct distance ratio are two other parameters that have some significant influence on the methanol price. A difference of the load hours from 6,500 to 8,000 hours varies the final price by 20 %, and difference of the road factor from 1 (flat landscape) to 3 (mountainous landscape) can increase the transport cost by 40 % and rise the methanol price by 3 %. Finally, from Figure 6, the amount of the different costs in the total methanol price is presented regarding the size of the power plant. One can notice that to get a competitive price, from a reasonable size of a power plant, a 200 MWbiomass power plant can be considered, and would give a price below 30 €/GJmethanol, or 1.0 €/Lgasoline equivalent. The methanol price is then mainly decided from the characteristics of the power plant (efficiency and load hours), the wood cost, and its geographic situation regarding biomass supply and fuel distribution. Focus should then be stressed on an efficient technology and a strategic geographical set up of the power plant, in order to obtain a low and competitive methanol price. In this study, heat and electricity production was not taken into consideration; these productions should have a significant influence on the methanol price and on the location of the power plant that would be closer to the heat demand. Tables Table 1: Reference parameters.
Description Unit Value Wood cost €/m3 30 Agriculture ratio % 20 Forestry ratio % 5 Road to direct distance ratio 1.5 Plant efficiency % 40 Load hours h 7,500 Technical lifetime years 25 Table 2: Variables studied with attached extreme values.
Description Unit -1 Ref. +1 Wood cost €/m3 15 30 60 Agriculture ratio % 50 20 10 Plant position ˚E
˚N 9.5 48.15 - 9
49 Road coefficient 1 1.5 3 Plant efficiency % 57 40 25
32

Load hours Hours 8,000 7,500 6,500
Table 3: Characteristics and costs for the 200 MWbiomass power plants.
Results Units Plant A Plant B Longitude ˚E 9.5 9 Latitude ˚N 48.15 49 Wood input t/hour 40 40 Methanol sold m3/day 438 438 Agriculture area ha 28,700 35,080 Biomass Transports €/GJmethnol 2.35 2.43 Fuel Transports €/GJmethnol 0.34 0.24 Production costs €/GJmethnol 14.46 14.46 Gas station costs €/GJmethnol 0.24 0.24 Fuel Cost €/GJmethnol 26.70 26.69 Figures
33

Figure 4: Example with two biofuel plants of 200 MWbiomass in the area of Baden Württemberg.
0
20
40
60
80
100
0.E+00 4.E+04 8.E+04 1.E+05 2.E+05Estimated effect
Nor
mal
pro
babi
lity
E : Plant efficiencyA : Wood costF : Load hoursD : Distance ratio
EAAE FD
Figure 5: Normal probability plot of effects
34

Figure 6: Cost of methanol (in €/GJ) by the size of the biofuel plant (in MWbiomass).
35
4 Economic Modeling
4.1 FASOM: The European Forest and Agricultural Sector Optimization Model Objectives The agricultural and forestry sectors relate to several acute environmental problems including climate change, fresh water scarcity and pollution, air pollution, and the decline in biodiversity. On one hand, these sectors contribute to the deterioration of environmental qualities through use of agrochemicals, irrigation, erosion promoting cultivation techniques, and diversification of natural ecosystems. On the other hand, agriculture and forestry have the potential to mitigate several negative environmental impacts. Carbon sink, wildlife habitat creation, and soil preservation are examples. However, while technological potentials of land use based mitigation strategies have been frequently estimated, only few studies examine economic potentials (De Cara and Jayet, McCarl and Schneider, Schneider, McCarl, and Schmid). Some of these studies are limited in economic scope.
The overall technical objective of the European Forest and Agricultural Sector Optimization Model (EUFASOM) development was to create a state of the art tool, which can simulate the most likely development of the European agriculture and forest sectors under different political, technological, and or environmental scenarios. The scientific and political purpose of this tool is to answer important societal question related to sustainability, global change, and environmental policies. Particularly, EUFASOM can address many research and political questions related to:
• the impact of environmental and or other farm and forest policies on land use
change, environmental abatement potentials, food and fiber prices, rural employment, and sector income
• the competition between environmental services and traditional food, fiber, and timber production, and
• tradeoffs and complementarities between different environmental objectives
Methods EUFASOM is a mathematical programming model coded in GAMS software. Solving this constrained optimization model means to find the most likely land use decisions and product trade activities across regions, time periods, and farm and forest structures. These decisions are driven by economic and policy incentives and are constrained by resource and technological limitations. EUFASOM portrays explicitly all major EU countries and multiple international regions, different land qualities related to texture, altitude, slope, and other soil parameters, more than 40 tree and crop species, more than 10 livestock categories, several management options related to alternative tillage, irrigation, tree thinning, fertilization, and livestock regimes, and up to about 10 alternative farm and forest owner classes. Important agricultural and forest resources are explicitly accounted.
36

These resources include land and land qualities, standing forests, labor, energy, and water. Furthermore, EUFASOM depicts more than 50 primary and processed commodities. Production, trade, and prices are endogenously computed.
EUFASOM marks a state-of-the-art model because
• the employed methods have been peer reviewed in respected scientific journals (see listed references on Schneider and McCarl)
• millions of endogenous variables and hundred thousands of equations are efficiently compressed into relatively few indexed equation and variable blocks. This makes model development faster, reduces chances of overlooked structural errors, and increases transparency of the model for external reviewers,
• all individual variables and equations have been subjected to and have passed more than 30 generic checks,
• the scope and size of the model can easily be changed, allowing a) fast model development and b) tailoring of the model to specific research question, and
• it uses highly automated interfaces between economic data sources (FADN, FAO, EUROSTAT), biophysical simulation (EPIC), and other models (OSKAR, AROPAJ, DIMA, GAINS). Thus, new data can be quickly integrated in EUFASOM and passed on to other models.
EUFASOM can be solved with model specifications containing more than 6 million variables, 600 thousand equations, and close to 40 million data coefficients. Despite a large number of individual equations and variables, EUFASOM has a relatively simple structure, which incorporates the following fundamental truths:
• Resources for agriculture and forestry are very heterogeneous (climate, land
quality) and may be physically limited (land, water, labor), • Land use can shift between agriculture and forestry, • If total resource use in a region increases, the marginal value of this resource
increases as well, • Land use technologies (agricultural and forest management options) are
heterogeneous in resource requirements, cost, and product yields, • Products face a downward sloping demand function, increased supply causes
prices to decrease, • Commodities can be traded, and • Tomorrow’s resources (standing forests, soil quality) depend on the today’s
state and management of these resources. In addition, the following general assumptions are made:
• Private farm or forest managers behave rational, i.e. maximize net present values
from land use, • Farm and forest managers don’t have market power,
37

• Farmers and foresters know the economic performance (resource use, costs, and yields) and environmental impacts (greenhouse gas emissions, erosion, nutrient leaching, and biodiversity values) of all included land use options.
Results The large size of the model yields a large amount of output. Below are preliminary selected EUFASOM results from assumed carbon policy scenarios and their intermediate impact on the agricultural and forest sectors. These results illustrate that carbon sinks are competitive with each other and competitive with traditional production and that economic potentials are substantially smaller than technical potentials. Strategy competition
llustrated ase
icultural
rices
The left figure shows the mitigation contribution of different greenhouse gas mitigation strategies under different incentive levels. Lower incentive levels promote tillage based soil carbon sinks. At higher levels carbon sinks from growing trees dominate. As more and more land is afforested, tillage based soil carbon sinks diminish for two reasons: a) less land remains in agriculture and b) increasing commodity market prices increase the
opportunity cost of reduced tillage options. Traditional production
Afforestation and associated land shifts from agriculture to forestry affect forestry and agricultural markets. This is iin the figure to the left. As forests incre(prices above 80 Euro/TgCE), agrproduction and net exports decrease whileprices for crop and livestock products increase. Increasing commodity pincrease the opportunity cost of agricultural and forest based greenhouse gas mitigation and thus make further
abatement more expensive.
0
100
200
300
400
500
0 50 100 150 200 250 300 350
Car
bon
equi
vale
nt p
rice
(EU
R/M
gCE)
Emission abatement (TgCE)
Reduced TillageAfforestationNon-Carbon
0
50
100
150
200
250
300
0 100 200 300 400 500
Fish
er In
dex
Carbon equivalent price (EUR/MgCE)
Crop ProductionCrop Prices
Crop Net ExportsLivestock Production
Livestock Prices
Economic vs. Technical Potential For reduced tillage based below ground carbon sequestration and afforestation based above ground carbon sequestration different measures of potential are computed. The
38

lines labeled competitive potential correspond to the figure in section 3.1. The left graph below shows the technical, economic (single strategy based), and competitive potential of carbon emission mitigation from reduced tillage. The technical potential is obtained by maximizing soil carbon sequestration regardless of costs. The single strategy economic potential shows the cost efficient abatement assuming that afforestation is not eligible for carbon credits. Clearly, the economic potential falls considerable short of the technical potential. Potentials of above ground carbon sequestration i.e. through increasing the forest base are illustrated in the right figure below. Again, the technical potential is substantially above the economic potential. Differences between the single strategy and competitive economic potential are relatively small. However, introduction of biofuels as additional mitigation option could increase the differences.
0
100
200
300
400
500
0 20 40 60 80 100 120 140 160
Car
bon
equi
vale
nt p
rice
(EU
R/M
gCE)
Emission abatement (TgCE)
Technical PotentialEconomic Potential
Competitive Potential
0
100
200
300
400
500
0 50 100 150 200 250 300 350 400 450
Car
bon
equi
vale
nt p
rice
(EU
R/M
gCE)
Emission abatement (TgCE)
Technical PotentialEconomic Potential
Competitive Potential
Discussion Land is scarce. Many emerging land based opportunities such as carbon sinks may require a reduction of other land uses. Prices for food and other traditional agricultural and forest products are likely to increase. To estimate competitive economic carbon sink potentials, EUFASOM has been developed within INSEA. This state-of-the-art model represents an integrated tool for the simulation of complex policy impacts in the agricultural and forestry sectors. As such EUFASOM will be useful for policy design and negotiations, i.e. on international post Kyoto climate policies.
Further EUFASOM actions include a) addition of bioenergy chains within the European Non-food Agriculture (ENFA) project, b) integration of detailed agricultural data from the EU new member states, c) integrated policy scenarios analysis within the whole network of INSEA tools, and d) communication of analysis results.
39

5 Policy Implications
5.1 The INSEA (Deliverables) results in the context of KP, IPCC, CDM, JI, and linking LULUCF credits, AFOLU – post 2012, and REDD INSEA and related activities in the policy making process The complexities inherent in land use, land-use change and forestry (LULUCF) contributions to the goals of the UNFCCC and Kyoto Protocol have led to contentious and prolonged debates about the merits of their inclusion in the first commitment period. Yet the inclusion of these activities played a key role in agreement on the general framework, and will likely continue to have a substantial part in negotiations on future commitments. The interrelation of LULUCF activities with biological processes distinguishes this sector from the other reporting sectors in several important areas, which has implications for policy approaches. The Marrakech Accords dictate which of these activities are addressed and how they are accounted in the first commitment period. The first section of the final INSEA policy report provides background and information on several of the most important aspects of LULUCF Kyoto Protocol (KP) implementation. It includes a detailed explanation of the “rulebook” for LULUCF and an analysis of how LULUCF activities could be implemented nationally. The first paper,”The Role of LULUCF activities in international and national climate policies” explains the current international “rulebook” on LULUCF as laid down in the Kyoto Protocol and the Marrakech Accords, and whether and how LULUCF activities are being or are likely to be implemented nationally (Schlamadinger 2005). It includes information on the IPCC Reporting Guidelines, the EU ETS, and information on how crediting for CDM AR projects is likely to affect their incorporation in the future. Also included in this section is a thesis developed under INSEA, which is a documentation of current incentives in support of agriculture and forestry activities to reduce CO2, both in and outside of the KP (Urstöger). Additionally this section includes the results of a workshop held to assist countries in making the important and imminent decision on which specific activities and definitions to elect under the KP for the LULUCF sector. Parties to the Protocol must make important policy decisions about specific activities and definitions within the LULUCF sector. These decisions will take into account scientific understanding, requirements within the KP, environmental integrity, practical applicability and cost effectiveness. The workshop was targeted at policy and decision makers on Kyoto Protocol issues related to LULUCF in Annex I countries, and staff of national agencies working on GHG reporting under the UNFCCC and the Kyoto Protocol (Land Use Related Choices under the Kyoto Protocol). A thesis which focuses on an analysis of one of these options for Article 3.4 activities for Austria, titled “Revegetation – an option in Austria to mitigate climate change?”, is also included (Schönhart, 2006). The overall aim of this study is to provide information for
40

decision-makers whether or not to elect Revegetation (RV) as one of many other activities to meet the GHG reduction commitments of the KP in Austria. Together these publications and summaries form an excellent resource for the most important upcoming issues for Annex I countries in the 1st Commitment Period of the KP. JR also made significant contributions to IPCC publications related to forests and climate mitigation. Contributions to a paper published in Global Change Biology entitled “Energy crops: current status and future prospects”(Sims et al) also fed into a contribution to the IPCC Fourth Assessment Report (FAR) chapter on “Energy supply mitigation options”. Bernhard Schlamadinger was an author in charge of biomass and bioenergy in the energy supply chapter of Working Group III, which is now undergoing government review, and will be published in 2007. Schlamadinger also made contributions to the FAR chapter on “Forestry sector mitigation options”. Additionally JR contributed to the IPCC 2006 Guidelines for National Greenhouse Gas Inventories, as Bernhard Schlamadinger was selected as a Review Editor. The KP “flexible mechanisms”, Joint Implementation (JI) and Clean Development Mechanism (CDM) provide additional opportunities for mitigation in the LULUCF sector. A presentation was given to the JI Executive Board on the potential for LULUCF projects under Joint Implementation. This presentation is provided in the annex. 2 publications from the CDM Investment Newsletter are also included. The first, “Policy brief: Inclusion of temporary credits from CDM forestry projects into the EU ETS”, looks at the significant political, environmental, and economic benefits the inclusion of credits from LULUCF projects can bring (Streck et al. 2005). The second paper, “How can carbon credits from CDM afforestation and reforestation projects be used by Annex I governments and companies?” proposes several options to internalize the risk of premature release of carbon stocks and thus of project failure before the end of an A/R CDM project’s crediting period (Schlamadinger et al. 2004). Also included is a publication from Climate Policy entitled “Can EU Emissions Trading Scheme support CDM forestry?”. This paper discusses the current situation, in which the European Commission is mandated to consider the inclusion of credits from land-use projects under the clean development mechanism (CDM) and joint implementation (JI), beginning with the second period of the European Union’s emission trading scheme (ETS) in its report due in July 2006. Temporary credits from afforestation and reforestation under the CDM are seen by many as posing a technical problem for their use under the ETS. This article summarizes three feasible, efficient and environmentally sound alternatives for achieving the integration of such temporary credits in the European emissions trading market starting in 2008. While activities in the LULUCF sector are somewhat constrained in the first commitment period, future commitment periods offer the chance to increase the effectiveness of mitigation through this sector. In May 2005 JR hosted a workshop on “Options and Recommendations for AFOLU post-2012. This workshop was designed to bring together experts on issues surrounding LULUCF and to allow them to discuss and formulate options for inclusion of LULUCF in an international climate change agreement beyond 2012. The focus of the workshop was on the objectives of LULUCF activities, options how LULUCF could be included in an international climate framework in order to move towards achieving these objectives, and an evaluation of the options.
41

Each of the working groups in the workshop produced a report summarizing the consensus achieved in the discussions, and where possible narrowing down the options, evaluating the options, and making progress at a technical level. These reports will serve as a background for negotiations on LULUCF (among other topics) to commence in the near future. Several papers were developed by participants as a result of the workshop, and these papers, included in the annex, will be published in a forthcoming special issue of Environmental Science and Policy in 2006. Several of these papers will also be summarized for the August 2006 SBSTA workshop on “Reducing Emissions from Deforestation in Developing Countries”. The topic of Reducing Emissions from Deforestation in Developing Countries (REDD) has gained increasing attention from the Parties to the UNFCCC. Joanneum Research hosted a workshop on this topic just before SBSTA 24 took up this issue in May 2006. The objective of the workshop was to provide a timely forum for an informal discussion and assessment of methodological and policy approaches for reducing emissions from deforestation. Participants discussed the 31 March submissions by Parties, IGOs and NGOs, and brainstormed on possible future pathways regarding possible positive incentives at international and national levels, as well as how methodological issues could be resolved. Workshop results were presented in a side event at SBSTA 24, and summaries of the workshop were published in Joint Implementation Quarterly and also in Ecosystem Marketplace, and are included in the annex. Additionally, Bernhard Schlamadinger was chosen as the representative of Research NGO’s to attend the August 2006 SBSTA workshop on this topic. INSEA Deliverables policy summaries Baselines for LULUCF Activities under the Kyoto Protocol and for Policymaking at National Levels; contributing to D8 Baseline Report The purpose of this paper is to explain the baselines against which carbon stock changes (and non-CO2 emissions) are accounted for under the Kyoto Protocol/Marrakech Accords, and whether and how this can be/is different in national implementation policies. The paper details how Articles 3.3 and 3.4 may be implemented by Annex I countries and describes baseline and accounting possibilities under the guidelines for reporting. It also discusses choices for EU countries under Article 3.4 and how these may impact emissions reduction efforts.
Deliverable D9 Report on First Supply Functions, 4.2 Annex II: A two-model comparison of GHG emissions and abatement costs in Baden-Württemberg This paper describes the comparison of two models which address emissions and costs of emissions abatement in agriculture. Two major conclusions can be drawn from the comparison of the two selected models, AROPA-GHG and EFEM. First, despite differences in the assumptions and levels of detail in the modeling approaches, estimates of baseline emissions and abatement costs are rather close. Second, this comparison also highlights the importance of methane emissions in marginal abatement costs. The diversity of emission sources in agriculture gives a large range of potential abatement strategies which could be reached by economic regulation and adapted policy
42
tools. The reactions of model farms to an emission tax are a reduction in the production intensity and a shift in the grown crops. Deliverable D9, 4.3 Annex III: Comparison of the Stand Level Model PICUS and the Grid Based Forest Model TsuBiMo This study describes the work done so far on the two lower levels in the forestry part of INSEA, mainly focusing on sink enhancement. Models show that productivity increases going south from northernmost plots at the polar circle and are highest in the temperate zone for all three tree species analyzed. On the opposite side of the simulated productivity spectrum, two plots in both climate records show all species suffering dieback. Reviewing location and site conditions shows that the affected plots are the southernmost in the array investigated and feature Mediterranean climate regime. Hence, the simulated response of the three tree species which are not adapted to such extreme ecological conditions can be considered realistic. The in general more favorable conditions under the second of the selected climate regimes, climate B simulation, are reflected in a distinct increase in productivity for all tree species in the simulation. This result is in good agreement with the response of trees to moderate warming, especially since potentially increasing drought stress is circumvented by likewise increased precipitation at most sites. Deliverable D9, 4.5 Annex V – Land Use Decision Modeling with Dynamically Updated Soil Carbon Emission Rates This article proposes a computationally feasible mathematical programming method for integration of soil status dependent sequestration rates in land use decision optimization models. In general, the approach can be used to accurately estimate the time path of soil carbon sequestration, to examine incentives for land owners to adopt or abandon soil carbon sequestration practices at various times in the future, and to better analyze the impact of various future scenarios on the optimal soil management decision. These analyses could benefit policymakers, carbon credit brokers, and private decision makers. Deliverable D9, 4.7, Annex VII – Global Supply of Biomass for Energy and Carbon Sequestration from Afforestation Activities In this paper we provide estimates of global biomass supply from afforestation activities and its implicit carbon sequestration in the forest and consumption sector. Biomass use is substantial in almost all greenhouse gas stabilization scenarios across all models. The largest potential for biomass supply are expected to come from marginal agricultural lands. The FAO (1999) indicate that energy forestry/crops (only temperate and tropical areas) essentially through land use change have the potential to reduce emissions of between 8-27% of current global consumption. Study results suggest that in the long run the contribution of afforestation activities to reduce atmospheric carbon concentrations is much larger for fossil fuel substitution than the carbon sink potential, though in the short run the sink effect dominates. In our model land-use changes of large amounts of land are predicted based on the comparison of discounted net present value calculations of land rents under current land use and afforestation.
43

Deliverable D9, 4.8, Annex VIII – Efficient Engery Systems with CO2 Capture and Storage from Renewable Biomass in Pulp and Paper Mills This paper investigates the impact of combining CO2 capture and storage with alternative systems for biomass-based combined heat and power production (CHP) in Kraft pulp and paper mills. We compare heat, power, and CO2 balances of systems with alternative configurations of the CHP and CO2 –capture systems. Results indicate that the attractiveness of carbon-negative production depends on the benefits to the manufacturer, both tangible and intangible, which would have to compensate for production cost increases. Tangible benefits could include credits given for CO2 reductions and a price increase of branded products featuring carbon-negativity. Credits for CO2 reductions could be based on either a tax approach with a “negative tax” or an emissions trading system whereby owners of plants that remove CO2 from the atmosphere are awarded credits corresponding to the amount of CO2 removed. Intangible benefits include the goodwill value that companies implementing carbon-negative production could earn. It is clear, however, that biomass-based industries rich in self-generated biomass residues will be uniquely equipped to generate carbon-negative production in the future provided the development of safe CO2 storage technologies. The paper shows that the CO2 reduction potential of CHP systems in pulp and paper mills could be leveraged with CO2 capture and storage (BECS). The commercialization of technologies for black liquor and biomass gasification and permanent CO2 storage would make it possible for pulp and paper mills to manufacture pulp or paper while being a net exporter of biomass-based electricity and, at the same time, remove substantial amounts of CO2 from the atmosphere for each ton of pulp or paper produced. D11 Methodology on Robust Decisions, Paper II: Investment under Multiple Uncertainties: The Case of Future Pulp and Paper Mills This paper evaluates the economic feasibility of CO2 capture in biomass-based heat and power (CHP) systems in a Kraft pulp and paper mill given correlated uncertainties of the biomass fuel, electricity and emission permit prices. Through the model, we seek to find the optimal time to enter the market for GHG abatement, and also to analyze the complete path of the optimal investment strategies for the chosen time period. In the case of the market pulp mill with the recovery boiler option (MPM/RB), the capture option is almost never used. This result can mainly be attributed to the steep increase in biomass requirement and to the high capital and operation costs of installing post-combustion capture technology. Black liquor gasification (BLG) on the other hand seems to be better adapted to a market situation where, in particular, carbon is priced. The results differ for different capture options and for different learning rates. Several general results can be drawn from the model results. First, optimal timing has a spread of about 10 years, which is due to uncertainty in the input and output prices. Second, in the face of uncertainty more flexible technologies become competitive earlier and can act as transition technologies. However, such transition technologies procrastinate the implementation of technologies that turn out to be superior in the long-run. In this sense the slowing effect of flexible transition technologies could be understood as a “technological risk premium” for the overall energy system, if the energy costs of the total system increases due to lost learning time for the superior technology.
44

Third, the introduction of uncertainty is more likely to allow for a more technological diverse energy portfolio. Most interestingly, we observe that technological diversity increases with the rate of learning. We observe that under fast learning the transportation distance does not influence the commitment time significantly. The insensitivity to transportation distance comes as a surprise since biomass-based energy conversion technologies are usually associated with a “logistical nightmare”. Due to this insensitivity, the technology can be regarded as geographically flexible. Results suggest that the emphasis in policies should be placed more upon support for developing efficient conversion systems (with minimized energy penalties) rather than on reducing cost for storage and transportation. D11 Methodology on Robust Decisions, Paper I; Optimal Land-Based Resource Management Using Real Options Approach The main aim of this study is to develop a model for the optimal forest management decisions under presence of carbon payments. We assess the optimal rotation period under the assumption of stochastic timber and stochastic carbon prices. The three major inputs to the model are timber price, carbon credit price, and growth function. The results of the model analysis include the suggestion that the major role in forest management is played by the timber price over the price of carbon credits. If the timber price is low, irrespective of the CO2 price level and the standing volume, the optimal decision is to postpone the harvest. If the standing volume of a forest is close to its maximum and the timber price is close or higher than its mean value, it is optimal to perform the “harvest and sell” action. The higher the timber price, the less significant the role of the CO2 price. The numerical results show that there is no definite claim about the impact of the carbon trading presence on the optimal rotation period length. The most significant extensions of the optimal rotation period compared to the case without carbon sequestration has been observed only under a high and constant CO2 price. This suggests that the forest owner would be willing to prolong the rotation period and hence to store the sequestered CO2 for a longer time only if the carbon sequestration is highly beneficial and payments are certain. Deliverable D13 Annex V – Environmental and Economic Impact Analysis of Alternative Management Practices in Baden-Württemberg The objective of this report is to summarize the environmental and economic analysis of environmentally friendly management practices in Baden-Württemberg (BW). In this analysis, the biophysical process model EPIC (Environmental Policy Integrated Climate) is used to predict changes in crop yields, sediment transport, and soil organic carbon. These results are then linked to economic FADN (Farm Accountancy Data Network) data to compute the direct net economic impact on farmers’ income implied by the adoption of alternative tillage and management systems. The results indicate that there exists a clear potential for adoption of alternative tillage systems by a significant number of farms at relatively small costs. Both reduced and minimum tillage practices allow for additional cost-savings compared to conventional management as the extra costs for crop protection do not outweigh the reduction in field operation. Minimum tillage appears to be the least expensive option among those examined, with higher cost savings for cereals and oilseeds.
45

Concerning effects on soil organic carbon (SOC), all tillage systems can increase sequestration of SOC, with lowest additional sequestration through the introduction of cover crops in conventional tillage systems, and the highest with minimum tillage systems, both over a 10 and 30 year time sequence. The impacts on crop yields are highest with minimum tillage, followed by reduced tillage and cover crop management. Crop yield impacts are smaller in the long run than in medium time length. Regarding the impact on farmer revenues, over a ten year average, average farmer income is reduced 0.8% for reduced tillage, 1.2% for minimum tillage, and 0.1% for cover crops. However, at the farm level, impacts on revenue vary in a fairly wide range, depending on the crops grown and the weight of crops in total income. For a significant share of BW farmers, revenues are unchanged or only marginally affected. Alternative tillage practices (reduced and minimum) tend to reduce the costs associated with crop production. However, study results suggest that these cost savings do not fully offset the loss in income due to lower yields. Based on a full cost calculation and the FADN data, over one third of BW farmers would actually gain by reduced tillage, with around 17% found to enjoy a net gain by switching from conventional to reduced tillage. In addition, a significant number of farmers are left unaffected. This totals almost 60% of the population. This result suggests that there is room for policy programs to prompt the adoption of alternative practices at relatively moderate levels of incentives, including training, sunk costs, etc. Results show that there exists a clear potential for adoption of alternative tillage systems by a significant number of farms at relatively small costs. The average compensation need for lost farm income lies within the range of what is currently offered through agri-environmental schemes. Incentives should be designed to match farmers’ marginal cost of adoption, and could be differentiated according to localization, crop rotational system, type of farming, etc. Simulations have shown that, even after a long time of minimum tillage, environmental benefits can be lost in a short period of time if farmers switch back to conventional tillage. Therefore, the issue of tillage conversion should be addressed in a policy program, for instance through enforcing farmers’ commitments to alternative tillage systems over a sufficient period of time and taxing tillage reversion. Deliverable D14 Report on Scenarios, D13 DIMA Results Comparison with other Studies and Using SRES Scenarios The aim of the Report on Scenarios was to present the investigated costs of stimulating landowners to make choices in favor of forest-based carbon sequestration and/or biomass supply in a competitive setting of different land use options. The study used the DIMA model to quantify the economic potential of global forests, taking into account the interactions and feedbacks between ecosystems and anthropogenic activities. The study used the SRES A2 and B1 scenarios. Results indicate that if modern biomass technologies are able to play a significant role within a wider global energy portfolio that aims at low GHG concentration targets, the global terrestrial landscapes will face unprecedented changes, though these changes are quite sensitive to the levels of carbon prices. This holds true under either scenario. This
46

fact suggests that forest-based carbon sequestration merits inclusion in a cost-effective global climate change strategies portfolio. The modeling results indicate that carbon sequestration policies, such as those that promote afforestation and reforestation and discourage deforestation, would contribute a significant part of the global portfolio of efficient climate change mitigation policies, dependent on carbon prices. Modeling results show that introducing a carbon price would make a significant difference and change land-use and management decisions of land owners considerably, even at rather low levels of carbon prices. On a regional level, the speed of growth of financial flows associated with both carbon sequestration and bioenergy production in regions like Africa or Latin America is estimated to grow faster than in northern regions. Within the tropical belt, Africa appears to be the continent with the biggest afforestation potential, due to strong relative cost competitiveness within the model. Overall, the total carbon supply from forests, until 2100, is projected to reach 90Gt of cumulative carbon sink. The vast majority of this volume comes from tropical forests, including 34% from South America and 26% in Africa.
47

References Angenendt, E.; Schäfer, M.; Neufeldt, H. & Zeddies, J. (2004), 'Modellierung
klimarelevanter Emissionen aus der Landwirtschaft Baden-Württembergs', Schriften der Gesellschaft für Wirtschafts- und Sozialwissenschaften des Landbaues e.V. 39, 221-230.
Atwood, J.D., D.W. Goss, R. Kellogg, T.A. Pitts, S.R Potter, and S. Wallace. 2000. The
NRCS National Nutrient Loss Modeling Project: Results for Corn East of the Rocky Mountains. Project Report funded by USDA Natural Resources Conservation Service and the Texas Agricultural Experiment Station.
Balkovic, J., E. Schmid, R. Skalsky, R. Bujnovsky. 2006. Initial soil organic carbon for
bio-physical process modelling – a validation approach using the European and Slovakian soil information systems. Final INSEA Report funded by the DG Environment, Laxenburg, Austria, p. 15.
Böhringer, C.; Löschel, A. & Rutherford, T.F. (2005), 'Efficiency gains from "What"-
flexibility in climate policy: An integrated CGE assessment', Venice Summer Institute: David F. Bradford Memorial Conference on The Design of Climate Policy', CESifo, Venice, Italy.
De Cara, S.; Houzé, M. & Jayet, P. (2005), 'Methane and nitrous oxide emissions from
agriculture in the EU: A spatial assessment of sources and abatement costs', Environmental and Resource Economics 32(4), 551-583.
De Cara, S. and P.A. Jayet 2000. Emissions of greenhouse gases from agriculture: The
heterogeneity of abatement costs in France. European Review of Agricultural Economics 27(3), 281-303.
Esser G, 1991 Osnabruck Biosphere Model: structure, construction, results. In: Modern
Ecology: basic and applied aspects (G. Esser and D. Overdieck, eds.). Elsevier, Amsterdam and London. pp. 679-709.
FAO. 2006. Global Forest Resources Assessment 2005, Progress towards sustainable
forest management, FAO Forestry Paper 147. Franklin et al. 2006a. Modeling forest production and carbon storage potentials in
response to management in the European Union 2005 – 2150, Manuscript. Franklin et al. 2006b. Thinning effects on growth and mortality in forest stands,
Manuscript. Freibauer, A. (2003), 'Regionalised inventory of biogenic greenhouse gas emissions from
European agriculture', European Journal of Agronomy 19(2), 135-160.
48
Haan, C.T., B. Allred, D.E. Storm, G.J. Sabbagh, and S. Prabhu. 1995. Statistical Procedure for Evaluating Hydrologic/Water Quality Models. Transactions of the American Society of Agricultural Engineers, Vol. 38(3), 725-733.
Hamelinck, C.N. and Faaij, A.P.C., Future Prospects for Production of Methanol and
Hydrogen from Biomass. Utrecht University, Copernicus Institute, Science Technology and Society, Utrecht, Netherlands, 2001.
IPCC Fourth Assessment Report, Working Group III, chapter on "Energy Supply"
(forthcoming in 2007). IPCC 2006 Guidelines for National Greenhouse Gas Inventories (forthcoming in 2006). IPCC. 2001. Emissions scenarios: A special report of working group III of the
Intergovernmental Panel on Climate Change. IPCC 2001. 'Agriculture', in J Penman; Kruger D; I Galbally; T Hiraishi; B Nyenzy; S
Emmanul; L Buendia; R Hoppaus; T Martinsen; J Meijer; K Miwa & K Tanabe, eds., 'Good Practice Guidance and Uncertainty Management in National Greenhouse Gas Inventories', Institute for Global Environmental Strategies (IGES), Japan, pp. 4.1-4.94.
JRC. 2005. European yield tables. Khalil, K., B. Mary, and P. Renault. 2004. Nitrous oxide production by nitrification and
denitrification in soil aggregates as affected by O2 concentration. Soil Biology and Biochemistry, 36, pp. 687-699.
Land Use Related Choices under the Kyoto Protocol: Obligations, Options and
Methodologies for Defining "Forest" and for Selecting Activities under Kyoto Protocol Article 3.4. http://www.joanneum.at/carboinvent/workshop.php
Marklund L G. 1988. Biomassafunktioner för tall, gran och björk i Sverige. Sveriges
Lantbruksuniversitet, Rapporter-Skog 45:1–73. McCarl, B.A. & Schneider, U.A. (2001), 'Greenhouse gas mitigation in U.S. agriculture
and forestry', Science 294, 2481-2482. New Mechanisms Needed to Address Deforestation. Ecosystem Marketplace, July 26
2006. Pérez Domínguez, I. (2005),'Greenhouse gases: inventories, abatement costs and markets for emission permits in European agriculture. A modelling approach', PhD thesis, Universität zu Bonn.
Putnam, J., J. Williams, and D. Sawyer. 1988. Using the erosion-productivity impact
calculator (EPIC) to estimate the impact of soil erosion for the 1985 RCA appraisal. In Journal Soil Water Cons. 1988, 43(4): pp 321-326.
49

Reducing Emissions from Deforestation in Developing Countries: A workshop report.
Joint Implementation Quarterly, Vol. 12 No. 2, July 2006. Reducing Emissions from Deforestation in Developing Countries: Methodological and
Policy Issues. SBSTA 24 Side Event. http://www.joanneum.at/REDD/REDD_side_event_announcement_SB_24.pdf
Rokityanskiy, D., Benítez, P. C., Kraxner, F., McCallum, I., Obersteiner, O.,
Rametsteiner, E., and Yamagata, Y., 2006. Geographically explicit global modeling of land-use change, carbon sequestration, and biomass supply. Technological Forecasting & Social Change. In print
Rosenber, N.J., M.S. McKenney, W.E. Easterling, and K.M.Lemon. 1992. Validation of
EPIC model simulations of crop responses to current climate and CO2 conditions: comparisons with census, expert judgment and experimental plot data. Agricultural Quality, 20(1), 239-244.
Saunders, C. & Wreford, A. (2005), 'Agricultural trade liberalization and greenhouse gas
emissions: Modeling the linkages using a partial equilibrium trade model', Agricultural and Resource Economics Review 34(1), 32-42.
Schadauer, K., Büchsenmeister, R., Hauk, E., Russ, W., Frank, G., 2006. Die
Österreichische Waldinventur. http://bfw.ac.at/700/700.html (2006-05-16) Schelhaas, M J, Varis S, Schuck A. and Nabuurs G J, 1999, EFISCEN's European Forest
Resource Database, European Forest Institute, Joensuu, Finland, http://www.efi.fi/projects/eefr/.
Schlamadinger, B., Dutschke, M., Immer, I.M. „How Can Credits from CDM
Afforestation and Reforestation Projects Be Used By Annex I Governments And Companies?” CDM Investment Newsletter No. 2/2004.
Schlamadinger, B., Bosquet, B., Streck, C., Noble, I., Dutschke, M., Bird, N. “Can EU
Emissions Trading Scheme support CDM forestry?”. Climate Policy: 5(2005) 199-208
Schlamadinger, B. 2005. The Role of LULUCF activities in international and national
climate policies. D5 Deliverable Report, INSEA. Schmid, E. 2001. Efficient Policy Design to Control Effluents from Agriculture.
Dissertation. University of Natural Resources and Applied Life Sciences Vienna, 2001, pp 188.
50

Schneider, U.A. and B.A. McCarl 2003. „Economic potential of biomass based fuels for greenhouse gas emission mitigation.” Environmental and Resource Economics 24(4), 291-312.
Schneider, U.A. and B.A. McCarl 2005. “Implications of a Carbon-Based Energy Tax for
U.S. Agriculture.” Agricultural and Resource Economics Review 34(2, October 2005) 1-14.
Schneider, U.A. and Bruce A. McCarl 2006. "Appraising Agricultural Greenhouse Gas
Mitigation Potentials: Effects of Alternative Assumptions." Agricultural Economics forthcoming.
Schneider, U.A., B.A. McCarl, and E. Schmid 2006. “Agricultural Sector Analysis on
Greenhouse Gas Mitigation in U.S. Agriculture and Forestry.” Agricultural Systems forthcoming.
Schneider, U.A. 2006. “Soil organic carbon changes in dynamic land use decision
models.” Agriculture, Ecosystems, and Environment forthcoming. Schönhart, M. 2006. Revegetation – an option in Austria to mitigate climate change?
Diploma Thesis at the University of Natural Resources and Applied Life Sciences, Vienna. Department of Economics and Social Sciences. Institute of Sustainable Economic Development
Seidl, R., Rammer, W., Jäger, D., Currie, W.S., Lexer, M.J., 2006. Assessing trade-offs
between carbon sequestration and timber production within a framework of multi-purpose forestry in Austria. For. Ecol. Manage., in revision.
Seidl R, Lexer M J, Jäger D, Hönninger K. 2005. Evaluation of a hybrid forest patch
model. Tree Phys. 25, 939-951. Sims, R..; Hastings, A.; Schlamadinger, B.; Taylors, G.; Smith, P. 2006, “Energy crops:
current status and future prospects”. Global Change Biology 12:1-23. Sitch S, Smith B, Prentice I C, Arneth A, Bondeau A, Cramer W, Kaplan J, Levis S,
Lucht W, Sykes M, Thonicke K, and Venevski S. 2003. Evaluation of ecosystem dynamics, plant geography and terrestrial carbon cycling in the LPJ Dynamic Vegetation Model. Global Change Biology 9:161-185
Sørensen, Å. L, Economies of Scale in Biomass Gasification Systems. Interim Report IR-
05-030, IIASA, 2005. Streck, C., Bosquet, B., Schlamadinger, B. “Policy Brief: Inclusion of Temporary Credits
From CDM Forestry Projects Into The EU Emissions Trading Scheme”. CDM Investment Newsletter No. 5/2005.
51

Urstöger I. and Schlamadinger, B. 2006. Incentives for the implementation of agriculture and forestry activities under the Kyoto Protocol.
Williams, J.R. 1995. The EPIC Model. In Computer Models of Watershed Hydrology
(Ed.: V.P. Singh). Water Resources Publications, Highlands Ranch, Colorado, 1995, pp 909-1000.
Yoda K, Kira T, Ogawa H, Hozumi K (1963) Self-thinning in overcrowded pure stands
under cultivated and natural conditions. (Intraspecific competition among higher plants. XI.) J Biol Osaka City Univ 14:107–129.
52