eu road surfaces
TRANSCRIPT


DIRECTORATE GENERAL FOR INTERNAL POLICIES
POLICY DEPARTMENT B: STRUCTURAL AND COHESION POLICIES
TRANSPORT AND TOURISM
EU ROAD SURFACES: ECONOMIC ANDSAFETY IMPACT OF THE LACK OFREGULAR ROAD MAINTENANCE
STUDY
This document was requested by the European Parliament's Committee on Transport andTourism.
AUTHORS
Steer Davies Gleave - Roberta Frisoni, Francesco Dionori, Lorenzo Casullo, ChristophVollath, Louis Devenish, Federico Spano, Tomasz Sawicki, Soutra Carl, Rooney Lidia, JoãoNeri, Radu Silaghi, Andrea Stanghellini
RESPONSIBLE ADMINISTRATOR
Piero SoavePolicy Department Structural and Cohesion PoliciesEuropean ParliamentB-1047 BrusselsE-mail: [email protected]
EDITORIAL ASSISTANCE
Adrienn Borka
LINGUISTIC VERSIONS
Original: EN.
ABOUT THE EDITOR
To contact the Policy Department or to subscribe to its monthly newsletter please write to:[email protected]
Manuscript completed in July, 2014© European Union, 2014.
DISCLAIMER
The opinions expressed in this document are the sole responsibility of the author and donot necessarily represent the official position of the European Parliament.
Reproduction and translation for non-commercial purposes are authorized, provided thesource is acknowledged and the publisher is given prior notice and sent a copy.
DIRECTORATE GENERAL FOR INTERNAL POLICIES
POLICY DEPARTMENT B: STRUCTURAL AND COHESION POLICIES
TRANSPORT AND TOURISM
EU ROAD SURFACES:ECONOMIC AND SAFETY IMPACT OF THELACK OF REGULAR ROAD MAINTENANCE
STUDY
AbstractThis study looks at the condition and the quality of road surfaces in the EU andat the trends registered in the national budgets on the road maintenanceactivities in recent years, with the aim of reviewing the economic and safetyconsequences of the lack of regular road maintenance. The authors investigatethe key causes behind the registered variations identified and the consequentimpacts on road safety; they recommend therefore a series of actions and bestpractices to help preserve the safety and quality of the EU road surfaces.
IP/B/TRAN/FWC/2010-006/Lot1/C1/SC6 2014
PE 529.059 EN

EU Road Surfaces: Economic and Safety Impact of the Lack of Regular Road Maintenance____________________________________________________________________________________________
3
CONTENTS
LIST OF ABBREVIATIONS 4
COUNTRY ABBREVIATIONS 7
LIST OF TABLES 9
LIST OF FIGURES 9
EXECUTIVE SUMMARY 13
INTRODUCTION 191.1.1. Preface 19
1.2. Study Requirements 19
1.3. Organisation of the research study 20
ROAD SAFETY IN THE EU 28 212.2.1 Road safety in the EU 21
ROAD MAINTENANCE EXPENDITURE IN THE EU 353.3.1 Introduction 35
3.2. Road investment and maintenance expenditure trends 40
3.3. Road maintenance activities: an assessment through asphalt production data 45
3.4. Economic cycle and road maintenance 50
ASSESSMENT OF ROAD SURFACE QUALITY AND SAFETY4.PERFORMANCE AND PLANNING OF MAINTENANCEACTIVITIES IN THE EU 594.1. Introduction 59
4.2 Impact of road condition on road safety 59
4.3 Road performance monitoring at the EU level 64
4.4 Performance monitoring at the national level 68
SOCIO-ECONOMIC IMPACTS OF ROAD MAINTENANCE5.ACTIVITIES 775.1 Road transport efficiency 77
5.2 Safety and health impacts 80
5.3 Wider socio-economic impacts 82
5.4 The potential impact of LHVs 85

Policy Department B: Structural and Cohesion Policies____________________________________________________________________________________________
4
CONCLUSIONS 896.6.1. Lessons learned 89
6.2. Key findings and recommendations 91
REFERENCES 97
ANNEXES 99

EU Road Surfaces: Economic and Safety Impact of the Lack of Regular Road Maintenance____________________________________________________________________________________________
5
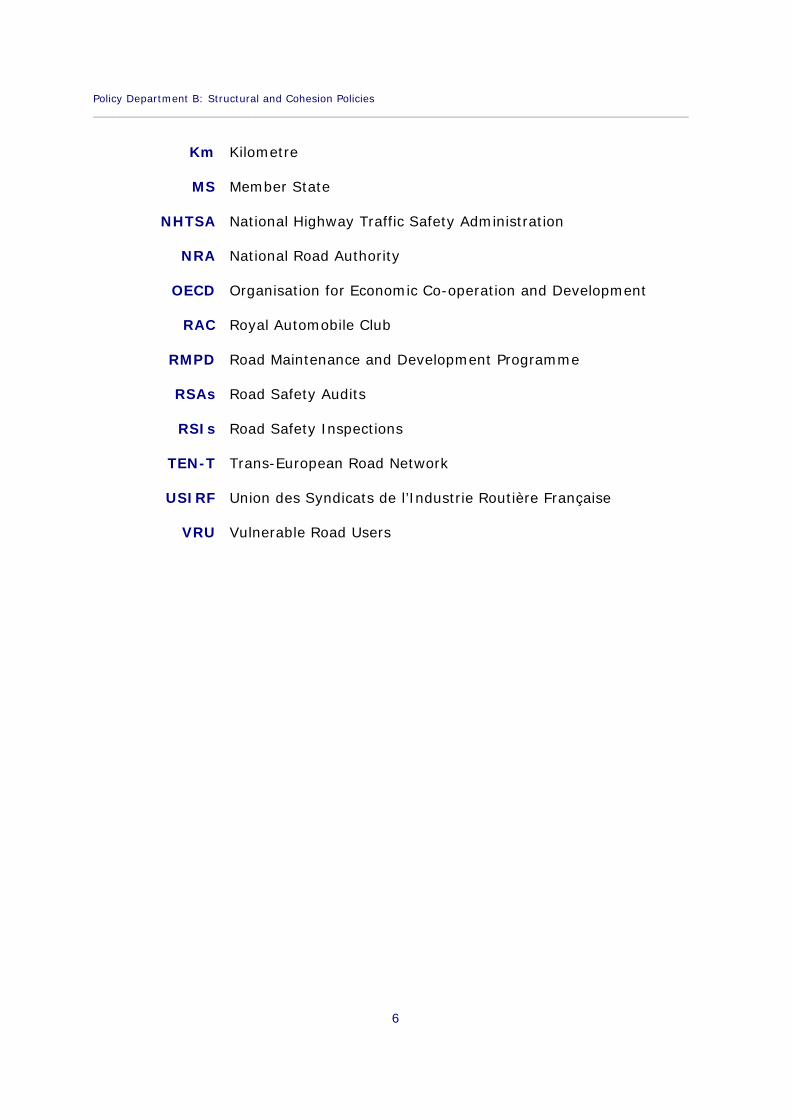
LIST OF ABBREVIATIONS
AEC Asociación Española de la Carretera (Spanish road Association)
ANAS Azienda Nazionale Autonoma delle Strade (NationalAutonomous Roads Corporation)
ASFINAG Autobahnen-und-Schnellstraßen-Finanzierungs-Aktiengesellschaft (Autobahn and high way financing stockcorporation)
CADaS Common Accident Data Set
CARE European Centralised database on Road Accidents
CAGR Compound annual growth rate
DARR Digital Accident Data Recorders
DPA Data Protection Act
EAPA European Asphalt Pavement Association
ERF European Union Road Federation
ERSAP European Road Safety Action Programme
ETSC European Road Safety Council
EU European Union
EU13 The Member States which joined the EU after 2004
EU15 EU Member States before the 2004 enlargement
EU28 The current Member States
GM General Motors
HI Highways Agency
IRU International Road Union
ITF International Transport Forum
ITS Intelligent Transport Systems
Policy Department B: Structural and Cohesion Policies____________________________________________________________________________________________
6
Km Kilometre
MS Member State
NHTSA National Highway Traffic Safety Administration
NRA National Road Authority
OECD Organisation for Economic Co-operation and Development
RAC Royal Automobile Club
RMPD Road Maintenance and Development Programme
RSAs Road Safety Audits
RSIs Road Safety Inspections
TEN-T Trans-European Road Network
USIRF Union des Syndicats de l’Industrie Routière Française
VRU Vulnerable Road Users

EU Road Surfaces: Economic and Safety Impact of the Lack of Regular Road Maintenance____________________________________________________________________________________________
7
COUNTRY ABBREVIATIONS
AT Austria
BE Belgium
BG Bulgaria
CY Cyprus
HR Croatia
CZ Czech Republic
DE Germany
DK Denmark
EE Estonia
EL Greece
ES Spain
FI Finland
FR France
UK United Kingdom
HU Hungary
IE Ireland
IT Italy
LT Lithuania
LU Luxembourg
LV Latvia
MT Malta
NL Netherlands
PL Poland

Policy Department B: Structural and Cohesion Policies____________________________________________________________________________________________
8
PT Portugal
RO Romania
SE Sweden
SI Slovenia
SK Slovakia
EU Road Surfaces: Economic and Safety Impact of the Lack of Regular Road Maintenance____________________________________________________________________________________________
9
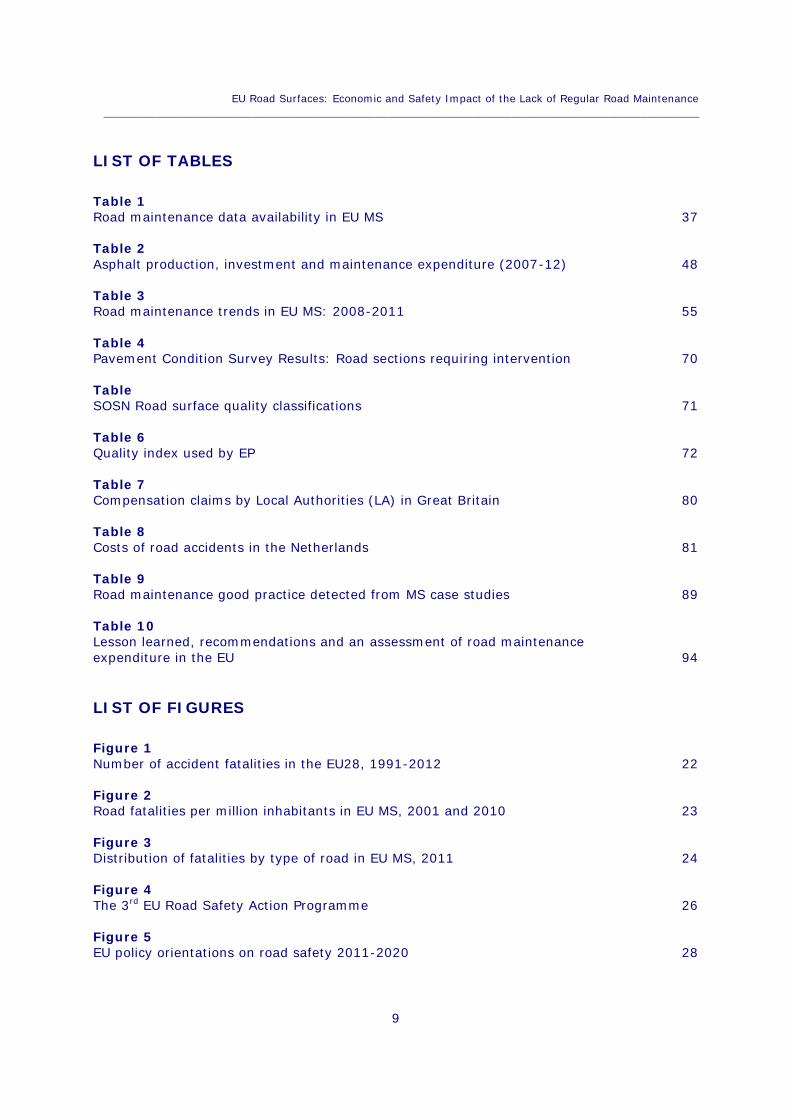
LIST OF TABLES
Table 1Road maintenance data availability in EU MS 37
Table 2Asphalt production, investment and maintenance expenditure (2007-12) 48
Table 3Road maintenance trends in EU MS: 2008-2011 55
Table 4Pavement Condition Survey Results: Road sections requiring intervention 70
TableSOSN Road surface quality classifications 71
Table 6Quality index used by EP 72
Table 7Compensation claims by Local Authorities (LA) in Great Britain 80
Table 8Costs of road accidents in the Netherlands 81
Table 9Road maintenance good practice detected from MS case studies 89
Table 10Lesson learned, recommendations and an assessment of road maintenanceexpenditure in the EU 94
LIST OF FIGURES
Figure 1Number of accident fatalities in the EU28, 1991-2012 22
Figure 2Road fatalities per million inhabitants in EU MS, 2001 and 2010 23
Figure 3Distribution of fatalities by type of road in EU MS, 2011 24
Figure 4The 3rd EU Road Safety Action Programme 26
Figure 5EU policy orientations on road safety 2011-2020 28
Policy Department B: Structural and Cohesion Policies____________________________________________________________________________________________
10
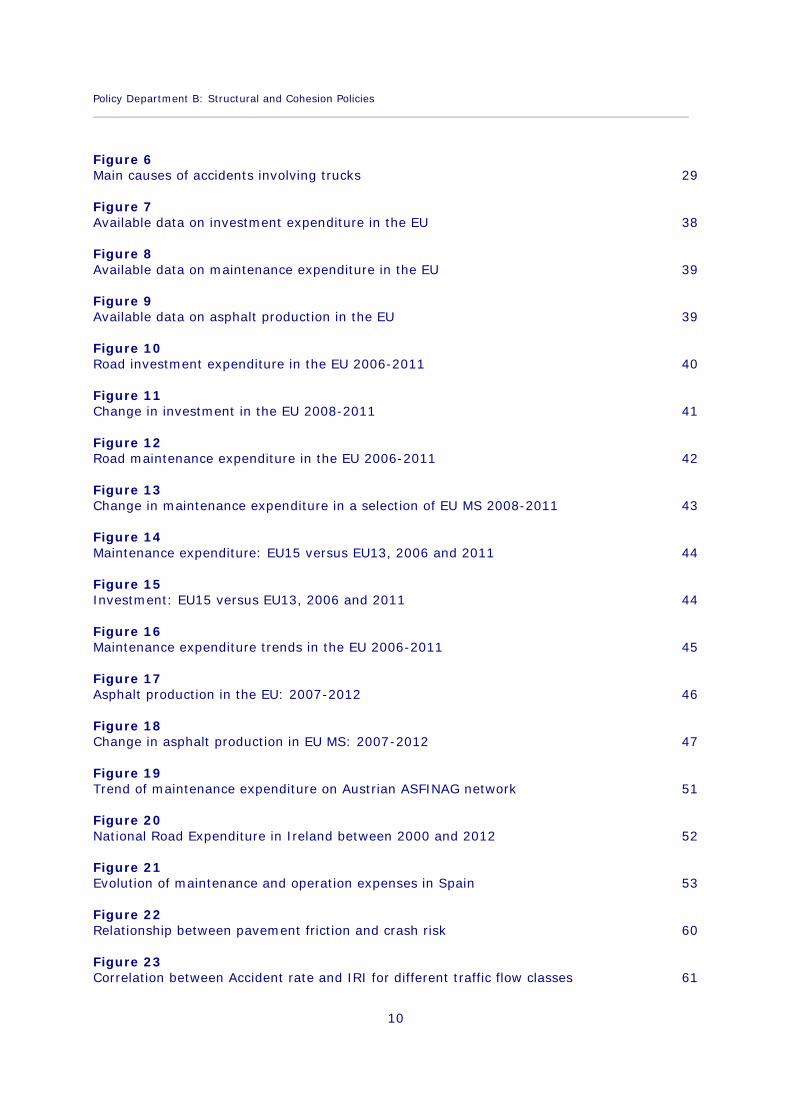
Figure 6Main causes of accidents involving trucks 29
Figure 7Available data on investment expenditure in the EU 38
Figure 8Available data on maintenance expenditure in the EU 39
Figure 9Available data on asphalt production in the EU 39
Figure 10Road investment expenditure in the EU 2006-2011 40
Figure 11Change in investment in the EU 2008-2011 41
Figure 12Road maintenance expenditure in the EU 2006-2011 42
Figure 13Change in maintenance expenditure in a selection of EU MS 2008-2011 43
Figure 14Maintenance expenditure: EU15 versus EU13, 2006 and 2011 44
Figure 15Investment: EU15 versus EU13, 2006 and 2011 44
Figure 16Maintenance expenditure trends in the EU 2006-2011 45
Figure 17Asphalt production in the EU: 2007-2012 46
Figure 18Change in asphalt production in EU MS: 2007-2012 47
Figure 19Trend of maintenance expenditure on Austrian ASFINAG network 51
Figure 20National Road Expenditure in Ireland between 2000 and 2012 52
Figure 21Evolution of maintenance and operation expenses in Spain 53
Figure 22Relationship between pavement friction and crash risk 60
Figure 23Correlation between Accident rate and IRI for different traffic flow classes 61
EU Road Surfaces: Economic and Safety Impact of the Lack of Regular Road Maintenance____________________________________________________________________________________________
11
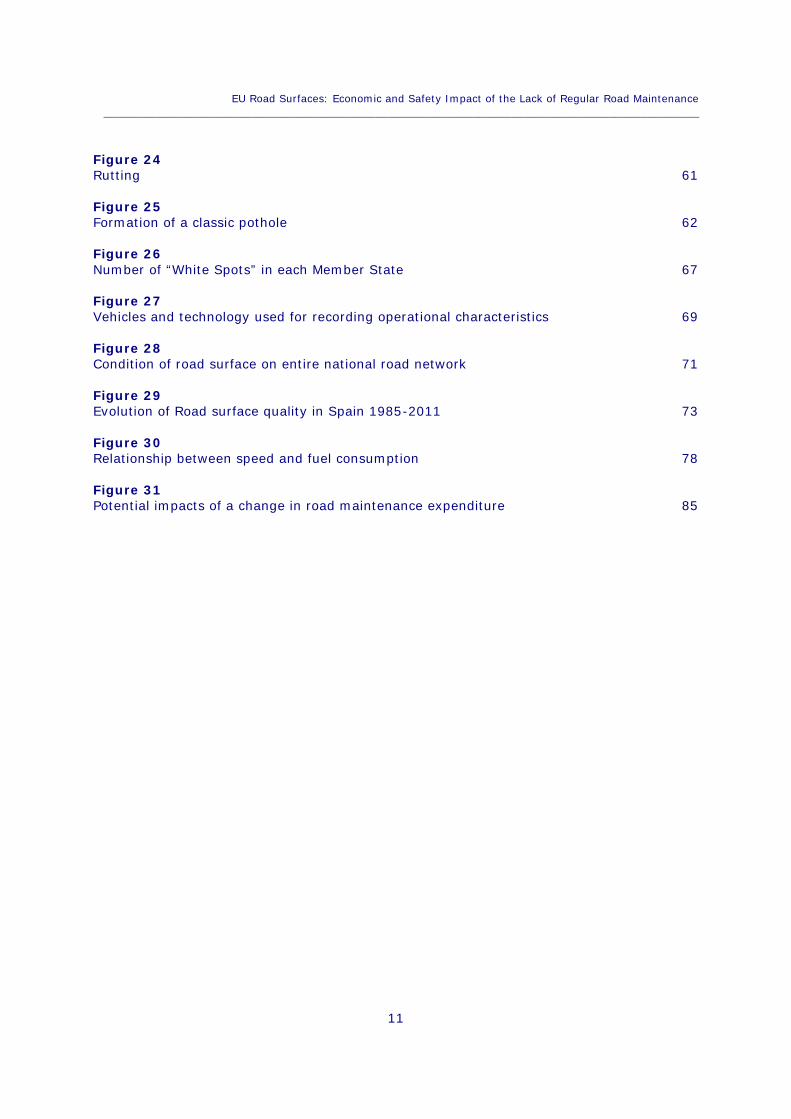
Figure 24Rutting 61
Figure 25Formation of a classic pothole 62
Figure 26Number of “White Spots” in each Member State 67
Figure 27Vehicles and technology used for recording operational characteristics 69
Figure 28Condition of road surface on entire national road network 71
Figure 29Evolution of Road surface quality in Spain 1985-2011 73
Figure 30Relationship between speed and fuel consumption 78
Figure 31Potential impacts of a change in road maintenance expenditure 85

Policy Department B: Structural and Cohesion Policies____________________________________________________________________________________________
12
EU Road Surfaces: Economic and Safety Impact of the Lack of Regular Road Maintenance____________________________________________________________________________________________
13
EXECUTIVE SUMMARY
This research study is intended to inform the parliamentary debate looking at the conditionand the quality of road surfaces in the EU and at the trends registered in the budgetassigned by EU Member States to road maintenance activities in recent years, with the aimof reviewing the economic and safety consequences of the lack of regular roadmaintenance.
To do so, the research study aims to give the reader, both an overview of the most recentdevelopments of academic and policy discussion in this field and a tangible perception of thecurrent situation regarding the status of road maintenance and level of expenditure in EUMember States. The study has a number of sections and is supported by evidence gatheredthrough 11 national case studies. The analysis is supported, where possible, by quantitativeinformation. As road maintenance standards, practices and monitoring tools are dissimilarwithin Europe, the volume of quantitative data that has been gathered in Member States isnot always comparable.
ROAD SAFETY
Road Safety in Europe has been improving over recent decades. The number of fatalities inthe EU-28 in 2010 was almost 31,500, or only 57% of the 54,949 fatalities registered in2001. A significant step in this trend took place between 2008 and 2010, when roadfatalities fell 10% per annum compared to 4% per annum between 2001 and 2007.Notwithstanding the substantial decline, the EU did not achieve the target, set in 2003, of a50% decrease in road fatalities between 2001 and 2010.
In addition to this general decline in road fatalities it is worth noting that:
The decline has been achieved despite a general growth in road passenger transport:between 1995 and 2011 road transport demand, measured in passenger-kilometres,grew by an average of 1.1% per annum across the EU.
The situation varies substantially across the different Member States. Southern andeastern Member States tend to have fatality rates higher than the EU average.
The decline in fatalities varies according to road users: the number of fatalities hasfallen steadily for cars (-45%), goods vehicles (-40%), cyclists (-33%) andpedestrians (-34%), while the number of fatalities in accidents involving motorcycleshas remained constant.
Provisional data for 2013 indicate that road fatalities are still decreasing, as anoverall number of 26,000 fatalities has been registered in the EU. According to theEC press-release "Second good year in a row puts Europe firmly on track towardstarget"1, 2013 is the second year in a row that saw an impressive decrease in thenumber of people killed on Europe's roads. Based on preliminary figures, the numberof road fatalities has decreased by 8% compared to 2012, following the 9% decreasebetween 2011 and 2012.
1 EC press-release IP/14/341 published on 31/03/2014.
Policy Department B: Structural and Cohesion Policies____________________________________________________________________________________________
14
For the coming years, the European Commission has renewed its objective of halvingfatalities by 2020 through an increased focus on the enforcement of road rules.
Data on road accidents at European level are collected in CARE, the European centraliseddatabase on road accidents, which provides information on deaths or injuries across the EU,collating non-confidential data from EU Member States into one central database. Althoughsignificant steps have been made to improve the quality of the statistical informationprovided, the CARE database has limitations regarding both the reliability of data and thelack of information about accident causation factors.
Since the adoption of the 3rd ERSAP, the EU has recognized that human error is the mostrecurring cause of road accidents, but the impact of road condition and maintenance is notnegligible. In many circumstances, it is difficult to disentangle causality: there are accidentscaused directly by the poor condition of the road, but there are also accidents caused bydrivers’ behaviour in reaction to the condition or the design of the road. As drivers can, andinevitably do, make mistakes, infrastructure conditions should be gradually improved toprotect users more effectively against their own shortcomings.
ROAD MAINTENANCE EXPENDITURE IN THE EU
The collection of homogeneous and accurate information on road maintenance andinvestment expenditure across the different Member States is difficult as the degree ofhomogeneity of data is minimal. Roads are administered differently in different MS, thus theresponsibility for keeping the different sections of the road network at acceptable standardsis assigned to numerous bodies, such as national ministries, regional or local authorities. Inaddition to this the definition of road maintenance and investment activities is not alwaysclear comparing different national contexts, making it problematic to detect exactly whatneeds to be recorded in each of the two categories, creating discrepancies in the way data isreported across the different MS.
To assess the evolution of maintenance activities on road works in the EU in recent yearsthis study has brought together the road expenditure dataset produced by the OECD/ITF,the asphalt production data reported by EAPA and specific country information.
Data collected shows that road investment levels remained relatively stable in the EUbetween 2006 and 2011. Road investment was at its highest in 2009, but had fallen by7.1% by 2011. Country-specific data shows that there is a great deal of variation across EUcountries in road investment expenditure registered in the 2008-2011 period. As anexample Bulgaria and Poland both increased their investment expenditure over these years,whilst Slovenia, Austria and Ireland drastically reduced theirs. Road investment expenditureof the largest economies in this sample – Germany, France and the UK – did not varysubstantially between 2008 and 2011.
Regarding the maintenance expenditure levels, the analysis suggests the presence of asignificant reduction of maintenance activities in Italy, Ireland, Slovenia and Spain in recentyears and a likely downward trend also in Slovakia, Finland, Czech Republic, the UK,Portugal and Hungary. At the same time, an increase in maintenance expenditure seems tohave been recorded in a number of EU MS over the same period: this is the case for Austria,Germany, France, Croatia, Lithuania, Luxemburg, and Poland.

EU Road Surfaces: Economic and Safety Impact of the Lack of Regular Road Maintenance____________________________________________________________________________________________
15
The extent to which the crisis has affected road investment and maintenance activitiesdepends on the structure of the funding mechanism adopted in the different countries andon the political choices made by decision makers. The impact of the crisis has been higherwhere the funding of road infrastructure is highly dependent on government spending ratherthan from other sources of financing (e.g. toll roads). The status of public finance ofdifferent MS and the fiscal and budgetary choices that have been made has led to differentoutcomes.
ASSESSMENT OF ROAD SURFACE QUALITY AND PLANNING OFMAINTENANCE ACTIVITIES
With the approval of Directive 2008/96/EC a common framework for road infrastructuresafety management was created for the first time in the EU. Though it represents a validstep forward in the creation of a harmonised framework for road safety monitoring in theEU, this Directive only applies to the TEN-T corridors and is subject to differentinterpretations and dissimilar implementation across the EU. In addition to this, theDirective focuses only on procedural aspects of road safety monitoring, and it leaves roomfor significant variability in the operational activities undertaken by different Member States.
The EU made an attempt to overcome these limits with two research projects. The first one,Pilot4safety, developed a manual, complemented by a collection of best practices that couldbe a starting point to develop a comprehensive tool that standardises the operationalprescriptions to be implemented by road operators and national authorities in order toguarantee a balanced level of road maintenance across Europe. The second one,WhiteRoads, identified the ‘white spots’, that is road sections along the Trans-EuropeanRoad Network (TEN-T) where no accidents occurred during the study period, despite hightraffic flows, and studied them to identify the key features that allowed these sections toachieve such a high level of road safety.
Results from the WhiteRoads project shows that good road design, the presence ofadequate maintenance programmes, the installation of reliable and homogenous trafficsignage and road markings and appropriate lighting are among the key aspects thatdetermine the success of white spots. The checklist developed within the WhiteRoadsproject should be considered as a new and complementary tool to the safety audits andinspections laid down in the Road Infrastructure Safety Directive 2008/96/EC on the design,maintenance and management of roads and could also be applied to other relevant roadsections not belonging to the TEN-T network.
Several Member States have a well-established procedure for the monitoring of roadconditions and the prioritisation of interventions. In many cases however, this does notextend to local or urban roads. Where road maintenance activities are carried out accordingto the outcomes of the monitoring process, prioritisation rules depend on the way outputsare assessed. For example while some national authorities decide to prioritise roads with theworst absolute indicators (e.g. Poland), others address the roads that are seen to bedeteriorating (e.g. UK).
From the case studies, a number of good practices have been identified that could help toimprove the cost-effectiveness of maintenance activities on local roads such as: i) the

Policy Department B: Structural and Cohesion Policies____________________________________________________________________________________________
16
recourse to user-fed information, where electronic or web-based systems are used to allowdrivers to report potholes and highway defects directly to road managers or ii) theutilisation of recycled asphalt, a material that has the same level of quality as newlyproduced asphalt, but costs about 30% less.
SOCIO-ECONOMIC IMPACTS OF ROAD MAINTENANCE
Road maintenance expenditures also yield substantial wider socio-economic impacts. Thereduction in journey times associated with timely maintenance is one of the most widelyrecognised economic benefits of road maintenance. A survey carried out by the AsphaltIndustry Association (2010) found that the average cost of poor maintenance per business,at £13,600 per year (€16,300).
There is also evidence of the social cost of road accidents which has been quantified instudies in France, Lithuania and the Netherlands. While the majority of road accidents aredown to driver behaviour, some of those accidents could be as a result of drivers behavingin a certain way to account for poor road maintenance.
Studies that have sought to quantify the wider economic impacts of road maintenanceactivities indicate that the reduction in road maintenance expenditure can have an impact tothe wider economy in the range of 100%-250%.
KEY FINDINGS AND RECOMMENDATIONS
When developing road safety policies and interventions, the reliability and quality of datais a key factor. There is scope across Europe for further efforts to link police collision reportsto hospital data records to improve data quality and consistency, especially regardingserious injury crashes. Data quality and effective analysis are fundamental to building riskawareness and intervention effectiveness. At the same time as the degree of homogeneityof available data on road maintenance and investment expenditure across the different MSis minimal, it is important to consider additional efforts to improve the standardisation ofstatistical data collected across the EU.
In light of future parliamentary debates on the actions to be taken by the EU to helppreserve the safety and quality of road surfaces and contrast the possible negative impactsgenerated by cuts in road maintenance activities due to economic downturns, the followingactions should be taken into consideration:
In the ongoing revision of the Road Infrastructure Safety Directive 2008/96/EC of19th November 2008, it will be important to support the introduction of changes thatallow for a more homogenous application across the EU and expand the technical andgeographical scope of the application of the Directive.
Call on the Commission to propose the extension of the experiences of theWhiteRoads project to other categories of roads and use the outcomes of the whitespot evaluation to improve safety records on the most dangerous sections.

EU Road Surfaces: Economic and Safety Impact of the Lack of Regular Road Maintenance____________________________________________________________________________________________
17
Support the dissemination of a checklist similar to those developed in WhiteRoads as anew and complementary tool to the safety audits and inspections laid down in Directive2008/96/EC and incentivise their application on road sections off the TEN-T network.
Identify actions and measures that could focus on local and urban roads, which showthe highest safety risks and, in some countries, are experiencing the strongestreduction in maintenance activities.
Help disseminating the good practices that several EU MS have introduced andcould help improve the cost-effectiveness of maintenance activities across the EU.

Policy Department B: Structural and Cohesion Policies____________________________________________________________________________________________
18

EU Road Surfaces: Economic and Safety Impact of the Lack of Regular Road Maintenance____________________________________________________________________________________________
19
INTRODUCTION1.
1.1. Preface
This study looks at the condition and the quality of road surfaces in the EU and at the trendsregistered in the budget assigned by EU MS to road maintenance activities in recent years,with the intent to investigate the economic and safety consequences of the lack of regularroad maintenance.
The analysis included within this study focuses exclusively on maintenance activities onexisting roads and does not include an assessment of investments in new roadinfrastructure.
The study has been informed by a number of previous studies, desktop analysis anddiscussions with stakeholders and provides a review of current developments in a subset ofMember States based on case studies. Case studies were selected according to a number ofcriteria: the existence of evidence on recent cuts in the budget allocated to roadmaintenance activities, the record of poor road safety performance, the presence of goodpractice in the assessment of the quality of road surface and planning of maintenanceactivities and the need to ensure a balance between EU15 and EU13 Member States.
1.2. Study Requirements
The objective of this research study is to provide the TRAN Committee with a clear overviewof the condition and quality of road surfaces in the EU with specific reference to theeconomic and safety consequences of the lack of regular road maintenance. In particularthe terms of reference for the study required the following activities to be completed:
Provision of updated key statistical data concerning road safety in the EU-28 -assessed against a list of objectives and targets fixed in the EU road safety plan for2011-2020. Special attention is given to the extent to which both investment(including construction, renewal and major repair) and good road maintenanceprogrammes can influence safety for the different types of road surfaces and users.
An overview of the recent trends in road maintenance expenditure in the EU MS anda detailed analysis of available data related to investment and maintenance spendingin road infrastructures in a selection of case studies.
A review of existing procedures and technologies put in place at EU and national levelto assess the quality of the road surfaces and to verify the constancy ofperformance, the programme maintenance interventions and the communicationwith the road user, including best practices that could help some MS to redressand/or to improve their road infrastructure safety management.
A balanced assessment of the possible socio-economic impacts of variations in theamount of resources dedicated to road maintenance looking at the possible impactsof road maintenance programmes on the efficiency of the road transport market,safety of transport users, MS economy and labour market as a whole, etc.

Policy Department B: Structural and Cohesion Policies____________________________________________________________________________________________
20
Finally, this study provides conclusions on the spectrum of interventions and actions ofsupport that could be taken at the EU level to promote the improvement and themaintenance of a good quality and safe road transport network throughout the EU, even inpresence of stringent public budget constraints that limit the scope of spending in thissector.
1.3. Organisation of the research study
The remainder of this research study is structured as follows:
Chapter 2 provides an overview of the current EU road safety targets, discussing theachievements made in recent years and the challenges yet to be addressed;
Chapter 3 provides an overview of road maintenance expenditure trends registeredin the EU;
Chapter 4 presents the procedures in use to assess road safety quality in the EU andto plan road maintenance activities over years;
Chapter 5 outlines the economic and social impact of road maintenance activities;and
Chapter 6 concludes by outlining key findings and recommendations.
EU Road Surfaces: Economic and Safety Impact of the Lack of Regular Road Maintenance____________________________________________________________________________________________
21
ROAD SAFETY IN THE EU 282.
This chapter provides the background explaining why, in the context of road safety, roadmaintenance is an issue of interest for EU transport policy. Firstly, the chapter sets outrecent trends in road safety in the EU and compares them with EU policy objectives andtargets in this area. The different factors that contribute to the improvement of road safetyon EU roads are also discussed in this chapter, along with an assessment of how the qualityand condition of road infrastructure affects this.
2.1 Road safety in the EU
2.1.1 Road safety trends
Road safety is monitored at EU level through the collection of statistics regarding roadaccidents, fatalities and injuries on EU roads. A common data collection methodology hasbeen developed for EU MS and standardized statistics are published in the CARE database -a Community database on road accidents resulting in death or injury. This dataset providesthe basis for the assessment presented in this section2.
Box 1: Road Safety statistics in the EU
The Care DatabaseCARE3 is the European centralised database on road accidents which result in death orinjury across the EU, pulling together non-confidential data from all EU Member States.While the yearly production of road safety statistics is the responsibility of each MS(which carry out this task following their own standards and statistical formats), CAREreturns a dataset that presents harmonised and comparable data across the EU. This ispossible thanks to a framework of transformation rules that ensure the compatibility ofdata variables and values.
Although significant effort has been made in recent years to improve the quality of thestatistical information provided by CARE, there are still a number of issues that hinderthe effectiveness of this tool. Firstly, the reliability of data depends primarily on thebasic statistics provided by single MSs, whose quality can differ across the EU, as arguedby the European Transport Safety Council (2006)3. While the accurateness of fatalinjuries is quite high across the EU, under-reporting appears to be an issue for injuriesand especially for damage-only accidents in a number of MS. Furthermore, although thedatabase provides data differentiated by type of road network and type of road users, itdoes not provide information on accident causation factors, limiting its role in theshaping of EU road safety policy and measures of intervention.
2 http://ec.europa.eu/transport/road_safety/index_en.htm3 European Road Safety Council – ETSC (2006), Road accident data in the enlarged European Union, Brussels,
Available at: http://www.etsc.eu/documents/Road_accident_data_in_the_Enlarged_European_Union.pdf

Policy Department B: Structural and Cohesion Policies____________________________________________________________________________________________
22
Figure 1 below shows the change in the number of road fatalities between 1991 and 2012,together with the targets set for 2010 and 2020 by EU policy in this area4. The number offatalities observed in 2010 was almost 31.000, a level corresponding to 85% of the fatalitiesreduction target set in 2003 by the EU. Although the EU target has not been achieved, asignificant fall has been registered in road fatalities between 2000 and 2010, with asignificant step change taking place between 2008 and 2010: over this period road fatalitiesfell by about 10% per year, against a 4% yearly average registered between 2001 and2007.
Figure 1: Number of accident fatalities in the EU28, 1991-20125
Source: Steer Davies Gleave elaboration on European Commission data (2013).
Road fatalities in the EU have been decreasing despite a general growth in road passengertransport activity. Between 1995 and 2011, demand (measured in passenger-km) grew byan average of 1.1% per annum in the EU, although growth was higher in the first decadethan in following years (the CAGR, or compound annual growth rate, was 1.5% between1995 and 2005 and 0.6% between 2005 and 2011). This made the goal of reducing total
4 See COM(2003) 311 final “Halving the number of road accident victims in the EU by 2010: A sharedresponsibility” for the 2010 target and COM(2010) 389 final “Towards a European road safety area: policyorientations on road safety for the years 2011-2020” for the 2020 target.
5 Provisional data for 2013 show a level of fatalities equal to 26,000 (source: European Commission).
76.250
31.484
28.136
54.949
15.500
0
10.000
20.000
30.000
40.000
50.000
60.000
70.000
80.000
90.000
EU 28 fatalities 2010 objective 2020 objective

EU Road Surfaces: Economic and Safety Impact of the Lack of Regular Road Maintenance____________________________________________________________________________________________
23
fatalities at the beginning of the 2000s more challenging, and partially explains the loweraccident reduction rates experienced in those years.
The general improvement in road safety is also shown by the fall in the risks road users areexposed to:
Road safety risk, i.e. the risk of being involved an accident causing physical injuries –measured as the number of accidents causing injury as a percentage of millionpassenger-kilometres - has fallen from 0.32 in 1995 (corresponding to one accidentevery 3.2 million kilometres) to 0.20 in 2011 (corresponding to one accident every5.1 million kilometres).
Road severity risk, i.e. the risk of being involved in an accident causing injuries thatresults in a fatality – measured as the number of fatalities as a percentage ofaccidents relating to injury - has also fallen from 4.2% in 1995 to 2.8% in 2011.
The situation varies substantially across the different EU MS, as well as between differenttypes of road users and types of road network. Southern and eastern EU MS tend to havehigher than the EU average fatality rates as shown in the figure below. This is a result ofboth historical/cultural reasons and safety policies adopted in single Member States, as wellas the trends registered in car usage in the different countries.
Figure 2: Road fatalities per million inhabitants in EU MS, 2001 and 2010
Source: Steer Davies Gleave elaboration on European Commission data (2013).
0
50
100
150
200
250
Swed
en
Uni
ted
King
dom
Net
herla
nds
Mal
ta
Germ
any
Denm
ark
Irela
nd
Finl
and
Spai
n
Esto
nia
Fran
ce
EU 2
8
Luxe
mbo
urg
Aust
ria
Slov
enia
Italy
Slov
akia
Cypr
us
Hung
ary
Czec
h Re
publ
ic
Belg
ium
Port
ugal
Lith
uani
a
Croa
tia
Latv
ia
Pola
nd
Bulg
aria
Gree
ce
2001 2010

Policy Department B: Structural and Cohesion Policies____________________________________________________________________________________________
24
This variation can be seen in the positive achievements obtained in countries like the UK,the Netherland, Germany, Ireland and Spain which are a consequence of the safety policyand the road network improvements in those MS. The poor performance registered bycountries like Poland, Romania, Greece and Bulgaria needs to be balanced against the sharpincrease in car usage in these MS: between 2001 and 2010 car ownership increased by 69%in Poland, 37% in Romania, 34% in Greece and Bulgaria, followed by an increase in roadtraffic of 73% in Poland, 63% in Romania, 58% in Greece and 42% in Bulgaria.
In most countries, fatalities occur predominantly in rural areas, averaging 55% in 2011and ranging from 75% in Ireland to 34% in Cyprus, while motorways account on averagefor about 7.5% of accident fatalities in the EU6.
Between 2000 and 2009, the reduction in the number of fatalities was fairly balanced acrossthe three road types (32% for urban roads, 36% for motorways and 41% for rural roads);however urban and rural roads remain those with the highest share of fatalities. Fromavailable statistics it is not possible to identify specific safety and severity risks indexes forthe different types of road newtorks across the different EU MS as no EU wide statistics areavailable on road passenger demand by type of roads. However, as further explained in Box2, research in this area suggests that accident risks are higher on rural roads than on othertypes of roads.
Figure 3: Distribution of fatalities by type of road in EU MS, 2011 (2010 whenindicated with an asterisk)
Source: Steer Davies Gleave elaboration on European Commission data.
6 This data would ideally need to be assessed against traffic volumes for different types of road which however isonly available for the motorway network. As a proxy, accident data by road type could be compared to the roadlength of the different types of roads in the different EU MS. Unfortunately this data is only available for asubset of countries. The available data does not provide a clear relationship between the share of rural roadlength and the percentage of road accidents in rural areas. Finland has a large share of rural roads (87%), anda high share of road fatalities in rural areas (71%). Poland has a similar share of rural roads (83%) but a lowershare of deaths in rural areas (52%). In the Czech Republic, 61% of road fatalities are recorded in rural roads,but these roads account for only 42% of total road infrastructure.
0%10%20%30%40%50%60%70%80%90%
100%
Irela
nd*
Finl
and
Latv
ia
Luxe
mbo
urg
Fran
ce
Swed
en*
Aust
ria
Denm
ark
Spai
n
Uni
ted
King
dom
Czec
h Re
publ
ic
Germ
any
Hung
ary
EU a
vera
ge
Slov
akia
*
Belg
ium
Slov
enia
Pola
nd
Net
herla
nds
Italy
*
Gree
ce
Rom
ania
Port
ugal
Croa
tia
Cypr
us
Rural, no motorway Urban, no motorway Motorway
EU Road Surfaces: Economic and Safety Impact of the Lack of Regular Road Maintenance____________________________________________________________________________________________
25
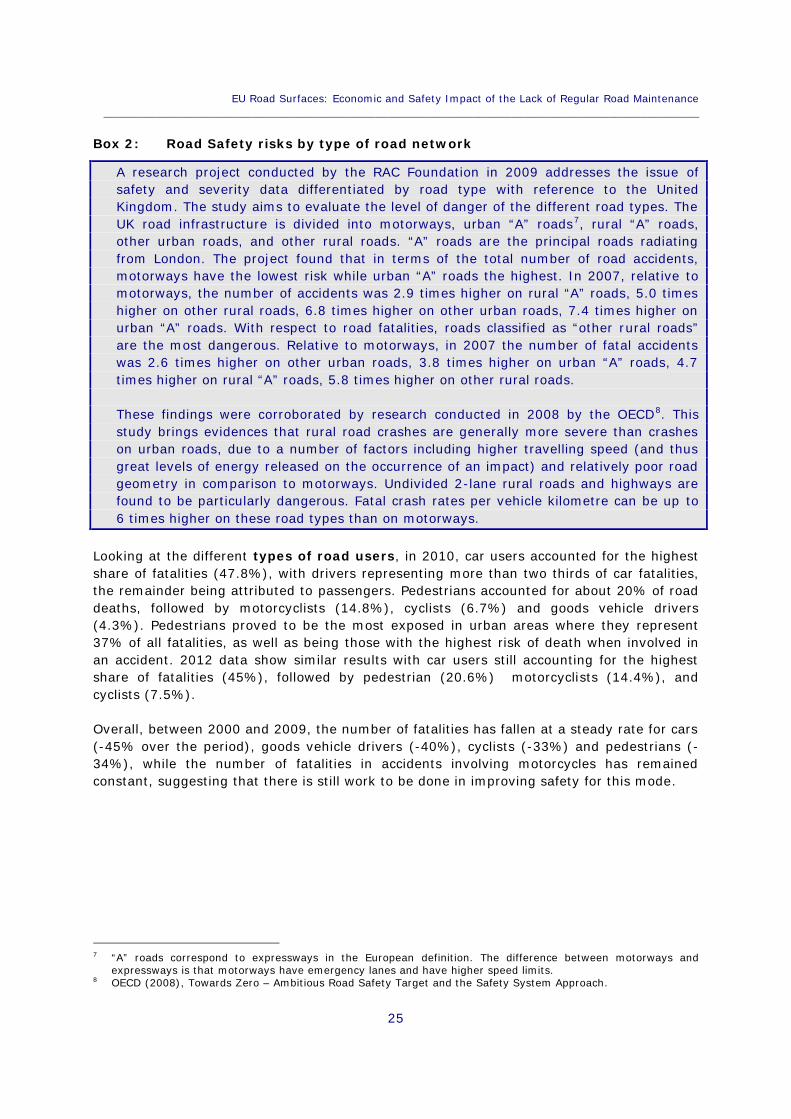
Box 2: Road Safety risks by type of road network
A research project conducted by the RAC Foundation in 2009 addresses the issue ofsafety and severity data differentiated by road type with reference to the UnitedKingdom. The study aims to evaluate the level of danger of the different road types. TheUK road infrastructure is divided into motorways, urban “A” roads7, rural “A” roads,other urban roads, and other rural roads. “A” roads are the principal roads radiatingfrom London. The project found that in terms of the total number of road accidents,motorways have the lowest risk while urban “A” roads the highest. In 2007, relative tomotorways, the number of accidents was 2.9 times higher on rural “A” roads, 5.0 timeshigher on other rural roads, 6.8 times higher on other urban roads, 7.4 times higher onurban “A” roads. With respect to road fatalities, roads classified as “other rural roads”are the most dangerous. Relative to motorways, in 2007 the number of fatal accidentswas 2.6 times higher on other urban roads, 3.8 times higher on urban “A” roads, 4.7times higher on rural “A” roads, 5.8 times higher on other rural roads.
These findings were corroborated by research conducted in 2008 by the OECD8. Thisstudy brings evidences that rural road crashes are generally more severe than crasheson urban roads, due to a number of factors including higher travelling speed (and thusgreat levels of energy released on the occurrence of an impact) and relatively poor roadgeometry in comparison to motorways. Undivided 2-lane rural roads and highways arefound to be particularly dangerous. Fatal crash rates per vehicle kilometre can be up to6 times higher on these road types than on motorways.
Looking at the different types of road users, in 2010, car users accounted for the highestshare of fatalities (47.8%), with drivers representing more than two thirds of car fatalities,the remainder being attributed to passengers. Pedestrians accounted for about 20% of roaddeaths, followed by motorcyclists (14.8%), cyclists (6.7%) and goods vehicle drivers(4.3%). Pedestrians proved to be the most exposed in urban areas where they represent37% of all fatalities, as well as being those with the highest risk of death when involved inan accident. 2012 data show similar results with car users still accounting for the highestshare of fatalities (45%), followed by pedestrian (20.6%) motorcyclists (14.4%), andcyclists (7.5%).
Overall, between 2000 and 2009, the number of fatalities has fallen at a steady rate for cars(-45% over the period), goods vehicle drivers (-40%), cyclists (-33%) and pedestrians (-34%), while the number of fatalities in accidents involving motorcycles has remainedconstant, suggesting that there is still work to be done in improving safety for this mode.
7 “A” roads correspond to expressways in the European definition. The difference between motorways andexpressways is that motorways have emergency lanes and have higher speed limits.
8 OECD (2008), Towards Zero – Ambitious Road Safety Target and the Safety System Approach.
Policy Department B: Structural and Cohesion Policies____________________________________________________________________________________________
26
2.1.2 EU road safety policy
Road safety is one of the key areas of intervention of the EU common transport policy.Building on the transport strategy set in the 2001 Transport White Paper9; in 2003 the 3rd
European Road Safety Action Programme (ERSAP)10 set the challenging goal of halvingthe number of road fatalities registered in 2001 by 2010.
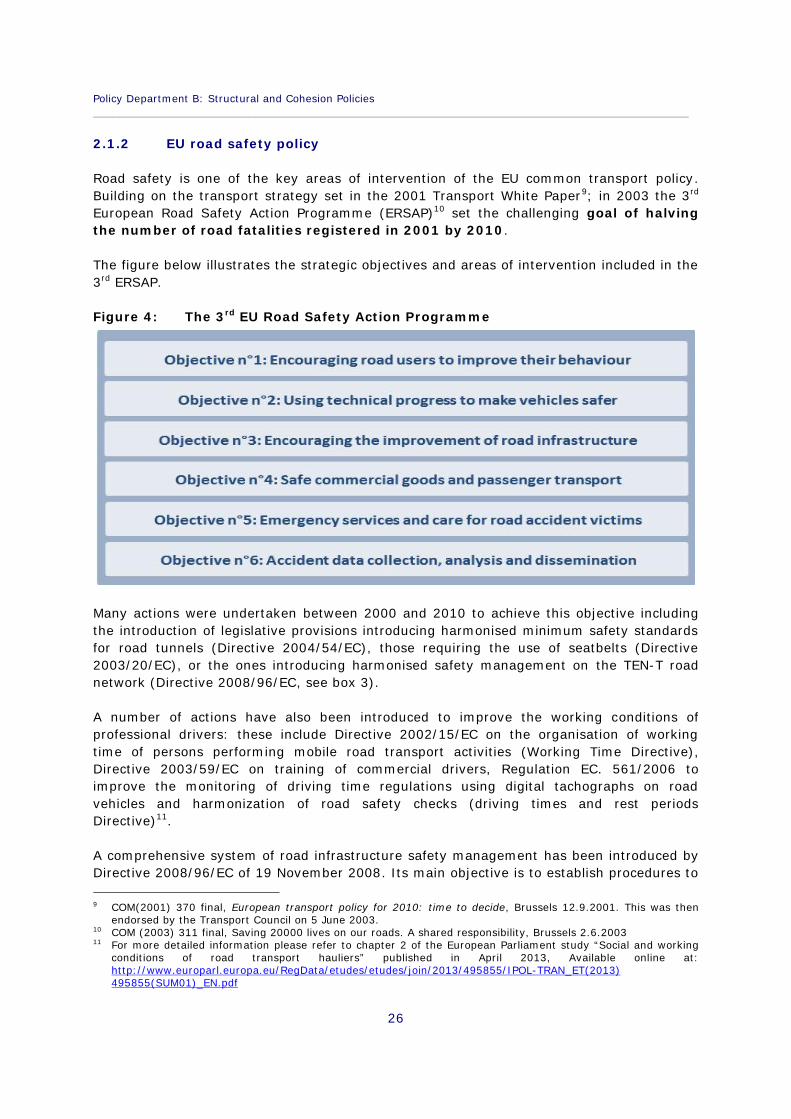
The figure below illustrates the strategic objectives and areas of intervention included in the3rd ERSAP.
Figure 4: The 3rd EU Road Safety Action Programme
Many actions were undertaken between 2000 and 2010 to achieve this objective includingthe introduction of legislative provisions introducing harmonised minimum safety standardsfor road tunnels (Directive 2004/54/EC), those requiring the use of seatbelts (Directive2003/20/EC), or the ones introducing harmonised safety management on the TEN-T roadnetwork (Directive 2008/96/EC, see box 3).
A number of actions have also been introduced to improve the working conditions ofprofessional drivers: these include Directive 2002/15/EC on the organisation of workingtime of persons performing mobile road transport activities (Working Time Directive),Directive 2003/59/EC on training of commercial drivers, Regulation EC. 561/2006 toimprove the monitoring of driving time regulations using digital tachographs on roadvehicles and harmonization of road safety checks (driving times and rest periodsDirective)11.
A comprehensive system of road infrastructure safety management has been introduced byDirective 2008/96/EC of 19 November 2008. Its main objective is to establish procedures to
9 COM(2001) 370 final, European transport policy for 2010: time to decide, Brussels 12.9.2001. This was thenendorsed by the Transport Council on 5 June 2003.
10 COM (2003) 311 final, Saving 20000 lives on our roads. A shared responsibility, Brussels 2.6.200311 For more detailed information please refer to chapter 2 of the European Parliament study “Social and working
conditions of road transport hauliers” published in April 2013, Available online at:http://www.europarl.europa.eu/RegData/etudes/etudes/join/2013/495855/IPOL-TRAN_ET(2013)495855(SUM01)_EN.pdf

EU Road Surfaces: Economic and Safety Impact of the Lack of Regular Road Maintenance____________________________________________________________________________________________
27
ensure that safety is integrated in all phases of the planning, design and operation of roadinfrastructure. It applies only to the trans-European network but MSs can extend it to otherroad types and many have done so. The Directive requires the implementation of: roadsafety impact assessments for infrastructure project at initial planning stage; compulsoryroad safety audits in all phases of planning, design and early operation of roadinfrastructure; safety ranking and management of the road network; periodic safetyinspections; data management; appointment and training of auditors. A discussion of keyfeatures of this Directive and possible areas of improvement is presented later in the studyin section 4.2.1.
While the 2010 fatality reduction target was not met, these actions have contributed to asubstantial drop in fatalities. As pointed out above, though, the situation is very differentacross the EU. In a number of cases, thanks to their commitment to enforcement (on suchthings as driving under the influence, speeding and seat belts) and investments ininfrastructure improvements (for example, to transfer high speed traffic from rural roads totrunk routes12), some countries performed much better than others. This shows theimportance of ensuring that EU policy is appropriately implemented at a national level and isaccompanied by a strong commitment and sufficient resources at national level.
At present, the EU ambition of improving safety on EU roads is still quite high and posesconsiderable challenges for the actions to be taken in the current decade.
In 2010 the Commission published policy orientations on road safety13 where it reiteratedthe objective of halving road fatalities and providing a general framework under whichconcrete action can be taken at European, national, regional or local level. Three mainprinciples guide the policy orientations:
Striving for the highest road safety standards throughout Europe by encouraging EUcitizens to take primary responsibility for their own safety and the safety of others onEU roads, and by focusing on improving the safety of more vulnerable road users;
Using an integrated approach to road safety – through cooperation with other EUpolicy areas, such as energy, environment, education, innovation and technology,and justice; and
Enforcing subsidiarity, proportionality and shared responsibility through the conceptof shared responsibility, commitment and concrete actions at all levels from EUcountries and their authorities to regional and local bodies.
Bearing in mind the importance of the contribution of national actions to meet this target –and with the intent of granting a more uniform level of road safety within the EU - in itscommunication the Commission “encourages Member States to contribute, through theirnational road safety strategy, to the achievement of the common objective, taking intoaccount their specific starting points, needs and circumstances14.
12 A trunk route is a strategic road which is the recommended route for long-distance and freight traffic.13 COM(2010) 389 final, Towards a European road safety area: policy orientations on road safety for the years
2011-2020, Brussels.14 Ibid.

Policy Department B: Structural and Cohesion Policies____________________________________________________________________________________________
28
Figure 5: EU policy orientations on road safety 2011-2020
Compared to the past, current EU policy has switched its attention to the enforcement ofroad traffic rules (Objective 2) – a task that is primarily the responsibility of single MS -through the use of modern technologies, the improvement of emergency and post-injuryservices and the protection of more vulnerable road users.
Nonetheless, vehicle and road infrastructure safety (Objectives 3 and 4) are two objectivesthat continuously appear in EU policy discussions. This can be partly explained by the factthat (i) the development of common standards and procedures in this areas match with thegeneral EU mandate of developing a true internal market for products, works and servicesand (ii) the quality of the vehicle and road infrastructure still seem to be key elements inthe prevention of road accidents, as further discussed in Section 2.2.3. In addition to thisEU policy has focused on the use of modern technology both for research purposes and in-vehicle standards (Objective 5), and for emergency and post injuries actions (Objective 6).Finally the Commission, in its communication, underlined the need to prioritize theprotection of vulnerable road users (Objective 7).

EU Road Surfaces: Economic and Safety Impact of the Lack of Regular Road Maintenance____________________________________________________________________________________________
29
2.1.3 The causes of road accidents in the EU
Since the adoption of the 3rd ERSAP, the EU has recognized that human error is the mostrecurring cause of road accidents. This derives from a general consensus that whatever thetechnical measures in place, the effectiveness of a road safety policy depends ultimately onusers’ behaviour – such as their willingness to observe driving rules or their ability to drivecarefully and have control over their vehicle.
A 2007 study funded by the EU and undertaken by the IRU investigating road accidentscausation for trucks confirms this view15.
Figure 6: Main causes of accidents involving trucks
Source: Steer Davies Gleave elaboration on IRU (2007).
The figure above shows that human factors16 were responsible for more than 85% ofaccidents causing injury. The remaining 15% were caused by technical failure (5.3%) pooror inadequate infrastructure (5.1%) and weather conditions (4.4%).
Therefore, vehicle and infrastructure characteristics have a role in ensuring roadsafety; as drivers can, and inevitably do, sometimes make mistakes, infrastructure andvehicles should be gradually improved to protect users more effectively against their ownshortcomings. This can be seen in the fact that vehicles produced today go much furtherthan previously in protecting lives. This is due to standards such as those relating toseatbelts, tyres, lights, mirrors, airbags, to name a few but also to the provision of newtechnologies that can warn and guide drivers’ behaviour.
As for infrastructure, the substantial investments aimed at improving the condition of theroad network in some EU countries have helped to improve safety. This is the case inPortugal and Ireland where the EU co-funded improvement of the quality of the roadnetwork, which in many cases also diverted traffic from national/regional roads tomotorways, has been a major contributing factor in the progress made by these twocountries. This is shown in the main transport statistics which show that while road trafficgrew by 11.8% and 14.8% in Portugal and Ireland respectively between 2001 and 2010,the number of fatalities by million inhabitants fell by 51.5% and 56.1%. A similar trend can
15 IRU (2007), A scientific study “ETAC” European Truck Accident Causation, Brussels 30.10.2006.16 For an overview of the different types of Human Functional Failures (HFF) in road accidents refer to the TRACE
research project available online at: http://www.trace-project.org/publication/archives/trace-wp5-d5-1.pdf

Policy Department B: Structural and Cohesion Policies____________________________________________________________________________________________
30
be seen in Poland where current investments on the road network have been accompaniedby an increase in traffic volumes by 69.3% and a decrease in road fatalities rates by 29.7%between 2001 and 2010.
Looking at different types of road users, poorly maintained road infrastructure increases therisk of accidents involving motorcyclists and cyclists but has a smaller impact on car or truckdrivers. This point has recently been made by the UK Royal Society for the Prevention ofAccidents, which states that motorcyclists are more susceptible to difficulties and hazardscreated by the design, construction, maintenance and surface condition of roads andstresses the importance of considering the needs and vulnerability of motorclysists andcyclists in planning the design or maintenance of roads17.
It is difficult to establish a direct link between road quality and the safety of road users, aneven more challenging task relates to understanding the extent to which investments in newroads or major repairs, on one side, and maintenance programmes, on the other side, caninfluence safety for different types of road users.
Box 3: The impact of road condition on road safety
Driver behaviour has been identified as the principal contributor to accidents, but the impactof road condition and maintenance is not negligible. In many circumstances, it is difficult todisentangle causality: there are accidents caused directly by the poor condition of the road,but there are also accidents caused by drivers’ behaviour in reaction to the condition or thedesign of the road. There is, in fact, a correlation between road quality and driverbehaviour; in some circumstances even careful drivers make poor choices as a result of thecondition of the road or their reading of the road layout.
There are different ways in which the condition of the road surface contributes to, orcompromises road safety: (i) localised anomalies, such as ruts, potholes and depressions,whose unpredictability make them dangerous for drivers; (ii) poor wheel-road contact thatfails to guarantee a sufficient skid resistance value, due to inadequate road maintenance;(iii) poor geometry and alignment design – i.e. inadequate design of the route of the road;(iv) poor level of service unable to accommodate existing traffic flows; (v) poor signage ormarkings, e.g. incomplete or missing markings and signs, and poor lighting.
Lack of regular road maintenance can exacerbate some of these factors, especially to onesrelated to the road surface condition. The purpose of road surface is to keep the vehicle onthe correct trajectory and to allow braking in wet and dry conditions.
A study conducted by the National Cooperative Highway Research Program18 (NCHRP)showed that there is a direct correlation between the number of accidents and the skidresistance value. The study shows that as pavement friction levels decrease, there is acorresponding increase in crash rates. Another study conducted by the Swedish NationalRoad and Transport Research Institute19 reinforces the theory that accidents increase inslippery conditions.
17 http://www.rospa.com/roadsafety/policy/statements/motorcycling.aspx18 National Cooperative Highway Research Program (NCHRP) (2009), “Guide for Pavement Friction” USA.19 Swedish National Road and Transport Research Institute (2004), “The Influence of Road Surface Condition on
Traffic Safety and Ride Comfort”, 6th International Conference on Managing Pavements.
EU Road Surfaces: Economic and Safety Impact of the Lack of Regular Road Maintenance____________________________________________________________________________________________
31
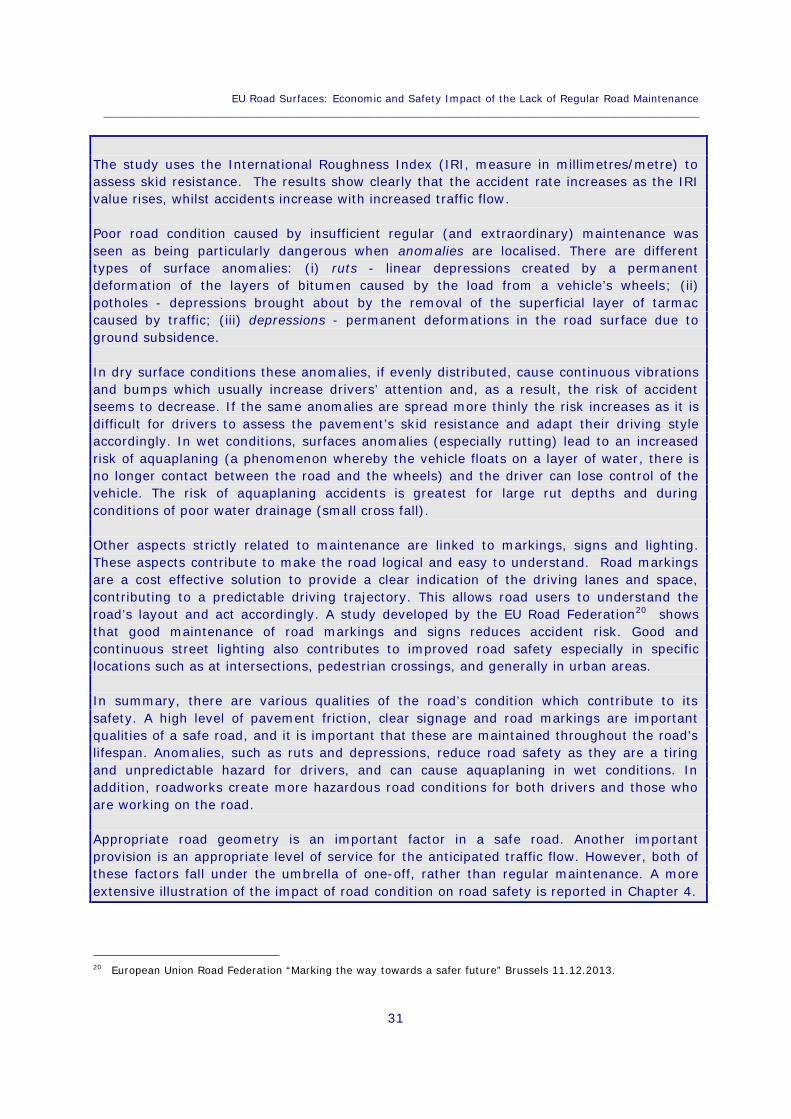
The study uses the International Roughness Index (IRI, measure in millimetres/metre) toassess skid resistance. The results show clearly that the accident rate increases as the IRIvalue rises, whilst accidents increase with increased traffic flow.
Poor road condition caused by insufficient regular (and extraordinary) maintenance wasseen as being particularly dangerous when anomalies are localised. There are differenttypes of surface anomalies: (i) ruts - linear depressions created by a permanentdeformation of the layers of bitumen caused by the load from a vehicle’s wheels; (ii)potholes - depressions brought about by the removal of the superficial layer of tarmaccaused by traffic; (iii) depressions - permanent deformations in the road surface due toground subsidence.
In dry surface conditions these anomalies, if evenly distributed, cause continuous vibrationsand bumps which usually increase drivers’ attention and, as a result, the risk of accidentseems to decrease. If the same anomalies are spread more thinly the risk increases as it isdifficult for drivers to assess the pavement’s skid resistance and adapt their driving styleaccordingly. In wet conditions, surfaces anomalies (especially rutting) lead to an increasedrisk of aquaplaning (a phenomenon whereby the vehicle floats on a layer of water, there isno longer contact between the road and the wheels) and the driver can lose control of thevehicle. The risk of aquaplaning accidents is greatest for large rut depths and duringconditions of poor water drainage (small cross fall).
Other aspects strictly related to maintenance are linked to markings, signs and lighting.These aspects contribute to make the road logical and easy to understand. Road markingsare a cost effective solution to provide a clear indication of the driving lanes and space,contributing to a predictable driving trajectory. This allows road users to understand theroad’s layout and act accordingly. A study developed by the EU Road Federation20 showsthat good maintenance of road markings and signs reduces accident risk. Good andcontinuous street lighting also contributes to improved road safety especially in specificlocations such as at intersections, pedestrian crossings, and generally in urban areas.
In summary, there are various qualities of the road’s condition which contribute to itssafety. A high level of pavement friction, clear signage and road markings are importantqualities of a safe road, and it is important that these are maintained throughout the road’slifespan. Anomalies, such as ruts and depressions, reduce road safety as they are a tiringand unpredictable hazard for drivers, and can cause aquaplaning in wet conditions. Inaddition, roadworks create more hazardous road conditions for both drivers and those whoare working on the road.
Appropriate road geometry is an important factor in a safe road. Another importantprovision is an appropriate level of service for the anticipated traffic flow. However, both ofthese factors fall under the umbrella of one-off, rather than regular maintenance. A moreextensive illustration of the impact of road condition on road safety is reported in Chapter 4.
20 European Union Road Federation “Marking the way towards a safer future” Brussels 11.12.2013.

Policy Department B: Structural and Cohesion Policies____________________________________________________________________________________________
32
We have identified a broad consensus on the approach to be adopted at policy level toimprove the safety of new and existing roads, as part of a wider strategy targeted atreducing road deaths and accidents. The latest European Commission as well as the OECDroad safety strategy orientations21, indicate that the approach needs to be founded on thefollowing pillars:
Presence of accurate and reliable data to be used to assess the results and identifyareas of intervention;
Establishment of a context of shared responsibility, commitment and concreteactions, at the different levels of intervention (e.g. European authorities, MemberStates, regional and local bodies) and involving the various actors (e.g. roaddevelopers, infrastructure managers, civil society, etc.);
Recourse to an appropriate design for each road type to minimise the probability ofaccidents occurring and to mitigate injury severity accompanied by the existence ofa robust system of road safety audits;
Use of maintenance and infrastructure safety investment programmes based onprocedures for funding allocation and project selection able to prioritiseinterventions that can tackle safety risks in the most efficient and effective way.
While the first three points listed above have been put on the agenda of road safety policyfor some years now, it is only in recent years that the last point is emerging with moreurgency. This has become more important as the 2008 economic and financial crisis hasput at risk the availability of resources dedicated to road maintenance andinvestment works in some countries. In its resolution issued on the 27th September 2011on European road safety 2011-2020, while commenting on a number of aspects of theCommission road safety strategy22, the European Parliament stressed the importance of awell-preserved road infrastructure to contribute to reducing fatalities and injuries of roadusers. The resolution calls on the Member States to preserve and develop their roadinfrastructure through regular maintenance and innovative methods such as intelligent roadmarkings that display safety distances and the direction of travel, and passively safe roadinfrastructure. It also stresses that regulations for signposting, in particular regarding roadworks, must be respected as they are crucial for a high level of road safety23.
The evolution of road expenditure trends before and after the economic and financial crisisis looked at in more detail in the following chapter.
21 See COM(2010) 389 final, Towards a European road safety area: policy orientations on road safety for theyears 2011-2020, Brussels and OECD (2008), Towards Zero – Ambitious Road Safety Target and the SafetySystem Approach.
22 COM(2010) 389 final.23 See European Parliament resolution of 27 September 2011 on European road safety 2011-2020
(2010/2235(INI)), P7_TA(2011)0408.
EU Road Surfaces: Economic and Safety Impact of the Lack of Regular Road Maintenance____________________________________________________________________________________________
33
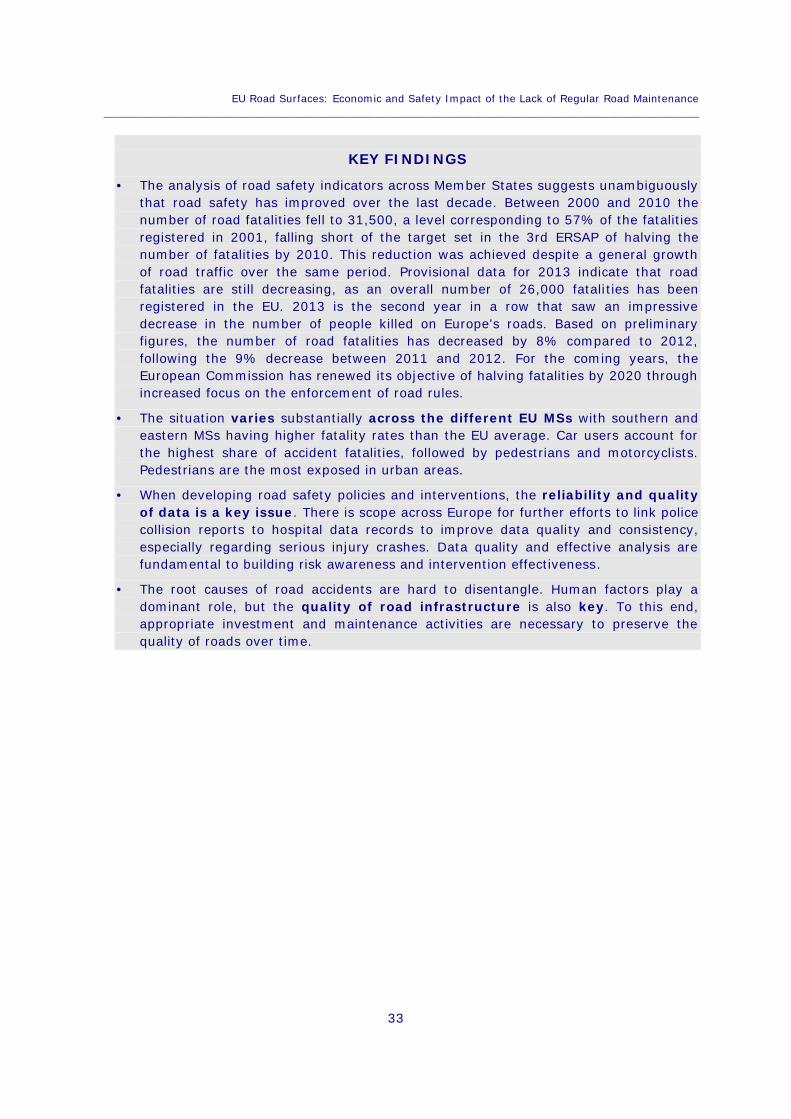
KEY FINDINGS
The analysis of road safety indicators across Member States suggests unambiguouslythat road safety has improved over the last decade. Between 2000 and 2010 thenumber of road fatalities fell to 31,500, a level corresponding to 57% of the fatalitiesregistered in 2001, falling short of the target set in the 3rd ERSAP of halving thenumber of fatalities by 2010. This reduction was achieved despite a general growthof road traffic over the same period. Provisional data for 2013 indicate that roadfatalities are still decreasing, as an overall number of 26,000 fatalities has beenregistered in the EU. 2013 is the second year in a row that saw an impressivedecrease in the number of people killed on Europe's roads. Based on preliminaryfigures, the number of road fatalities has decreased by 8% compared to 2012,following the 9% decrease between 2011 and 2012. For the coming years, theEuropean Commission has renewed its objective of halving fatalities by 2020 throughincreased focus on the enforcement of road rules.
The situation varies substantially across the different EU MSs with southern andeastern MSs having higher fatality rates than the EU average. Car users account forthe highest share of accident fatalities, followed by pedestrians and motorcyclists.Pedestrians are the most exposed in urban areas.
When developing road safety policies and interventions, the reliability and qualityof data is a key issue. There is scope across Europe for further efforts to link policecollision reports to hospital data records to improve data quality and consistency,especially regarding serious injury crashes. Data quality and effective analysis arefundamental to building risk awareness and intervention effectiveness.
The root causes of road accidents are hard to disentangle. Human factors play adominant role, but the quality of road infrastructure is also key. To this end,appropriate investment and maintenance activities are necessary to preserve thequality of roads over time.

Policy Department B: Structural and Cohesion Policies____________________________________________________________________________________________
34

EU Road Surfaces: Economic and Safety Impact of the Lack of Regular Road Maintenance____________________________________________________________________________________________
35
ROAD MAINTENANCE EXPENDITURE IN THE EU3.
3.1 Introduction
This chapter provides an overview of the recent trends in road maintenance expenditure inthe EU and analyses in detail the data available on investment and maintenance spending inroad infrastructure. Road maintenance expenditure data is also assessed against overalleconomic performance of the EU to investigate whether the ongoing economic and financialcrisis started in 2008 has had an impact on the amount of resources targeted at themaintenance of road infrastructure in the EU.
3.1.1 Data availability
The collection of homogeneous and accurate information on road maintenance andinvestment expenditure across the different MS is difficult as the degree of homogeneity ofdata is minimal, leading to an imperfect dataset. First, the fact that roads are administereddifferently in different MSs means that the responsibility for keeping the different sections ofthe road network (e.g. national, regional or local roads) at acceptable standards is assignedto numerous bodies, such as national ministries, regional or local authorities, etc. In manycases, in particularly for administrations in charge of local roads, authorities may not havethe resources to accurately record the budget allocated and/or spent, making it difficult tocollect relevant and useful information. Secondly, the definition of road maintenance andinvestment activities is not always clear (see box below) making it problematic to detectexactly what needs to be recorded in each of the two categories, creating discrepancies inthe way data is reported across the different MSs.
To date the most accurate international dataset that collects information on roadmaintenance and investment data is the one produced by the Organisation for Economic Co-operation and Development (OECD) – through the International Transport Forum (ITF). Theanalysis reported in this chapter is thus primarily based on public information provided inthe recently issued ITF publication (2013) on spending trends between 1995 and 2011.
Before discussing this data it is important to explain the assumptions that underpin the ITFdatabase. The first one regards the definitions of maintenance and investment expenditureat the basis of the collected data. The ITF collects road maintenenance and investmentexpenditure data following the definitions provided by the the United Nations System ofNational Accounts (see Box 4).
These definitions, however, are not currently implemented uniformely across MSs and theITF is engaged in discussions with national road authorities, working towards thestandardisation of these definitions. This implies that the ITF data used for the analysis oftrends in this chapter is not necessarily consistent among Member States. At the same time,there is no harmonised approach across countries on the type of road expenditure datareported, as the data provided by each MS refers to different sections (national, regional,local) of their road network. Finally, data for a number of countries – including some EU

Policy Department B: Structural and Cohesion Policies____________________________________________________________________________________________
36
MSs24 – is missing within the ITF dataset. Despite these limitations it is important to pointout that there is consistency in the time series statistics within single countries and ageneral convergence on the adoption of the same definition for maintenance and investmentactivities. To overcome some of these limitations, in some cases25 the data has beensupplemented by other evidence on relevant indicators such as asphalt production ormaintenance expenditure data provided by stakeholders such as the European AsphaltPavement Association (EAPA) and the Professional Association of Operators of Toll RoadInfrastructures (ASECAP), or added to by relevant national data sources.
Box 4: Definition of investment and maintenance in the road sector
International Transport Forum (ITF) delineation of investment andmaintenance expenditure
When considering the delineation of transport infrastructure spending, the distinctionbetween fixed capital formation and intermediate consumption is important. The newpurchase, or original production, of a new structure is a clear case of investment, whilemaintenance expenditure is less clear. Repairs and ordinary maintenance should benoted as intermediate consumption; major reconstructions, renovations or extensionsshould be recorded as investment. The difference between investment and maintenanceis defined as follows by the United Nations System of National Accounts (SNA):
“Ordinary maintenance and repairs are distinguished by two features:
a. They are activities that owners or users of fixed assets are obliged to undertakeperiodically in order to be able to utilize such assets over their expected service lives.[…] The owner or user cannot afford to neglect maintenance and repairs as the expectedservice life may be drastically shortened otherwise;
b. Maintenance and repairs do not change the fixed asset or its performance, but simplymaintain it in good working order or restore it to its previous condition in the event of abreakdown. Defective parts are replaced by new parts of the same kind withoutchanging the basic nature of the fixed asset” (SNA, para. 6.228).
“On the other hand, major renovations or enlargements to fixed assets are distinguishedby the following features:
a. The decision to renovate, reconstruct or enlarge a fixed asset is a deliberateinvestment decision that may be undertaken at any time and is not dictated by thecondition of the asset. Major renovations of equipment, buildings or other structures arefrequently undertaken well before the end of their normal service lives;
b. Major renovations or enlargements increase the performance or capacity of existingfixed assets or significantly extend their previously expected service lives. Enlarging orextending an existing building or structure obviously constitutes a major change in thissense, but a complete refitting or restructuring of the interior of a building also qualifies”(SNA, para. 6.229).
24 See Table 1 on page 37.25 See Table 1.
EU Road Surfaces: Economic and Safety Impact of the Lack of Regular Road Maintenance____________________________________________________________________________________________
37
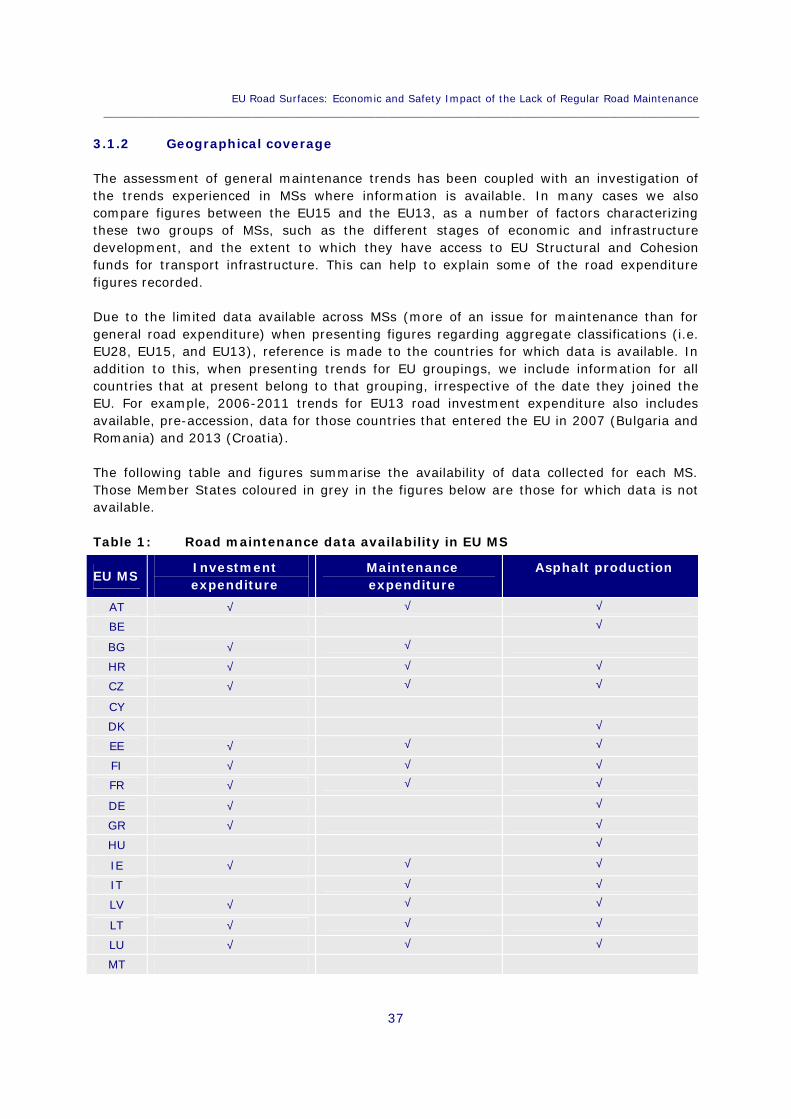
3.1.2 Geographical coverage
The assessment of general maintenance trends has been coupled with an investigation ofthe trends experienced in MSs where information is available. In many cases we alsocompare figures between the EU15 and the EU13, as a number of factors characterizingthese two groups of MSs, such as the different stages of economic and infrastructuredevelopment, and the extent to which they have access to EU Structural and Cohesionfunds for transport infrastructure. This can help to explain some of the road expenditurefigures recorded.
Due to the limited data available across MSs (more of an issue for maintenance than forgeneral road expenditure) when presenting figures regarding aggregate classifications (i.e.EU28, EU15, and EU13), reference is made to the countries for which data is available. Inaddition to this, when presenting trends for EU groupings, we include information for allcountries that at present belong to that grouping, irrespective of the date they joined theEU. For example, 2006-2011 trends for EU13 road investment expenditure also includesavailable, pre-accession, data for those countries that entered the EU in 2007 (Bulgaria andRomania) and 2013 (Croatia).
The following table and figures summarise the availability of data collected for each MS.Those Member States coloured in grey in the figures below are those for which data is notavailable.
Table 1: Road maintenance data availability in EU MS
EU MS Investmentexpenditure
Maintenanceexpenditure
Asphalt production
AT √ √ √
BE √
BG √ √
HR √ √ √
CZ √ √ √
CYDK √
EE √ √ √
FI √ √ √
FR √ √ √
DE √ √
GR √ √
HU √
IE √ √ √
IT √ √
LV √ √ √
LT √ √ √
LU √ √ √
MT

Policy Department B: Structural and Cohesion Policies____________________________________________________________________________________________
38
EU MS Investmentexpenditure
Maintenanceexpenditure
Asphalt production
NL √ √ √
PO √ √ √
PT √
RO √ √
SK √ √ √
SI √ √ √
ES √ √ √
SE √ √ √
UK √ √ √
Figure 7: Available data on investment expenditure in the EU
Source: SDG elaboration.
EU Road Surfaces: Economic and Safety Impact of the Lack of Regular Road Maintenance____________________________________________________________________________________________
39
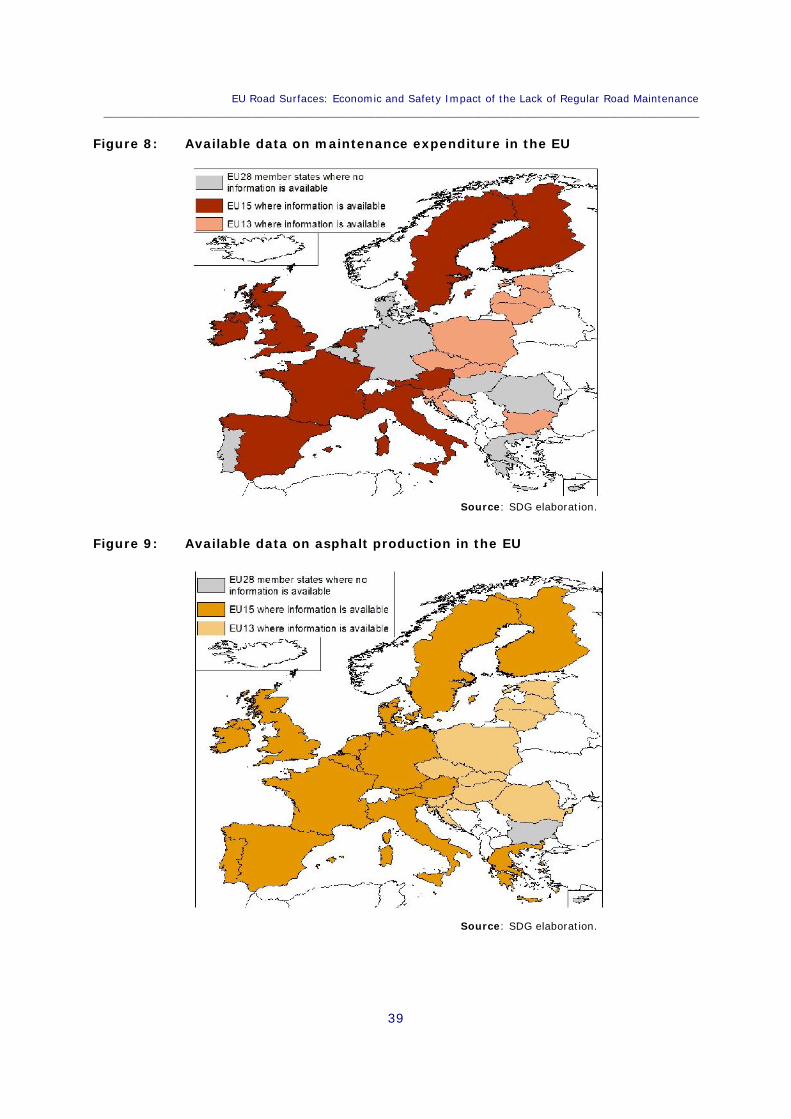
Figure 8: Available data on maintenance expenditure in the EU
Source: SDG elaboration.
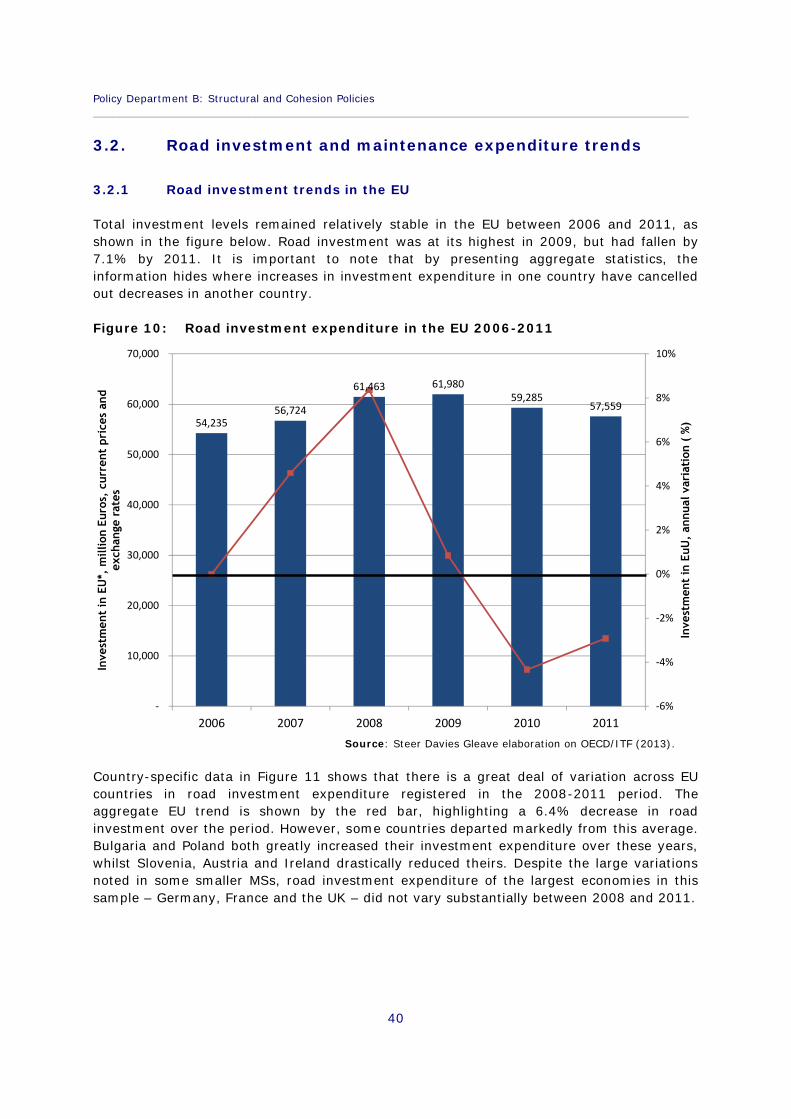
Figure 9: Available data on asphalt production in the EU
Source: SDG elaboration.
Policy Department B: Structural and Cohesion Policies____________________________________________________________________________________________
40
3.2. Road investment and maintenance expenditure trends
3.2.1 Road investment trends in the EU
Total investment levels remained relatively stable in the EU between 2006 and 2011, asshown in the figure below. Road investment was at its highest in 2009, but had fallen by7.1% by 2011. It is important to note that by presenting aggregate statistics, theinformation hides where increases in investment expenditure in one country have cancelledout decreases in another country.
Figure 10: Road investment expenditure in the EU 2006-2011
Source: Steer Davies Gleave elaboration on OECD/ITF (2013).
Country-specific data in Figure 11 shows that there is a great deal of variation across EUcountries in road investment expenditure registered in the 2008-2011 period. Theaggregate EU trend is shown by the red bar, highlighting a 6.4% decrease in roadinvestment over the period. However, some countries departed markedly from this average.Bulgaria and Poland both greatly increased their investment expenditure over these years,whilst Slovenia, Austria and Ireland drastically reduced theirs. Despite the large variationsnoted in some smaller MSs, road investment expenditure of the largest economies in thissample – Germany, France and the UK – did not vary substantially between 2008 and 2011.
54,23556,724
61,463 61,98059,285
57,559
-6%
-4%
-2%
0%
2%
4%
6%
8%
10%
-
10,000
20,000
30,000
40,000
50,000
60,000
70,000
2006 2007 2008 2009 2010 2011
Inve
stm
ent
in E
uU,
annu
al v
aria
tion
( %
)
Inve
stm
ent
in E
U*,
mill
ion
Euro
s, c
urre
nt p
rice
s an
dex
chan
ge r
ates
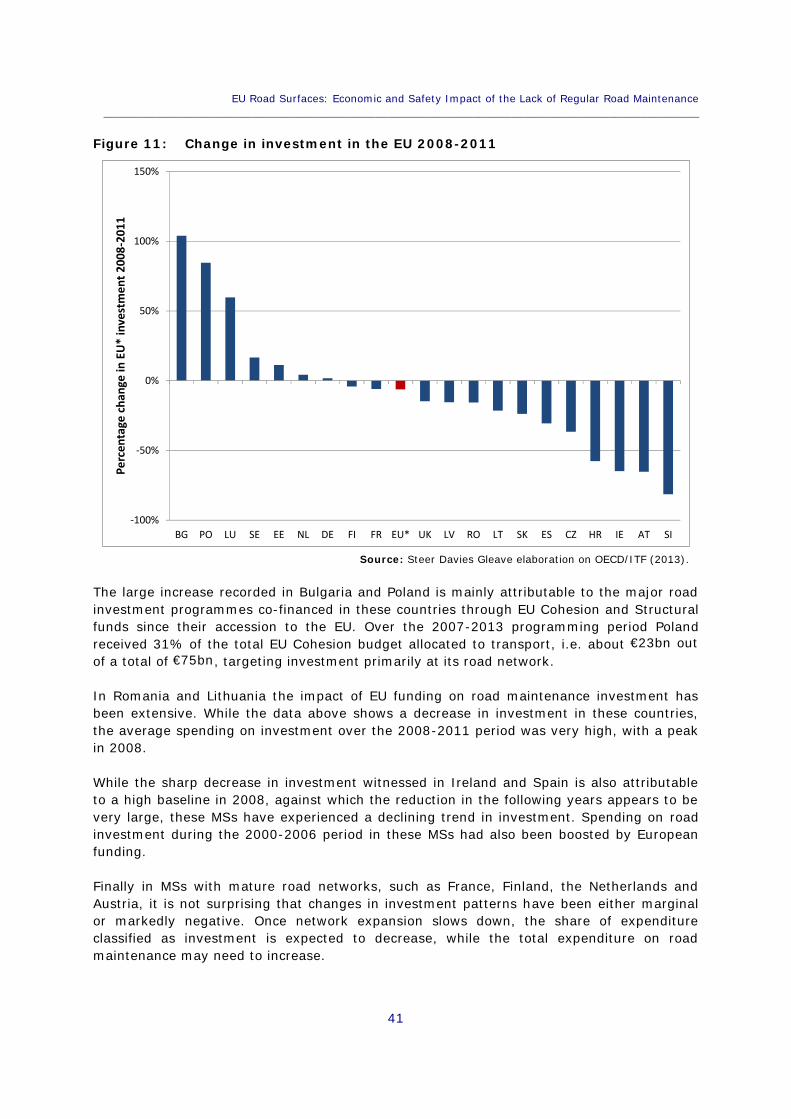
EU Road Surfaces: Economic and Safety Impact of the Lack of Regular Road Maintenance____________________________________________________________________________________________
41
Figure 11: Change in investment in the EU 2008-2011
Source: Steer Davies Gleave elaboration on OECD/ITF (2013).
The large increase recorded in Bulgaria and Poland is mainly attributable to the major roadinvestment programmes co-financed in these countries through EU Cohesion and Structuralfunds since their accession to the EU. Over the 2007-2013 programming period Polandreceived 31% of the total EU Cohesion budget allocated to transport, i.e. about €23bn outof a total of €75bn, targeting investment primarily at its road network.
In Romania and Lithuania the impact of EU funding on road maintenance investment hasbeen extensive. While the data above shows a decrease in investment in these countries,the average spending on investment over the 2008-2011 period was very high, with a peakin 2008.
While the sharp decrease in investment witnessed in Ireland and Spain is also attributableto a high baseline in 2008, against which the reduction in the following years appears to bevery large, these MSs have experienced a declining trend in investment. Spending on roadinvestment during the 2000-2006 period in these MSs had also been boosted by Europeanfunding.
Finally in MSs with mature road networks, such as France, Finland, the Netherlands andAustria, it is not surprising that changes in investment patterns have been either marginalor markedly negative. Once network expansion slows down, the share of expenditureclassified as investment is expected to decrease, while the total expenditure on roadmaintenance may need to increase.
-100%
-50%
0%
50%
100%
150%
BG PO LU SE EE NL DE FI FR EU* UK LV RO LT SK ES CZ HR IE AT SI
Perc
enta
ge c
hang
e in
EU
* in
vest
men
t 200
8-20
11
Policy Department B: Structural and Cohesion Policies____________________________________________________________________________________________
42
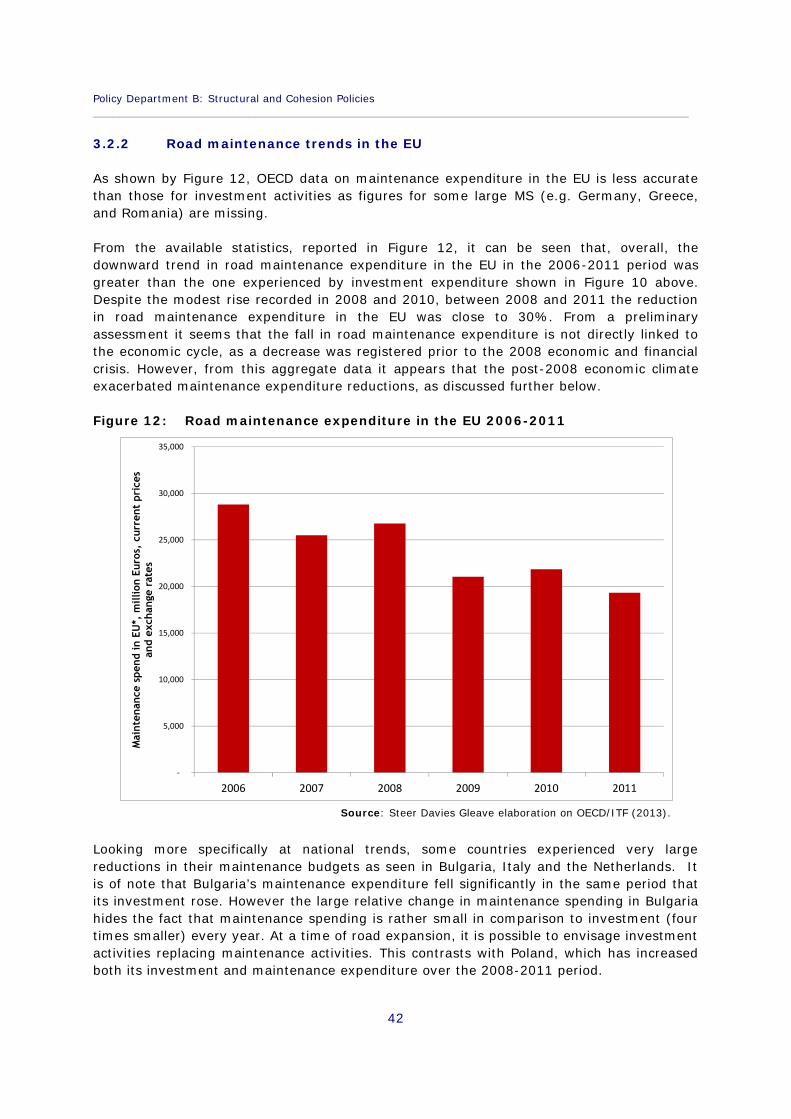
3.2.2 Road maintenance trends in the EU
As shown by Figure 12, OECD data on maintenance expenditure in the EU is less accuratethan those for investment activities as figures for some large MS (e.g. Germany, Greece,and Romania) are missing.
From the available statistics, reported in Figure 12, it can be seen that, overall, thedownward trend in road maintenance expenditure in the EU in the 2006-2011 period wasgreater than the one experienced by investment expenditure shown in Figure 10 above.Despite the modest rise recorded in 2008 and 2010, between 2008 and 2011 the reductionin road maintenance expenditure in the EU was close to 30%. From a preliminaryassessment it seems that the fall in road maintenance expenditure is not directly linked tothe economic cycle, as a decrease was registered prior to the 2008 economic and financialcrisis. However, from this aggregate data it appears that the post-2008 economic climateexacerbated maintenance expenditure reductions, as discussed further below.
Figure 12: Road maintenance expenditure in the EU 2006-2011
Source: Steer Davies Gleave elaboration on OECD/ITF (2013).
Looking more specifically at national trends, some countries experienced very largereductions in their maintenance budgets as seen in Bulgaria, Italy and the Netherlands. Itis of note that Bulgaria’s maintenance expenditure fell significantly in the same period thatits investment rose. However the large relative change in maintenance spending in Bulgariahides the fact that maintenance spending is rather small in comparison to investment (fourtimes smaller) every year. At a time of road expansion, it is possible to envisage investmentactivities replacing maintenance activities. This contrasts with Poland, which has increasedboth its investment and maintenance expenditure over the 2008-2011 period.
-
5,000
10,000
15,000
20,000
25,000
30,000
35,000
2006 2007 2008 2009 2010 2011
Mai
nten
ance
spe
nd in
EU
*, m
illio
n Eu
ros,
cur
rent
pri
ces
and
exch
ange
rat
es
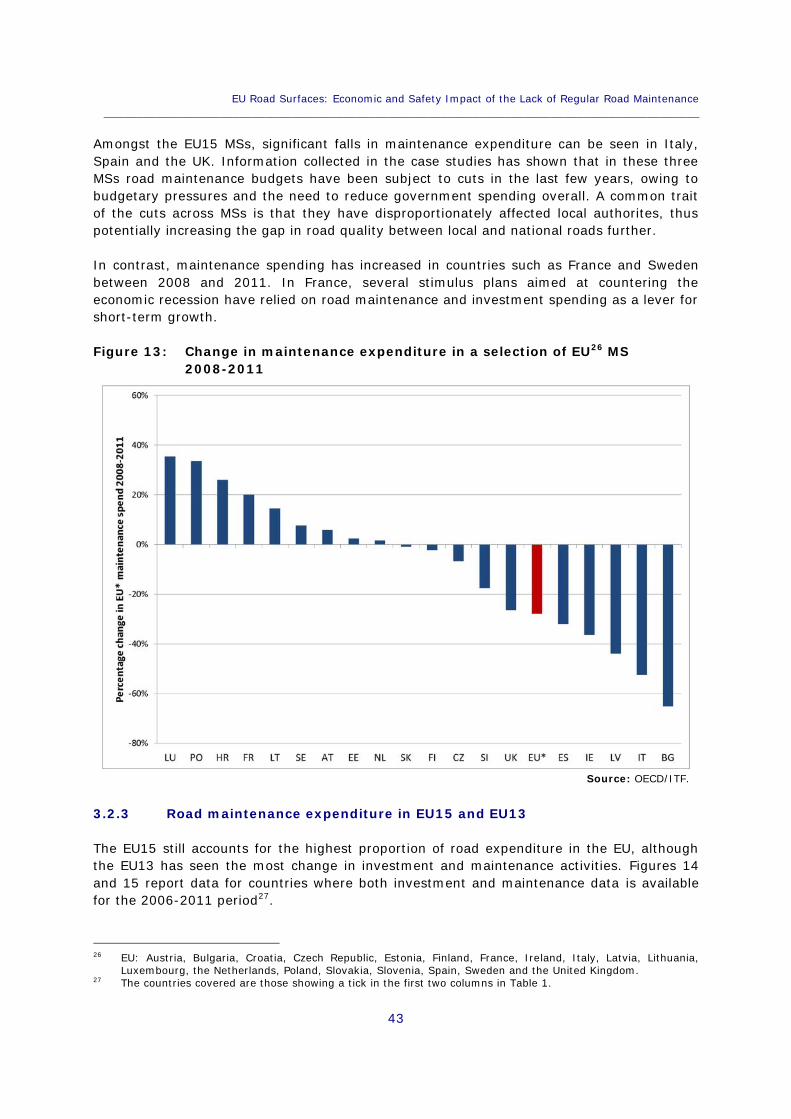
EU Road Surfaces: Economic and Safety Impact of the Lack of Regular Road Maintenance____________________________________________________________________________________________
43
Amongst the EU15 MSs, significant falls in maintenance expenditure can be seen in Italy,Spain and the UK. Information collected in the case studies has shown that in these threeMSs road maintenance budgets have been subject to cuts in the last few years, owing tobudgetary pressures and the need to reduce government spending overall. A common traitof the cuts across MSs is that they have disproportionately affected local authorites, thuspotentially increasing the gap in road quality between local and national roads further.
In contrast, maintenance spending has increased in countries such as France and Swedenbetween 2008 and 2011. In France, several stimulus plans aimed at countering theeconomic recession have relied on road maintenance and investment spending as a lever forshort-term growth.
Figure 13: Change in maintenance expenditure in a selection of EU26 MS2008-2011
Source: OECD/ITF.
3.2.3 Road maintenance expenditure in EU15 and EU13
The EU15 still accounts for the highest proportion of road expenditure in the EU, althoughthe EU13 has seen the most change in investment and maintenance activities. Figures 14and 15 report data for countries where both investment and maintenance data is availablefor the 2006-2011 period27.
26 EU: Austria, Bulgaria, Croatia, Czech Republic, Estonia, Finland, France, Ireland, Italy, Latvia, Lithuania,Luxembourg, the Netherlands, Poland, Slovakia, Slovenia, Spain, Sweden and the United Kingdom.
27 The countries covered are those showing a tick in the first two columns in Table 1.
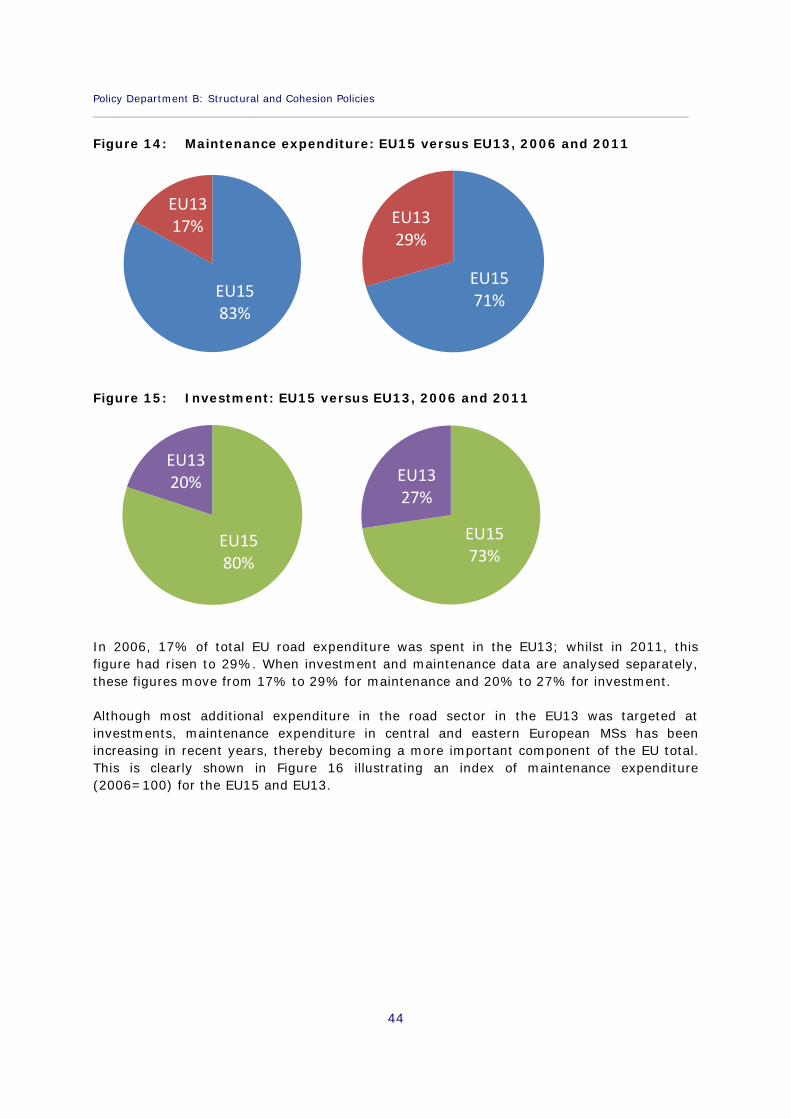
Policy Department B: Structural and Cohesion Policies____________________________________________________________________________________________
44
Figure 14: Maintenance expenditure: EU15 versus EU13, 2006 and 2011
Figure 15: Investment: EU15 versus EU13, 2006 and 2011
In 2006, 17% of total EU road expenditure was spent in the EU13; whilst in 2011, thisfigure had risen to 29%. When investment and maintenance data are analysed separately,these figures move from 17% to 29% for maintenance and 20% to 27% for investment.
Although most additional expenditure in the road sector in the EU13 was targeted atinvestments, maintenance expenditure in central and eastern European MSs has beenincreasing in recent years, thereby becoming a more important component of the EU total.This is clearly shown in Figure 16 illustrating an index of maintenance expenditure(2006=100) for the EU15 and EU13.
EU1583%
EU1317%
EU1571%
EU1329%
EU1580%
EU1320%
EU1573%
EU1327%
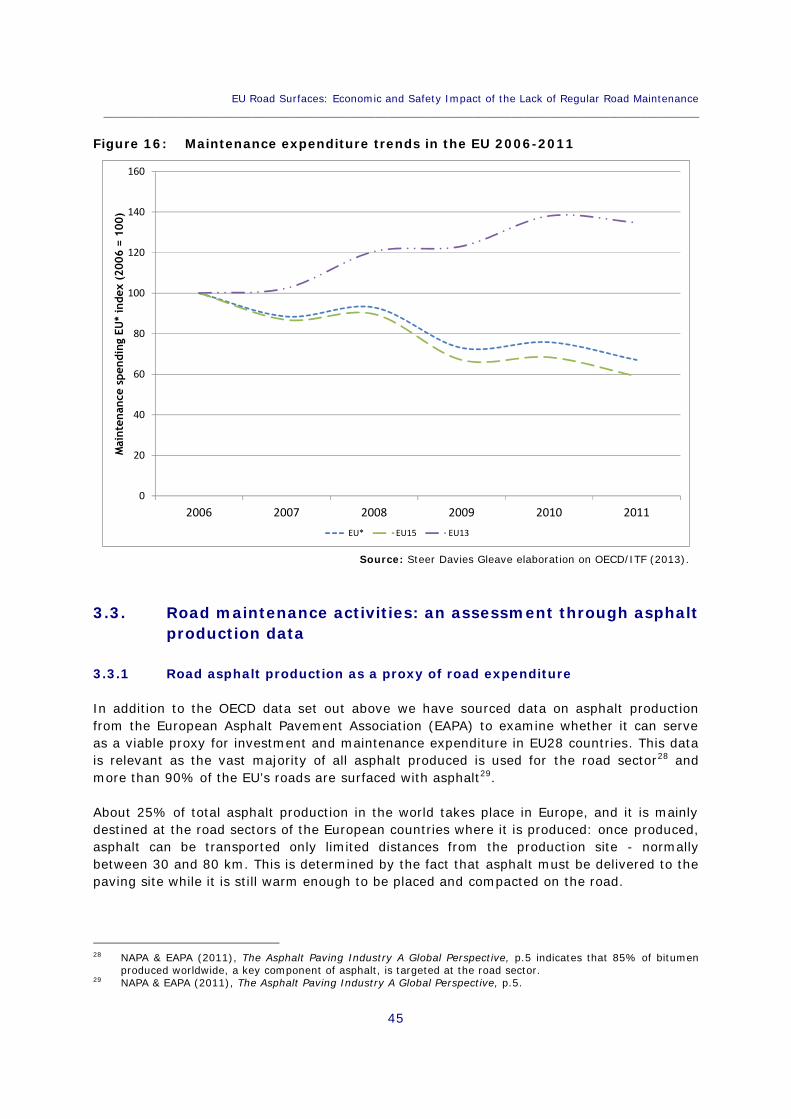
EU Road Surfaces: Economic and Safety Impact of the Lack of Regular Road Maintenance____________________________________________________________________________________________
45
Figure 16: Maintenance expenditure trends in the EU 2006-2011
Source: Steer Davies Gleave elaboration on OECD/ITF (2013).
3.3. Road maintenance activities: an assessment through asphaltproduction data
3.3.1 Road asphalt production as a proxy of road expenditure
In addition to the OECD data set out above we have sourced data on asphalt productionfrom the European Asphalt Pavement Association (EAPA) to examine whether it can serveas a viable proxy for investment and maintenance expenditure in EU28 countries. This datais relevant as the vast majority of all asphalt produced is used for the road sector28 andmore than 90% of the EU’s roads are surfaced with asphalt29.
About 25% of total asphalt production in the world takes place in Europe, and it is mainlydestined at the road sectors of the European countries where it is produced: once produced,asphalt can be transported only limited distances from the production site - normallybetween 30 and 80 km. This is determined by the fact that asphalt must be delivered to thepaving site while it is still warm enough to be placed and compacted on the road.
28 NAPA & EAPA (2011), The Asphalt Paving Industry A Global Perspective, p.5 indicates that 85% of bitumenproduced worldwide, a key component of asphalt, is targeted at the road sector.
29 NAPA & EAPA (2011), The Asphalt Paving Industry A Global Perspective, p.5.
0
20
40
60
80
100
120
140
160
2006 2007 2008 2009 2010 2011
Mai
nten
ance
spe
ndin
g EU
* in
dex
(200
6 =
100)
EU* EU15 EU13

Policy Department B: Structural and Cohesion Policies____________________________________________________________________________________________
46
From the above it can be seen that the level of road investment and maintenance worksundertaken in a country is highly correlated to the amount of asphalt produced in the sameyear in its production plants, as the possibility of importing/exporting asphalt is limited. Thisimplies that asphalt production of a single EU MS can be used as a proxy for consumption,and hence for the overall level of road works in each MS. This data however cannot indicatewhether this consumption is attributable to investment or maintenance activities on theroad network. However, some conclusions can be drawn with appropriate assumptions.
Total asphalt production in EU countries fell almost every year, and by a total of 27.8% overthe 2007-2012 period as shown in Figures 17 and 18.
Figure 17: Asphalt production in the EU: 2007-2012
Source: Steer Davies Gleave elaboration on EAPA (2013).
0
50
100
150
200
250
300
350
2007 2008 2009 2010 2011 2012
Prod
uctio
n of
Asp
halt
in E
U*, m
illio
n to
nnes

EU Road Surfaces: Economic and Safety Impact of the Lack of Regular Road Maintenance____________________________________________________________________________________________
47
Figure 18: Change in asphalt production in EU MSs: 2007-2012
Source: Steer Davies Gleave elaboration on EAPA (2013).
At a national level, Greece, Spain, Slovenia, Ireland and Italy experienced the greatest fallsin asphalt production since 2008: this seem to suggest that investment and maintenanceactivities have decreased significantly in these MSs. In contrast, Belgium, Poland andDenmark increased production over the same period.
Comparing asphalt production data with the extension of the road network highlightswhether variations in asphalt production are driven primarily by changes in the level ofinvestment or are mainly attributable to a variation in the extent of road maintenanceactivities. The former seems to be the case of Poland, where there has been significant roadinvestment in recent years. The latter is certainly the case in countries such as Spain andItaly, where the size of road network has remained stable since 2007, while the productionof asphalt has fallen significantly.
The analysis of asphalt data reveals similar trends to those identified in the analysis of roadexpenditure. On the one hand, MSs where an increase in asphalt production has beenrecorded also tend to be the ones where total spending on roads has not decreased (e.g.Poland, Luxembourg). Conversely, the decrease in asphalt production witnessed in MSs suchas Spain, Ireland, Italy and the UK is in line with a reduction in road maintenance andparticularly in investment in these countries with developed road networks.
24%
17%
9%
2% 0% 0% 0%
-10%-14%
-17%-20% -20%
-24% -24% -24% -24%-27% -28% -28% -29%
-32%
-42% -42%-48%
-61%
-80%
-100%
-80%
-60%
-40%
-20%
0%
20%
40%
BE PO DK LU LV RO SK NL SK FR DE CZ LT FI AT HU EE EU* UK PT HR IT IE SI ES GR
Perc
enta
ge c
hang
e EU
* in
asp
halt
pro
duct
ion
2007
-201
2

Policy Department B: Structural and Cohesion Policies____________________________________________________________________________________________
48
Table 2: Asphalt production, investment and maintenance expenditure (2007-12)
Asphalt production Investment Mainteinanceexpenditure
Belgium 24%
Poland 17% 85% 34%
Denmark 9%
Luxembourg 2% 60% 35%
Latvia 0% -15% -44%
Romania 0% -16%
Sweden 0% 17% 8%
Netherlands -10% 4% 2%
Slovakia -14% -24% -1%
France -17% -6% 20%
Germany -20% 2%
Czech Republic -20% -37% -7%
Lithuania -24% -21% 15%
Finland -24% -4% -2%
Austria -24% -65% 6%
Hungary -24%
Estonia -27% 11% 2%
United Kingdom -28% -15% -26%
Portugal -29%
Croatia -32% -58% 26%
Italy -42% -52%
Ireland -42% -65% -36%
Slovenia -48% -82% -18%
Spain -61% -31% -32%
Greece -80% 5%
Bulgaria 104% -65%
Cyprus
Malta
Legend:
Positive variation (more than 30%) Negative variation (more than 30%)Positive variation (less than 30%) Negative variation (less than 30%)No variation Unavailable data
Source: SDG elaboration.

EU Road Surfaces: Economic and Safety Impact of the Lack of Regular Road Maintenance____________________________________________________________________________________________
49
Table 2 compares changes in asphalt production (as in Figure 18) with changes ininvestment and maintenance expenditure (as in Figure 11 and 13) between 2007 and 2012.Countries are sorted with respect to percentage changes in asphalt production (from thelargest positive changes to the largest negative changes) and colour coded according to thedirection and size of the change – positive variation greater than 30% (dark green), positivevariation of less than 30% (light green), no variation (grey), negative variation of less than30% (orange), and negative variation greater than 30% (red). This has been done tofacilitate the comparison with the subsequent lists, which report the corresponding changesin investment and maintenance expenditure.
Only in two MSs, namely Poland and Luxemburg, a strong increase in maintenance andexpenditure data is confirmed by an increase in asphalt production, though as alreadydiscussed above, in the case of Poland the growth in asphalt production is more likely to belinked to the infrastructure investment boom of recent years rather than to increasedmaintenance activity. The asphalt production data shows a positive variation also in Belgiumand Denmark, suggesting an increase of road works also in these MS, though hereexpenditure data on investment and maintenance activities are missing and it is notpossible to identify the drivers behind this trend.
In the remaining MSs, asphalt production data shows a negative variation over the 2007-2012 period, with the exception of Latvia, Romania and Sweden where no change wasrecoreded. These figures are not always consistent with the available road maintenance andinvestment expenditures though.
In four cases – Croatia, France, Lithuania, Austria – the general decrease in asphaltproduction is accompanied by a negative change in investment and a positive change inmaintenance expenditure: here data are congruent and seem to suggest the presence of anincrease in mainteanance activities counterbalanced by a decrease of investment works thattogether led to a overall reduction in asphalt production.
In Sweden, Estonia and The Netherlands, though, a positive change in both maintenanceexpenditure and investment is accompanied by a zero or negative trend in asphaltproduction, which does not seem to be intrinsincly consistent.
Data is more congruent for countries reporting negative trends in maintenance expenditure.All MSs reporting a decrease in maintenance expenditure have also experienced a downturnin investment and a decrease in asphalt production. Slovakia, Finland, Czeck Republic andthe UK registered a reduction in asphalt production below 30% and reported a decreaseboth in investment and maintenance activities. Four countries experienced a reduction inasphalt production of over 30% and also reported the largest fall in both investment andmaintenance expenditure – Italy, Ireland, Slovenia and Spain.
Overall the analysis of asphalt production data re-states the presence of a significantreduction of maintenance activities in Italy, Ireland, Slovenia and Spain and a likelydownward trend also in Slovakia, Finland, Czeck Republic and the UK. The same data alsosupports an increase in maintenance expenditure in Poland, Luxemburg, Croatia, France,Lithuania and Austria. For all other MSs either asphalt production or road expenditure dataare missing, or they show some inconsistencies.

Policy Department B: Structural and Cohesion Policies____________________________________________________________________________________________
50
3.4. Economic cycle and road maintenance
3.4.1 Drivers of variation in maintenance in the EU in the 2008-2011 period
This section seeks to identify if there is a relationship between the economic cycle and roadmaintenance, based on the evidence gathered above in relation to road maintenance andfrom the evidence collected within the case studies carried out for a selection of countries.
The analysis undertaken in a selection of EU MSs shows that while some MSs experienced adecrease in maintenance activities on some sections of their road network following the2008 crisis30, some EU MSs registered an increase in maintenance budget boosted bycounter-cycle economic policies. Moreover, as highlighted below, a number of factorsinfluenced the pattern experienced by road maintenance activities including, above all, thetype of the organization in charge of road maintenance and the structure of the fundingsystem for the road maintenance budget, which tends to vary not only state by state butalso by types of road network within one single country.
Since 2001, the maintenance budget for motorways and expressways in Austria operatedby ASFINAG31 increased gradualy up to 2010, but fell significantly in 2011 and 2012. Thiswas accompanied by a 25% decrease in investment between 2010 and 2011. Thesepatterns are due to the fact that ASFINAG funds its maintenance and invesment operationthrough the tolls collected from vehicles circulating on its network and by raising the capitalit needs for investments on the capital martket. This makes ASFINAG independent ofGovernment budgetary trends, but vulnerable to the variation in traffic flows and thevolatility of capital markets. Following the financial and economic crisis, ASFINAG’s revenuefell by 9% between 2008 and 2009 because of reduced traffic volumes, which had an impactboth on its maintenance and investment decisions. Subsequently revenues rebounded andin 2010 they were back at the pre-recession level of 2008, which can explain the slightrecovery in maintenance budget registered in 2013.
30 Which in some cases can be attributable to the economic downturn but in other cases is also due to otherconcurring factors (e.g. increased focus on investment rather than maintenance activities).
31 http://www.asfinag.at

EU Road Surfaces: Economic and Safety Impact of the Lack of Regular Road Maintenance____________________________________________________________________________________________
51
Figure 19: Trend of maintenance expenditure on Austrian ASFINAG network
Source: ASFINAG (2013).
In France the Union des Syndicats de l’Industrie Routière Française (USIRF) reported asignificant decrease in the annual road maintenance budget. Since 2008, the overall budgetdecreased by 25% across all network types (national, county or local) and it is likely that in2014 this will fall by an additional -5% (-10% on rural roads).
In Germany all federal transport infrastructure investment projects are included in thenational infrastructure plan (Bundesverkehrswegeplan) which ensures a coordinatedapproach to the building of new infrastructure as well as maintenance andupgrading/renewal. Infrastructure capital investments and maintenance activities of thefederal roads network are also partly financed by toll income from heavy vehicles, in placesince 2005. In contrast to other MSs, expenditure on maintenance of the national roadnetwork in Germany increased notably since the start of the financial crisis in 2009. Thiswas mainly due to two economic stimulus packages in these years aimed at mitigating theimpacts of the economic downturn in Germany. The first economic stimulus package (2008-2009) provided an additional €2 billion for investments in the federal transport networks(road, rail and waterways). The same amount was spent under the second stimulus packagein the period 2010-2011. €910 million of a total of €2 billion under the second stimuluspackage were spent on the federal roads network, of which €450 million were dedicated tomaintenance activities. The Federal Government estimated that it requires annual spendingof more than €3 billion in order to maintain the condition of the federal road network at itscurrent level. The reason for this increased spending is mainly as a result of an increase inmaintenance costs and increased maintenance needs due to an unexpectedly high increasein heavy traffic on the network.
Over the last fifteen years, Ireland has witnessed the biggest infrastructure expenditure inits history. Figure 20 details the Exchequer’s32 investment in national roads includingmotorways since 2004.
32 The United Kingdom Ministry of Economy.
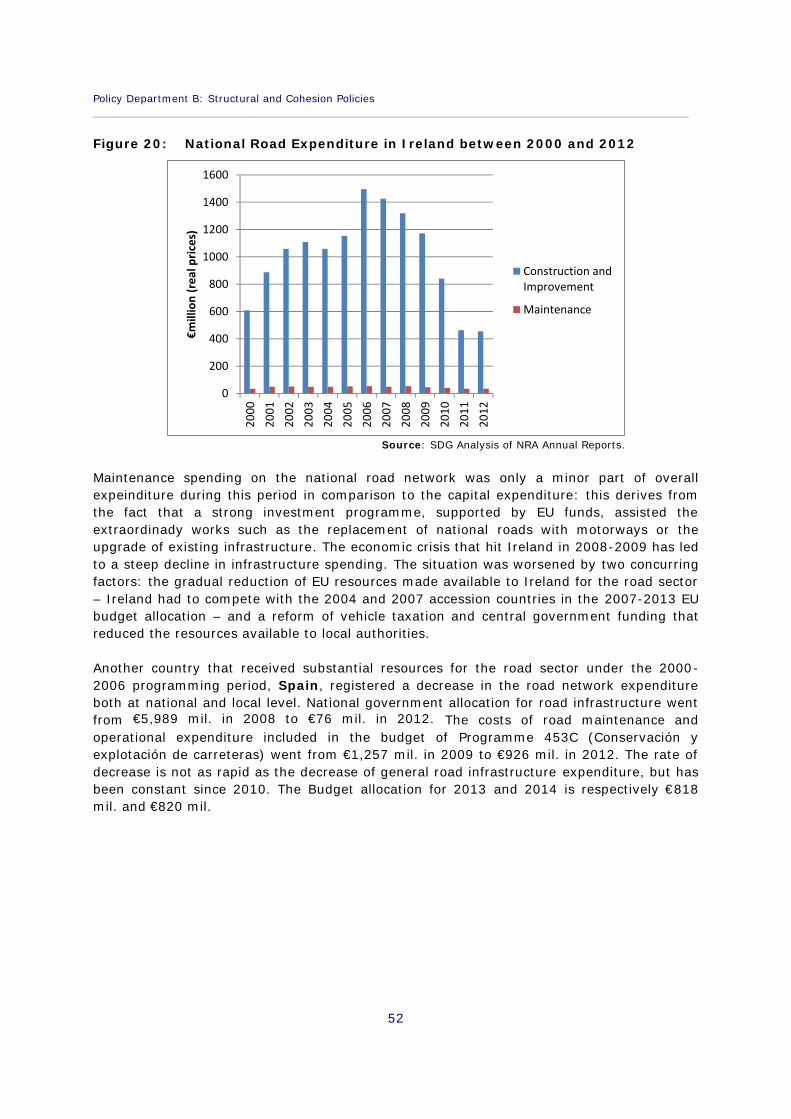
Policy Department B: Structural and Cohesion Policies____________________________________________________________________________________________
52
Figure 20: National Road Expenditure in Ireland between 2000 and 2012
Source: SDG Analysis of NRA Annual Reports.
Maintenance spending on the national road network was only a minor part of overallexpeinditure during this period in comparison to the capital expenditure: this derives fromthe fact that a strong investment programme, supported by EU funds, assisted theextraordinady works such as the replacement of national roads with motorways or theupgrade of existing infrastructure. The economic crisis that hit Ireland in 2008-2009 has ledto a steep decline in infrastructure spending. The situation was worsened by two concurringfactors: the gradual reduction of EU resources made available to Ireland for the road sector– Ireland had to compete with the 2004 and 2007 accession countries in the 2007-2013 EUbudget allocation – and a reform of vehicle taxation and central government funding thatreduced the resources available to local authorities.
Another country that received substantial resources for the road sector under the 2000-2006 programming period, Spain, registered a decrease in the road network expenditureboth at national and local level. National government allocation for road infrastructure wentfrom €5,989 mil. in 2008 to €76 mil. in 2012. The costs of road maintenance andoperational expenditure included in the budget of Programme 453C (Conservación yexplotación de carreteras) went from €1,257 mil. in 2009 to €926 mil. in 2012. The rate ofdecrease is not as rapid as the decrease of general road infrastructure expenditure, but hasbeen constant since 2010. The Budget allocation for 2013 and 2014 is respectively €818mil. and €820 mil.
0
200
400
600
800
1000
1200
1400
1600
2000
2001
2002
2003
2004
2005
2006
2007
2008
2009
2010
2011
2012
€mill
ion
(rea
l pric
es)
Construction andImprovement
Maintenance

EU Road Surfaces: Economic and Safety Impact of the Lack of Regular Road Maintenance____________________________________________________________________________________________
53
Figure 21: Evolution of maintenance and operation expenses in Spain
Source: SDG analysis of programme 453C.
The effect of a falling budget allocation for road network operations is particularly evidentwhen looking at pavement rehabilitation. For instance, the budget for Project Clave 32,dedicated to pavement rehabilitation, went from almost €560 mil. in 2008 to only €37 mil.in 2010. Even more alarming is the fact that in 2011 and 2012 no investments were madein this area. The last tender for Project Clave 32 was launched in 2013 (almost three yearsafter the previous one in 2010) for the amount of only €11 mil.
In Italy, a sharp fall in road maintenance spending started shortly after the 2008 economiccrisis. The operator of national roads (except motorways), ANAS, reported a reduction in theexpenditure on road maintenance both in routine and structural budgets, respectively of16% and 43% in the 2008 to 2012 period and registered a total decrease of about €500m.Similarly the budget allocated by local authorities to current and capital expenditure on theroads under their responsibility decreased by 43% and 3% respectively between 2009 and2011, with northern and central regions being those affected most by the cuts (here thereduction at municipal level reached peaks of 26% and 12% respectively, against an budgetincrease in some southern municipalities33).
In the UK, road maintenance expenditure on the Strategic Road Network, managed by theHighways Agency (HA), has fluctuated considerably, with an average of £850m (€1.02bn)per year in the first half of the previuos decade and of £1bn (€1.2bn) per year in the secondhalf of the decade. However, changes in accounting practices in 2009/10 make it difficult tocompare recent figures. Expenditure by local authorities make up between 70% and 80% ofall road maintenance spending in England each year. This corresponds to a figure of about£3bn (€3.6bn) in 2011/12 prices. Local authority spending is further split into expenditureon main roads and on minor roads. Trends for both types of road are similar, with amarginal decline over the period 2009-2012.
Planned reductions in both the amount and type funding available for roads will affect roadmaintenance expenditure in the UK over the next few years. Firstly, funding will have been
33 The fact that some Italian southern regions increased their budget during the spending review operated by theItalian National Government is explained by the fact that these regions are located in areas that receiveresources for transport investments also from the EU structural and cohesion funds, whose operationalprogrammes were not affected by budget cuts.
0200400600800
1.0001.2001.400
2005 2006 2007 2008 2009 2010 2011 2012mill
ions
of
euro
Expenses for "Programa 453C"

Policy Department B: Structural and Cohesion Policies____________________________________________________________________________________________
54
reduced by 30% between 2011 and 2015 for both the Highways Agency and localgovernments. Central government expects the Highways Agency and local administrationsto be able to make up for this shortfall through efficiency savings, but budgets for roadmaintenance are likely to be stretched as a result. Secondly, funding for maintenance willnot be ring-fenced anymore. Instead, it will be pooled into a single pot of local governmentfunding which is allocated to local authorities, thus with no assurance that it will be spent onroad maintenance. Therefore, local budgets will be under pressure from growing spendingtrends in social care and environmental services. The Local Government Associationestimates that a multi-billion pound funding gap will materialise in 2020. Based on theseprojections, the RAC Foundation has estimated that the proportion of spending on transportand roads by local authorities will decrease from 7% to 4% of the total, at around £2.3bn(€2.8bn) in 2019.
In Lithuania road network management and maintenance is funded by the RoadMaintenance and Development Programme (RMPD), which is supported by excise duty onfuel, gas and road taxes. Funds available for road maintenance have fallen following the2008-2009 economic crisis, with a drop of €24m between 2008 and 2009 alone, and adecrease of 32% since 2008.
Total expenditure on the Polish road network has been rising since accession to theEuropean Union. From 2004 to 2011 actual expenditure on new road infrastructure hasrisen approximately 500% to a high of over PLN34 26bn (€6bn) in 2011. During the period ofeconomic downturn, investment spending in Polish roads has not decreased, mainly due tolarge amounts EU funding. The budget for routine maintenance has generally increased inthe period from 2007 to 2012 with annual expenditure rising from almost PLN 600m(€146m) to a high of almost PLN 1.15bn (€472m) in 2012. Spending on routinemaintenance is expected to be in-line with the expansion of the road network.
In Portugal road maintenance expenditure increased significantly between 2000 and 2003,from approximately €113m to €203m, and since then there has been a gradual fall inexpenditure. As a result of this trend, in 2013, the amount spent was the same as thatspent in 2000. Furthermore, in 2008 there was a significant drop in expenditure on local andregional roads which remains low.
Road infrastructure spending in Romania is highly dependent on central governmentfunding. Although the road maintenance budget increased by 78% between 2004 and 2008,the percentage allocated to this budget actually decreased by 23.7%. No evidence has beenfound on the impact of the economic crisis on maintenance activities.
3.4.2 Road maintenance expenditure in comparison to economic performance
From the evidence collected it seems that there is no clear correlation between the patternof road expenditure in the EU MS and the 2008 economic crisis.
34 PLN: Polish złoty
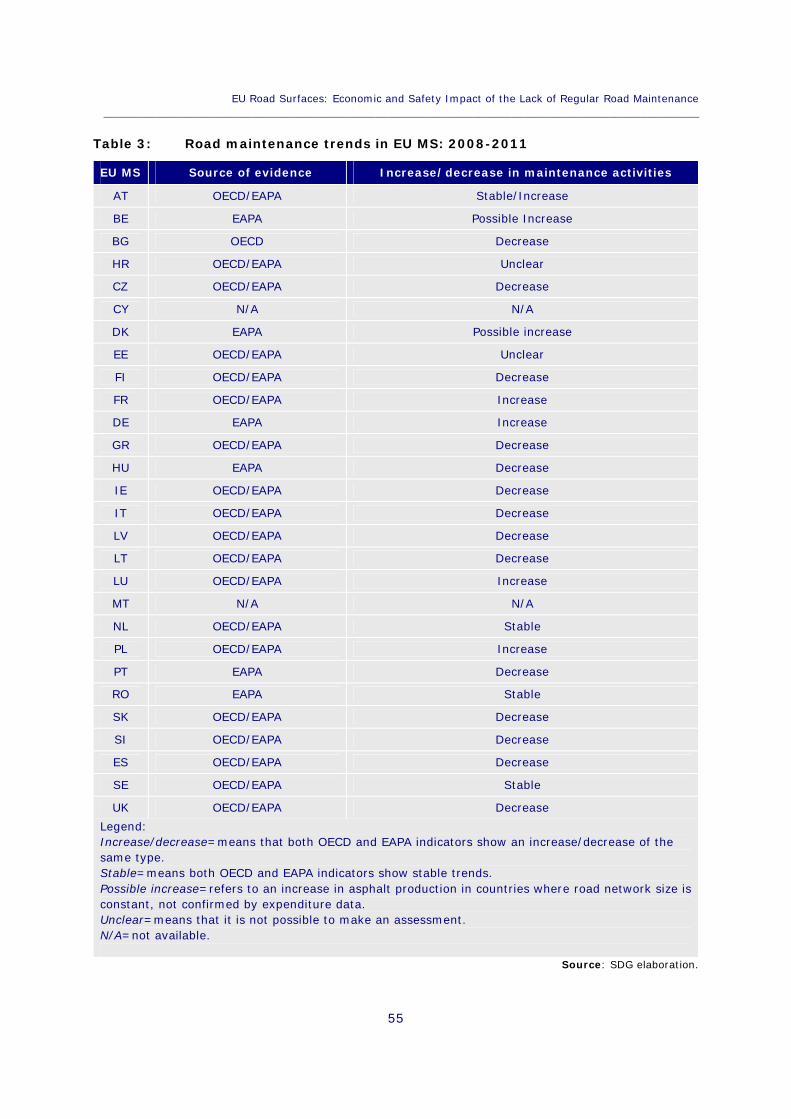
EU Road Surfaces: Economic and Safety Impact of the Lack of Regular Road Maintenance____________________________________________________________________________________________
55
Table 3: Road maintenance trends in EU MS: 2008-2011
EU MS Source of evidence Increase/decrease in maintenance activities
AT OECD/EAPA Stable/Increase
BE EAPA Possible Increase
BG OECD Decrease
HR OECD/EAPA Unclear
CZ OECD/EAPA Decrease
CY N/A N/A
DK EAPA Possible increase
EE OECD/EAPA Unclear
FI OECD/EAPA Decrease
FR OECD/EAPA Increase
DE EAPA Increase
GR OECD/EAPA Decrease
HU EAPA Decrease
IE OECD/EAPA Decrease
IT OECD/EAPA Decrease
LV OECD/EAPA Decrease
LT OECD/EAPA Decrease
LU OECD/EAPA Increase
MT N/A N/A
NL OECD/EAPA Stable
PL OECD/EAPA Increase
PT EAPA Decrease
RO EAPA Stable
SK OECD/EAPA Decrease
SI OECD/EAPA Decrease
ES OECD/EAPA Decrease
SE OECD/EAPA Stable
UK OECD/EAPA DecreaseLegend:Increase/decrease=means that both OECD and EAPA indicators show an increase/decrease of thesame type.Stable=means both OECD and EAPA indicators show stable trends.Possible increase=refers to an increase in asphalt production in countries where road network size isconstant, not confirmed by expenditure data.Unclear=means that it is not possible to make an assessment.N/A=not available.
Source: SDG elaboration.
Policy Department B: Structural and Cohesion Policies____________________________________________________________________________________________
56
Available expenditure and asphalt production data suggest a significant reduction ofmaintenance activities in Italy, Ireland, Slovenia and Spain in recent years and a likelydownward trend also in Slovakia, Finland, Czeck Republic and the UK. Asphalt productiondata also suggests a downward trend in Portugal and Hungary. However, at the same time,the information available shows an increase in maintenance expenditure in a number of MSsover the same period: this is the case for Poland, Luxemburg, Croatia, France, Lithuania andAustria. Also Germany seems to have recorded an increase in road maintenance works fromthe asphalt production dataset.
The case study analysis confirms that the extent to which the crisis has affected the roadinvestment and maintenance activities depends on the structure of the funding mechanismadopted in the different countries and on the political choices made by decision makers. Theimpact of the crisis has been higher where the funding of road infrastructure is highlydependend on government spending (national or local irrespectively) rather than from othersources of financing (e.g. toll roads). The status of public finance of different MSs and thefiscal and budgetary choices that have been made has then lead to different outcomes. Insome cases road investment has been used as a counter-cyclical form of public spending.However at times of budget cuts, putting off investment and repairs in the road sector is arelatively quick way to reduce public spending that has been pursued by a number of EUcountries. Thus it is not surprising that the sharpest reduction in spending has beenwitnessed in MSs that have implemented wide-ranging deficit reduction plans in recentyears. This is particurarly the case of Eurozone MSs with higher debt levels – such as Italy,Spain, Portugal and Greece - that had to reduce their public spending in order to becompliant with EU fiscal costraints.
In addition to this, it must be pointed out that maintenance spending is also highlydependent on the size of road infrastructure in previous years. Road construction today willinevitably increase the need for maintenance spending tomorrow. This can be seen as aform of liability which current investment decisions impose on future maintenance budgets.In addition, the more intensive is the pace of road building today, the more likely it is thatthe need for maintenance appears abruptly and is harder to spread out over time. Thismight be particularly the case for the TEN-T road networks that are under constructions orhave been built in recent years.
A final remark needs to be made on the difficulties that we have encountered in evaluatingthe relationship between the economic cycle and road maintenance expenditure. The lack ofclear definitions and common practices relating to the measurement of road transportinfrastructure spending, pointed out at the beginning of the Chapter, hinders accuratemeasurement of these figures and limits a complete assessment of how this spendingrelates to economic growth. A similar point was made recently by the ITF35 that highlightsthe presence of “significant problems relating to data availability, definitions, coverage,quality and comparability” regarding expenditure in the transport sector and calls for “betterand more comparable data […] to lead to more robust macroeconomic analysis forsupporting decision-making”.
35 International Transport Forum, Understanding the Value of Transport Infrastructure, 2013.
EU Road Surfaces: Economic and Safety Impact of the Lack of Regular Road Maintenance____________________________________________________________________________________________
57
KEY FINDINGS
The degree of homogeneity of available data on road maintenance and investmentexpenditure across the different MS is minimal, leading to an imperfect dataset:different definitions of maintenance and investment aggregates are in use leading toEU aggregate datasets where the comparability between MSs is limited.
To assess the evolution of maintenance activities on road works in the EU in recentyears the study carried out a comparison between the road expenditure datasetproduced by the OECD/ITF, the asphalt production data reported by EAPA andspecific country information. The analysis suggests the presence of a significantreduction of maintenance activities in Italy, Ireland, Slovenia and Spain in recentyears and a likely downward trend also in Slovakia, Finland, Czeck Republic, the UK,Portugal and Hungary. At the same time, an increase in maintenance expenditureseems to have been recorded in a number of EU MSs over the same period: this isthe case for Poland, Luxemburg, Croatia, France, Lithuania, Austria and Germany.
The extent to which the crisis has affected road investment and maintenanceactivities depends on the structure of the funding mechanism adopted in the differentcountries and on the political choices made by decision makers. The impact of thecrisis has been higher where the funding of road infrastructure is highly dependendon government spending (national or local irrespectively) rather than from othersources of financing (e.g. toll roads). The status of public finance of different MSsand the fiscal and budgetary choices that have been made has then lead to differentoutcomes.

Policy Department B: Structural and Cohesion Policies____________________________________________________________________________________________
58

EU Road Surfaces: Economic and Safety Impact of the Lack of Regular Road Maintenance____________________________________________________________________________________________
59
ASSESSMENT OF ROAD SURFACE QUALITY AND4.SAFETY PERFORMANCE AND PLANNING OFMAINTENANCE ACTIVITIES IN THE EU
4.1. Introduction
This Chapter discusses the impact of road conditions on road safety and describes theprocedures and technologies in place across Europe to assess the quality of the roadsurfaces and to verify the constancy of performance.
4.2 Impact of road condition on road safety
As discussed in Chapter 2, only a small proportion of accidents seem to be caused by roaddesign and/or poor road maintenance. Instead driver behaviour seems to be the principalcontributor to accidents. Nevertheless, in many circumstances, it is difficult to disentanglecausality: there are accidents caused directly by the poor condition of the road network, butthere are also accidents caused by drivers’ behaviour in reaction to the condition or thedesign of the road. There is, in fact, a correlation between road quality and driverbehaviour; in some circumstances even careful drivers make poor choices as a result of thecondition of the road or their reading of the road layout.
There are several ways in which road condition contributes to, or compromises road safety.According to existing literature, the key causes are:
poor wheel-road contact that fails to guarantee sufficient skid resistance, due toinadequate road maintenance;
localised anomalies, such as ruts, potholes and depressions, whose unpredictabilitymake them dangerous for drivers;
poor geometry and alignment design – i.e. inadequate design of the road;
“level of service” / performance too poor to accommodate existing traffic flows;
poor signage or markings, e.g. incomplete or missing markings and signs, and poorlighting.
As will be discussed in more detail below, a lack of road maintenance or inappropriatedesign can exacerbate these factors, and thereby increase the number of accidents. Ofthese factors, only some are attributable to a lack of regular maintenance. For example,geometry and alignment design modifications do not fall within regular maintenanceprograms.
To assure road safety, road geometry and alignment must be designed to be ashomogenous and clear to the driver as possible. The literature refers to this as “designconsistency”. The appropriate sequence of road features is important as it increases theavailable time that a driver has to react. For example, road geometry and its alignment
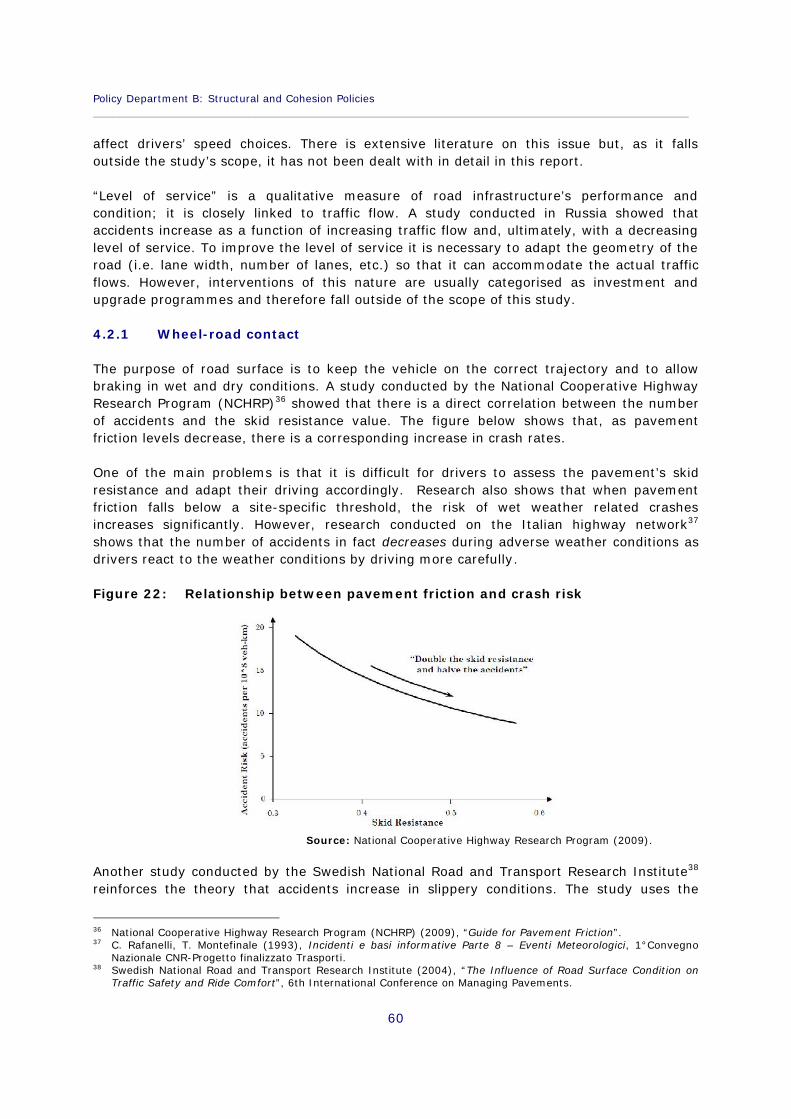
Policy Department B: Structural and Cohesion Policies____________________________________________________________________________________________
60
affect drivers’ speed choices. There is extensive literature on this issue but, as it fallsoutside the study’s scope, it has not been dealt with in detail in this report.
“Level of service” is a qualitative measure of road infrastructure’s performance andcondition; it is closely linked to traffic flow. A study conducted in Russia showed thataccidents increase as a function of increasing traffic flow and, ultimately, with a decreasinglevel of service. To improve the level of service it is necessary to adapt the geometry of theroad (i.e. lane width, number of lanes, etc.) so that it can accommodate the actual trafficflows. However, interventions of this nature are usually categorised as investment andupgrade programmes and therefore fall outside of the scope of this study.
4.2.1 Wheel-road contact
The purpose of road surface is to keep the vehicle on the correct trajectory and to allowbraking in wet and dry conditions. A study conducted by the National Cooperative HighwayResearch Program (NCHRP)36 showed that there is a direct correlation between the numberof accidents and the skid resistance value. The figure below shows that, as pavementfriction levels decrease, there is a corresponding increase in crash rates.
One of the main problems is that it is difficult for drivers to assess the pavement’s skidresistance and adapt their driving accordingly. Research also shows that when pavementfriction falls below a site-specific threshold, the risk of wet weather related crashesincreases significantly. However, research conducted on the Italian highway network37
shows that the number of accidents in fact decreases during adverse weather conditions asdrivers react to the weather conditions by driving more carefully.
Figure 22: Relationship between pavement friction and crash risk
Source: National Cooperative Highway Research Program (2009).
Another study conducted by the Swedish National Road and Transport Research Institute38
reinforces the theory that accidents increase in slippery conditions. The study uses the
36 National Cooperative Highway Research Program (NCHRP) (2009), “Guide for Pavement Friction”.37 C. Rafanelli, T. Montefinale (1993), Incidenti e basi informative Parte 8 – Eventi Meteorologici, 1°Convegno
Nazionale CNR-Progetto finalizzato Trasporti.38 Swedish National Road and Transport Research Institute (2004), “The Influence of Road Surface Condition on
Traffic Safety and Ride Comfort”, 6th International Conference on Managing Pavements.

EU Road Surfaces: Economic and Safety Impact of the Lack of Regular Road Maintenance____________________________________________________________________________________________
61
International Roughness Index (IRI, measure in millimetres/metre) to assess skidresistance. The results show clearly that the accident rate increases as the IRI value rises,furthermore accidents increase with increased traffic flow Figure 23).
Figure 23: Correlation between Accident rate and IRI for different traffic flowclasses
Source: Swedish National Road and Transport Research Institute (2004).
Therefore, a safe road needs to have a good skid resistance value when it is initially built,and this level needs to be maintained throughout its life. The latter is possible only throughregular maintenance.
4.2.2 Localised anomalies
Localised anomalies, considered significant for this study, are ruts, potholes and depressionsin the surface. Ruts are linear depressions created following a permanent deformation of thelayers of bitumen caused by the load from a vehicle’s wheels.
Figure 24: Rutting
Source: http://lgam.wikidot.com/rutting.
Potholes are depressions brought about by the removal of the uppermost layer of tarmaccaused by traffic. Pothole depth increases when there is the risk of rainwater entering thegaps in the surface.

Policy Department B: Structural and Cohesion Policies____________________________________________________________________________________________
62
Figure 25: Formation of a classic pothole
Source: http://www.halifax.ca/municipalops/potholes/PotholeFAQ.html.
Depressions are permanent deformations in the road surface due to ground subsidence.Their repair falls inside extraordinary maintenance because they relate to road elementsbelow the surface.
These anomalies in the road surface (according to a study conducted by the SwedishNational Road and Transport Research Institute39) cause, in dry surface conditions,vibrations and bumps which can increase driver fatigue. However, such anomalies usuallyincrease drivers’ attention and, as a result, the risk of accident seems to decrease.
In wet conditions, rutting causes an increased risk of aquaplaning which is a phenomenonwhereby the vehicle floats on a layer of water as a result of the loss of contact between theroad and the wheels, leading to the driver losing control of the vehicle. The risk ofaquaplaning caused accidents is greatest where rut depths are larger and where there ispoor water drainage (i.e. small cross fall).
An important additional consideration relating to these types of anomalies is that they aredangerous because drivers cannot predict them. They are particularly hazardous when theyare spread out along the road rather than when the driver is facing a consistently roughroad.
In many cases the repair of ruts, potholes and depressions would require extraordinarymaintenance works including a general reconstruction of the road surface to be durature,but often, especially on local or urban roads, for budget and/or operational reasons, repairsare only carried out on the surface providing a temporary solution to the problem withoutconsidering the underlying problem.
4.2.3 Poor signage, markings and lighting
Markings, signs and lighting contribute to make the road logical and easy to understand.Road markings are a cost effective solution to provide a clear indication of the driving lanesand space, contributing to a predictable driving trajectory. As a result road users intuitivelyunderstand the road’s alignment and can adapt their driving behavior accordingly. A studydeveloped by the European Union Road Federation40 shows that good maintenance of roadmarkings and signs reduces accident risks.
39 Swedish National Road and Transport Research Institute (2004), “The Influence of Road Surface Condition onTraffic Safety and Ride Comfort”, 6th International Conference on Managing Pavements.
40 European Union Road Federation “Marking the way towards a safer future”.
EU Road Surfaces: Economic and Safety Impact of the Lack of Regular Road Maintenance____________________________________________________________________________________________
63
Good street lighting also improves road safety especially in specific, potentially dangerouslocations such as intersections, pedestrian crossings, urban areas, etc. The aim of roadlighting is to provide the required visibility for the driver to read the road and react tooncoming obstacles in a safe manner. On this topic, different studies have shown a directlink between poor lighting and a consequent increase in accident risk.
4.2.4 Road works and accidents: unintended consequences of roadmaintenance
Road works tend to be unsafe for those working on site (as a result of their proximity oftraffic) and to drivers moving through them (resulting from a change in the road layout). Astudy conducted by the Institute for Road Safety Research in the Netherlands (SWOV)41
showed that, in the period 2000-2009, 2% of all registered fatal accidents in theNetherlands took place in the proximity of roadworks and roadwork locations seem todisplay a higher accident rate than at other road locations. The risk is highest in the workzone; roadworks that take longer and cover a longer distance seem to have a lower crashrate. The literature also shows a generally higher crash rate during nighttime.
Guidelines exist for the uniform preparation, indication and marking of roadworks. It isimportant that these guidelines are followed for large as well as small roadworks. However,an evaluation of roadworks shows that these guidelines are only followed diligently at a fewlocations.
4.2.5 The impact of road condition on road safety
In summary, there are various aspects of the road’s condition which contribute to its safety.A high level of pavement friction, clear signage and road markings are important qualities ofa safe road. It is important that these are maintained throughout the road’s lifespan.Anomalies, such as ruts and depressions, reduce road safety as they affect driver fatigue,can create a hazard for drivers and can cause aquaplaning in wet conditions. In addition tonormal road conditions, roadworks create more hazardous road conditions for both driversand those who are working on the road and affect the accident rate for a road.
A consistent design of a road’s geometry is an important factor in ensuring a safe road.Another important provision is an appropriate level of service for the anticipated traffic flow.However, both of these factors fall under the umbrella of exceptional, rather than regularmaintenance, which is the focus of this study. In what follows we illustrate the proceduresadopted in EU MS to monitor the performance of their road network and plan formaintenance activities.
41 Institute For Road Safety Research (2010), “Roadworks and road safety”, SWOV fact sheet.

Policy Department B: Structural and Cohesion Policies____________________________________________________________________________________________
64
4.3 Road performance monitoring at the EU level
4.3.1 Directive 2008/96/EC
Up to 2008, the EU lacked a harmonised and coordinated framework for procedures relatingto road safety audits and impact assessments on the European road network with theexception of tunnels on the trans-European road network whose common safetyrequirements and procedures were laid down by Directive 2004/54/EC.
However, by then, a number of Member States could already boast a well functioning roadinfrastructure safety management systems, but there was the need to set up commonprocedures to ensure a consistent approach to safety across the EU roads.
It was only with the approval of Directive 2008/96/EC of 19 November 2008 that aframework for road infrastructure safety management in the EU was set up, although thiswas limited to roads on the TEN-T network. The Directive indicates the necessaryprocedures relating to road safety impact assessments, road safety audits, the managementof road network safety and safety inspections by the Member States.
The Directive has three objectives: (i) to ensure that safety is integrated in all phases ofplanning, design, construction and operation of road infrastructure, (ii) to bring about acommon and high level of safety of roads in all EU Member States; and (iii) to use thelimited funds for more efficient construction and maintenance of roads.
Five operational provisions are included in the text:
(i) Road impact assessment for infrastructure projects at initial planning stage (impactassessment shall indicate the road safety considerations which contribute to thechoice of the proposed solution);
(ii) Road Safety Audits (RSAs) for all infrastructure projects during all the phases (draftdesign, pre-opening and early operation);
(iii) The identification of “black spots” for road safety, ranking Accident Concentrationsections (black spots) to be reviewed every three years ;
(iv) The undertaking of periodic Road Safety Inspections (RSIs) to be carried out by thecompetent authorities ;
(v) The data management of fatal accidents consisting of compulsory reporting of eachfatal accident and of setting up a methodology to calculate the cost of a fatalaccident.
The Impact Assessment accompanying the introduction of the Directive estimated that itcan help reduce the number of victims on the trans-European road network by more than600 fatalitites per year and the seriously injuried by about 7,000 per year42.
42 Commission of the European Communities (2006), Proposal for a Directive of the EU Parliament and of theCouncil on road infrastructure safety management, Full impact assessment, Commission staff workingdocument.
EU Road Surfaces: Economic and Safety Impact of the Lack of Regular Road Maintenance____________________________________________________________________________________________
65
Member States were given until 19 December 2010 to bring into force the laws, regulationsand administrative provisions necessary to comply with this Directive. On 19 December2011, the EC published “Guidelines for competent authorities on application of theDirective”. MS have been given until March 2012 to fulfil these requirements43.
Despite the harmonisation efforts, the interpretation of the Directive varies in each MemberState and dissimilar approaches to its implementation highlight the limitations of this text.
First, the Directive applies only to the trans-European road network, while the mostfatalities due to traffic accidents occur on two-lane rural roads and the majority of accidentsoccur in urban areas.44 In order to improve road safety for all users it is crucial to frame acommon approach for procedures relating road safety impact assessments, road safetyaudits, management of road network safety and safety inspections on all roads networks.While proceeding in this direction, attention should also be focused on the procedures to betaken to reduce road safety risks for vulnareble users, such as motorcyclists, cyclists,pedestrians, etc. – an area which is not covered sufficiently by the current Directive. Anexample is given by the fact that as it focuses exclusively on the methodology andprocedures to be followed for safety controls, it does not provide indications on thematerials or equipment to be chosen and, as such, does not sufficiently boost theintroduction of crash barriers or other tools that could help reduce the accident risks ofmotorcyclists.
Another limitation is in relation to the legislative instrument chosen. According to theprinciple of subsidiarity, a Directive is binding upon each MS, in terms of the end that needsto be achieved, although it leaves the means and method to the discretion of the nationalauthorities. As a result, operational approaches related to the goals set by Directive2008/96/EC are different in each MS. Road Safety Audits (RSA) and Road SafetyInspections (RSI) are conducted differently across the EU, and the experience and thebackground of road safety inspectors can vary significantly.Recently, two research projects have tried to address some of the limitations of theDirective and propose actions to improve its effectiveness, i.e.:
Pilot4Safety;
WhiteRoads.
In addition to this, the European Commission recently commissioned a study on theeffectiveness of the existing EU legislative framework on road infrastructure safetymanagement, which would include also an ex-post evaluation of Directive 2008/96/EC.
4.3.2 The Pilot4Safety Project
The Pitol4Safety project was carried out between June 2010 and May 2012. The main actionresulting from this project was the creation of a common “Road safety tools and manual”and experts from across the EU are trained using this tool. A shared and common definitionof the different steps composing a RSA was conceived in order to have a: “…systematic and
43 According to the “30th Annual Report on monitoring the application of EU law” (2012), only Finland has beenreferred to the Court for the late transposition of Directive 2008/96 on road infrastructure safety management.
44 « Accident » refers to any kind of road accident; « casualty » refers to accidents leading to serious injuries ordeath.

Policy Department B: Structural and Cohesion Policies____________________________________________________________________________________________
66
independent examination of a road project, designed to highlight potential security issues atthe earliest possible stage of planning and construction, to reduce or eliminate theseproblems and limit the risk for different types of users”. Similarly, the RSI is defined in themanual as “a preventive safety management tool implemented by roadauthorities/operators”.
In addition – although the Directive applies only to TEN road network, its contents havebeen used as a template for the implementation of safety measures on regional roads assome Member States have extended the application of the Directive to otherinfrastructure.45 On the basis of the understanding of local stakeholders coming from the sixEuropean regions participating in the project46, in June 2012 a “Safety prevention Manualfor secondary roads” was published.
The stakeholders of this project have stated that this manual, and best practices collectedthrough this project, could be a starting point for the European Commission and Parliamentto develop a comprehensive tool that standardises the operational procedures to beimplemented by road operators and authorities in MSs in order to guarantee a balancedlevel of road maintenance across Europe.
4.3.3 The WhiteRoads Project
WhiteRoads is a joint project of the European Union Road Federation (ERF) and the SpanishRoad Association (AEC), which is taking an innovative approach to road safety at the EUlevel. Traditionally, improvements in road safety are made in the aftermath of accidents.However, the WhiteRoads project inverts this logic by identifying road sections along theTrans-European Road Network (TEN-T) where no accidents have happened during the studyperiod, despite high traffic flows. The project then highlights the key infrastructurecharacteristics of these sections of road – called ‘white-spots’ – from which lessons can belearnt. The project started in 2010 and the final results were officially presented in 2013.
WhiteRoads was developed in different stages. The first of these was to collect and analysetraffic flow and road accident data on TEN-T roads for each MS. After extensive analysis ofroad accidents in most EU countries, a European White Spot (EUWS) was defined as:
“A road section of the TEN-T of at least 15 km with no fatal accidents during the lastfive years considered in the study.”
Also important was the identification of EUWS on the TEN-T network in all MSs. A total of982 EUWS have been identified in the 25 EU Member States for which the analysis of roadnetworks has been completed. The figure below shows, for each country, how many EUWSwere identified - France, Spain and Sweden have the greatest number of safe stretches ofroad. Data for Germany was not available (due to privacy concerns).
45 It has not been possible to determine which MS have chosen to extend the requirement to other road networks.This is part of the analysis included in the European Commission ex-post evaluation mentioned earlier. Adetailed breakdown should be available within that report when it is published.
46 The consortium of the project is made up of the following organizations:1. FEHRL (Belgium) for management and training. 2. ASTRAL, Road Management company of Lazio, Italy 3.CDV (Transport Research Centre) - Czech Republic 4. Generalitat de Catalunya, Spain 5. Prefecture ofThessaloniki, Greece 6. Randers Municipality, Denmark.
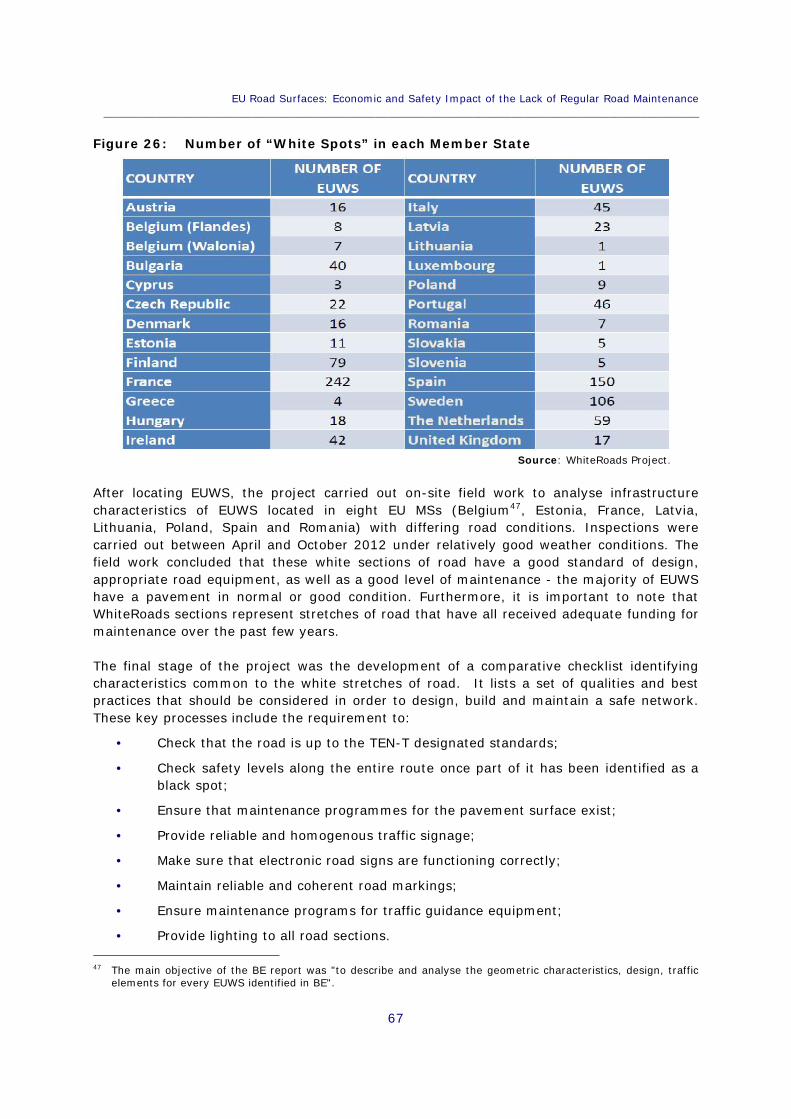
EU Road Surfaces: Economic and Safety Impact of the Lack of Regular Road Maintenance____________________________________________________________________________________________
67
Figure 26: Number of “White Spots” in each Member State
Source: WhiteRoads Project.
After locating EUWS, the project carried out on-site field work to analyse infrastructurecharacteristics of EUWS located in eight EU MSs (Belgium47, Estonia, France, Latvia,Lithuania, Poland, Spain and Romania) with differing road conditions. Inspections werecarried out between April and October 2012 under relatively good weather conditions. Thefield work concluded that these white sections of road have a good standard of design,appropriate road equipment, as well as a good level of maintenance - the majority of EUWShave a pavement in normal or good condition. Furthermore, it is important to note thatWhiteRoads sections represent stretches of road that have all received adequate funding formaintenance over the past few years.
The final stage of the project was the development of a comparative checklist identifyingcharacteristics common to the white stretches of road. It lists a set of qualities and bestpractices that should be considered in order to design, build and maintain a safe network.These key processes include the requirement to:
Check that the road is up to the TEN-T designated standards;
Check safety levels along the entire route once part of it has been identified as ablack spot;
Ensure that maintenance programmes for the pavement surface exist;
Provide reliable and homogenous traffic signage;
Make sure that electronic road signs are functioning correctly;
Maintain reliable and coherent road markings;
Ensure maintenance programs for traffic guidance equipment;
Provide lighting to all road sections.
47 The main objective of the BE report was "to describe and analyse the geometric characteristics, design, trafficelements for every EUWS identified in BE".
Policy Department B: Structural and Cohesion Policies____________________________________________________________________________________________
68
The WhiteRoads checklist should be considered as a new and complementary tool to thesafety audits and inspections laid down in the Road Infrastructure Safety Directive2008/96/EC for the design, maintenance and management of roads. There is scope for thechecklist to be applied further; so far the WhiteRoads Project has been developed for theTEN-T network only, but its methodology could be applied to other road networks48.
4.4 Performance monitoring at the national level
As mentioned above, most EU MSs have long established procedurse for the monitoring ofroad safety performance on their network. From the case study analysis set out in Annex Ait can be seen that several MSs implement uniform techniques to verify performance acrossa large part of the road network, not limited to the TEN-T ones covered by Directive2008/96/EC. This section reports the evidence collected on performance monitoring atnational level, identifying, where possible, common features and best practice.
To assess a road’s condition, authorities in each MS evaluate a number of commonparameters, including the following:
Skid resistance - to provide a good relationship between road and tire;
Texture (macro and micro) - to evaluate the roughness of the surface;
Longitudinal and transverse profile - to ensure ride comfort;
Rutting, cracks and defects;
Bearing capacity - the ability to sustain a given level of road traffic.
Dedicated monitoring equipment is used to identify and measure these parameters. In mostcases this involves a monitoring vehicle, designed to be used in moving traffic, that recordsthe operational parameters listed above in real time. Vehicles typically use a GPS device torecord administrative data.The photo on the left in figure below shows a vehicle used in Germany to measure thelongitudinal and transverse profile of the road surface by means of laser technology. Thephoto on the right shows a measuring wheel used to assess the skid resistance of the roadsurface. In order to establish a visual record of road surface characteristics, a highresolution camera in combination with special lightning is also used. This camera is fixed atthe rear of the vehicle and is visible in the left hand image of figure.
48 For further details please refer to www.whiteroads.eu.

EU Road Surfaces: Economic and Safety Impact of the Lack of Regular Road Maintenance____________________________________________________________________________________________
69
Figure 27: Vehicles and technology used for recording operational characteristics
Source: Government of Rheinland-Pfalz (2013).
This type of monitoring is usually accompanied by visual inspections. Based on the results ofthese monitoring exercises, some MSs then prepare a cumulative index which provides thenecessary values to assess whether maintenance is necessary and/or when to intervene.
Some MSs also use a Pavement Management System (PMS) that identifies an optimummaintenance strategy taking into consideration budget and other constraints. The followingparagraphs will outline in more detail the various monitoring techniques at national level,and the impact on decision-making for road maintenance.
4.4.1 Monitoring techniques
Monitoring of roads in Germany is done regularly. Federal road quality is assessed atintervals of four years, while state and district roads are generally monitored at five yearintervals. There is no consistent assessment schedule for urban roads, these are theresponsibility of the municipalities. The procedure for road monitoring and assessment(ZEB) was developed jointly by the federal and state governments, and has establishedorganisational and technical structures to carry out the monitoring.
The measured operational characteristics are assigned to the respective road sections andconverted into a score ranging from 1.0 (very good) to 5.0 (very bad). These values arethen combined into sub-target values to indicate the degree of usability and the degree ofdeterioration of the road section. These sub-target values are subsequently merged into onetotal value. The resulting total values for road surface quality are grouped into fourcategories where:
Total Value 1.0 to 1.5 = very good
Total Value 1.5 to 3.5 = acceptable
Total Value 3.5 to 4.5 = bad
Total Value 4.5 to 5.0 = very bad

Policy Department B: Structural and Cohesion Policies____________________________________________________________________________________________
70
Maintenance funding for national roads is allocated by prioritising expenditure on roads withthe worst scores. German municipalities have sought innovative approaches to improveroad conditions whilst simultaneously reducing spending on maintenance activities. Themunicipality of Hamburg, for example, implemented a maintenance process using 100%recycled asphalt. According to most recent observations, the material is of the same qualityas newly produced asphalt, but costs about 30% less.
The National Road Authority (NRA) in Ireland has carried out annual surveys of the entirenational road network since 2010. The most recent survey of regional roads was carried outin 2011, when over 13,000km were surveyed. This data enables the NRA and LocalAuthorities to prioritise maintenance for their work programs. Surveys of regional roadswere also carried out in 1996 and 2004. Local roads have not been surveyed as it is notconsidered to be cost effective.
The recorded parameters were reported for every 100 metre sample unit on the entireregional road network. The NRA recently developed an application that allows LocalAuthorities to upload this data to a central database. The results of the 2011 road scan49 arepresented in Table below which shows the percentage length of regional roads requiringeach particular type of intervention. Due to a change in methodology, direct comparisonsare not possible.
Table 4: Pavement Condition Survey Results: Road sections requiringintervention, by type of intervention
Year RoadConstruction
SurfaceRestoration
Restoration ofSkid resistance
RoutineMaintenance
2004 15.1% 23.7% 39.4% 21.8%
2011 23.9% 21.7% 29.6% 24.7%
Source: NRA (2011).
In Poland, road surface quality analysis is carried out using the System for Road SurfaceEvaluation (SOSN) for asphalt roads, SOSN-B for concrete roads50. This is complemented bySOPO, the System for Evaluation of Roadsides, both developed by the General Directoratefor National Roads and Motorways. Road surface parameters are grouped into fourcategories, A, B, C or D as detailed in Table below. The resulting data is published annually.Maintenance is prioritised for sections which have been categorized as Class D and C.
49 NRA 2011 Survey.50 Asphalt and concrete are two construction materials used to pave road surfaces. The primary difference
between the two is that asphalt is made by mixing aggregate with bitumen, a sticky black hydrocarbon which isextracted from natural deposits or crude oil. Concrete is made by mixing an aggregate material with a cementbinder and then allowing the mixture to harden.
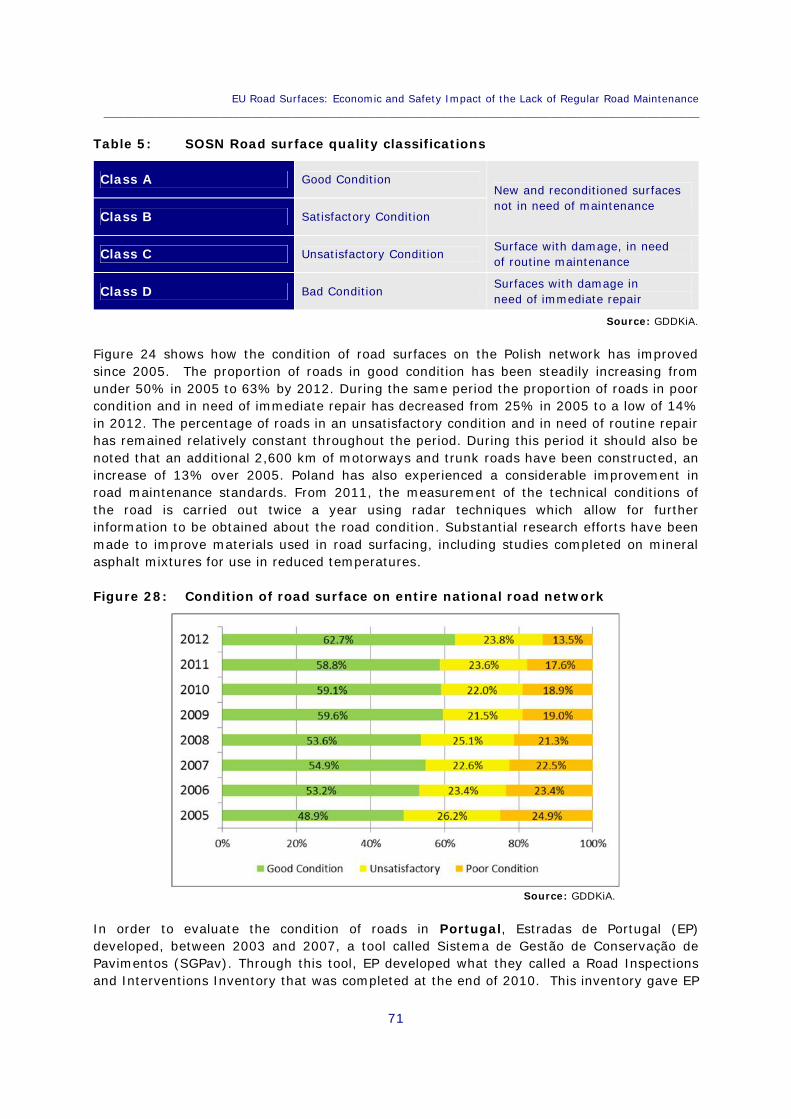
EU Road Surfaces: Economic and Safety Impact of the Lack of Regular Road Maintenance____________________________________________________________________________________________
71
Table 5: SOSN Road surface quality classifications
Class A Good ConditionNew and reconditioned surfacesnot in need of maintenance
Class B Satisfactory Condition
Class C Unsatisfactory Condition Surface with damage, in needof routine maintenance
Class D Bad Condition Surfaces with damage inneed of immediate repair
Source: GDDKiA.
Figure 24 shows how the condition of road surfaces on the Polish network has improvedsince 2005. The proportion of roads in good condition has been steadily increasing fromunder 50% in 2005 to 63% by 2012. During the same period the proportion of roads in poorcondition and in need of immediate repair has decreased from 25% in 2005 to a low of 14%in 2012. The percentage of roads in an unsatisfactory condition and in need of routine repairhas remained relatively constant throughout the period. During this period it should also benoted that an additional 2,600 km of motorways and trunk roads have been constructed, anincrease of 13% over 2005. Poland has also experienced a considerable improvement inroad maintenance standards. From 2011, the measurement of the technical conditions ofthe road is carried out twice a year using radar techniques which allow for furtherinformation to be obtained about the road condition. Substantial research efforts have beenmade to improve materials used in road surfacing, including studies completed on mineralasphalt mixtures for use in reduced temperatures.
Figure 28: Condition of road surface on entire national road network
Source: GDDKiA.
In order to evaluate the condition of roads in Portugal, Estradas de Portugal (EP)developed, between 2003 and 2007, a tool called Sistema de Gestão de Conservação dePavimentos (SGPav). Through this tool, EP developed what they called a Road Inspectionsand Interventions Inventory that was completed at the end of 2010. This inventory gave EP

Policy Department B: Structural and Cohesion Policies____________________________________________________________________________________________
72
a global view of its road network and its condition. To evaluate the condition of the roads,an index that ranges from 0 and 5 is used, where a highest result corresponds to the bestquality. The indicator ranges, classes and strategies to take are shown in Table below.
Table 6: Quality index used by EP
Index Class Strategy
Index<2.5 Bad Need to intervene
1.5≤Index<2.5 Mediocre Need to give the intervention a higher priority
2.5≤Index<3.5 Reasonable Stable network, interventions depend on thechange in quality
≥3.5 Good New Network, no need of intervention
For 2011, the average quality level was 2.82 and this level was kept constant, at around 3,between 2007 and 2011. Maintenance activities are scheduled based on the resultsemerging from the SGPav analysis.
The Department for Transport and the Highways Agency in the United Kingdom havedeveloped a Road Condition Indicator (RCI) to monitor road surface quality. The RCI isbased on a set of indicators which are collected annually using road scanning technologies.The parameters recorded are weighted to obtain the RCI for each 10 metre section of roadsurveyed. The RCI value can fall within a range of 0 to 315. Any value above 100 indicatesthat road conditions are unsatisfactory, and are likely to require maintenance within thenext year.
In Spain, the Spanish Road’s Association (Asociación Española de la Carretera), has stated,after extensive monitoring, that the condition of the road surface is poor. As shown in thefigure belowError! Reference source not found., the quality of the road surface(national, local and municipal) in Spain improved in the 1980s and then worsened from thebeginning of the century to 2011.
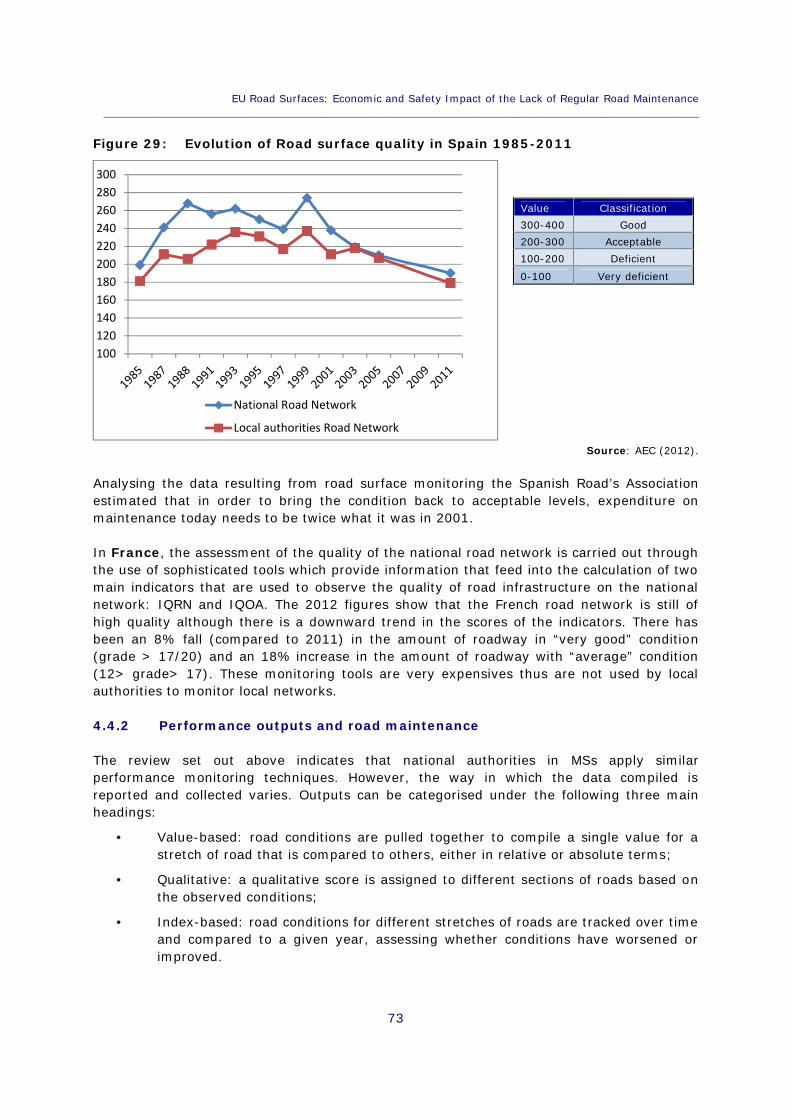
EU Road Surfaces: Economic and Safety Impact of the Lack of Regular Road Maintenance____________________________________________________________________________________________
73
Figure 29: Evolution of Road surface quality in Spain 1985-2011
Value Classification300-400 Good200-300 Acceptable100-200 Deficient
0-100 Very deficient
Source: AEC (2012).
Analysing the data resulting from road surface monitoring the Spanish Road’s Associationestimated that in order to bring the condition back to acceptable levels, expenditure onmaintenance today needs to be twice what it was in 2001.
In France, the assessment of the quality of the national road network is carried out throughthe use of sophisticated tools which provide information that feed into the calculation of twomain indicators that are used to observe the quality of road infrastructure on the nationalnetwork: IQRN and IQOA. The 2012 figures show that the French road network is still ofhigh quality although there is a downward trend in the scores of the indicators. There hasbeen an 8% fall (compared to 2011) in the amount of roadway in “very good” condition(grade > 17/20) and an 18% increase in the amount of roadway with “average” condition(12> grade> 17). These monitoring tools are very expensives thus are not used by localauthorities to monitor local networks.
4.4.2 Performance outputs and road maintenance
The review set out above indicates that national authorities in MSs apply similarperformance monitoring techniques. However, the way in which the data compiled isreported and collected varies. Outputs can be categorised under the following three mainheadings:
Value-based: road conditions are pulled together to compile a single value for astretch of road that is compared to others, either in relative or absolute terms;
Qualitative: a qualitative score is assigned to different sections of roads based onthe observed conditions;
Index-based: road conditions for different stretches of roads are tracked over timeand compared to a given year, assessing whether conditions have worsened orimproved.
100120140160180200220240260280300
National Road Network
Local authorities Road Network
Policy Department B: Structural and Cohesion Policies____________________________________________________________________________________________
74
From the analysis undertaken it emerged that different EU MSs use different types of outputindicators and, in many cases, use a mixture of them. France uses indicators based on amix of value-based and index-based outputs; Germany and Portugal use qualitativeindicators; Poland a mixture of qualitative and index-based indicators and the UK approachtakes into account all the three type of output indicators mentioned above (i.e. value-based,qualitative, index-based)51.
Consequently, in Member States where road maintenance activities are carried outaccording to the outcomes of the monitoring process, prioritisation rules depend on the wayoutputs are assessed. Consequently some national authorities decide to prioritise roads withthe worst absolute indicators (e.g. Poland), while others address the roads that aredeteriorationg (e.g. UK).
In addition, the approaches to prioritisation of maintenance activities increasingly rely onuser-fed information, thanks to the growth of social media across Europe. In the UK, theHighways Agency traditionally relies on the nationally standardised procedures forperformance assessment described above. However local authorities have recently beenpromoting innovative approaches to road maintenance. For instance, some local authorities,including London, have been developing electronic or web-based systems for the public toreport potholes and road defects directly to road managers.
The average numbers of reports received from the public by each local authority in England(excluding London) in the financial year 2012/13 is over 12,000. This is up by around1,000, or nearly 10%, on the year before. The total number of reports from the generalpublic was 1.6 million, compared to 1.5 million in 2011/12. Going forward, other competentauthorities across Europe may also start to rely on user-fed information as well as usingmore thorough technical investigations.
In addition to this, in light of the shaping of a more homogenous framework for road safetymonitoring and maintenance programming across the EU – that could accompany a moredetailed assessment and potential revision of Directive 2008/96/EC – research thatinvestigated in detail the procedures in place across the different MSs accompained by anexchange and sharing of best practice and experience could certainly be of help. This wouldallow MSs that do not have well established procedures or suffer maintenance budget cutsto introduce tools able to improve the cost effectiveness of their actions.
51 See Annex A.
EU Road Surfaces: Economic and Safety Impact of the Lack of Regular Road Maintenance____________________________________________________________________________________________
75
KEY FINDINGS
Only a small proportion of accidents seem to be caused by road design and/or poorroad maintenance. Instead driver behaviour seems to be the principal contributor toaccidents. Nevertheless, in many circumstances, it is difficult to disentanglecausality. A consistent design of a road’s geometry is an important factor in ensuringa safe road; another important provision is an appropriate level of service for theanticipated traffic flow.
It was only with the approval of Directive 2008/96/EC of 19 November 2008 thata framework for road infrastructure safety management in the EU was set for roadsbelonging to the TEN-T network. Though it represents a valid step forward in thecreation of a harmonised framework for road safety monitoring in the EU, thisDirective only applies to the TEN-T corridors and is subject to differentinterpretations and dissimilar implementation across the EU. In particular, as itfocuses only to procedural aspects of road safety monitoring, it leaves room forsignificant variability in the operational activities undertaken by different EU MSs.
Two research projects have recently tried to overcome some of the limits of Directive2008/96/EC. The Pilot4safety project developed a manual, complemented by acollection of best practices, that could be a starting point to develop acomprehensive tool that standardises the operational prescriptions to beimplemented by road operators and authorities in EU MS in order to guarantee aneven and balanced level of road maintenance across Europe.
The WhiteRoads project identifies road sections along the Trans-European RoadNetwork (TEN-T) where no accidents have happened during the study period, despitehigh traffic flows. Road sections of the TEN-T – so called ‘white-spots’ – have beenidentified by the study and used to point out the key features that allowed them toachieve such a high level of road safety.
Good road design, the presence of adeguate maintenance programmes, theinstallation of reliable and homogenous traffic signage and road markings andadeguate lighting are among the key aspects that determine the success of whitespots. The checklist developed within the WhiteRoad project should be considered asa new and complementary tool to the safety audits and inspections laid down in theRoad Infrastructure Safety Directive 2008/96/EC on the design, maintenance andmanagement of roads and could also be applied to other relevant road sections notbelonging to the TEN-T network.
Several EU MSs have a well established procedure for the monitoring of roadconditions and the prioritasation of interventions. In many cases however, this doesnot extend to local or urban roads. Where road maintenance activities are carried outaccording to the outcomes of the monitoring process, prioritisation rules depend onthe way outputs are assessed. For example while some national authorities decide toprioritise roads with the worst absolute indicators (e.g. Poland), others address theroads that are seen to be deteriorating (e.g. UK).

Policy Department B: Structural and Cohesion Policies____________________________________________________________________________________________
76
From the case studies, a number of best practices have been identified that couldhelp to improve the cost-effectiveness of maintenance activities on local roads suchas: i) the recourse to user-fed information, where electronic or web-based systemsare used to allow drivers to report potholes and highway defects directly to roadmanagers or ii) the utilisation of recycled asphalt, a material that has the same levelof quality as newly produced asphalt, but costs about 30% less.

EU Road Surfaces: Economic and Safety Impact of the Lack of Regular Road Maintenance____________________________________________________________________________________________
77
SOCIO-ECONOMIC IMPACTS OF ROAD5.MAINTENANCE ACTIVITIES
The importance of dedicating a significant amount of resources to road maintenance hasbeen highlighted throughout this study. A number of stakeholders52 in different MemberStates have expressed concerns about the growing maintenance backlog in their countries,resulting in lower road safety standards and losses in efficiency. However, the assessmentof the socio-economic impacts of variations in road maintenance resources present somechallenges.
This chapter outlines the methods used to assess such impacts and offers an overview ofthe key technical data requirements. The analysis is presented under three headings:
Road transport efficiency, particularly in terms of vehicle operating costs;
Safety and health impacts for road transport users;
Wider socio-economic impacts, including impacts on economic growth.
This chapter also includes a review of the potential impact of Longer and Heavier Vehicles(LHVs) on long-term road maintenance requirements, and an assessment of whether anyadditional costs can be, at least in part, covered by additional funding sources.Due to their limited duration and impact, this chapter does not look at the potentialdisbenefits due to travel disruptions that could be generated from road closures. It isimportant to note however that the effect is proportionally more significant on the local roadnetwork because maintenance work zones on single carriageway roads cause comparativelymore disruption than on multilane highways.
5.1 Road transport efficiency
5.1.1 Vehicle operating costs
The efficiency of the road haulage market depends on a number of factors, ranging fromlabour costs to road infrastructure quality. The competitiveness of a country’s or a region’sgoods transport sector thus varies considerably across Europe. In addition, private car usersface significant private costs from the maintenance and repair of their vehicles, which alsovary greatly depending on the characteristics of local roads.
Anecdotal evidence on the direct relationship between road maintenance and vehicleoperating costs has been provided by a number of stakeholders participating in this study.For example, the Freight Transport Association in Ireland and the Federation ofMotorcyclists in France have complained about the increase in vehicle repairs due todeteriorating road surfaces.
52 The stakeholders that have been consulted fall into the following categories: road users, associations of localauthorities, associations of asphalt producers, infrastructural managers.

Policy Department B: Structural and Cohesion Policies____________________________________________________________________________________________
78
The World Bank has developed a series of tools to assess the economic benefits of amarginal change in maintenance expenditure through the use of the Highway Developmentand Management Model, currently in its fourth version (HDM-4). The model is useful toassess the implications of maintenance expenditure in terms of traffic delays and vehicleoperating costs. It also offers a good analytical framework within which to analyse theeffects of road conditions on vehicle operations. The main elements that contribute tovehicle operational efficiency are:
Fuel consumption ;
Tire repairs costs ;
Costs of other vehicle maintenance, repairs (e.g. shock absorbers) ;
Depreciation.
In addition, the model can analyse the relationship between road characteristics, vehicleperformance and economic or environmental impacts. For example, lower speeds (whichcan be due to bad road conditions) lead to increased fuel consumption, as shown in thefigure 26. As speed is reduced below 40 km/hour, the rate of fuel consumption per kmincreases substantially, from 80 litres per kilometre to more than 150 litres per kilometre.
Figure 30: Relationship between speed and fuel consumption
Note: India-1, India-2, India-3, Carribbean and Kenya are the labels assigned to different models used by theWorld Bank to compute Vehicle Operating Costs (VOC).Source: World Bank, Highway Develompment and Management-4 Road User Effects.
Transport Scotland has recently carried out a comprehensive study on the socio-economicimpacts of maintenance spend in Scotland, using HDM-4 as part of the cost-benefit analysisto assess different spending scenarios. For a scenario in which funding is reduced by 40%compared to current levels, the total increase in vehicle operating costs, for local roads and
EU Road Surfaces: Economic and Safety Impact of the Lack of Regular Road Maintenance____________________________________________________________________________________________
79
trunk roads, discounted over 20 years, is estimated to be more than £3.5 billion53. Thisfigure, albeit large, represents an increase of only about 1% compared with the base casewith no reductions in spending.
Results from the analysis carried out in Poland as part of the JASPERS54 project suggestsimilar conclusions. By comparing vehicle operating costs at different speeds, it has beenestimated that at a speed of 60 km/h the difference in operating costs is PLN 0.017/km(€0.004/km) for cars and PLN 0.1/km (€0.02km) for goods vehicles. Hence vehicleoperating costs appear to be in region of 2-3% higher when travelling on roads withdeteriorated pavement conditions.
Further evidence emerged from a study carried out by Infraplanas in Lithuania. This studyestimated the savings in transport costs for road users (excluding travel time savings) ofroad rehabilitation. For each Euro invested in road maintenance, they calculated transportcost savings in the region of €0.7 for urban road users and €1.4 for rural road users.
Finally, studies carried out on the Spanish road network since the ‘80s have concluded thatpoor road surface can increase fuel consumption in light vehicles by 34% (12% for heavyvehicles) compared to a road in good conditions55. A poorly maintained road surface canalso lead to faster deterioration of tyres, worsening their lifespan by 66% for light vehiclesand 10% for heavy vehicles.
It should be noted that lower transport costs, resulting from good maintenance, have apositive effect on the wider economy by reducing the overall cost of production along thesupply chain.
5.1.2 Motor insurance claims
The number and value of requests for damages made by road users to local authorities hasalso proven helpful to shed some light on the extent to which extra costs are borne by roadusers due to the lack of maintenance. A consultation carried out by Insurance Europe in thecontext of this study has shown that some insurance schemes have been set up by highwayoperators in France, Italy, Austria and Poland. The limits for liability are usually around€50m.
In these Member States, claims are made frequently by road users. In Poland, on averagemotorists make about 2,000 per year for a network of around 17,000km managed by thenational authority GDDKiA. In England and Wales, the results from the survey carried outamong local authorities indicates that the overall cost of motor insurance claims amountedto just under £32m (€38.5m) in the financial year 2011/12.
53 Transport Scotland, Economic, Environmental and Social Impact of Changes in Maintenance Spend on Roads inScotland, Summary Report 2012.
54 The Jaspers Blue Book (2008).55 Protti, J. (2012), Los mensajes sobre la conservación y la realidad de la conservación de nuestros firmes de
Carreteras, Revista Asfalto y Pavimentación número 7.

Policy Department B: Structural and Cohesion Policies____________________________________________________________________________________________
80
Further evidence emerged in Britain indicating that councils have paid out a total of £2.5m(€3m) in compensation to motorists in the financial year 2012/13 for pothole relateddamage to cars (an increase of 80% over the previous year).
Table 7: Compensation claims by Local Authorities (LA) in Great Britain
Indicators YEAEngland London Wales
Number of staff hours spent onclaims (on average, per LA)
2012 183 125 99
2011 172 131 93
Annual amount spent(on average, per LA)
2012 £87k £53k £38k
2011 £105 £68 £55k
Amount paid to road users inclaims (total) 2012 £23.8m £6.3m £1.8m
Source: ALARM Survey (2012 and 2013).
Other than the direct cost of claims, poor road maintenance also adds an indirect cost interms of working hours spent by public sector employees to deal with these claims, asdetailed inTable 7. Their time could be better spent on other tasks that could instead lead to animprovement in local road transport efficiency and maintenance.
By observing the trends of these claims over time, it is possible to have an indication of therelative resilience of national and local road networks. As part of this project, we haveattempted to collect such information but came across several limitations, including theissues of time lags and the fact that the volume of claims depends on the availability ofinsurance as well as road quality. By further engaging insurance providers across Europe,new research could provide interesting conclusions in this area.
5.2 Safety and health impacts
The costs of road accidents can be quantified in economic terms, as is done in some MSs.These costs encompass both human costs and material costs such as those in relation todamage of property and settlement costs. In the Netherlands, the Institute for Road SafetyResearch (SWOV) reports that, in 2011, the costs associated with road accidents amountedto € 12.5 billion, or 2.2% of GDP. By way of an example, the following table, taken from aSWOV document, shows the breakdown of the estimated social costs of road accidents.
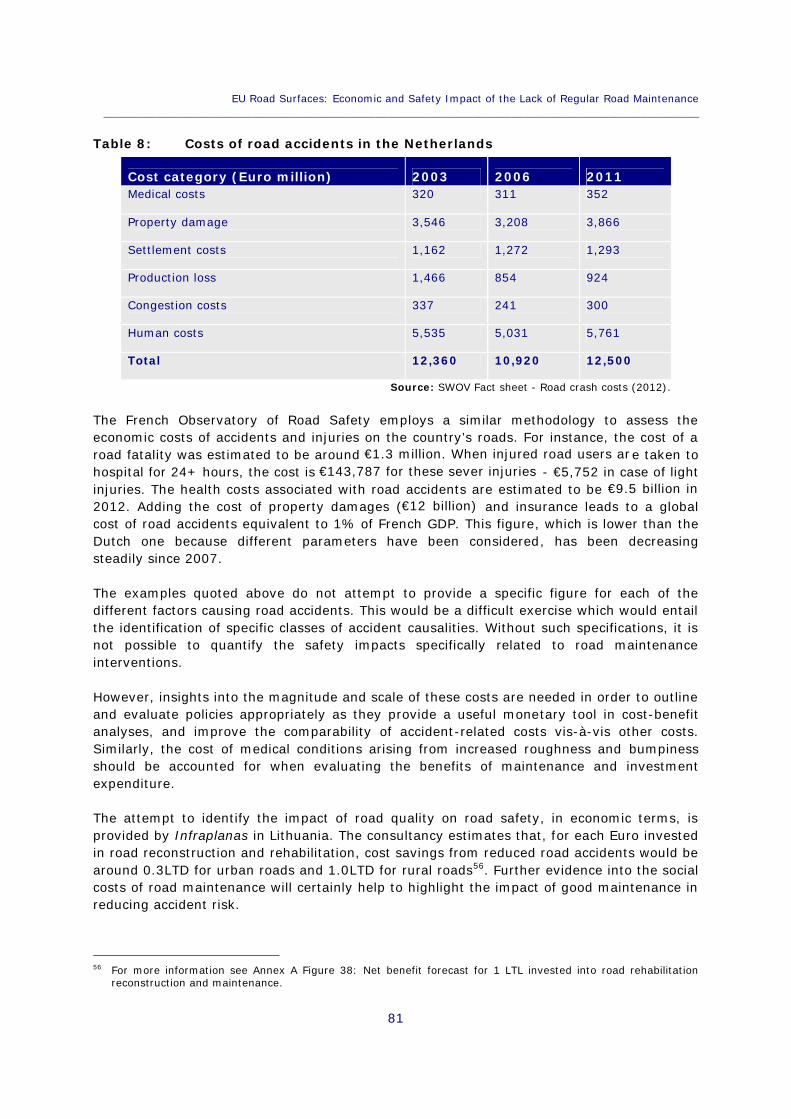
EU Road Surfaces: Economic and Safety Impact of the Lack of Regular Road Maintenance____________________________________________________________________________________________
81
Table 8: Costs of road accidents in the Netherlands
Cost category (Euro million) 2003 2006 2011Medical costs 320 311 352
Property damage 3,546 3,208 3,866
Settlement costs 1,162 1,272 1,293
Production loss 1,466 854 924
Congestion costs 337 241 300
Human costs 5,535 5,031 5,761
Total 12,360 10,920 12,500
Source: SWOV Fact sheet - Road crash costs (2012).
The French Observatory of Road Safety employs a similar methodology to assess theeconomic costs of accidents and injuries on the country’s roads. For instance, the cost of aroad fatality was estimated to be around €1.3 million. When injured road users are taken tohospital for 24+ hours, the cost is €143,787 for these sever injuries - €5,752 in case of lightinjuries. The health costs associated with road accidents are estimated to be €9.5 billion in2012. Adding the cost of property damages (€12 billion) and insurance leads to a globalcost of road accidents equivalent to 1% of French GDP. This figure, which is lower than theDutch one because different parameters have been considered, has been decreasingsteadily since 2007.
The examples quoted above do not attempt to provide a specific figure for each of thedifferent factors causing road accidents. This would be a difficult exercise which would entailthe identification of specific classes of accident causalities. Without such specifications, it isnot possible to quantify the safety impacts specifically related to road maintenanceinterventions.
However, insights into the magnitude and scale of these costs are needed in order to outlineand evaluate policies appropriately as they provide a useful monetary tool in cost-benefitanalyses, and improve the comparability of accident-related costs vis-à-vis other costs.Similarly, the cost of medical conditions arising from increased roughness and bumpinessshould be accounted for when evaluating the benefits of maintenance and investmentexpenditure.
The attempt to identify the impact of road quality on road safety, in economic terms, isprovided by Infraplanas in Lithuania. The consultancy estimates that, for each Euro investedin road reconstruction and rehabilitation, cost savings from reduced road accidents would bearound 0.3LTD for urban roads and 1.0LTD for rural roads56. Further evidence into the socialcosts of road maintenance will certainly help to highlight the impact of good maintenance inreducing accident risk.
56 For more information see Annex A Figure 38: Net benefit forecast for 1 LTL invested into road rehabilitationreconstruction and maintenance.

Policy Department B: Structural and Cohesion Policies____________________________________________________________________________________________
82
5.3 Wider socio-economic impacts
5.3.1 The analytical framework
Transport can make a substantial contribution to improving the efficiency of the internalmarket. As such, the quality of road infrastructure facilitates the smooth transportation ofgoods both nationally and across MSs. Good maintenance plays a crucial role in ensuringthat the quality of road surfaces is high.
Assessing the costs and benefits of road maintenance is, once again, not a trivial task. Areview of the literature produced in different Member States has highlighted which impactstend to be considered when assessing the wider benefits of road maintenance spending. Inthe Transport Scotland study mentioned above57, the following benefits from roadmaintenance were deemed to be quantifiable58:
Travel time savings;
Lower deterioration of road asset values.
In addition, evidence from Scotland – within the UK case studies – and other case studies(e.g. Poland) suggests that maintenance and investment of the road network affects theeconomic development of more remote regions across Europe.
5.3.2 Travel time savings
The reduction in journey times associated with timely maintenance is one of the most widelyrecognised economic benefits of road maintenance. When roads are well maintained, thelikelihood of road closures due to unforeseen events is reduced. Similarly, routinemaintenance can be better planned to avoid peak times, as opposed to reactivemaintenance which may not be delayed even when it causes disruptions.
More importantly, the good state of roads is the primary prerequisite for ensuring efficienttraffic movements. Journeys for commuter cars, goods transport vehicles and deliveryservices can be significantly shorter if they take place in roads without potholes, even whenweather conditions are adverse. These time savings directly impact the productivity ofnational and local businesses.
According to a survey by the Manufacturers’ Association, the poor maintenance of manylocal roads in Britain: “…is adversely impacting manufacturing on a number of core businessactivities. Three-quarters of manufacturers cite it as a barrier to sending and receivingproducts and raw materials”. The Association explains that “more than 60% see it as animpediment to recruiting and sustaining relationships with customers and suppliers. Themajority of manufacturers are experiencing significantly increased operating costs andnearly a third a fall in productivity as a result of sub-optimal road quality” (EEF 2012).
57 Transport Scotland, Economic, Environmental and Social Impact of Changes in Maintenance Spend on Roads inScotland, Summary Report 2012.
58 The study found that the first two sets of benefits could only be quantified for principal roads. In the case oftime savings, this is because only higher speeds on good quality roads lead to significant savings. For skidding-related accidents, there was not enough evidence to assess the impact on local roads.
EU Road Surfaces: Economic and Safety Impact of the Lack of Regular Road Maintenance____________________________________________________________________________________________
83
A survey of Small and Medium Enterprises in England and Wales carried out by the AsphaltIndustry Association (2010) found that 68% of SMEs consider road maintenance veryimportant for the success of their business, while 44% of businesses thought that localroads were not very well maintained. When asked to point to the main business costsarising from poor maintenance, SMEs indicated the following: negative productivity impactsin terms of time wasted, as well as lost competitiveness from higher vehicle operating costsand fuel consumption. The survey further attempts to quantify the average cost of poormaintenance per business, estimating these to be £13,600 per year (€16,300).
5.3.3 The value of road assets
The OECD has published a series of papers summarising the existing evidence on valuingroad assets and planning for road maintenance in order to preserve this value over time, aswell as to optimise the level of expenditure against the foreseen costs. Funding for roadmaintenance is often postponed when pressure is put on budgets because a lack ofmaintenance does not necessarily lead to immediate failure of the network. However,maintenance deferral can be expensive in the long run. Short-term cost savings fromdeferring maintenance may be outweighed, even in present value terms, by the consequentneed for more expensive treatments in the future.
Deferred maintenance refers to the amount of maintenance and rehabilitation work thatshould have been completed to retain the road surface in an acceptable condition but had tobe deferred due to reduced maintenance funding or policy changes for the preventivemaintenance and/or pavement rehabilitation programs.
Pavements that remain untreated can deteriorate at a faster rate. The cost of repairsincreases disproportionately as the condition of the pavement decreases over its life.Deferring pavement related preventive maintenance or rehabilitation can lead to asubstantial increase in the required repair costs.
Given that, in the long run, deferring maintenance can make future costs greater, thechallenge is to provide additional information on the value of roadway facilities and the costsassociated with deferred maintenance spending. In particular, it is to quantify the costs ofunderfunding in order to bring these costs to the attention of decision makers as pointedput by Philippe, Kauppilla, Vassallo and Wlaschin (2013)59.
Harvey (2012)60 proposes a way of communicating the cost of maintenance deferral todecision makers through a measure termed the “equivalent interest rate for deferredmaintenance” (EIRDM). He sees deferring maintenance as a form of borrowing. Funds aresaved in the short-term at the expense of higher outlays in the future. Estimating an EIRDMenables comparisons to be made between cost of borrowing through maintenance deferraland conventional borrowing to fund current expenditures on maintenance.
Evidence emerging from the national case studies shows that research has advanced inseveral Member States, leading to the estimation of “road maintenance backlogs”. Thesefigures, expressed in terms of millions of Euros, are perhaps indicative of the desire by
59 Philippe, C., Kauppilla, J., Vassallo, J. and Wlaschin, B., Asset Management for Sustainable Road Funding,Discussion Paper 13, 2013, ITF/OECD.
60 Harvey, Mark, Optimising Road Maintenance, Discussion Paper 12, 2012, ITF/OECD.
Policy Department B: Structural and Cohesion Policies____________________________________________________________________________________________
84
stakeholders to summarise the problem of neglecting road assets in a single figure. Someexamples of these estimates include the following:
In Britain, Bayliss (2012) estimates a funding shortfall of as much as £1 billion(€1.2 billion) a year since 2000. The cost of clearing the backlog maintenance wasestimated to cost £9.7 billion (€11.6 billion), and even if local authorities had therequired funding and staff, it would take 11 years to eliminate.
The National Road Authority of Ireland has estimated the replacement cost of thenetwork to be in the around €30 billion. With a 20-30 year life-cycle cost, thenetwork would deteriorate by €1 - €1.5 billion per year with no maintenancebudget. With expenditure forecast to be in the realm of €500 million per year, asignificant shortfall is likely to arise61.
5.3.4 Summary of wider socio-economic impacts
The volume of road maintenance expenditures yields substantial wider socio-economicimpacts. Some of these, such as the value of travel time savings, can be quantified inaccordance with existing analytical frameworks at the national or at the European level.Other impacts, despite being important outcomes of road maintenance, are better describedfrom a qualitative point of view.
Examples of the quantification of wider economic impacts include the aforementionedstudies in Scotland and Lithuania: these studies indicate that the reduction in roadmaintenance expenditure can have an impact to the wider economy in the range of 100%-250%62.
In Germany, the ADAC (2011) claims that the condition of the German road network isgradually worsening and that a lack of road maintenance can result in total macroeconomiccosts equivalent to 4% of German GDP.
Overall, timely and effective maintenance is thus fundamental to ensure that the internalmarket is working efficiently. It has also been shown that good road maintenance leads tolower transport costs and has positive implications on the safety and health of transportusers. The inherent differences in the recording and quantification of those impacts,however, poses severe challenges to any attempts to monetise the impacts of maintenanceinterventions.
The diagram below summarises the conceptual framework that we recommend for anycomprehensive assessment of the socio-economic impacts of a change in road maintenanceexpenditure, based on our review of the literature mentioned above.
No relevant evidence relating to road maintenance environmental impacts has beenidentified during the course of this study. A well maintained road surface reduces thedeterioration rate of tyres and also fuel consumption but these have to be balanced againstthe additional environmental negative externalities from the maintenance activity.
61 See Annex A paragraph 4.5 Socio-economic impacts of road maintenance in Ireland.62 Transport Scotland’s assessment shows that « for every £1 reduction in road maintenance, there is a cost of
£1.50 to the wider economy ». The multiplier effect estimated in Lithuania is even higher: for every 1 LTL spentto rehabilitate roads, the net benefit over 25 years is forecast to be around 2.5 LTL.
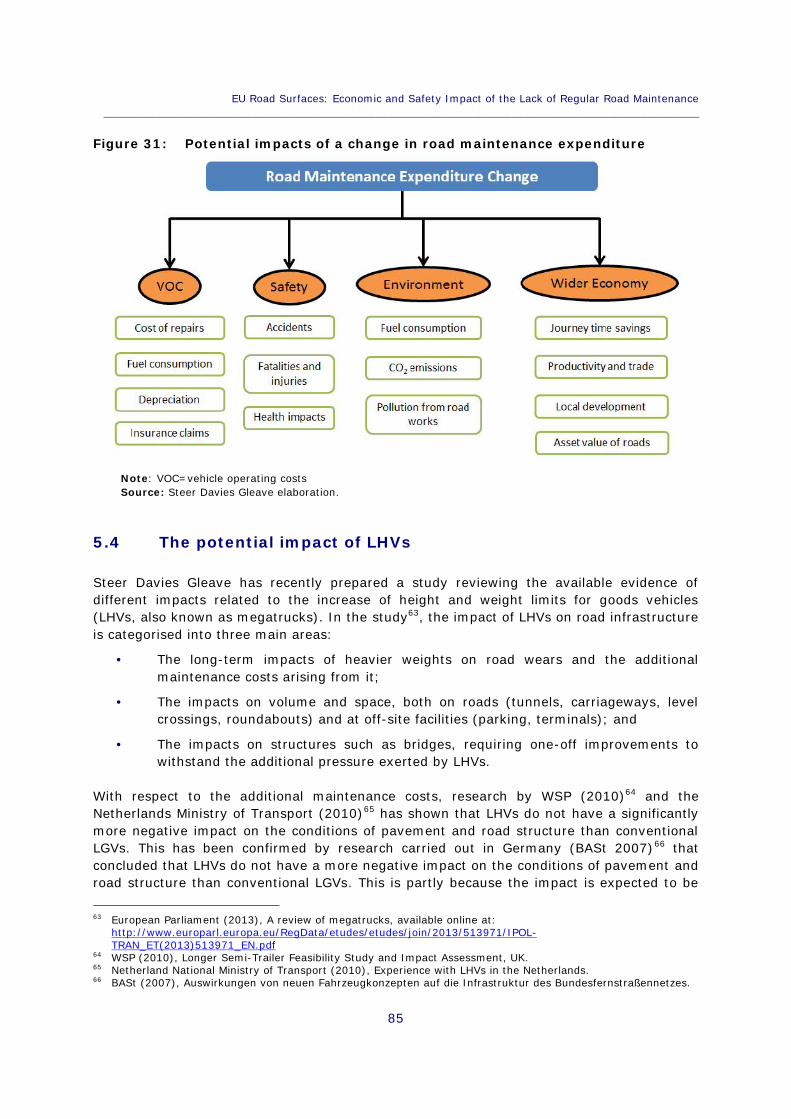
EU Road Surfaces: Economic and Safety Impact of the Lack of Regular Road Maintenance____________________________________________________________________________________________
85
Figure 31: Potential impacts of a change in road maintenance expenditure
Note: VOC=vehicle operating costsSource: Steer Davies Gleave elaboration.
5.4 The potential impact of LHVs
Steer Davies Gleave has recently prepared a study reviewing the available evidence ofdifferent impacts related to the increase of height and weight limits for goods vehicles(LHVs, also known as megatrucks). In the study63, the impact of LHVs on road infrastructureis categorised into three main areas:
The long-term impacts of heavier weights on road wears and the additionalmaintenance costs arising from it;
The impacts on volume and space, both on roads (tunnels, carriageways, levelcrossings, roundabouts) and at off-site facilities (parking, terminals); and
The impacts on structures such as bridges, requiring one-off improvements towithstand the additional pressure exerted by LHVs.
With respect to the additional maintenance costs, research by WSP (2010)64 and theNetherlands Ministry of Transport (2010)65 has shown that LHVs do not have a significantlymore negative impact on the conditions of pavement and road structure than conventionalLGVs. This has been confirmed by research carried out in Germany (BASt 2007)66 thatconcluded that LHVs do not have a more negative impact on the conditions of pavement androad structure than conventional LGVs. This is partly because the impact is expected to be
63 European Parliament (2013), A review of megatrucks, available online at:http://www.europarl.europa.eu/RegData/etudes/etudes/join/2013/513971/IPOL-TRAN_ET(2013)513971_EN.pdf
64 WSP (2010), Longer Semi-Trailer Feasibility Study and Impact Assessment, UK.65 Netherland National Ministry of Transport (2010), Experience with LHVs in the Netherlands.66 BASt (2007), Auswirkungen von neuen Fahrzeugkonzepten auf die Infrastruktur des Bundesfernstraßennetzes.
Policy Department B: Structural and Cohesion Policies____________________________________________________________________________________________
86
smaller due to lower tonnage per axle. At the same time, though, the BASt study pointedout that the introduction of LHVs with a length of up to 25.25m would require substantialinvestment in infrastructure as the current road infrastructure in Germany is not designedfor LHVs.
Vehicle weight is not considered to be a sufficient indicator of strain for road wear. Theactual weight-per-axle needs to be taken into account when assessing the impacts of LHVs.Despite their increased weight, LHVs often have a greater number of axles across whichweight can be distributed, therefore reducing the axle load. The importance of assessingaxle load rather than vehicle load is emphasised both by TML (2008)67 and VTI (2008)68,both of which note that weight-per-axle might even be lower for LHVs.
However the potential impact of LHVs remains ambiguous given the limited number ofvehicles currently circulating in Europe. Should road deterioration caused by extra-dimensioned vehicles take place, then it will be necessary for road managers to developaccurate systems that relate road usage to damage estimations. A better understanding ofsuch correlation will result in the possibility to apply road user charges that better reflectthe damaging potential of those vehicles.
The current regulatory framework for user charges (‘Eurovignette’) was introduced in 2011by Directive 2011/76/EU. In contrast with the former framework directive which was limitedto trans-European roads, the new rules may now be extended to cover all motorways.
Although no reference is made in the Directive to the impact of road wear as one of thecriterion to modulate charges, the European Commission has recently conducted an ex-postevaluation69 of Directive 2011/76/EU which concluded that the Member Staters are notmaking full use of the opportunity for wider differentiation of toll rates.
Currently, Member States may apply an “external cost charge” on heavy vehicles in order toachieve the key policy goals of reducing the negative external impacts of transport. Thelevel of tolls will be dependent upon the emissions of the vehicle, the distance travelled, aswell as the location and time of the road use. In a recent statement70, TransportCommissioner Kallas suggested that these charges would be subject to multipliers for LHVsunder a reformed Eurovignette system.
Besides the difficulties in calculating such “external costs” with respect to LHVs, furtherproblems in the implementation of nation-wide tolling schemes accounting for the externalcost charge envisaged by the Eurovignette Directive have recently emerged. In this respect,the European Parliament has invited71 the European Commission to review Annex I toDirective 96/53/EC and report on its implementation, taking into account, inter alia, impacts
67 TML (2008), Effects of adapting the rules on weights and dimensions of heavy commercial vehicles asestablished within Directive 96/53/EC. Final report.
68 VTI (2008), The effects of long and heavy trucks on the transport system, Sweden.69 Commission staff working document: Ex-post evaluation of Directive 1999/62/EC, as amended, on the charging
of heavy goods vehicles for the use of certain infrastructures [SWD(2013)1].70 Please see “After Eurovignette, EU asks: For whom the road tolls?”, EurActiv.com, 19/09/2013
(http://www.euractiv.com/specialreport-road-transport-dri/eu-asks-road-tolls-news-530550).71 See European Parliament Legislative Resolution of 15 April 2014 on the Proposal for a Directive of the European
Parliament and of the Council amending Directive 96/53/EC of 25 July 1996 laying down for certain roadvehicles circulating within the Community the maximum authorised dimensions in national and internationaltraffic and the maximum authorised weights in international traffic.

EU Road Surfaces: Economic and Safety Impact of the Lack of Regular Road Maintenance____________________________________________________________________________________________
87
on international competition, modal split, costs of infrastructure adaption and theenvironmental and safety objectives of the European Union as set in the 2011 White Paperon Transport. By 2016, the Commission shall review Annex I to Directive 96/53/EC andsubmit a report on its implementation to the European Parliament and the Council. On thebasis of this report, the Commission, shall, if appropriate, make a legislative proposal dulyaccompanied by an impact assessment.
KEY FINDINGS
Some research has been undertaken on the economic impacts of roadmaintenance showing that good road maintenance can have a positive impact oneconomic activity.
There is also evidence of the social cost of road accidents which has beenquantified in studies in France, Lithuania and the Netherlands. While the majority ofroad accidents are down to driver behaviour, some of those accidents could be as aresult of drivers behaving in a certain way to account for poor road maintenance.
The reduction in journey times associated with timely maintenance is one of themost widely recognised economic benefits of road maintenance. A survey carried outby the Asphalt Industry Association (2010) found that the average cost of poormaintenance per business, at £13,600 per year (€16,300).
Transport Scotland’s assessment of wider economic impacts shows that “for every£1 reduction in road maintenance, there is a cost of £1.50 to the wider economy. Iffigures were available to quantify aspects not currently included in the quantitativeanalyses, it is expected that these would only enhance the conclusion”. Themultiplier effect estimated in Lithuania is even higher: for every 1 LTL spent torehabilitate roads, the net benefit over 25 years is forecast to be around 2.5 LTL.
There is no evidence that the use of LHVs will materially affect road maintenance asthe increased weight of the vehicles is distributed over a larger number of axles. Onthe contrary, the introduction of LHVs would require substantial investment ininfrastructure in MS where the current road infrastructure is not designed for LHVs.

Policy Department B: Structural and Cohesion Policies____________________________________________________________________________________________
88
EU Road Surfaces: Economic and Safety Impact of the Lack of Regular Road Maintenance____________________________________________________________________________________________
89
CONCLUSIONS6.
6.1. Lessons learned
As discussed in Chapter 2, between 2000 and 2010 road safety improved significantlyacross the EU. The number of road fatalities fell to 31,000, a level corresponding to 57% ofthe fatalities registered in 2001, falling short of the target set in the 3rd European RoadSafety Action Programme (ERSAP) of halving the number of road fatalities registered in2001 by 2010 but still a significant achievement. This reduction was achieved despite ageneral growth of road traffic over the same period. Provisional data for 2013 indicate thatroad fatalities are still decreasing, as an overall number of 26,000 fatalities has beenregistered in the EU. For the coming years, the European Commission renewed its objectiveof halving road fatalities by 2020 through increased focus on the enforcement of road rules.
The root causes of road accidents are hard to disentangle. Human factors play adominant role, but the quality of road infrastructure is also a key-factor. As discussed inChapter 4, there are various aspects of the road’s condition which contribute to its safety. Aconsistent design of a road’s geometry is an important factor in ensuring a safe road.Another important provision is an appropriate level of service for the anticipated traffic flow.Both these aspects fall within investment activities rather than maintenance. Nevertheless,also the lack of regular road maintenance can contribute to the worsening of the quality ofthe road surface. High level of pavement friction, clear signage and road markings areimportant qualities of a safe road and it is important that they are maintained throughoutthe road’s lifespan. Anomalies, such as ruts and depressions, reduce road safety as theyaffect driver fatigue, can create a hazard for drivers and can cause aquaplaning in wetconditions.
To date the framework for road maintenance planning and activities to address safety issuesis very fragmented. Directive 2008/96/EC – the legislative intervention that disciplinesroad infrastructure safety management – deals only with the methodological and proceduralaspects to be followed for road safety assessment on EU TEN-T roads, without providingprescriptions on the type of materials to be used or equipment to be installed.
A key factor behind the undertaking of regular road maintenance activities is also thecommitment and availability of sufficient budget to dedicate to road works. A key questionthat this study has thus tried to investigate in Chapter 3 is whether there has been anyvariation in road maintenance expenditure in the EU in recent years that can beattributed to the 2008 economic and financial crisis.
A number of difficulties have been encountered in evaluating the relationship between theeconomic cycle and road maintenance expenditure. The lack of clear definitions andcommon practices to measure road transport infrastructure spending hinders accuratemeasurement of these aggregates and impede a robust assessment of how this spendingrelates to economic growth. To date the ITF provides the most accurate and updateddataset on transport infrastructure expenditure, which includes the figures on roadmaintenance and investment that have been used to support our assessment.
Policy Department B: Structural and Cohesion Policies____________________________________________________________________________________________
90
However this dataset has some shortcomings and the ITF is working closely with OECD MSsto improve the availability, definitions, coverage, quality and comparability of data.Therefore, to assess the evolution of maintenance activities on road works in the EU wehave compared ITF data with the asphalt production data reported by EAPA and specificcountry information.
In the aftermath of the 2008 economic and financial crisis some EU MSs found it challengingto maintain an adequate level of road maintenance expenditure. The data reviewed in thisstudy points to a significant reduction of maintenance activities in Italy, Ireland,Slovenia and Spain in recent years and a likely downward trend experienced also inSlovakia, Finland, Czech Republic, the UK, Portugal and Hungary. At the same time, anincrease in maintenance expenditure was recorded in a number of MSs over the sameperiod: this is the case for Poland, Luxemburg, Croatia, France, Lithuania, Austria andGermany.
As discussed in the case studies reported in Annex A, the different patterns of roadmaintenance activities registered across the EU since the 2008 economic downturn dependmuch on the governance of the system. The impact of the crisis has been higher wherethe funding of road infrastructure is highly dependent on government spending (national orlocal irrespectively) rather than from other sources of financing (e.g. toll roads). The stateof public finances in different MSs and the fiscal and budgetary choices that have beenmade has then brought different outcomes. In some cases road investment has been usedas a counter-cyclical form of public spending. However at times of budget cuts, putting offinvestment and repairs in the road sector is a relatively quick way to reduce public spendingand this has been pursued by a number of EU countries. It is not surprising therefore thatthe largest fall in spending has been witnessed in MS that have implemented wide-rangingdeficit reduction plans in recent years.
In addition to this, it is important to note that maintenance spending is also highlydependent on the size of road infrastructure in previous years. Road construction today willinevitably increase the need for maintenance spending tomorrow. This can be seen as aform of liability which current investment decisions impose on future maintenance budgets.In addition, the more intensive is the pace of road building today, the more likely it is thatthe need for maintenance appears abruptly and is harder to spread out over time.
Good road maintenance can also have a positive impact on economic activity, as shownin Chapter 5. The reduction in journey times associated with timely maintenance is one ofthe most widely recognised economic benefits of road maintenance. A survey carried out bythe Asphalt Industry Association (2010) found the average cost of poor maintenance perbusiness, at £13,600 per year (€16,300). Studies assessing the wider economic impacts ofa lack of regular road maintenance carried out in Scotland and Lithuania show that thereduction in road maintenance expenditure can have an impact on the wider economy in therange of 100%-250%.
There is also evidence of the social cost of road accidents which has been quantified instudies in France, Lithuania and the Netherlands. While the majority of road accidents aredown to driver behaviour, some of those accidents could be as a result of drivers behavingin a certain way to account for poor road maintenance. On the other hand, there is no

EU Road Surfaces: Economic and Safety Impact of the Lack of Regular Road Maintenance____________________________________________________________________________________________
91
evidence that the use of LHVs will materially affect road maintenance as the increasedweight of the vehicles is distributed over a larger number of axles.
6.2. Key findings and recommendations
When developing road safety policies and interventions, the reliability and quality of datais a key factor. There is scope across Europe for further efforts to link police collision reportsto hospital data records to improve data quality and consistency, especially regardingserious injury crashes. Data quality and effective analysis are fundamental to building riskawareness and intervention effectiveness.
At the same time as the degree of homogeneity of available data on road maintenance andinvestment expenditure across the different MSs is minimal, it is important to consideradditional efforts to improve the standardisation of statistical data collected across the EUMS. This needs to be done in terms of type of roads covered, length and technical featuresof roads (e.g. number of carriageways), funding mechanism, definition of maintenance andinvestment expenditure in use, etc. In doing this it would be useful to further support theactions already taken by the OECD in this area.
Overall there is general international consensus on the approach to be adopted at policylevel to improve the safety of new and existing roads, as part of a wider strategy targetedat reducing road deaths and accidents. The approach needs to be founded on the followingpillars:
Ensure the presence of accurate and reliable data to be used to assess the resultsand identify areas of intervention. In doing this, particular attention should be given tothe information available regarding the causes of accidents.
Establish the concept of shared responsibility, commitment and concrete actions, atthe different levels of intervention (e.g. European authorities, Member States, regionaland local bodies) and involving the various actors (e.g. road developers, infrastructuremanagers, civil society, etc.).
Ensure that there is an appropriate design for each road type to minimise theprobability of accidents occurring and to mitigate injury severity accompanied by theexistence of a robust system of road safety audits.
Use maintenance and infrastructure safety investment programmes based onprocedures which ensure that funding allocation and project selection can prioritiseinterventions focused on tackling safety risks in the most efficient and effective manner.
While the first three points listed above have been put on the agenda of road safety policyfor some years now, it is only in recent years that the last point is emerging with moreurgency. This has become more important as the 2008 economic and financial crisis hasput at risk the availability of resources dedicated to road maintenance andinvestment works in some countries. In its resolution issued on the 27th September 2011on the European road safety 2011-2020 the European Parliament stressed the importanceof a well-preserved road infrastructure to contribute to reducing fatalities and injuries ofroad users. The resolution calls on the Member States to preserve and develop their roadinfrastructure through regular maintenance and innovative methods such as intelligent road

Policy Department B: Structural and Cohesion Policies____________________________________________________________________________________________
92
markings that display safety distances and the direction of travel, and passively safe roadinfrastructure; it also stresses that norms for signposting, in particular regarding roadworks, must be respected as they are crucial for a high level of road safety.
In light of future parliamentary debates on the actions to be taken by the EU to helppreserve the safety and quality of road surfaces and contrast the possible negative impactsgenerated by cuts in road maintenance activities due to economic downturns, the followingactions should be taken into consideration:
In the ongoing revision of the Road Infrastructure Safety Directive 2008/96/EC of19th November 2008, EU policymakers should support the introduction of amendmentsthat allow for a more homogenous application across the EU, reduce the existingvariability in the operational activities undertaken by different EU MS, introduceprovisions that provide guidance on materials to be used or elements to be installed onthe road network to boost its safety performance and expand its scope of applicationalso on road sections outside the TEN-T network that register poor safety scores.
The European Commission should consider proposing the extension to other categoriesof roads the experiences of the WhiteRoads project described in previous chapters anduse the outcomes of the white spot evaluation to improve safety records on the mostdangerous sections.
The European Commission should support the dissemination of a checklist similar tothose developed by the WhiteRoads project as a new and complementary tool to thesafety audits and inspections laid down in Directive 2008/96/EC and incentivise theirapplication on road sections not on the TEN-T network.
EU, national and local policy-makers should identify actions and measures that couldfocus on local and urban roads, which show the highest safety risks and, in somecountries, are experiencing the strongest reduction in maintenance activities. SeveralEU MSs have a well-established procedure for the monitoring of road conditions and theprioritisation of interventions. In many cases however, this does not extend to local orurban roads. The ongoing mid-term review of the EU road safety policy 2010-2020could be the right occasion to provide suggestions on how to address this issue.
From the case studies, a number of good practices have been identified that could help toimprove the cost-effectiveness of maintenance activities on local roads, including, amongothers, the recourse to user-fed information, where electronic or web-based systems areused to allow drivers to report potholes and highway defects directly to road managers, andthe utilisation of recycled asphalt that has the same level of quality as newly producedasphalt, but can lead to significant cost savings. Table 9 reports a synthesis of the goodpractices in road maintenance that we have encountered in some of the case studiesreported in Annex A, which can be used as reference for other MSs. Table 10 belowsummarises the main lessons learnt and the recommendations going forward for each of theareas assessed.

EU Road Surfaces: Economic and Safety Impact of the Lack of Regular Road Maintenance____________________________________________________________________________________________
93
Table 9: Road maintenance good practice detected from MS case studiesMS Organization Issue addressed Solution Adopted
AT ASFINAGEffective coordination andplanning of maintenancework
Set of performance targets for maintenancework limiting the number of construction sitesand length of road section:
No more than 3 construction sites on a 100kmstrip on the high-level road network
No more than 10km for each section of workNo more than 5 minutes for delays in traveltime due to maintenance activities.
See Appendix A, par. 1.4.5 for further details
FR Public roadauthorities
Reduction of maintenancecosts and optimization ofmaintenance planning
Devolution and differentiation of maintenanceregimes based on different usage patterns ofroad networks.
Introduction of smart road and vehicletechnologies.See Appendix A, par. 2.4.3 for further details
FR USIRFFacilitation of themaintenance planningprocess
Creation of a catalogue of global costs of eachmaintenance procedure and its life cycle cost.See Appendix A, par. 2.4.3 for further details
DE Municipality ofHamburg
Improving road conditionswhile at the same timedecreasing expenditure onmaintenance activities
Implementation of a maintenance processwhich uses 100% recycled asphalt.See Appendix A, par. 3.4.4 for further details
DE Municipality ofRednitzhembach
Carrying out of roadmaintenance withoutimpacting the municipalbudget
Implementation of a resurfacing process whereonly a few centimetres of the road surface aremilled off and later applied again.See Appendix A, par. 3.4.4 for further details
IT ANASPlanning and carrying out ofcorrect and effectivemaintenance work
Publication of the document providingextensive information on how to use innovativematerials to improve the effectiveness ofmaintenance activities.See Appendix A, par. 3.4.4 for further details
UKDepartment forTransport andHighway Agency
Identification of the mosteffective ways ofmaintaining the highway
Development of the Highways MaintenanceEfficiency Programme.
Issuance of several Toolkits and Best PracticeGuidances.
Sharing of good practices results to increaseoverall efficiency.See Appendix A, par. 11.4.4 for further details
UK Local authorities
Encouragement of roadusers to report maintenanceissues on the network toprioritise planning/executionof maintenance
Development of electronic or web-basedsystems for the public to report pavement androad defects and alert boroughs and TfL onsafety-critical issues.See Appendix A, par. 3.4.4 for further details

Policy Department B: Structural and Cohesion Policies____________________________________________________________________________________________
94
Table 10: Lessons learned, recommendations and an assessment of road maintenance expenditure in the EU
Issue Lessons learned Recommendations
Data availability Fatalities and sever injuries: reliability and quality of data isnot homogeneous across the EU.
Expenditure data: Lack of clear definitions and commonpractices to measure road transport infrastructuremaintenance and investment spending.
Fatalities and sever injuries: Improve the link between policecollision reports to hospital data records to improve dataquality and consistency, especially for serious injury crashes.
Expenditure data: improve the standardisation of statisticaldata collected across MSs. This needs to be done in terms oftype of roads covered, length and technical features ofroads, funding mechanism, definition of maintenance andinvestment expenditure in use, etc. This should be tied withfurther support for the actions of the OECD in this area.
Extent to whichroadmaintenancecontributes tothe safety of EUroads
Human factors play a dominant role, but the quality of roadinfrastructure is also a key factor. This is particularly thecase for road infrastructure design. Nevertheless, also thelack of regular road maintenance can contribute to worseningthe quality of the road surface. High level of pavementfriction, clear signage and road markings are importantqualities of a safe road and it is important that they aremaintained throughout the road’s lifespan. Anomalies, suchas ruts and depressions, reduce road safety as they affectdriver fatigue, can create a hazard for drivers and can causeaquaplaning in wet conditions.
-Ensure the presence of accurate and reliable data;
-Establish the concept of shared responsibility, commitmentand concrete actions, at the different levels of interventionand involving the various actors;
-Ensure that there is an appropriate design for each roadtype to minimise the probability of accidents occurring and tomitigate injury severity accompanied by the existence of arobust system of road safety audits;
-Use maintenance and infrastructure safety investmentprogrammes based on procedures which ensure that fundingallocation and project selection can prioritise interventionsfocused on tackling safety risks in the most efficient andeffective manner.

Conditions and quality of EU road surfaces____________________________________________________________________________________________
95
Issue Lessons learned Recommendations
Economic cycleand roadmaintenanceexpenditure inEU MS
Following the 2008 crisis some MSs have found it challengingto maintain an adequate level of road maintenanceexpenditure. Significant reductions have been seen in Italy,Ireland, Slovenia and Spain in recent years and a likelydownward trend experienced also in Slovakia, Finland, CzechRepublic, UK, Portugal and Hungary. Increases have beenrecorded in a number of MSs over the same period: Poland,Luxemburg, Croatia, France, Lithuania, Austria andGermany.
The different patterns on road maintenance activitiesregistered across the EU since the 2008 economic downturndepends significantly on the governance of the system.
Seek innovative funding techniques to enable a full andcorrect financing of road maintenance activities including amore detailed consideration of potential user-pays options.
Impacts ofvariation in roadmaintenanceexpenditure
Good road maintenance can also have a positive impact oneconomic activity. The reduction in journey times associatedwith timely maintenance is one of the most widelyrecognised economic benefits of road maintenance, but widereconomic impacts in the range of 100%-250% of roadmaintenance expenditure reduction can be generated by theof lack of regular road maintenance.
Ensure there is a full understanding of how to measure theimpact of appropriate road maintenance through theappropriate sharing of best practice in this area andpotentially identifying “white spots” for maintenance.
Best practicefrom EU MS
A number of good practices have been identified that couldhelp to improve the cost-effectiveness of maintenanceactivities on local roads, as reported in Table 9.
A dissemination of existing good practices implemented insome MSs should be encouraged across the EU to improvethe cost-effectiveness of maintenance activities.
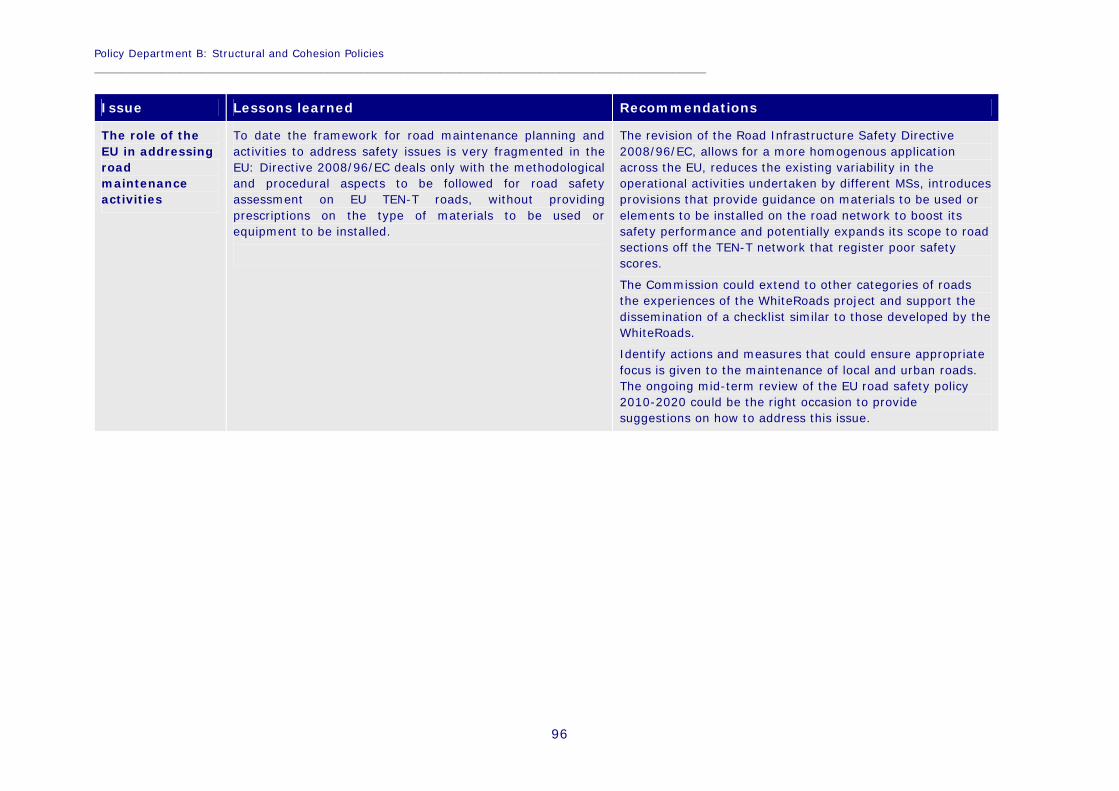
Policy Department B: Structural and Cohesion Policies____________________________________________________________________________________________
96
Issue Lessons learned Recommendations
The role of theEU in addressingroadmaintenanceactivities
To date the framework for road maintenance planning andactivities to address safety issues is very fragmented in theEU: Directive 2008/96/EC deals only with the methodologicaland procedural aspects to be followed for road safetyassessment on EU TEN-T roads, without providingprescriptions on the type of materials to be used orequipment to be installed.
The revision of the Road Infrastructure Safety Directive2008/96/EC, allows for a more homogenous applicationacross the EU, reduces the existing variability in theoperational activities undertaken by different MSs, introducesprovisions that provide guidance on materials to be used orelements to be installed on the road network to boost itssafety performance and potentially expands its scope to roadsections off the TEN-T network that register poor safetyscores.
The Commission could extend to other categories of roadsthe experiences of the WhiteRoads project and support thedissemination of a checklist similar to those developed by theWhiteRoads.
Identify actions and measures that could ensure appropriatefocus is given to the maintenance of local and urban roads.The ongoing mid-term review of the EU road safety policy2010-2020 could be the right occasion to providesuggestions on how to address this issue.
Conditions and quality of EU road surfaces____________________________________________________________________________________________
97
REFERENCES
BASt (2007) Bundesanstalt für Straßenwesen (Federal Highway Research Institute ofthe Federal Ministry of German Transport and Digital Infrastructure), 2007,Auswirkungen von neuen Fahrzeugkonzepten auf die Infrastruktur desBundesfernstraßennetzes: Schlussbericht (Effects of new vehicle concepts on theinfrastructure of the federal trunk road network: Final report), Bergisch Gladbach,Germany.
COM (2001) 370 Final European Commission, 2001, European Transport Policy for2010: Time to Decide, White Paper, Brussels, Belgium.
COM (2003) 311 Final European Commission, 2003, Saving 20 000 lives on ourroads – A shared responsibility. European road safety action programme - halving thenumber of road accident victims in the European Union by 2010: A sharedresponsibility, Communication from the Commission to the European Parliament, theCouncil, the European Economic and Social Committee and the Committee of theRegions, Office for Official Publications of the European Communities, Luxembourg City,Luxembourg.
COM (2010) 389 Final European Commission, 2010, Towards a European road safetyarea: policy orientations on road safety for the years 2011-2020, Communication fromthe Commission to the European Parliament, the Council, the European Economic andSocial Committee and the Committee of the Regions, Brussels, Belgium.
ERF (2013) European Union Road Federation, 2013, Marking the way towards a saferfuture – An ERF position paper on how road markings can make our road safer,Brussels, Belgium.
ETSC (2006) European Road Safety Council, 2006, Road accident data in the enlargedEuropean Union – Learning from each other, Review, Brussels, Belgium.
IRU (2007) International Road Transport Union, 2007, European truck accidentcausation (ETAC) – A scientific study, Geneva, Switzerland.
ITF/OECD (2008) International Transport Forum/Organisation for Economic Co-operation and Development Joint Transport Research Centre, 2008, Towards Zero –Ambitious Road Safety Target and the Safety System Approach, Paris, France.
ITF/OECD (2012) Harvey, Mark O., 2012, Optimising Road Maintenance, OECD/ITFJoint Transport Research Centre, ITF Discussion Paper 2012-12, Paris, France.
ITF/OECD (2013) Philippe, C., Kauppilla, J., Vassallo, J. and Wlaschin, B., AssetManagement for Sustainable Road Funding, ITF/OECD Joint Transport Research Centre,ITF Discussion Paper 2013-13, Paris, France.
ITF/OECD (2013) ITF/OECD Task Force on Measuring Transport InfrastructureSpending and Assets, 2013, Understanding the Value of Transport Infrastructure -Guidelines for macro-level measurement, of spending and assets, InternationalTransport Forum/Organisation for Economic Co-operation and Development JointTransport Research Centre, Task Force Report, Paris, France.
NAPA and EAPA (2011) National Asphalt Pavement Association, and European AsphaltPavement Association, 2011, The Asphalt Paving Industry – A Global Perspective.Production, Use, Properties, and Occupational Exposure Reduction Technologies andTrends, Global Series 101, Second Edition, Lanham, Maryland, USA, and Brussels,Belgium.
Policy Department B: Structural and Cohesion Policies____________________________________________________________________________________________
98
NCHRP (2009) National Cooperative Highway Research Program, 2009, Guide forPavement Friction, Web-Only Document 108, Washington D.C., USA.
PE 495.855 European Parliament, 2013, Social and working conditions of roadtransport hauliers, Study, Brussels, Belgium.
PE 513.971 European Parliament, 2013, A review of megatrucks – Major issues andcase studies, Study, Brussels, Belgium.
PIARC/WB (2000) Odoki, J.B. and Kerali, H.G.R., 2000, Highway Development andManagement (HDM-4), Volume 4: Analytical Framework and Model Descriptions,International Study of Highway Development and Management Tolls (ISOHDM), jointlypublished by the World Road Association (PIARC), Paris and the World Bank,Washington, D.C., USA.
Rijkswaterstaat (2010) Rijkswaterstaat (Netherland National Ministry of Transport),2010, Experience with Longer and Heavier Vehicles (LHVs) in the Netherlands, web-onlydocument.
SWD (2013) 1 Final European Commission, 2013, Ex-post evaluation of Directive1999/62/EC, as amended, on the charging of heavy goods vehicles for the use ofcertain infrastructures, Commission staff working document, Brussels, Belgium.
TML (2008) Transport & Mobility Leuven, 2008, Effects of adapting the rules onweights and dimensions of heavy commercial vehicles as established within Directive96/53/EC – Final Report, published by the European Commission, Directorate-GeneralEnergy and Transport, Brussels, Belgium.
TRACE (2007) Traffic Accident Causation in Europe, 2007, Analyzing "humanfunctional failures” in road accidents, TRACE Project Report.
Transport Scotland (2012) Transport Research Laboratory and Transport Scotland,2012, Economic, Environmental and Social Impact of Changes in Maintenance Spend onRoads in Scotland, Summary Report, Glasgow, UK.
VTI (2004) Sfogren, Leif and Ihs, Anita, 2004, The Influence of Road SurfaceCondition on Traffic Safety and Ride Comfort, Swedish National Road and TransportResearch Institute (VTI), Reprint from 6th International Conference on ManagingPavements, 19-24 October 2004, Brisbane Convention and Exhibition Centre,Queensland, Australia.
VTI (2008) Swedish National Road and Transport Research Institute (VTI), 2008, Theeffects of long and heavy trucks on the transport system. Report on a governmentassignment, Linköping, Sweden.
WSP (2010) WSP Development and Transportation, 2010, Longer Semi-TrailerFeasibility Study and Impact Assessment – Final Summary Report, Cambridge, UK.

EU Road Surfaces: Economic and Safety Impact of the Lack of Regular Road Maintenance____________________________________________________________________________________________
99
ANNEXES
Policy Department B: Structural and Cohesion Policies____________________________________________________________________________________________
100
CONTENTS
LIST OF ABBREVIATIONS 103
COUNTRY ABBREVIATIONS 106
LIST OF TABLES 109
LIST OF FIGURES 110
ANNEX 1: CASE STUDIES 115
1. CASE STUDY AUSTRIA 1151.1 Member State overview 115
1.2 Road Safety Statistic 115
1.3 Maintenance budgets analysis 115
1.4 Road Performance monitoring 117
1.5 Socio-economic impacts of road maintenance 122
1.6 Summary for Austria 122
2. CASE STUDY FRANCE 1232.1 Member State Overview 123
2.2 Road Safety Statistic 123
2.3 Maintenance budgets analysis 123
2.4 Road performance monitoring 125
2.5 Socio-economic impacts of road maintenance 127
2.6 Summary for France 128
3. CASE STUDY GERMANY 1293.1 Member State Overview 129
3.2 Road safety statistics 129
3.3 Maintenance budgets analysis 129
3.4 Road performance monitoring 132
3.5 Socio-economic impacts of road maintenance 136
3.6 Summary for Germany 137
4. CASE STUDY IRELAND 1394.1 Member State Overview 139
4.2 Road safety statistics 139
4.3 Maintenance budgets analysis 140
4.4 Road performance monitoring 145
4.5 Socio-economic impacts of road maintenance 148
4.6 Summary for Ireland 148
EU Road Surfaces: Economic and Safety Impact of the Lack of Regular Road Maintenance____________________________________________________________________________________________
101
5. CASE STUDY ITALY 1495.1 Introduction 149
5.2 Road Safety statistic 149
5.3 Maintenance budgets analysis 149
5.4 Road performance monitoring 154
5.5 Socio-economic impacts of road maintenance 158
5.6 Summary for Italy 160
6. CASE STUDY LITHUANIA 1616.1 Member State overview 161
6.2 Road safety statistics 161
6.3 Analysis of maintenance budgets 161
6.4 Road maintenance performance and monitoring system 164
6.5 Socio-economic impacts of road maintenance 167
6.6 Summary for Lithuania 170
7. CASE STUDY POLAND 1717.1 Member State overview 171
7.2 Road safety statistics 171
7.3 Maintenance budgets analysis 171
7.4 Road performance monitoring 173
7.5 Socio-economic impacts of road maintenance 176
7.6 Summary for Poland 177
8. CASE STUDY PORTUGAL 1798.1 Introduction 179
8.2 Road Safety 179
8.3 Stakeholders and Responsibilities 179
8.4 Maintenance Budgets 181
8.5 Socio-economic Impacts of Road Maintenance 185
8.6 Summary for Portugal 186
9. CASE STUDY ROMANIA 1899.1 Member State overview 189
9.2 Road safety statistics 189
9.3 Maintenance budgets analysis 191
9.4 Road performance monitoring 193
9.5 Socio-economic impacts of road maintenance 194
9.6 Summary for Romania 194
Policy Department B: Structural and Cohesion Policies____________________________________________________________________________________________
102
10. CASE STUDY SPAIN 19510.1 Member State overview 195
10.2 Road safety statistics 195
10.3 Maintenance budgets analysis 196
10.4 Road performance monitoring 199
10.5 Socio-economic impacts of road maintenance 202
10.6 Summary for Spain 203
11. CASE STUDY GREAT BRITAIN 20511.1 Member State overview 205
11.2 Road safety statistics 205
11.3 Maintenance budgets analysis 206
11.4 Road performance monitoring 208
11.5 Socio-economic impacts of road maintenance 212
11.6 Summary for Great Britain 213
LIST OF SOURCES 215
ANNEX 2: IMPACT OF ROAD CONDITION ON ROAD SAFETY 219
EU Road Surfaces: Economic and Safety Impact of the Lack of Regular Road Maintenance____________________________________________________________________________________________
103
LIST OF ABBREVIATIONS
ACA-M Associação de Cidadãos Auto-Mobilizados (Portuguese Road UsersAssociation)
ADRVEST Agentia pentru Dezvoltare Regionala (Romanian RegionalDevelopment Agency)
AEC Asociación Española de la Carretera (Spanish National RoadAssociation)
AFITF Agence de financement des infrastructures de transport de France(French Agency for the Financing of Transport Infrastructure)
AIA Asphalt Industry Association
AICCOPN Associação dos Industriais da Construção Civil e Obras Públicas(Portuguese Association of the Public Power and Civil Construction)
AIT Austrian Institute of Technology
ANAS Azienda Nazionale Autonoma delle Strade (Italian National RoadAgency)
ASEFMA Asociacion espanola de fabricantes de mezclas asfalticas (SpanishAssociation of Asphalt Producers)
ASFINAG Autobahn and high way financing stock corporation (Austria)
BMS Bridge Management System
BMVIT Bundesministerium für Verkehr, Innovation und Technologie(Austrian Ministry for Transport, Innovation and Technology)
CAT Coefficiente di Aderenza Trasversale (Transversal FrictionCoefficient)
CdS Codice della Strada (Italian Road Codee)
CNADNR Compania Naţională de Autostrăzi şi Drumuri Naţionale din România(Romanian National Company of Motorways and National Roads)
CNIT Conto Nazionale delle Infrastrutture e dei Trasporti (Italian NationalTransport Statistics)
CR Certification of Regularity
DfT Department for Transport (UK)
DIW Deutsches Institut für Wirtschaftsforschung (German Institute forEconomic Research)
Policy Department B: Structural and Cohesion Policies____________________________________________________________________________________________
104
DPIIS Departamentul pentru Proiecte de Infrastructura (RomanianDepartment of Infrastructure Projects and Foreign Investment)
DRPCIV Romanian Driving Licenses and Vehicle Registration Authority
DTTaS Department of Transport, Tourism And Sport (Ireland)
EAPA European Asphalt Pavement Association
EP Estradas de Portugal (Portuguese Road Company)
ERDF European Regional Development Fund
ETSC European Transport Safety Council
FEMA Federation of European Motorcycles Association
FFMC Fédération Francaise des Motards en Colère (French Association ofAngry Motorcyclists)
FGSV Forschungsgesellschaft fur strassen-und verkehrswesen (GermanRoad and Transportation Research Association)
GDDKiA Generalna Dyrekcja Dróg Krajowych i Autostrad (General Directoratefor Road and Motorways-Poland)
GDP Gross Domestic Product
GPS Global Positioning System
HA Highways Agency (UK)
IDRRIM Institut des Routes, des Rues et des Infrastructures pour la Mobilité(France Institute for Roads and Transport Infrastructure)
IQOA Image de la qualite des ouvrages d’art (French Measurement ofQuality of Civil Engineering Structures)
IQRN Image qualité du réseau routier national (French Measurement ofQuality of National Roads)
IRI Ride quality index
LRA Lithuanian Road Administration Institution
MPD Mean profile depth
NHT National Highways & Transport Survey (UK)
NRA National Roads Authority (UK)
OECD Organisation for Economic Co-operation and Development

EU Road Surfaces: Economic and Safety Impact of the Lack of Regular Road Maintenance____________________________________________________________________________________________
105
OSEC Cities and Roads Safety Observatory
PEIT Plan Estratégico de Infraestructuras y Transporte (Spanish TransportInfrastructure Strategic Plan)
PMS Pavement Management System
PPP Public Private Partnership
RCI Road Condition Indicator
RMPD Road Maintenance and Development Programme
RSA Road Safety Authority’s
RSP Road Surface Profiler
SCANNER Surface Condition Assessment for the National Network of Roads(UK)
SCRIM Skid Resistance Index Measure
SGPav Sistema de Gestão de Conservação de Pavimentos (PortugueseSystem of road surface maintenance)
SHWD Super Heavy Weight Deflectometer
SITEB Associazione Italiana Bitume Asfalto Strade (Italian NationalAssociation of Asphalt Producers)
SOPO System for Evaluation of Roadsides
SOSN System for Road Surface Evaluation for Asphalt Roads
SOSN-B System for Road Surface Evaluation for concrete Roads
SRN Strategic road network (UK)
TRACS Traffic-speed Condition Survey (UK)
UNTRR Road Transporter’s National Union (Romania)
USIRF Union des Syndicats de l’Industrie Routière Française (Franch RoadTransport Union)
ZEB Road Monitoring and Assessment (Germany)
ŽSI Winter Severity Index (Poland)

Policy Department B: Structural and Cohesion Policies____________________________________________________________________________________________
106
COUNTRY ABBREVIATIONS
AT Austria
BE Belgium
BG Bulgaria
CY Cyprus
CZ Czech Republic
DE Germany
DK Denmark
EE Estonia
EL Greece
ES Spain
FI Finland
FR France
UK United Kingdom
HU Hungary
HR Croatia
IE Ireland
IT Italy
LT Lithuania
LU Luxembourg
LV Latvia
MT Malta
NL Netherlands
PL Poland
PT Portugal

EU Road Surfaces: Economic and Safety Impact of the Lack of Regular Road Maintenance____________________________________________________________________________________________
107
RO Romania
SE Sweden
SI Slovenia
SK Slovakia

Policy Department B: Structural and Cohesion Policies____________________________________________________________________________________________
108
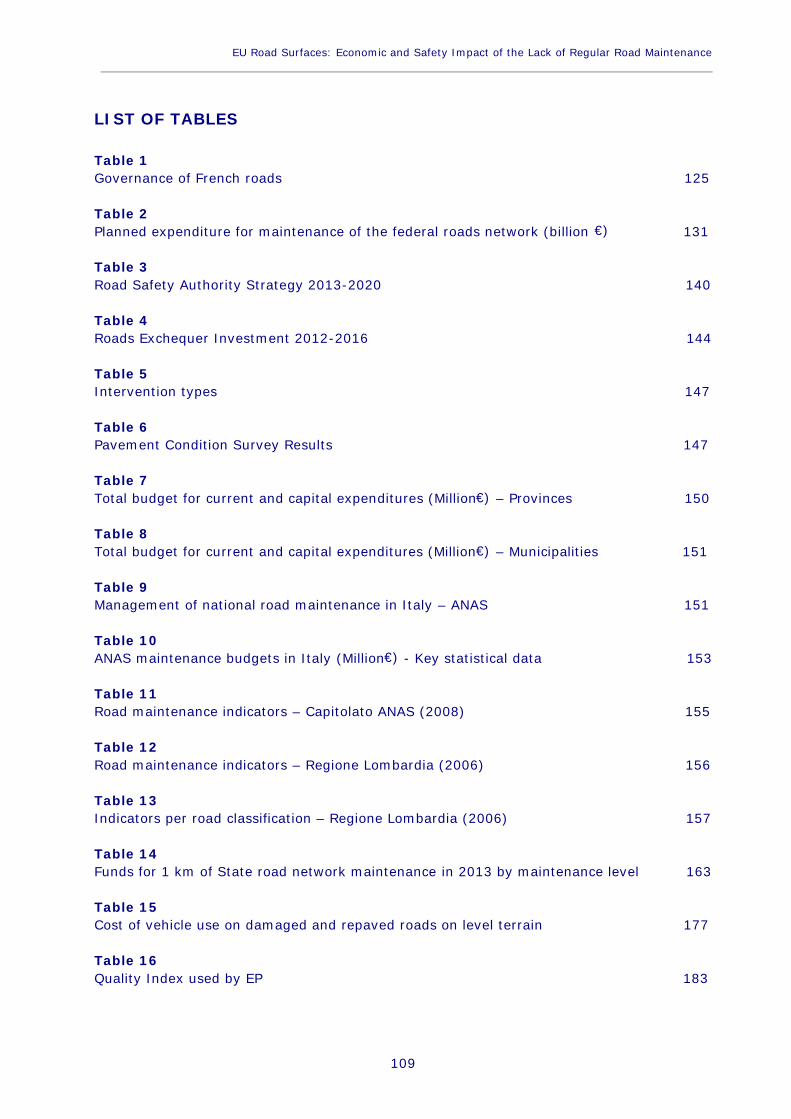
EU Road Surfaces: Economic and Safety Impact of the Lack of Regular Road Maintenance____________________________________________________________________________________________
109
LIST OF TABLES
Table 1Governance of French roads 125
Table 2Planned expenditure for maintenance of the federal roads network (billion €) 131
Table 3Road Safety Authority Strategy 2013-2020 140
Table 4Roads Exchequer Investment 2012-2016 144
Table 5Intervention types 147
Table 6Pavement Condition Survey Results 147
Table 7Total budget for current and capital expenditures (Million€) – Provinces 150
Table 8Total budget for current and capital expenditures (Million€) – Municipalities 151
Table 9Management of national road maintenance in Italy – ANAS 151
Table 10ANAS maintenance budgets in Italy (Million€) - Key statistical data 153
Table 11Road maintenance indicators – Capitolato ANAS (2008) 155
Table 12Road maintenance indicators – Regione Lombardia (2006) 156
Table 13Indicators per road classification – Regione Lombardia (2006) 157
Table 14Funds for 1 km of State road network maintenance in 2013 by maintenance level 163
Table 15Cost of vehicle use on damaged and repaved roads on level terrain 177
Table 16Quality Index used by EP 183
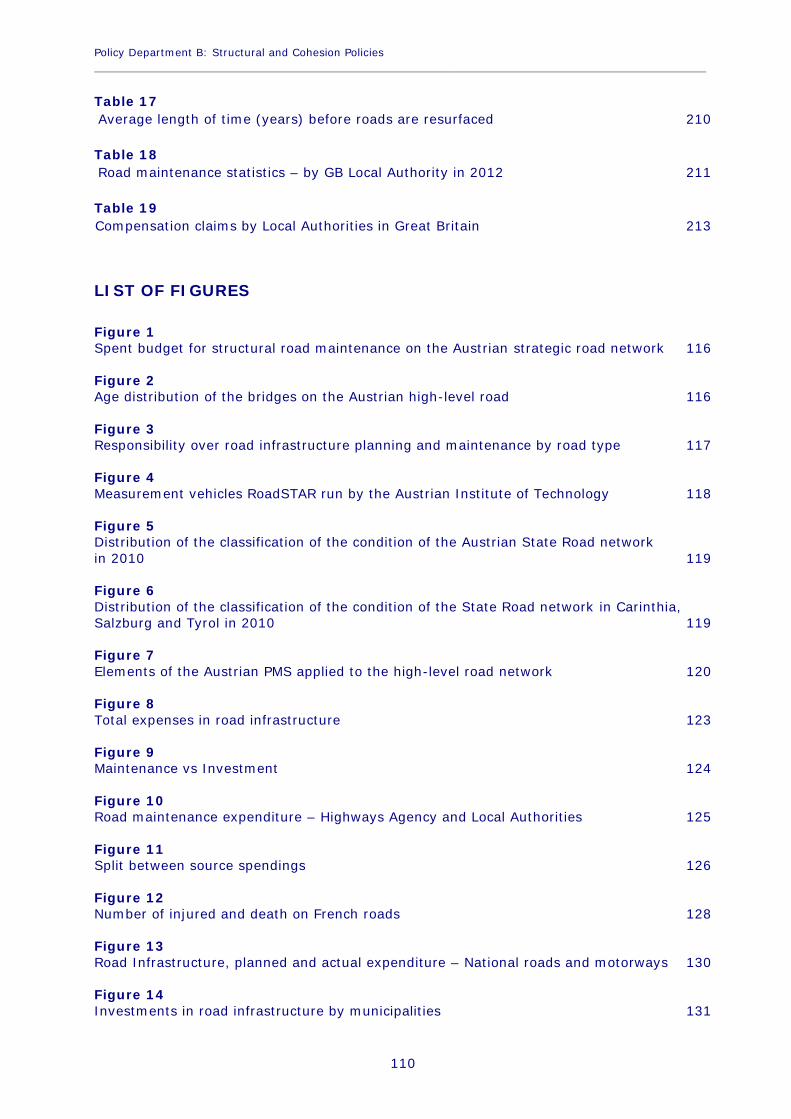
Policy Department B: Structural and Cohesion Policies____________________________________________________________________________________________
110
Table 17Average length of time (years) before roads are resurfaced 210
Table 18Road maintenance statistics – by GB Local Authority in 2012 211
Table 19Compensation claims by Local Authorities in Great Britain 213
LIST OF FIGURES
Figure 1Spent budget for structural road maintenance on the Austrian strategic road network 116
Figure 2Age distribution of the bridges on the Austrian high-level road 116
Figure 3Responsibility over road infrastructure planning and maintenance by road type 117
Figure 4Measurement vehicles RoadSTAR run by the Austrian Institute of Technology 118
Figure 5Distribution of the classification of the condition of the Austrian State Road networkin 2010 119
Figure 6Distribution of the classification of the condition of the State Road network in Carinthia,Salzburg and Tyrol in 2010 119
Figure 7Elements of the Austrian PMS applied to the high-level road network 120
Figure 8Total expenses in road infrastructure 123
Figure 9Maintenance vs Investment 124
Figure 10Road maintenance expenditure – Highways Agency and Local Authorities 125
Figure 11Split between source spendings 126
Figure 12Number of injured and death on French roads 128
Figure 13Road Infrastructure, planned and actual expenditure – National roads and motorways 130
Figure 14Investments in road infrastructure by municipalities 131
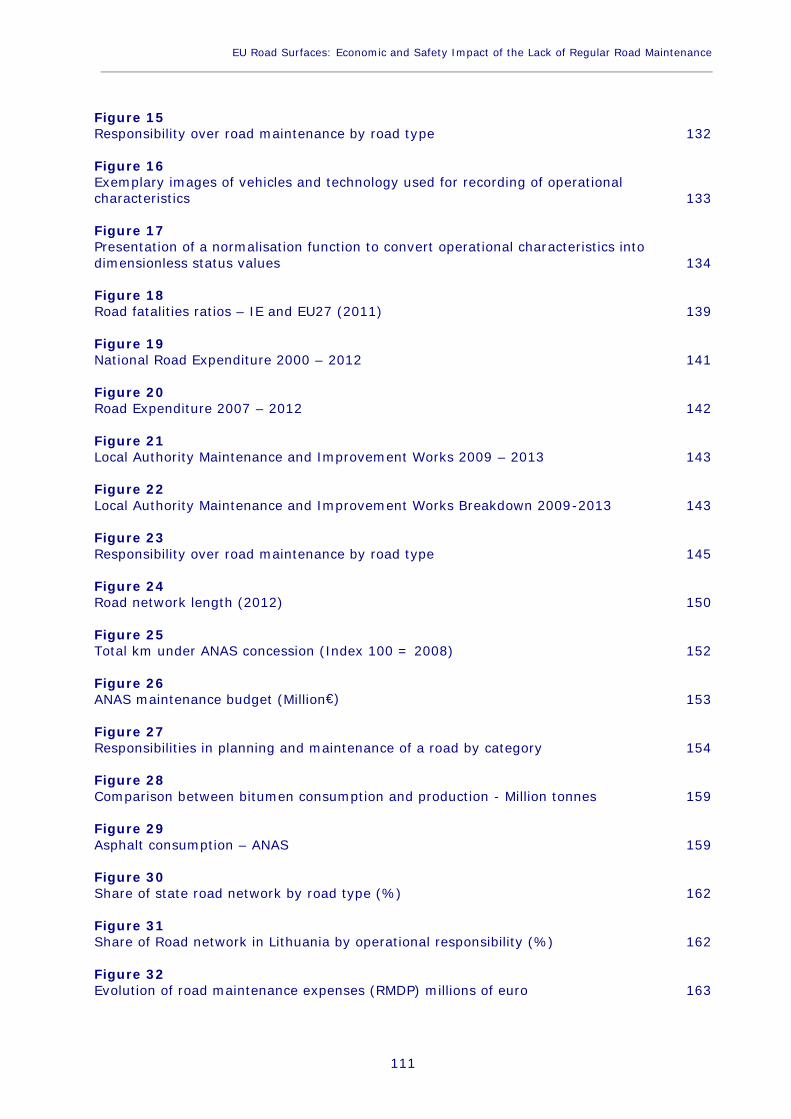
EU Road Surfaces: Economic and Safety Impact of the Lack of Regular Road Maintenance____________________________________________________________________________________________
111
Figure 15Responsibility over road maintenance by road type 132
Figure 16Exemplary images of vehicles and technology used for recording of operationalcharacteristics 133
Figure 17Presentation of a normalisation function to convert operational characteristics intodimensionless status values 134
Figure 18Road fatalities ratios – IE and EU27 (2011) 139
Figure 19National Road Expenditure 2000 – 2012 141
Figure 20Road Expenditure 2007 – 2012 142
Figure 21Local Authority Maintenance and Improvement Works 2009 – 2013 143
Figure 22Local Authority Maintenance and Improvement Works Breakdown 2009-2013 143
Figure 23Responsibility over road maintenance by road type 145
Figure 24Road network length (2012) 150
Figure 25Total km under ANAS concession (Index 100 = 2008) 152
Figure 26ANAS maintenance budget (Million€) 153
Figure 27Responsibilities in planning and maintenance of a road by category 154
Figure 28Comparison between bitumen consumption and production - Million tonnes 159
Figure 29Asphalt consumption – ANAS 159
Figure 30Share of state road network by road type (%) 162
Figure 31Share of Road network in Lithuania by operational responsibility (%) 162
Figure 32Evolution of road maintenance expenses (RMDP) millions of euro 163

Policy Department B: Structural and Cohesion Policies____________________________________________________________________________________________
112
Figure 33Share of road maintenance expenses (RMDP) in 2013 (%) 164
Figure 34Responsibility structure for State road network 165
Figure 35State road network maintenance levels in 2013 166
Figure 36Evolution of total deaths and passenger cars (2001 – 2011) 167
Figure 37Evolution of total accident deaths and injured (2005 - 2012) 168
Figure 38Net benefit forecast for 1 LTL invested into road rehabilitation reconstruction andmaintenance 168
Figure 39Decrease in fuel consumption and CO2 emissions per 1 km of road intervention 169
Figure 40Road Infrastructure, planned and actual expenditure – National roads and motorways 172
Figure 41Maintenance expenditure (actual) – Routine and structural maintenance 172
Figure 42Responsibility over road maintenance by road type 174
Figure 43SOSN Road surface quality classifications 174
Figure 44Condition of road surface on entire national road network 175
Figure 45Regulation and Operation Responsibilities by Stakeholder 180
Figure 46EP Expenditure in Road Maintenance 181
Figure 47Road Maintenance and Safety Interventions and Network directly Managed by EP 182
Figure 48EP Historic Inspections 184
Figure 49App images 185
Figure 50Road fatalities ratios – Romania and EU27 (2011) 189
Figure 51Romania’s motorway network 190
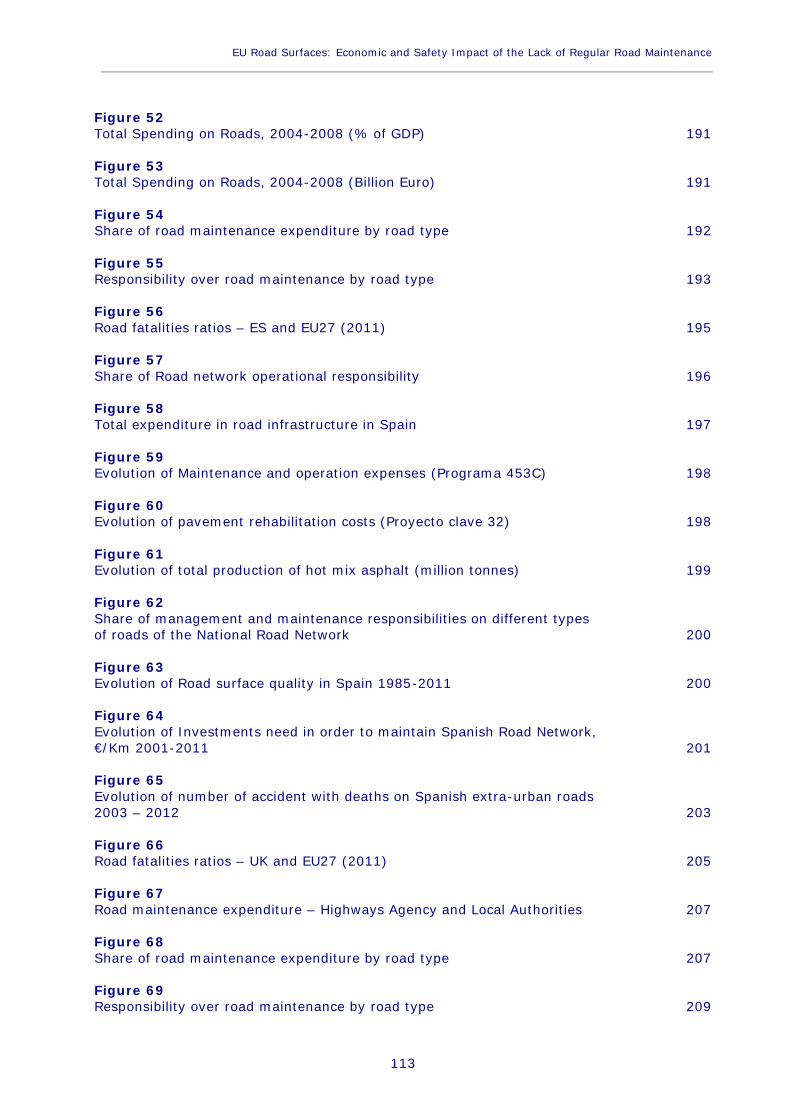
EU Road Surfaces: Economic and Safety Impact of the Lack of Regular Road Maintenance____________________________________________________________________________________________
113
Figure 52Total Spending on Roads, 2004-2008 (% of GDP) 191
Figure 53Total Spending on Roads, 2004-2008 (Billion Euro) 191
Figure 54Share of road maintenance expenditure by road type 192
Figure 55Responsibility over road maintenance by road type 193
Figure 56Road fatalities ratios – ES and EU27 (2011) 195
Figure 57Share of Road network operational responsibility 196
Figure 58Total expenditure in road infrastructure in Spain 197
Figure 59Evolution of Maintenance and operation expenses (Programa 453C) 198
Figure 60Evolution of pavement rehabilitation costs (Proyecto clave 32) 198
Figure 61Evolution of total production of hot mix asphalt (million tonnes) 199
Figure 62Share of management and maintenance responsibilities on different typesof roads of the National Road Network 200
Figure 63Evolution of Road surface quality in Spain 1985-2011 200
Figure 64Evolution of Investments need in order to maintain Spanish Road Network,€/Km 2001-2011 201
Figure 65Evolution of number of accident with deaths on Spanish extra-urban roads2003 – 2012 203
Figure 66Road fatalities ratios – UK and EU27 (2011) 205
Figure 67Road maintenance expenditure – Highways Agency and Local Authorities 207
Figure 68Share of road maintenance expenditure by road type 207
Figure 69Responsibility over road maintenance by road type 209

Policy Department B: Structural and Cohesion Policies____________________________________________________________________________________________
114

EU Road Surfaces: Economic and Safety Impact of the Lack of Regular Road Maintenance____________________________________________________________________________________________
115
ANNEX 1: CASE STUDIES
1. CASE STUDY AUSTRIA
1.1 Member State overview
The total road network of Austria is 122,800 km long, of which 1,700 km are motorways.Austria’s current level of car ownership is approximately 535 passenger cars per 1000inhabitants. This figure has steadily increased in the period 2001-2011; the percentageincrease over this period was 3.1% (Eurostat).
1.2 Road Safety Statistics
In 2011, Austria registered 523 fatalities on its roads, which represented a 45% decreasefrom 2001. In terms of fatalities per million inhabitants, Austria’s 62 is slightly above theEU27 average of 60. When referring to other indices, Austria remains around the EU27average level: it noted 69 fatalities per 10 billion passenger kilometres (above the EUaverage of 61), whilst its figure of 117 fatalities per million passenger cars is marginallyless than the EU average of 126. In total there were 35,100 accidents resulting in personalinjury on Austrian roads in 2011, which is a 18.4% decrease on the same figure recorded in2001 (Eurostat and OECD).
1.3 Maintenance budgets analysis
1.3.1 Road infrastructure and maintenance spending for federal roads inAustria
The expenditure for maintenance of the strategic road network, comprising the motorwayand the expressway network, is covered by the revenues generated by Autobahnen- undSchnellstraßen-Finanzierungs-Aktiengesellschaf (ASFINAG). Its main source of income istolls collected from vehicles. In addition, ASFINAG raises the capital necessary for itsinvestments on the capital market, while the Austrian Government provides stateguarantees for this financing. ASFINAG does not receive any state subsidies.
The financing of maintenance activities on the high level road network is not based on theprinciples of project financing, but on the principles of corporate financing. Therefore,ASFINAG is independent of any other Governmental spending, and due to the economiccrisis, there have been no specific changes in its overall strategy for maintenance.
Since 1997, ASFINAG more than quadrupled its investments in the extension, upgradingand maintenance of the strategic network, from €0.29 billion in 1997 to €1.2 billion in2008.1 As a result of the financial crisis, ASFINAG’s revenue decreased by 9% between2008 and 2009. Subsequently revenues rebounded and in 2010 were back at the pre-recession level of 2008. As a reaction to the decreased income in 2009 and the weakeconomic situation of the company in general, ASFINAG diminished its investments byapproximately 25% in 2010 and 2011. Infrastructure expenditure between 2011 and 2016is planned to be around €1 billion for each individual year.
1 Austrian Ministry of Finance (2011) Infrastrukturbeilage.
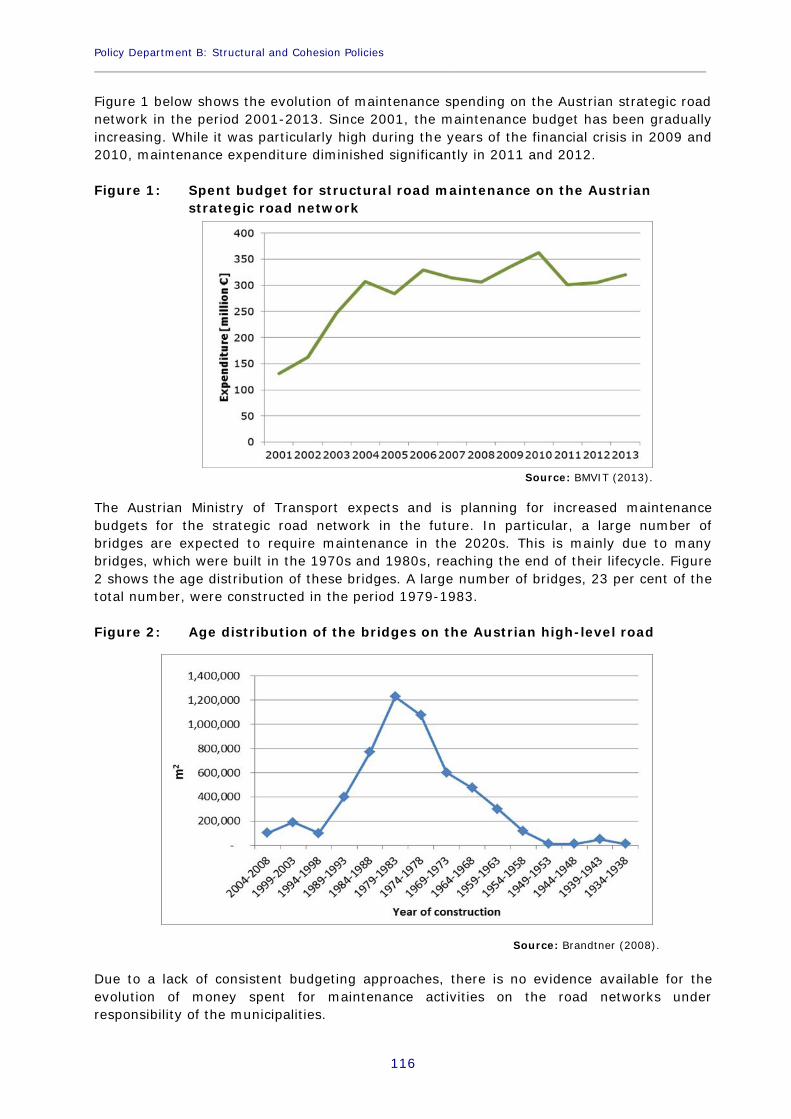
Policy Department B: Structural and Cohesion Policies____________________________________________________________________________________________
116
Figure 1 below shows the evolution of maintenance spending on the Austrian strategic roadnetwork in the period 2001-2013. Since 2001, the maintenance budget has been graduallyincreasing. While it was particularly high during the years of the financial crisis in 2009 and2010, maintenance expenditure diminished significantly in 2011 and 2012.
Figure 1: Spent budget for structural road maintenance on the Austrianstrategic road network
Source: BMVIT (2013).
The Austrian Ministry of Transport expects and is planning for increased maintenancebudgets for the strategic road network in the future. In particular, a large number ofbridges are expected to require maintenance in the 2020s. This is mainly due to manybridges, which were built in the 1970s and 1980s, reaching the end of their lifecycle. Figure2 shows the age distribution of these bridges. A large number of bridges, 23 per cent of thetotal number, were constructed in the period 1979-1983.
Figure 2: Age distribution of the bridges on the Austrian high-level road
Source: Brandtner (2008).
Due to a lack of consistent budgeting approaches, there is no evidence available for theevolution of money spent for maintenance activities on the road networks underresponsibility of the municipalities.
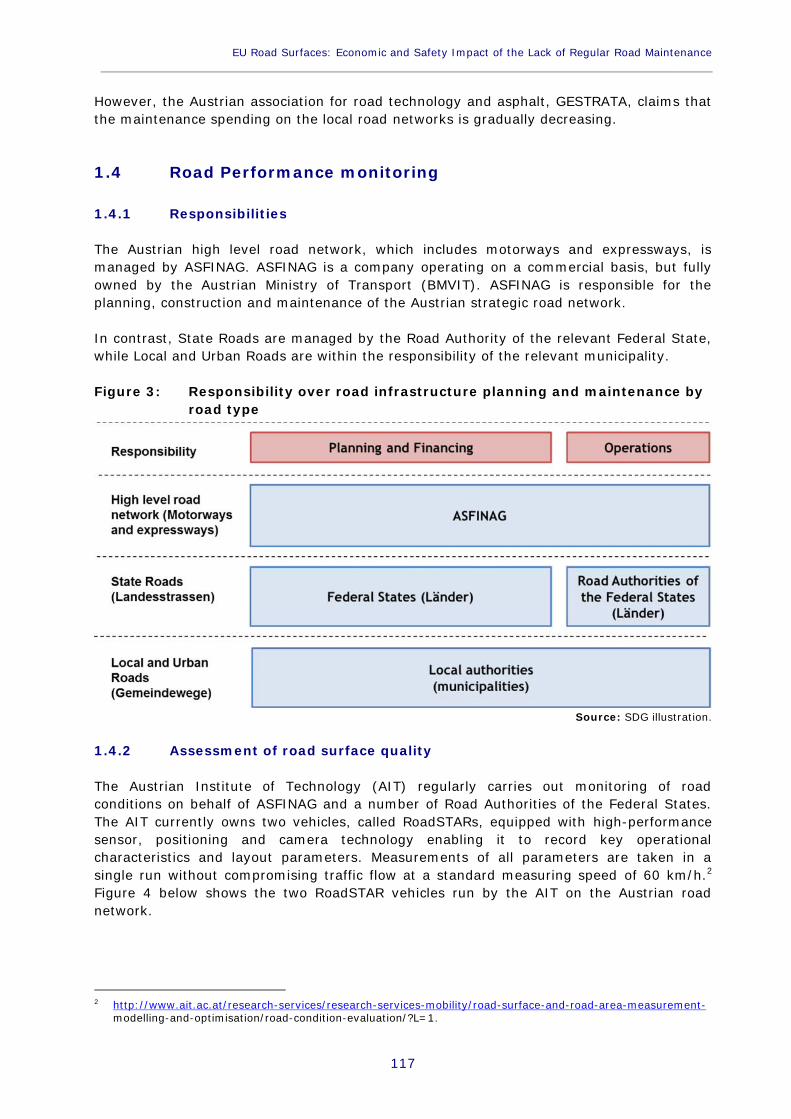
EU Road Surfaces: Economic and Safety Impact of the Lack of Regular Road Maintenance____________________________________________________________________________________________
117
However, the Austrian association for road technology and asphalt, GESTRATA, claims thatthe maintenance spending on the local road networks is gradually decreasing.
1.4 Road Performance monitoring
1.4.1 Responsibilities
The Austrian high level road network, which includes motorways and expressways, ismanaged by ASFINAG. ASFINAG is a company operating on a commercial basis, but fullyowned by the Austrian Ministry of Transport (BMVIT). ASFINAG is responsible for theplanning, construction and maintenance of the Austrian strategic road network.
In contrast, State Roads are managed by the Road Authority of the relevant Federal State,while Local and Urban Roads are within the responsibility of the relevant municipality.
Figure 3: Responsibility over road infrastructure planning and maintenance byroad type
Source: SDG illustration.
1.4.2 Assessment of road surface quality
The Austrian Institute of Technology (AIT) regularly carries out monitoring of roadconditions on behalf of ASFINAG and a number of Road Authorities of the Federal States.The AIT currently owns two vehicles, called RoadSTARs, equipped with high-performancesensor, positioning and camera technology enabling it to record key operationalcharacteristics and layout parameters. Measurements of all parameters are taken in asingle run without compromising traffic flow at a standard measuring speed of 60 km/h.2
Figure 4 below shows the two RoadSTAR vehicles run by the AIT on the Austrian roadnetwork.
2 http://www.ait.ac.at/research-services/research-services-mobility/road-surface-and-road-area-measurement-modelling-and-optimisation/road-condition-evaluation/?L=1.
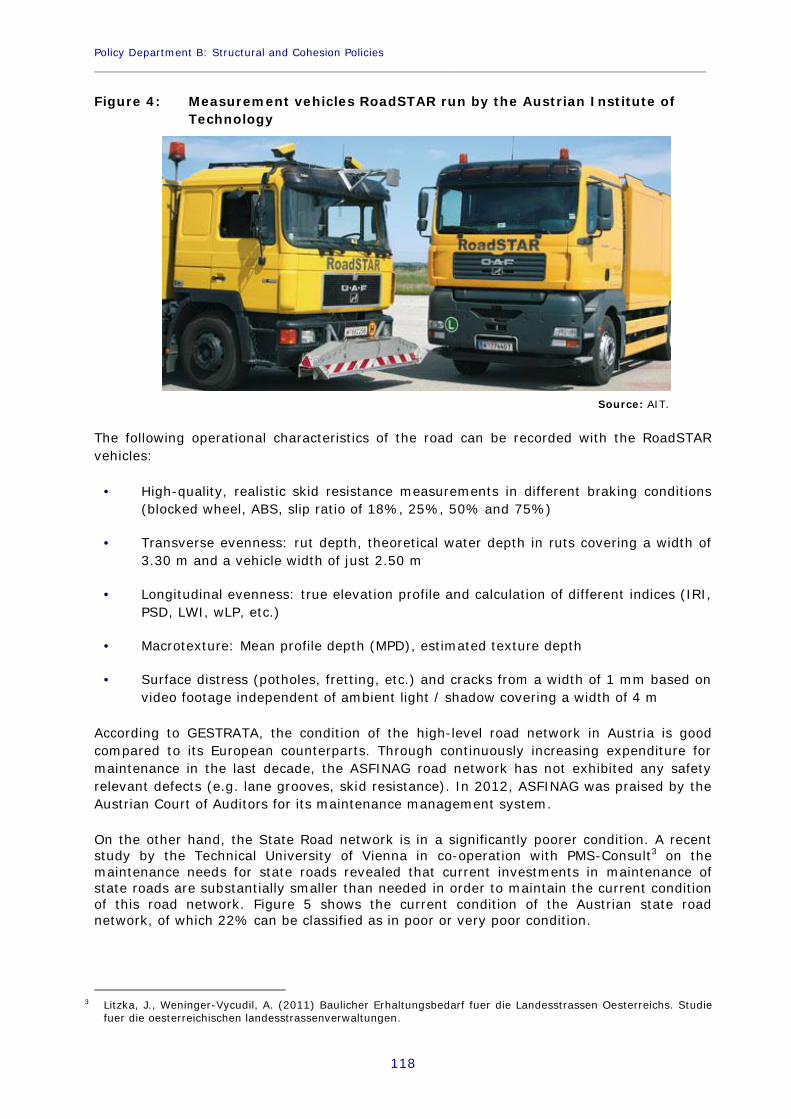
Policy Department B: Structural and Cohesion Policies____________________________________________________________________________________________
118
Figure 4: Measurement vehicles RoadSTAR run by the Austrian Institute ofTechnology
Source: AIT.
The following operational characteristics of the road can be recorded with the RoadSTARvehicles:
High-quality, realistic skid resistance measurements in different braking conditions(blocked wheel, ABS, slip ratio of 18%, 25%, 50% and 75%)
Transverse evenness: rut depth, theoretical water depth in ruts covering a width of3.30 m and a vehicle width of just 2.50 m
Longitudinal evenness: true elevation profile and calculation of different indices (IRI,PSD, LWI, wLP, etc.)
Macrotexture: Mean profile depth (MPD), estimated texture depth
Surface distress (potholes, fretting, etc.) and cracks from a width of 1 mm based onvideo footage independent of ambient light / shadow covering a width of 4 m
According to GESTRATA, the condition of the high-level road network in Austria is goodcompared to its European counterparts. Through continuously increasing expenditure formaintenance in the last decade, the ASFINAG road network has not exhibited any safetyrelevant defects (e.g. lane grooves, skid resistance). In 2012, ASFINAG was praised by theAustrian Court of Auditors for its maintenance management system.
On the other hand, the State Road network is in a significantly poorer condition. A recentstudy by the Technical University of Vienna in co-operation with PMS-Consult3 on themaintenance needs for state roads revealed that current investments in maintenance ofstate roads are substantially smaller than needed in order to maintain the current conditionof this road network. Figure 5 shows the current condition of the Austrian state roadnetwork, of which 22% can be classified as in poor or very poor condition.
3 Litzka, J., Weninger-Vycudil, A. (2011) Baulicher Erhaltungsbedarf fuer die Landesstrassen Oesterreichs. Studiefuer die oesterreichischen landesstrassenverwaltungen.

EU Road Surfaces: Economic and Safety Impact of the Lack of Regular Road Maintenance____________________________________________________________________________________________
119
Figure 5: Distribution of the classification of the condition of the Austrian StateRoad network in 2010
Source: Litzka and Wieniger (2011).
The study further found that the current yearly investments in maintenance of the stateroad network of approximately €4,800/km need to be increased by 40%, to €6,600/km, tomaintain the current condition of the network. To keep the maintenance backlog at lessthan 20% of the state road network by 2020, maintenance investments would need to beincreased by 46%, to a yearly €7,000/km.
However the condition of the state road network depends strongly on the respective federalstate. Several federal states, namely Vorarlberg, Tyrol, Upper Austria, Lower Austria andBurgenland, have implemented a pavement management system, following the example ofASFINAG. Figure 6 shows the condition of the state road networks in Carinthia, Salzburgand Tyrol in 2010.
Figure 6: Distribution of the classification of the condition of the State Roadnetwork in Carinthia, Salzburg and Tyrol in 2010
Source: Litzka and Weninger-Vycudil (2011).
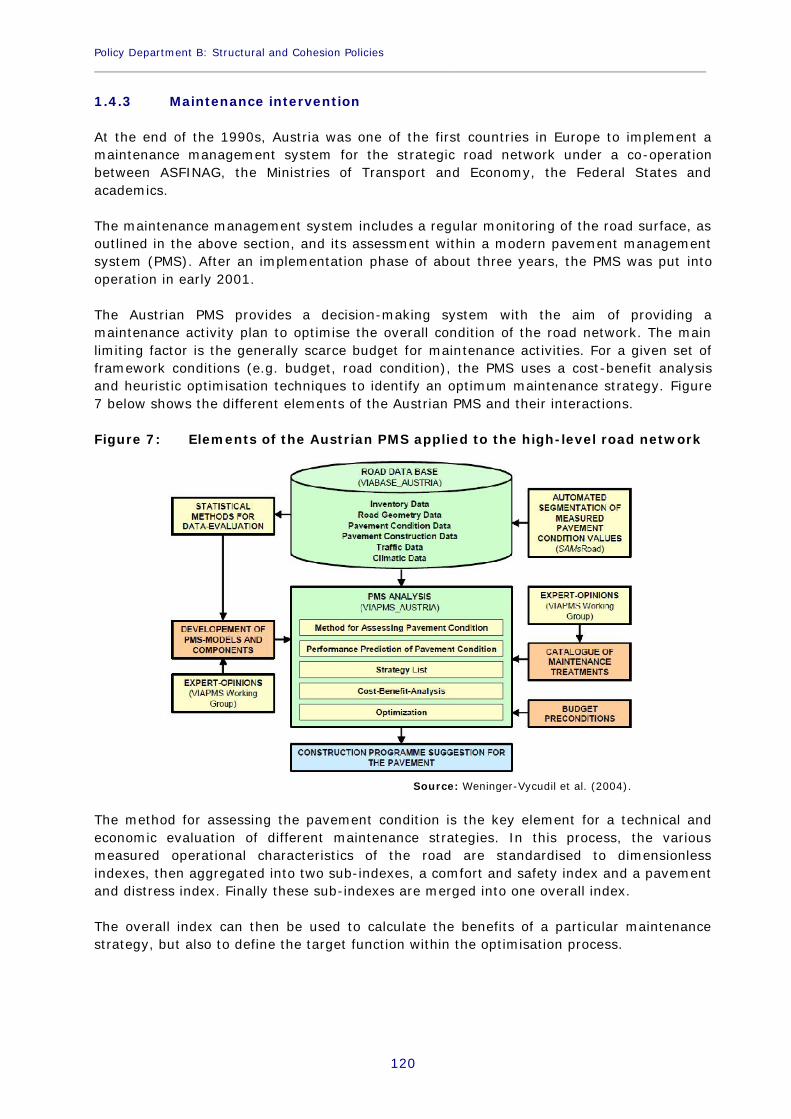
Policy Department B: Structural and Cohesion Policies____________________________________________________________________________________________
120
1.4.3 Maintenance intervention
At the end of the 1990s, Austria was one of the first countries in Europe to implement amaintenance management system for the strategic road network under a co-operationbetween ASFINAG, the Ministries of Transport and Economy, the Federal States andacademics.
The maintenance management system includes a regular monitoring of the road surface, asoutlined in the above section, and its assessment within a modern pavement managementsystem (PMS). After an implementation phase of about three years, the PMS was put intooperation in early 2001.
The Austrian PMS provides a decision-making system with the aim of providing amaintenance activity plan to optimise the overall condition of the road network. The mainlimiting factor is the generally scarce budget for maintenance activities. For a given set offramework conditions (e.g. budget, road condition), the PMS uses a cost-benefit analysisand heuristic optimisation techniques to identify an optimum maintenance strategy. Figure7 below shows the different elements of the Austrian PMS and their interactions.
Figure 7: Elements of the Austrian PMS applied to the high-level road network
Source: Weninger-Vycudil et al. (2004).
The method for assessing the pavement condition is the key element for a technical andeconomic evaluation of different maintenance strategies. In this process, the variousmeasured operational characteristics of the road are standardised to dimensionlessindexes, then aggregated into two sub-indexes, a comfort and safety index and a pavementand distress index. Finally these sub-indexes are merged into one overall index.
The overall index can then be used to calculate the benefits of a particular maintenancestrategy, but also to define the target function within the optimisation process.

EU Road Surfaces: Economic and Safety Impact of the Lack of Regular Road Maintenance____________________________________________________________________________________________
121
1.4.4 Maintenance intervention on the state road network (The example ofCarinthia, Salzburg and Tyrol)
A recent study by the Carinthian audit court4 compared the maintenance strategies on thestate road networks in Carinthia, Salzburg and Tyrol. It found that both road monitoringactivities and the road condition assessment process vary strongly among the variousstates.
In Carinthia, the condition of the state road network has been measured in 2004/05 andagain in 2009/10 using visual measurement devices. The focus of these measurements wasset on identifying surface defects, lane grooves, and unevenness of the longitudinal profile.However due to the applied visual approach, no skid resistance could be measured.
Based on the results of the visual inspection, the road network was then classified into fivecategories (very poor to very good). Based on this classification, the federal state ofCarinthia then produced a ranking list, which was used to define preferential maintenanceactivities.
For the first time in 2008, the state of Salzburg commissioned an extensive monitoring ofthe condition of its state road network. The contracted organisation to carry out theseactivities was the Austrian Institute of Technology with its RoadSTAR measurement vehiclesmentioned above
Based on the data obtained, the state of Salzburg applied a PMS which is consistent withthe one used by ASFINAG on the high-level road network. The PMS produced an optimisedmaintenance strategy for the state road network of Salzburg.
Between 2004 and 2009, the state of Tyrol commissioned the AIT to carry outmeasurement activities on its state road network using the RoadSTAR vehicles. In addition,the Tyrolean Institute for Material Research and Testing carried out visual measurements ofthe state road network to validate the results of the AIT. To assess the condition of theroad network and to produce an optimised maintenance strategy, the state of Tyrol thenapplied the same procedure as the state of Salzburg, using a PMS consistent with the oneused on the Austrian high-level road network.
As a result of the different approaches, the costs incurred by the different states for theassessment of the road condition and to produce a maintenance strategy variedsignificantly. While the state of Carinthia spent approximately €5 per km on this process,the costs incurred by the states of Salzburg and Tyrol were substantially higher, with €44and €41 respectively. The higher costs can be explained mainly by the more sophisticatedmeasurement procedure and the licence fees for the PMS system only applied in Salzburgand Tyrol.
1.4.5 Good practice in maintenance activities
ASFINAG has been praised for their approach towards coordinated maintenance planning.As a general rule, ASFINAG does not allow more than three construction sites on a 100kmstrip on the high-level road network, with one section of work not exceeding 10km. In
4 Rechnungshof Kärnten (2013) Bericht des Rechnungshofes, Bauliche Erhaltung von Landesstraßen.
Policy Department B: Structural and Cohesion Policies____________________________________________________________________________________________
122
addition, ASFINAG seeks to keep to its performance target of no delays in travel time dueto maintenance activities of greater than 5 minutes.5
1.5 Socio-economic impacts of road maintenance
As outlined above, ASFINAG does not receive any state subsidies and funds all itsinvestment activities within its commercial revenues. Therefore, ASFINAG’s finances do notdepend on political decisions regarding the allocation of funds, but do depend on its abilityto generate revenue. For example, in the years after the financial crisis, ASFINAG reducedits infrastructure investments due to reduced revenue following a decrease in traffic on thehigh-level road network.
On the other hand, federal states and municipalities do have substantial budgetconstraints. States and municipalities in Austria have to allocate a specific share of the totalbudget to road maintenance, which is often decreasing in times of increased budget needsfor budgets for social, health or educational activities.
Furthermore, we could not find any evidence for a socio-economic impact of spending onroad maintenance, e.g. an improved road-safety record.
1.6 Summary for Austria
Maintenance expenditure for the Austrian strategic road network has gradually increasedover the last 15 years. The maintenance budget is not dependent on political decisions onbudget allocation, but depends only on the financial situation of the road operatorASFINAG, which sources its income mainly from tolls.
On its strategic road network, Austria implemented a modern road condition monitoringand assessment system using a pavement management system. Limited funds cantherefore be allocated to road maintenance activities to optimise pre-defined objectives,like the overall condition of the road network.
Regarding the rest of the road network, comprising state, local and urban roads, there is noconsistent approach to monitoring and assessing the road condition, nor a dedicatedallocation of funds to maintenance activities.
We found that a number of federal states implemented a similar maintenance approach ontheir state road network as ASFINAG does on the high-level road network, includingmonitoring and assessment processes in combination with a modern pavementmanagement system. Although there is no consistent approach towards monitoring roadcondition, road condition data surveyed by the federal states suggests that the state roadnetwork in Austria is in worse condition than the strategic road network.
5 Ernst and Young (2012), Effectiveness of national roads maintenance management in Poland.

EU Road Surfaces: Economic and Safety Impact of the Lack of Regular Road Maintenance____________________________________________________________________________________________
123
2. CASE STUDY FRANCE
2.1 Member State Overview
France’s total road network is 1,041,800 km long, of which 11,400 km are motorways and654,200 km are classified as municipal roads. France’s current level of car ownership isapproximately 500 passenger cars per 1000 inhabitants. This level has slightly decreased inthe period 2001-2011; the percentage change over this period was -1.2% (Eurostat).
2.2 Road Safety Statistics
In 2011, France registered 3,963 fatalities on its roads, which represents a 51% decreasefrom 2001. In terms of fatalities per million inhabitants, France’s value of 63 is slightlyabove the EU27 average of 60. Using other indices France scores more favourably relativeto the EU27 average: it registered 44 fatalities per 10 billion passenger kilometres (belowthe EU average of 61), whilst its figure of 125 fatalities per million passenger cars ismarginally less than the EU average of 126. There were 65,000 accidents resulting inpersonal injury on French roads in 2011, which is a 44% decrease on the same figurerecorded in 2001 (Eurostat and OECD).
2.3 Maintenance budgets analysis
2.3.1 Infrastructure spending
The Union des Syndicats de l’Industrie Routière Française (USIRF) told us that they haveidentified a significant decrease in the annual road maintenance budget. Since 2008, theoverall budget fallen by 25% across all network types (National, Departemental or Local)and it is likely that in 2014 this will fall by an additional -5% (-10% on county roads).
Figure 8: Total expenses in road infrastructure
Source: Union Routière Francaise, DGFiP (French Finance Ministry) et SOeS (2013).
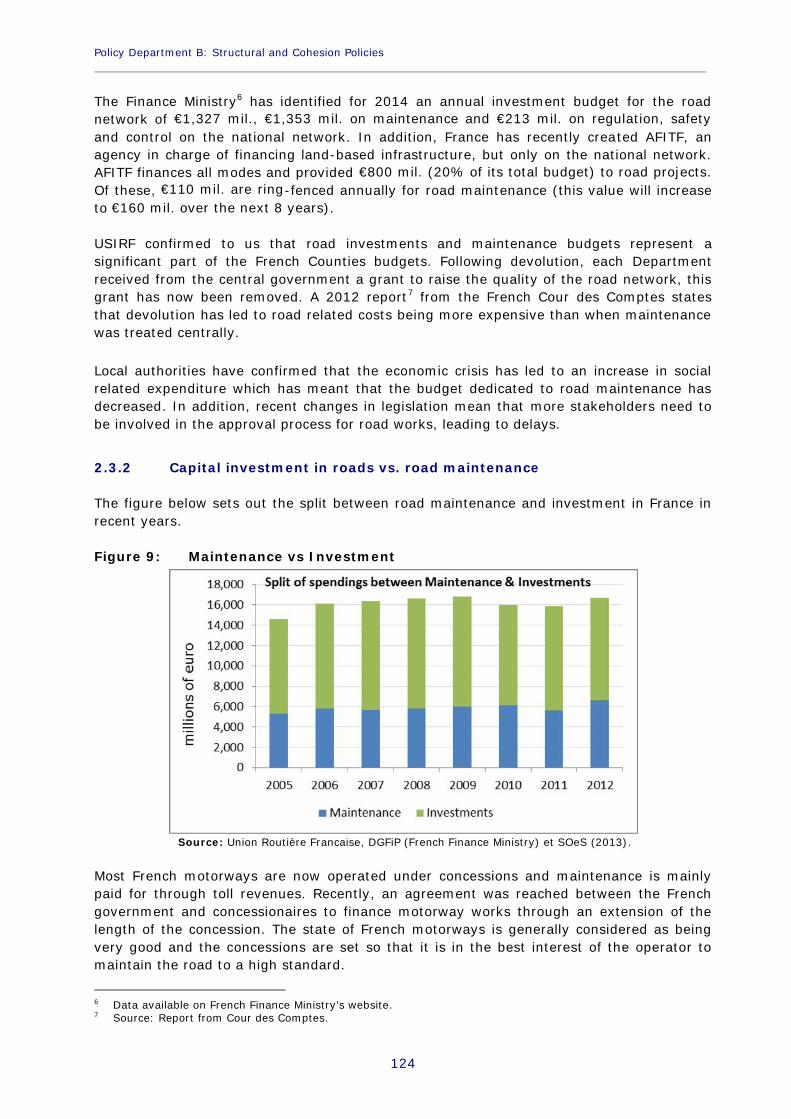
Policy Department B: Structural and Cohesion Policies____________________________________________________________________________________________
124
The Finance Ministry6 has identified for 2014 an annual investment budget for the roadnetwork of €1,327 mil., €1,353 mil. on maintenance and €213 mil. on regulation, safetyand control on the national network. In addition, France has recently created AFITF, anagency in charge of financing land-based infrastructure, but only on the national network.AFITF finances all modes and provided €800 mil. (20% of its total budget) to road projects.Of these, €110 mil. are ring-fenced annually for road maintenance (this value will increaseto €160 mil. over the next 8 years).
USIRF confirmed to us that road investments and maintenance budgets represent asignificant part of the French Counties budgets. Following devolution, each Departmentreceived from the central government a grant to raise the quality of the road network, thisgrant has now been removed. A 2012 report7 from the French Cour des Comptes statesthat devolution has led to road related costs being more expensive than when maintenancewas treated centrally.
Local authorities have confirmed that the economic crisis has led to an increase in socialrelated expenditure which has meant that the budget dedicated to road maintenance hasdecreased. In addition, recent changes in legislation mean that more stakeholders need tobe involved in the approval process for road works, leading to delays.
2.3.2 Capital investment in roads vs. road maintenance
The figure below sets out the split between road maintenance and investment in France inrecent years.
Figure 9: Maintenance vs Investment
Source: Union Routière Francaise, DGFiP (French Finance Ministry) et SOeS (2013).
Most French motorways are now operated under concessions and maintenance is mainlypaid for through toll revenues. Recently, an agreement was reached between the Frenchgovernment and concessionaires to finance motorway works through an extension of thelength of the concession. The state of French motorways is generally considered as beingvery good and the concessions are set so that it is in the best interest of the operator tomaintain the road to a high standard.
6 Data available on French Finance Ministry’s website.7 Source: Report from Cour des Comptes.
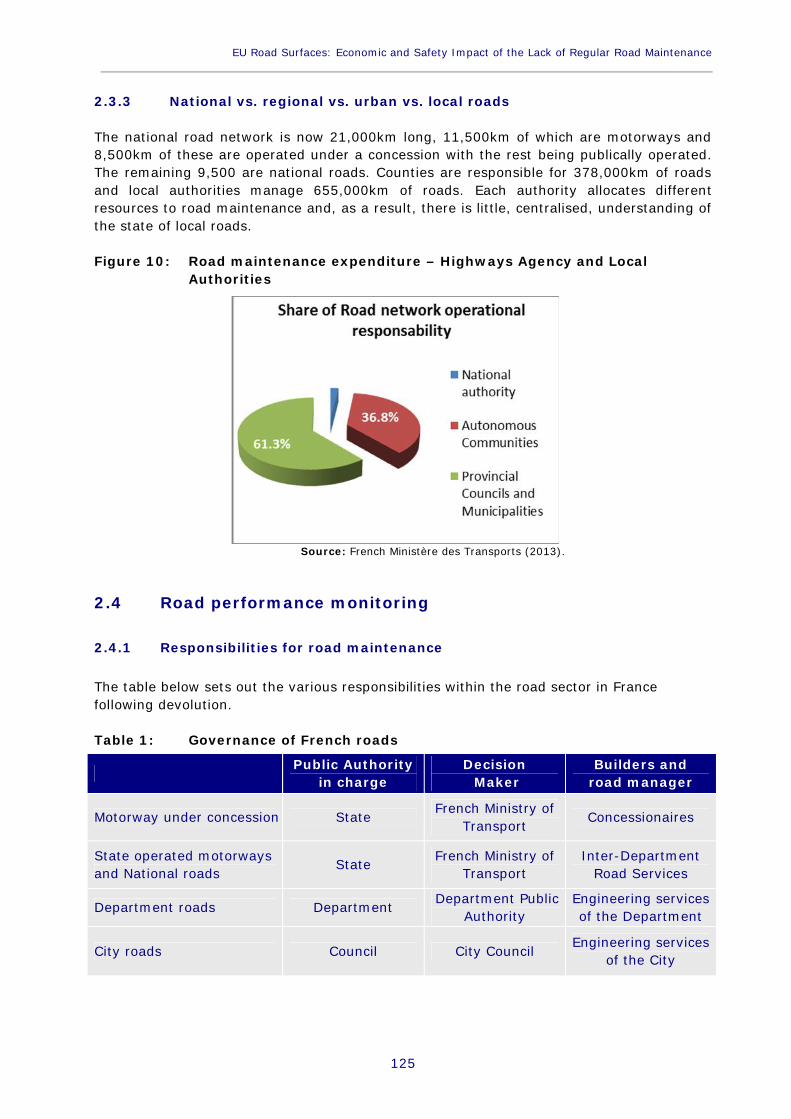
EU Road Surfaces: Economic and Safety Impact of the Lack of Regular Road Maintenance____________________________________________________________________________________________
125
2.3.3 National vs. regional vs. urban vs. local roads
The national road network is now 21,000km long, 11,500km of which are motorways and8,500km of these are operated under a concession with the rest being publically operated.The remaining 9,500 are national roads. Counties are responsible for 378,000km of roadsand local authorities manage 655,000km of roads. Each authority allocates differentresources to road maintenance and, as a result, there is little, centralised, understanding ofthe state of local roads.
Figure 10: Road maintenance expenditure – Highways Agency and LocalAuthorities
Source: French Ministère des Transports (2013).
2.4 Road performance monitoring
2.4.1 Responsibilities for road maintenance
The table below sets out the various responsibilities within the road sector in Francefollowing devolution.
Table 1: Governance of French roads
Public Authorityin charge
DecisionMaker
Builders androad manager
Motorway under concession State French Ministry ofTransport Concessionaires
State operated motorwaysand National roads State French Ministry of
TransportInter-Department
Road Services
Department roads Department Department PublicAuthority
Engineering servicesof the Department
City roads Council City Council Engineering servicesof the City

Policy Department B: Structural and Cohesion Policies____________________________________________________________________________________________
126
Devolution has also led to a “brain drain” in the sector with many competencies passing tothe private sector and no longer being affordable for local authorities.
The figure below shows the difference between spending from local authorities and thosewhere the source is national funds. As it can be observed, devolution has a very importantfinancial impact for counties and cities.
Figure 11: Split between source spendings
Source: Union Routière Francaise, DGFiP (French Finance Ministry) et SOeS.
2.4.2 Assessment of road surface quality
Assessment of road quality is carried out through the use of sophisticated tools which thenprovide information that feed into the calculation of two main indicators8 that are used toobserve the quality of road infrastructure on the national network: IQRN and IQOA(described below) which assess the quality of the road on an annual basis. While the IQRDcovers the departemental network, it is less effective and more expensive to operate. Thereare no such indicators in place for local authorities. The 2012 figures show that the Frenchroad network is still of high quality although there is a downward trend in the scores of theindicators. There has been an 8% fall (compared to 2011) in the amount of roadway in“very good” condition (grade > 17/20) and an 18%9 increase in the amount of roadwaywith “average” condition (12> grade> 17). Only in the bridges and tunnels category hasthere been an improvement in the scores in 2012.
In order to set up such indicators, road paths need to be regularly probed. Companies suchas Technologies Nouvelles in France (similar to others in France and the EU) havedeveloped specific products, such as special trucks equipped with SHWD (Super HeavyWeight Deflectometer) technology, which provide a large quantity of data. Other tools canbe used for specific purposes such as Evalis for damage and deformation, Lacroix fordeflection or tools measuring the longitudinal evenness or the pavement structure.
8 Report Mobilité 21, Evaluation of National Scheme on Transportation Infrastructure.9 Report on annual performance regarding program 203 on infrastructure and transportation services.

EU Road Surfaces: Economic and Safety Impact of the Lack of Regular Road Maintenance____________________________________________________________________________________________
127
2.4.3 Scheduling and best practice in maintenance interventions
The general approach to road maintenance in France involves carrying out maintenance ina three-year cycle. Some Counties however are differentiating their maintenance regimesbased on the different usage patterns of their respective road networks. This is necessarygiven the size of the French network and is also being accompanied by a trend towards lessdetailed but faster and cheaper tools to facilitate monitoring. Some authorities are alsoconsidering the introduction of smart road and vehicle technologies to optimisemaintenance. Devolution has also meant that maintenance planning has also diversifiedand studies are underway seeking to reverse this trend and identify appropriatemethodologies to ensure appropriate maintenance planning. USIRF is also planning tocreate a catalogue of global costs of each maintenance procedure and its life cycle cost tofacilitate in the maintenance planning process.
The required maintenance expenditure is likely to rise in the future as public authorities cutback on current expenditure at this time. The cost of such a strategy appears to be lower inthe long term. This is to be accompanied by modifications to the road path in order toreduce the need for maintenance. USIRF is planning to publish an independent review ofexisting solutions to help public authorities to make informed decisions on the matter.
Stakeholders such as the FFMC (Fédération Francaise des Motards en Colère), member ofFEMA (Federation of European Motorcycles Association), have engaged in discussions withroad authorities to highlight their specific needs with respect to maintenance interventions.They expressed concerns both in relation to the way surface quality is assessed (beingbiased towards cars) and the way interventions are scheduled which they believe do nottaking into account specific seasonal effects.
2.5 Socio-economic impacts of road maintenance
The impact of road maintenance on road safety has not been identified in France. However,some weak signals are appearing and the Union des Routes de France should investigatethis in more depth in 2014. Indeed an increase in windshield breakages has been identifiedin recent years. Organisations such as the Union Routière de France is planning toinvestigate this issue in 2014 to assess the probability of insurance firms increasing theirpremiums. There has also been a relative increase in the number of deaths on departementroads versus national ones (+14% in 10 years). Even though the cause of most incidents isregistered as “human” in most police reports, this imbalance shows that either theinfrastructure on national roads is getting better or the departement roads are gettingworst. In addition, 66% of deaths on French roads happen on departement roads while only34% of injuries occur there, illustrating that the accidents are often more severe. This canbe explained by the presence of many obstacles at the side of the road or by the specifictechnical characteristics of the road (signs, poor shaped road shoulders, traffic intersection,double-direction road path, etc.).
We have not been able to identify any studies conducted on the potential link betweeninfrastructure characteristics and road safety and the social security budget. Stakeholderscommented that public authorities do not want to commit to minimum levels of asphaltmacro-texture as there is a risk a victim of aquaplaning could sue them if those measureswere not respected. However, the cost of accidents for the nation has been looked at. Onedeath is estimated to generate a cost of €1,342.072m for society. When someone has to goto the hospital for 24+ hours, the cost is €143,787 and €5,752 in case of light injuries.
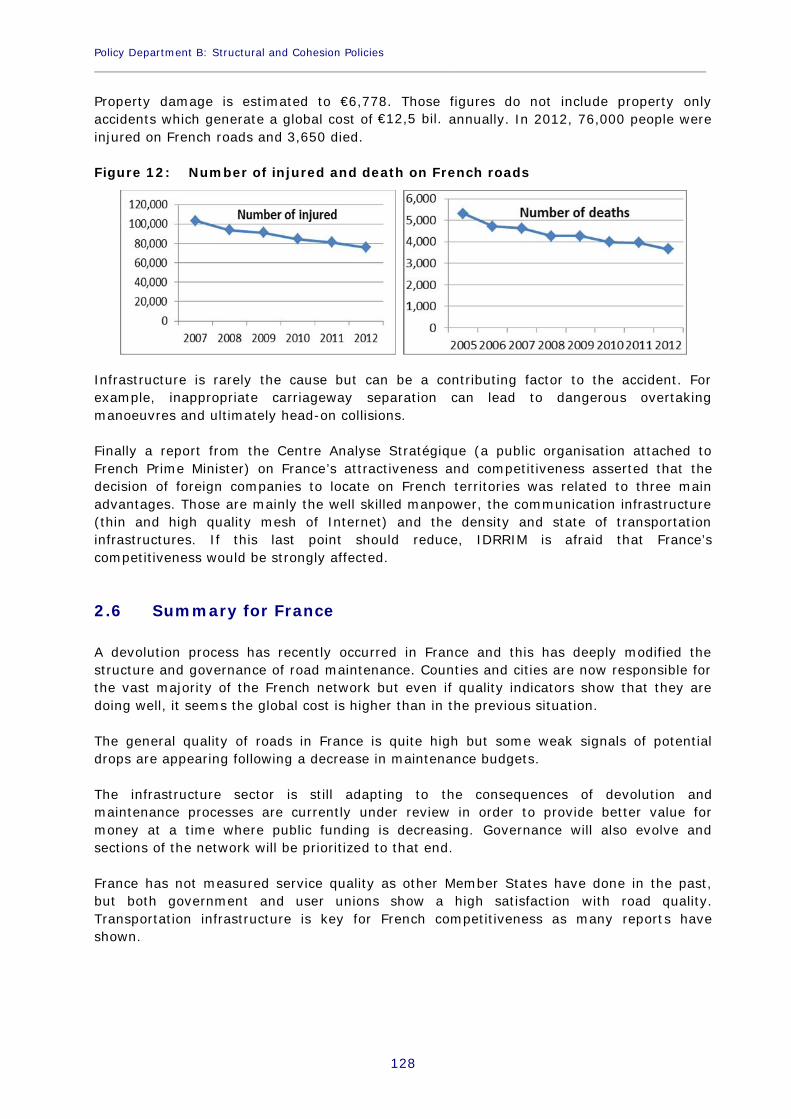
Policy Department B: Structural and Cohesion Policies____________________________________________________________________________________________
128
Property damage is estimated to €6,778. Those figures do not include property onlyaccidents which generate a global cost of €12,5 bil. annually. In 2012, 76,000 people wereinjured on French roads and 3,650 died.
Figure 12: Number of injured and death on French roads
Infrastructure is rarely the cause but can be a contributing factor to the accident. Forexample, inappropriate carriageway separation can lead to dangerous overtakingmanoeuvres and ultimately head-on collisions.
Finally a report from the Centre Analyse Stratégique (a public organisation attached toFrench Prime Minister) on France’s attractiveness and competitiveness asserted that thedecision of foreign companies to locate on French territories was related to three mainadvantages. Those are mainly the well skilled manpower, the communication infrastructure(thin and high quality mesh of Internet) and the density and state of transportationinfrastructures. If this last point should reduce, IDRRIM is afraid that France’scompetitiveness would be strongly affected.
2.6 Summary for France
A devolution process has recently occurred in France and this has deeply modified thestructure and governance of road maintenance. Counties and cities are now responsible forthe vast majority of the French network but even if quality indicators show that they aredoing well, it seems the global cost is higher than in the previous situation.
The general quality of roads in France is quite high but some weak signals of potentialdrops are appearing following a decrease in maintenance budgets.
The infrastructure sector is still adapting to the consequences of devolution andmaintenance processes are currently under review in order to provide better value formoney at a time where public funding is decreasing. Governance will also evolve andsections of the network will be prioritized to that end.
France has not measured service quality as other Member States have done in the past,but both government and user unions show a high satisfaction with road quality.Transportation infrastructure is key for French competitiveness as many reports haveshown.
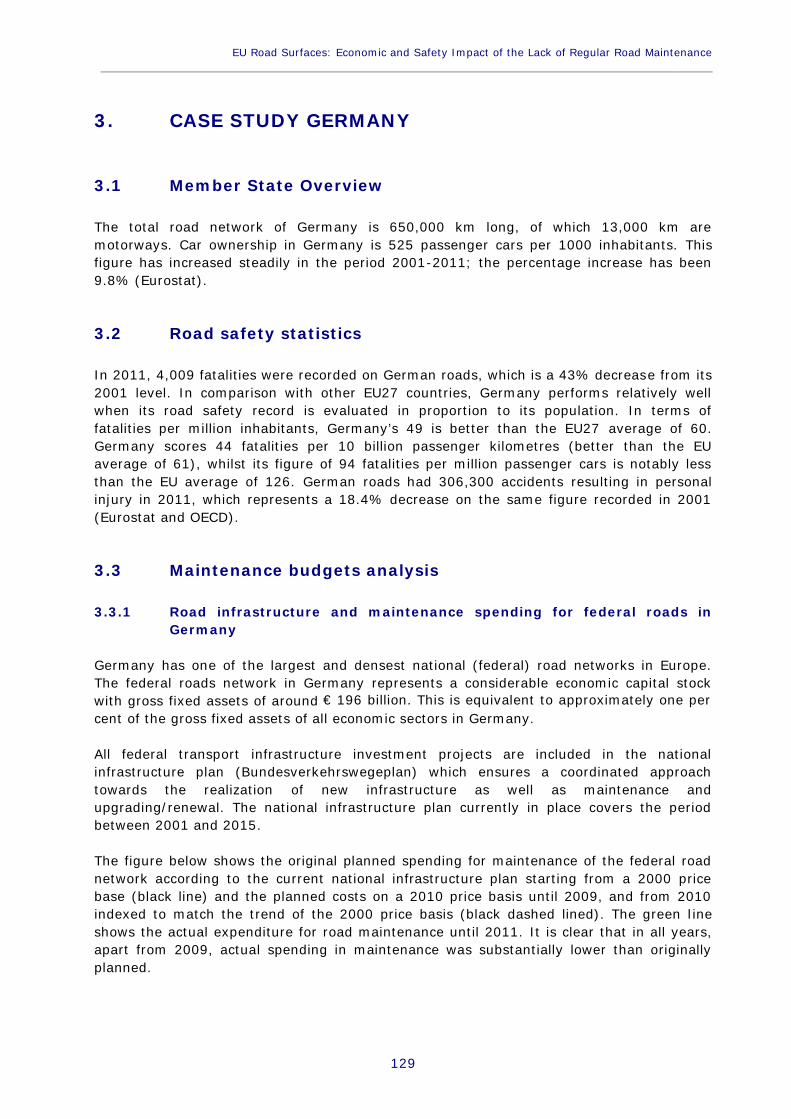
EU Road Surfaces: Economic and Safety Impact of the Lack of Regular Road Maintenance____________________________________________________________________________________________
129
3. CASE STUDY GERMANY
3.1 Member State Overview
The total road network of Germany is 650,000 km long, of which 13,000 km aremotorways. Car ownership in Germany is 525 passenger cars per 1000 inhabitants. Thisfigure has increased steadily in the period 2001-2011; the percentage increase has been9.8% (Eurostat).
3.2 Road safety statistics
In 2011, 4,009 fatalities were recorded on German roads, which is a 43% decrease from its2001 level. In comparison with other EU27 countries, Germany performs relatively wellwhen its road safety record is evaluated in proportion to its population. In terms offatalities per million inhabitants, Germany’s 49 is better than the EU27 average of 60.Germany scores 44 fatalities per 10 billion passenger kilometres (better than the EUaverage of 61), whilst its figure of 94 fatalities per million passenger cars is notably lessthan the EU average of 126. German roads had 306,300 accidents resulting in personalinjury in 2011, which represents a 18.4% decrease on the same figure recorded in 2001(Eurostat and OECD).
3.3 Maintenance budgets analysis
3.3.1 Road infrastructure and maintenance spending for federal roads inGermany
Germany has one of the largest and densest national (federal) road networks in Europe.The federal roads network in Germany represents a considerable economic capital stockwith gross fixed assets of around € 196 billion. This is equivalent to approximately one percent of the gross fixed assets of all economic sectors in Germany.
All federal transport infrastructure investment projects are included in the nationalinfrastructure plan (Bundesverkehrswegeplan) which ensures a coordinated approachtowards the realization of new infrastructure as well as maintenance andupgrading/renewal. The national infrastructure plan currently in place covers the periodbetween 2001 and 2015.
The figure below shows the original planned spending for maintenance of the federal roadnetwork according to the current national infrastructure plan starting from a 2000 pricebase (black line) and the planned costs on a 2010 price basis until 2009, and from 2010indexed to match the trend of the 2000 price basis (black dashed lined). The green lineshows the actual expenditure for road maintenance until 2011. It is clear that in all years,apart from 2009, actual spending in maintenance was substantially lower than originallyplanned.
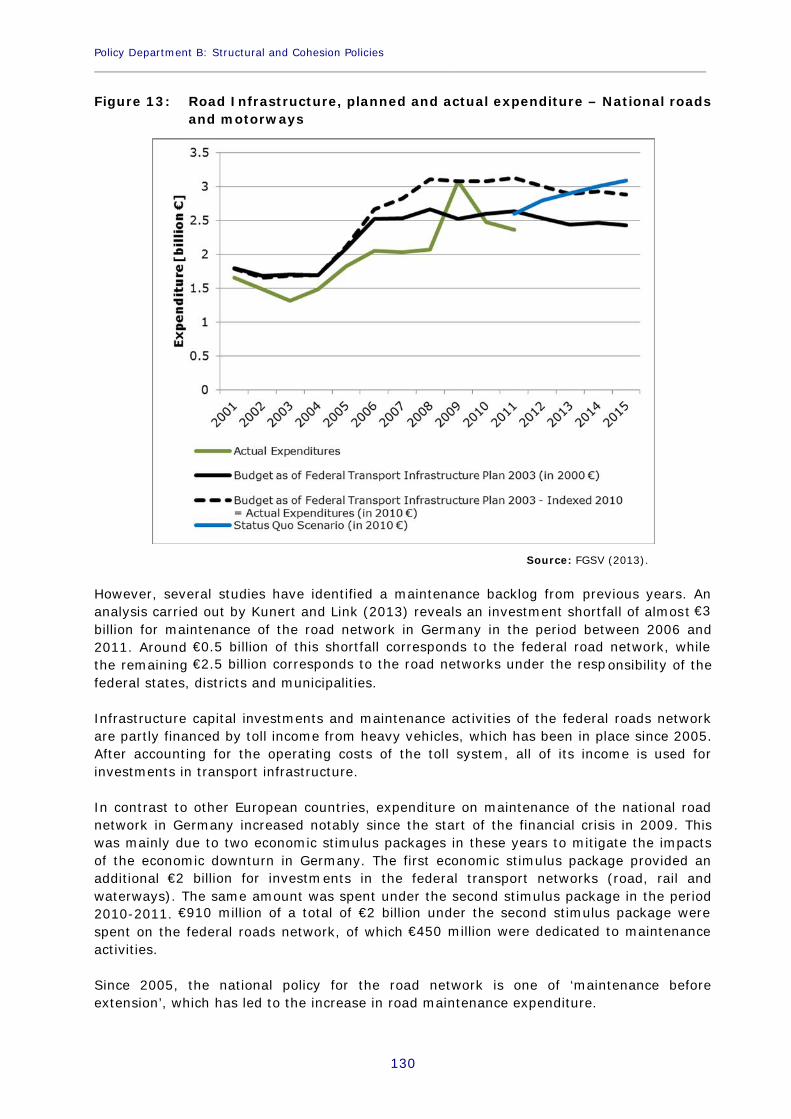
Policy Department B: Structural and Cohesion Policies____________________________________________________________________________________________
130
Figure 13: Road Infrastructure, planned and actual expenditure – National roadsand motorways
Source: FGSV (2013).
However, several studies have identified a maintenance backlog from previous years. Ananalysis carried out by Kunert and Link (2013) reveals an investment shortfall of almost €3billion for maintenance of the road network in Germany in the period between 2006 and2011. Around €0.5 billion of this shortfall corresponds to the federal road network, whilethe remaining €2.5 billion corresponds to the road networks under the responsibility of thefederal states, districts and municipalities.
Infrastructure capital investments and maintenance activities of the federal roads networkare partly financed by toll income from heavy vehicles, which has been in place since 2005.After accounting for the operating costs of the toll system, all of its income is used forinvestments in transport infrastructure.
In contrast to other European countries, expenditure on maintenance of the national roadnetwork in Germany increased notably since the start of the financial crisis in 2009. Thiswas mainly due to two economic stimulus packages in these years to mitigate the impactsof the economic downturn in Germany. The first economic stimulus package provided anadditional €2 billion for investments in the federal transport networks (road, rail andwaterways). The same amount was spent under the second stimulus package in the period2010-2011. €910 million of a total of €2 billion under the second stimulus package werespent on the federal roads network, of which €450 million were dedicated to maintenanceactivities.
Since 2005, the national policy for the road network is one of ‘maintenance beforeextension’, which has led to the increase in road maintenance expenditure.

EU Road Surfaces: Economic and Safety Impact of the Lack of Regular Road Maintenance____________________________________________________________________________________________
131
The Federal Government estimated that it requires annual spending of more than €3 billionin order to maintain the condition of the federal road network at its current level. Thereason for this increased spending is mainly as a result of an increase in maintenance costsand increased maintenance needs due to an unexpectedly high increase in heavy traffic onthis network. Table 2 sets out the planned governmental spending for the maintenance ofthe federal road network in the coming years.
Table 2: Planned expenditure for maintenance of the federal roads network(billion €)
2013 2014 2015 2016
2.5 2.6 2.7 2.8
Source: German Bundestag (2013b).
The draft of the new National Infrastructure Plan allocates the highest priority to themaintenance of the existing network. Funds for network extensions and elimination ofbottlenecks will therefore only be released after financing of maintenance activities issufficient.
3.3.2 Road infrastructure and maintenance spending for local roads inGermany
Figure 14 below shows the evolution of investment in road infrastructure by localauthorities (municipalities) since the 1950s (adjusted by inflation). Since the early 1980sthere has been a continuous decrease in spending in the Old Länder. This is similar to theevolution in the New Länder since the early 1990s. As network length has remained broadlythe same, it can be assumed that municipalities have been gradually spending less on themaintenance of their road networks.
In this context, ADAC (2011) reports that a large-scale survey involving local authoritiesrevealed that seven out of ten municipalities have a significant backlog in road investment.
Figure 14: Investments in road infrastructure by municipalities
Source: Difu (2008).
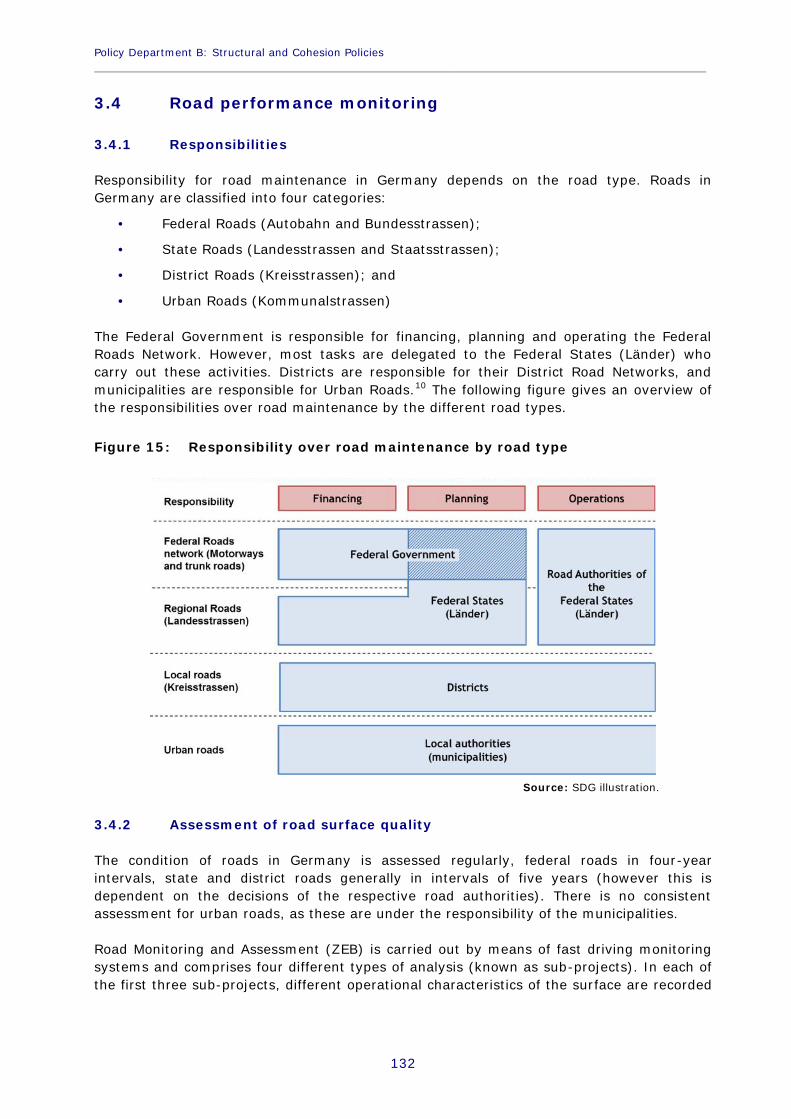
Policy Department B: Structural and Cohesion Policies____________________________________________________________________________________________
132
3.4 Road performance monitoring
3.4.1 Responsibilities
Responsibility for road maintenance in Germany depends on the road type. Roads inGermany are classified into four categories:
Federal Roads (Autobahn and Bundesstrassen);
State Roads (Landesstrassen and Staatsstrassen);
District Roads (Kreisstrassen); and
Urban Roads (Kommunalstrassen)
The Federal Government is responsible for financing, planning and operating the FederalRoads Network. However, most tasks are delegated to the Federal States (Länder) whocarry out these activities. Districts are responsible for their District Road Networks, andmunicipalities are responsible for Urban Roads.10 The following figure gives an overview ofthe responsibilities over road maintenance by the different road types.
Figure 15: Responsibility over road maintenance by road type
Source: SDG illustration.
3.4.2 Assessment of road surface quality
The condition of roads in Germany is assessed regularly, federal roads in four-yearintervals, state and district roads generally in intervals of five years (however this isdependent on the decisions of the respective road authorities). There is no consistentassessment for urban roads, as these are under the responsibility of the municipalities.
Road Monitoring and Assessment (ZEB) is carried out by means of fast driving monitoringsystems and comprises four different types of analysis (known as sub-projects). In each ofthe first three sub-projects, different operational characteristics of the surface are recorded
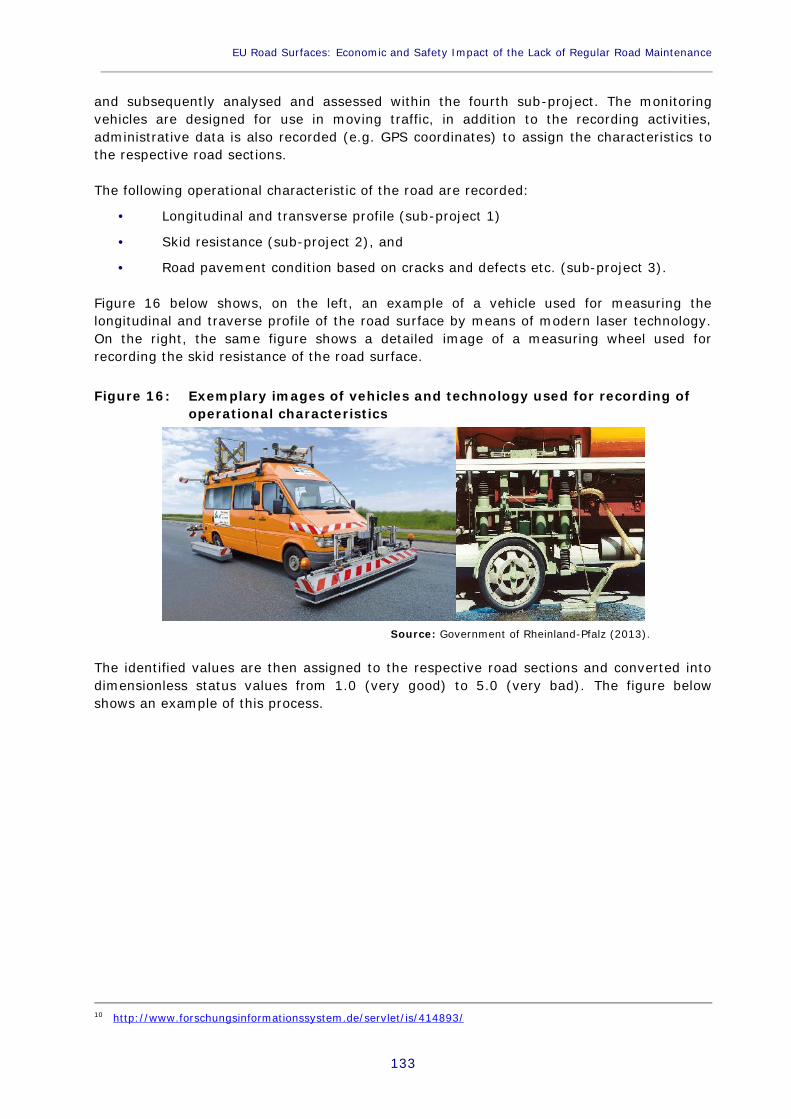
EU Road Surfaces: Economic and Safety Impact of the Lack of Regular Road Maintenance____________________________________________________________________________________________
133
and subsequently analysed and assessed within the fourth sub-project. The monitoringvehicles are designed for use in moving traffic, in addition to the recording activities,administrative data is also recorded (e.g. GPS coordinates) to assign the characteristics tothe respective road sections.
The following operational characteristic of the road are recorded:
Longitudinal and transverse profile (sub-project 1)
Skid resistance (sub-project 2), and
Road pavement condition based on cracks and defects etc. (sub-project 3).
Figure 16 below shows, on the left, an example of a vehicle used for measuring thelongitudinal and traverse profile of the road surface by means of modern laser technology.On the right, the same figure shows a detailed image of a measuring wheel used forrecording the skid resistance of the road surface.
Figure 16: Exemplary images of vehicles and technology used for recording ofoperational characteristics
Source: Government of Rheinland-Pfalz (2013).
The identified values are then assigned to the respective road sections and converted intodimensionless status values from 1.0 (very good) to 5.0 (very bad). The figure belowshows an example of this process.
10 http://www.forschungsinformationssystem.de/servlet/is/414893/
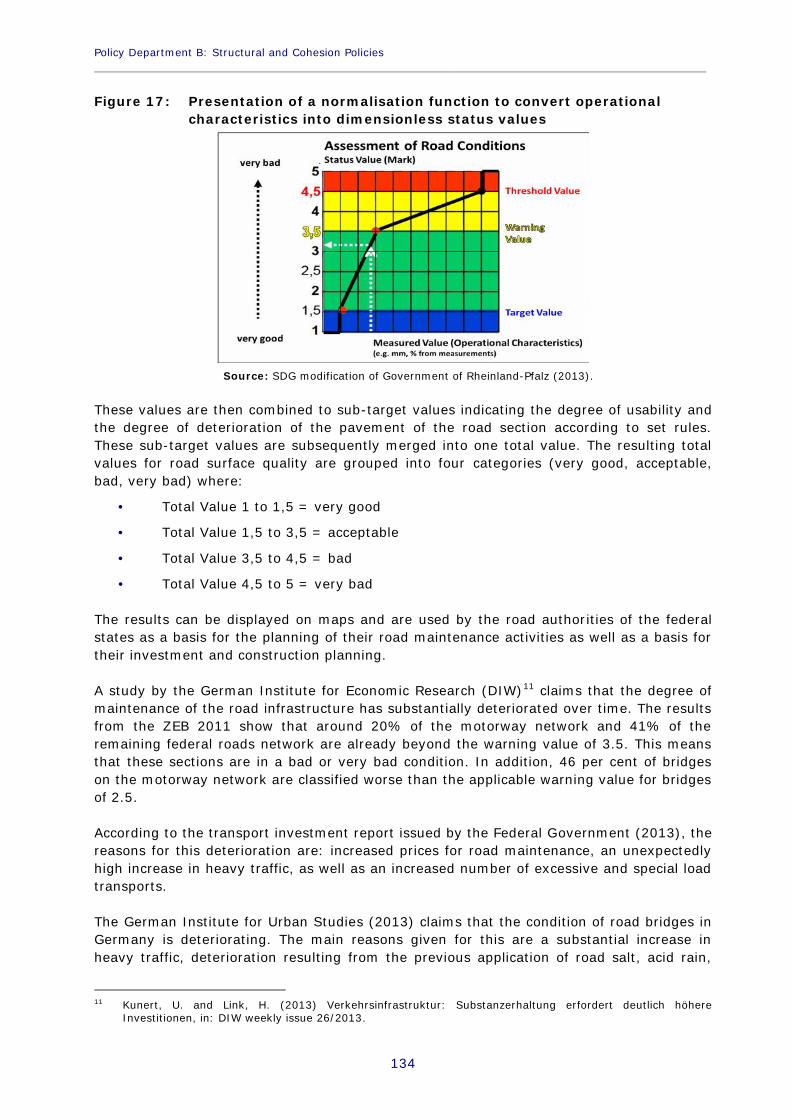
Policy Department B: Structural and Cohesion Policies____________________________________________________________________________________________
134
Figure 17: Presentation of a normalisation function to convert operationalcharacteristics into dimensionless status values
Source: SDG modification of Government of Rheinland-Pfalz (2013).
These values are then combined to sub-target values indicating the degree of usability andthe degree of deterioration of the pavement of the road section according to set rules.These sub-target values are subsequently merged into one total value. The resulting totalvalues for road surface quality are grouped into four categories (very good, acceptable,bad, very bad) where:
Total Value 1 to 1,5 = very good
Total Value 1,5 to 3,5 = acceptable
Total Value 3,5 to 4,5 = bad
Total Value 4,5 to 5 = very bad
The results can be displayed on maps and are used by the road authorities of the federalstates as a basis for the planning of their road maintenance activities as well as a basis fortheir investment and construction planning.
A study by the German Institute for Economic Research (DIW)11 claims that the degree ofmaintenance of the road infrastructure has substantially deteriorated over time. The resultsfrom the ZEB 2011 show that around 20% of the motorway network and 41% of theremaining federal roads network are already beyond the warning value of 3.5. This meansthat these sections are in a bad or very bad condition. In addition, 46 per cent of bridgeson the motorway network are classified worse than the applicable warning value for bridgesof 2.5.
According to the transport investment report issued by the Federal Government (2013), thereasons for this deterioration are: increased prices for road maintenance, an unexpectedlyhigh increase in heavy traffic, as well as an increased number of excessive and special loadtransports.
The German Institute for Urban Studies (2013) claims that the condition of road bridges inGermany is deteriorating. The main reasons given for this are a substantial increase inheavy traffic, deterioration resulting from the previous application of road salt, acid rain,
11 Kunert, U. and Link, H. (2013) Verkehrsinfrastruktur: Substanzerhaltung erfordert deutlich höhereInvestitionen, in: DIW weekly issue 26/2013.

EU Road Surfaces: Economic and Safety Impact of the Lack of Regular Road Maintenance____________________________________________________________________________________________
135
the construction boom between the 1960s and 1980s, and a lack of maintenance activitiesparticularly of bridges under the responsibility of municipalities. The construction boombetween the 1960s and the 1980s implies that many bridges are now reaching a criticalage in which they have to be replaced or fully renewed.
To estimate the condition of bridges on the urban road network, the German Institute forUrban Studies carried out an extensive study in which they consulted with more than 500municipalities. They found that around 50% of bridges under the responsibility ofmunicipalities are in poor condition (classified worse than the warning value of 2.5).
The deterioration of the road network under the responsibility of the municipalities is inmany places apparent, but there are no official statistics due to a lack of consistent datacollection and documentation.
3.4.3 Maintenance intervention
In 1999, a Pavement management System (PMS) was implemented in Germany. Sincethen the tool has proved to be successful in monitoring the state of the network, and is nowused in nearly all federal states to support the maintenance planning process. The PMS isable to estimate the condition of the road pavement for individual sections of the networkbased on measured input data and empirically observed long-term road surface condition.The PMS elaborates the data provided by the ZEB, which only provides a snapshot of thecurrent state of the road condition, and provides an estimate of the evolution of thecondition of the road network. It also allows for the maintenance programme to beoptimised according to the various conditions.
The German PMS has been set up in 8 different modules which can be improved individuallywithout affecting the overall functionality of the PMS. These modules are:
In the first module, road areas with similar quality are combined into larger,homogeneous sections.
The second module selects the sections that need to be maintained.
The third module analyses faults and the causes of faults.
The fourth module provides a prediction of the changes in road condition.
The fifth module provides suggestions for structurally feasible maintenancemeasures.
The sixth module calculates the effectiveness of these measures and provides aranking of the various alternatives.
The seventh module optimises the alternatives given budget restrictions.
The eighth module provides a suggestion for an optimised maintenanceprogramme.
3.4.4 Good practice in maintenance activities by municipalities
Municipalities have sought innovative approaches to improve the condition of the roads anddecrease spending on maintenance activities. The municipality of Hamburg, for example,implemented a maintenance process using 100% recycled asphalt. On selected roadsections, each layer of asphalt is milled off separately and subsequently regenerated byadding substances that reactivate the aged bitumen. The regenerated asphalt is then re-
Policy Department B: Structural and Cohesion Policies____________________________________________________________________________________________
136
applied to the respective road section. According to most recent observations, the materialhas the same level of quality as newly produced asphalt, but is accompanied by a costreduction in the order of 30%.
The maintenance approach used in Rednitzhembach, a municipality with a population of7,000, proved that road maintenance does not need to impact the municipal budget. In1996, the municipality, which then was one of the most indebted in Germany, stoppedfilling individual potholes. Instead, 42km of the municipality’s road network wereprogressively resurfaced through a process where only a few centimetres of the roadsurface are milled off and later applied again. This approach has been effective, contrary toexpectations. With this strategy, Rednitzhembach saved a substantial amount of moneyassisting in the cancellation of its debt.
3.5 Socio-economic impacts of road maintenance
3.5.1 Operating efficiency
The ADAC (2011) claims that the condition of the German road network is graduallyworsening. They state that apart from this giving a poor picture, poor infrastructure is alsodangerous and brings macroeconomic harm. A lack of road maintenance can result in anincreased number of accidents, increased vehicle wear and tear as well as delays due tohampered traffic flow. The ADAC estimated these macroeconomic impacts costs equate to4% of the German GDP.
The Friedrich Ebert Foundation reports that the condition of the state road network in theGerman region of Hesse and the amount of spending on maintenance activities has beencriticised by industry associations. Due to the poor condition of the road surface, a speedlimit was applied to 520km of state road network (out of a total of 7,200km) in 2005. Inaddition 330 out of 1,950 bridges were closed to heavy vehicles. Due to the poor conditionof the road network, truck trips need to be rerouted leading to increased costs for theaffected companies.
3.5.2 Impacts on public spending
Socio-economic benefits of investment in road infrastructure can be estimated by means ofa cost benefit analysis. This type of analysis has the advantage of also incorporatingbenefits that do not feed into GDP calculations, e.g. environmental impacts, noise, andother non-monetary costs. Based on the cost-benefit ratios of 1,300 projects listed in thenational infrastructure plan, Armbrecht and Hartwig (2005) estimated an annual averagenet benefit of €173 million over a period of 30 years for each €1 billion of investment infederal road infrastructure.
The ADAC (2013) and the German Institute for Urban Studies (2013) claim that the lack ofmaintenance spending of municipalities is partly due to the poor financial state of manymunicipalities. Recent changes in legislation implied that the financial burden onmunicipalities increased substantially. Only between 2000 and 2010, social spending bymunicipalities increased by approximately 60%. While up to 2008, municipalities inGermany achieved an overall budget surplus, with €7.7 billion in 2008, this has turned intoa substantial deficit of almost €8.9 billion in 2010. However, recent data suggests that in2011, due to the economic upturn, this budget deficit has been diminished to only €2.9billion.
EU Road Surfaces: Economic and Safety Impact of the Lack of Regular Road Maintenance____________________________________________________________________________________________
137
In 2007, the Green Party in the German Parliament published a study12 arguing that thereis no empirical evidence for a positive impact on the regional economy and the substantialinvestments in the extension of the road infrastructure that took place in the New Länder.In response to this study, Pro Mobilität commissioned the Technical University of Berlin andIGES to find further evidence for a link between capital investments in roads and regionaleconomic impacts. Their study13 found that a positive link between investments in roadinfrastructure and growth of the local economy can be well described in theory. However,they further concluded that there is no clear evidence on the actual magnitude of thispositive impact and the possible spatial distribution of such effects.
3.6 Summary for Germany
Road infrastructure in Germany is generally in a good condition, however, evidencesuggests that it has deteriorated in recent years. The reason for this is mainly seen in anincreased number of heavy vehicle trips over the period. In addition, the condition offederal roads is notably better than that of state, district or urban roads. Particularly,municipalities suffer from a lack of financial resources and, as a result, this is also the casefor urban roads which are operated and maintained under their responsibility.
A Pavement Management System has been put in place to optimise maintenance activitiesof the national, and state road networks in nearly all federal states. However, there is noconsistent approach for the monitoring and assessment of local and urban road networks.However, we found that an increased number of municipalities choose innovative ways toreduce costs and improve the quality of maintenance activities.
Although in recent years, road fatalities have decreased in Germany, there is no clearevidence that this is related to improved road maintenance or a better state of theinfrastructure in general. The decrease in fatalities in mainly explained by, as in most otherEuropean countries, an increase in vehicle safety and an increased awareness of safetyissues.
12 Bundestagsfraktion Bündnis 90/Die Grünen (2007) Jobmaschine Straßenbau?13 Pro Mobilität (2008) Regionale Effekte durch Straßenbau-Investitionen.

Policy Department B: Structural and Cohesion Policies____________________________________________________________________________________________
138
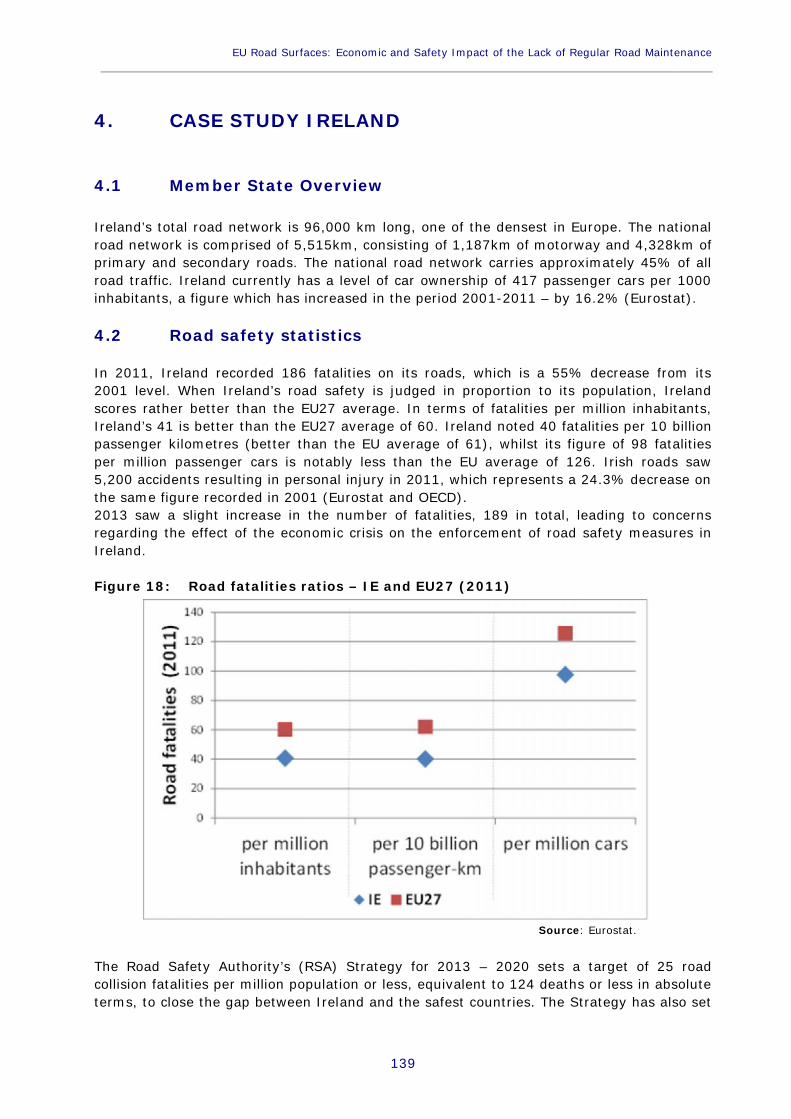
EU Road Surfaces: Economic and Safety Impact of the Lack of Regular Road Maintenance____________________________________________________________________________________________
139
4. CASE STUDY IRELAND
4.1 Member State Overview
Ireland’s total road network is 96,000 km long, one of the densest in Europe. The nationalroad network is comprised of 5,515km, consisting of 1,187km of motorway and 4,328km ofprimary and secondary roads. The national road network carries approximately 45% of allroad traffic. Ireland currently has a level of car ownership of 417 passenger cars per 1000inhabitants, a figure which has increased in the period 2001-2011 – by 16.2% (Eurostat).
4.2 Road safety statistics
In 2011, Ireland recorded 186 fatalities on its roads, which is a 55% decrease from its2001 level. When Ireland’s road safety is judged in proportion to its population, Irelandscores rather better than the EU27 average. In terms of fatalities per million inhabitants,Ireland’s 41 is better than the EU27 average of 60. Ireland noted 40 fatalities per 10 billionpassenger kilometres (better than the EU average of 61), whilst its figure of 98 fatalitiesper million passenger cars is notably less than the EU average of 126. Irish roads saw5,200 accidents resulting in personal injury in 2011, which represents a 24.3% decrease onthe same figure recorded in 2001 (Eurostat and OECD).2013 saw a slight increase in the number of fatalities, 189 in total, leading to concernsregarding the effect of the economic crisis on the enforcement of road safety measures inIreland.
Figure 18: Road fatalities ratios – IE and EU27 (2011)
Source: Eurostat.
The Road Safety Authority’s (RSA) Strategy for 2013 – 2020 sets a target of 25 roadcollision fatalities per million population or less, equivalent to 124 deaths or less in absoluteterms, to close the gap between Ireland and the safest countries. The Strategy has also set
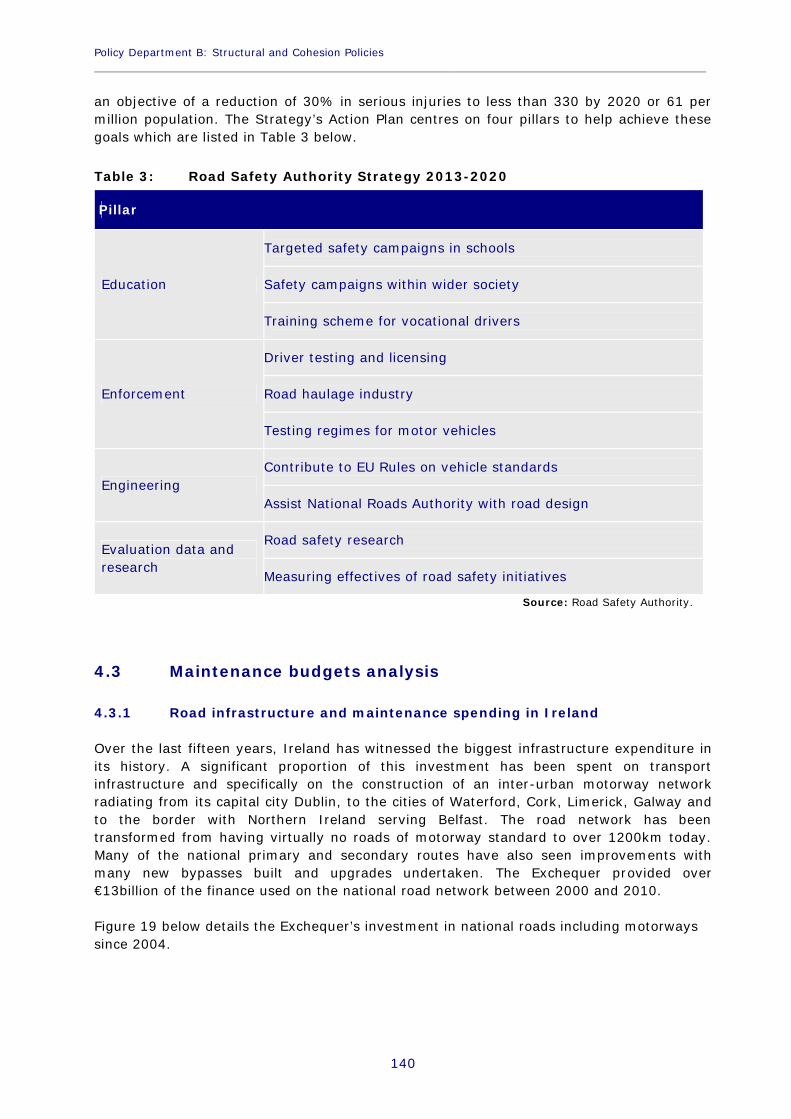
Policy Department B: Structural and Cohesion Policies____________________________________________________________________________________________
140
an objective of a reduction of 30% in serious injuries to less than 330 by 2020 or 61 permillion population. The Strategy’s Action Plan centres on four pillars to help achieve thesegoals which are listed in Table 3 below.
Table 3: Road Safety Authority Strategy 2013-2020
Pillar
Education
Targeted safety campaigns in schools
Safety campaigns within wider society
Training scheme for vocational drivers
Enforcement
Driver testing and licensing
Road haulage industry
Testing regimes for motor vehicles
EngineeringContribute to EU Rules on vehicle standards
Assist National Roads Authority with road design
Evaluation data andresearch
Road safety research
Measuring effectives of road safety initiatives
Source: Road Safety Authority.
4.3 Maintenance budgets analysis
4.3.1 Road infrastructure and maintenance spending in Ireland
Over the last fifteen years, Ireland has witnessed the biggest infrastructure expenditure inits history. A significant proportion of this investment has been spent on transportinfrastructure and specifically on the construction of an inter-urban motorway networkradiating from its capital city Dublin, to the cities of Waterford, Cork, Limerick, Galway andto the border with Northern Ireland serving Belfast. The road network has beentransformed from having virtually no roads of motorway standard to over 1200km today.Many of the national primary and secondary routes have also seen improvements withmany new bypasses built and upgrades undertaken. The Exchequer provided over€13billion of the finance used on the national road network between 2000 and 2010.
Figure 19 below details the Exchequer’s investment in national roads including motorwayssince 2004.
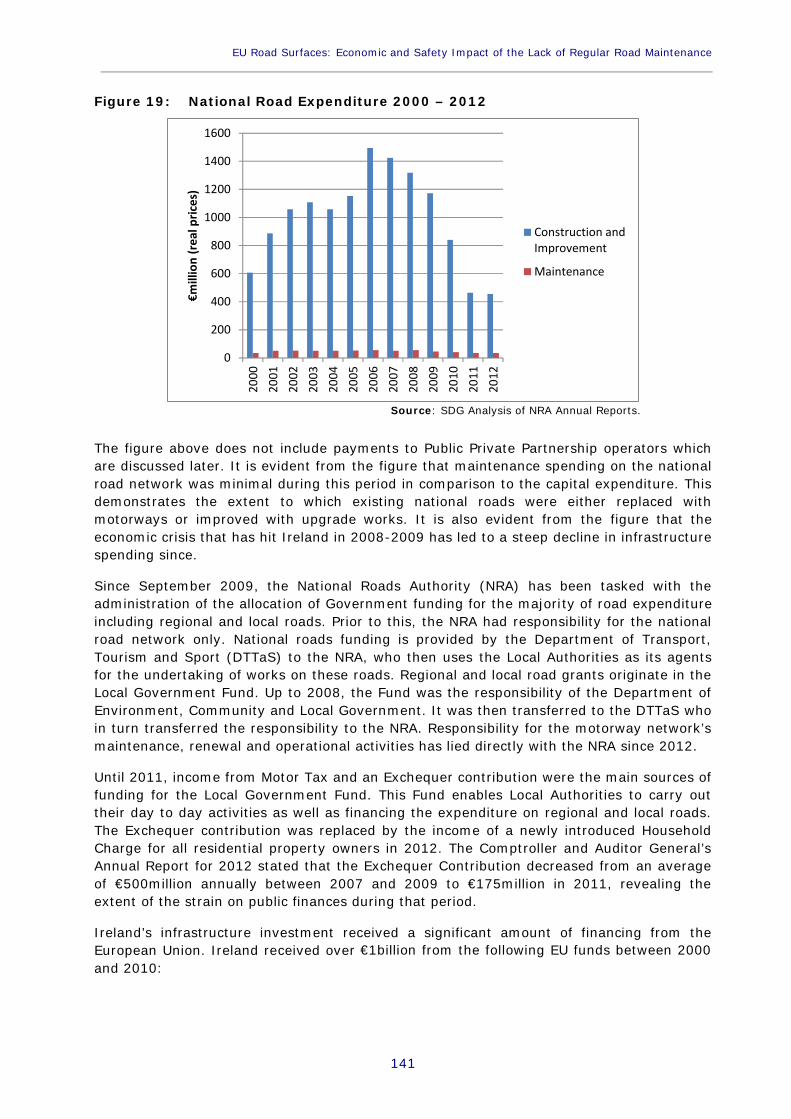
EU Road Surfaces: Economic and Safety Impact of the Lack of Regular Road Maintenance____________________________________________________________________________________________
141
Figure 19: National Road Expenditure 2000 – 2012
0
200
400
600
800
1000
1200
1400
1600
2000
2001
2002
2003
2004
2005
2006
2007
2008
2009
2010
2011
2012
€mill
ion
(rea
l pric
es)
Construction andImprovement
Maintenance
Source: SDG Analysis of NRA Annual Reports.
The figure above does not include payments to Public Private Partnership operators whichare discussed later. It is evident from the figure that maintenance spending on the nationalroad network was minimal during this period in comparison to the capital expenditure. Thisdemonstrates the extent to which existing national roads were either replaced withmotorways or improved with upgrade works. It is also evident from the figure that theeconomic crisis that has hit Ireland in 2008-2009 has led to a steep decline in infrastructurespending since.
Since September 2009, the National Roads Authority (NRA) has been tasked with theadministration of the allocation of Government funding for the majority of road expenditureincluding regional and local roads. Prior to this, the NRA had responsibility for the nationalroad network only. National roads funding is provided by the Department of Transport,Tourism and Sport (DTTaS) to the NRA, who then uses the Local Authorities as its agentsfor the undertaking of works on these roads. Regional and local road grants originate in theLocal Government Fund. Up to 2008, the Fund was the responsibility of the Department ofEnvironment, Community and Local Government. It was then transferred to the DTTaS whoin turn transferred the responsibility to the NRA. Responsibility for the motorway network’smaintenance, renewal and operational activities has lied directly with the NRA since 2012.
Until 2011, income from Motor Tax and an Exchequer contribution were the main sources offunding for the Local Government Fund. This Fund enables Local Authorities to carry outtheir day to day activities as well as financing the expenditure on regional and local roads.The Exchequer contribution was replaced by the income of a newly introduced HouseholdCharge for all residential property owners in 2012. The Comptroller and Auditor General’sAnnual Report for 2012 stated that the Exchequer Contribution decreased from an averageof €500million annually between 2007 and 2009 to €175million in 2011, revealing theextent of the strain on public finances during that period.
Ireland’s infrastructure investment received a significant amount of financing from theEuropean Union. Ireland received over €1billion from the following EU funds between 2000and 2010:
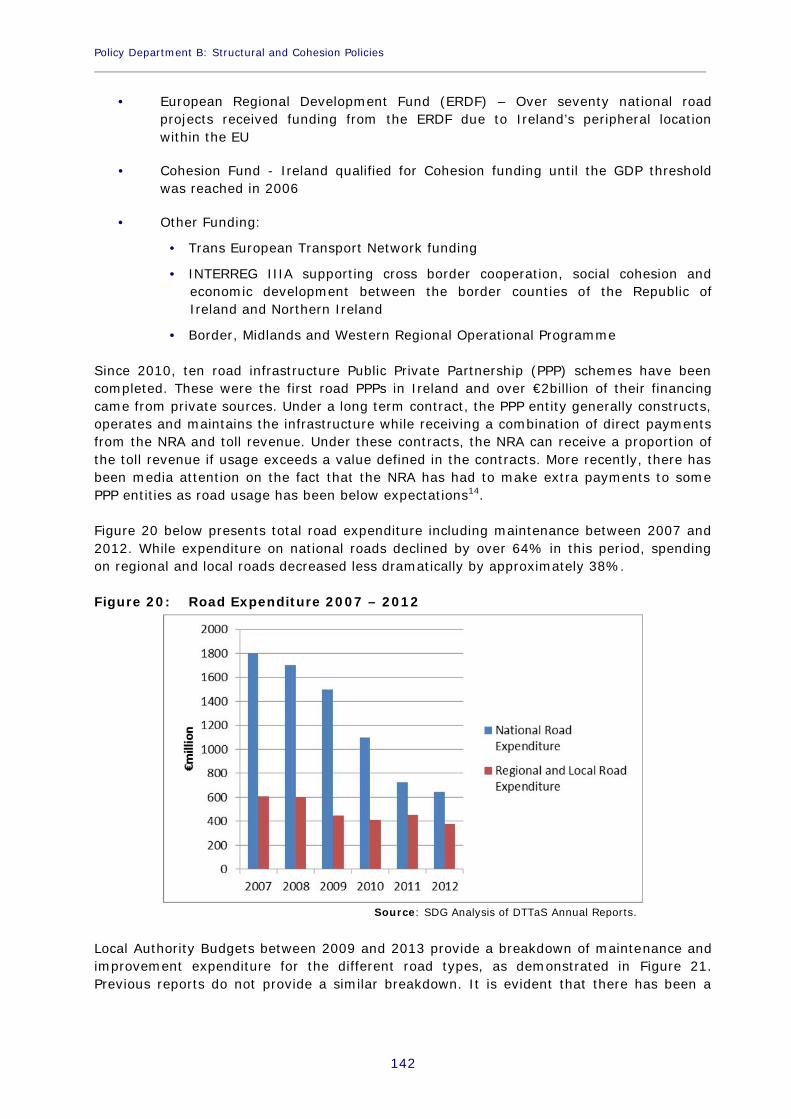
Policy Department B: Structural and Cohesion Policies____________________________________________________________________________________________
142
European Regional Development Fund (ERDF) – Over seventy national roadprojects received funding from the ERDF due to Ireland’s peripheral locationwithin the EU
Cohesion Fund - Ireland qualified for Cohesion funding until the GDP thresholdwas reached in 2006
Other Funding:
Trans European Transport Network funding
INTERREG IIIA supporting cross border cooperation, social cohesion andeconomic development between the border counties of the Republic ofIreland and Northern Ireland
Border, Midlands and Western Regional Operational Programme
Since 2010, ten road infrastructure Public Private Partnership (PPP) schemes have beencompleted. These were the first road PPPs in Ireland and over €2billion of their financingcame from private sources. Under a long term contract, the PPP entity generally constructs,operates and maintains the infrastructure while receiving a combination of direct paymentsfrom the NRA and toll revenue. Under these contracts, the NRA can receive a proportion ofthe toll revenue if usage exceeds a value defined in the contracts. More recently, there hasbeen media attention on the fact that the NRA has had to make extra payments to somePPP entities as road usage has been below expectations14.
Figure 20 below presents total road expenditure including maintenance between 2007 and2012. While expenditure on national roads declined by over 64% in this period, spendingon regional and local roads decreased less dramatically by approximately 38%.
Figure 20: Road Expenditure 2007 – 2012
Source: SDG Analysis of DTTaS Annual Reports.
Local Authority Budgets between 2009 and 2013 provide a breakdown of maintenance andimprovement expenditure for the different road types, as demonstrated in Figure 21.Previous reports do not provide a similar breakdown. It is evident that there has been a
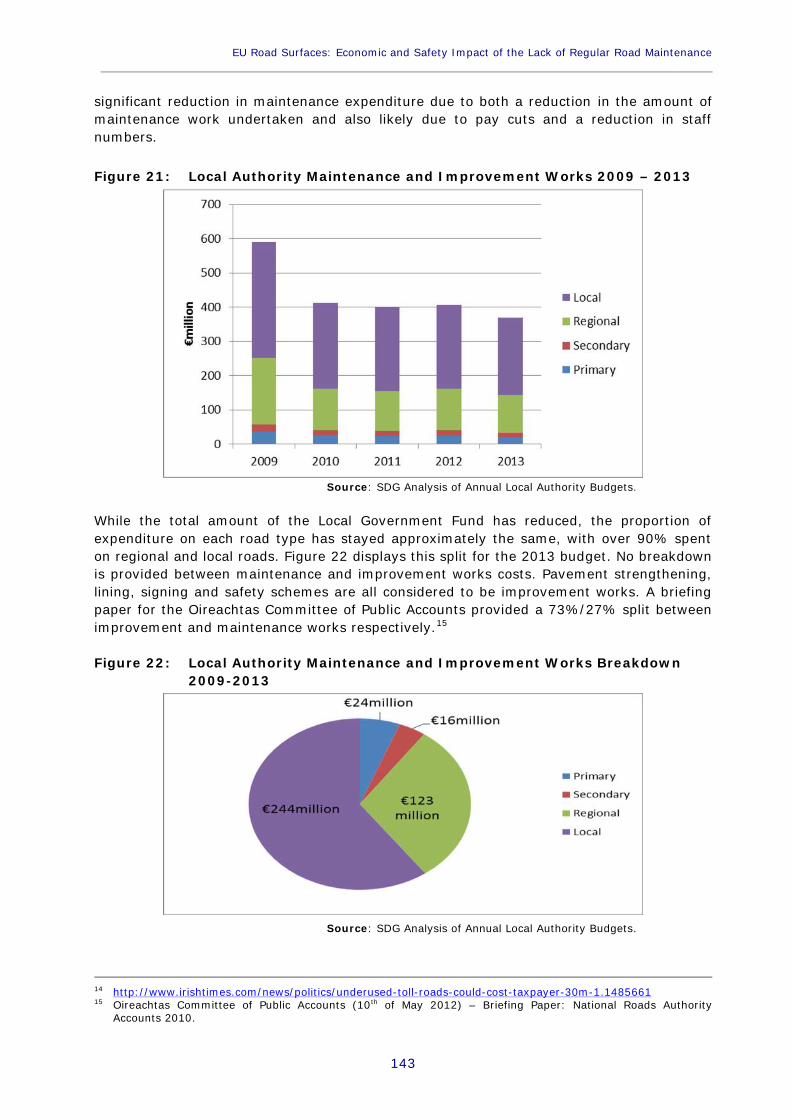
EU Road Surfaces: Economic and Safety Impact of the Lack of Regular Road Maintenance____________________________________________________________________________________________
143
significant reduction in maintenance expenditure due to both a reduction in the amount ofmaintenance work undertaken and also likely due to pay cuts and a reduction in staffnumbers.
Figure 21: Local Authority Maintenance and Improvement Works 2009 – 2013
Source: SDG Analysis of Annual Local Authority Budgets.
While the total amount of the Local Government Fund has reduced, the proportion ofexpenditure on each road type has stayed approximately the same, with over 90% spenton regional and local roads. Figure 22 displays this split for the 2013 budget. No breakdownis provided between maintenance and improvement works costs. Pavement strengthening,lining, signing and safety schemes are all considered to be improvement works. A briefingpaper for the Oireachtas Committee of Public Accounts provided a 73%/27% split betweenimprovement and maintenance works respectively.15
Figure 22: Local Authority Maintenance and Improvement Works Breakdown2009-2013
Source: SDG Analysis of Annual Local Authority Budgets.
14 http://www.irishtimes.com/news/politics/underused-toll-roads-could-cost-taxpayer-30m-1.148566115 Oireachtas Committee of Public Accounts (10th of May 2012) – Briefing Paper: National Roads Authority
Accounts 2010.

Policy Department B: Structural and Cohesion Policies____________________________________________________________________________________________
144
4.3.2 Road maintenance budget outlook
Although the inter-urban motorway network has been completed, the financial crisis inIreland has put many other road infrastructure projects on hold. Substantial cuts have beenmade to the public service workforce with the NRA losing over 40% of its staff in recentyears. Despite Ireland’s recent extremely difficult economic circumstances, the IrishGovernment has committed to continue to invest in road maintenance and in particularmaintaining the national road network which it views as a legacy of the economic boomperiod.
The Infrastructure and Capital Investment 2012-2016 Capital Spending Programme stated‘amongst the main priorities over the medium term will be ensuring adequate maintenanceof the national road network in order to protect the value of previous investments andtarget the improvement of specific road segments where there is a clear economicjustification’.
The road expenditure outlook as agreed in 2011 is detailed in Table 4. The figures doinclude some close-out payments relating to the completion of the motorway network, mostnotably in 2012 and 2013. The Government has allocated the majority of funding to roadmaintenance projects however, with over 85% of funding for regional and local roads to bespent on maintenance and rehabilitation work.
Table 4: Roads Exchequer Investment 2012-2016
€million 2012 2013 2014 2015 2016 Total
National 605 278 288 253 252 1,676
Regional & Local 285 250 240 240 240 1,255
Total 890 528 528 493 492 2,931
Source: Infrastructure and Capital Investment 2012-16: Medium Term Exchequer Framework.
The NRA has estimated the replacement cost of the network to be in the region of €30billion. With a twenty to thirty year life-cycle cost, the network’s maintenance costaverages at €1 - €1.5 billion per year and would deteriorate to the extent of €1 - €1.5billion per year with no maintenance budget.16 In light of this, the NRA set out threepriorities for road infrastructure investment in 2011:
Asset Management, Network Rehabilitation and Network Operations
National Secondary Roads Improvements, Bottleneck Improvement Projects,Safety Projects and Traffic Management Projects
Major Improvement Projects
16 Oireachtas Committee of Public Accounts (7th of February 2013) – Statement by Mr. Fred Barry, CEO NationalRoads Authority.

EU Road Surfaces: Economic and Safety Impact of the Lack of Regular Road Maintenance____________________________________________________________________________________________
145
The NRA reported in mid-2013 that it would not be able to make essential repairs on mainroads due to further budget cuts but stated that it saw no safety implications for 2013.17
4.4 Road performance monitoring
4.4.1 Responsibilities for road maintenance
As explained, the National Roads Authority (NRA) under the Roads Act (1993 to 2007)channels expenditure through Local Authorities for all road maintenance except for that onmotorways and dual carriageways. The NRA has taken direct responsibility for renewal andoperational activities on the motorway/dual carriageway network. While the LocalAuthorities carry out the maintenance work on the national road network, the NRA hasoverall responsibility for management of the network including operation, maintenance,renewal and improvement. The national network ranges from primary roads that conformwith the latest design standards to coastal national secondary routes which are legacy low-volume routes. Since its establishment in 1993, the NRA has evolved from an entityresponsible for the development of a new road network to one of management,maintenance and operation.
Regarding regional and local roads, the NRA carries out certain management andadministration obligations along with the allocation of the Local Government Fund. Theseinclude:
Monitoring the progress of the Local Authority Work Programmes and undertakingroutine scheme inspections
Providing technical assistance.
Figure 23 below outlines the responsibilities in respect of each road type.
Figure 23: Responsibility over road maintenance by road type
Source: SDG illustration.
17 http://www.irishtimes.com/news/politics/oireachtas/nra-unable-to-make-road-surface-repairs-due-to-cuts-1.1466282
Policy Department B: Structural and Cohesion Policies____________________________________________________________________________________________
146
Finally, with respect to the new arrangement for the maintenance of motorways, the NRAhas divided the motorway network into three regions including PPP sections. Themaintenance for each region has been let out on a multi-annual contract.
4.4.2 Assessment of road surface quality
The NRA has carried out annual surveys of the entire national road network, since 2010.Historical data dates back to the 1990s. The most recent survey of regional roads wascarried out in 2011, when over 13,000km were surveyed. This data enables the NRA andLocal Authorities to prioritise maintenance for their work programmes. Regional roadsurveys were also carried out in 1996 and 2004. Local roads have not been surveyed as itis not considered to be cost effective. The pavement condition surveys record the followingparameters:
Skid resistance (SCRIM)
Texture (Macro (MPD) and Micro (SC))
Ride quality (IRI)
Rutting (Rut Depth)
Geometrics
Visual Condition Rating (Regional survey only)
These parameters were reported for every 100 metre sample unit on the entire regionalroad network. Two types of vehicles are used; a SCRIM machine and a Road SurfaceProfiler (RSP). The ride quality index (IRI) decreased from 5.5mm/m to 4.2mm/m betweenthe 2004 and 2011 surveys.
Local Authorities also carry out inspections by driving the routes. The NRA has recentlydeveloped an app that allows Local Authorities to upload this data to a central system.There is no statutory obligation on the NRA or Local Authorities to salt roads in winter.Salting is carried out when the NRA and Local Authorities deem it necessary in order toreduce hazards. The most heavily trafficked roads and the national road network are givenpriority in these circumstances.
4.4.3 Maintenance intervention
Table 5 shows the parameter matching to intervention type. The results are entered into amapping programme providing the Local Authorities with the necessary data to prioritisemaintenance works.
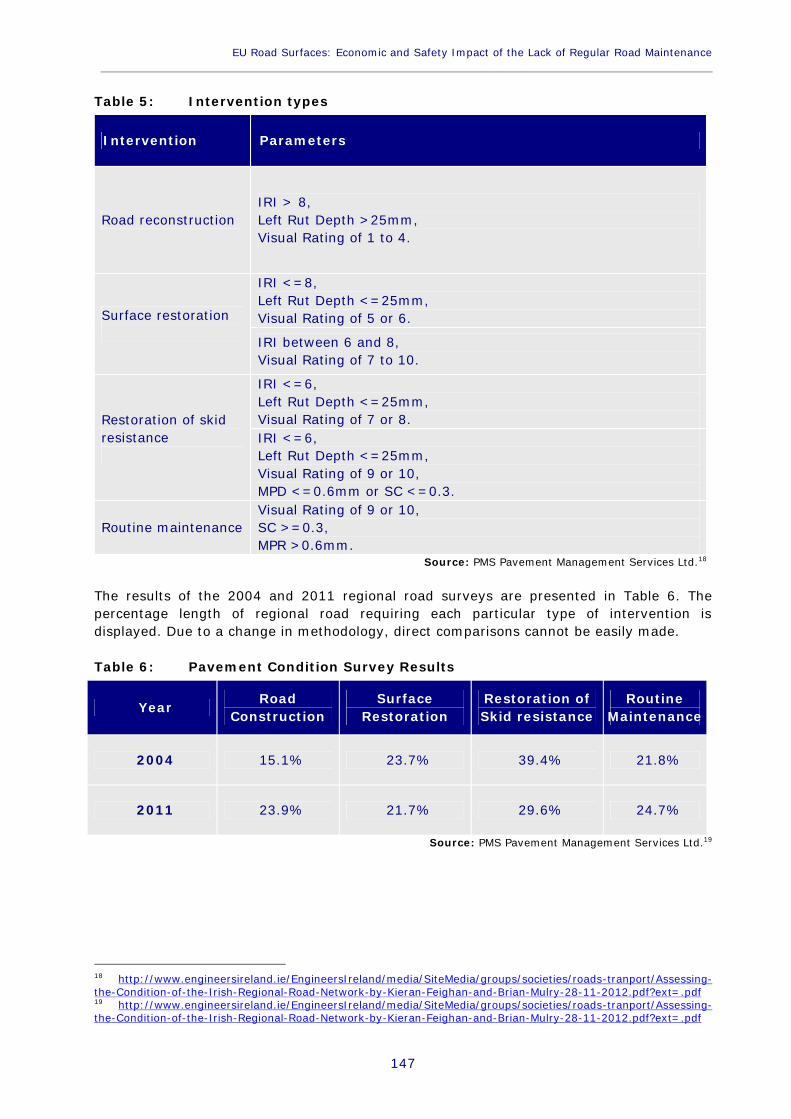
EU Road Surfaces: Economic and Safety Impact of the Lack of Regular Road Maintenance____________________________________________________________________________________________
147
Table 5: Intervention types
Intervention Parameters
Road reconstructionIRI > 8,Left Rut Depth >25mm,Visual Rating of 1 to 4.
Surface restoration
IRI <=8,Left Rut Depth <=25mm,Visual Rating of 5 or 6.
IRI between 6 and 8,Visual Rating of 7 to 10.
Restoration of skidresistance
IRI <=6,Left Rut Depth <=25mm,Visual Rating of 7 or 8.IRI <=6,Left Rut Depth <=25mm,Visual Rating of 9 or 10,MPD <=0.6mm or SC <=0.3.
Routine maintenanceVisual Rating of 9 or 10,SC >=0.3,MPR >0.6mm.
Source: PMS Pavement Management Services Ltd.18
The results of the 2004 and 2011 regional road surveys are presented in Table 6. Thepercentage length of regional road requiring each particular type of intervention isdisplayed. Due to a change in methodology, direct comparisons cannot be easily made.
Table 6: Pavement Condition Survey Results
Year RoadConstruction
SurfaceRestoration
Restoration ofSkid resistance
RoutineMaintenance
2004 15.1% 23.7% 39.4% 21.8%
2011 23.9% 21.7% 29.6% 24.7%
Source: PMS Pavement Management Services Ltd.19
18 http://www.engineersireland.ie/EngineersIreland/media/SiteMedia/groups/societies/roads-tranport/Assessing-the-Condition-of-the-Irish-Regional-Road-Network-by-Kieran-Feighan-and-Brian-Mulry-28-11-2012.pdf?ext=.pdf19 http://www.engineersireland.ie/EngineersIreland/media/SiteMedia/groups/societies/roads-tranport/Assessing-the-Condition-of-the-Irish-Regional-Road-Network-by-Kieran-Feighan-and-Brian-Mulry-28-11-2012.pdf?ext=.pdf
Policy Department B: Structural and Cohesion Policies____________________________________________________________________________________________
148
4.5 Socio-economic impacts of road maintenance
The Road Safety Authority’s (RSA) annual report for 2012 mentions the need for money tobe diverted to particular elements of road safety requiring attention, specifically roadspolicing and local road maintenance, despite the current economic climate. No specificindicators are provided. The RSA’s strategy for 2013 to 2020 lists a number of actions to betaken in order to maintain the record low levels of road fatalities. This includes arequirement for Local Authorities to publish their prioritised plan on road buildingconstruction and maintenance annually.
In response to the “National Budget 2014” announcement, the Freight TransportAssociation Ireland stated that the continued cuts in road maintenance budgets would leadto ‘a progressive deterioration in the condition of the road network, higher maintenancecosts for commercial and private road users and will ultimately lead to higher costs toremedy road damage.
The NRA has highlighted that maintenance works are most effective when carried out on acontinuous basis. With an annual cost of €1 - €1.5 billion as stated above, the currentforecasted expenditure will lead to a shortfall of €500 million - €1 billion in roadinvestment. The budget for capital maintenance has been halved since its peak in the late2000s and there are concerns that the lack of investment in maintenance could reverse thebenefits brought by the expenditure on roads over the last fifteen years.
4.6 Summary for Ireland
Since the establishment of the NRA in 1993, the focus of road infrastructure investment inIreland has been on the development of the motorway network and on the improvement ofthe national road network. The network has been transformed with the help of privateinvestment and EU funding. Journey times between Dublin and the other principal citieshave been greatly reduced. Road safety has significantly improved, partly due to theimproved road infrastructure.
It is only in recent years with harsher than usual winters and severe budget cuts that theimportance of road maintenance has been brought to the public’s attention. It is clear thatover the coming years, the NRA will struggle to maintain the motorway and national roadnetwork to their current standards. Local Authorities will also have to carefully managetheir maintenance budgets. The availability of greater and improved data should aid therelevant authority in making maintenance investment decisions.
EU Road Surfaces: Economic and Safety Impact of the Lack of Regular Road Maintenance____________________________________________________________________________________________
149
5. CASE STUDY ITALY
5.1 Introduction
The total road network of Italy is 248,700 km long, of which 6,700 km are motorways and69,000 km of Italy’s roads are classed as municipal. Italy’s current level of car ownership isapproximately 610 passenger cars per 1000 inhabitants, a figure which has increased in theperiod 2001-2011, a percentage change of 4.6% (Eurostat).
5.2 Road Safety statistics
In 2011, Italy recorded 3,860 fatalities on its roads, which represented a 46% decreasefrom 2001. In terms of fatalities per million inhabitants, Italy’s 64 is slightly worse than theEU27 average of 60. When referring to other indices, Italy remains around the EU27average with 55 fatalities per 10 billion passenger kilometres (better than the EU averageof 61), whilst its figure of 105 fatalities per million passenger cars is notably less than theEU average of 126. Overall there were 205,600 accidents resulting in personal injury onItalian roads in 2011, which was a 21.8% decrease on the same figure recorded in 2001(Eurostat and OECD).
5.3 Maintenance budgets analysis
5.3.1. Road infrastructure and maintenance spending in Italy
Statistics on road spending in Italy are included in the Conto Nazionale delle Infrastrutturee dei Trasporti (CNIT). This document represents the official document prepared by theMinistero delle Infrastrutture e dei Trasporti to present an annual review, based on nationalstatistics and analysis for national infrastructures and transportation. In particular, itevaluates economic expenditure for both public and private sectors regarding road,aviation, rail and other service infrastructure. This document does not however providedetailed information on road maintenance expenditure, but general trends can be observedby looking at the overall spending levels.
Overall, the Italian network length was 179,024 km in 2011: this includes motorways(6,668 km – 4%), national roads plus other roads of national importance (20,773 km –12%), roads under Regional and Provincial administration (151,583 km – 85%). This figuredoes not include local roads.
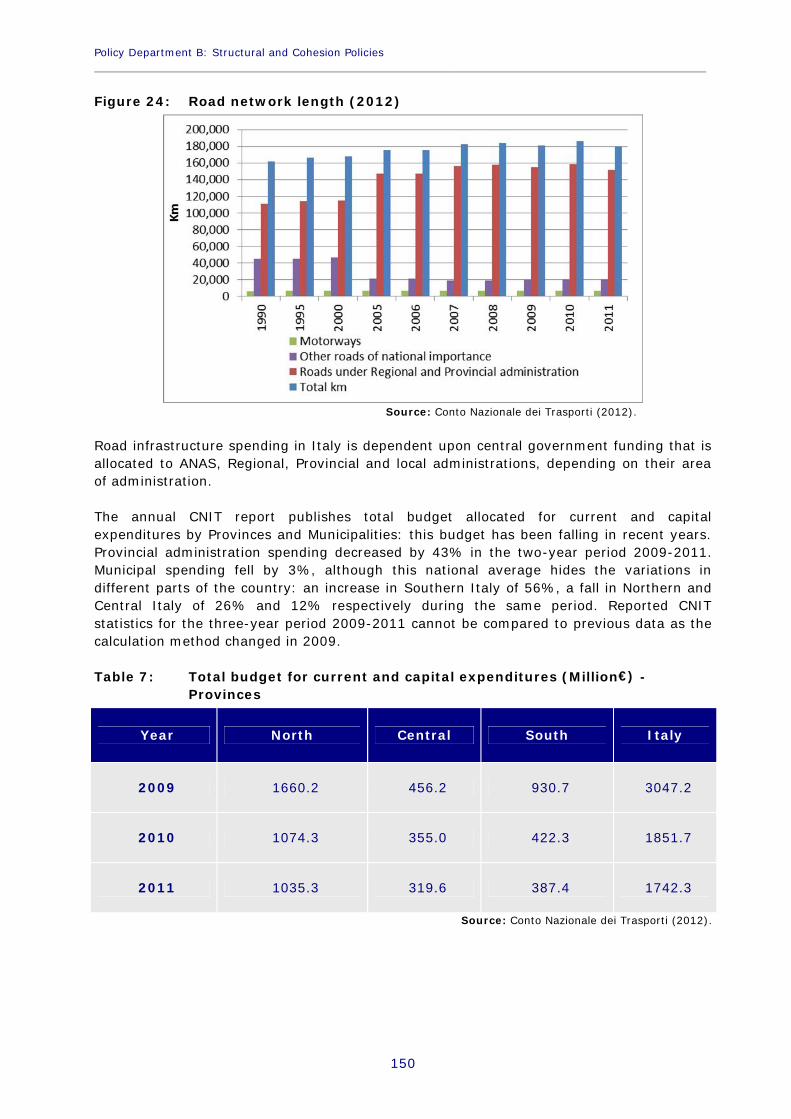
Policy Department B: Structural and Cohesion Policies____________________________________________________________________________________________
150
Figure 24: Road network length (2012)
Source: Conto Nazionale dei Trasporti (2012).
Road infrastructure spending in Italy is dependent upon central government funding that isallocated to ANAS, Regional, Provincial and local administrations, depending on their areaof administration.
The annual CNIT report publishes total budget allocated for current and capitalexpenditures by Provinces and Municipalities: this budget has been falling in recent years.Provincial administration spending decreased by 43% in the two-year period 2009-2011.Municipal spending fell by 3%, although this national average hides the variations indifferent parts of the country: an increase in Southern Italy of 56%, a fall in Northern andCentral Italy of 26% and 12% respectively during the same period. Reported CNITstatistics for the three-year period 2009-2011 cannot be compared to previous data as thecalculation method changed in 2009.
Table 7: Total budget for current and capital expenditures (Million€) -Provinces
Year North Central South Italy
2009 1660.2 456.2 930.7 3047.2
2010 1074.3 355.0 422.3 1851.7
2011 1035.3 319.6 387.4 1742.3
Source: Conto Nazionale dei Trasporti (2012).
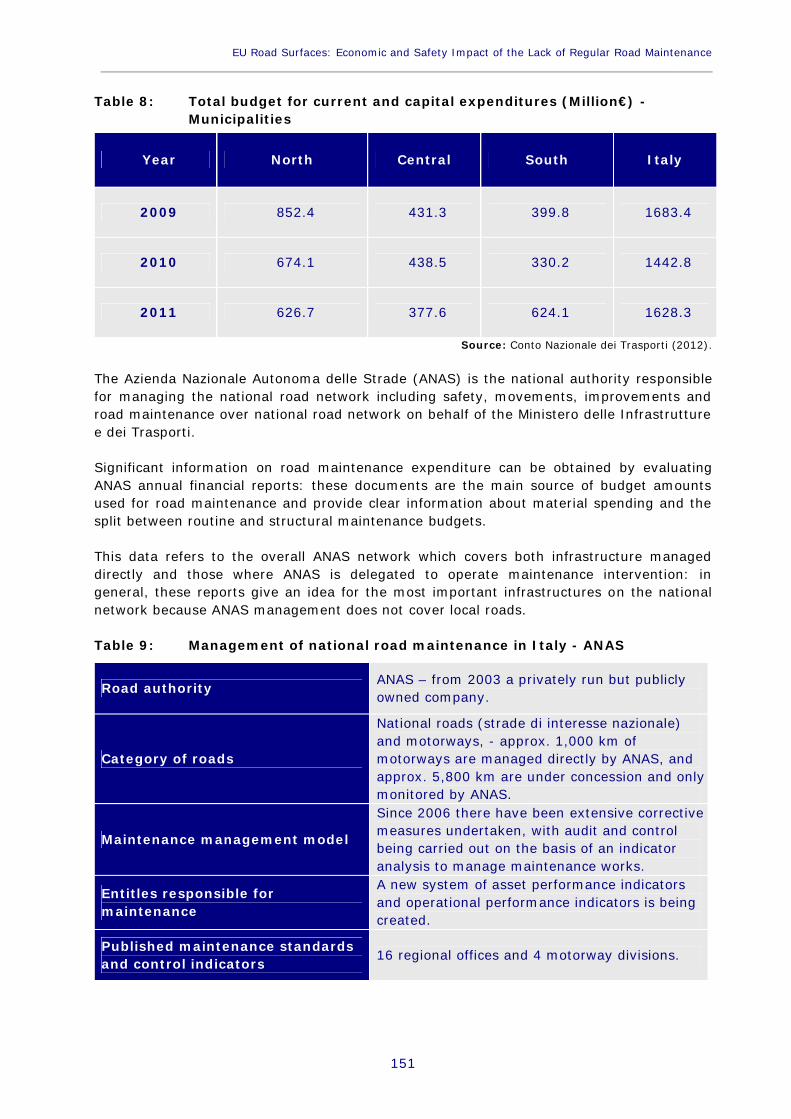
EU Road Surfaces: Economic and Safety Impact of the Lack of Regular Road Maintenance____________________________________________________________________________________________
151
Table 8: Total budget for current and capital expenditures (Million€) -Municipalities
Year North Central South Italy
2009 852.4 431.3 399.8 1683.4
2010 674.1 438.5 330.2 1442.8
2011 626.7 377.6 624.1 1628.3
Source: Conto Nazionale dei Trasporti (2012).
The Azienda Nazionale Autonoma delle Strade (ANAS) is the national authority responsiblefor managing the national road network including safety, movements, improvements androad maintenance over national road network on behalf of the Ministero delle Infrastrutturee dei Trasporti.
Significant information on road maintenance expenditure can be obtained by evaluatingANAS annual financial reports: these documents are the main source of budget amountsused for road maintenance and provide clear information about material spending and thesplit between routine and structural maintenance budgets.
This data refers to the overall ANAS network which covers both infrastructure manageddirectly and those where ANAS is delegated to operate maintenance intervention: ingeneral, these reports give an idea for the most important infrastructures on the nationalnetwork because ANAS management does not cover local roads.
Table 9: Management of national road maintenance in Italy - ANAS
Road authority ANAS – from 2003 a privately run but publiclyowned company.
Category of roads
National roads (strade di interesse nazionale)and motorways, - approx. 1,000 km ofmotorways are managed directly by ANAS, andapprox. 5,800 km are under concession and onlymonitored by ANAS.
Maintenance management model
Since 2006 there have been extensive correctivemeasures undertaken, with audit and controlbeing carried out on the basis of an indicatoranalysis to manage maintenance works.
Entitles responsible formaintenance
A new system of asset performance indicatorsand operational performance indicators is beingcreated.
Published maintenance standardsand control indicators 16 regional offices and 4 motorway divisions.

Policy Department B: Structural and Cohesion Policies____________________________________________________________________________________________
152
Reporting
There is a published Charter of Servicing Roadsand Motorways (Carta dei Servizi Stradali edAutostradali) where minimum standards aredefined together with the level of service whichmay be expected by road users. Levels of servicein many cases are not very high. However, thereis no information in relation to the extent towhich these indicators are being complied with.
Quality of maintenance Comprehensive annual reports.
Source: ERNST&YOUNG (2012).
ANAS is a privately run but publicly owned company set up ten years ago which generatesits own revenues, as well as receiving public subsidies. Its budget has been fluctuating inrecent years and often there are not enough funds available to maintain the road networkin an appropriate manner. In order to counter the budget reductions in the road sector,there are plans to introduce tolls on some roads that are not currently within a concessioncontract.
Justifying maintenance spending is made more difficult by the fact that there is littleinformation available on maintenance as a whole, especially in the area of routinemaintenance. The situation should improve following the implementation of a managementsupport tool (SAP).
Some observations can be made by comparing total network length under the ANASconcession to total expenditure by the company. The size of the network managed by ANAShas remained fairly stable in recent years, increasing by only 1% (about 250km) between2008 and 2012.
Figure 25: Total km under ANAS concession (Index 100 = 2008)
Source: ANAS Financial Reports.
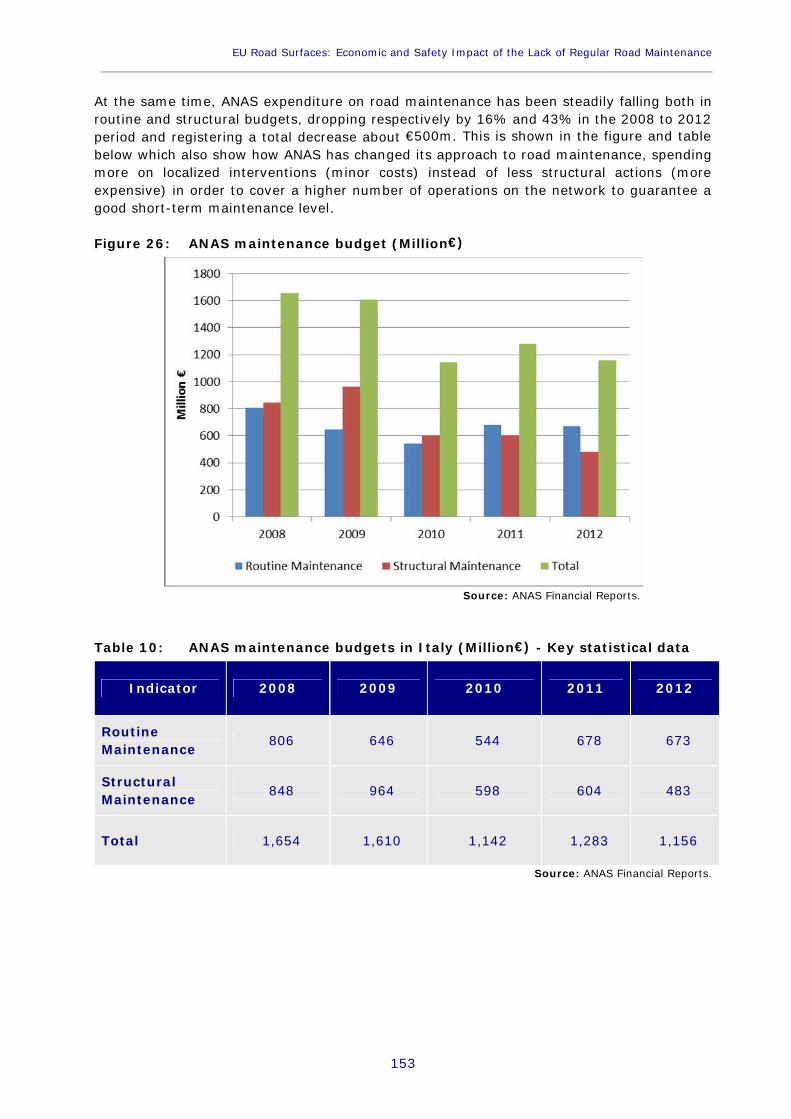
EU Road Surfaces: Economic and Safety Impact of the Lack of Regular Road Maintenance____________________________________________________________________________________________
153
At the same time, ANAS expenditure on road maintenance has been steadily falling both inroutine and structural budgets, dropping respectively by 16% and 43% in the 2008 to 2012period and registering a total decrease about €500m. This is shown in the figure and tablebelow which also show how ANAS has changed its approach to road maintenance, spendingmore on localized interventions (minor costs) instead of less structural actions (moreexpensive) in order to cover a higher number of operations on the network to guarantee agood short-term maintenance level.
Figure 26: ANAS maintenance budget (Million€)
Source: ANAS Financial Reports.
Table 10: ANAS maintenance budgets in Italy (Million€) - Key statistical data
Indicator 2008 2009 2010 2011 2012
RoutineMaintenance 806 646 544 678 673
StructuralMaintenance 848 964 598 604 483
Total 1,654 1,610 1,142 1,283 1,156
Source: ANAS Financial Reports.

Policy Department B: Structural and Cohesion Policies____________________________________________________________________________________________
154
5.4 Road performance monitoring
5.4.1 Responsibilities
The responsibilities in the Italian road network are currently defined in the DecretoLegislativo 285/92 (Codice della strada - CdS, and its update in the Decreto Legge 21 June2013, n. 69) and splits the overall national network into:
Motorways;
Extra-urban roads (which includes national; Regional; Provincial and Local Roads)
Urban roads;
The responsibility for some of these roads has been devolved to the Regional, Provincial orMunicipal authorities. Art. 2, comma 5 of the CdS establishes the public or private entitiesresponsible for road maintenance:
Motorways: the private concessionaire covers the cost of maintenance through tollrevenues;
National roads: the maintenance is carried out by ANAS;
Regional roads: Regional administrations are the owners but they entrust themanagement and the maintenance to ANAS, Provinces or municipalities;
Provincial roads: The Provinces manage the maintenance;
Local roads: The Municipalities manage the maintenance.
Figure 27: Responsibilities in planning and maintenance of a road by category
Source: SDGelaboration.

EU Road Surfaces: Economic and Safety Impact of the Lack of Regular Road Maintenance____________________________________________________________________________________________
155
5.4.2 Assessment of road surface quality
At the national level, the Ministry of Public Works made it compulsory for road managementbodies to draw up “Catasto Stradale”, a geographical information system to track the stateof infrastructure. This registry aims to monitor the following:
Integrated and updated knowledge of assets;
Real time traffic monitoring;
Road maintenance optimisation;
Road safety level
The database must contain:
Road geometry and intersections;
Pavement: parameters, surveys and controls;
Markings and signs;
Traffic, accidents and pollution data;
Maintenance and interventions schedule.
In 2008, ANAS published the document ”Capitolato ANAS – Linee guida di progetto e normetecniche prestazionali (2008)” setting out the data relating to the road surface qualityindicators and best practice to plan and carry out correct maintenance works on a roadsection. As this is not a law it is not compulsory but it contains useful guidelines for usingtraditional and innovative materials. Road maintenance interventions must address:
Roughness (“Aderenza”): the capability to provide a good relationship between roadand tyre;
Macro- texture (“Macro-tessitura”): to evaluate the roughness surface level;
Surface regularity (“Regolarità”): fundamental to provide safety conditions forusers;
Load (“Portanza”): the capability to sustain a road traffic level.
The main indicators used to measure road quality are set out in the table below. Theseindicators are derived from a series of assumptions and empirical formulas based on anumber of input data20.
Table 11: Road maintenance indicators – Capitolato ANAS (2008)Maintenance Referring to Indicator Name
Surface layer maintenance
RoughnessCAT Coefficiente di Aderenza
TrasversaleBPN Skid Tester
Surface texture HS Altezza in sabbia
Surface regularity IRI International RoughnessIndex
Deep layer renewal Load bearing capacityFWD Falling weight
deflectometer
D Benkelmann beammethod
Source: SDG elaboration.
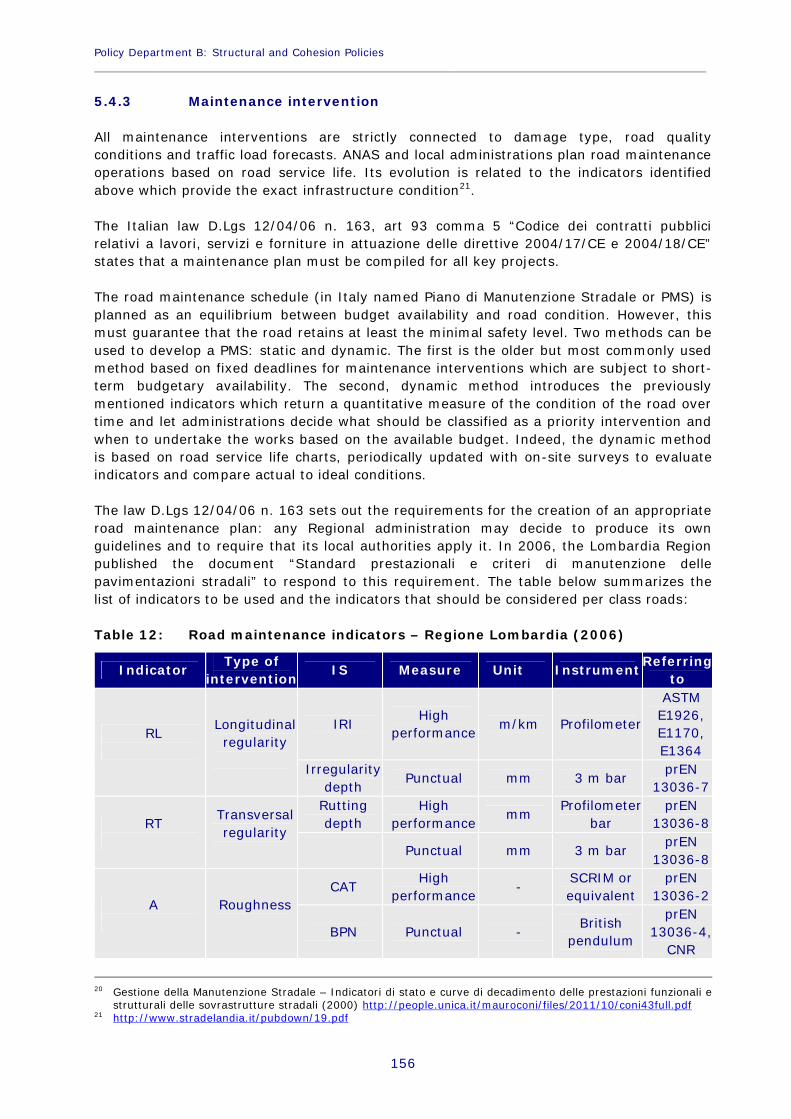
Policy Department B: Structural and Cohesion Policies____________________________________________________________________________________________
156
5.4.3 Maintenance intervention
All maintenance interventions are strictly connected to damage type, road qualityconditions and traffic load forecasts. ANAS and local administrations plan road maintenanceoperations based on road service life. Its evolution is related to the indicators identifiedabove which provide the exact infrastructure condition21.
The Italian law D.Lgs 12/04/06 n. 163, art 93 comma 5 “Codice dei contratti pubblicirelativi a lavori, servizi e forniture in attuazione delle direttive 2004/17/CE e 2004/18/CE”states that a maintenance plan must be compiled for all key projects.
The road maintenance schedule (in Italy named Piano di Manutenzione Stradale or PMS) isplanned as an equilibrium between budget availability and road condition. However, thismust guarantee that the road retains at least the minimal safety level. Two methods can beused to develop a PMS: static and dynamic. The first is the older but most commonly usedmethod based on fixed deadlines for maintenance interventions which are subject to short-term budgetary availability. The second, dynamic method introduces the previouslymentioned indicators which return a quantitative measure of the condition of the road overtime and let administrations decide what should be classified as a priority intervention andwhen to undertake the works based on the available budget. Indeed, the dynamic methodis based on road service life charts, periodically updated with on-site surveys to evaluateindicators and compare actual to ideal conditions.
The law D.Lgs 12/04/06 n. 163 sets out the requirements for the creation of an appropriateroad maintenance plan: any Regional administration may decide to produce its ownguidelines and to require that its local authorities apply it. In 2006, the Lombardia Regionpublished the document “Standard prestazionali e criteri di manutenzione dellepavimentazioni stradali” to respond to this requirement. The table below summarizes thelist of indicators to be used and the indicators that should be considered per class roads:
Table 12: Road maintenance indicators – Regione Lombardia (2006)
Indicator Type ofintervention IS Measure U Unit Instrument Referring
to
RL Longitudinalregularity
IRI Highperformance m/km Profilometer
ASTME1926,E1170,E1364
Irregularitydepth Punctual mm 3 m bar prEN
13036-7
RT Transversalregularity
Ruttingdepth
Highperformance mm Profilometer
barprEN
13036-8
Punctual mm 3 m bar prEN13036-8
A RoughnessCAT High
performance - SCRIM orequivalent
prEN13036-2
BPN Punctual - Britishpendulum
prEN13036-4,
CNR
20 Gestione della Manutenzione Stradale – Indicatori di stato e curve di decadimento delle prestazioni funzionali estrutturali delle sovrastrutture stradali (2000) http://people.unica.it/mauroconi/files/2011/10/coni43full.pdf
21 http://www.stradelandia.it/pubdown/19.pdf

EU Road Surfaces: Economic and Safety Impact of the Lack of Regular Road Maintenance____________________________________________________________________________________________
157
Indicator Type ofintervention IS Measure U Unit Instrument Referring
to105/85
M Macro-texture
ETD Highperformance mm
Texturemeter or
equivalent
prEN13036-1
HS Punctual mmSand
equivalenttest
prEN13036-1
PLoad
bearingcapacity
Deflection Highperformance mm/100 FWD or
equivalent
ASTMD4694,D4695
Deflection Punctual mm/100 Benkelmannbeam
CNR141/92
DS Surfacedamages
Administra-tion's owndiscretion
Highperformance
Dependson
damagetype
Video-inspection
Punctual
Dependson
damagetype
Source: Standard prestazionali e criteri di manutenzione delle pavimentazioni stradali - Regione Lombardia.
Table 13: Indicators per road classification – Regione Lombardia (2006)
Indicator Type of road
R1 R2 P1 Extraurban P1 Urban P2 Extraurban P2 Urban L+notclassified
RL Yes Yes Yes Yes Yes Yes Suggested
RT Yes Yes Yes Yes Yes Yes Suggested
A Yes Yes Yes Yes Yes Yes Yes
M Yes Yes Suggested Suggested Suggested Suggested Suggested
P Yes Yes Yes Suggested Suggested Suggested Suggested
DS Yes Yes Yes Yes Yes Yes Yes
Source: Standard prestazionali e criteri di manutenzione delle pavimentazioni stradali - Regione Lombardia.
Policy Department B: Structural and Cohesion Policies____________________________________________________________________________________________
158
In addition, the ANAS Capitolato suggests general best practices for road surfacemaintenance and renewals, depending on the degree of damage and forecasted traffic formaintenance period. Indication is given for two kind of works: surface maintenance forsurface layers and extensive renewals for a road reconstruction. ANAS road maintenancesuggestions depend on degree of damage:
Surface layer maintenance (RS1): small cracks > 45% road section length;
Surface layer renewal (RS2): scattered cracks > 45% road section length;
Deep layer renewal (RP1, RP2, RP3): strong and deep damages > 45% roadsection length.
The document provides extensive information on how to use innovative materials toimprove the effectiveness of maintenance activities.
5.5 Socio-economic impacts of road maintenance
Italian legislation delegates road maintenance responsibilities to the owner of the road asmentioned above. These owners are also liable in the event of an accident that is due tothe poor quality of the road network and in particular have to pay compensation foraccidents caused by unsafe roads even in the presence of warning signs22.
To detail road maintenance budget spending in Italy, general bitumen consumption couldbe an indication of its measure. SITEB (Associazione Italiana Bitume Asfalto Strade) is anational association bringing together almost 300 companies and Public Administrationswho are currently working for infrastructure planning, construction, control andmaintenance. Recent data shows that in the past six years the total amount of bitumenconsumed has almost halved (-45%), declining from 2.91 to 1.60 million tonnes. In 2012consumption recorded another 23% fall compared to 2011, both as a result of theeconomic downturn and the cost increase of the raw materials which increased from anaverage unitary price of €275/ton in 2006 to €520/ton in 2012.
22 http://www.euroconsumatori.eu/leggi_articoli_regione.php?id=151http://www.statoquotidiano.it/06/05/2013/la-responsabilita-della-p-a-per-cattiva-manutenzione-pubbliche-strade-xvi/139488/

EU Road Surfaces: Economic and Safety Impact of the Lack of Regular Road Maintenance____________________________________________________________________________________________
159
Figure 28: Comparison between bitumen consumption and production - Milliontonnes
ANAS data on hot-mixed asphalt consumption registered a 40% drop between 2010 and2011 as shown below.
Figure 29: Asphalt consumption – ANAS
Source: ANAS – Bilancio sostenibile (2011).
ANAS regularly publishes a Charter of Servicing Roads and Motorways (Carta dei ServiziStradali ed Autostradali) where minimum standards are defined together with the level ofservice which may be expected by road users. In many cases there is no information onwhether the targets have been met. Targets range from the minimum number ofinspections on the road network (two inspections per year on national roads), to specificinfrastructural targets such as improving surface drainage by 10% annually.
Policy Department B: Structural and Cohesion Policies____________________________________________________________________________________________
160
5.6 Summary for Italy
The Conto Nazionale delle Infrastrutture e dei Trasporti shows that the total budget forcurrent and capital expenditure is decreasing across the country, over a period of timewhen the size of the network has remained about the same. The data from ANAS confirm aprogressive reduction in global maintenance spending but, at the same time, it is clearwhere to focus current resources and budget, preferring general routine maintenanceinstead of specific structural interventions in order guarantee a good short-termmaintenance level.
According to SITEB data, national bitumen consumption has dropped significantly in recentyears, by about 45% to 2011 and further declining by 23% in 2012. This is as a result ofboth the economic downturn and an increase in unit costs.
The publication of some key best practice documentation has facilitated the decisionmaking process for maintenance across the country. It is up to each Region to decide howto apply these best practices and implement a maintenance plan, but it is a step in theright direction to improve the efficiency of maintenance spending given current budgetcuts.
EU Road Surfaces: Economic and Safety Impact of the Lack of Regular Road Maintenance____________________________________________________________________________________________
161
6. CASE STUDY LITHUANIA
6.1 Member State overview
Lithuania’s total road network measures 83,000 km, of which 309 km are classified asmotorways. The car ownership rate in Lithuania is approximately 570 passenger cars per1000 inhabitants, growing by 75% in the period 2001-2011 – a substantial increase interms of car ownership (Eurostat).
6.2 Road safety statistics
In 2011, 296 road fatalities were recorded in Lithuania, which represents a substantial(57%) decrease from its 2001 level. When road safety is judged in proportion to itspopulation, Lithuania scores below the EU27 average, and in terms of fatalities per millioninhabitants, Lithuania’s 98 is much higher than the EU27 average of 60. Lithuania noted 97fatalities per 10 billion passenger kilometres (again worse than the EU27 average of 61),whilst its figure of 174 fatalities per million passenger cars is substantially higher than theEU average of 126. There were 3,300 accidents resulting in personal injury on Lithuanianroads in 2011. This is a notable 45% decrease compared to the same variable recorded in2001 (Eurostat and OECD).
6.3 Analysis of maintenance budgets
6.3.1 Road infrastructure and maintenance spending in Lithuania
Road network management and maintenance is funded by the Road Maintenance andDevelopment Programme (RMPD), which is supported by excise duty on fuel and gas androad taxes.
The State road network is entirely under the responsibility of the Lithuanian RoadAdministration Institution LRA. It consists of 21,243 km divided into 3 categories: MainRoads (1,746 km), National Roads (4,429 km) and Regional Roads (14,567 km). Pavementtype varies mostly between asphalt (64.6%) and gravel (35%), and only a small share isdone with concrete (0.3%).

Policy Department B: Structural and Cohesion Policies____________________________________________________________________________________________
162
Figure 30: Share of state road network by road type (%)
Source: LRA (2013).
The State road network represents 25% of the total road network in Lithuania. Theremaining 75% consists of local roads (69%) and private roads (6%). Responsibility for thelocal road network management and maintenance lies with local municipalities that receivefunds from the Road Maintenance and Development Programme (RMPD), according to theplanning done by the Lithuanian Road Administration Institution (LRA).
Figure 31: Share of Road network in Lithuania by operational responsibility (%)
Source: LRA (2013).
Allocation of funds for the RMDP is approved by the government annually. As can be seenin Figure 32, funds available for road maintenance have fallen following the 2008-2009economic crisis, with a drop of €24m between 2008 and 2009 alone, and a decrease of32% in the last six years. The 2013 road maintenance budget is back at its 2001 level.

EU Road Surfaces: Economic and Safety Impact of the Lack of Regular Road Maintenance____________________________________________________________________________________________
163
Figure 32: Evolution of road maintenance expenses (RMDP) millions of euro
Source: LRA (2013).
Allocation of funds varies significantly according to both road type and the level ofmaintenance that the LRA is planning to carry out. The maintenance level is in turn decidedyearly according to the funds allocated to the RMDP by the State.
Table 14: Funds for 1 km of State road network maintenance in 2013 bymaintenance level (Euro)
Road type Funds for 1 Km Maintenance level
Main roads10,710 I
7,354 II
National roads 3,443 III
Regional roads1,188 III (asphalt)
1,742 III (gravel)
Source: LRA (2013).
6.3.2 Road maintenance budget outlook
Looking at how the funds of the RMDP are spent, it becomes evident how due to theclimatic conditions of Lithuania, priority is given to routine winter maintenance. In 2013,€29.2m was allocated to winter maintenance, almost 40% of the total budget of the RMDP.
This €29.2m was further distributed along the road network according to the result of theRoutine Winter Maintenance Funds Indexing Project, which uses the LRA-built WinterSeverity Index (ŽSI) to identify priority areas according to weather conditions, such as:precipitation rates; temperature fluctuations; and the duration of the winter season.Overall, a total amount of €56.5m has been allocated for routine road maintenance.

Policy Department B: Structural and Cohesion Policies____________________________________________________________________________________________
164
A smaller budget is dedicated to extraordinary maintenance on the road surface. In fact,over the past five years, only in 2011 and 2013 did some sections of the State roadnetwork undergo an extraordinary maintenance: 600km in 2011 and 215km in 2013. Thismeans that between 2009 and 2013 only 4% of the State road network underwentsystemic and extraordinary rehabilitation, with direct consequences for the overallconditions of the State network system.
Figure 33: Share of road maintenance expenses (RMDP) in 2013 (%)
Source: LRA (2013).
6.4 Road maintenance performance and monitoring system
6.4.1 Responsibilities
In Lithuania, the management and operation of the national road network is under theresponsibility of the Ministry of Transport and Communications. Within the Ministry,different tasks are sub-divided between: the Transport and Road Research Institute incharge of research, development and road design; the agency Problematika in charge ofroad maintenance technical supervision; and the Lithuanian Road Administration Institution(LRA) in charge of the overall management.
Maintenance of the national road system is carried out by ten Regional state-ownedenterprises and one motorway state enterprise. Responsibility for the local road network isheld by municipalities. All the activities of road management and maintenance are fundedthrough the Road Maintenance and Development programme (RMPD).
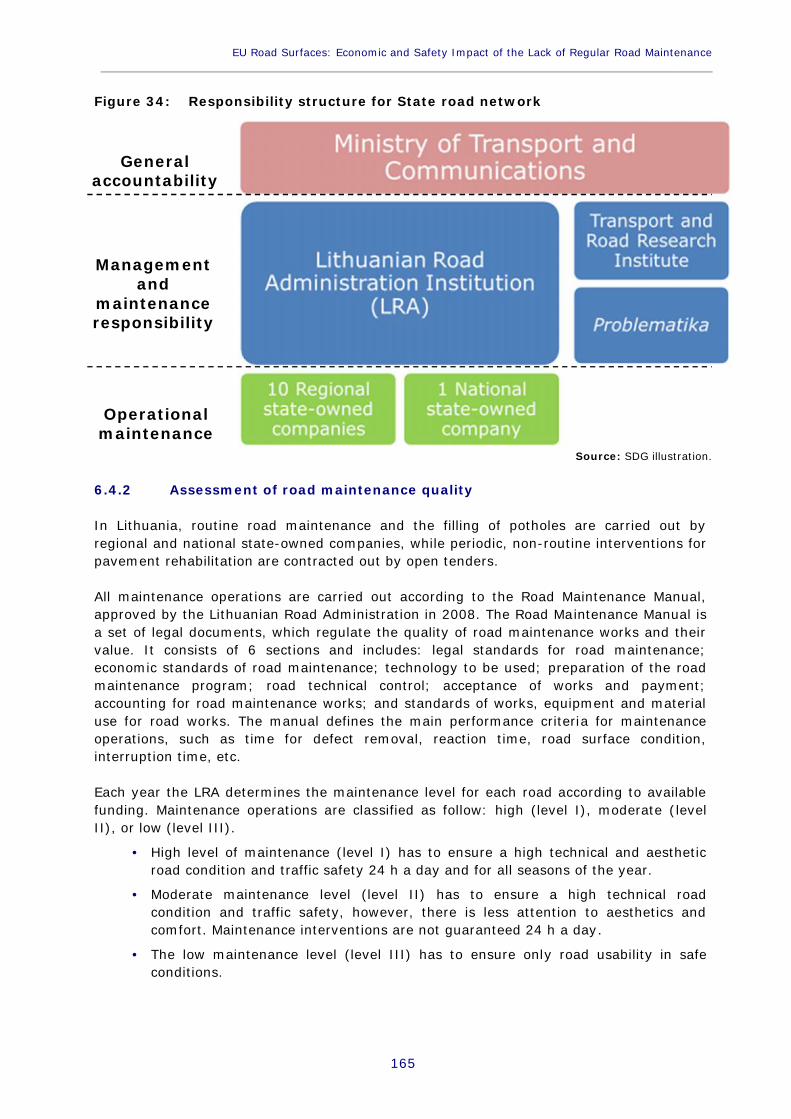
EU Road Surfaces: Economic and Safety Impact of the Lack of Regular Road Maintenance____________________________________________________________________________________________
165
Figure 34: Responsibility structure for State road network
Source: SDG illustration.
6.4.2 Assessment of road maintenance quality
In Lithuania, routine road maintenance and the filling of potholes are carried out byregional and national state-owned companies, while periodic, non-routine interventions forpavement rehabilitation are contracted out by open tenders.
All maintenance operations are carried out according to the Road Maintenance Manual,approved by the Lithuanian Road Administration in 2008. The Road Maintenance Manual isa set of legal documents, which regulate the quality of road maintenance works and theirvalue. It consists of 6 sections and includes: legal standards for road maintenance;economic standards of road maintenance; technology to be used; preparation of the roadmaintenance program; road technical control; acceptance of works and payment;accounting for road maintenance works; and standards of works, equipment and materialuse for road works. The manual defines the main performance criteria for maintenanceoperations, such as time for defect removal, reaction time, road surface condition,interruption time, etc.
Each year the LRA determines the maintenance level for each road according to availablefunding. Maintenance operations are classified as follow: high (level I), moderate (levelII), or low (level III).
High level of maintenance (level I) has to ensure a high technical and aestheticroad condition and traffic safety 24 h a day and for all seasons of the year.
Moderate maintenance level (level II) has to ensure a high technical roadcondition and traffic safety, however, there is less attention to aesthetics andcomfort. Maintenance interventions are not guaranteed 24 h a day.
The low maintenance level (level III) has to ensure only road usability in safeconditions.
Generalaccountability
Managementand
maintenanceresponsibility
Operationalmaintenance
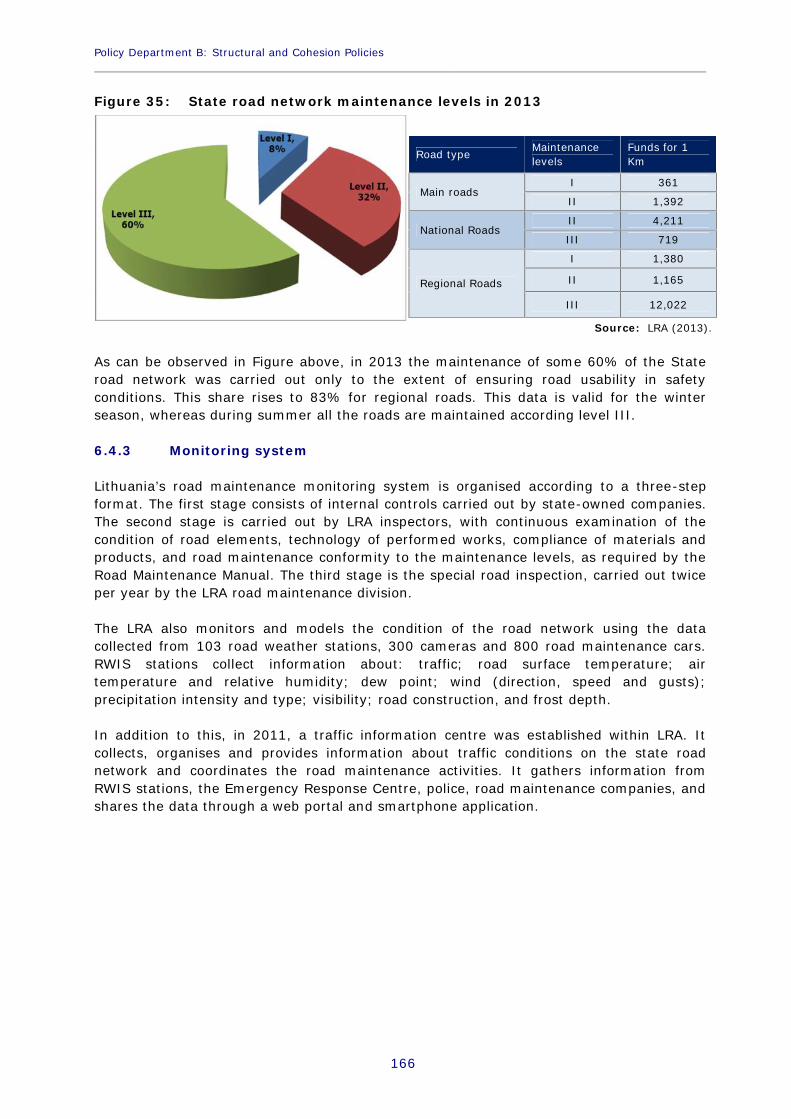
Policy Department B: Structural and Cohesion Policies____________________________________________________________________________________________
166
Figure 35: State road network maintenance levels in 2013
Source: LRA (2013).
As can be observed in Figure above, in 2013 the maintenance of some 60% of the Stateroad network was carried out only to the extent of ensuring road usability in safetyconditions. This share rises to 83% for regional roads. This data is valid for the winterseason, whereas during summer all the roads are maintained according level III.
6.4.3 Monitoring system
Lithuania’s road maintenance monitoring system is organised according to a three-stepformat. The first stage consists of internal controls carried out by state-owned companies.The second stage is carried out by LRA inspectors, with continuous examination of thecondition of road elements, technology of performed works, compliance of materials andproducts, and road maintenance conformity to the maintenance levels, as required by theRoad Maintenance Manual. The third stage is the special road inspection, carried out twiceper year by the LRA road maintenance division.
The LRA also monitors and models the condition of the road network using the datacollected from 103 road weather stations, 300 cameras and 800 road maintenance cars.RWIS stations collect information about: traffic; road surface temperature; airtemperature and relative humidity; dew point; wind (direction, speed and gusts);precipitation intensity and type; visibility; road construction, and frost depth.
In addition to this, in 2011, a traffic information centre was established within LRA. Itcollects, organises and provides information about traffic conditions on the state roadnetwork and coordinates the road maintenance activities. It gathers information fromRWIS stations, the Emergency Response Centre, police, road maintenance companies, andshares the data through a web portal and smartphone application.
Road type Maintenancelevels
Funds for 1Km
Main roadsI 361
II 1,392
National RoadsII 4,211
III 719
Regional Roads
I 1,380
II 1,165
III 12,022

EU Road Surfaces: Economic and Safety Impact of the Lack of Regular Road Maintenance____________________________________________________________________________________________
167
6.5 Socio-economic impacts of road maintenance
6.5.1 Road safety
Road safety has improved a lot in Lithuania in the last few years. The number of deathsdropped from a total amount of 706 in 2001 to 301 in 2012. This data is particularlyinteresting if we take into consideration that over the same period of time car ownershiphas increased. As can be seen in figure below, this fall in fatalities can be partiallyattributed to falling traffic. Nevertheless the factor that has had the most effect on thisresult, according to the European Transport Safety Council (ETSC) is the lowering of thelegal blood alcohol limit to 0.4g/l and 0.2 for new and professional drivers along withincreased fines for speeding. Between 2001 and 2010 Lithuania achieved a 58% reductionin road deaths (third best reduction in the EU after Latvia and Estonia). For this reason, in2011 the Minister of Transport received the PIN award from ETSC.
Figure 36: Evolution of total deaths and passenger cars (2001 – 2011)
Source: LRA (2012).
Even though the number of deaths on Lithuanian roads has fallen substantially, mortalityremains high, with over 90 deaths per million inhabitants in 2012. In addition to this, ascan be observed in Figure 37 the total number of deaths remained stable between 2010and 2012.
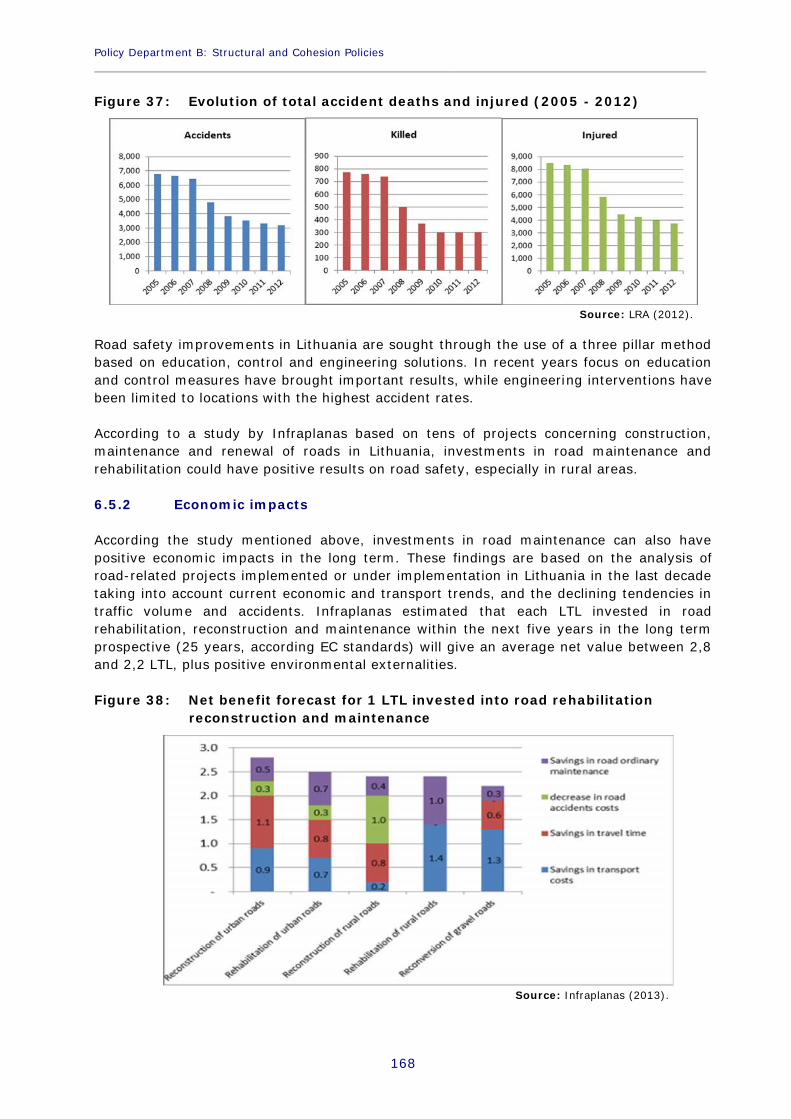
Policy Department B: Structural and Cohesion Policies____________________________________________________________________________________________
168
Figure 37: Evolution of total accident deaths and injured (2005 - 2012)
Source: LRA (2012).
Road safety improvements in Lithuania are sought through the use of a three pillar methodbased on education, control and engineering solutions. In recent years focus on educationand control measures have brought important results, while engineering interventions havebeen limited to locations with the highest accident rates.
According to a study by Infraplanas based on tens of projects concerning construction,maintenance and renewal of roads in Lithuania, investments in road maintenance andrehabilitation could have positive results on road safety, especially in rural areas.
6.5.2 Economic impacts
According the study mentioned above, investments in road maintenance can also havepositive economic impacts in the long term. These findings are based on the analysis ofroad-related projects implemented or under implementation in Lithuania in the last decadetaking into account current economic and transport trends, and the declining tendencies intraffic volume and accidents. Infraplanas estimated that each LTL invested in roadrehabilitation, reconstruction and maintenance within the next five years in the long termprospective (25 years, according EC standards) will give an average net value between 2,8and 2,2 LTL, plus positive environmental externalities.
Figure 38: Net benefit forecast for 1 LTL invested into road rehabilitationreconstruction and maintenance
Source: Infraplanas (2013).

EU Road Surfaces: Economic and Safety Impact of the Lack of Regular Road Maintenance____________________________________________________________________________________________
169
The parameters taken into account in these calculations are savings in transportation costs,savings in travel time, decreased road accident costs, and savings in infrastructure ordinarymaintenance costs. Looking at the findings summarized in Figure 38 it can be seen howextraordinary maintenance such as road reconstruction and systematic rehabilitation couldhave positive economic effects in the long term, especially in urban contexts where trafficflows are more consistent.
6.5.3 Environmental and health impacts
According to Infraplanas estimates, road maintenance activities in Lithuania may also havepositive impacts on the environment. As can be observed in Figure 39, taking a temporalreference of 25 years, the reconstruction of 1 km of urban roads results in 680 thousandslitres of fuel saved and 1700 t of CO2 emissions avoided (300 thousands litres of fuel savedand 700 t of CO2 emissions in rural roads). The rehabilitation and strengthening of 1 km ofurban roads results in 200 thousands litres of fuel saved and 500 t of CO2 emissionsavoided (200 thousands litres of fuel saved and 500 t of CO2 avoided in rural roads). Thepaving of 1 km of gravel roads results in 230 thousands litters of fuel saved and 580 t ofCO2 emissions avoided.
Figure 39: Decrease in fuel consumption (thousands of litres) and CO2 emissions(tonnes) per 1 km of road intervention
Source: Infraplanas (2013).
To pave gravel roads (bearing in mind that 35% of Lithuania state road network iscomposed of gravel road) can also have positive externality effect on health. Paving 10% ofthe current Lithuanian gravel state road network per year could avoid the production of 736tonnes of particles in the next 5 years.Road transport is also an important source of noise pollution. The level of noise producedby the friction between vehicles and road surface depends on the speed of the vehicles, thecharacteristics of the surface and its level of deterioration. Irregularities of the pavement,ruts, traverse and longitudinal cracks, also can increase the noise level. Asphalt pavementnoise increases about 3 dBA within 6–7 years of usage and in later years of usage it canincrease up to 4 dBA. Ordinary and non-ordinary maintenance of the pavement surfacesare fundamental to keep the noise level within the comfort zone for human hearing.
Policy Department B: Structural and Cohesion Policies____________________________________________________________________________________________
170
6.6 Summary for Lithuania
In Lithuania, road network management and maintenance is funded by the RoadMaintenance and Development Programme (RMPD), which is supported by excise duty onfuel and gas and road taxes. RMPD funds have fallen following the 2008-2009 economiccrisis, with a decrease of 32% in the last six years. The 2013 road maintenance budget isback at its 2001 level.
Within the RMPD funds, because the Lithuanian climatic conditions, priority is given to roadwinter maintenance which absorbs 40% of the expenditure. Little investments are insteaddedicated to extraordinary maintenance: between 2009 and 2013 only 4% of the Stateroad network underwent systemic and extraordinary rehabilitation. Ordinary maintenance isto ensure a minimum level (according Lithuanian Road Maintenance Manual), whichensures only road usability in safe conditions along 60% of the road network.
Road safety has improved a lot in the last few years: Between 2001 and 2010 Lithuaniaachieved a 58% reduction in road deaths. The main reason for this drop is the lowering ofthe legal blood alcohol limit to 0.4g/l and 0.2 for new and professional drivers along withincreased fines for speeding. The number of fatalities stabilized between 2010 and 2013and national experts stated that investment in road maintenance and rehabilitation couldhave positive results on road safety, especially in rural areas.
In Lithuania 35% of the national road network consists of gravel roads. To pave gravelroads would have economic and environmental impacts and it would also improve thecomfort of drivers and road users.
EU Road Surfaces: Economic and Safety Impact of the Lack of Regular Road Maintenance____________________________________________________________________________________________
171
7. CASE STUDY POLAND
7.1 Member State overview
Poland’s total road network extends to 412,000 km, of which 1,000 km are graded asmotorways. Municipal roads make up 237,000 km of the total network. Poland’s level of carownership is approximately 470 passenger cars per 1000 inhabitants. This figure hasincreased markedly in the period 2001-2011; the percentage increase was 71% (Eurostat).
7.2 Road safety statistics
In 2011, Poland recorded 4,189 fatalities on its roads, which rates as a 24% decrease fromits 2001 level. In terms of fatalities per million inhabitants, Poland ranks as the worst in theEU27: there are 109 fatalities per million inhabitants (EU27 average = 60). When judged interms of passenger kilometres and car ownership Poland rates slightly better; Poland noted105 fatalities per 10 billion passenger kilometres (EU27 average = 61) and 237 fatalitiesper million passenger cars (EU27 average = 126) which, whilst still worse than the EUaverage, is better than four of its European neighbours. In 2011, there were 40,000accidents resulting in personal injury on Polish roads, which represents a 26% decrease onthe equivalent figure from 2001 (Eurostat and OECD).
7.3 Maintenance budgets analysis
7.3.1 Road infrastructure and maintenance spending in Poland.
Poland’s underdeveloped road network has, in the past, been in part responsible for a poorroad safety record and has been a limiting factor in Poland’s economic growth. Morerecently, since joining the EU in May 2004, Poland has seen a step-change in roadinvestment, in part as a result of substantial co-financing from the EU and the World Bank.This support has led to a programme of road infrastructure projects from the building ofNational highways to overall road improvements through road maintenance andrehabilitation projects, including upgrading many major national roads.
The World bank23 reported that, in order to develop the road network and capitalise onfunding, institutional changes would be necessary. The result was reform within theGeneral Directorate for Road and Motorways (GDDKiA) in 2004 allowing improved workingpractices between the Ministry of Transport, GDDKiA headquarters and its regionalbranches. These institutional changes included: appointing a new GDDkiA management in2008; decentralisation of investment planning, preparation and implementation in regionaloffices; changing key business processes and procedures within the GDDKiA; and thecreation of several units within the GDDKiA including departments for environment,technology and internal audit and control.
23 World Bank (2009) – Implementation and completion results report on a loan of Euro 100 million to theRepublic of Poland for a road maintenance and rehabilitation project.

Policy Department B: Structural and Cohesion Policies____________________________________________________________________________________________
172
The restructuring exercise has improved planning and implementation capacity and wasaccompanied by financial support aimed at clearing the large backlog of road maintenanceand to allow for new investments for network expansion. From this point on, Poland hasimplemented several stages of road and economic development planning, with the nextstages due to be completed in 2015.
Figure 40: Road Infrastructure, planned and actual expenditure – National roadsand motorways
Source: Ernst & Young (2012).
As shown in Figure 40 above, total expenditure on the Polish road network has been risingsince its accession to the European Union. From 2004 to 2011, actual expenditure on newroad infrastructure has risen approximately 500% to a high of over PLN 26 billion(€6.3billion24) in 2011. According to the Financing Programme for National Road Building,the actual expenditure has been lower than planned expenditure for all years. During theperiod of economic downturn, investment spending into Polish roads has not decreased,mainly due to large amounts EU funding.
Figure 41: Maintenance expenditure (actual) – Routine and structuralmaintenance
Source: GDDKiA (2014).
24 (1 EUR = 4.1 PLN) based on exchange rate at 02/08/2012.
EU Road Surfaces: Economic and Safety Impact of the Lack of Regular Road Maintenance____________________________________________________________________________________________
173
Routine maintenance in Poland includes preserving the condition of trunk roads,motorways, bridges and winter maintenance. These activities are focused primarily on thepreservation of the current condition of the road for example clearing snow from roads andcleaning of carriageways and hard shoulders. Structural maintenance includes renewals ofroads and bridges as well as the upgrading of roads to improved specifications andreinforcement of bridges.
Figure 41 shows the budget for routine maintenance has generally increased in the periodfrom 2007 to 2012 with annual expenditure rising from almost PLN 600 Million (€146Million) to a high of almost PLN 1.15 Billion (€472 Million) in 2012. Spending on routinemaintenance would be expected, in-line with the expansion of the road network.
As a proportion of the total spending, routine maintenance has fluctuated dramatically. Thishas been due to the large variations in structural maintenance spending which has rangedfrom 51% to 78% of combined spending and includes the resurfacing of roads that arecurrently in a poor condition. Between 2010 and 2012 structural maintenance has beensupplemented by additional funds to repair road and bridges that were damaged as a resultof flooding. Our analysis of winter maintenance (which fluctuates between 8% and 17% ofthe total budget) has shown a large correlation between the intensity and duration ofsnowfalls and the amount spent on winter interventions.
From 2010, spending on Polish infrastructure was due to slow down, especially with the endof the Euro 2012 effect which boosted infrastructure spending. Despite this, the 2013budget has assigned PLN 3 Billion (€730 Million) to the roads infrastructure fund.
7.4 Road performance monitoring
7.4.1 Responsibilities
Roads in Poland are divided into four main types; national roads, expressways andmotorways belonging to GDDKiA; regional roads, county roads and roads belonging tocities and towns. In each case, the maintenance and management of these roads as well asresponsibility for damage or accidents caused as a result of improper maintenance lies withthe manager of each road area.
National roads, expressways and motorways are managed by the directorate for NationalRoads and Highways, supervised by The Ministry for Transport, Construction and MaritimeEconomy. The General Directorate for National Roads and Highways (GDDKiA) is brokendown into 16 administrative regions each with its own geographical areas of responsibility.Below the regional level there are a further 105 subdivisions spanning 273 road areas.Regional roads, which are smaller and connect towns, are owned and managed by therelevant regional governments. Each region holds its own budget and implementsmaintenance works.
County and town roads are smaller in size and capacity than either national or regionalroads. These roads are also managed by their corresponding geographical administrativeareas.
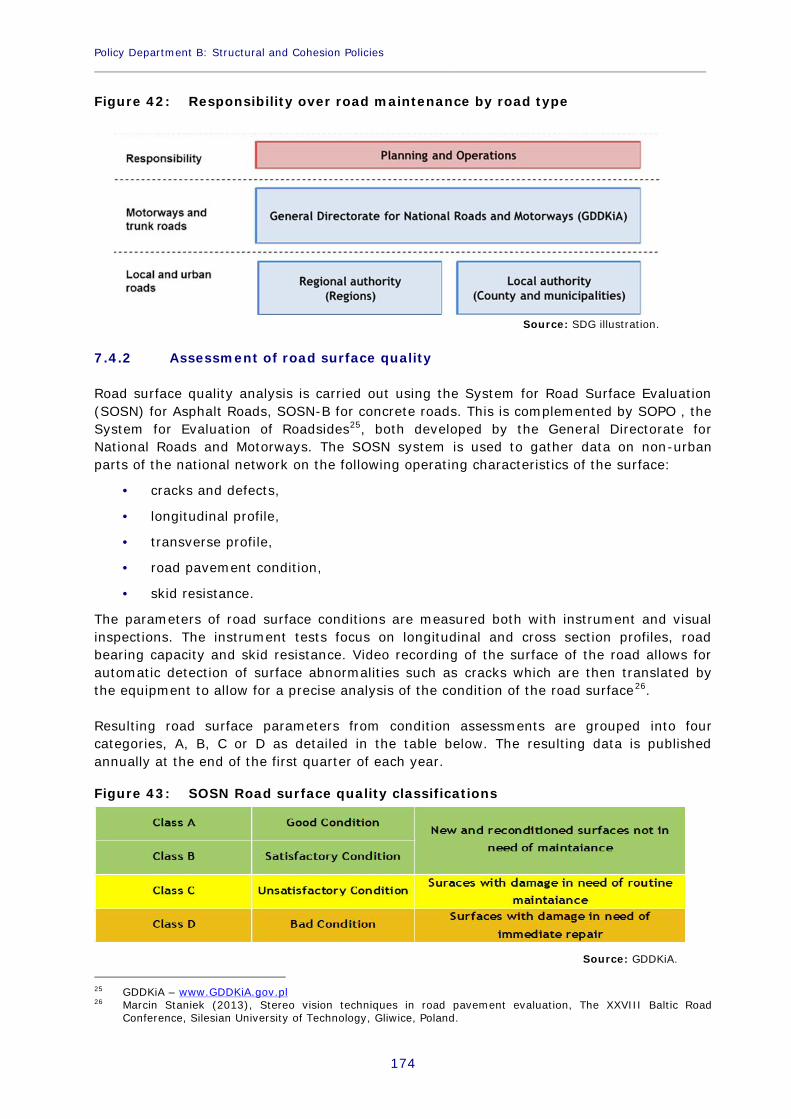
Policy Department B: Structural and Cohesion Policies____________________________________________________________________________________________
174
Figure 42: Responsibility over road maintenance by road type
Source: SDG illustration.
7.4.2 Assessment of road surface quality
Road surface quality analysis is carried out using the System for Road Surface Evaluation(SOSN) for Asphalt Roads, SOSN-B for concrete roads. This is complemented by SOPO , theSystem for Evaluation of Roadsides25, both developed by the General Directorate forNational Roads and Motorways. The SOSN system is used to gather data on non-urbanparts of the national network on the following operating characteristics of the surface:
cracks and defects,
longitudinal profile,
transverse profile,
road pavement condition,
skid resistance.
The parameters of road surface conditions are measured both with instrument and visualinspections. The instrument tests focus on longitudinal and cross section profiles, roadbearing capacity and skid resistance. Video recording of the surface of the road allows forautomatic detection of surface abnormalities such as cracks which are then translated bythe equipment to allow for a precise analysis of the condition of the road surface26.
Resulting road surface parameters from condition assessments are grouped into fourcategories, A, B, C or D as detailed in the table below. The resulting data is publishedannually at the end of the first quarter of each year.
Figure 43: SOSN Road surface quality classifications
Source: GDDKiA.
25 GDDKiA – www.GDDKiA.gov.pl26 Marcin Staniek (2013), Stereo vision techniques in road pavement evaluation, The XXVIII Baltic Road
Conference, Silesian University of Technology, Gliwice, Poland.

EU Road Surfaces: Economic and Safety Impact of the Lack of Regular Road Maintenance____________________________________________________________________________________________
175
These classifications are applied to the entire length of the National Road Network and formthe basis of planned maintenance works. Figure 44 shows how the condition of roadsurfaces on the Polish network has improved since 2005. The proportion of roads in goodcondition has been steadily increasing from under 50% in 2005 to 63% by 2012. Duringthe same period, the proportion of roads in poor condition and in need of immediate repairhas decreased from 25% in 2005 to a low of 14% in 2012. The percentage of roads in anunsatisfactory condition and in need of routine repair has remained relatively constantthroughout the period. During this period, it should also be noted that an additional 2600km of motorways and trunk roads have been constructed, an increase of 13% over 2005.
Figure 44: Condition of road surface on entire national road network
Source: GDDKiA.
7.4.3 Maintenance intervention
There has been a considerable push to improve standards within GDDKiA and on Polishroads in the last decade. The next phase of improvements to monitoring was attained in2010, with GDDKiA publishing a more complete and in depth analysis of road conditions,taking into consideration drainage and technical condition of road shoulders as factors inincreased road surface deterioration.
From 2011 measurement of the technical conditions of the road is carried out twice a yearusing radar techniques which will allow for further information to be obtained about theroad condition27- these techniques have been developed by GDDKiA. After the 2004restructuring, a specialist research and technology department was created. According tothe GDDKiA’s own publications, substantial research efforts have been made to improvematerials used in road surfacing, including studies completed on mineral asphalt mixturesfor use in reduced temperatures. This is in addition to several studies into the use ofimproved radar techniques for measurement purposes.
27 Ernst and Young 2012, Effectiveness of national roads maintenance management in Poland.

Policy Department B: Structural and Cohesion Policies____________________________________________________________________________________________
176
In 2010 an significant change was introduced to the structure of GDDKiA, which includedthe creation of a Traffic Management Department. This new department acts exclusively inrelation to road maintenance. From 2010 the traffic management and maintenancedepartments were entrusted with the organisational and technical matters of planning anddesigning and carrying out projects in the field of traffic safety on national roads6.
7.5 Socio-economic impacts of road maintenance
7.5.1 Road safety
Poland’s road safety record is amongst the worst in Europe. In 2012 the average number ofdeaths on the roads was 93 per million, almost double the EU average of 5528. Despitenational efforts to improve road safety through the GAMBIT programme, targets of a 50%reduction in fatalities between 2003 and 2013 have not been achieved29. Due to the lack ofgood quality data at levels below the national level for roads, analysis of the causes of thefatalities is difficult to determine as the relationship between road surface quality andcrashes is not clear. The World Bank report indicates that general road quality isresponsible and some the key risk factors are :
Unforgiving roadsides
Lack of sealed shoulders
Lack of separated carriageways allowing for head on collisions
Lack of facilities for pedestrians and cyclists
Speed limits on rural and urban roads different from international best practice.
National records indicate an overall fall in road accidents in the period between 2003-2012with a reduction from 51,078 accidents in 2003 to 37,046 in 2012, an overall reduction of37%. This has been reflected in a reduction in road fatalities and injuries against a backdrop of increasing vehicle use and, ownership rising to over 24 million vehicles in 2011, anincrease of over 55% on 2002 levels.
The proportion of accidents that occur on differing types of roads varies greatly in Poland.The roads with the best safety records for 2012 were motorways (0.7%), express roads(0.4%) and dual carriageways (13.3%) contributing a total of 14.4% of all accidents. Themajority of accidents that occurred took place on single carriageway roads, accounting for82.3% of accidents, 87.8% of road deaths and 82.4% of injuries. Within this period, 49.2%of accidents were between moving vehicles and 27.1% included accidents involvingpedestrians. Of all accidents in 2012, only 89 were attributed directly to the poor conditionof the road surface by the Police.
7.5.2 Operating efficiency
The Jaspers Blue Book (2008) analyses economic and road data in order to provideindicators of economic effectiveness in relation to Poland’s road network. Table 15 showsthe relative increases in vehicle operating costs between deteriorated and renovated roadsurfaces for passenger vehicles and good vehicles without trailers.
28 World Bank, 2013. Road safety in Poland.29 World Bank, 2009. Country Report on Poland – Road safety management capacity review.
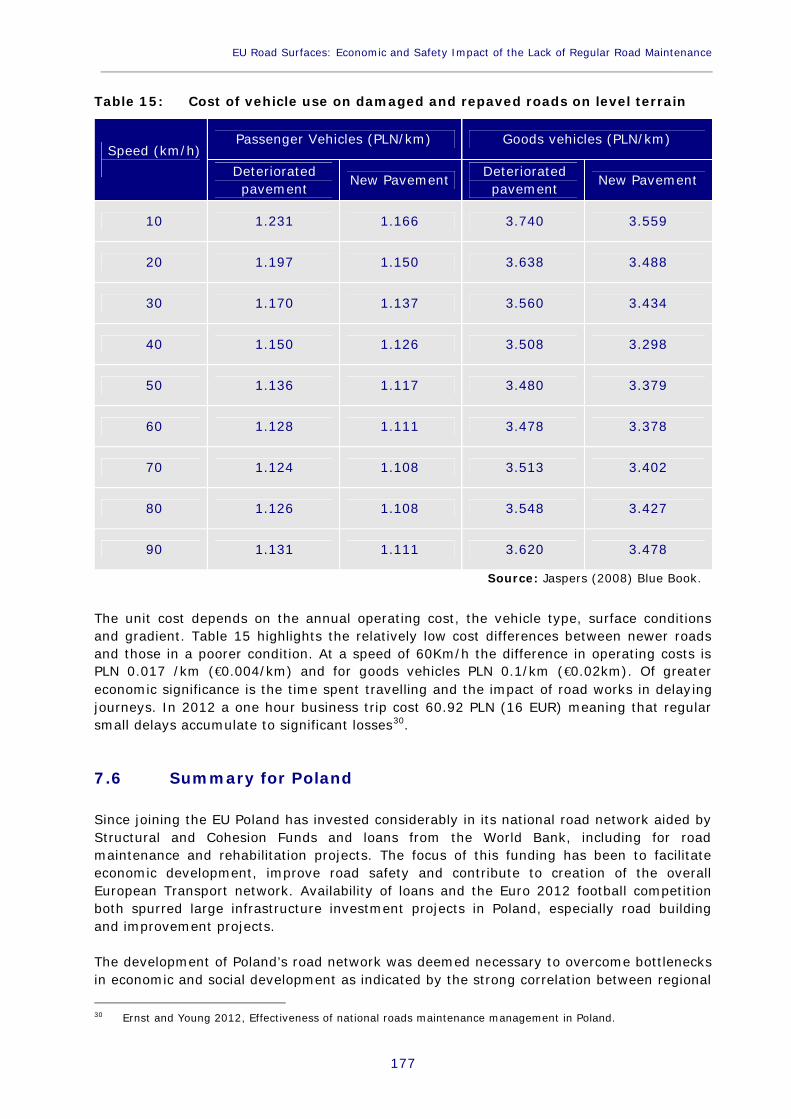
EU Road Surfaces: Economic and Safety Impact of the Lack of Regular Road Maintenance____________________________________________________________________________________________
177
Table 15: Cost of vehicle use on damaged and repaved roads on level terrain
Speed (km/h)Passenger Vehicles (PLN/km) Goods vehicles (PLN/km)
Deterioratedpavement New Pavement Deteriorated
pavement New Pavement
10 1.231 1.166 3.740 3.559
20 1.197 1.150 3.638 3.488
30 1.170 1.137 3.560 3.434
40 1.150 1.126 3.508 3.298
50 1.136 1.117 3.480 3.379
60 1.128 1.111 3.478 3.378
70 1.124 1.108 3.513 3.402
80 1.126 1.108 3.548 3.427
90 1.131 1.111 3.620 3.478
Source: Jaspers (2008) Blue Book.
The unit cost depends on the annual operating cost, the vehicle type, surface conditionsand gradient. Table 15 highlights the relatively low cost differences between newer roadsand those in a poorer condition. At a speed of 60Km/h the difference in operating costs isPLN 0.017 /km (€0.004/km) and for goods vehicles PLN 0.1/km (€0.02km). Of greatereconomic significance is the time spent travelling and the impact of road works in delayingjourneys. In 2012 a one hour business trip cost 60.92 PLN (16 EUR) meaning that regularsmall delays accumulate to significant losses30.
7.6 Summary for Poland
Since joining the EU Poland has invested considerably in its national road network aided byStructural and Cohesion Funds and loans from the World Bank, including for roadmaintenance and rehabilitation projects. The focus of this funding has been to facilitateeconomic development, improve road safety and contribute to creation of the overallEuropean Transport network. Availability of loans and the Euro 2012 football competitionboth spurred large infrastructure investment projects in Poland, especially road buildingand improvement projects.
The development of Poland’s road network was deemed necessary to overcome bottlenecksin economic and social development as indicated by the strong correlation between regional
30 Ernst and Young 2012, Effectiveness of national roads maintenance management in Poland.

Policy Department B: Structural and Cohesion Policies____________________________________________________________________________________________
178
income, unemployment levels and road density31. The results of heavy investment inconstruction and infrastructure so far have contributed to strengthening Poland’seconomy32 throughout the economic downturn of 2008-2012 where growth decreased, buteconomic activity did not stagnate for long. Throughout this period road maintenancebudgets and infrastructure spending did not decrease. On the contrary, road investmenthelped sustain high levels of economic activity.
It is difficult to determine the scale to which improvements to the national road networkhave impacted on road safety due to there being several key contributory factors. Withinthe study period, road accidents have decreased as car ownership has increased, indicatingan overall improvement. In recent years there has been a large safety campaign aimed atraising awareness of road safety in Poland. Additional measures to curb accidents include alow tolerance policy (for example in relation to alcohol by setting a maximum allowed BACequal 0.2mg/l) to driving while under the influence of alcohol. Another factor playing animportant role in road safety is the affordability of more modern cars with improved safetyfeatures. Although cars fitted with airbags will not prevent accidents, other features such asanti-lock braking and the age and general condition of vehicles may play a part in reducingthe accident rate.
From recent studies, further recommendations have been made to improve themanagement and therefore quality of road surfaces in Poland, including: greater use of ITsystems to allow for better technical and economic management of road maintenance;guaranteed and steady road maintenance budgets to be set year on year to allow forbetter planning of routine maintenance works33 with examples being taken from otherEuropean countries such as Germany, and to take into account roads users’ needs inmaintenance activities including shortening the duration and therefore the impact of roadwork durations on journey times and economic performance.
31 World Bank (2009) – Implementation and completion results report on a loan of Euro 100 million to theRepublic of Poland for a road maintenance and rehabilitation project.
32 EC Harris Research, International focus on Poland (2012) Time to invest in Poland – Competition tightening asEU funded infrastructure workload slows.
33 Ernst and Young 2012, Effectiveness of national roads maintenance management in Poland.

EU Road Surfaces: Economic and Safety Impact of the Lack of Regular Road Maintenance____________________________________________________________________________________________
179
8. CASE STUDY PORTUGAL
8.1 Introduction
Portugal’s total road network is 11,000 km long, of which 2,700 km is motorways.Portugal’s level of car ownership in 2011 was 447 passenger cars per 1000 inhabitants, anincrease of 29% on the 2001 value (Eurostat).
8.2 Road Safety
In 2011, Portugal recorded 891 fatalities on its roads, which stands as a 47% decreasefrom its 2001 level. When road safety is judged in proportion to its population, Portugalscores consistently worse than the EU27 average. In terms of fatalities per millioninhabitants, Portugal’s 84 is above the EU27 average of 60. Portugal registered 105fatalities per 10 billion passenger kilometres (again worse than the EU average of 61),whilst its figure of 189 fatalities per million passenger cars is also higher than the EUaverage of 126. There were 32,500 accidents resulting in personal injury on Portugueseroads in 2011, which represents a 24% decrease on the same figure recorded in 2001(Eurostat and OECD).
8.3 Stakeholders and Responsibilities
In Portugal there are several institutions and companies that play a key role in roadmaintenance and safety, along with others that play a more indirect role. This section setsout the main stakeholders in Portugal and their responsibilities. The list is not exhaustivebut gives an overview of the Portuguese institutional framework across the different levelsof decision making. Some of the stakeholders approached to assist in the preparation ofthis case study belong to these organisations.
8.3.1 List of stakeholders and their responsibilities
Secretary of Public works, Transport and Communication at the Ministry ofEconomy: the central authority which is in charge of transportation policy.
Instituto da Mobilidade e dos Transportes, IMT, I.P34: responsible for the regulationand supervision of the road infrastructure sector and for the supervision and regulation ofits execution, conservation and management.
Estradas de Portugal, EP35: responsible for managing the existing and future NationalRoad Network. It is also responsible for the planning and construction of changes to thenetwork.
34 IMT - http://www.imtt.pt/sites/IMTT/Portugues/Paginas/IMTHome.aspx35 Estradas de Portugal - http://www.estradasdeportugal.pt/index.php

Policy Department B: Structural and Cohesion Policies____________________________________________________________________________________________
180
Brisa36: a private highways concessionaire in Portugal. Currently Brisa has 6 concessionsin Portugal that includes 17 highways and a total of 1352km of motorways that it operatesand maintains (approximately 50% of the total highway network).
Local authorities: such as the Municipality of Lisbon which also has road infrastructureresponsibilities.
8.3.2 Institutional framework and recent changes
Figure 45 below summarises the general responsible for road regulation and operations.
Figure 45: Regulation and Operation Responsibilities by Stakeholder
Source: SDG Analysis.
In recent years, the organizational structure has gone through a number of changes andthe current framework is still quite recent. For example, IMT was restructured and createdin 2012, following the merger of several entities. EP was created following the merger of anumber of different authorities. The economic crisis has meant that the institutionalreorganisation has also been accompanied by substantial budget cuts.
8.3.3 National Road Plans
The National Road Plan was implemented in 1985 and covers all roads excluding local roadsbelonging to the municipalities.
The National Road Plan 2000 was defined in the Decreto-Lei n.o 222/98 which introducedseveral significant innovations to enhance the development of the road transport network,the reduction of global road costs and the increase in road safety. In order to accelerate theeconomic development of some regions, some roads were reclassified to increase theirimportance. It was also decided to improve the accessibility to some counties in order tocorrect the asymmetric socio economic developments of the country37.
36 Brisa - http://www.brisa.pt/PresentationLayer/homepageinternacional.aspx?menuid=7037 http://www.estradasdeportugal.pt/index.php/pt/areas-de-atuacao/prn/142-legislacao

EU Road Surfaces: Economic and Safety Impact of the Lack of Regular Road Maintenance____________________________________________________________________________________________
181
8.4 Maintenance Budgets
8.4.1 Infrastructure Spending
Aggregate expenditure increased significantly between 2000 and 2003, from approximately€113m to €203m, and since then there has been a gradual fall in expenditure. In 2013, theamount spent was the same as that spent in 2000. Furthermore, in 2008 there was asignificant drop in expenditure on local and regional roads which remains low today.Overall, the data shows that, since 2000, there has been an overall downward trend in roadexpenditure both at the national and at the local level.
Figure 46: EP Expenditure in Road Maintenance
Source: EP.
Figure 47 shows the extension of the network directly managed by EP and the network thatreceived maintenance and safety interventions between 2009 and 201238.
The network directly managed by EP decreased from 13,855km to 13,450km between 2009and 2011, and then it increased to 13,515km in 2012. In addition, the amount of networkthat received maintenance and safety interventions increased slightly between 2009 and2010, from 215km to 229km. This increase corresponds to a period where the expenditurein road maintenance in aggregate and regional/local levels increased. After 2010, there wasa dramatic drop, reaching 55km in 2012.
This means that less than 2% of the network directly managed by EP had any type of roadmaintenance and safety interventions per year. If we also consider road construction andreconfiguration, this value increases slightly but remains lower than 3%.
38 EP Annual Reports.

Policy Department B: Structural and Cohesion Policies____________________________________________________________________________________________
182
Figure 47: Road Maintenance and Safety Interventions and Network directlyManaged by EP (Kms)
Source: EP Annual Reports.
8.4.2 Criteria to allocate the Budget to Road Maintenance
The budgets for road maintenance are defined exclusively through the necessities identifiedthrough the Maintenance Management Systems. The allocation will then depend on theprioritization defined in EP’s medium term Action Plan and the available budget to executeit39.The same is true for Brisa O&M, there are no upper or lower limits regarding theallocation of budget to maintenance activities. The allocation of resources is based on arigorous analysis of the data collected through infrastructure monitoring. Brisa also basesthe budget decision on previous experience in maintenance activity40.
8.4.3 Performance Monitoring
Different techniques and methodologies have been adopted by the different institutions tomonitor road quality in order to ensure that road managers can make informed decisionson road maintenance expenditure.
EP’s Maintenance Management System is described in a paper published by 3 EPemployees41. This section is mainly based on information from this paper. EP contracted outthe development of a tool called Sistema de Gestão de Conservação de Pavimentos - SGPav(Pavements Conservation Management System). This tool was developed between 2003and 2007 and since then, EP started to evaluate the quality of the surface at a NationalLevel through Road Inspections and Interventions Inventory updates. The road inventorywas finished by the end of 2010, which gave EP a global view of the roads networkcondition.
39 EP contribution.40 Brisa O&M contribution.41 http://www.crp.pt/docs/A45S129-149_Art_T5_7CRP_2013.pdf

EU Road Surfaces: Economic and Safety Impact of the Lack of Regular Road Maintenance____________________________________________________________________________________________
183
In this process, EP used VIZIROAD software to identify and measure the differentparameters of road damages using simultaneously a GPS device. Overall, a team of 3people could inspect, on average, 80km of roads per day.
In 2010, EP started to use a Laser Profilometer that could measure the difference in surfaceheight in order to assess the ideal profile. This enabled EP to calculate internationallongitudinal indicators such as the International Roughness Index. Through 14 lasersensors, it is possible to obtain a real time image of the transversal profile of the road. It isalso possible to measure other parameters like the macro texture of the pavementssurface, longitudinal and transversal slopes and radius of curvature. In 2012, a tool to filmwith high definition images was included, improving the efficiency of operations with twopeople able to inspect more than 200km per day.
To evaluate the quality of the roads, an index that ranges between 0 and 5 is used, wherethe higher the value, the better the quality. The indicator’s ranges, classes and strategiesto adopt are described in following table.
Table 16: Quality Index used by EP
Index Class Strategy
Index<2.5 Bad Necessary to intervene
1.5≤Index<2.5 Mediocre Necessary to giveintervention priorities
2.5≤Index<3.5 ReasonableStable network,
interventions depend on thequality evolution
≥3.5 Good New Network, no need ofintervention
Source: "O Sistema de Gestão de Conservação de Pavimentos da Estradas de Portugal, S.A. - Balançode uma Implementação Consolidada".
For 2011, the average quality level was 2.82 and this level was kept constant, around 3,between 2007 and 2011. Following the completion of the evaluation, EP adopted aprocedure to define the priority interventions, which was based on two criteria:
the technical urgency and
the investment adequacy given the traffic in each road.
Each intervention is then ranked using a weight of 65% and 35% for each of these twocriteria respectively. Finally, the investment decision will follow this ranking of interventionsuntil the budget limit is reached for each year. This approach makes multiannual planningfor the road interventions easier. The figure below sets out the different techniques usedfor inspecting roads between 2009 and 2012, showing the smooth transition from visualinspections to using the perfilometer.
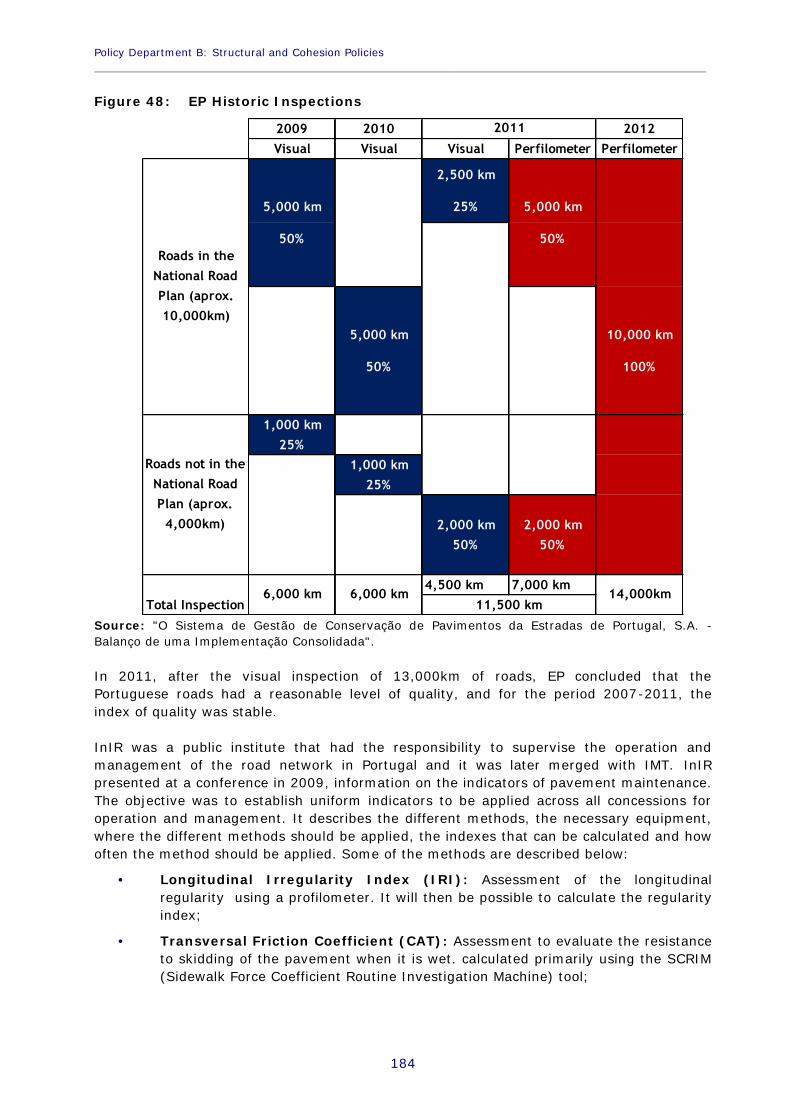
Policy Department B: Structural and Cohesion Policies____________________________________________________________________________________________
184
Figure 48: EP Historic Inspections
2009 2010 2012Visual Visual Visual Perfilometer Perfilometer
2,500 km
5,000 km 25% 5,000 km
50% 50%
5,000 km 10,000 km
50% 100%
1,000 km25%
1,000 km25%
2,000 km 2,000 km50% 50%
4,500 km 7,000 km
Roads not in theNational RoadPlan (aprox.
4,000km)
Roads in theNational RoadPlan (aprox.10,000km)
2011
Total Inspection14,000km6,000 km6,000 km
11,500 km
Source: "O Sistema de Gestão de Conservação de Pavimentos da Estradas de Portugal, S.A. -Balanço de uma Implementação Consolidada".
In 2011, after the visual inspection of 13,000km of roads, EP concluded that thePortuguese roads had a reasonable level of quality, and for the period 2007-2011, theindex of quality was stable.
InIR was a public institute that had the responsibility to supervise the operation andmanagement of the road network in Portugal and it was later merged with IMT. InIRpresented at a conference in 2009, information on the indicators of pavement maintenance.The objective was to establish uniform indicators to be applied across all concessions foroperation and management. It describes the different methods, the necessary equipment,where the different methods should be applied, the indexes that can be calculated and howoften the method should be applied. Some of the methods are described below:
Longitudinal Irregularity Index (IRI): Assessment of the longitudinalregularity using a profilometer. It will then be possible to calculate the regularityindex;
Transversal Friction Coefficient (CAT): Assessment to evaluate the resistanceto skidding of the pavement when it is wet. calculated primarily using the SCRIM(Sidewalk Force Coefficient Routine Investigation Machine) tool;

EU Road Surfaces: Economic and Safety Impact of the Lack of Regular Road Maintenance____________________________________________________________________________________________
185
Surface Texture Measurement: Assessment used to evaluate the skidresistance and the adherence of the tire and the pavement. Calculated using laserequipment such as MPD (Mean Profile Depth) or SMTD (Sensor Measure TextureDepth);
Transversal Regularity Measurement (CR): Assessment used to measure thetransversal regularity a using metallic ruler with 3000±3mm;
Freight Capacity Measurement: Used to assess the mechanic resistance of thepavement by using a Falling Weight Deflectometer;
Even though it is not clear if normalized techniques were applied in Portugal before thispresentation, it proved that there was awareness of the issue and the intention to use moreof these techniques. This work can be seen as a manual of the different techniques andhow they can be applied. EP is currently using a profilometer that is able to calculate theInternational Roughness Index (IRI).
8.5 Socio-economic Impacts of Road Maintenance
8.5.1 Communication with Road Users
EP offers road users road operational information on their website. It also has a call centreand an app with the information regarding road operation as well as access to the videocameras.
Figure 49: App images
Source: Google Play store.
Policy Department B: Structural and Cohesion Policies____________________________________________________________________________________________
186
In terms of communication with the users, Brisa has available on its website an app thatgives information in real time about traffic and maintenance works. Brisa O&M has a similarway to communicate with the users. Brisa is obliged to inform the users about long termroad works through the media, with some time in advance. The highways operated by Brisaalso have SOS stations. In terms of local authorities, Lisbon city council provides onlineinformation regarding the maintenance works that are being undertaken.
8.5.2 Other relevant studies
The road user association ACA-M has on its website a 2007 study42 where the differentaccident factors are analysed. The study explores the accident causes relating to thevehicle, the driver, the road and the environment. In terms of road conditions, the authorgives several examples about the sub-optimal design of roads and roadside signs. It alsoprovides examples of the lack of road maintenance. For the case of Lisbon, the authorclaimed that roads have in general a poor level of maintenance. Two examples are given,where manhole covers were responsible for accidents and damages in car suspensions andwhere the asphalt was very irregular.
8.5.3 Opinion from other stakeholders
The Associação dos Industriais da Construção Civil e Obras Públicas (AICCOPN, acronym forAssociation of the public power and civil construction industrials) considers that part of theroad network needs maintenance works urgently and they are concerned that the budgetcuts suffered recently through the austerity program may compromise the realization ofthese works43.
Even though the technology and the inspections to assess road quality aim to give anobjective evaluation, there were still different opinions. The Cities and Roads SafetyObservatory (OSEC) thinks that it is inappropriate to say visual inspections enable apositive evaluation of the road conditions parameters.44
8.6 Summary for Portugal
Budget cuts in Portugal have led to a decrease in road maintenance expenditure in recentyears. Data is somewhat contrasting in relation to maintenance expenditure as while OECDdata points to a fall in the period 2006-2010, the quality index calculated by EP for 2007-2011 seems to be stable, possibly showing that the full effects of the budget cuts have yetto be felt. There are a number of factors that can explain this, for example, an increase inconstruction of new roads, more efficient ways to maintain the roads or better decisions inallocation of resources. As mentioned above some stakeholders have questioned thevalidity of the EP quality evaluation.
Regarding the use of maintenance techniques, EP seems to be applying a consistentprogram since 2007, by introducing new technologies but also trying to make the resultsthat it extracts comparable. Laser inspections were introduced in 2011 and enable EP to dothe inspections more quickly and using less people. The results seem to have a greaterlevel of detail compared to visual inspections.
42 http://www.aca-m.org/w/images/3/3d/Factores_potenciadores_sinistralidade_rodoviaria.pdf43 http://www.aiccopn.pt/news.php?news_id=159144 http://www.tsf.pt/PaginaInicial/Portugal/Interior.aspx?content_id=1875574&page=-1
EU Road Surfaces: Economic and Safety Impact of the Lack of Regular Road Maintenance____________________________________________________________________________________________
187
Regarding the communication with the users, it seems that EP, highway concessionairesand local authorities communicate with the road users mainly through the internet or anapp. In several cases, real time information is provided. This can lead to improved trafficmanagement in the presence of road works for maintenance.
With respect to economic impacts, even though there is a limited amount of informationspecifically about Portugal, the study available on the ACA-M website explores the differentaccident causes, including the driver, the vehicle, the road and the environment. Theobjective of the study is to distinguish the causes and highlight several examples of badpractices for each of the car accidents causes. The author highlights two specific situationsrelated to road maintenance in Lisbon, where manhole covers have a negative impact onthe suspension of the car and where the asphalt is in bad condition. The study finds thatdifferent factors, including low expenditure in road maintenance, can cause accidents orhave a negative impact on the vehicles.

Policy Department B: Structural and Cohesion Policies____________________________________________________________________________________________
188
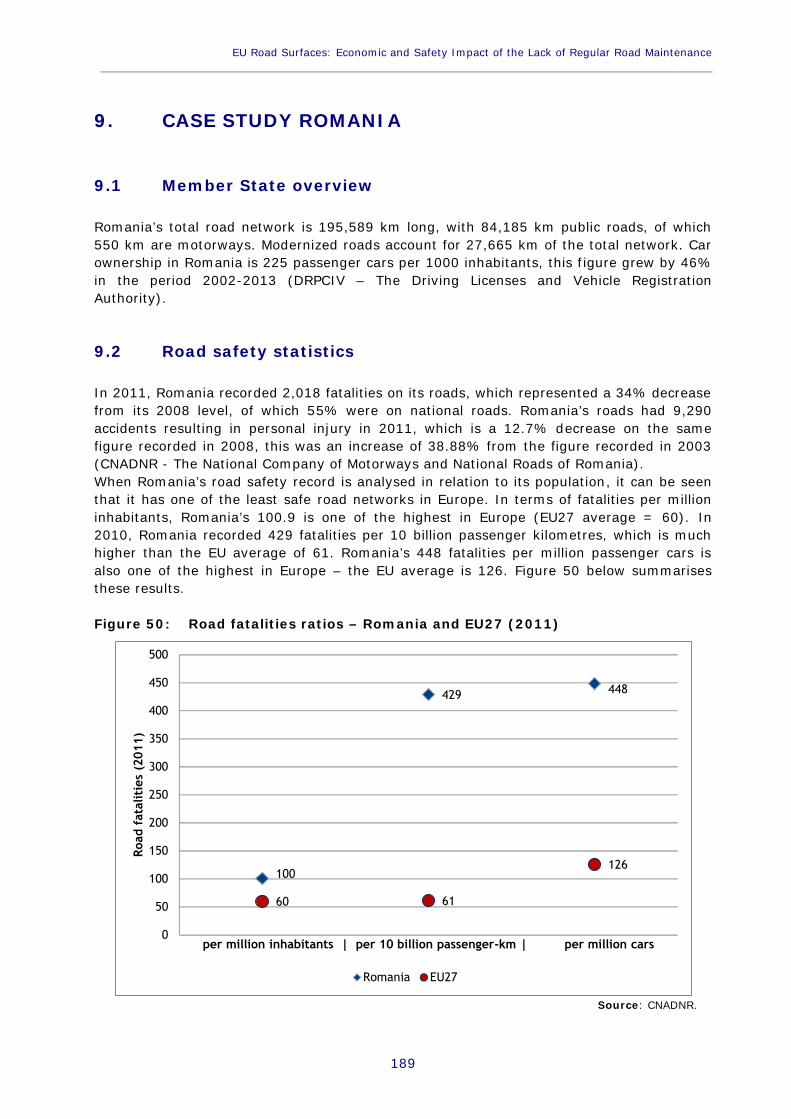
EU Road Surfaces: Economic and Safety Impact of the Lack of Regular Road Maintenance____________________________________________________________________________________________
189
9. CASE STUDY ROMANIA
9.1 Member State overview
Romania’s total road network is 195,589 km long, with 84,185 km public roads, of which550 km are motorways. Modernized roads account for 27,665 km of the total network. Carownership in Romania is 225 passenger cars per 1000 inhabitants, this figure grew by 46%in the period 2002-2013 (DRPCIV – The Driving Licenses and Vehicle RegistrationAuthority).
9.2 Road safety statistics
In 2011, Romania recorded 2,018 fatalities on its roads, which represented a 34% decreasefrom its 2008 level, of which 55% were on national roads. Romania’s roads had 9,290accidents resulting in personal injury in 2011, which is a 12.7% decrease on the samefigure recorded in 2008, this was an increase of 38.88% from the figure recorded in 2003(CNADNR - The National Company of Motorways and National Roads of Romania).When Romania’s road safety record is analysed in relation to its population, it can be seenthat it has one of the least safe road networks in Europe. In terms of fatalities per millioninhabitants, Romania’s 100.9 is one of the highest in Europe (EU27 average = 60). In2010, Romania recorded 429 fatalities per 10 billion passenger kilometres, which is muchhigher than the EU average of 61. Romania’s 448 fatalities per million passenger cars isalso one of the highest in Europe – the EU average is 126. Figure 50 below summarisesthese results.
Figure 50: Road fatalities ratios – Romania and EU27 (2011)
100
429 448
60 61
126
0
50
100
150
200
250
300
350
400
450
500
Road
fat
alit
ies
(201
1)
per million inhabitants | per 10 billion passenger-km | per million cars
Romania EU27
Source: CNADNR.

Policy Department B: Structural and Cohesion Policies____________________________________________________________________________________________
190
More than 95% of national roads are single carriageway roads, therefore driving involves alot of potentially dangerous overtaking. This increases the risk of accidents and makesdriving more aggressive.
The two main objectives of the Ministry of Transport are to rapidly increase the length ofthe motorways and to introduce more dual carriageway roads in order to increase safetyand reduce traffic congestion.
Romania currently has approximately 550 km of highway with another 84 km to be open totraffic in late 2013/early 2014. With increased focus on building new motorways there is arisk of a decrease in the maintenance budget, in proportion to the country’s needs.
Figure 51: Romania’s motorway network
Source: 130km.ro website.
Other Ministry of Transport actions for increasing road safety include:
Improving driver training;
Improving the legal framework and increasing efficiency in enforcement (less than50% of fines are paid).
The CNADNR has also started testing new safety strategies. One safety project on DN1,between Saftica and Balotesti, managed to reduce the accident rate by over 65% through:
Separating carriageways;
Remodelling intersection and altering the radius of curves;
Adding pedestrian refuge points at crossings.
OpenUnder ConstructionPlanned

EU Road Surfaces: Economic and Safety Impact of the Lack of Regular Road Maintenance____________________________________________________________________________________________
191
9.3 Maintenance budgets analysis
9.3.1 Road infrastructure and maintenance spending in Romania
Road infrastructure spending in Romania is highly dependent on central governmentfunding. There is a road tax for the National Roads network but there are no tolled roads.CNADNR, an Executive Agency of the Department of Infrastructure Projects and ForeignInvestment (DPIIS), is responsible for operating, maintaining and improving the NationalRoad Network in Romania. The National Road Network comprises 19.3% of the total publicroad network in Romania, but it serves 75% of all road traffic. The development andmaintenance of other roads is the responsibility of local authorities.Although the road maintenance budget increased by 78% between 2004 and 2008, thepercentage allocated to this budget from the GDP actually decreased by 23.7%
Figure 52: Total Spending on Roads, 2004-2008 (% of GDP)
Figure 53: Total Spending on Roads, 2004-2008 (Billion Euro)
Sources: World Bank estimates; CNADNR; Ziarul Financiar.

Policy Department B: Structural and Cohesion Policies____________________________________________________________________________________________
192
The national roads and motorways maintenance budget for the period 2008-2013 was9.26bn RON (€ 2.15bn), which is equivalent to around €360 mil. per annum (CNADNR).There are 41 counties in Romania, each has an average annual budget for roadmaintenance of about €4.5m amounting to a total of RON775m (€180m)45 per annum.Expenditure by local authorities covers between 30% and 40% of total road maintenancespending in Romania each year. Local authority spending is further split into expenditure onprincipal roads and on minor roads.
Figure 54: Share of road maintenance expenditure by road type
Sources: CNADNR; Local Councils.
9.3.2 Road investment finance
Until 1992, all road maintenance in Romania was paid for on the basis of the time takenand material consumed.
In 1995, with the strong support of the central economic agencies, the government createda Road Fund, initially fed by supplementary taxes on petrol, diesel fuel, and vehicleregistration, complemented later by annual fees on vehicle capacity. In 1997 this fundcollected US$250m (€227m)46, financing over 90% of road expenditures, which freedbudgetary resources for other purposes. Road finance is now based on user-related taxesthat aim to recover the cost of road use from vehicle owners and operators according to thecosts they impose on the road network.
Long-term relationships have been established with the international financial institutions,which have secured finance for road rehabilitation. This type of financial support has grownconsiderably in recent years, supporting the Romanian government’s efforts to provideoperational and maintenance expenditure on the national road network in conjunction withtax revenues.
45 Based on the January 2012 exchange rate : EUR/RON = 4.3146 Based on the first exchange rate from 1999 : EUR/USD = 1.1
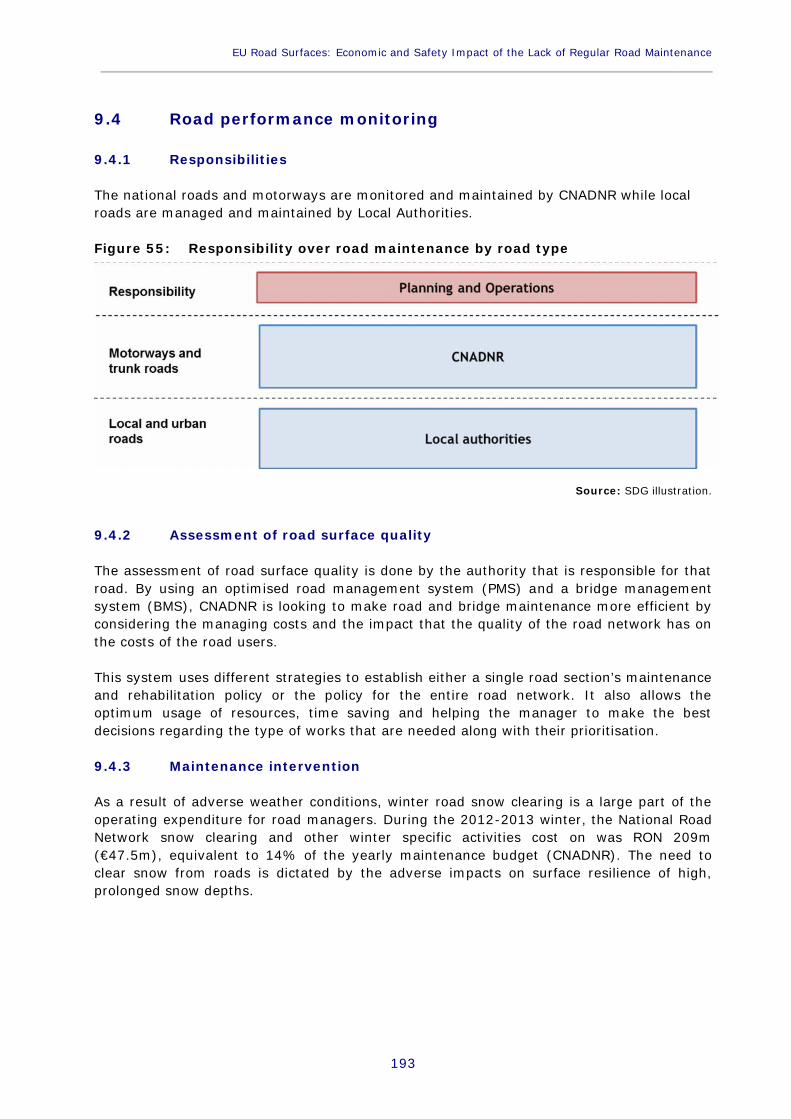
EU Road Surfaces: Economic and Safety Impact of the Lack of Regular Road Maintenance____________________________________________________________________________________________
193
9.4 Road performance monitoring
9.4.1 Responsibilities
The national roads and motorways are monitored and maintained by CNADNR while localroads are managed and maintained by Local Authorities.
Figure 55: Responsibility over road maintenance by road type
Source: SDG illustration.
9.4.2 Assessment of road surface quality
The assessment of road surface quality is done by the authority that is responsible for thatroad. By using an optimised road management system (PMS) and a bridge managementsystem (BMS), CNADNR is looking to make road and bridge maintenance more efficient byconsidering the managing costs and the impact that the quality of the road network has onthe costs of the road users.
This system uses different strategies to establish either a single road section’s maintenanceand rehabilitation policy or the policy for the entire road network. It also allows theoptimum usage of resources, time saving and helping the manager to make the bestdecisions regarding the type of works that are needed along with their prioritisation.
9.4.3 Maintenance intervention
As a result of adverse weather conditions, winter road snow clearing is a large part of theoperating expenditure for road managers. During the 2012-2013 winter, the National RoadNetwork snow clearing and other winter specific activities cost on was RON 209m(€47.5m), equivalent to 14% of the yearly maintenance budget (CNADNR). The need toclear snow from roads is dictated by the adverse impacts on surface resilience of high,prolonged snow depths.
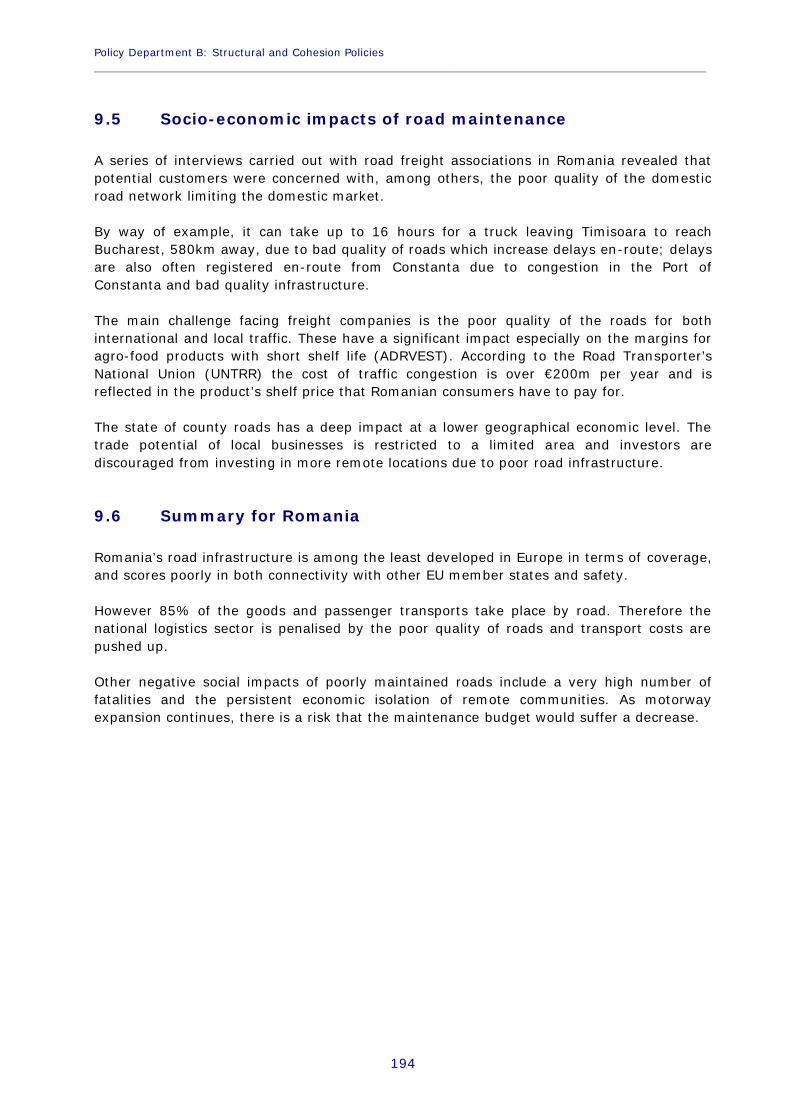
Policy Department B: Structural and Cohesion Policies____________________________________________________________________________________________
194
9.5 Socio-economic impacts of road maintenance
A series of interviews carried out with road freight associations in Romania revealed thatpotential customers were concerned with, among others, the poor quality of the domesticroad network limiting the domestic market.
By way of example, it can take up to 16 hours for a truck leaving Timisoara to reachBucharest, 580km away, due to bad quality of roads which increase delays en-route; delaysare also often registered en-route from Constanta due to congestion in the Port ofConstanta and bad quality infrastructure.
The main challenge facing freight companies is the poor quality of the roads for bothinternational and local traffic. These have a significant impact especially on the margins foragro-food products with short shelf life (ADRVEST). According to the Road Transporter’sNational Union (UNTRR) the cost of traffic congestion is over €200m per year and isreflected in the product’s shelf price that Romanian consumers have to pay for.
The state of county roads has a deep impact at a lower geographical economic level. Thetrade potential of local businesses is restricted to a limited area and investors arediscouraged from investing in more remote locations due to poor road infrastructure.
9.6 Summary for Romania
Romania’s road infrastructure is among the least developed in Europe in terms of coverage,and scores poorly in both connectivity with other EU member states and safety.
However 85% of the goods and passenger transports take place by road. Therefore thenational logistics sector is penalised by the poor quality of roads and transport costs arepushed up.
Other negative social impacts of poorly maintained roads include a very high number offatalities and the persistent economic isolation of remote communities. As motorwayexpansion continues, there is a risk that the maintenance budget would suffer a decrease.

EU Road Surfaces: Economic and Safety Impact of the Lack of Regular Road Maintenance____________________________________________________________________________________________
195
10. CASE STUDY SPAIN
10.1 Member State overview
Spain’s total road network is 150,000 km long, of which 15,000 km are motorways. Carownership in Spain is 482 passenger cars per 1000 inhabitants. This measure has seen asmall increase in the period 2001-2011; car ownership has increased by 8.8% in the sameperiod (Eurostat).
10.2 Road safety statistics
In 2011, Spain recorded 2,060 fatalities on its roads, which is a significant (63%) decreasefrom its 2001 level, indeed this is a greater percentage reduction in fatalities than mostother EU nations (only Latvia’s fatalities fell by a greater proportion over this period). WhenSpain’s road safety is evaluated in proportion to its population it also scores reasonablywell. In terms of fatalities per million inhabitants, Spain’s 45 is lower than the EU27average of 60. Spain recorded 60 fatalities per 10 billion passenger kilometres, which isclose to the EU average of 61, whilst its figure of 93 fatalities per million passenger cars ismarkedly less than the EU average of 126. Spain’s roads saw 83,000 accidents resulting inpersonal injury in 2011, which is a 17.3% decrease on the same figure recorded in 2001(Eurostat and OECD).
Figure 56: Road fatalities ratios – ES and EU27 (2011)
0
20
40
60
80
100
120
140
per millioninhabitants
per 10 billionpassenger-km
per million cars
Road
fata
litie
s (2
011)
ES EU27
Source: Eurostat.

Policy Department B: Structural and Cohesion Policies____________________________________________________________________________________________
196
10.3 Maintenance budgets analysis
10.3.1 Road infrastructure and maintenance spending in Spain
Road network management and operation in Spain is under the responsibility of theGeneral Direction for Roads (Dirección General de Carreteras), a section of the GeneralSecretary for Infrastructure (Secreteria General de Infrastrcuturas), that reports to theSecretary of State for Infrastructure, Transport and Housing (Secretaria de Estado deinfraestructura, transporte y vivienda). The whole structure is included in the Ministry ofDevelopment (Ministerio de Fomento). Management and maintenance are respectively theresponsibility of the General Branch for operations and network management (SubdirecciónGeneral de Explotación y Gestión de la Red) and the Branch for maintenance (Subdirecciónde Conservación).
The national authority is responsible for the operation of only 15.7% of the total roadnetwork in Spain. The rest of the network is operated by: Autonomous Communities(Comunidades Autónomas) 43,1%, and the Provincial Councils and Municipalities(Diputaciones y cabildos) 41.2%.
Figure 57: Share of Road network operational responsibility
Source: DGT (2012).
Road infrastructure spending in Spain is highly dependent on government funding.Expenditure is divided between the National Government and Local Authorities. As can beseen in the figure, the decrease in budget allocation for road network operations has beenparticularly significant at the national level in the past few years. National governmentallocation for road infrastructure went from €5,989 mil. in 2008 to €76 mil. in 2012. Theshare of expenditure by local authorities has thus increased, however severe cuts have alsobeen made to local budgets. This reduction partly reflects a return to “long-term” spendingpatterns after a construction boom in the past decade.
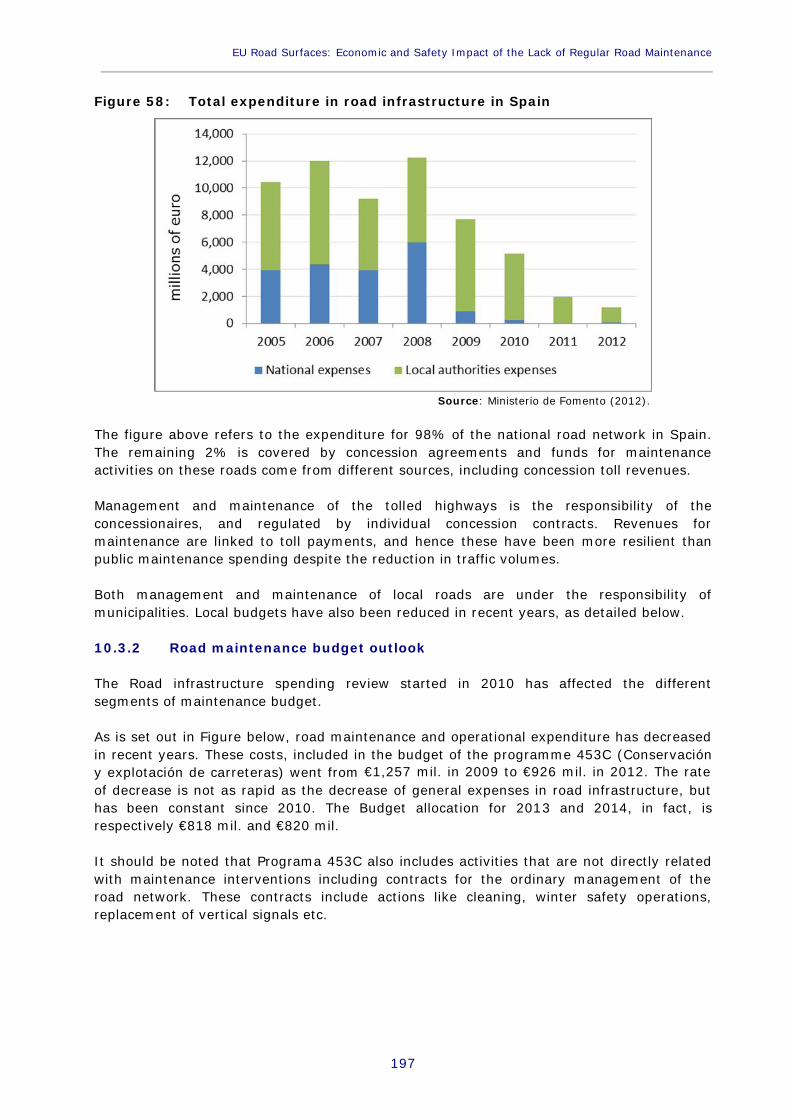
EU Road Surfaces: Economic and Safety Impact of the Lack of Regular Road Maintenance____________________________________________________________________________________________
197
Figure 58: Total expenditure in road infrastructure in Spain
Source: Ministerio de Fomento (2012).
The figure above refers to the expenditure for 98% of the national road network in Spain.The remaining 2% is covered by concession agreements and funds for maintenanceactivities on these roads come from different sources, including concession toll revenues.
Management and maintenance of the tolled highways is the responsibility of theconcessionaires, and regulated by individual concession contracts. Revenues formaintenance are linked to toll payments, and hence these have been more resilient thanpublic maintenance spending despite the reduction in traffic volumes.
Both management and maintenance of local roads are under the responsibility ofmunicipalities. Local budgets have also been reduced in recent years, as detailed below.
10.3.2 Road maintenance budget outlook
The Road infrastructure spending review started in 2010 has affected the differentsegments of maintenance budget.
As is set out in Figure below, road maintenance and operational expenditure has decreasedin recent years. These costs, included in the budget of the programme 453C (Conservacióny explotación de carreteras) went from €1,257 mil. in 2009 to €926 mil. in 2012. The rateof decrease is not as rapid as the decrease of general expenses in road infrastructure, buthas been constant since 2010. The Budget allocation for 2013 and 2014, in fact, isrespectively €818 mil. and €820 mil.
It should be noted that Programa 453C also includes activities that are not directly relatedwith maintenance interventions including contracts for the ordinary management of theroad network. These contracts include actions like cleaning, winter safety operations,replacement of vertical signals etc.

Policy Department B: Structural and Cohesion Policies____________________________________________________________________________________________
198
Figure 59: Evolution of Maintenance and operation expenses (Programa 453C)
Source: Val Melús (2010), Ministerio de Fomento (2012).
The effect of a falling budget allocation for road network operations is particularly evidentwhen looking at pavement rehabilitation. For instance, the budget for Project clave 32,dedicated to pavement rehabilitation, went from almost €560 mil. in 2008 to only €37 mil.in 2010. Even more alarming is the fact that in 2011 and 2012 no investments were madein this area. The last tender for Project clave 32 was launched in 2013 (more than 900 daysafter the previous one in 2010) for the amount of only €11 mil.
Figure 60: Evolution of pavement rehabilitation costs (Proyecto clave 32)
Source: Val Melús (2010), SEPG (2012, 2013).
The data above refers to the 165,000 km of National Roads. In addition to these, in Spainthere are almost 500,000 km of local roads under the responsibility of the Municipalauthorities: 128,180 km of urban roads and 361,517 km of extra-urban roads. There is noclear information regarding the exact investment by single municipalities in order tomaintain this network, although the figures on asphalt production give an indication of thetrends.

EU Road Surfaces: Economic and Safety Impact of the Lack of Regular Road Maintenance____________________________________________________________________________________________
199
Figure 61: Evolution of total production of hot mix asphalt (million tonnes)
Source: EAPA (2012).
This data should be read bearing in mind that:
In Spain road transportation is, by far, the main mode transportation: 89.5% ofpassenger journeys and 83.9% of goods transport occur on roads.
The Spanish Highway network has grown by 249% in the past 20 years, from4,496 Km in 1993 to 11,676 in 2013.
These two factors could mean that in the near future, in order to maintain the Spanish roadnetwork, the Government would be required to invest even more than in the first half ofthe decade 2000.
10.4 Road performance monitoring
10.4.1 Responsibilities for road maintenance
As set out above, the National Government is responsible for the overall state of the entirenational Road network, but, as can be seen in Figure 62, the operational management andmaintenance is shared with local authorities. Only tolled highways remain almost entirelyunder the direct responsibility of central government, but in this case the management andmaintenance activities are carried out by the concessionaires. The 500,000 km of the localroad network is instead entirely the responsibility of Municipalities.
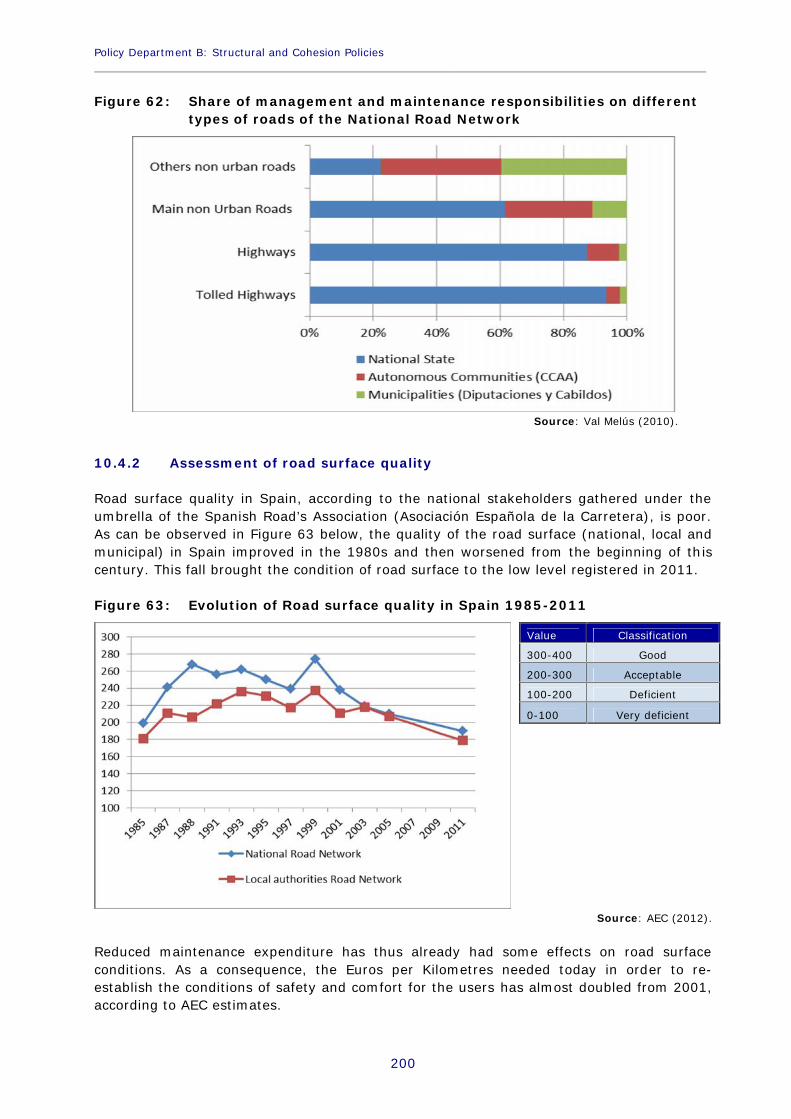
Policy Department B: Structural and Cohesion Policies____________________________________________________________________________________________
200
Figure 62: Share of management and maintenance responsibilities on differenttypes of roads of the National Road Network
Source: Val Melús (2010).
10.4.2 Assessment of road surface quality
Road surface quality in Spain, according to the national stakeholders gathered under theumbrella of the Spanish Road’s Association (Asociación Española de la Carretera), is poor.As can be observed in Figure 63 below, the quality of the road surface (national, local andmunicipal) in Spain improved in the 1980s and then worsened from the beginning of thiscentury. This fall brought the condition of road surface to the low level registered in 2011.
Figure 63: Evolution of Road surface quality in Spain 1985-2011
Source: AEC (2012).
Reduced maintenance expenditure has thus already had some effects on road surfaceconditions. As a consequence, the Euros per Kilometres needed today in order to re-establish the conditions of safety and comfort for the users has almost doubled from 2001,according to AEC estimates.
Value Classification
300-400 Good
200-300 Acceptable
100-200 Deficient
0-100 Very deficient
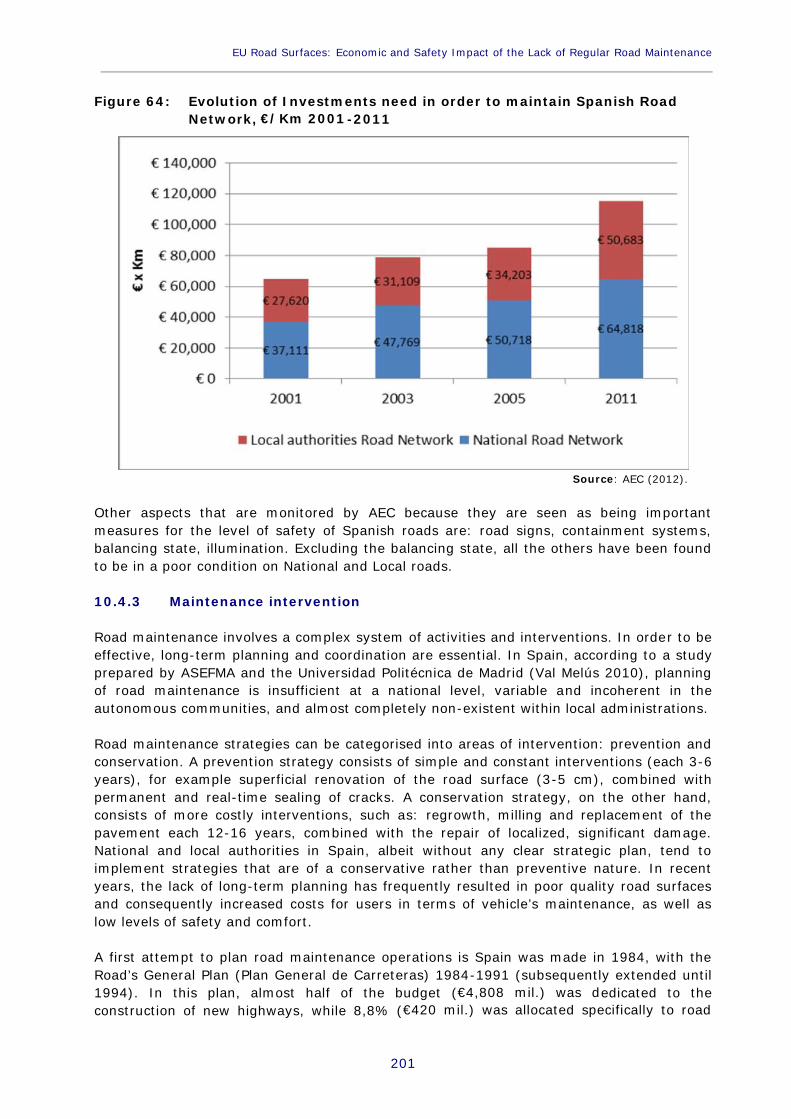
EU Road Surfaces: Economic and Safety Impact of the Lack of Regular Road Maintenance____________________________________________________________________________________________
201
Figure 64: Evolution of Investments need in order to maintain Spanish RoadNetwork, €/Km 2001-2011
Source: AEC (2012).
Other aspects that are monitored by AEC because they are seen as being importantmeasures for the level of safety of Spanish roads are: road signs, containment systems,balancing state, illumination. Excluding the balancing state, all the others have been foundto be in a poor condition on National and Local roads.
10.4.3 Maintenance intervention
Road maintenance involves a complex system of activities and interventions. In order to beeffective, long-term planning and coordination are essential. In Spain, according to a studyprepared by ASEFMA and the Universidad Politécnica de Madrid (Val Melús 2010), planningof road maintenance is insufficient at a national level, variable and incoherent in theautonomous communities, and almost completely non-existent within local administrations.
Road maintenance strategies can be categorised into areas of intervention: prevention andconservation. A prevention strategy consists of simple and constant interventions (each 3-6years), for example superficial renovation of the road surface (3-5 cm), combined withpermanent and real-time sealing of cracks. A conservation strategy, on the other hand,consists of more costly interventions, such as: regrowth, milling and replacement of thepavement each 12-16 years, combined with the repair of localized, significant damage.National and local authorities in Spain, albeit without any clear strategic plan, tend toimplement strategies that are of a conservative rather than preventive nature. In recentyears, the lack of long-term planning has frequently resulted in poor quality road surfacesand consequently increased costs for users in terms of vehicle’s maintenance, as well aslow levels of safety and comfort.
A first attempt to plan road maintenance operations is Spain was made in 1984, with theRoad’s General Plan (Plan General de Carreteras) 1984-1991 (subsequently extended until1994). In this plan, almost half of the budget (€4,808 mil.) was dedicated to theconstruction of new highways, while 8,8% (€420 mil.) was allocated specifically to road

Policy Department B: Structural and Cohesion Policies____________________________________________________________________________________________
202
pavement maintenance (50% of the total budget for road maintenance). The Plan Generalde Carreteras then allocated 6,321 €/Km for surface maintenance which became 5,126€/Km because of increased expenditures on highways.
In the following plan, the Infrastructure Directive Plan (Plan Director de Infrastructure) for1993-2007, road maintenance gained additional focus, as one of the eight priorities of theplan. The total budget allocation for road maintenance was €681m per year, while 10,284€/Km was dedicated to surface maintenance (assuming 50% of the total road maintenancebudget assigned to this sector) – almost the double amount of that allocated in the PlanGeneral de Carreteras 1984-1991. Nevertheless, political alternation had a negativeinfluence on road maintenance investments. In fact, after the political election of 1996 andthe relative change in the government team, the Plan Director de Infrastructure remainedonly on paper. Between 1996 and 2000 the new government decided to focus its efforts onthe telecommunications sector, reserving few investment opportunities to the Roadinfrastructure.
The successive plan was completed in 2004: The Strategic Plan for Infrastructures andTransportation (Plan Estratégico de Infraestructuras y Transporte – PEIT) 2005-2020. ThePIET, even though it mainly conforms to a conservative strategy, sets an important goal for2012: to link the annual investment for road maintenance to the National Road Networkasset value (estimated to €170,875 mil.) planning to spend 2% of the National RoadNetwork asset value in road maintenance per annum. The PIET forecast a level ofexpenditure on road surfacing of 19,520 €/Km. It should be noted, however, as shownpreviously in Figure 58, that although the budget allocation for road maintenance grewbetween 2005 and 2009, it never reached 1% of the National Road Network asset value.Moreover, road maintenance expenditure started decreasing from 2010, and is expected tobe €820 mil. for 2014.
These budgetary fluctuation, according to ASEFMA, have led to both a reduction in thecondition of the road surface and a reduction in innovation on the part of nationalcompanies operating in the sector.
10.5 Socio-economic impacts of road maintenance
As has been stated in previous studies, the most influential factor behind road safety isdriver behaviour. Excessive speed, alcohol, distraction, and lack of respect for the highwaycode are the main causes of accidents. Nevertheless, in some cases the conditions of theroad infrastructure is also a significant factor. The two infrastructure parameters that havea direct impact of safety are: i.) the friction coefficient of the pavement, and ii.) theregularity of the surface. An irregular road surface caused by a lack of road maintenancecan increase the risk for accidents mostly when it occurs in spot locations.
As can be observed in Figure 65, the number of accidents causing fatalities on Spanish non-urban roads between 2003 and 2012 has been decreasing by an average of 3% per annum.This fall in accidents may be due to an improvement in the quality of roads, but is also dueto the fall in traffic on Spanish roads after 2007.

EU Road Surfaces: Economic and Safety Impact of the Lack of Regular Road Maintenance____________________________________________________________________________________________
203
Figure 65: Evolution of number of accident with deaths on Spanish extra-urbanroads 2003 – 2012
Source: AEC (2012).
Road surfacing may also have direct and indirect economic impacts on transportation costs.According to a study prepared by the Institute of Transportation and CommunicationStudies (Instituto de Estudios de Transportes y Comunicaciones) on the Spanish roadnetwork, a moderately deficient road surface can accelerate the fuel consumption of lightvehicles by 34% (12% for heavy vehicles), further causing an increase in their CO2emissions. According to the same research, a poorly preserved road surface can alsoincrease the maintenance costs of vehicles by 185% for light vehicles and by 129% forheavy vehicles. Finally, a poorly maintained road surface can lead to a reduction in the totallife of tyres of about 66% for light vehicles and 10% for heavy vehicles.
10.6 Summary for Spain
In Spain, road maintenance and operational expenditure decreased significantly in the lastyears with an acceleration after the 2008 economic crisis. The spending review has beenparticularly notable in pavement rehabilitation as the budget allocated went from almost€560 mil. in 2008 to only €37 mil. in 2010. An example of the impact of such a policy is thefact that between the summer of 2010 and the spring of 2013 no investments were madein this area.
In addition to this, planning and implementation of road maintenance interventions havebeen fluctuant and often fragmented. Thus national companies operating in the sector havereceived few stimulus to invest in innovation and development of new techniques.
Road surface quality in Spain is poor and it is decreasing from the beginning of the century.According to the stakeholders gathered under the umbrella of the Spanish Road’sAssociation, the quality of the road surface in 2011 is the same registered in 1985 and theneeded investments grew: the Euros per Kilometres needed today in order to re-establishthe conditions of safety and comfort for the users of Spanish road network has almostdoubled from 2001.

Policy Department B: Structural and Cohesion Policies____________________________________________________________________________________________
204

EU Road Surfaces: Economic and Safety Impact of the Lack of Regular Road Maintenance____________________________________________________________________________________________
205
11. CASE STUDY GREAT BRITAIN
11.1 Member State overview
The UK’s total road network is 416,000 km long, of which 3,700 km are motorways.Municipal roads account for 344,000 km of the total network. Car ownership in the UK iscurrently at 466 passenger cars per 1000 inhabitants, this figure grew by 7.0% in theperiod 2001-2011 (Eurostat).
11.2 Road safety statistics
In 2011, the UK recorded 1,960 fatalities on its roads, which represented a 46% decreasefrom its 2001 level. The UK’s roads had 157,100 accidents resulting in personal injury in2011, which is a 34% decrease on the same figure recorded in 2001 (Eurostat and OECD).
When the UK’s road safety record is analysed in relation to its population it can be seenthat it has one of the safest road networks in Europe. In terms of fatalities per millioninhabitants, the UK’s 31 is the lowest in Europe (EU27 average = 60). The UK recorded 30fatalities per 10 billion passenger kilometres, which is much lower than the EU average of61, and only bettered by Sweden. The UK’s score of 67 fatalities per million passenger carsis also the lowest in Europe – the EU average is 126. Figure 66 below summarises theseresults.
Figure 66: Road fatalities ratios – UK and EU27 (2011)
31 30
6760 61
126
-
20
40
60
80
100
120
140
per million inhabitants per 10 billion passenger-km per million cars
Road
fata
litie
s (2
011)
UK EU27
Source: Eurostat.
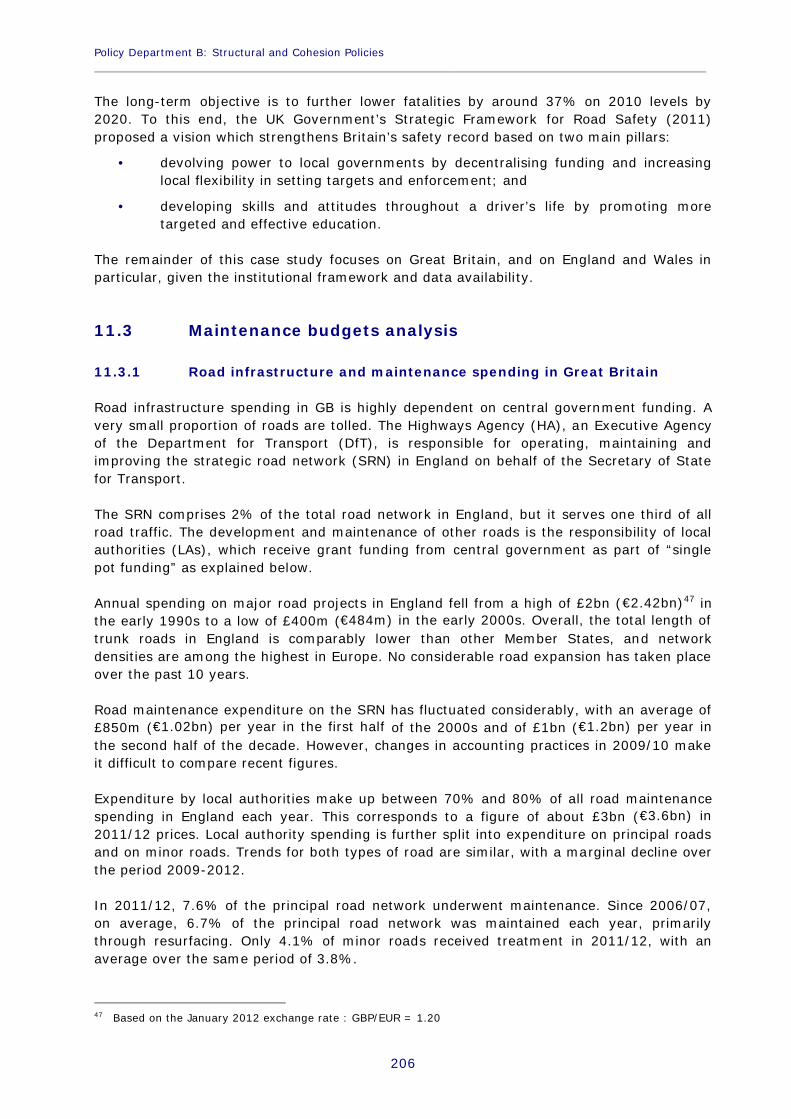
Policy Department B: Structural and Cohesion Policies____________________________________________________________________________________________
206
The long-term objective is to further lower fatalities by around 37% on 2010 levels by2020. To this end, the UK Government’s Strategic Framework for Road Safety (2011)proposed a vision which strengthens Britain’s safety record based on two main pillars:
devolving power to local governments by decentralising funding and increasinglocal flexibility in setting targets and enforcement; and
developing skills and attitudes throughout a driver’s life by promoting moretargeted and effective education.
The remainder of this case study focuses on Great Britain, and on England and Wales inparticular, given the institutional framework and data availability.
11.3 Maintenance budgets analysis
11.3.1 Road infrastructure and maintenance spending in Great Britain
Road infrastructure spending in GB is highly dependent on central government funding. Avery small proportion of roads are tolled. The Highways Agency (HA), an Executive Agencyof the Department for Transport (DfT), is responsible for operating, maintaining andimproving the strategic road network (SRN) in England on behalf of the Secretary of Statefor Transport.
The SRN comprises 2% of the total road network in England, but it serves one third of allroad traffic. The development and maintenance of other roads is the responsibility of localauthorities (LAs), which receive grant funding from central government as part of “singlepot funding” as explained below.
Annual spending on major road projects in England fell from a high of £2bn (€2.42bn)47 inthe early 1990s to a low of £400m (€484m) in the early 2000s. Overall, the total length oftrunk roads in England is comparably lower than other Member States, and networkdensities are among the highest in Europe. No considerable road expansion has taken placeover the past 10 years.
Road maintenance expenditure on the SRN has fluctuated considerably, with an average of£850m (€1.02bn) per year in the first half of the 2000s and of £1bn (€1.2bn) per year inthe second half of the decade. However, changes in accounting practices in 2009/10 makeit difficult to compare recent figures.
Expenditure by local authorities make up between 70% and 80% of all road maintenancespending in England each year. This corresponds to a figure of about £3bn (€3.6bn) in2011/12 prices. Local authority spending is further split into expenditure on principal roadsand on minor roads. Trends for both types of road are similar, with a marginal decline overthe period 2009-2012.
In 2011/12, 7.6% of the principal road network underwent maintenance. Since 2006/07,on average, 6.7% of the principal road network was maintained each year, primarilythrough resurfacing. Only 4.1% of minor roads received treatment in 2011/12, with anaverage over the same period of 3.8%.
47 Based on the January 2012 exchange rate : GBP/EUR = 1.20
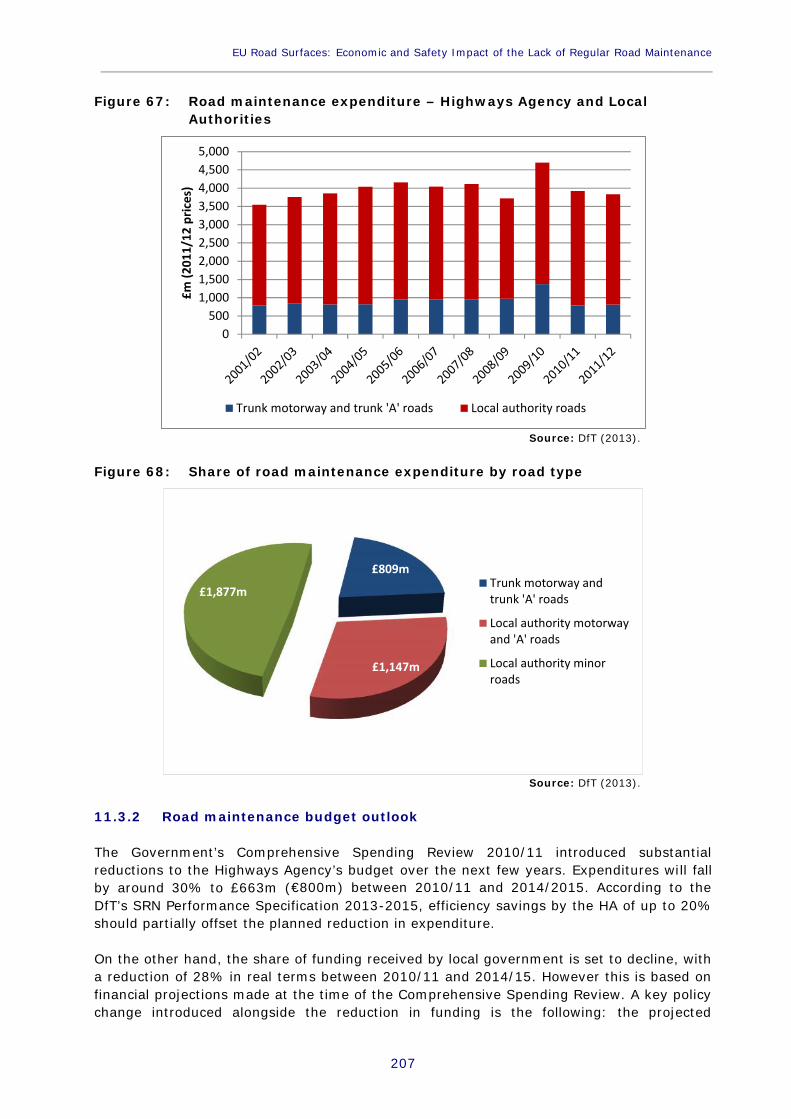
EU Road Surfaces: Economic and Safety Impact of the Lack of Regular Road Maintenance____________________________________________________________________________________________
207
Figure 67: Road maintenance expenditure – Highways Agency and LocalAuthorities
0500
1,0001,5002,0002,5003,0003,5004,0004,5005,000
£m (2
011/
12 p
rices
)
Trunk motorway and trunk 'A' roads Local authority roads
Source: DfT (2013).
Figure 68: Share of road maintenance expenditure by road type
£809m
£1,147m
£1,877mTrunk motorway andtrunk 'A' roads
Local authority motorwayand 'A' roads
Local authority minorroads
Source: DfT (2013).
11.3.2 Road maintenance budget outlook
The Government’s Comprehensive Spending Review 2010/11 introduced substantialreductions to the Highways Agency’s budget over the next few years. Expenditures will fallby around 30% to £663m (€800m) between 2010/11 and 2014/2015. According to theDfT’s SRN Performance Specification 2013-2015, efficiency savings by the HA of up to 20%should partially offset the planned reduction in expenditure.
On the other hand, the share of funding received by local government is set to decline, witha reduction of 28% in real terms between 2010/11 and 2014/15. However this is based onfinancial projections made at the time of the Comprehensive Spending Review. A key policychange introduced alongside the reduction in funding is the following: the projected
Policy Department B: Structural and Cohesion Policies____________________________________________________________________________________________
208
maintenance budget is to be “pooled” in a wider single pot of local government fundingwhich is allocated to local authorities, thus with no assurance that it will be spent on roadmaintenance.
Given the projected decrease in total local government funding to 2019/20, the LocalGovernment Association has assessed funding prospects for LAs and concluded that amulti-billion pound funding gap will materialise in 2019/20. Budgets will be under pressurefrom growing spending trends in social care and environmental services. Based on theseprojections, the RAC Foundation has estimated that the proportion of spending on transportand roads by local authorities will decrease from 7% to 4% of the total, at around £2.3bn(€2.8bn) in 2019/2020.
The DfT recognises the key challenges that local authorities are facing in maintaining theroad network, given the series of extreme weather events in recent years and growingenergy prices, which constitute a high share of maintenance costs. Some efficiency gainsare envisaged as the 153 bodies currently managing local roads could adopt a morecoordinated approach to procurement and construction (Action for Roads, 2013). From2014/15, funding certainty will be enhanced as 5-year budgets will be introduced, asopposed to 2-year budgets currently.
However the ALARM Survey 2012-2013 reported that 94% of English authorities foreseehaving to make cuts to their highway maintenance service, and over 90% of authorities inLondon and Wales foresee staff reductions and reduced service delivery.
11.4 Road performance monitoring
11.4.1 Responsibilities for road maintenance
As explained, different bodies are responsible for road maintenance in GB. The HighwaysAgency (HA) is charged with the planning and operation of the strategic road network. Itpublishes an annual report setting out spending plans and road quality. Between 1998 and2009, the responsibility for maintenance was devolved further to local authorities throughthe “detrunking programme”. As such, local authorities have been increasingly tasked withthe maintenance of the remaining parts of the network. Scotland and Wales also havedevolved oversight powers over their respective infrastructure.

EU Road Surfaces: Economic and Safety Impact of the Lack of Regular Road Maintenance____________________________________________________________________________________________
209
Figure 69: Responsibility over road maintenance by road type
Source: SDG illustration.
The HA negotiates and earmarks funding for road maintenance two years in advance,based on a review of road pavement conditions monitored through performance indicators.Structural maintenance works are tendered out, usually on the basis of Performance BasedContracts, to private contractors. These contracts define the principles and the objectives ofthe work to be carried out, and payment is conditional upon satisfying them. More than90% of the HA’s expenditure is spent through contracts with the supply chain.
In 2011, the first of the new “asset support contracts” was awarded in the South West.More of these contracts will be used to drive service providers to deliver an agreed level ofservice on the network, while providing best value. A percentage ‘year on year’ reduction incost is mandated within the contract. ‘Continual improvement and innovations’ clauses alsoencourage the service provider to seek efficiencies and reduce costs over the duration ofthe contract.
11.4.2 Assessment of road surface quality
The Department for Transport and the Highways Agency have developed a Road ConditionIndicator (RCI) to monitor road surface quality. The indicator is based on a set of indicatorswhich are collected annually using road scanning technologies. In particular, the equipmentthat carries out the assessment on local roads is called SCANNER (Surface ConditionAssessment for the National Network of Roads) the equipment used for trunk roads isknown as TRACS (Traffic-speed Condition Survey).
The parameters recorded by SCANNER and TRACS are the following:
Rut depth
Evenness of the road (longitudinal profile)
Texture of the road surface
Cracking of the road surface
These parameters are weighted to obtain the RCI for each section of road (10 metres)analysed. The RCI can vary between 0 and 315. Any values above 100 indicate that roadconditions are below the required levels and are likely to require maintenance within thenext year.

Policy Department B: Structural and Cohesion Policies____________________________________________________________________________________________
210
The overall index of road conditions for England is the Highway Condition Index (HCI)which is derived by grouping together all the RCIs. It is indexed to 2006/07 at 100. If theindex goes up, it means there has been an increase, on average, of the condition of theroad network across the country.
11.4.3 Maintenance intervention
Maintenance intervention in England is scheduled based on the findings of the monitoringactivities. This approach ensures that sections with the worst scores are prioritised givenlimited funding. This also allows for the appropriate planning of expenditure as themonitoring provides a clear indication of the roads in need of maintenance in the nearfuture.
The latest statistical bulletin (2009/2010) stated that only 6% of the classified roadnetwork was in poor condition. This is consistent with the figures showing the percentage ofthe network which received maintenance in the following years, which is around 6-7% ofthe total. The percentage of national trunk roads requiring further investigation (i.e.reputed to be in poor conditions) was only about 3-4% for motorways and A roads (DfT2013).
The survey of local authorities (ALARM 2012) carried out by the asphalt industry suggeststhat 19% of English roads (excluding London), and 27% of London roads were consideredto be in poor condition according to local road managers. This appears to show a trend ofdeclining quality, which contrasts with the trend of improving quality at the national level.The historical trends analysed by Bayliss (2012) indicate that the reduction in local roadmaintenance spending in 2010 was significant (-9.5% year on year).
Table 17: Average length of time (years) before roads are resurfaced
Type of road England London Wales Urban Rural
Principal roads 31 21 48 24 20
Non principalroads 59 28 97 34 31
All roads classes 58 32 72 40 45
Source: ALARM Survey (2013).
While routine maintenance follows the practices described above, reactive maintenance ishighly dependent on contingent events. With the severe weather events experienced acrossBritain in recent years, including severe flooding and below average winter temperatures,local authorities have requested further support from central government. By way of anexample, the average cost of flood damage in 2012 was almost £4m (€4.8m) per localauthority but only £300m (€360) was provided by central government between 2011 and2012 to cope with the additional cost resulting from this damage.
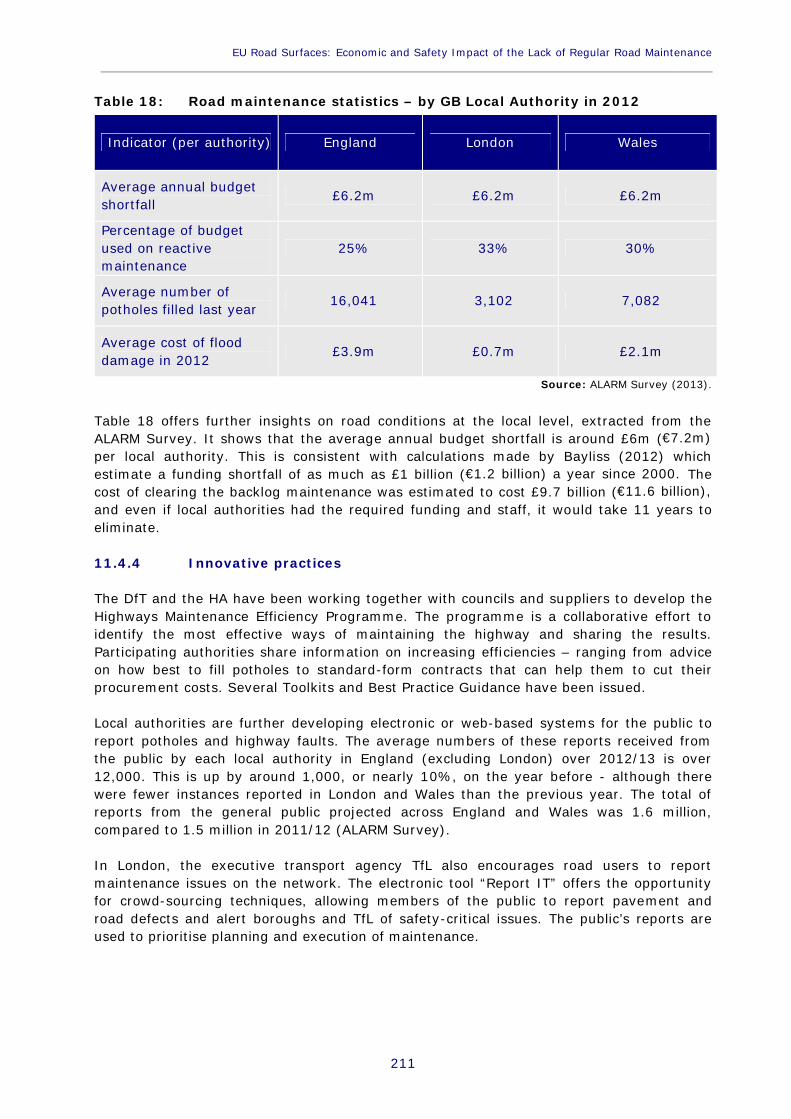
EU Road Surfaces: Economic and Safety Impact of the Lack of Regular Road Maintenance____________________________________________________________________________________________
211
Table 18: Road maintenance statistics – by GB Local Authority in 2012
Indicator (per authority) England London Wales
Average annual budgetshortfall £6.2m £6.2m £6.2m
Percentage of budgetused on reactivemaintenance
25% 33% 30%
Average number ofpotholes filled last year 16,041 3,102 7,082
Average cost of flooddamage in 2012 £3.9m £0.7m £2.1m
Source: ALARM Survey (2013).
Table 18 offers further insights on road conditions at the local level, extracted from theALARM Survey. It shows that the average annual budget shortfall is around £6m (€7.2m)per local authority. This is consistent with calculations made by Bayliss (2012) whichestimate a funding shortfall of as much as £1 billion (€1.2 billion) a year since 2000. Thecost of clearing the backlog maintenance was estimated to cost £9.7 billion (€11.6 billion),and even if local authorities had the required funding and staff, it would take 11 years toeliminate.
11.4.4 Innovative practices
The DfT and the HA have been working together with councils and suppliers to develop theHighways Maintenance Efficiency Programme. The programme is a collaborative effort toidentify the most effective ways of maintaining the highway and sharing the results.Participating authorities share information on increasing efficiencies – ranging from adviceon how best to fill potholes to standard-form contracts that can help them to cut theirprocurement costs. Several Toolkits and Best Practice Guidance have been issued.
Local authorities are further developing electronic or web-based systems for the public toreport potholes and highway faults. The average numbers of these reports received fromthe public by each local authority in England (excluding London) over 2012/13 is over12,000. This is up by around 1,000, or nearly 10%, on the year before - although therewere fewer instances reported in London and Wales than the previous year. The total ofreports from the general public projected across England and Wales was 1.6 million,compared to 1.5 million in 2011/12 (ALARM Survey).
In London, the executive transport agency TfL also encourages road users to reportmaintenance issues on the network. The electronic tool “Report IT” offers the opportunityfor crowd-sourcing techniques, allowing members of the public to report pavement androad defects and alert boroughs and TfL of safety-critical issues. The public’s reports areused to prioritise planning and execution of maintenance.

Policy Department B: Structural and Cohesion Policies____________________________________________________________________________________________
212
11.5 Socio-economic impacts of road maintenance
Stakeholders in Britain place great importance on the quality of the road network in relationto its impacts on economic growth and trade, road safety and its wider budgetaryimplications.
11.5.1 Wider economic impacts
According to a survey by the Manufacturers’ Association, the state of British roads, fromthe high levels of congestion on key arteries to the poor maintenance of many local roads,“is adversely impacting manufacturing on a number of core business activities. Three-quarters of manufacturers cite it as a barrier to sending and receiving products and rawmaterials”. The Association explains that “more than 60% see it as an impediment torecruiting and sustaining relationships with customers and suppliers. The majority ofmanufacturers are experiencing significantly increased operating costs and nearly a third aloss of productivity as a result of sub-optimal road quality” (EEF 2012).
Quoting a study by Parkman and others (2013), the RAC Foundation has highlighted theoverall disbenefit to society of reducing road maintenance expenditure on the Scottish roadnetwork. The quantitative analyses show “that for every £1 reduction in road maintenance,there is a cost of £1.50 to the wider economy. If figures were available to quantify aspectsnot currently included in the quantitative analyses, it is expected that these would onlyenhance the conclusion”. Among the impacts of poor maintenance on the economy, theauthors list the following:
negative impacts of any increase in road closures due to unforeseen events;
costs of delaying major repair work on significant structures leading to closures;
weight restrictions or more extensive maintenance work;
wider economic disbenefits such as reduced tourism or local economic activity.
A survey of Small and Medium Enterprises in England and Wales carried out by the AsphaltIndustry Association (2010) found that 68% of SMEs consider road maintenance veryimportant for the success of their business, while 44% of businesses thought that localroads were not very well maintained. When asked to point to the main business costsarising from poor maintenance, SMEs indicated the following: negative productivity impactsin terms of time wasted, as well as lost competitiveness from higher vehicle operating costsand fuel consumption. The survey further attempts to estimate the average cost of poormaintenance per business, resulting in £13,600 per year (€16,300).
The general public expresses similar concerns to those of businesses. In 2012, the NationalHighways & Transport Survey (NHT Survey) found that “61% of residents in England weredissatisfied with the condition of local roads. Only 27% were satisfied with the condition ofthis asset, giving a net satisfaction rating of minus 34%, much worse than for the yearsthat preceded the recent hard winters” (NHT Survey, 2012). In the 2013 RAC Report onMotoring, respondents were asked about the “issues that most concern motorists”.Condition/maintenance of UK roads was equal second in importance, after the cost of fuelfor running a car (RAC 2013).
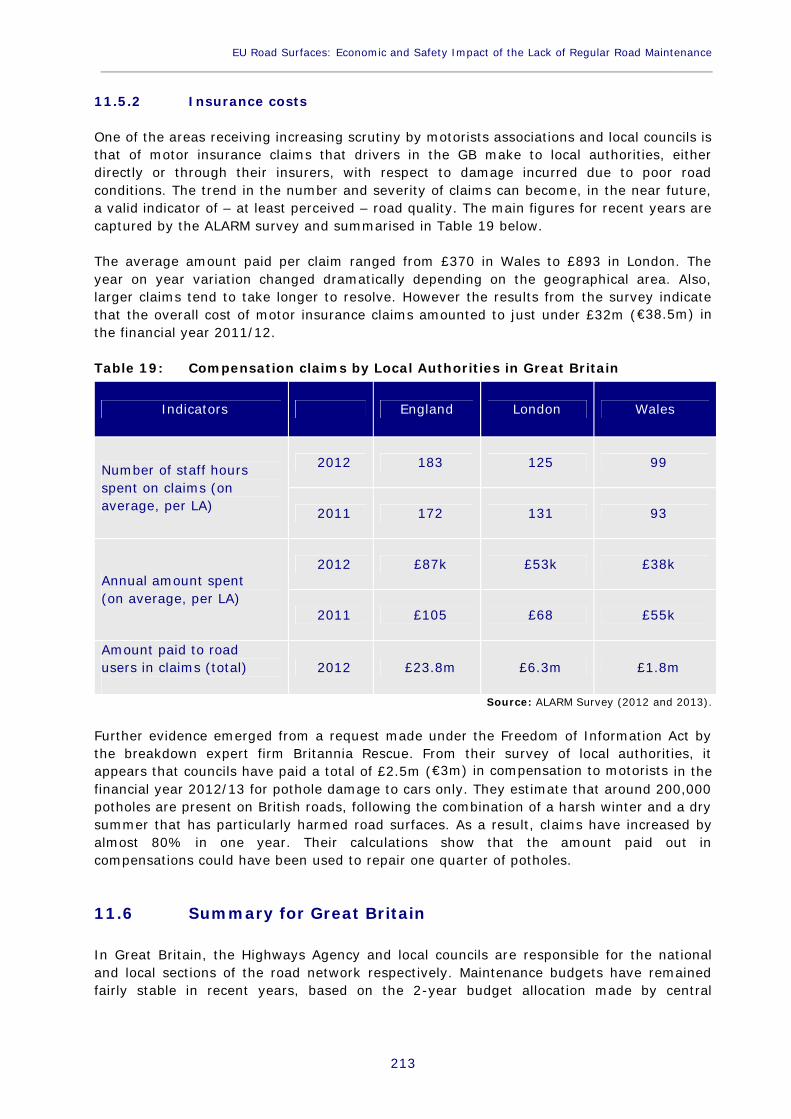
EU Road Surfaces: Economic and Safety Impact of the Lack of Regular Road Maintenance____________________________________________________________________________________________
213
11.5.2 Insurance costs
One of the areas receiving increasing scrutiny by motorists associations and local councils isthat of motor insurance claims that drivers in the GB make to local authorities, eitherdirectly or through their insurers, with respect to damage incurred due to poor roadconditions. The trend in the number and severity of claims can become, in the near future,a valid indicator of – at least perceived – road quality. The main figures for recent years arecaptured by the ALARM survey and summarised in Table 19 below.
The average amount paid per claim ranged from £370 in Wales to £893 in London. Theyear on year variation changed dramatically depending on the geographical area. Also,larger claims tend to take longer to resolve. However the results from the survey indicatethat the overall cost of motor insurance claims amounted to just under £32m (€38.5m) inthe financial year 2011/12.
Table 19: Compensation claims by Local Authorities in Great Britain
Indicators England London Wales
Number of staff hoursspent on claims (onaverage, per LA)
2012 183 125 99
2011 172 131 93
Annual amount spent(on average, per LA)
2012 £87k £53k £38k
2011 £105 £68 £55k
Amount paid to roadusers in claims (total) 2012 £23.8m £6.3m £1.8m
Source: ALARM Survey (2012 and 2013).
Further evidence emerged from a request made under the Freedom of Information Act bythe breakdown expert firm Britannia Rescue. From their survey of local authorities, itappears that councils have paid a total of £2.5m (€3m) in compensation to motorists in thefinancial year 2012/13 for pothole damage to cars only. They estimate that around 200,000potholes are present on British roads, following the combination of a harsh winter and a drysummer that has particularly harmed road surfaces. As a result, claims have increased byalmost 80% in one year. Their calculations show that the amount paid out incompensations could have been used to repair one quarter of potholes.
11.6 Summary for Great Britain
In Great Britain, the Highways Agency and local councils are responsible for the nationaland local sections of the road network respectively. Maintenance budgets have remainedfairly stable in recent years, based on the 2-year budget allocation made by central
Policy Department B: Structural and Cohesion Policies____________________________________________________________________________________________
214
government. The proportion of roads classified as needing repair is low and road safetystatistics show continuous improvement over the past decade.
However, stakeholders do not appear to be satisfied with road conditions in Britain. Parallelsurveys conducted among local authorities, SMEs and the general public indicate thatbetter road maintenance is considered to be a priority to improve safety and businessproductivity, as well as to reduce the cost of vehicle repairs. Against this background, localauthorities begin to face a substantial funding gap which is projected to widen over thenext few years. This raises some concerns about their ability to keep the road network ingood conditions.
At the same time, the study of road maintenance in Britain presents a number of goodpractices. Budget cuts are accompanied by greater budget certainty which will see a changeto 5-year allocations to road maintenance budgets. Advanced systems are used to screenroad surface quality regularly and prioritise interventions. In addition, local authorities areestablishing reporting systems which favour the crowdsourcing of information about roadsin need of repair. Finally, various stakeholders are engaged in collecting and reporting dataon road maintenance, facilitating the exchange of information and putting pressure oncentral and local government.
EU Road Surfaces: Economic and Safety Impact of the Lack of Regular Road Maintenance____________________________________________________________________________________________
215
LIST OF SOURCES
General
AIA: Asphalt Industry Alliance: http://www.asphaltindustryalliance.com/alarm-survey.asp
EAPA – European Asphalt Pavement Association: http://www.eapa.org/
Eurostat: http://epp.eurostat.ec.europa.eu/portal/page/portal/eurostat/home/
OECD: http://www.oecd.org
Austria
AIT: http://www.ait.ac.at/research-services/research-services-mobility/
ASFINAG: http://www.asfinag.at/
Austrian Ministry of Finance: https://www.bmf.gv.at/
GESTRATA: http://www.gestrata.at/aktuelles
Litzka, J., Weninger-Vycudil, A. (2011) Baulicher Erhaltungsbedarf fuer dieLandesstrassen Oesterreichs. Studie fuer die oesterreichischenlandesstrassenverwaltungen.
Rechnungshof Kärnten (2013) Bericht des Rechnungshofes, Bauliche Erhaltungvon Landesstraßen.
France
French Finance Ministry: http://www.economie.gouv.fr/welcome-to-the-french-ministry-for-the-economy-and-finance
USIRF: http://www.usirf.com/
Germany
ADAC: http://www.adac.de/
FGSV: http://www.fgsv.de/
FIS: http://www.forschungsinformationssystem.de/servlet/is/414893/
German Bundestag: http://www.bundestag.de
Bundestagsfraktion Bündnis 90/Die Grünen (2007) Jobmaschine Straßenbau
Kunert, U. and Link, H. (2013) Verkehrsinfrastruktur: Substanzerhaltungerfordert deutlich höhere Investitionen, in: DIW weekly issue 26/2013
Pro Mobilität (2008) Regionale Effekte durch Straßenbau-Investitionen
Ireland
DTTaS: http://www.dttas.ie/corporate/publications/english/annual-report-2012
http://www.irishtimes.com/premium/loginpage?destination=http://www.irishtimes.com/news/politics/underused-toll-roads-could-cost-taxpayer-30m-1.1485661
National Roads Authority Ireland: http://www.nra.ie/
Road Safety Authority Ireland: http://www.rsa.ie/
Oireachtas Committee of Public Accounts (10th of May 2012) – Briefing Paper:National Roads Authority Accounts 2010
Policy Department B: Structural and Cohesion Policies____________________________________________________________________________________________
216
Oireachtas Committee of Public Accounts (7th of February 2013) – Statement byMr. Fred Barry, CEO National Roads Authority
Italy
ANAS: http://www.stradeanas.it/
CNIT - Conto Nazionale delle Infrastrutture e dei Trasporti:http://www.mit.gov.it/mit/site.php?p=cm&o=vd&id=2265
Gestione della Manutenzione Stradale – Indicatori di stato e curve di decadimentodelle prestazioni funzionali e strutturali delle sovrastrutture stradali (2000):http://people.unica.it/mauroconi/files/2011/10/coni43full.pdf
http://www.euroconsumatori.eu/leggi_articoli_regione.php?id=151
http://www.statoquotidiano.it/06/05/2013/la-responsabilita-della-p-a-per-cattiva-manutenzione-pubbliche-strade-xvi/139488/
SITEB-Associazione Italiana Bitume e Asfalto Strade:http://www.siteb.it/new%20siteb/
Lithuania
Lithuanian Road Administration Institution (LRA):http://www.lra.lt/en.php/about_lra/general_information/101
Poland
GDDKiA, Poland: www.GDDKiA.gov.pl
EC Harris Research, International focus on Poland (2012) Time to invest in Poland– Competition tightening as EU funded infrastructure workload slows.
Ernst and Young (2012), Effectiveness of national roads maintenancemanagement in Poland.
Ernst and Young 2012, Effectiveness of national roads maintenance managementin Poland.
Marcin Staniek (2013), Stereo vision techniques in road pavement evaluation,The XXVIII Baltic Road Conference, Silesian University of Technology, Gliwice,Poland.
World Bank (2009) – Implementation and completion results report on a loan ofEuro 100 million to the Republic of Poland for a road maintenance andrehabilitation project.
World Bank (2009), Implementation and completion results report on a loan ofEuro 100 million to the Republic of Poland for a road maintenance andrehabilitation project.
Portugal
ACAM:http://www.acam.org/w/images/3/3d/Factores_potenciadores_sinistralidade_rodoviaria.pdf
AICCOPN: http://www.aiccopn.pt/news.php?news_id=1591
Brisa:http://www.brisa.pt/PresentationLayer/homepageinternacional.aspx?menuid=70
Estradas de Portugal (EP): http://www.estradasdeportugal.pt/index.php
http://www.crp.pt/docs/A45S129-149_Art_T5_7CRP_2013.pdf
IMT: http://www.imtt.pt/sites/IMTT/Portugues/Paginas/IMTHome.aspx

EU Road Surfaces: Economic and Safety Impact of the Lack of Regular Road Maintenance____________________________________________________________________________________________
217
TSF:http://www.tsf.pt/PaginaInicial/Portugal/Interior.aspx?content_id=1875574&page=-1
O Sistema de Gestão de Conservação de Pavimentos da Estradas de Portugal,S.A. - Balanço de uma Implementação Consolidada"
Romania
CNADNR: The National Company of Motorways and National Roads of Romania:http://www.cnadnr.ro/pagina.php?idg=20
Spain
ASEFMA: http://www.aecarretera.com/en/servicios/servicios-al-socio/promocion-y-defensa-de-la-carretera/asefma-asociacion-espanola-de-fabricantes-de-mezclas-asfalticas
Asociación Española de la Carretera (AEC): http://www.aecarretera.com/
DGT (Direccion General de Trafico) Spain: http://www.dgt.es/es/
EAPA – European Asphalt Pavement Association: http://www.eapa.org/
Ministerio de Fomento – Spain: http://www.fomento.gob.es
Great Britain
DfT– Department for Transport – UK: https://www.gov.uk/department-for-transport-london-offices
Highways Agency, UK: http://www.highways.gov.uk/traffic-information/

Policy Department B: Structural and Cohesion Policies____________________________________________________________________________________________
218
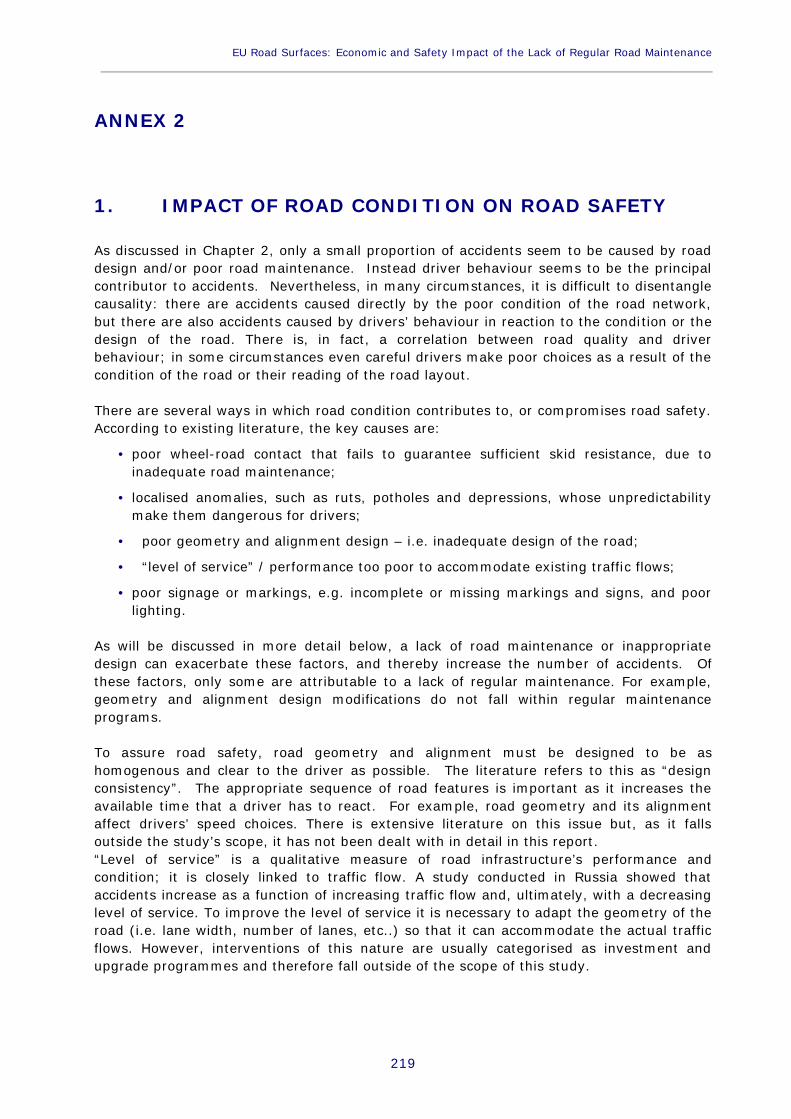
EU Road Surfaces: Economic and Safety Impact of the Lack of Regular Road Maintenance____________________________________________________________________________________________
219
ANNEX 2
1. IMPACT OF ROAD CONDITION ON ROAD SAFETY
As discussed in Chapter 2, only a small proportion of accidents seem to be caused by roaddesign and/or poor road maintenance. Instead driver behaviour seems to be the principalcontributor to accidents. Nevertheless, in many circumstances, it is difficult to disentanglecausality: there are accidents caused directly by the poor condition of the road network,but there are also accidents caused by drivers’ behaviour in reaction to the condition or thedesign of the road. There is, in fact, a correlation between road quality and driverbehaviour; in some circumstances even careful drivers make poor choices as a result of thecondition of the road or their reading of the road layout.
There are several ways in which road condition contributes to, or compromises road safety.According to existing literature, the key causes are:
poor wheel-road contact that fails to guarantee sufficient skid resistance, due toinadequate road maintenance;
localised anomalies, such as ruts, potholes and depressions, whose unpredictabilitymake them dangerous for drivers;
poor geometry and alignment design – i.e. inadequate design of the road;
“level of service” / performance too poor to accommodate existing traffic flows;
poor signage or markings, e.g. incomplete or missing markings and signs, and poorlighting.
As will be discussed in more detail below, a lack of road maintenance or inappropriatedesign can exacerbate these factors, and thereby increase the number of accidents. Ofthese factors, only some are attributable to a lack of regular maintenance. For example,geometry and alignment design modifications do not fall within regular maintenanceprograms.
To assure road safety, road geometry and alignment must be designed to be ashomogenous and clear to the driver as possible. The literature refers to this as “designconsistency”. The appropriate sequence of road features is important as it increases theavailable time that a driver has to react. For example, road geometry and its alignmentaffect drivers’ speed choices. There is extensive literature on this issue but, as it fallsoutside the study’s scope, it has not been dealt with in detail in this report.“Level of service” is a qualitative measure of road infrastructure’s performance andcondition; it is closely linked to traffic flow. A study conducted in Russia showed thataccidents increase as a function of increasing traffic flow and, ultimately, with a decreasinglevel of service. To improve the level of service it is necessary to adapt the geometry of theroad (i.e. lane width, number of lanes, etc..) so that it can accommodate the actual trafficflows. However, interventions of this nature are usually categorised as investment andupgrade programmes and therefore fall outside of the scope of this study.
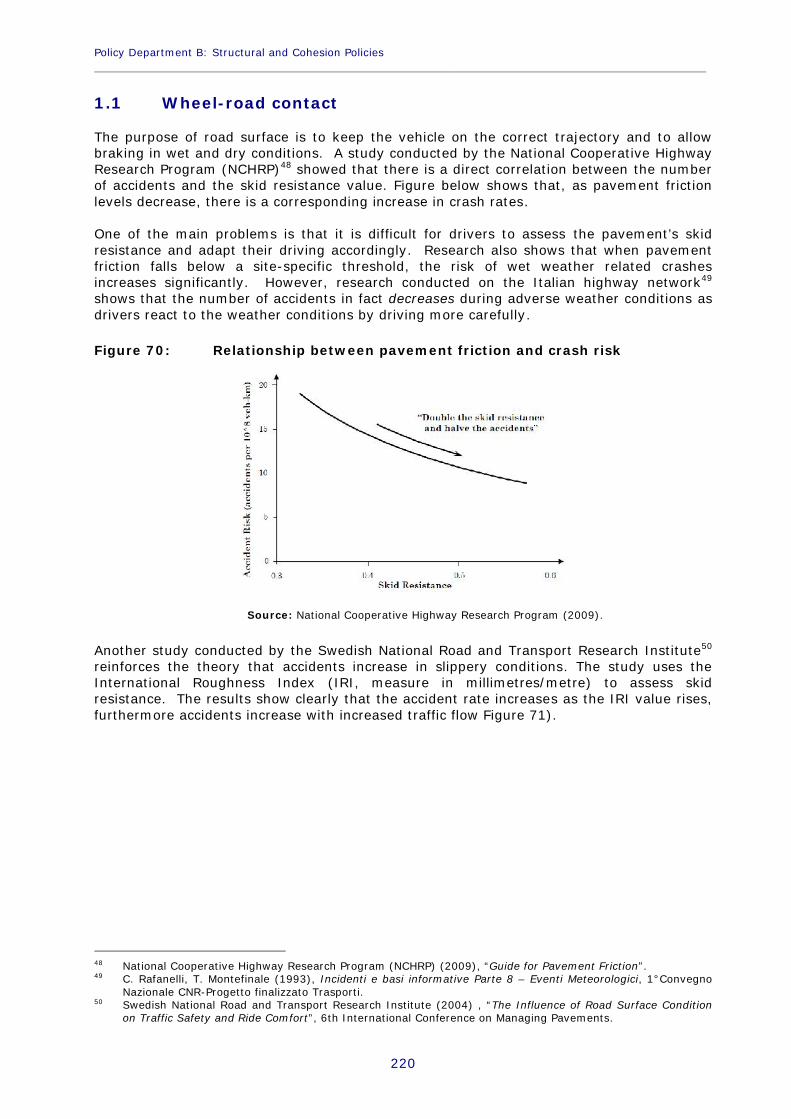
Policy Department B: Structural and Cohesion Policies____________________________________________________________________________________________
220
1.1 Wheel-road contact
The purpose of road surface is to keep the vehicle on the correct trajectory and to allowbraking in wet and dry conditions. A study conducted by the National Cooperative HighwayResearch Program (NCHRP)48 showed that there is a direct correlation between the numberof accidents and the skid resistance value. Figure below shows that, as pavement frictionlevels decrease, there is a corresponding increase in crash rates.
One of the main problems is that it is difficult for drivers to assess the pavement’s skidresistance and adapt their driving accordingly. Research also shows that when pavementfriction falls below a site-specific threshold, the risk of wet weather related crashesincreases significantly. However, research conducted on the Italian highway network49
shows that the number of accidents in fact decreases during adverse weather conditions asdrivers react to the weather conditions by driving more carefully.
Figure 70: Relationship between pavement friction and crash risk
Source: National Cooperative Highway Research Program (2009).
Another study conducted by the Swedish National Road and Transport Research Institute50
reinforces the theory that accidents increase in slippery conditions. The study uses theInternational Roughness Index (IRI, measure in millimetres/metre) to assess skidresistance. The results show clearly that the accident rate increases as the IRI value rises,furthermore accidents increase with increased traffic flow Figure 71).
48 National Cooperative Highway Research Program (NCHRP) (2009), “Guide for Pavement Friction”.49 C. Rafanelli, T. Montefinale (1993), Incidenti e basi informative Parte 8 – Eventi Meteorologici, 1°Convegno
Nazionale CNR-Progetto finalizzato Trasporti.50 Swedish National Road and Transport Research Institute (2004) , “The Influence of Road Surface Condition
on Traffic Safety and Ride Comfort”, 6th International Conference on Managing Pavements.
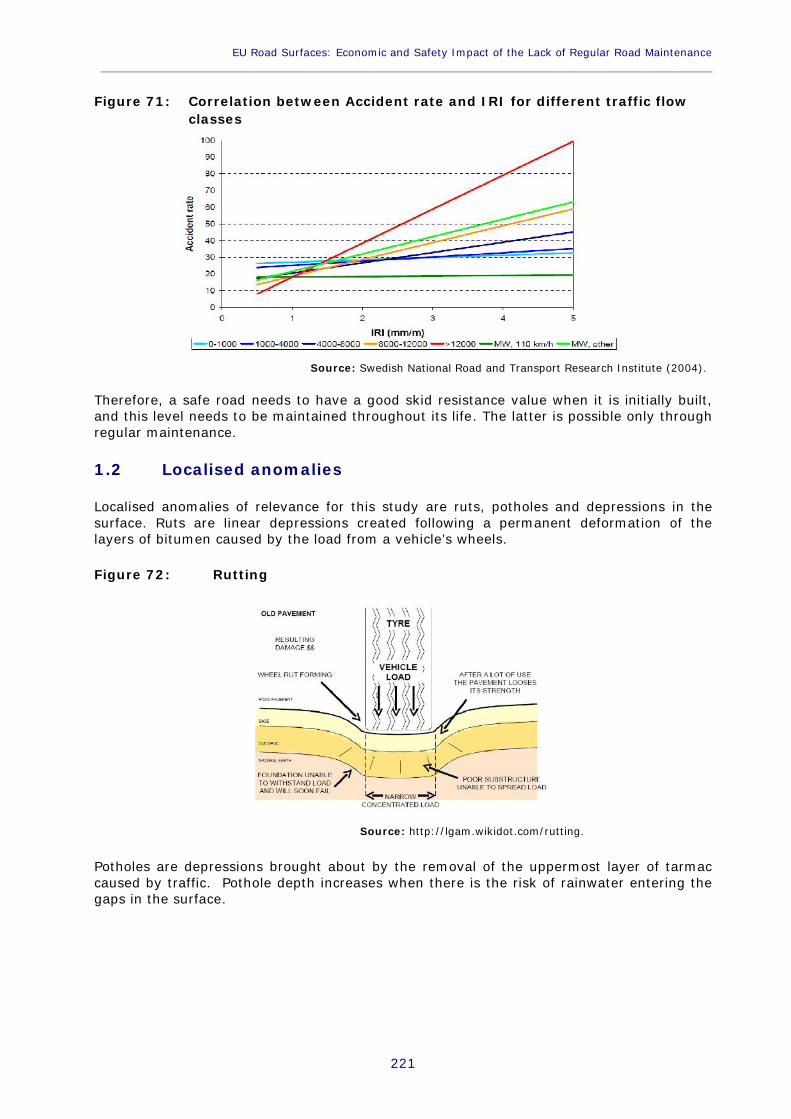
EU Road Surfaces: Economic and Safety Impact of the Lack of Regular Road Maintenance____________________________________________________________________________________________
221
Figure 71: Correlation between Accident rate and IRI for different traffic flowclasses
Source: Swedish National Road and Transport Research Institute (2004).
Therefore, a safe road needs to have a good skid resistance value when it is initially built,and this level needs to be maintained throughout its life. The latter is possible only throughregular maintenance.
1.2 Localised anomalies
Localised anomalies of relevance for this study are ruts, potholes and depressions in thesurface. Ruts are linear depressions created following a permanent deformation of thelayers of bitumen caused by the load from a vehicle’s wheels.
Figure 72: Rutting
Source: http://lgam.wikidot.com/rutting.
Potholes are depressions brought about by the removal of the uppermost layer of tarmaccaused by traffic. Pothole depth increases when there is the risk of rainwater entering thegaps in the surface.

Policy Department B: Structural and Cohesion Policies____________________________________________________________________________________________
222
Figure 73: Formation of a classic pothole
Source: http://www.halifax.ca/municipalops/potholes/PotholeFAQ.html
Depressions are permanent deformations in the road surface due to ground subsidence.Their repair falls inside extraordinary maintenance because they relate to road elementsbelow the surface.
These anomalies in the road surface (according to a study conducted by the SwedishNational Road and Transport Research Institute51) cause, in dry surface conditions,vibrations and bumps which can increase driver fatigue. However, such anomalies usuallyincrease drivers’ attention and, as a result, the risk of accident seems to decrease.
In wet conditions, rutting causes an increased risk of aquaplaning which is a phenomenonwhereby the vehicle floats on a layer of water as a result of the loss of contact between theroad and the wheels, leading to the driver losing control of the vehicle. The risk ofaquaplaning caused accidents is greatest where rut depths are larger and where there ispoor water drainage (i.e. small cross fall).An important additional consideration relating to these types of anomalies is that they aredangerous because drivers cannot predict them. They are particularly hazardous when theyare spread out along the road rather than when the driver is facing a consistently roughroad.
1.2.1 Poor signage, markings and lighting
Markings, signs and lighting contribute to make the road logical and easy to understand.Road markings are a cost effective solution to provide a clear indication of the driving lanesand space, contributing to a predictable driving trajectory. As a result road users intuitivelyunderstand the road’s alignment and can adapt their driving behavior accordingly. A studydeveloped by the European Union Road Federation52 shows that good maintenance ofmarkings and signs reduces accident risks.
Good street lighting also improves road safety especially in a specific, potentially dangerouslocations such as intersections, pedestrian crossings, urban areas, etc. The aim of roadlighting is to provide the required visibility for the driver to read the road and react tooncoming obstacles in a safe manner. On this topic, different studies have shown a directlink between poor lighting and a consequent increase in accident risk.
51 Swedish National Road and Transport Research Institute (2004) , “The Influence of Road Surface Conditionon Traffic Safety and Ride Comfort”, 6th International Conference on Managing Pavements.
52 European Union Road Federation “Marking the way towards a safer future”.

EU Road Surfaces: Economic and Safety Impact of the Lack of Regular Road Maintenance____________________________________________________________________________________________
223
1.2.2 Road works and accidents: unintended consequences of roadmaintenance
Road works tend to be unsafe for those working on site (as a result of their proximity oftraffic) and to drivers moving through them (resulting from a change in the road layout). Astudy conducted by the Institute for Road Safety Research in the Netherlands (SWOV)53
showed that, in the period 2000-2009, 2% of all registered fatal accidents in theNetherlands took place in the proximity of roadworks and roadwork locations seem todisplay a higher accident rate than at other road locations. The risk is highest in the workzone; roadworks that take longer and cover a longer distance seem to have a lower crashrate. The literature also shows a generally higher crash rate during nighttime.
Guidelines exist for the uniform preparation, indication and marking of roadworks. It isimportant that these guidelines are followed for large as well as small roadworks.However, an evaluation of roadworks shows that these guidelines are only followeddiligently at a few locations.
1.2.3 Main conclusions on the impact of road condition on road safety
In summary, there are various aspects of the road’s condition which contribute to itssafety. A high level of pavement friction, clear signage and road markings are importantqualities of a safe road. It is important that these are maintained throughout the road’slifespan. Anomalies, such as ruts and depressions, reduce road safety - as they affectdriver fatigue - and can create a hazard for drivers and can cause aquaplaning in wetconditions. In addition to normal road conditions, roadworks create more hazardous roadconditions for both drivers and those who are working on the road and affect the accidentrate for a road.
A consistent design of a road’s geometry is an important factor in ensuring a safe road.Another important provision is an appropriate level of service for the anticipated trafficflow. However, both of these factors fall under the umbrella of exceptional, rather thanregular maintenance.
53 Institute For Road Safety Research (2010), “Roadworks and road safety”, SWOV fact sheet.


