eu-singapore trade and investment publication...
TRANSCRIPT
Trade

SOURCES
EUROPEAN COMMISSION, DG TRADE
EUROSTAT

TABLE OF CONTENTS
3
MESSAGE FROM THE EU TRADE COMMISSIONER 4 MESSAGE FROM THE EU AMBASSADOR 5
THE GLOBAL PERSPECTIVE : EU TRADE AND INVESTMENT WITH THE REST OF THE WORLD 6EU TRADE IN GOODS WITH THE WORLD 7 EU TRADE IN SERVICES WITH THE WORLD 10 EU OUTWARD AND INWARD FDI STOCK 12
THE REGIONAL PERSPECTIVE: EU-ASEAN TRADE AND INVESTMENT 14EU-ASEAN TRADE IN GOODS 14 EU-ASEAN TRADE IN SERVICES 20 EU-ASEAN FDI 21
THE BILATERAL PERSPECTIVE: EU-SINGAPORE TRADE AND INVESTMENT TIES 22 EU-SINGAPORE TRADE IN GOODS 22 EU-SINGAPORE TRADE IN SERVICES 26 EU-SINGAPORE BILATERAL INVESTMENT TIES 28 INVESTMENT HIGHLIGHTS 2014 – SINGAPORE INVESTMENTS IN THE EU 30 INVESTMENT HIGHLIGHTS 2014 – EU INVESTMENTS IN SINGAPORE 31 EU BUSINESS AVENUES: PARTNERING GROWTH IN SOUTHEAST ASIA 32

4
MESSAGE FROM THE EU TRADE COMMISSIONER
Today, the European Union (EU) is the world’s largest economy. Trade has always been cen-tral to this achievement and at the heart of our prosperity. The commercial and political ties between the EU and its partners, which have grown strong over many centuries, have helped the EU become the most important trading partner and the world’s biggest investor and recipient of foreign direct investments. The EU endeavours to promote free trade at home and abroad, creating a level playing field so that everyone can enjoy the benefits that this sys-tem can bring, such as jobs and growth.
In this respect, the close relationship between the EU and ASEAN is of vital importance. The rise of Asia is possibly the most important economic and political story of our times and the ten coun-tries of ASEAN are playing a central part in it.
ASEAN is the EU’s third largest trading part-ner outside of Europe, while the EU is ASEAN’s second trading partner after China. The EU is also by far the biggest source of foreign direct investment in ASEAN. This close bond that we maintain through trade and investment means that we have a responsibility to work towards deepening our ties. The EU considers the ASEAN Economic Community (AEC) as an important step towards increasing connectivity in South East Asia, fostering deeper economic integra-
tion and facilitating freer movement of goods, services, capital and labour between the ten countries.
Singapore has long been a key partner for Eu-rope. As one of the most liberalised economies in the world, its status as a trading hub for the region has been positively reinforced by its thriving economy, dynamic business environ-ment and open market. The growing number of EU investments in Singapore is a strong testament to its continued adherence to these policies.
With Singapore the EU has negotiated one of its most ambitious trade deals to date. Addressing not only tariffs but also non-tariff barriers to trade such as technical standards and regula-tory issues, I am sure that the new trade en-vironment we have created will greatly benefit the EU, Singapore and the wider region. As we negotiate other agreements throughout ASEAN, we hope that these activities will foster closer economic integration, bringing our two regions still closer to each other.
CECILIA MALMSTRÖM EU Trade Commissioner

5
The EU Delegation to Singapore has served to enhance bilateral ties between the EU and the City-State since opening its doors in 2003. Playing an important role in Singapore for over 10 years, it also actively promotes EU relations with ASEAN. Each year, the continued strength of the econom-ic relationship that we enjoy with Singapore is highlighted in the Trade & Investment Booklet published by the Delegation. While presenting a comprehensive narrative of the EU’s consist-ent strength in the global economy, this booklet showcases EU-Singapore trade and investment relations, as well as those between the EU and ASEAN on a region-to-region basis.
The EU continues to be one of the most impor-tant trade and investment partners for Singapore. Concluded in October 2014, the Investment Chap-ter of the EU-Singapore Free Trade Agreement completes the text and paves the way for its rat-ification. Once in force, this Agreement will pro-vide additional benefits to EU actors operating in Singapore, especially those providing services and investing here. Additionally, it will enhance the EU’s economic diplomacy in ASEAN, as Singapore plays an increasingly important role as ‘hub’ for the wider South East Asian region.
With over 10,000 EU companies operating in Sin-gapore, its open trading system, good governance and businessfriendly environment, often make it
the preferred choice for companies entering this vibrant region. The European Chamber of Com-merce and the National Business Groups play an important role in supporting business presence in the city state.
To complement the FTA, the EU launched the EU Business Avenues to South East Asia programme in Singapore last October. Modelled on the suc-cessful business support programmes in Japan and Korea, this initiative will bring 1,000 European SMEs to the region over the next five years, cre-ating business links with local counterparts and fostering economic ties.
2015 will be an important year for Singapore, as the City-State marks its 50th anniversary of independence. I look forward to the additional activities and celebrations, which I am sure will give even more impetus to ongoing engagement between and among the European and Singapo-rean business communities.
This booklet is a tool which I hope will provide better understanding of the progress, impact and potential of EU-Singapore economic relations and hope that it can be used as a valuable reference.
DR MICHAEL PULCH Ambassador / Head of the European Union
Delegation to Singapore
MESSAGE FROM THE EU AMBASSADOR
THE GLOBAL PERSPECTIVE : EU TRADE AND INVESTMENT WITH THE WORLD
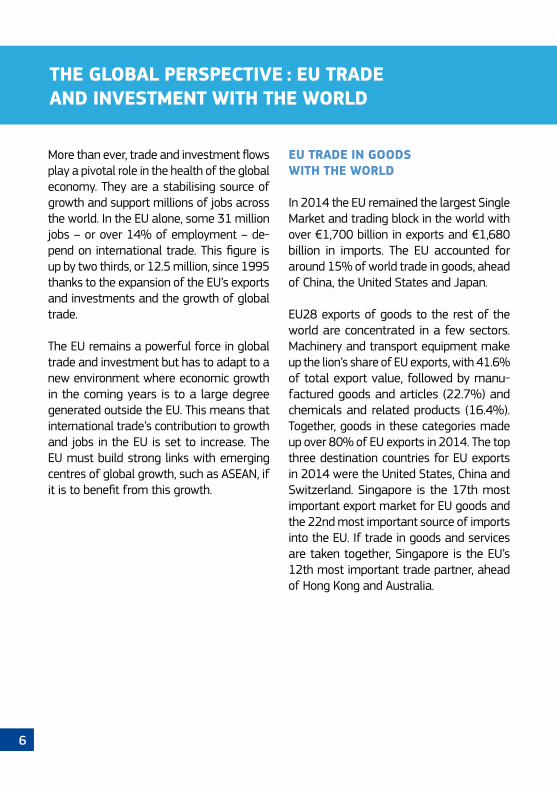
More than ever, trade and investment flows play a pivotal role in the health of the global economy. They are a stabilising source of growth and support millions of jobs across the world. In the EU alone, some 31 million jobs – or over 14% of employment – de-pend on international trade. This figure is up by two thirds, or 12.5 million, since 1995 thanks to the expansion of the EU’s exports and investments and the growth of global trade.
The EU remains a powerful force in global trade and investment but has to adapt to a new environment where economic growth in the coming years is to a large degree generated outside the EU. This means that international trade’s contribution to growth and jobs in the EU is set to increase. The EU must build strong links with emerging centres of global growth, such as ASEAN, if it is to benefit from this growth.
EU TRADE IN GOODS WITH THE WORLD
In 2014 the EU remained the largest Single Market and trading block in the world with over €1,700 billion in exports and €1,680 billion in imports. The EU accounted for around 15% of world trade in goods, ahead of China, the United States and Japan.
EU28 exports of goods to the rest of the world are concentrated in a few sectors. Machinery and transport equipment make up the lion’s share of EU exports, with 41.6% of total export value, followed by manu-factured goods and articles (22.7%) and chemicals and related products (16.4%). Together, goods in these categories made up over 80% of EU exports in 2014. The top three destination countries for EU exports in 2014 were the United States, China and Switzerland. Singapore is the 17th most important export market for EU goods and the 22nd most important source of imports into the EU. If trade in goods and services are taken together, Singapore is the EU’s 12th most important trade partner, ahead of Hong Kong and Australia.
6

EU28 EXPORTS TO THE WORLD, 2014
PARTNER COUNTRIES
VALUE (€ bn)
SHARE TOTAL (%)
USA 310.8 18.3China 164.7 9.7Switzerland 140.3 8.2Russia 103.3 6.1Turkey 74.6 4.4Japan 53.3 3.1Norway 50.2 2.9South Korea 43.1 2.5United Arab Emirates
42.8 2.5
Brazil 36.9 2.2India 35.5 2.1Saudi Arabia 35.1 2.1Hong Kong 34.7 2.0Canada 31.7 1.9Australia 29.6 1.7Mexico 28.5 1.7Singapore 28.2 1.7Algeria 23.4 1.4South Africa 23.3 1.4Morocco 18.2 1.1
TOTAL EXPORTS (all countries)
1,702.7 100.0
EU28 IMPORTS FROM THE WORLD, 2014
PARTNER COUNTRIES
VALUE(€ bn)
SHARE TOTAL (%)
China 302.6 18.0USA 204.8 12.2Russia 181.8 10.8Switzerland 96.6 5.7Norway 83.9 5.0Japan 54.6 3.2Turkey 54.3 3.2South Korea 39.0 2.3India 37.1 2.2Brazil 31.2 1.9Algeria 29.4 1.7Saudi Arabia 28.8 1.7Nigeria 28.2 1.7Canada 27.4 1.6Kazakhstan 23.9 1.4Taiwan 23.2 1.4Vietnam 22.1 1.3Malaysia 19.7 1.2Thailand 18.5 1.1South Africa 18.4 1.1Mexico 18.2 1.1Singapore 16.6 1.0TOTAL IMPORTS (all countries)
1,680.2 100.0
EU28 imports of goods from the rest of the world showed a similar sectorial distribution with machinery and transport equipment accounting for 26.8% of total value of imported goods, followed by mineral fuels, lubricants and related materials (26.4%) and manufactured goods and articles (24.3). Together, goods in these categories made up over 77% of EU imports in 2014. The top three source countries for EU imports in 2014 were China, the United States and Russia. 7

EU TRADE IN SERVICES WITH THE WORLD
As global trade has grown, so has the importance of the services sector. Services today represent about 40% of the value added to products that are exported from the EU. About a third of jobs generated by exports of manufactured goods are actually located in companies that supply exporters of goods with auxiliary services.
DEVELOPMENT OF EU TRADE IN SERVICES BY TRADING PARTNER, 2012–13 (€bn)
2012 2013 (1) EXPORTS IMPORTS BALANCE EXPORTS IMPORTS BALANCE
United States 164.8 150.9 13.9 180.7 159.9 20.8
Switzerland 70.7 36.5 34.2 99.5 54.2 45.3
China 29.4 20.0 9.5 29.0 20.9 8.1
Russia 29.3 15.2 14.1 30.7 14.3 16.4
Japan 24.8 15.6 9.2 24.7 14.6 10.1
Canada 16.9 10.3 6.6 17.4 11.4 6.0
Singapore 13.7 11.3 2.4 16.5 13.1 3.4
India 11.9 10.7 1.2 11.5 12.2 -0.7
Brazil 13.5 6.4 7.1 14.8 6.3 8.5
Hong Kong 10.9 8.8 2.1 9.8 9.8 0
Other 254.7 196.6 58.1 275.1 214.9 60.2
TOTAL EU (2) 640.6 482.3 158.3 709.7 531.6 178.1
(1) Preliminary figures based on annualised quarterly data.
(2) 2012 and 2013: Extra EU 28.
In 2013 (most recent data available), the EU exported € 710 billion in services and imported € 532 billion, for a net positive balance of € 178 billion. Main services exports included business services (€219bn), transport services (€140bn) and travel services (€101bn). These same sectors also constituted the key service imports, with business services accounting for 28.5% of total imports, followed by transport services (22.7%) and travel services (17.1%).
8

EU TRADE IN SERVICES, BY MAIN PRODUCT CATEGORIES (€bn), 2013
2012 2013 (1) EXPORTS IMPORTS BALANCE EXPORTS IMPORTS BALANCE
United States 164.8 150.9 13.9 180.7 159.9 20.8
Switzerland 70.7 36.5 34.2 99.5 54.2 45.3
China 29.4 20.0 9.5 29.0 20.9 8.1
Russia 29.3 15.2 14.1 30.7 14.3 16.4
Japan 24.8 15.6 9.2 24.7 14.6 10.1
Canada 16.9 10.3 6.6 17.4 11.4 6.0
Singapore 13.7 11.3 2.4 16.5 13.1 3.4
India 11.9 10.7 1.2 11.5 12.2 -0.7
Brazil 13.5 6.4 7.1 14.8 6.3 8.5
Hong Kong 10.9 8.8 2.1 9.8 9.8 0
Other 254.7 196.6 58.1 275.1 214.9 60.2
TOTAL EU (2) 640.6 482.3 158.3 709.7 531.6 178.1
(1) Preliminary figures based on annualised quarterly data.
(2) 2012 and 2013: Extra EU 28.
CATEGORY EXPORTS IMPORTS
Transport 140.2 115.8
Travel 101.2 87.4
Communications services 20.3 16.9
Construction services 17.8 7.8
Insurance services 18.9 8.7
Financial services 59.2 22.8
Computer & information services 47.3 20.3
Royalties & license fees 43.9 53.4
Other business services 219.2 145.9
Personal, cultural & recreational services 8.7 6.4
Govt. services 7.5 5.8
Other 25.6 40.6
TOTAL 709.8 531.8
9

EU OUTWARD AND INWARD FDI STOCK
FDI stocks are an important indicator of globalisation and provide a measurement of the longstanding links between countries and continents. International investment flows contribute significantly to generating growth and jobs as well as to the wide-spread adoption of best business practices, more efficient technologies and products.
In 2013, the EU retained its position as the world’s largest investor and the world’s largest recipient of FDI. The EU held FDI stocks of €4,900 billion in the world, while stocks held by other countries in the EU amounted to €3,778 billion, meaning that the EU held a net investment position vis-à-vis the rest of the world of €1,122 billion. At the global level, in 2013, the EU accounted for 46% of world FDI inflows and 44% of world FDI outflows (excluding intra-EU flows).
North America was the leading location of EU FDI stock with €1,911 billion, of which €1,135 billion held in the US and €225 billion in Canada. Europe (non-EU) was also a key destination for EU FDI, with over €1,135 billion at the end of 2013. Taken together, Asia accounted for €664 billion or 14% of EU FDI stock abroad.
SHARE OF FDI STOCK HELD BY THE
SHARE OF EU FDI STOCKS HELD IN THE WORLD, 2013
SHARE OF FDI STOCKS HELD BY THE WORLD IN THE EU, 2013
North America 39 %
Europe (extra EU) 23 %
Asia 14 %
Central America 9 %
South America 8 %
Africa 4 %
Oceania 3 %
10
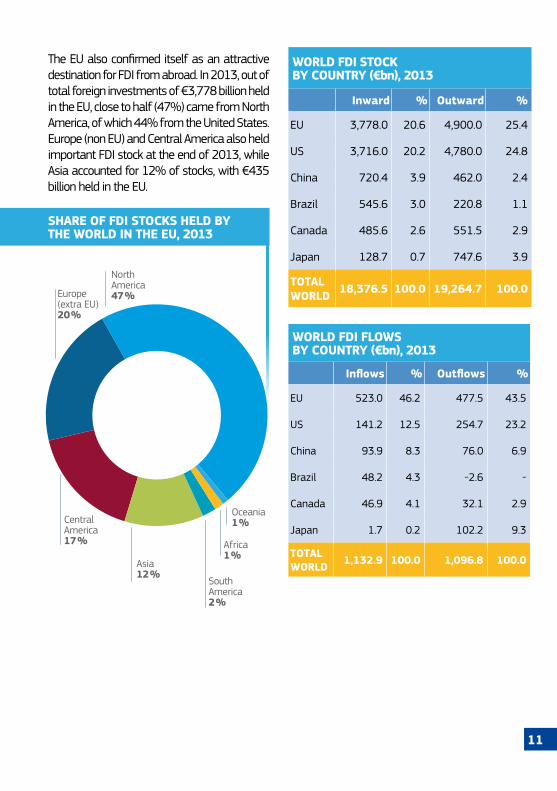
The EU also confirmed itself as an attractive destination for FDI from abroad. In 2013, out of total foreign investments of €3,778 billion held in the EU, close to half (47%) came from North America, of which 44% from the United States. Europe (non EU) and Central America also held important FDI stock at the end of 2013, while Asia accounted for 12% of stocks, with €435 billion held in the EU.
SHARE OF EU FDI STOCKS HELD IN THE WORLD, 2013
SHARE OF FDI STOCKS HELD BY THE WORLD IN THE EU, 2013
WORLD FDI STOCK BY COUNTRY (€bn), 2013
Inward % Outward %
EU 3,778.0 20.6 4,900.0 25.4
US 3,716.0 20.2 4,780.0 24.8
China 720.4 3.9 462.0 2.4
Brazil 545.6 3.0 220.8 1.1
Canada 485.6 2.6 551.5 2.9
Japan 128.7 0.7 747.6 3.9
TOTAL WORLD 18,376.5 100.0 19,264.7 100.0
WORLD FDI FLOWS BY COUNTRY (€bn), 2013
Inflows % Outflows %
EU 523.0 46.2 477.5 43.5
US 141.2 12.5 254.7 23.2
China 93.9 8.3 76.0 6.9
Brazil 48.2 4.3 -2.6 -
Canada 46.9 4.1 32.1 2.9
Japan 1.7 0.2 102.2 9.3
TOTAL WORLD 1,132.9 100.0 1,096.8 100.0
THE REGIONAL PERRT-
North America 47 %Europe
(extra EU) 20 %
Asia 12 %
Central America 17 %
South America 2 %
Africa 1 %
Oceania 1 %
11

As Southeast Asia pushes to deepen regional integration and works towards the ASEAN Economic Community (AEC) by the end of 2015, economic relations between ASEAN and the EU have continued to grow. During their most recent consultations in April 2015, ASEAN Economic Ministers and the EU Trade Commissioner tasked senior officials to meet before the end of the year to take stock of (i) the state of play of ASEAN economic integration; (ii) the progress in the negotiations of bilateral FTAs between the EU and individual ASEAN countries and; (iii) evaluate how a region-to-region re-engagement could add value, building on bilateral FTAs.
EU-ASEAN TRADE IN GOODS
Trade between ASEAN and the EU has continued to expand over recent years. Taken as a single trading entity, ASEAN is the EU’s fifth most important trading partner worldwide and the third most important trading partner outside of Europe, reaching almost €180 billion in bilateral trade in 2014. The EU remains ASEAN’s second most important trading partner after China, accounting for around 13% of ASEAN’s trade in goods with the world. Conversely, ASEAN accounts for around 5% of the EU’s total trade with the world.
Despite the setbacks from the economic crisis, total ASEAN-EU trade between 2004 and 2014 has shown compound annual growth rates of 4.7%. During this period, imports from ASEAN to the EU have grown by 3.7% per year while exports from the EU to ASEAN have expanded by 6.2% per year, on a compound annual growth basis.
THE REGIONAL PERSPECTIVE: EU-ASEAN TRADE AND INVESTMENT
12

EU-ASEAN TRADE IN GOODS (MIO €), 2004-2014
IMPORTS EXPORTS TOTAL TRADE % CHANGE Y-O-Y
2004 69,707 43,071 112,778 -
2005 71,761 44,687 116,448 3.3
2006 79,271 48,590 127,861 9.8
2007 81,184 53,207 134,391 5.1
2008 80,306 56,349 136,655 1.7
2009 68,379 50,206 118,585 -13.2
2010 85,828 61,829 147,657 24.5
2011 94,156 69,176 163,332 10.6
2012 99,104 81,594 180,698 10.6
2013 96,797 81,697 178,494 -1.2
2014 100,539 78,631 179,170 0.4
13

The EU maintains a structural trade deficit with ASEAN. In 2014, the EU imported €100.5 billion worth of goods and exported €78.6 billion worth of goods, resulting in a trade deficit of €21.9 billion.
Bilateral trade between the EU and ASEAN continued to be concentrated in a few sectors, namely machinery and transport equipment (43.2% of imports and 50.7% of exports of the EU to ASEAN in 2014), chemicals and related products and textiles&clothing.
While manufactured products constitute the bulk of trade, the EU and ASEAN also have a sizeable exchange of primary products totalling almost €30 billion in 2014 (16.3% of the total).
120,000
100,000
80,000
60,000
40,000
20,000
0
-20,000
-40,000
2004
MIL
LIO
N €
EU TRADE FLOWS WITH ASEAN, 2004-2014IMPORTS
EXPORTS
BALANCE
69,707
43,071
-26,636
2005
71,761
44,687
-27,074
2006
79,271
48,590
-30,681
2007
81,184
53,207
2008
-27,977
80,306
56,349
-23,957
14

EU TRADE IN GOODS WITH ASEAN BY MAIN PRODUCT CATEGORIES (MIO €), 2014
IMPORTS SHARE % EXPORTS SHARE %
Primary products 17,688 17.6 11,460 14.6
Manufactures 81,198 80.7 64,979 82.7
Chemicals 8,783 8.7 11,152 14.2
Machinery and transport equipment 43,439 43.2 39,871 50.7
Textiles 1,064 1.1 613 0.8
Clothing 8,064 8.0 524 0.7
Other products 442 0.4 1,424 1.8
TOTAL 100,539 100.0 78,631 100.0
EU TRADE FLOWS WITH ASEAN, 2004-2014
2009
68,379
50,206
-18,173
2010
85,828
61,829
-23,999
2011
94,156
69,176
-24,980
2012
99,104
81,594
-17,510
2013
96,797
81,697
-15,100
2014
100,539
78,631
-21,908
15

ASEAN MEMBER STATES’ SHARE OF EU-ASEAN TRADE IN GOODS 2014
THAILANDTOTAL TRADE WITH EU (MIO €) 30,986SHARE OF TOTAL EU-ASEAN TRADE (%) 17.3
MALAYSIATOTAL TRADE WITH EU (MIO €) 33,627SHARE OF TOTAL EU-ASEAN TRADE (%) 18.8
SINGAPORETOTAL TRADE WITH EU (MIO €) 44,909SHARE OF TOTAL EU-ASEAN TRADE (%) 25.1
INDONESIATOTAL TRADE WITH EU (MIO €) 23,843SHARE OF TOTAL EU-ASEAN TRADE (%) 13.3
MYANMARTOTAL TRADE WITH EU (MIO €) 889SHARE OF TOTAL EU-ASEAN TRADE (%) 0.5
16

ASEAN MEMBER STATES’ SHARE OF EU-ASEAN TRADE IN GOODS 2014
BRUNEI DARUSSALAMTOTAL TRADE WITH EU (MIO €) 477SHARE OF TOTAL EU-ASEAN TRADE (%) 0.3
CAMBODIATOTAL TRADE WITH EU (MIO €) 3,317SHARE OF TOTAL EU-ASEAN TRADE (%) 1,9
LAOSTOTAL TRADE WITH EU (MIO €) 405SHARE OF TOTAL EU-ASEAN TRADE (%) 0.2
VIETNAMTOTAL TRADE WITH EU (MIO €) 28,240SHARE OF TOTAL EU-ASEAN TRADE (%) 15.8
PHILIPPINESTOTAL TRADE WITH EU (MIO €) 12,477SHARE OF TOTAL EU-ASEAN TRADE (%) 7.0
17

EU-ASEAN TRADE IN SERVICES
In 2013 the EU’s main partner for trade in services in ASEAN was Singapore (with €29.6 billion), followed by Thailand (€9.4 billion), Malaysia (€7.3billion), Indonesia (€5.5billion) and the Philippines (€3.1 billion). Total trade in services between these five ASEAN countries and the EU reached €54.9 billion in 2013, with a surplus of €3.3 billion in favour of the EU.
EU-ASEAN FDI
In 2013, the EU was ASEAN’s largest investor with €156 billion in FDI stocks held in the region at year-end. According to statistics on ASEAN FDI compiled from submissions of ASEAN Central Banks and National Statistical Offices, in 2013 the EU accounted for 22% of investment flows into ASEAN, followed by Japan (18.7% of investment flows).
If taken as a single entity, in 2013 ASEAN was the 6th most important location of EU FDI stock abroad, while ASEAN was the 8th most important source of FDI stock held in the EU.
EU FDI in ASEAN tends to be concentrated in Singapore, which alone accounts for close to 60% of EU FDI stock in the region, followed by Indonesia (15%) and Malaysia (11%). Similarly, Singapore accounts for the lion’s share (76%) of ASEAN FDI stock held in the EU, followed by Malaysia.
EU-ASEAN TRADE IN SERVICES BY KEY PARTNER COUNTRY (MIO €), 2013
EU IMPORTS EU EXPORTS BALANCE TOT TRADE
SINGAPORE 13,115 16,491 3,376 29,606
THAILAND 5,964 3,454 -2,510 9,418
MALAYSIA 3,156 4,165 1,009 7,321
INDONESIA 1,879 3,657 1,778 5,536
PHILIPPINES 1,678 1,374 -304 3,052
TOTAL FOR ASEAN 5 25,792 29,141 3,349 54,933
Main services imported by the EU from these five ASEAN countries included transport, travel, financial and business related services, while main services exported by the EU to these countries included telecommunication, business, transport and travel related services, as well as royalties for the use of intellectual property.
18

EU-ASEAN FDI STOCK AND FLOWS (MIO €), 2013
STOCKS FLOWS
HELD BY THE EU IN
ASEAN COUNTRY
HELD BY ASEAN
COUNTRY IN THE EU
FROM THE EU
TO ASEAN COUNTRY
FROM ASEAN
COUNTRY TO THE EU
SINGAPORE 93,163 43,652 10,975 6,817
INDONESIA* 22,838 -1,336 1,323 -139
MALAYSIA 17,438 14,010 1,941 618
THAILAND 10,378 720 -2,793 305
PHILIPPINES 6,233 573 283 204
VIETNAM 3,914 14 2,212 -55
CAMBODIA 1,574 24 9 25
BRUNEI DARUSSALAM 376 58 97 7
MYANMAR 263 0 61 0
LAOS* 251 -37 23 -1
ASEAN 156,428 57,678 14,131 7,781
* Negative FDI stock may be recorded when (i) continuous losses in the direct investment enterprise lead to negative reserves; (ii) the value of loans /debt securities extended by direct investment enterprise to foreign direct investors exceeds the corresponding value advanced by foreign direct investors to the direct investment enterprise.
19

THE BILATERAL PERSPECTIVE: EU-SINGAPORE TRADE & INVESTMENT TIES
Singapore continues to be the EU’s most important trading partner in ASEAN and a key destination for investments from the EU. Last year was an important milestone as the EU and Singapore concluded negotiations on the Investment Chapter of the EU-Singapore FTA. The chapter commits both the EU and Singapore to ensuring a stable and fair regime for foreign investors while preserving the right of the parties to regulate in the public’s interest (see box on page 27). The conclusion of the investment chapter paves the way towards the ratification and implementation of the Agreement.
With extensive commitments by both parties to provide greater access to each other’s markets, including through the liberalisation of services, investment and procurement markets, and the removal of tariff or non-tariff barriers to trade, once it is signed, the EUSFTA will further enhance the strong trade flows between the EU and Singapore.
EU-SINGAPORE TRADE IN GOODS
Trade in goods between the EU and Singapore has remained resilient despite the instability in the global economic environment. Between 2004 and 2014, total EU-Singapore trade grew by 3.1% per annum and in 2014 the EU remained Singapore’s third most important trade partner, behind only China and Malaysia. In 2014, total EU imports from Singapore reached €16.6 billion, while the EU exported €28.3 billion worth of goods to Singapore, resulting in a trade balance of €11.6 billion in favour of the EU.
20

EU-SINGAPORE TRADE IN GOODS (MIO €), 2004-2014
IMPORTS EXPORTS TOTAL TRADE % CHANGE Y-O-Y
2004 16,935 16,212 33,147 -
2005 18,459 17,310 35,769 7.9
2006 19,307 19,597 38,904 8.8
2007 18,478 20,558 39,036 0.3
2008 16,152 22,272 38,424 -1.6
2009 14,594 20,440 35,034 -8.8
2010 18,772 24,556 43,328 23.7
2011 19,197 27,265 46,462 7.2
2012 21,559 30,414 51,973 11.9
2013 17,624 29,129 46,753 -10.0
2014 16,637 28,272 44,909 -3.9
21

32,000 30,000 28,000 26,000 24,000 22,000 20,000 18,000 16,000 14,000 12,000 10,000
8,000 6,000 4,000 2,000
0 -2,000
MIL
LIO
N €
EU TRADE WITH SINGAPORE, 2004-2014
Bilateral trade between the EU and Singapore is structurally dominated by a few manufactured products sectors. Machinery and transport equipment and chemical products are the largest categories for both imports and exports with the City State. In 2014, the combined value of these sectors represented 71.4% of Singapore’s supply and 60.7% of EU sales to Singapore. Finally it is also worth noting that almost a fifth of EU exports to the City State are primary products (€5.3 billion value in 2014).
IMPORTS
EXPORTS
BALANCE2004
16,93516,212
-723
2005
18,459
17,310
-1,149
2006
19,307
19,597
290
2007
18,478
20,558
2008
2,080
16,152
22,272
6,120
22

EU-SINGAPORE TRADE IN GOODS BY MAIN PRODUCT CATEGORIES (MIO €), 2014
IMPORTS SHARE % EXPORTS SHARE %
Primary products 1,208 7.3 5,320 18.8
Manufactures 14,196 85.3 22,254 78.7
Chemicals 5,548 33.3 4,012 14.2
Machinery and transport equip. 6,342 38.1 13,135 46.5
Other manufactures 1,882 11.3 2,922 10.3
Other products 204 1.2 456 1.6
TOTAL 16,637 100 28,272 100
6,120
2009
14,594
20,440
5,846
2010
18,772
24,556
5,784
2011
19,197
27,265
8,068
2012
21,559
30,414
8,855
2013
17,624
29,129
11,505
2014
16,637
28,272
11,635
23

EU-SINGAPORE TRADE IN SERVICES
As mature economies, the EU and Singapore have a similar economic structure, with the services sector accounting for close to 75% of GDP. In 2013, bilateral trade in services between the EU and Singapore reached €29.6 billion with the EU importing €13.1 billion worth of services from Singapore and exporting €16.5 billion worth of services. This made Singapore the 8th most important country of destination for EU services – ahead of Hong Kong, South Korea, India and Brazil. Singapore was also the 8th most important supplier of services to the EU – ahead of Hong Kong, India, Canada, Australia, Brazil, Thailand and South Korea.
In 2013 the EU remained Singapore’s most important trading partner for services, accounting for 18.1% of Singapore’s imports of services – compared to 15.6% for the US and 5% for ASEAN – and 13.3% of Singapore’s exports of services – compared to 11.8% for the US and 10.0% for ASEAN.
The EU’s imports of services from Singapore were concentrated in a few sectors, namely transport services €5.0 billion (or 38.5% of total services imports), business services €3.7 billion (or 27.9% of total services imports) and financial services €2.1 billion (or 15.8% of total services imports). The EU’s exports of services to Singapore were also dominated by transport services €4.8 billion (or 28.8% of total exports), business services €3.9 billion (23.7% of total exports) and royalties for the use of intellectual property €2.5 billion (15.0% of total exports).
TRADE IN SERVICES EU WITH SINGAPORE 2011-2013 (MIO €) (1)
DEBITS (IMPORTS) CREDITS (EXPORTS) NET ( BALANCE ) 2011 2012 2013 2011 2012 2013 2011 2012 2013
Manufacturing services on physical inputs owned by others
84 108 85 336 264 234 252 156 149
Maintenance and repair services n.i.e. 88 92 167 230 192 245 141 100 77
Transport 4,192 4,190 5,044 3,198 3,421 4,755 -994 -769 -289
Sea transport 2,749 2,591 3,241 2,462 2,615 3,911 -287 24 670
Air transport 1,146 1,286 1,460 511 557 560 -636 -729 -899
Other modes of transport 287 300 335 200 191 224 -88 -109 -111
Postal and courier services 8 10 10 25 56 60 17 46 51
Travel 334 440 470 464 532 507 131 93 37
Construction 133 199 182 83 167 147 -50 -32 -35
Insurance and pension services 87 118 57 370 238 375 283 120 319
Financial services 1,546 1,337 2,067 1,327 1,419 1,605 -219 81 -462
Charges for the use of intellectual property 1 76 460 3,375 1,849 2,472 3,374 1,773 2,012
Telecommunications, computer, and information services
542 622 741 1,535 2,021 1,943 993 1,399 1,202
Other business services 3,860 3,892 3,661 2,698 3,261 3,914 -1,162 -632 253
Personal, cultural and recreational services 48 54 44 76 149 129 29 95 85
Government goods and services 73 150 125 33 28 36 -40 -122 -90
Services not allocated 2 4 2 - 146 128 -2 143 126
TOTAL 10,998 11,292 13,115 13,750 13,743 16,550 2,753 2,450 3,435
(1) 2011: EU-27. 2012 and 2013: EU-28.
24

TRADE IN SERVICES EU WITH SINGAPORE 2011-2013 (MIO €) (1)
DEBITS (IMPORTS) CREDITS (EXPORTS) NET ( BALANCE ) 2011 2012 2013 2011 2012 2013 2011 2012 2013
Manufacturing services on physical inputs owned by others
84 108 85 336 264 234 252 156 149
Maintenance and repair services n.i.e. 88 92 167 230 192 245 141 100 77
Transport 4,192 4,190 5,044 3,198 3,421 4,755 -994 -769 -289
Sea transport 2,749 2,591 3,241 2,462 2,615 3,911 -287 24 670
Air transport 1,146 1,286 1,460 511 557 560 -636 -729 -899
Other modes of transport 287 300 335 200 191 224 -88 -109 -111
Postal and courier services 8 10 10 25 56 60 17 46 51
Travel 334 440 470 464 532 507 131 93 37
Construction 133 199 182 83 167 147 -50 -32 -35
Insurance and pension services 87 118 57 370 238 375 283 120 319
Financial services 1,546 1,337 2,067 1,327 1,419 1,605 -219 81 -462
Charges for the use of intellectual property 1 76 460 3,375 1,849 2,472 3,374 1,773 2,012
Telecommunications, computer, and information services
542 622 741 1,535 2,021 1,943 993 1,399 1,202
Other business services 3,860 3,892 3,661 2,698 3,261 3,914 -1,162 -632 253
Personal, cultural and recreational services 48 54 44 76 149 129 29 95 85
Government goods and services 73 150 125 33 28 36 -40 -122 -90
Services not allocated 2 4 2 - 146 128 -2 143 126
TOTAL 10,998 11,292 13,115 13,750 13,743 16,550 2,753 2,450 3,435
(1) 2011: EU-27. 2012 and 2013: EU-28.
25
EU-SINGAPORE BILATERAL INVESTMENT TIES
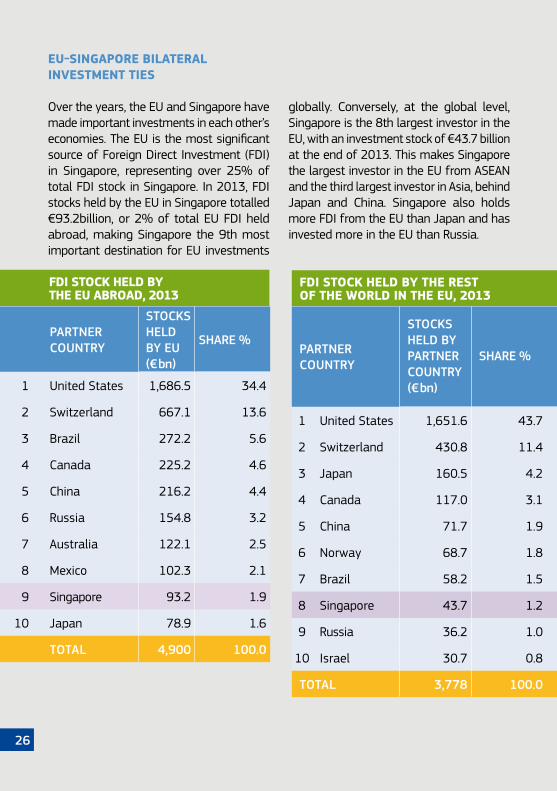
Over the years, the EU and Singapore have made important investments in each other’s economies. The EU is the most significant source of Foreign Direct Investment (FDI) in Singapore, representing over 25% of total FDI stock in Singapore. In 2013, FDI stocks held by the EU in Singapore totalled €93.2billion, or 2% of total EU FDI held abroad, making Singapore the 9th most important destination for EU investments
FDI STOCK HELD BY THE EU ABROAD, 2013
PARTNER COUNTRY
STOCKS HELD BY EU (€ bn)
SHARE %
1 United States 1,686.5 34.4
2 Switzerland 667.1 13.6
3 Brazil 272.2 5.6
4 Canada 225.2 4.6
5 China 216.2 4.4
6 Russia 154.8 3.2
7 Australia 122.1 2.5
8 Mexico 102.3 2.1
9 Singapore 93.2 1.9
10 Japan 78.9 1.6
TOTAL 4,900 100.0
INVESTMENT PROTECTION IN THE EUSFTA
The Chapter on Investment Protection introduces important innovations, ensuring a high level of investment protection while preserving the EU and Singapore’s right to regulate and pursue legitimate public policy objectives such as the protection of health, safety, or the environment. These provisions not only set the basis for enhanced trade and investment relations between the EU and Singapore, but lead the way for the entire Southeast Asia region.
Many improvements are not present in the 12 Bilateral Investment Treaties (BITs) currently in place between Singapore and a number of EU Member States. Existing bilateral BITs will eventually be replaced by the EUSFTA, which will clarify investment protection rules and standards and improve how investment disputes are settled. The table below offers a top-line analysis of the key provisions in the EUSFTA.
FDI STOCK HELD BY THE REST OF THE WORLD IN THE EU, 2013
PARTNER COUNTRY
STOCKS HELD BY PARTNER COUNTRY (€ bn)
SHARE %
1 United States 1,651.6 43.7
2 Switzerland 430.8 11.4
3 Japan 160.5 4.2
4 Canada 117.0 3.1
5 China 71.7 1.9
6 Norway 68.7 1.8
7 Brazil 58.2 1.5
8 Singapore 43.7 1.2
9 Russia 36.2 1.0
10 Israel 30.7 0.8
TOTAL 3,778 100.0
globally. Conversely, at the global level, Singapore is the 8th largest investor in the EU, with an investment stock of €43.7 billion at the end of 2013. This makes Singapore the largest investor in the EU from ASEAN and the third largest investor in Asia, behind Japan and China. Singapore also holds more FDI from the EU than Japan and has invested more in the EU than Russia.
INVESTMENT STANDARDS
Right to regulate Made explicit in the Preamble, with a specific reference to public policy objectives
Fair and Equitable Treatment A closed list of state behaviour that can constitute a violation (like denial of justice or arbitrariness)
Indirect expropriation Annex containing guidance, including various safeguards against abuses
ISDS
Transparency Full transparency
Choice of arbitrators Disputing parties –if no agreement Parties use pre-established roster (EU and Singapore)
Ethics of arbitrators Detailed and binding Code of Conduct – policed by independent actor
Prevention of fraudulent or manipulative claims Explicit rules against abusive claims
Parallel claims Prohibited
Party control Binding interpretations + submissions in all proceedings
Costs Loser pays
Appellate mechanism Possibility to develop
26

INVESTMENT PROTECTION IN THE EUSFTA
The Chapter on Investment Protection introduces important innovations, ensuring a high level of investment protection while preserving the EU and Singapore’s right to regulate and pursue legitimate public policy objectives such as the protection of health, safety, or the environment. These provisions not only set the basis for enhanced trade and investment relations between the EU and Singapore, but lead the way for the entire Southeast Asia region.
Many improvements are not present in the 12 Bilateral Investment Treaties (BITs) currently in place between Singapore and a number of EU Member States. Existing bilateral BITs will eventually be replaced by the EUSFTA, which will clarify investment protection rules and standards and improve how investment disputes are settled. The table below offers a top-line analysis of the key provisions in the EUSFTA.
PARTNER COUNTRY
STOCKS HELD BY PARTNER COUNTRY (€ bn)
SHARE %
1 United States 1,651.6 43.7
2 Switzerland 430.8 11.4
3 Japan 160.5 4.2
4 Canada 117.0 3.1
5 China 71.7 1.9
6 Norway 68.7 1.8
7 Brazil 58.2 1.5
8 Singapore 43.7 1.2
9 Russia 36.2 1.0
10 Israel 30.7 0.8
TOTAL 3,778 100.0
INVESTMENT STANDARDS
Right to regulate Made explicit in the Preamble, with a specific reference to public policy objectives
Fair and Equitable Treatment A closed list of state behaviour that can constitute a violation (like denial of justice or arbitrariness)
Indirect expropriation Annex containing guidance, including various safeguards against abuses
ISDS
Transparency Full transparency
Choice of arbitrators Disputing parties –if no agreement Parties use pre-established roster (EU and Singapore)
Ethics of arbitrators Detailed and binding Code of Conduct – policed by independent actor
Prevention of fraudulent or manipulative claims Explicit rules against abusive claims
Parallel claims Prohibited
Party control Binding interpretations + submissions in all proceedings
Costs Loser pays
Appellate mechanism Possibility to develop
27

INVESTMENT HIGHLIGHTS 2014 – SINGAPORE INVESTMENTS IN THE EU
As testament to Singapore’s confidence in the recovery and long-term prospects of the EU, 2014 saw the City-State make an important number of investments in Europe. Figures from GIC, one of Singapore’s Sovereign Wealth Funds (SWF), indicate that it increased its exposure in Europe considerably, with over 30 deals in the period 2013-2014, including a €300 million investment in real estate in Italy and Spain.
In 2014, Temasek, Singapore’s other SWF, also increased its focus on Europe by opening an office in the United Kingdom from which to support and expand its investment interests. While Temasek is already an important investor in Europe – with participations in investments in Repsol; Evonik Industries AG; Standard Chartered; AS Watson; Lloyds Banking Group and Markit Group – it also invested over €500 million in a financial services group based in the Netherlands and a British peer-to-peer lender.
Other significant investments made by Singapore-based companies in 2014 include deals in the hospitality industry (with €107 million in hotel acquisitions in Germany and Denmark) and the acquisition of a data centre in the Netherlands by Keppel’s telecommunications and transport unit.
28

INVESTMENT HIGHLIGHTS 2014 – EU INVESTMENTS IN SINGAPORE
In 2014, European companies reaffirmed their long-standing commitment to Singa-pore. Important commitments include an investment of over €20 million by a lead-ing German transport and logistic company (DHL) in a new facility located within the Changi Airfreight centre, set to be concluded in 2016.
French telecommunications company Al-catel-Lucent also signed a contract in 2014 with South East Asia-Middle East-Western Europe 5 (SEA-ME-WE 5) a consortium of 15 leading telecommunications operators to create an under-sea cable system. With a system capacity of 24 Tbps, the SEA-ME-WE 5 system will span 20,000 km con-necting 17 countries from Singapore to the Middle East to France and Italy, delivering ultra-broadband capacity and faster access to consumers and businesses.
European companies in a number of other sectors also announced the establishment of new regional headquarters in the City-State, including major investments by lead-ing Dutch health and wellbeing company (Philips) and a large French ophthalmic optics company (Essilor), which opened a new HQ and innovation facility.
29
EU BUSINESS AVENUES: PARTNERING GROWTH IN SOUTHEAST ASIA
The importance of SMEs to the EU cannot be overstated. SMEs form the backbone of the EU’s domestic economy and play a key role in the EU’s trade performance. For instance, the EU has over 600,00 exporting SMEs – over 80% of the total number of EU exporting firms – accounting for about €500 billion or 1/3 of total extra-EU exports and employing over 6 million people across the continent. However, despite exporting SMEs representing a large share of total exporting enterprises, they constitute a small share of the millions of existing SMEs in the EU.
This is why, as part of its overall competi-tiveness strategy to support SMEs’ economic activities outside the EU and in view of mo-bilizing their untapped export potential, in 2014 the EU launched the Business Avenues to Southeast Asia programme.
EU Business Avenues to Southeast Asia is a business support programme built on the successful EU Gateway model. Over the past 20 years, the EU Gateway to Japan and Korea has accompanied more than 3000 EU SMEs in the lifestyle, fashion, healthcare, environment, energy, construction and building related sectors to these countries. EU Gateway has resulted in significant new business collaborations and revenue growth for both European SMEs and local partners, with ex-post evaluations showing that for every €1 invested in the programme, EU companies got €5 back in extra revenue, within one year. Over the coming years, Business Avenues will look to replicate this success in Southeast Asia.
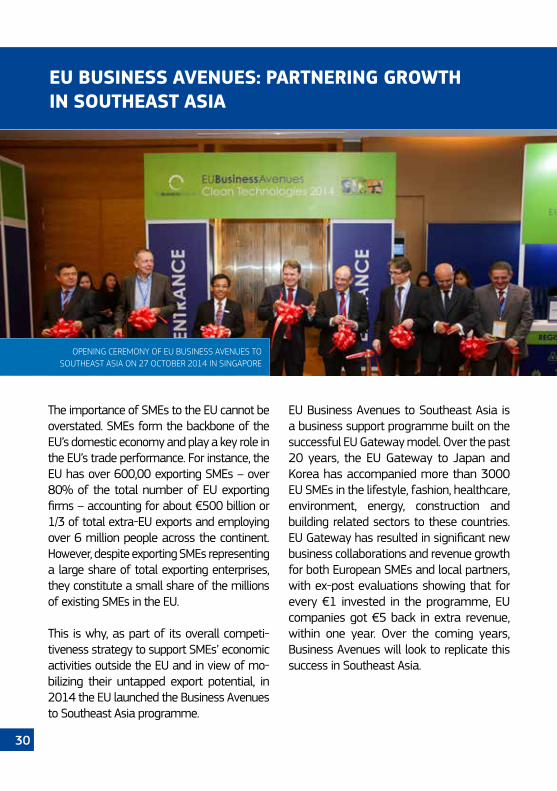
OPENING CEREMONY OF EU BUSINESS AVENUES TO SOUTHEAST ASIA ON 27 OCTOBER 2014 IN SINGAPORE
30

During the pilot phase of the programme (March 2014 to October 2015) Business Avenues brought over 100 SMEs from across the European Union (EU) to Singapore, Malaysia and Vietnam to showcase a broad range of technologies, services and products in a bid to explore new business opportunities. Focusing on Clean Technologies (including energy and water management software, advanced materials for construction and green building applications and waste management technologies) and home décor (small furnishings, contemporary furniture and premium lighting, bathroom and home accessories) the pilot programme will be followed by a full-fledged 5 year business support programme that will bring 1000 European SMEs in a number of different sectors to the region between 2016-2020.
In a way, the inauguration of this programme marks the maturity of the ASEAN region as an important export market. As the regional ‘hub’ for Clean Technologies and premium ‘home décor’ products, Singapore was chosen as the entry point from which to extend to neighbouring countries. Companies participating in the future Business Avenues programme will also have the option of travelling to Indonesia, Malaysia, Philippines, Thailand and Vietnam to explore additional business opportunities in these emerging economies and to team up with local businesses to establish lasting partnerships for growth.
31
EU AMBASSADOR DR MICHAEL PULCH, AMBASSADOR OF SWEDEN MR HAKAN JEVRELL AND SENIOR MINISTER OF STATE MR LEE YI SHYAN AT EUROPEAN DESIGN 2015
