eu survey on issues related to transport and mobility...eu survey on issues related to transport and...
TRANSCRIPT

Davide Fiorello
Loredana Zani
EU Survey on issues related to transport and mobility
2015
Report EUR 27334 EN

European Commission
Joint Research Centre
Institute for Prospective Technological Studies
Contact information
Panayotis Christidis
Elena Navajas
Address: Edificio Expo. c/ Inca Garcilaso, 3. E-41092 Seville (Spain)
E-mail: [email protected]
Tel.: +34 954488318
Fax: +34 954488300
https://ec.europa.eu/jrc
https://ec.europa.eu/jrc/en/institutes/ipts
Legal Notice
This publication is a Science and Policy Report by the Joint Research Centre, the European Commission’s in-house science
service. It aims to provide evidence-based scientific support to the European policy-making process. The scientific output
expressed does not imply a policy position of the European Commission. Neither the European Commission nor any person
acting on behalf of the Commission is responsible for the use which might be made of this publication.
All images © European Union 2015
JRC96151
EUR 27334 EN
ISBN 978-92-79-49281-5 (PDF)
ISSN 1831-9424 (online)
doi:10.2791/48322
Luxembourg: Publications Office of the European Union, 2015
© European Union, 2015
Reproduction is authorised provided the source is acknowledged.
Abstract
The main purpose of the survey was to collect data on car use, on use of transport modes for long distance mobility as well as on some other policy relevant issues (e.g. the attitude towards internalisation of road external costs by means of road charging). The survey involved all the 28 European countries. In each country a sample of 1000 individuals (500 in Cyprus, Luxembourg and Malta) was asked to fill in a questionnaire divided into four sections: a. general information on the respondent (e.g. age, gender, living area) as well as details on availability of cars and public transport service. b. information on everyday mobility in terms of mode used, frequency of trips, duration, distance, inter-modality and opinions on main problems experienced. c. information long distance trips (between 300 km and 1000 km as well as over 1000 km) made in the last 12 months; number of trips by purpose and main mode; connections between rail and air transport. d. opinions on aspects related to the European transport policy and especially on the scope for road charging.

EU Survey on issues related to transport and mobility
i
TABLE OF CONTENTS
1 INTRODUCTION ................................................................................................................... 1
2 INDIVIDUAL CHARACTERISTICS .................................................................................... 3
2.1 KEY FINDINGS .................................................................................................................................... 3
2.2 LIVING PLACE ..................................................................................................................................... 4
2.3 LEVEL OF PUBLIC TRANSPORT SERVICE IN THE LIVING AREA ......................................................... 6
2.4 DRIVING LICENCE AND CAR AVAILABILITY ...................................................................................... 8
2.5 DRIVING SKILLS ............................................................................................................................... 12
3 MOST FREQUENT TRIP ................................................................................................... 13
3.1 KEY FINDINGS .................................................................................................................................. 13
3.2 TRIP FREQUENCY............................................................................................................................. 14
3.3 TRANSPORT MODES USED............................................................................................................... 16
3.4 MULTIMODAL TRIPS ....................................................................................................................... 18
3.5 CAR OCCUPANCY .............................................................................................................................. 19
3.6 TRIP DURATION .............................................................................................................................. 21
3.7 TRIP LENGTH ................................................................................................................................... 23
3.8 PROBLEMS EXPERIENCED BY CAR USERS ....................................................................................... 25
4 LONG DISTANCE TRIPS ................................................................................................... 27
4.1 KEY FINDINGS .................................................................................................................................. 27
4.2 LONG DISTANCE TRIPS OVER 1000 KM ......................................................................................... 28
4.2.1 Number of trips over 1000 for working and studying ................................................................... 28
4.2.2 Number of trips over 1000 for leisure and personal purposes ...................................................... 30
4.2.3 Transport modes used for trips over 1000 km ............................................................................... 31
4.3 LONG DISTANCE TRIPS BETWEEN 300 AND 1000 KM ................................................................. 34
4.3.1 Number of trips between 300 and 1000 km for working and studying ......................................... 34
4.3.2 Number of trips between 300 and 1000 km for leisure and personal purposes ............................ 36
4.3.3 Transport modes used for trips between 300 and 1000 km .......................................................... 38
4.4 INTERMODALITY PLANE/RAIL ....................................................................................................... 40
5 ATTITUDES TOWARDS INNOVATIVE TRANSPORT AND TRANSPORT POLICY43
5.1 KEY FINDINGS .................................................................................................................................. 43
5.2 ELECTRIC VEHICLES......................................................................................................................... 44
5.3 CAR SHARING ................................................................................................................................... 47
5.4 LEVEL OF CONCERN FOR THE IMPACT OF TRAFFIC ON THE ENVIRONMENT ................................. 50
5.5 ATTITUDE TOWARDS ROAD CHARGING ......................................................................................... 51
6 CONCLUSIONS ..................................................................................................................... 58
REFERENCES ................................................................................................................................. 60
TECHNICAL ANNEX – REPRESENTATIVENESS OF THE SAMPLE AND INFLUENCES ON RELIABILITY OF RESULTS .......................................................................... 61

EU Survey on issues related to transport and mobility
ii
LIST OF FIGURES
Figure 2-1: Distribution of respondents by living area, EU28 ......................................................................... 4
Figure 2-2: Distribution of respondents by living area. ..................................................................................... 4
Figure 2-3: Distribution of respondents by city area, EU28 ............................................................................. 5
Figure 2-4: Distribution of respondents by city area and by country .......................................................... 5
Figure 2-5: Distribution of respondents by PT service level, EU28 .............................................................. 6
Figure 2-6: Distribution of respondents by PT service level by country .................................................... 7
Figure 2-7: PT service level by living area, EU28 ................................................................................................. 7
Figure 2-8: Availability of driving licence, EU28 ................................................................................................... 8
Figure 2-9: Availability of driving licence by country ......................................................................................... 8
Figure 2-10: Availability of driving licence by age group .................................................................................. 9
Figure 2-11: Average number of available cars per household by country ............................................ 10
Figure 2-12: Average number of available cars per adult by country ...................................................... 10
Figure 2-13: Average number of available cars per adult by living area, EU28 .................................... 11
Figure 2-14: Average number of available cars per adult by income, EU28 .......................................... 11
Figure 2-15: Self-assessment driving skills, EU28 ............................................................................................ 12
Figure 2-16: Self-assessment driving skills .......................................................................................................... 12
Figure 3-1: Frequency of the most frequent trip, EU28 .................................................................................. 14
Figure 3-2: Frequency of the most frequent trip by country ........................................................................ 15
Figure 3-3: Frequency of the most frequent trip by employment status, EU28 ................................... 15
Figure 3-4: Main Transport Mode used for the most frequent trip, EU28 .............................................. 16
Figure 3-5: Main Transport Mode used for the most frequent trip by country .................................... 17
Figure 3-6: Main Transport Mode by living area, EU28 .................................................................................. 17
Figure 3-7: Number of modes used for the most frequent trip, EU28 ...................................................... 18
Figure 3-8: Number of modes used for the most frequent trip by country ............................................ 18
Figure 3-9: Combination of modes used for the most frequent trip – EU28 .......................................... 19
Figure 3-10: Combination of modes used for the most frequent trip by country ................................ 19
Figure 3-11: Car occupancy rate by country ................................................................................................. 20
Figure 3-12: Average duration of most frequent trip by country ..................................................... 21
Figure 3-13: Average duration of most frequent trip by mode .......................................................... 22
Figure 3-14: Average distance of most frequent trip by country ...................................................... 23
Figure 3-15: Average distance of most frequent trip by mode ........................................................... 24
Figure 3-16: Problems experienced concerning the most frequent trip by car users, EU28 ................................................................................................................................................................................................ 25
Figure 3-17: Problems experienced concerning the most frequent trip by car users by country ............................................................................................................................................................................... 25

EU Survey on issues related to transport and mobility
iii
Figure 3-18: Problems experienced concerning the most frequent trip by car users by living area ......................................................................................................................................................................... 26
Figure 4-1: Number of trips > 1000 km for working, business, study purposes, EU28 ......... 28
Figure 4-2: Number of trips > 1000 km for study purposes, EU28 ................................................... 28
Figure 4-3: Number of trips > 1000 km for working, business, study purposes by country ................................................................................................................................................................................................ 29
Figure 4-4: Number of trips > 1000 km for study purposes by country ........................................ 29
Figure 4-5: Number of trips > 1000 km for leisure and personal purposes - EU28 ................ 30
Figure 4-6: Number of trips > 1000 km for visiting purposes - EU28 ............................................. 30
Figure 4-7: Number of trips > 1000 km for leisure and personal purposes by country ....... 31
Figure 4-8: Number of trips > 1000 km for visiting purposes by country .................................... 31
Figure 4-9: Modal split of trips > 1000 km – EU28 ..................................................................................... 32
Figure 4-10: Modal split of trips > 1000 km for working, business, study purposes by country ............................................................................................................................................................................... 33
Figure 4-11: Modal split of trips > 1000 km for personal purposes by country ....................... 33
Figure 4-12: Number of trips 300-1000 km for working, business, study purposes, EU28 ............ 34
Figure 4-13: Number of trips 300-1000 km for study purposes, EU28 ................................................... 34
Figure 4-14: Number of trips 300-1000 km for working, business, study purposes by country .. 35
Figure 4-15: Number of trips 300-1000 km for study purposes by country ............................... 35
Figure 4-16: Number of trips 300-1000 km for personal purposes, EU28 .................................. 36
Figure 4-17: Number of trips 300-1000 km for visiting purposes, EU28...................................... 36
Figure 4-18: Number of trips 300-1000 km for personal purposes by country ....................... 37
Figure 4-19: Number of trips 300-1000 km for visiting purposes by country ........................... 37
Figure 4-20: Modal split of trips 300-1000 km by mode, EU28 .......................................................... 38
Figure 4-21: Mode split of trips 300-1000 km for working, business, study purposes by country ............................................................................................................................................................................... 38
Figure 4-22: Mode split of trips 300-1000 km for personal purposes by country .................. 39
Figure 4-23: Frequency of the use of rail to or from airports, EU28 ................................................ 40
Figure 4-24: Frequency of the use of rail to or from airports by country ..................................... 41
Figure 4-25: Frequency of the use of rail to reach airports by living area ................................... 41
Figure 4-26: Experience with connections between rail and air - EU28 ....................................... 42
Figure 4-27: Experience with connections between rail and air by country .............................. 42
Figure 5-1: Propensity to consider the purchase of an electric car - EU28 .................................. 44
Figure 5-2: Propensity to consider the purchase of an electric car by country ........................ 45
Figure 5-3: Propensity to consider the purchase of an electric by gender, EU28 .................... 45
Figure 5-4: Propensity to consider the purchase of an electric by age, EU28 ............................ 46
Figure 5-5: Knowledge of car sharing systems, EU28 .............................................................................. 47
Figure 5-6: Knowledge of car sharing systems ............................................................................................ 47
Figure 5-7: Propensity to subscribe a car sharing system, EU28 ...................................................... 48

EU Survey on issues related to transport and mobility
iv
Figure 5-8: Propensity to subscribe a car sharing system by country ........................................... 49
Figure 5-9: Propensity to subscribe a car sharing system by mode used, EU28 ....................... 49
Figure 5-10: Level of concern regarding pollution caused by cars by country .......................... 50
Figure 5-11: Level of concern regarding pollution caused by cars by mode used, EU28 ..... 50
Figure 5-12: Preferred policy option to fight urban congestion and pollution - EU28 ......... 51
Figure 5-13: Preferred policy option to fight urban congestion and pollution by country 51
Figure 5-14: Preferred policy option of car drivers to fight urban congestion and pollution, EU28 .............................................................................................................................................................. 52
Figure 5-15: Preferred policy option of car drivers to fight urban congestion and pollution by country ......................................................................................................................................................................... 52
Figure 5-16: Reasons for opposing to road charging - EU28 ................................................................ 53
Figure 5-17: Reasons for opposing road charging by country ............................................................ 53
Figure 5-18: Preferred road charging system - EU28 .............................................................................. 54
Figure 5-19: Preferred road charging system by country ..................................................................... 54
Figure 5-20: Preferred road charging system by those who agree with tolls - EU28 ............. 55
Figure 5-21: Preferred road charging system by those who agree with tolls by country.... 55
Figure 5-22: Preferred use of road charging revenues, EU28 ............................................................. 56
Figure 5-23: Preferred use of road toll revenues ....................................................................................... 56
Figure 5-24: Preferred use of road toll revenues of those who agree with tolls, EU28......... 57
Figure 5-25: Preferred use of road toll revenues of those who agree with tolls ...................... 57

EU Survey on issues related to transport and mobility
1
1 Introduction The transport system is a key field for the European policy. When looking in detail at the multifaceted world of transportation, the overall goals of the European transport policy can be further defined in specific objectives and targets. The success of the transport policy depends on in its capability to attain such targets. In order to understand whether targets are being approached, data is needed to measure trends in the transport sector.
Despite transport statistics having become richer and richer within the Eurostat domain, projects like ETIS and ETISplus have produced large sets of European-wide data and several other projects have contributed to collect useful information on transport, the need for monitoring the progress towards the relevant goals of the White Paper requires that this information is integrated. More data is needed to define suitable parameters, to measure their value in all EU Member States and to measure them over time to follow the effects of the most important European transport policies.
For these reasons, the Joint Research Centre – Institute for Perspective and Technological Studies (JRC-IPTS) of the European Commission selected TRT Trasporti e Territorio and IPSOS to carry out a EU wide transport survey. The main purpose of the survey was to collect data on car use, on use of transport modes for long distance mobility as well as on some other policy relevant issues (e.g. the attitude towards internalisation of road external costs by means of road charging). However, the survey broadened a little bit its scope and investigated several aspects of the mobility at the European level.
The survey involved all the 28 European countries. In each country a sample of 1000 individuals (500 in Cyprus, Luxembourg and Malta) was asked to fill in a questionnaire divided into four sections1:
A first section designed to collect general information on the respondent (e.g. age, gender, living area)as well as details on availability of cars and public transport service.
A second section investigating on everyday mobility in terms of mode used, frequency of trips,duration, distance, intermodality and also collecting judgments on main problems experienced.
The third section focused on long distance trips (between 300 km and 1000 km as well as over 1000km) made in the last 12 months. The number of trips by different purpose and the main modes usedwere collected. A few questions were focused on connections between rail and air transport.
The last section devoted to collect the opinions of the respondents about some aspects related to theEuropean transport policy and especially on the scope for road charging.
The questionnaire was exactly the same (translated in the local languages) for each country so that responses obtained are fully comparable.
In each country the sample was segmented according to some socio-economic characteristics. A weighting procedure was applied in order to ensure that the responses were estimated on a sample reflecting the composition of EU adult population (from 16 years on) in terms of gender, age class, employment status and living region.
The survey was administered using the CAWI (Computer Aided Web Interview) methodology during the month of June 2014. The CAWI methodology allowed savings on direct costs (logistics and interviewers) with respect to phone interviews granting at the same time a high (or higher) level of quality in terms of sampling procedures, data collection, field monitoring, data processing. Details on the methodology are provided in the Evaluation Report of the survey (Deliverable D4).
1 The questionnaire is reported in Deliverable D3 of the study.

EU Survey on issues related to transport and mobility
2
This report is the final deliverable of the study and provides a large overview of the results collected. The report is divided into four main chapters, each one devoted to analyse responses to one section of the questionnaire. Thus, Chapter 2 summarises the information collected on personal characteristics of respondents; Chapter 3 presents data on the most frequent trip made by respondents; Chapter 4 introduces results on long distance mobility and; Chapter 5 shows the attitude of respondents towards innovative transport and transport policy. The last chapter provides some final considerations.
It should be considered that the results presented and commented in this report are not exhaustive of the information that can be drawn from the survey data. For instance, using the details collected on personal characteristics of individuals, responses can be analysed for different segments of population: age groups, gender, living region and others. In this report results for specific segments are reported only when they seemed particularly relevant for one reason or another. Additional results are then collected in an Excel workbook annexed to this report. Furthermore, JRC-IPTS have received the full set of elementary data produced by the survey and can therefore use this data for further analyses.

EU Survey on issues related to transport and mobility
3
2 Individual characteristics
2.1 Key findings
Almost half of the respondents declared to live in a place with a good public transport service. On the other hand almost 1 respondent out of 5 declared that the place where he/she lives is not or is poorly provided with public transport services.
As expected, the level of public transport services is better for respondents living in metropolitan areas and large cities. Only 40% of those living in small and medium towns (i.e. almost half of the respondents) are well served by public transport.
More than 80% of respondents hold a driving license with most of the Eastern Europe countries well below this share. Among Western Europe countries only UK and Sweden stay below the EU average.
Individuals aged less than 30 years are significantly less driving permits holders than other individuals.
The EU motorisation rate average is of 1.4 cars available per household and 0.7 cars available per adult component of the household. Again, in general lower values are found for Eastern Europe countries but differences are smaller than for driving licenses.
Income seems linked with car ownership more than the living area. Even lower seems the link with the level of public transport services. Nevertheless in many Western Europe countries the number of cars is larger in higher-middle income households than in high income ones.
The self-perception of driving skills is biased: only a minority of respondents rate themselves as less than the average skilled drivers.

EU Survey on issues related to transport and mobility
4
2.2 Living place
Two third of respondents live in small towns (less than 250.000 in habitants) or rural areas, only one third in large cities or metropolitan areas with more than 1 million inhabitants (Figure 2-1). This distribution is not much different across countries (Figure 2-2). Countries with the highest percentage of population living in rural area are Luxembourg, Malta Austria, Slovenia and Slovakia.
Figure 2-1: Distribution of respondents by living area, EU28
Figure 2-2: Distribution of respondents by living area.
In comparison to Eurostat Regional Yearbook 2012 data (Eurostat, 2012) the sample is a bit more concentrated in urban areas than overall population. Using the Eurostat definition based on a continuous grid, 33% of EU population lives rural areas while this share is 24% in the sample. Larger differences are
24%
44%
19%
13%
Distribution of respondents by living area - EU 28
Rural area
Small or medium town
Large city
Metropolitan area
0%
10%
20%
30%
40%
50%
60%
70%
80%
90%
100%
Au
stri
a
Bel
giu
m
Bu
lgar
ia
Cro
atia
Cyp
rus
Cze
ch R
.
Den
mar
k
Esto
nia
Fin
lan
d
Fran
ce
Ger
man
y
Gre
ece
Hu
nga
ry
Irel
and
Ital
y
Latv
ia
Lith
uan
ia
Luxe
mb
ou
rg
Mal
ta
Net
her
lan
ds
Po
lan
d
Po
rtu
gal
Ro
man
ia
Slo
vaki
a
Slo
ven
ia
Spai
n
Swed
en UK
Distribution of respondents by living area
Metropolitan area Large city Small or medium town Rural area

EU Survey on issues related to transport and mobility
5
found in Bulgaria (only 5% of the sample living in urban areas compared to the 39% of population according to Eurostat) and in Northern Europe countries (Denmark, Finland, Ireland, Lithuania, Sweden). It should be considered however that Eurostat data is based on objective definitions whereas the survey results are qualitative judgments of respondents.
Among the respondents living in urban areas slightly more than a half reported to live in the suburbs (Figure 2-3). Northern Europe countries have in general a higher share of respondents living in suburbs than Southern Europe countries even if there are exceptions (Figure 2-4).
Figure 2-3: Distribution of respondents by city area, EU28
Figure 2-4: Distribution of respondents by city area and by country
53%
47%
Distribution of respondents by city area - EU 28
suburbs
centre of the city
0%
10%
20%
30%
40%
50%
60%
70%
80%
90%
100%
Au
stri
a
Be
lgiu
m
Bu
lgar
ia
Cro
atia
Cyp
rus
Cze
ch R
.
De
nm
ark
Esto
nia
Fin
lan
d
Fran
ce
Ger
man
y
Gre
ece
Hu
nga
ry
Ire
lan
d
Ital
y
Latv
ia
Lith
uan
ia
Luxe
mb
ou
rg
Mal
ta
Net
her
lan
ds
Po
lan
d
Po
rtu
gal
Ro
man
ia
Slo
vaki
a
Slo
ven
ia
Spai
n
Swed
en
UK
Distribution of respondents by city area
centre of the city suburbs

EU Survey on issues related to transport and mobility
6
2.3 Level of public transport service in the living area
82% of the European citizens refer to live in a location well served or relatively well served by public transport (PT). Only 5% of citizens declare to live in an area not served by public transport (Figure 2-5).
In all countries the majority of respondents live in places where public transport service is good or fair, however there are differences between countries like Malta, Netherlands, Poland, Spain – where more than 50% of respondents are well served – and countries like Cyprus, Ireland and Lithuania – where less than 30% are well served and 10% lives in areas without public transport (Figure 2-6). Interestingly, the comparison between Figure 2-2 and Figure 2-6 shows that the share of respondents living in rural areas is not a proxy of the share of respondents not well served by public transport. For instance Austria has one of the largest shares of inhabitants in rural areas but one of the smallest shares of the inhabitants living in areas not served by public transport. Instead in Lithuania the share of respondents living in rural areas is not that high but the share of those complaining of poor public transport service is double compared to EU average.
Figure 2-5: Distribution of respondents by PT service level, EU28
5%
13%
37%
45%
Distribution of respondents by PT service - EU 28
Not served by publictransport
Difficult to reach withpublic transport
Relatively served bypublic transport
Well served by publictransport
0%10%20%30%40%50%60%70%80%90%
100%
Au
stri
a
Be
lgiu
m
Bu
lgar
ia
Cro
atia
Cyp
rus
Cze
ch R
.
De
nm
ark
Esto
nia
Fin
lan
d
Fran
ce
Ger
man
y
Gre
ece
Hu
nga
ry
Ire
lan
d
Ital
y
Latv
ia
Lith
uan
ia
Luxe
mb
ou
rg
Mal
ta
Net
her
lan
ds
Po
lan
d
Po
rtu
gal
Ro
man
ia
Slo
vaki
a
Slo
ven
ia
Spai
n
Swed
en
UK
Distribution of respondents by PT service Well served by public transport Relatively served by public transport
Difficult to reach with public transport Not served by public transport

EU Survey on issues related to transport and mobility
7
Figure 2-6: Distribution of respondents by PT service level by country
Nevertheless, the level of service is linked to the living area type (Figure 2-7). In metropolitan areas the percentage of population not or badly served by public transport is less than 5%. This percentage increases moving to smaller cities and rural areas, where it amounts to almost 40%. Conversely, nearly 70% of respondents living in metropolitan areas are well served by public transport whereas less than 20% of those living in rural areas are. If the overall level of satisfaction with public transport services shown in Figure 2-6 is good is because only 25% of respondents live in rural areas and because even the majority of those living in rural areas are well or relatively well served by public transport anyhow (with differences among countries: as mentioned above the share of rural inhabitants is not correlated with the share of those living in badly served areas, which means that the level of service in rural areas changes country by country. For instance, more than 70% of respondents living in rural areas of Ireland declared a poor public transport connection but only 12% of rural inhabitants in Bulgaria did the same).
This pattern can be found in most of the countries (see Table A2.1 in the Annex). However in some countries slightly different results were obtained:
In Belgium the share of respondents well served by public transport is higher in large cities than in metropolitan areas or
In France the share of respondents not served by public transport is larger in metropolitan areas than in large cities;
in Bulgaria more respondents living in rural areas reported a good level of service than those living in small and medium towns (Bulgaria)
In Hungary, Latvia, Slovakia less respondents living in rural areas reported a bad level of service than those living in small and medium towns.
Figure 2-7: PT service level by living area, EU28
0%
10%
20%
30%
40%
50%
60%
70%
80%
90%
100%
Metropolitanarea
Large city Small ormedium town
Rural area
Level of PT service by living area - EU 28
Well served by public transport
Relatively served by publictransport
Difficult to reach with publictransport
Not served by public transport

EU Survey on issues related to transport and mobility
8
2.4 Driving licence and car availability
The wide majority of respondents (82%) has a driving licence (Figure 2-8). The country with the highest diffusion of driving licence is Luxembourg followed by Cyprus, Italy, Slovenia and Austria. The countries with lower percentages of driving licences are Romania and Hungary. In general there are less driving licences per 100 inhabitants in East Europe than in West Europe (Figure 2-9).
Figure 2-8: Availability of driving licence, EU28
Figure 2-9: Availability of driving licence by country
18%
82%
Availability of driving licence - EU 28
No
Yes
0%
10%
20%
30%
40%
50%
60%
70%
80%
90%
100%
Au
stri
a
Be
lgiu
m
Bu
lgar
ia
Cro
atia
Cyp
rus
Cze
ch R
.
De
nm
ark
Esto
nia
Fin
lan
d
Fran
ce
Ger
man
y
Gre
ece
Hu
nga
ry
Ire
lan
d
Ital
y
Latv
ia
Lith
uan
ia
Luxe
mb
ou
rg
Mal
ta
Net
her
lan
ds
Po
lan
d
Po
rtu
gal
Ro
man
ia
Slo
vaki
a
Slo
ven
ia
Spai
n
Swed
en
UK
Availability of driving licence
Yes
No

EU Survey on issues related to transport and mobility
9
Interestingly, the availability of a driving licence is significantly2 lower among the respondents younger than 30 years old (Figure 2-10). In EU countries the minimum age for obtaining a driving licence is 18 years, but even if underage respondents are excluded the result is the same: one out of four individuals aged less than 30 years does not hold a driving permit. This difference emerges in most of the countries with few exceptions (see charts A2.2 in the annex). This evidence seems to support the view that the younger generation in Europe is less keen (or has lower possibilities) to drive a car than it happened in the recent past.
Figure 2-10: Availability of driving licence by age group
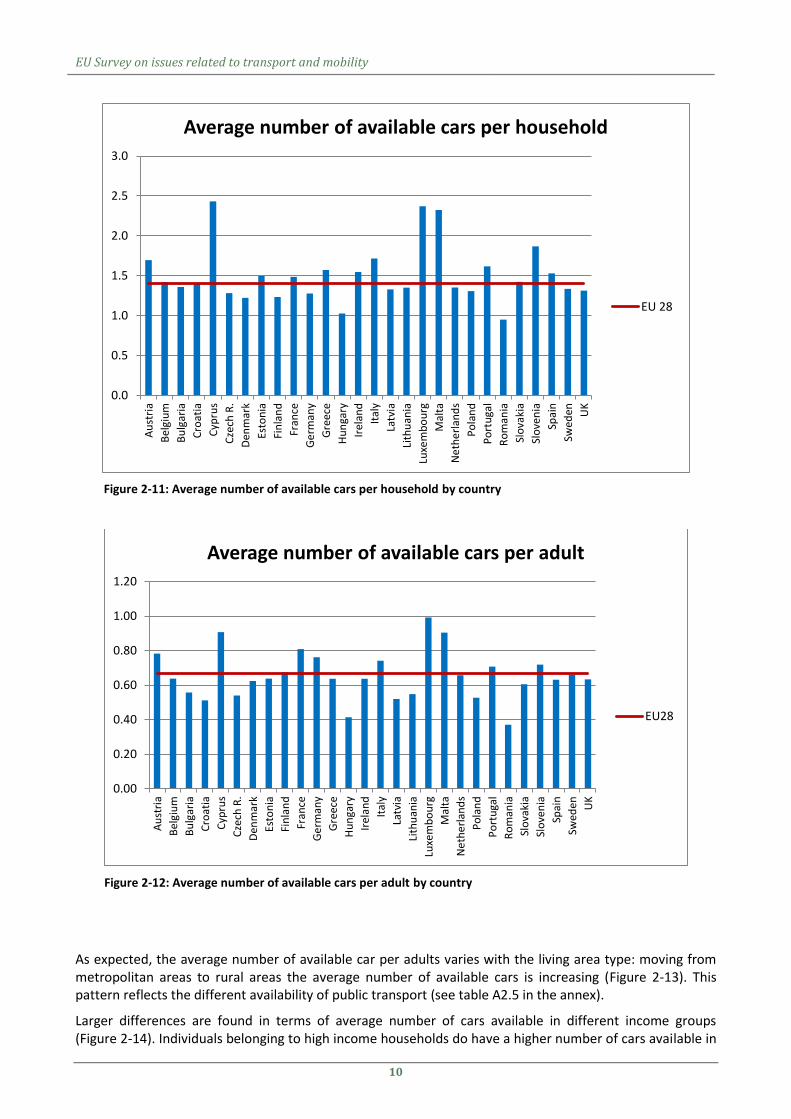
On average in EU28 there are 1.4 cars available per each household. Most of the countries above this average are West Europe countries but also some East Europe countries are above the average (e.g. Estonia and Slovenia, Figure 2-11) and several West Europe countries are below the average (e.g. Denmark, Sweden, UK). Peaks of car availability are found in Cyprus, Luxembourg and Malta. Only in Romania there is less than one car available per household3.
When the number of adults in the households4 is accounted for, more but slight differences arise across countries (Figure 2-12). For instance, Estonia, Ireland and Spain fall below the average rather than above and vice-versa Germany goes up in the ranking. In Luxembourg basically each adult has a car available.
2 The difference with respect to the other age classes is statistically significant according to a Chi-squared test
3 It should be noted that the question asked in the survey referred to the number of available cars rather than the
number of owned cars. Company vehicles as well as relatives’ or friends’ cars can be also available to respondents. This specification can at least partly explain why the number of cars per household is larger than the ratio between the car stock and the number of households in each country drawn from available statistics. Notwithstanding car owners could be overrepresented in the sample.
4 The number of adults in the households is an estimation made using the information on the total number of
individuals living in the households and that on the existence of members with less than 16 years of age.
0%
10%
20%
30%
40%
50%
60%
70%
80%
90%
100%
16-29 years 30-49 years 50+ years
Availability of driving licence by age - EU28
No
Yes
EU Survey on issues related to transport and mobility
10
Figure 2-11: Average number of available cars per household by country
Figure 2-12: Average number of available cars per adult by country
As expected, the average number of available car per adults varies with the living area type: moving from metropolitan areas to rural areas the average number of available cars is increasing (Figure 2-13). This pattern reflects the different availability of public transport (see table A2.5 in the annex).
Larger differences are found in terms of average number of cars available in different income groups (Figure 2-14). Individuals belonging to high income households do have a higher number of cars available in
0.0
0.5
1.0
1.5
2.0
2.5
3.0A
ust
ria
Bel
giu
m
Bu
lgar
ia
Cro
atia
Cyp
rus
Cze
ch R
.
Den
mar
k
Esto
nia
Fin
lan
d
Fran
ce
Ge
rman
y
Gre
ece
Hu
nga
ry
Irel
and
Ital
y
Latv
ia
Lith
uan
ia
Luxe
mb
ou
rg
Mal
ta
Ne
the
rlan
ds
Po
lan
d
Po
rtu
gal
Ro
man
ia
Slo
vaki
a
Slo
ven
ia
Spai
n
Swed
en UK
Average number of available cars per household
EU 28
0.00
0.20
0.40
0.60
0.80
1.00
1.20
Au
stri
a
Bel
giu
m
Bu
lgar
ia
Cro
atia
Cyp
rus
Cze
ch R
.
Den
mar
k
Esto
nia
Fin
lan
d
Fran
ce
Ge
rman
y
Gre
ece
Hu
nga
ry
Irel
and
Ital
y
Latv
ia
Lith
uan
ia
Luxe
mb
ou
rg
Mal
ta
Ne
the
rlan
ds
Po
lan
d
Po
rtu
gal
Ro
man
ia
Slo
vaki
a
Slo
ven
ia
Spai
n
Swed
en UK
Average number of available cars per adult
EU28

EU Survey on issues related to transport and mobility
11
comparison to those living in low income households. Interestingly, as shown in the data reported in the annex, especially in West Europe countries the number of available cars is larger in the class “higher-middle income” than in the class “high income”.
The role of income could explain why especially in some East Europe countries (e.g. Bulgaria, Estonia, Latvia, Romania) more cars can be found among those living in large urban areas than in rural population (see table A2.6 in the annex).
Figure 2-13: Average number of available cars per adult by living area, EU28
Figure 2-14: Average number of available cars per adult by income, EU28
0.00
0.10
0.20
0.30
0.40
0.50
0.60
0.70
0.80
0.90
Metropolitan area Large city Small or mediumtown
Rural area
Nu
mC
ar/A
du
ltC
om
po
ne
nt
Average number of available cars per adult by living area - EU28
0.00
0.10
0.20
0.30
0.40
0.50
0.60
0.70
0.80
0.90
1.00
High Higher middle Middle Lower middle Low
Nu
mC
ar/A
du
ltC
om
po
ne
nt
Average number of available car by income

EU Survey on issues related to transport and mobility
12
2.5 Driving skills
More than one third of the respondents rank themselves as better than an average driver. Only 3% think to be worse than the average (Figure 2-16).
Countries more self-confident with their driving skills are Cyprus and Greece. Countries less self-confident are Croatia and Finland.
Figure 2-15: Self-assessment driving skills, EU28
Figure 2-16: Self-assessment driving skills
3% 3%
56%
38%
Self-assessment driving skills - EU 28
Don't know/ no answer
Worse than an averagedriver
Average driver
Better than an averagedriver
0%
10%
20%
30%
40%
50%
60%
70%
80%
90%
100%
Au
stri
a
Be
lgiu
m
Bu
lgar
ia
Cro
atia
Cyp
rus
Cze
ch R
.
De
nm
ark
Esto
nia
Fin
lan
d
Fran
ce
Ger
man
y
Gre
ece
Hu
nga
ry
Ire
lan
d
Ital
y
Latv
ia
Lith
uan
ia
Luxe
mb
ou
rg
Mal
ta
Net
her
lan
ds
Po
lan
d
Po
rtu
gal
Ro
man
ia
Slo
vaki
a
Slo
ven
ia
Spai
n
Swed
en
UK
Self assessment driving skills Better than an average driver Average driverWorse than an average driver Don't know/ no answer

EU Survey on issues related to transport and mobility
13
3 Most frequent trip
3.1 Key findings
Car is largely the most used transport mode for the most frequent trips of respondents.
As a whole, public transport has a mode share above 30% only in East Europe countries where less cars are available: car ownership seems very relevant for mode choice.
Everywhere public transport is the most used alternative in metropolitan areas.
Bike seems more an alternative to public transport than an alternative to private modes
20% of most frequent trips are made using two or more transport modes.
Intermodality is especially between slow modes and public transport in West Europe countries and between private motorised modes and public transport in East Europe countries.
On average the most frequent trip duration is 39 minutes.
The average duration of trip across modes is similar. It seems that faster transport modes are used not to save time but to travel longer.
On average the most frequent trip length is 17 km.
20% of car users do not experience problems related to their most frequent trip. 25% of car drivers complain about poor public transport service or lack of cycling facilities: this data suggests that they would consider to switch on more sustainable modes if their level of service is improved.
EU Survey on issues related to transport and mobility
14
3.2 Trip frequency
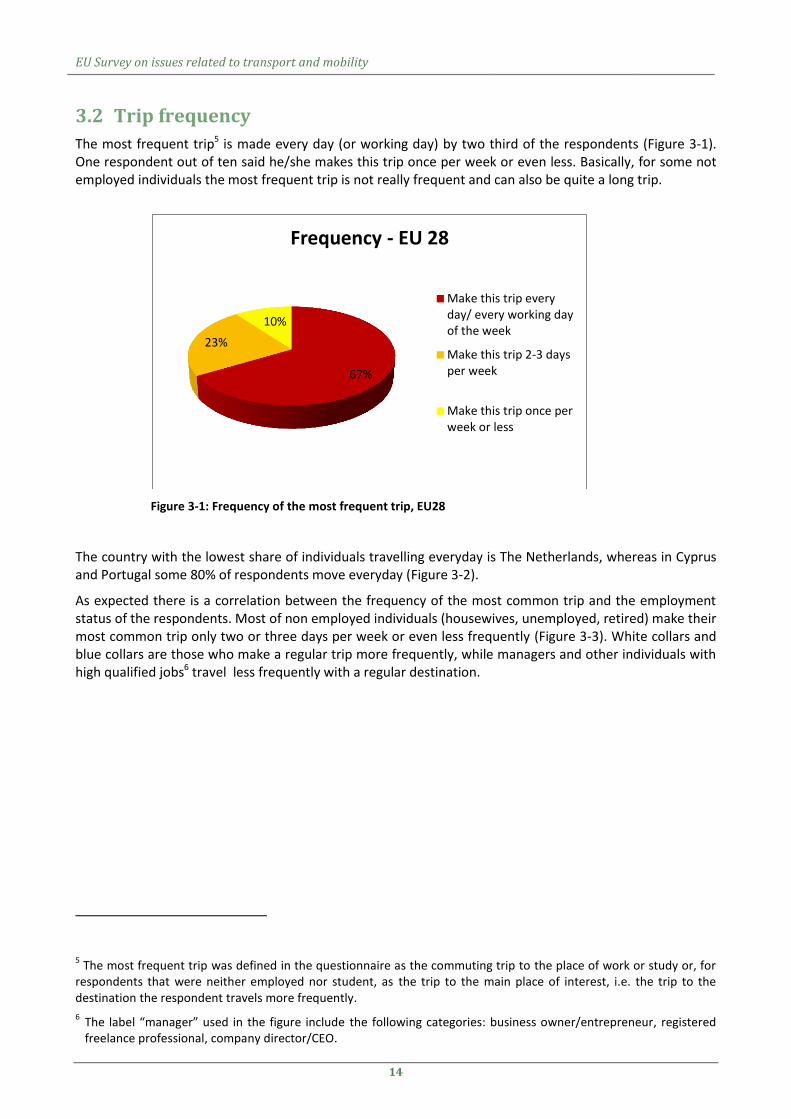
The most frequent trip5 is made every day (or working day) by two third of the respondents (Figure 3-1). One respondent out of ten said he/she makes this trip once per week or even less. Basically, for some not employed individuals the most frequent trip is not really frequent and can also be quite a long trip.
Figure 3-1: Frequency of the most frequent trip, EU28
The country with the lowest share of individuals travelling everyday is The Netherlands, whereas in Cyprus and Portugal some 80% of respondents move everyday (Figure 3-2).
As expected there is a correlation between the frequency of the most common trip and the employment status of the respondents. Most of non employed individuals (housewives, unemployed, retired) make their most common trip only two or three days per week or even less frequently (Figure 3-3). White collars and blue collars are those who make a regular trip more frequently, while managers and other individuals with high qualified jobs6 travel less frequently with a regular destination.
5 The most frequent trip was defined in the questionnaire as the commuting trip to the place of work or study or, for
respondents that were neither employed nor student, as the trip to the main place of interest, i.e. the trip to the destination the respondent travels more frequently.
6 The label “manager” used in the figure include the following categories: business owner/entrepreneur, registered freelance professional, company director/CEO.
67%
23%
10%
Frequency - EU 28
Make this trip everyday/ every working dayof the week
Make this trip 2-3 daysper week
Make this trip once perweek or less

EU Survey on issues related to transport and mobility
15
Figure 3-2: Frequency of the most frequent trip by country
Figure 3-3: Frequency of the most frequent trip by employment status, EU28
0%
10%
20%
30%
40%
50%
60%
70%
80%
90%
100%
Au
stri
a
Be
lgiu
m
Bu
lgar
ia
Cro
atia
Cyp
rus
Cze
ch R
.
De
nm
ark
Esto
nia
Fin
lan
d
Fran
ce
Ger
man
y
Gre
ece
Hu
nga
ry
Ire
lan
d
Ital
y
Latv
ia
Lith
uan
ia
Luxe
mb
ou
rg
Mal
ta
Net
her
lan
ds
Po
lan
d
Po
rtu
gal
Ro
man
ia
Slo
vaki
a
Slo
ven
ia
Spai
n
Swed
en
UK
Frequency Make this trip once per week or less
Make this trip 2-3 days per week
Make this trip every day/ every working day of the week
0%
10%
20%
30%
40%
50%
60%
70%
80%
90%
100%
Frequency by employment status - EU 28 once per week or less 2-3 days per week every day

EU Survey on issues related to transport and mobility
16
3.3 Transport modes used
The most frequent trip is made by car by the majority of respondents. Public transport7 is used by one respondent out of five. Train is the main mode8 for the most frequent trip only for 7% of respondents (Figure 3-4).
Car is dominant (share above 70%) in small countries (Cyprus, Luxembourg, Malta, Slovenia). Its role is lower (share below 40%) in some Eastern Europe countries: Czech Republic, Hungary, Romania (Figure 3-5). Since the availability of cars in these countries is well below the average (see section 0) it can be said that motorisation rate seems a key factor of transport mode choice.
Considering public transport and train together, their share is above 30% more likely in East Europe (Austria, Greece and Sweden are the only three West Europe countries where this share exceeds 30%). In general, there is a correlation between the share of public transport and the level of service in the living area (see table A3.4 in the annex).
Bike is used more frequently in North Europe. Denmark and the Netherlands are largely at the top of the rank (in both countries bike is the second most used mode) and also countries like Sweden, Finland and Hungary are above the average. Interestingly, in Denmark and the Netherlands bike seems principally an alternative to urban public transport, whose share is very small. Actually, if the shares of public transport and bike are summed, the result for these two countries is below 30%, in line with other West Europe countries (e.g. Austria, Germany, Greece) and well below many East Europe countries. On this respect, only in Finland and especially in Sweden the share of public transport and bicycle together is above 30% (but in these two countries less respondents than the average walk for their most frequent trip).
Figure 3-4: Main Transport Mode used for the most frequent trip, EU28
7 Public transport includes: bus, coach, tram and metro.
8 In case the respondent reported the use of more transport modes, the main mode has been defined according to a functional hierarchy. Namely, when train is used together other modes the latter usually have an ancillary role (e.g. to reach the station), so any combination of modes including train was associated to main mode “train”. When public transport and car are both used it is fair to assume that the largest part of the trip is made by car (e.g. until a park&ride station) so these combinations have been associated to the main mode “car”. When motorbikes or slow modes (walking and bicycle) are used together with public transport their main purpose is to reach the stop so public transport has been considered the main mode.
56%
7%
20%
1% 6% 10%
Main Transport Mode - EU 28
Car
Train
PT
Motorcycle
Bicycle
Walk

EU Survey on issues related to transport and mobility
17
Figure 3-5: Main Transport Mode used for the most frequent trip by country
As expected the use of car for the most frequent trip is much lower in urban areas than in rural areas whereas the opposite holds for public transport and train (Figure 3-6). In metropolitan areas car is used less than public transport and sustainable modes cater for the majority of the most frequent trips of respondents in large cities as well.
Figure 3-6: Main Transport Mode by living area, EU28
0%
10%
20%
30%
40%
50%
60%
70%
80%
90%
100%A
ust
ria
Bel
giu
m
Bu
lgar
ia
Cro
atia
Cyp
rus
Cze
ch R
.
Den
mar
k
Esto
nia
Fin
lan
d
Fran
ce
Ge
rman
y
Gre
ece
Hu
nga
ry
Irel
and
Ital
y
Latv
ia
Lith
uan
ia
Luxe
mb
ou
rg
Mal
ta
Ne
the
rlan
ds
Po
lan
d
Po
rtu
gal
Ro
man
ia
Slo
vaki
a
Slo
ven
ia
Spai
n
Swed
en UK
Main Transport Mode
Walk
Bicycle
Motorcycle
PT
Train
Car
0%
10%
20%
30%
40%
50%
60%
70%
80%
90%
100%
Metropolitanarea
Large city Small-Mediumcity
Rural area
Main transport mode used for the most frequent trip by living area - EU 28
Walk
Bicycle
Motorcycle
PT
Train
Car
Car + Train
Car + PT
CarPax

EU Survey on issues related to transport and mobility
18
3.4 Multimodal trips
The large majority of respondents, 78%, have declared to use only one mode during their most frequent trip, 14% use two modes and 8% use three or more modes (Figure 3-7).
Multimodality is more common in East Europe countries, especially Croatia, Hungary and Poland (Figure 3-8). In Croatia and Poland nearly 20% of respondents have declared to use 3 or more modes.
Figure 3-7: Number of modes used for the most frequent trip, EU28
Figure 3-8: Number of modes used for the most frequent trip by country
In half of the cases, as shown in Figure 3-9, multimodal trips involve the combination of one private mode (car or motorbike) and public transport (including train). Very frequent is also the interchange between slow modes and public transport (i.e. bike and public transport: walking is generally needed to reach stops
78%
14% 8%
Number of modes of the most frequent trip - EU28
1 mode
2 modes
3 or more
0%
10%
20%
30%
40%
50%
60%
70%
80%
90%
100%
Au
stri
a
Be
lgiu
m
Bu
lgar
ia
Cro
atia
Cyp
rus
Cze
ch R
.
De
nm
ark
Esto
nia
Fin
lan
d
Fran
ce
Ger
man
y
Gre
ece
Hu
nga
ry
Ire
lan
d
Ital
y
Latv
ia
Lith
uan
ia
Luxe
mb
ou
rg
Mal
ta
Net
her
lan
ds
Po
lan
d
Po
rtu
gal
Ro
man
ia
Slo
vaki
a
Slo
ven
ia
Spai
n
Swed
en
UK
Number of modes of the most frequent trip
1 mode 2 modes 3 or more
EU Survey on issues related to transport and mobility
19
and stations so trips reported as walk + train or walk + bus, etc. were not considered multimodal trips). Only in a minority of cases the multimodal trip is a combination of different public transport modes.
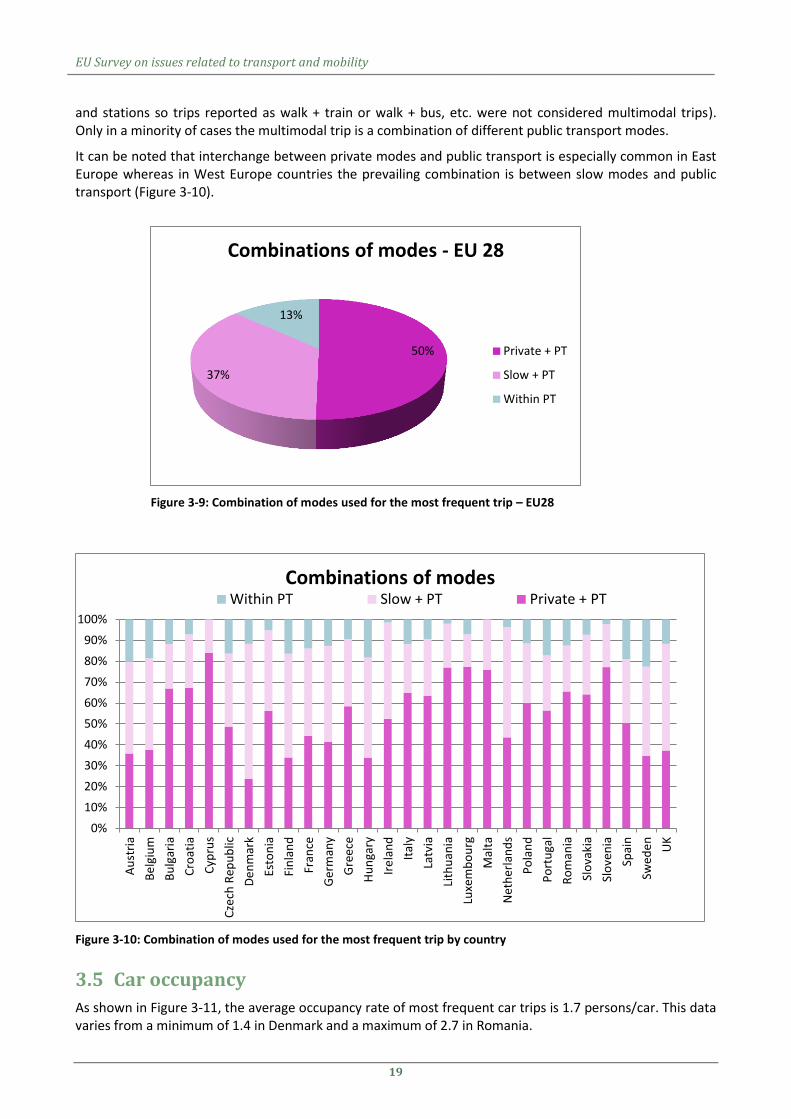
It can be noted that interchange between private modes and public transport is especially common in East Europe whereas in West Europe countries the prevailing combination is between slow modes and public transport (Figure 3-10).
Figure 3-9: Combination of modes used for the most frequent trip – EU28
Figure 3-10: Combination of modes used for the most frequent trip by country
3.5 Car occupancy
As shown in Figure 3-11, the average occupancy rate of most frequent car trips is 1.7 persons/car. This data varies from a minimum of 1.4 in Denmark and a maximum of 2.7 in Romania.
50%
37%
13%
Combinations of modes - EU 28
Private + PT
Slow + PT
Within PT
0%
10%
20%
30%
40%
50%
60%
70%
80%
90%
100%
Au
stri
a
Be
lgiu
m
Bu
lgar
ia
Cro
atia
Cyp
rus
Cze
ch R
epu
blic
De
nm
ark
Esto
nia
Fin
lan
d
Fran
ce
Ger
man
y
Gre
ece
Hu
nga
ry
Ire
lan
d
Ital
y
Latv
ia
Lith
uan
ia
Luxe
mb
ou
rg
Mal
ta
Net
her
lan
ds
Po
lan
d
Po
rtu
gal
Ro
man
ia
Slo
vaki
a
Slo
ven
ia
Spai
n
Swed
en
UK
Combinations of modes Within PT Slow + PT Private + PT

EU Survey on issues related to transport and mobility
20
Comparing Figure 3-11 with Figure 2-12 (average number of available cars per adult in the household) it clearly emerges that countries with a high occupancy rate are those with a low car availability. This suggests that car is widely perceived as an individual means of transport and pooling cars seems more a necessity than a deliberate choice.
Figure 3-11: Car occupancy rate by country
0.0
0.5
1.0
1.5
2.0
2.5
3.0
Au
stri
a
Be
lgiu
m
Bu
lgar
ia
Cro
atia
Cyp
rus
Cze
ch R
.
De
nm
ark
Esto
nia
Fin
lan
d
Fran
ce
Ger
man
y
Gre
at B
rita
in
Gre
ece
Hu
nga
ry
Ire
lan
d
Ital
y
Latv
ia
Lith
uan
ia
Lou
xem
bo
urg
Mal
ta
Net
her
lan
ds
Po
lan
d
Po
rtu
gal
Ro
man
ia
Slo
vaki
a
Slo
ven
ia
Spai
n
Swed
en
Occupancy rate EU28

EU Survey on issues related to transport and mobility
21
3.6 Trip duration
Looking at the average duration of the most frequent trip, the EU28 average value is 39 minutes (Figure 3-12). In East Europe countries the trip duration is often above the EU average. This can be somewhat related to the larger share of multimodal trips in these countries (see section 3.4). At the same time, especially in some East Europe countries, there is a share of relatively long trips made once per week or less. These trips lift the average trip duration.
Figure 3-12: Average duration of most frequent trip by country
The average duration considers all modes together, including pedestrian trips. Figure 3-13 shows the average duration of most frequent trip by mode. Train trips, including trips in combination with car are lengthier than any other mode’s. It will be shown later that this result is related to a longer average distance of trips by train again influenced by non-daily trips. Apart from train, the average duration of trip is not that different across modes. This evidence seems to support the idea that faster transport modes are used not to save time but to travel longer.
0
10
20
30
40
50
60
70
Au
stri
a
Be
lgiu
m
Bu
lgar
ia
Cro
atia
Cyp
rus
Cze
ch R
.
De
nm
ark
Esto
nia
Fin
lan
d
Fran
ce
Ger
man
y
Gre
ece
Hu
nga
ry
Ire
lan
d
Ital
y
Latv
ia
Lith
uan
ia
Luxe
mb
ou
rg
Mal
ta
Net
her
lan
ds
Po
lan
d
Po
rtu
gal
Ro
man
ia
Slo
vaki
a
Slo
ven
ia
Spai
n
Swed
en
UK
min
Average duration of most frequent trip
EU 28

EU Survey on issues related to transport and mobility
22
Figure 3-13: Average duration of most frequent trip by mode
0
20
40
60
80
100
120
min
Average duration by mode - EU28

EU Survey on issues related to transport and mobility
23
3.7 Trip length
On average the most frequent trip is 17 km long9 (Figure 3-14). The variability across countries is limited. Only in 5 countries out of 28 the average distance falls outside the interval 14 – 20 km with Luxembourg showing the peak (25 km) and Malta reporting the shortest distance (7 km).
Figure 3-14: Average distance of most frequent trip by country
Train trips are the longest ones: 38 km on average (Figure 3-15). As reported earlier, train trips are also lengthier than those with other modes and here again one should consider the impact of some relatively long distance trips made not on a daily basis. Travelled distance is therefore not the only reason why train trips needs more time. Trips by car are on average 20 km long, while trip by public transport are shorter (13 km). Walking trips are nearly 3 km long.
9 The questionnaire asked to choose the distance band of the trip rather than to indicate the exact distance (which is
often not well known). For the estimation of the average trip length the middle point of each distance band was used. For instance, for trips reported in the band 6 – 10 km a value of 8 km has been considered to estimate the average length.
0
5
10
15
20
25
30
Au
stri
a
Be
lgiu
m
Bu
lgar
ia
Cro
atia
Cyp
rus
Cze
ch R
.
De
nm
ark
Esto
nia
Fin
lan
d
Fran
ce
Ger
man
y
Gre
ece
Hu
nga
ry
Ire
lan
d
Ital
y
Latv
ia
Lith
uan
ia
Luxe
mb
ou
rg
Mal
ta
Net
her
lan
ds
Po
lan
d
Po
rtu
gal
Ro
man
ia
Slo
vaki
a
Slo
ven
ia
Spai
n
Swed
en
UK
km
Average distance of most frequent trip
EU 28

EU Survey on issues related to transport and mobility
24
Figure 3-15: Average distance of most frequent trip by mode
0
5
10
15
20
25
30
35
40
45
50
km
Average distance by mode - EU28

EU Survey on issues related to transport and mobility
25
3.8 Problems experienced by car users
Congestion and parking difficulty are the main problems experienced by car users (both drivers and passengers) in relation to their most common trip (Figure 3-16). 22% of respondents do not report any problem while, interestingly, 20% of respondents complain about poor quality of public transport (too low frequency or lack of coverage) and 7% of respondents reported the lack of bicycle lanes as a problem. Since these answers come from car users, the perception of problems concerning public transport suggests that they consider to travel with alternative modes and could switch to public transport if service were better.
In some Northern Europe countries such as Denmark, Finland, Netherlands and Sweden, the relative majority of respondents do not complain about anything (Figure 3-17). Instead, the share of those who do not experience problems is smaller in Bulgaria, Croatia, Italy, Malta, Poland and Romania. With the exception of Poland, these are all South Europe countries.
Figure 3-16: Problems experienced concerning the most frequent trip by car users, EU28
Figure 3-17: Problems experienced concerning the most frequent trip by car users by country
27%
24% 7%
10%
10%
22%
Problems concerning the most frequent trip by car users EU 28
Congestion
Difficulty of parking
Lack of bicycle lanes
Infrequency of publictransport connections
Lack of coverage ofpublic transport
None
0%
10%
20%
30%
40%
50%
60%
70%
80%
90%
100%
Au
stri
a
Be
lgiu
m
Bu
lgar
ia
Cro
atia
Cyp
rus
Cze
ch R
.
De
nm
ark
Esto
nia
Fin
lan
d
Fran
ce
Ger
man
y
Gre
ece
Hu
nga
ry
Ire
lan
d
Ital
y
Latv
ia
Lith
uan
ia
Luxe
mb
ou
rg
Mal
ta
Net
her
lan
ds
Po
lan
d
Po
rtu
gal
Ro
man
ia
Slo
vaki
a
Slo
ven
ia
Spai
n
Swed
en
UK
Problems concerning the most frequent trip
Congestion Difficulty of parkingLack of bicycle lanes Infrequency of public transport connectionsLack of coverage of public transport None

EU Survey on issues related to transport and mobility
26
Geography matters also in terms of living area. Car users residents in the metropolitan areas experience congestion and difficulty of parking almost as twice as residents in rural areas (Figure 3-18). Conversely, lack of or infrequent public transport services are suffered in rural areas much more than in urban areas. At the same time, nearly one third of respondents living in rural areas do not report any significant problem while the larger the city the higher the probability of problems with congestion or parking.
Figure 3-18: Problems experienced concerning the most frequent trip by car users by living area
0%10%20%30%40%50%60%70%80%90%
100%
Metropolitan area Large city Small or mediumtown
Rural area
Problems concerning the most frequent trip
Congestion Difficulty of parking
Lack of bicycle lanes Infrequency of public transport connections
Lack of coverage of public transport None

EU Survey on issues related to transport and mobility
27
4 Long distance trips
4.1 Key findings
75% of EU employed or studying citizens did not make trips above 1000 km for business/education purposes in the last 12 months. 60% of EU employed or studying citizens did not make any trip between 300 and 1000 km for business/education purposes in the last 12 months.
60% of EU citizens did not make trips above 1000 km for leisure/visiting purposes in the last 12 months. 60% of EU citizens did at least one trip between 300 and 1000 km for leisure/visiting purposes in the last 12 months.
Car is the most used mode for long distance trips, around half of business trips over 1000 km are made by car.
Individuals with high qualifications jobs travel significantly more than others above 1000 km not only for business but also for leisure.
Nearly half of EU citizens who took an air trip in the last 12 months have experienced a rail-air connection and usually they state it was a good connection.

EU Survey on issues related to transport and mobility
28
4.2 Long distance trips over 1000 km
4.2.1 Number of trips over 1000 for working and studying
Most of the employed individuals and students in EU28 do not travel longer than 1000 km for work/business/study purposes: 75% of the respondents with a job or studying declared no trips over 1000 km in the last 12 months10 (Figure 4-1). Nearly half of the remaining 25% made only 1 trip over 1000 km per year. Less than 3 respondents out of 100 in this group travelled over 1000 km for business or studying purposes more often than once every two months.
Note: employed individuals and students only
Figure 4-1: Number of trips > 1000 km for working, business, study purposes, EU28
If the focus is restricted to study trips, 15 students out of 100 travelled longer than 1000 km for that purpose in the last 12 months (Figure 4-2). Long distance mobility pattern of EU students is comparable to mobility of employed individuals for business.
Note: students only
Figure 4-2: Number of trips > 1000 km for study purposes, EU28
10
The survey was carried out in June 2014 so the 12 months period considered is June 2013 – June 2014.
75%
12%
6% 5% 1% 0,4%
1%
Number of trips > 1000 km for working, business, study purposes - EU28
0
1
2
3 to 5
6 to 12
13 to 24
>24
84%
9%
4% 2% 0,7% 0,4% 0,4%
Number of trips > 1000 km for study purposes - EU28
0
1
2
3 to 5
6 to 12
13 to 24
>24

EU Survey on issues related to transport and mobility
29
Differences across countries exist but the overall picture is similar everywhere (Figure 4-3). Countries with the highest percentages of respondents that made at least one trip over 1000 km for work/business/study purposes are Bulgaria, Ireland and Lithuania whereas the lowest percentages are found in Finland, France, Germany and Malta.
The largest shares of students that travelled at least one time above 1000 km in the last 12 months are found in Bulgaria, Greece, Ireland and Lithuania (Figure 4-4).
Looking at further charts reported in the annex (see table A4.1) it can be observed that managers and other individuals employed in high qualification position are those who travel more for working purposes. Actually, nearly 40% of individuals in this group made at least one trip over 1000 km in the last 12 months.
Note: employed individuals and students only Figure 4-3: Number of trips > 1000 km for working, business, study purposes by country
Note: students only Figure 4-4: Number of trips > 1000 km for study purposes by country
0%10%20%30%40%50%60%70%80%90%
100%
Au
stri
a
Be
lgiu
m
Bu
lgar
ia
Cro
atia
Cyp
rus
Cze
ch R
.
De
nm
ark
Esto
nia
Fin
lan
d
Fran
ce
Ger
man
y
Gre
ece
Hu
nga
ry
Ire
lan
d
Ital
y
Latv
ia
Lith
uan
ia
Luxe
mb
ou
rg
Mal
ta
Net
her
lan
ds
Po
lan
d
Po
rtu
gal
Ro
man
ia
Slo
vaki
a
Slo
ven
ia
Spai
n
Swed
en
UK
Number of trips > 1000 km for working, business, study purposes
>24
13 to 24
6 to 12
3 to 5
2
1
0
0%10%20%30%40%50%60%70%80%90%
100%
Au
stri
a
Be
lgiu
m
Bu
lgar
ia
Cro
atia
Cyp
rus
Cze
ch R
.
De
nm
ark
Esto
nia
Fin
lan
d
Fran
ce
Ger
man
y
Gre
ece
Hu
nga
ry
Ire
lan
d
Ital
y
Latv
ia
Lith
uan
ia
Luxe
mb
ou
rg
Mal
ta
Net
her
lan
ds
Po
lan
d
Po
rtu
gal
Ro
man
ia
Slo
vaki
a
Slo
ven
ia
Spai
n
Swed
en
UK
Number of trips > 1000 km study purposes
>24
13 to 24
6 to 12
3 to 5
2
1
0

EU Survey on issues related to transport and mobility
30
4.2.2 Number of trips over 1000 for leisure and personal purposes
Trips over 1000 km for leisure and personal purposes are more frequent than business trips. 60% of respondents did not travel longer than 1000 km for leisure in the last 12 months (Figure 4-5) but nearly one respondent out of three made one or two trips over 1000 km for leisure or personal purposes and more than 7% of citizens made three or more of such trips.
The share of those who took at least one trip over 1000 km in the last 12 months for visiting relatives and friends is roughly a half of the share of respondents that made at least one trip for any leisure and personal purposes (Figure 4-6).
Data reported in the annex (table A4.3) shows that managers and other individuals employed in high qualification position not only made more business long distance trips, as mentioned earlier, but also made more leisure and personal trips over 1000 km than any other group based on job type.
Figure 4-5: Number of trips > 1000 km for leisure and personal purposes - EU28
Figure 4-6: Number of trips > 1000 km for visiting purposes - EU28
Similarly to what has been observed for business trips, differences across countries are relatively limited (Figure 4-7): comparing with the average share of 40% of respondents making at least one trip, only one
60% 23%
10%
6% 1% 0,2% 0,2%
Number of trips > 1000 km for leisure and personal purposes - EU28
0
1
2
3 to 5
6 to 12
13 to 24
>24
82%
12%
4% 2% 0% 0,1%
0,1%
Number of trips > 1000 km for visiting purposes - EU28
0
1
2
3 to 5
6 to 12
13 to 24
>24

EU Survey on issues related to transport and mobility
31
country is below 30% (Hungary) and only three countries are above 50% (Ireland, Luxembourg and Sweden). Differences are limited also with reference to trips for visiting purposes (Figure 4-8).
Figure 4-7: Number of trips > 1000 km for leisure and personal purposes by country
Figure 4-8: Number of trips > 1000 km for visiting purposes by country
4.2.3 Transport modes used for trips over 1000 km
It is very interesting to notice that car is the favourite mode for long distance trips: more than half of those trips were made by car both for leisure and for business purposes (Figure 4-9). This result is somewhat
0%
10%
20%
30%
40%
50%
60%
70%
80%
90%
100%
Au
stri
aB
elg
ium
Bu
lgar
iaC
roat
iaC
ypru
sC
zech
R.
De
nm
ark
Esto
nia
Fin
lan
dFr
ance
Ger
man
yG
ree
ceH
un
gary
Ire
lan
dIt
aly
Latv
iaLi
thu
ania
Luxe
mb
ou
rgM
alta
Net
her
lan
ds
Po
lan
dP
ort
uga
lR
om
ania
Slo
vaki
aSl
ove
nia
Spai
nSw
ede
nU
K
Number of trips > 1000 km for leisure and personal purposes
>24
13 to 24
6 to 12
3 to 5
2
1
0
0%
10%
20%
30%
40%
50%
60%
70%
80%
90%
100%
Au
stri
aB
elg
ium
Bu
lgar
ia
Cro
atia
Cyp
rus
Cze
ch R
.D
en
mar
k
Esto
nia
Fin
lan
dFr
ance
Ger
man
yG
ree
ceH
un
gary
Ire
lan
d
Ital
yLa
tvia
Lith
uan
iaLu
xem
bo
urg
Mal
taN
eth
erla
nd
sP
ola
nd
Po
rtu
gal
Ro
man
iaSl
ova
kia
Slo
ven
ia
Spai
nSw
ede
nU
KNumber of trips > 1000 km for visiting purposes
>24
13 to 24
6 to 12
3 to 5
2
1
0

EU Survey on issues related to transport and mobility
32
unexpected but it is in line with data collected by national surveys in the recent past. The national travel survey carried out in France in 2008 reported that 52% of trips over 1000 km were made by car (ENTD, 2008). In the same year the German national survey MiD (Mobilität in Deutschland) came up with a share of 40% of car for trips over 1000 km (MiD, 2008).
Plane is the second most used alternative: one third of leisure long distance trips and one fourth of business trips are made by plane. Third is train (including High Speed trains) which is used for nearly 10% of trips above 1000 km.
Note: employed individuals and students only
Figure 4-9: Modal split of trips > 1000 km – EU28
The use of transport modes is more differentiated across countries than the overall number of trips (Figure 4-10 and Figure 4-11). In most of the West Europe countries plane is used more than average (even if car generally remains the most used alternative). Conversely, in several East Europe countries, coach is used by a significant share of travellers. Somewhere (Bulgaria, Czech Republic, Latvia, Romania) coach is even more used than plane for long distance trips (especially for working and studying purposes: students explain most of this data).
The relatively high share of ship used by travellers in Greece and Ireland reflects local circumstances. The share of motorcycle for working and studying trips in Bulgaria (7%) and Slovakia (6%) is also remarkable (and depends much on students).
The share of car for long distance trips originated in Malta and Cyprus, especially for working and studying purposes, is a puzzling result of the survey. In both cases the threshold of 1000 km is largely beyond any possible domestic trip. In theory long distance car trips are conceivable using a ferry, but there are not ferry services connecting Cyprus and only a few routes connecting Malta with Italy (and on a seasonally base one route to Tunisia). Interestingly, the latest Eurobarometer reported a 39% mode share for car/campervan on trips above 300 km originated in Cyprus. This is not directly comparable to the result of the survey but also the threshold of 300 km corresponds to a foreign destination. So it seems that car is actually an alternative to leave Cyprus (maybe using ferry connections to Turkey in the northern part of the island). In summary there are reasons to believe that the share of car is overestimated (part of the respondents might have misinterpreted the question) but the use of car for long distance trips is probably not negligible even in these two countries.
53%
2%
8%
7%
3% 25%
2%
Modal split of trips > 1000 km for working, business, study purposes - EU28
car
motorcar
coach
train
HStrain
plane
ship
51%
1% 5% 6%
2%
33%
2%
Modal split of trips > 1000 km for personal purposes EU28
car
motorcar
coach
train
HStrain
plane
ship

EU Survey on issues related to transport and mobility
33
Note: employed individuals and students only
Figure 4-10: Modal split of trips > 1000 km for working, business, study purposes by country
Figure 4-11: Modal split of trips > 1000 km for personal purposes by country
0%10%20%30%40%50%60%70%80%90%
100%
Au
stri
a
Be
lgiu
m
Bu
lgar
iaC
roat
ia
Cyp
rus
Cze
ch R
.D
en
mar
k
Esto
nia
Fin
lan
dFr
ance
Ger
man
yG
ree
ce
Hu
nga
ry
Ire
lan
dIt
aly
Latv
ia
Lith
uan
iaLu
xem
bo
urg
Mal
ta
Net
her
lan
ds
Po
lan
d
Po
rtu
gal
Ro
man
ia
Slo
vaki
aSl
ove
nia
Spai
n
Swed
en
UK
Mode split of trips > 1000 km for working, business, study purposes
ship
plane
HStrain
train
coach
motorcycle
car
0%
10%
20%
30%
40%
50%
60%
70%
80%
90%
100%
Au
stri
a
Be
lgiu
m
Bu
lgar
ia
Cro
atia
Cyp
rus
Cze
ch R
.
De
nm
ark
Esto
nia
Fin
lan
d
Fran
ce
Ger
man
y
Gre
ece
Hu
nga
ry
Ire
lan
d
Ital
y
Latv
ia
Lith
uan
ia
Luxe
mb
ou
rg
Mal
ta
Net
her
lan
ds
Po
lan
d
Po
rtu
gal
Ro
man
ia
Slo
vaki
a
Slo
ven
ia
Spai
n
Swed
en
UK
Mode split of trips > 1000 km for personal purposes
ship
plane
HStrain
train
coach
motorcycle
car

EU Survey on issues related to transport and mobility
34
4.3 Long distance trips between 300 and 1000 km
4.3.1 Number of trips between 300 and 1000 km for working and studying
The share of respondents employed or students that travelled for working or studying purposes between 300 and 1000 km is significantly higher than the share of those who travelled over 1000 km for the same purposes: 38% of individuals made at least one trip in the last 12 months (Figure 4-12). Nearly 10% of respondents made 3 trips or more. For this type of trips a gender differentiation was observed: men travel slightly more than women (see Table A4.6 in the annex for details).
With reference to the trips for studying purpose only, almost 30% of students made one trip or more and nearly 10% made at least three trips over 300 km (Figure 4-13).
Note: employed individuals and students only Figure 4-12: Number of trips 300-1000 km for working, business, study purposes, EU28
Note: students only Figure 4-13: Number of trips 300-1000 km for study purposes, EU28
In most of the East Europe countries the share of employed respondents and students that made at least one trip between 300 and 1000 km in the last 12 months is above the average (Figure 4-14). In West Europe, above the average are Austria, Germany, Ireland, Italy and Portugal. Also students travelling one
62% 13%
9%
9% 5%
1% 1%
Number of trips 300-1000 km for working, business, study purposes - EU28
0
1
2
3 to 5
6 to 12
13 to 24
>24
72%
12%
6%
5% 3% 1% 1%
Number of trips 300-1000 km for study purposes - EU28
0
1
2
3 to 5
6 to 12
13 to 24
>24

EU Survey on issues related to transport and mobility
35
or more times between 300 and 1000 km are more numerous in East Europe countries with some exceptions: Czech Republic, Estonia, Hungary (Figure 4-15). Among West Europe countries Italy and Ireland are below the EU average despite they are above the average considering working and studying trips as a whole, this means that the overall trip rate is strongly influenced by trips made for working purposes.
Note: employed individuals and students only Figure 4-14: Number of trips 300-1000 km for working, business, study purposes by country
Note: students only Figure 4-15: Number of trips 300-1000 km for study purposes by country
0%
10%
20%
30%
40%
50%
60%
70%
80%
90%
100%
Au
stri
a
Be
lgiu
m
Bu
lgar
ia
Cro
atia
Cyp
rus
Cze
ch R
.
De
nm
ark
Esto
nia
Fin
lan
d
Fran
ce
Ger
man
y
Gre
ece
Hu
nga
ry
Ire
lan
d
Ital
y
Latv
ia
Lith
uan
ia
Luxe
mb
ou
rg
Mal
ta
Net
her
lan
ds
Po
lan
d
Po
rtu
gal
Ro
man
ia
Slo
vaki
a
Slo
ven
ia
Spai
n
Swed
en
UK
Number of trips 300-1000 km for working, business, study purposes
>24
13 to 24
6 to 12
3 to 5
2
1
0
0%
10%
20%
30%
40%
50%
60%
70%
80%
90%
100%
Au
stri
a
Be
lgiu
m
Bu
lgar
ia
Cro
atia
Cyp
rus
Cze
ch R
.
De
nm
ark
Esto
nia
Fin
lan
d
Fran
ce
Ger
man
y
Gre
ece
Hu
nga
ry
Ire
lan
d
Ital
y
Latv
ia
Lith
uan
ia
Luxe
mb
ou
rg
Mal
ta
Net
her
lan
ds
Po
lan
d
Po
rtu
gal
Ro
man
ia
Slo
vaki
a
Slo
ven
ia
Spai
n
Swed
en
UK
Number of trips 300-1000 km for study purposes
>24
13 to 24
6 to 12
3 to 5
2
1
0

EU Survey on issues related to transport and mobility
36
4.3.2 Number of trips between 300 and 1000 km for leisure and personal purposes
The majority of respondents travelled between 300 and 1000 km for leisure and personal purposes in the last 12 months. Some 40% of them made one or two trips and more than 20% made 3 or more trips. Finally, two respondents out of 100 travelled over 300 km more than one time per month (Figure 4-16).
If only trips to visit relatives and friends are considered only one third of respondents travelled between 300 and 1000 km in the last 12 months (Figure 4-17). 37% of respondents made more than one trip for leisure and personal purposes but only 18% made more than one visiting trip between 300 and 1000 km. In brief, personal trips are made for both leisure and visiting purposes but the latter trips are made less frequently.
Figure 4-16: Number of trips 300-1000 km for personal purposes, EU28
Figure 4-17: Number of trips 300-1000 km for visiting purposes, EU28
There are visible differences across countries in the mobility between 300 and 1000 km for personal purposes (Figure 4-18) but there is no an apparent element that explains such differences. Countries where the share of respondents travelling in the last 12 months is above the average are found everywhere in
40%
23%
15%
14% 6%
1% 1%
Number of trips 300-1000 km for personal purposes - EU28
0
1
2
3 to 5
6 to 12
13 to 24
>24
67%
15%
7% 7%
3% 0.5%
0.2%
Number of trips 300-1000 km for visiting purposes - EU28
0
1
2
3 to 5
6 to 12
13 to 24
>24

EU Survey on issues related to transport and mobility
37
Europe (France, Spain, Sweden, Bulgaria, Croatia), are both small (Luxembourg, Slovenia) and large countries (Italy, Germany). For Malta and Cyprus the share of travellers are significantly lower, but this evidence is clearly related to their geographical size and position.
If the analysis is limited to visiting trips the differences across countries are less evident (Figure 4-19). It seems that divergences in EU countries concerning long distance personal trips depend more on leisure travels than on visits to relatives and friends.
Figure 4-18: Number of trips 300-1000 km for personal purposes by country
Figure 4-19: Number of trips 300-1000 km for visiting purposes by country
0%
10%
20%
30%
40%
50%
60%
70%
80%
90%
100%
Au
stri
a
Be
lgiu
m
Bu
lgar
ia
Cro
atia
Cyp
rus
Cze
ch R
.
De
nm
ark
Esto
nia
Fin
lan
d
Fran
ce
Ger
man
y
Gre
ece
Hu
nga
ry
Ire
lan
d
Ital
y
Latv
ia
Lith
uan
ia
Luxe
mb
ou
rg
Mal
ta
Net
her
lan
ds
Po
lan
d
Po
rtu
gal
Ro
man
ia
Slo
vaki
a
Slo
ven
ia
Spai
n
Swed
en
UK
Number of trips 300-1000 km for personal purposes
>24
13 to 24
6 to 12
3 to 5
2
1
0
0%
10%
20%
30%
40%
50%
60%
70%
80%
90%
100%
Au
stri
a
Be
lgiu
m
Bu
lgar
ia
Cro
atia
Cyp
rus
Cze
ch R
.
De
nm
ark
Esto
nia
Fin
lan
d
Fran
ce
Ger
man
y
Gre
ece
Hu
nga
ry
Ire
lan
d
Ital
y
Latv
ia
Lith
uan
ia
Luxe
mb
ou
rg
Mal
ta
Net
her
lan
ds
Po
lan
d
Po
rtu
gal
Ro
man
ia
Slo
vaki
a
Slo
ven
ia
Spai
n
Swed
en
UK
Number of trips 300-1000 km for visiting purposes
>24
13 to 24
6 to 12
3 to 5
2
1
0

EU Survey on issues related to transport and mobility
38
4.3.3 Transport modes used for trips between 300 and 1000 km
For 300 – 1000 km trips car is definitely the favourite mode: nearly three quarters of such trips are made by car (Figure 4-20). Train is the second most used mode, especially for working and studying trips where its share is 16% (considering also High Speed train), but also for personal trips (12% of share).
Figure 4-20: Modal split of trips 300-1000 km by mode, EU28
Car is preferred everywhere but especially in East Europe countries: the share of car in above the average in 8 East Europe countries out of 13 and only in 7 West Europe countries out of 15 (Figure 4-21). Train is used especially in North and Centre Europe: Finland, France, Germany, UK. In some countries – especially in East Europe – coach is used more than train to travel between 300 and 1000 km: Bulgaria, Estonia, Greece, Hungary, Latvia, Lithuania, Portugal, Romania, Slovenia (and of course Malta and Cyprus). The only country where plane plays a significant role also for trips in this distance range is Malta, probably for geographical reasons.
Figure 4-21: Mode split of trips 300-1000 km for working, business, study purposes by country
72% 1%
6%
12%
4% 4% 1%
Mode split of trips 300 - 1000 km working,
business, study purposes - EU28
car
motorcycle
coach
train
HStrain
plane
ship
77%
1%
5% 8% 4% 4% 1%
Mode split of trips 300 - 1000 km personal purposes - EU28
car
motorcycle
coach
train
HStrain
plane
ship
0%
10%
20%
30%
40%
50%
60%
70%
80%
90%
100%
Au
stri
a
Be
lgiu
m
Bu
lgar
ia
Cro
atia
Cyp
rus
Cze
ch R
.
De
nm
ark
Esto
nia
Fin
lan
d
Fran
ce
Ger
man
y
Gre
ece
Hu
nga
ry
Ire
lan
d
Ital
y
Latv
ia
Lith
uan
ia
Luxe
mb
ou
rg
Mal
ta
Net
her
lan
ds
Po
lan
d
Po
rtu
gal
Ro
man
ia
Slo
vaki
a
Slo
ven
ia
Spai
n
Swed
en
UK
Mode split of trips 300-1000 km for working, business,
study purposes
ship
plane
HStrain
train
coach
motorcycle
car

EU Survey on issues related to transport and mobility
39
Figure 4-22: Mode split of trips 300-1000 km for personal purposes by country
0%
10%
20%
30%
40%
50%
60%
70%
80%
90%
100%
Au
stri
a
Be
lgiu
m
Bu
lgar
ia
Cro
atia
Cyp
rus
Cze
ch R
.
De
nm
ark
Esto
nia
Fin
lan
d
Fran
ce
Ger
man
y
Gre
ece
Hu
nga
ry
Ire
lan
d
Ital
y
Latv
ia
Lith
uan
ia
Luxe
mb
ou
rg
Mal
ta
Net
her
lan
ds
Po
lan
d
Po
rtu
gal
Ro
man
ia
Slo
vaki
a
Slo
ven
ia
Spai
n
Swed
en
UK
Mode split of trips 300-1000 km for personal purposes
ship
plane
HStrain
train
coach
motorcycle
car

EU Survey on issues related to transport and mobility
40
4.4 Intermodality plane/rail
A specific aspect concerning long distance trips was investigated in the survey: the intermodality between rail and air transport.
Among respondents that used plane at least once in the last 12 months, half of the sample reported the use of rail transport to access airport or to reach the destination from the arrival airport (Figure 4-23). One quarter of individuals used rail always or most of the times, the other quarter sometimes or occasionally.
Figure 4-23: Frequency of the use of rail to or from airports, EU28
The use of rail to or from airports varies considerably across countries (Figure 4-24), but in this case national differences are only partially significant. Indeed, the share of travellers that used a train in combination with an air trip in each country is influenced by differences in personal preferences, but also by differences in the accessibility of airports by train. However, since many air trips are international, the relevant accessibility is not only that of the airports of the respondents’ country but also of the destination airports. Thus, the evidence that rail is used more by travellers of Austria, Denmark, Germany and The Netherlands is only partially explained by a different attitude towards rail or by a different level of airports accessibility by train in these countries.
11%
14%
14%
11%
50%
Frequency of the use of rail to reach airports - EU28
Yes always
Yes most of the times
Yes sometimes
Yes but onlyoccasionally
No, never

EU Survey on issues related to transport and mobility
41
Figure 4-24: Frequency of the use of rail to or from airports by country
The use of rail in connection to plane seems independent from the city type (Figure 4-25). Individuals living in metropolitan areas or urban areas or rural areas do not show large differences regarding accessing airports by rail. Here again it should be considered that rail can be used at destination and so the role of the living area is only partially relevant.
Figure 4-25: Frequency of the use of rail to reach airports by living area
0%
10%
20%
30%
40%
50%
60%
70%
80%
90%
100%
Au
stri
a
Bel
giu
m
Bu
lgar
ia
Cro
atia
Cyp
rus
Cze
ch R
.
Den
mar
k
Esto
nia
Fin
lan
d
Fran
ce
Ge
rman
y
Gre
ece
Hu
nga
ry
Irel
and
Ital
y
Latv
ia
Lith
uan
ia
Luxe
mb
ou
rg
Mal
ta
Ne
the
rlan
ds
Po
lan
d
Po
rtu
gal
Ro
man
ia
Slo
vaki
a
Slo
ven
ia
Spai
n
Swed
en UK
Frequency of the use of rail to reach aiports
Yes always Yes most of the times Yes sometimes
Yes but only occasionally No, never
0%
10%
20%
30%
40%
50%
60%
70%
80%
90%
100%
Metropolitanarea
Large city Small ormedium town
Rural area
Frequency of the use of rail to reach airports by living area
No, never
Yes but only occasionally
Yes sometimes
Yes most of the times
Yes always
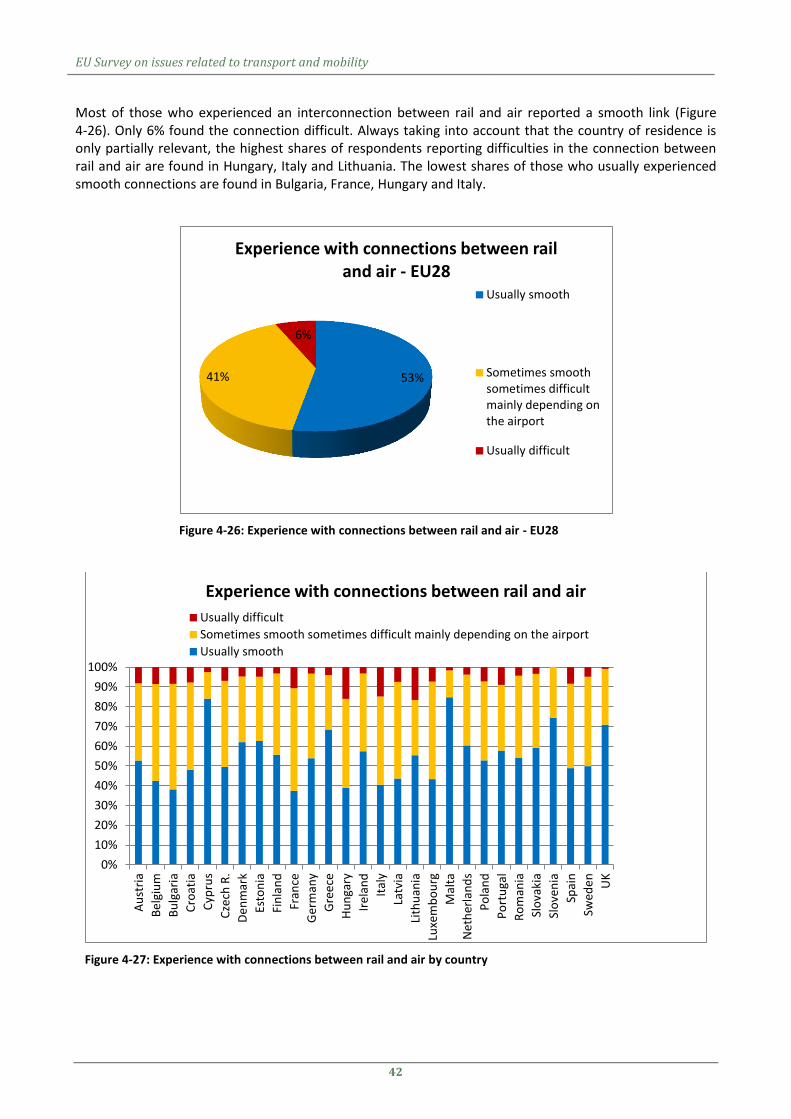
EU Survey on issues related to transport and mobility
42
Most of those who experienced an interconnection between rail and air reported a smooth link (Figure 4-26). Only 6% found the connection difficult. Always taking into account that the country of residence is only partially relevant, the highest shares of respondents reporting difficulties in the connection between rail and air are found in Hungary, Italy and Lithuania. The lowest shares of those who usually experienced smooth connections are found in Bulgaria, France, Hungary and Italy.
Figure 4-26: Experience with connections between rail and air - EU28
Figure 4-27: Experience with connections between rail and air by country
53% 41%
6%
Experience with connections between rail and air - EU28
Usually smooth
Sometimes smoothsometimes difficultmainly depending onthe airport
Usually difficult
0%
10%
20%
30%
40%
50%
60%
70%
80%
90%
100%
Au
stri
a
Be
lgiu
m
Bu
lgar
ia
Cro
atia
Cyp
rus
Cze
ch R
.
De
nm
ark
Esto
nia
Fin
lan
d
Fran
ce
Ger
man
y
Gre
ece
Hu
nga
ry
Ire
lan
d
Ital
y
Latv
ia
Lith
uan
ia
Luxe
mb
ou
rg
Mal
ta
Net
her
lan
ds
Po
lan
d
Po
rtu
gal
Ro
man
ia
Slo
vaki
a
Slo
ven
ia
Spai
n
Swed
en
UK
Experience with connections between rail and air
Usually difficult
Sometimes smooth sometimes difficult mainly depending on the airport
Usually smooth

EU Survey on issues related to transport and mobility
43
5 Attitudes towards innovative transport and transport policy
5.1 Key findings
One third of respondents declare to be ready to consider the purchase of an electric or hybrid car in the next future. Existing incentive schemes at the country level do not seem correlated to the propensity in different countries.
One third of respondents do not know what a car sharing service is. In some countries, only 20% of citizens or less know what car sharing is.
One third of respondents is not interested in car sharing. Only 10% of citizens see car sharing like an alternative to own a private car.
Respondents are significantly worried about environmental adverse effects generated by transport (average rate of 7 on a scale 1 – 10). Car users are only slightly less concerned than the average.
Limiting road traffic is more accepted than road charging, especially because road users are supposed to pay a lot already.
There are no strong preferences about the earmarking of road charging revenues. The use of revenues to improve transport supply (either roads/parking or public transport) is however preferred to reduction of other taxes.
The use of road charging revenues to improve public transport is preferred in West Europe countries whereas in East Europe roads improvements are supported.

EU Survey on issues related to transport and mobility
44
5.2 Electric vehicles
As shown in Figure 5-1 one third of the respondents in EU28 said they would certainly or probably consider to purchase a hybrid or an electric car in the near future. At the same time nearly one fourth will certainly or probably not consider a hybrid or an electric car. The largest share of respondents do not have a strong opinion on this topic. Taking into account that currently hybrid and especially battery electric cars are significantly more expensive than comparable conventional cars, the fact that one citizen out of three is available to consider the purchase of this type of car is representative of a good level of propensity. At the same time, the question asked did not distinguish between battery electric cars and hybrid cars. The latter represent a lower change with respect to conventional car and basically do not imply any change of habits, but only a bargain between a higher purchase cost and a lower fuel economy. Instead a full battery vehicle is not only quite expensive but has currently a limited range, in comparison to conventional vehicles. It might be interesting in a future survey to collect attitudes for the two electric vehicles types separately.
Figure 5-1: Propensity to consider the purchase of an electric car - EU28
The propensity towards electric cars varies among countries going from a maximum of 56% of “yes” or “probably yes” in Italy to a minimum of 14% in Denmark (Figure 5-2). The propensity is generally higher in South Europe countries (e.g. Italy, Greece, Portugal) and often lower in North Europe (e.g. Belgium, Denmark, Sweden). Different propensity could be in principle affected by public incentives but the outcome of the survey does not support this assumption. For instance in Italy and Greece, where the propensity is higher, there were not significant schemes to promote electric cars at the time of the fieldwork in comparison to e.g. France, Luxembourg and UK where purchaser of electric cars received some refund11 but propensity is lower.
11
ACEA (2014)
11%
23%
31%
17%
9% 9%
Propensity to consider the purchase of an electric car - EU28
Certainly yes
Probably yes
Maybe yes maybe not
Probably not
Certainly not
Don't know
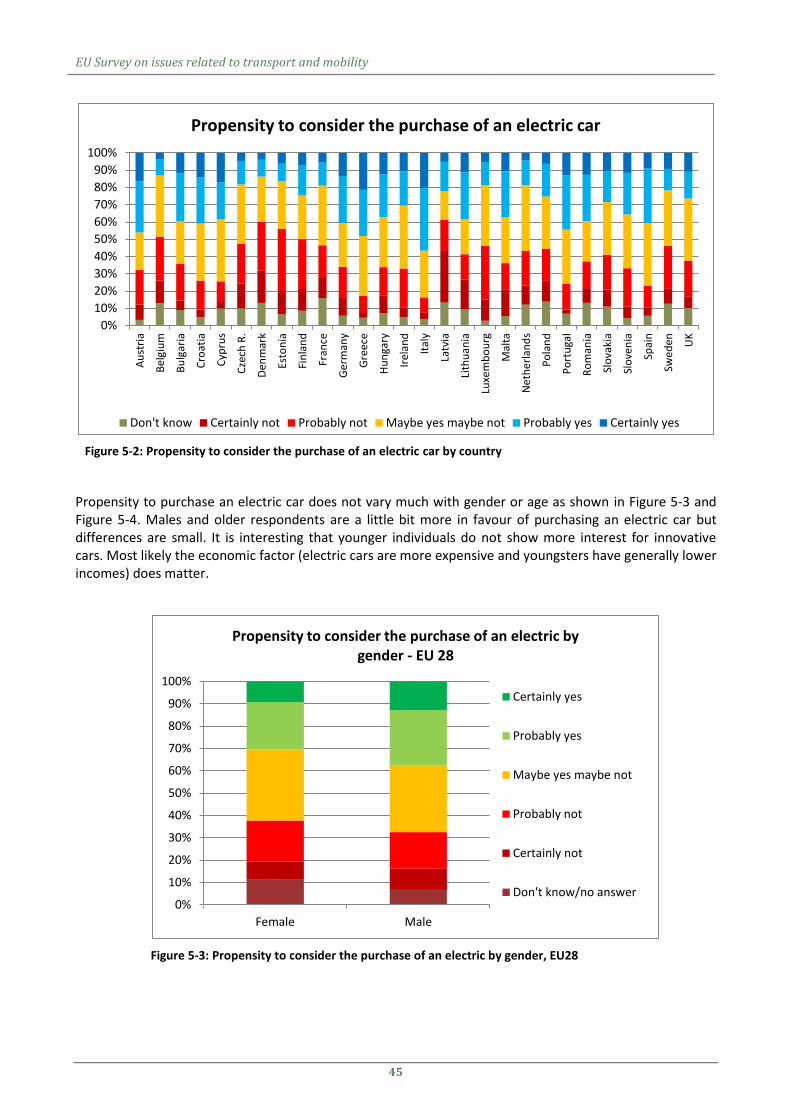
EU Survey on issues related to transport and mobility
45
Figure 5-2: Propensity to consider the purchase of an electric car by country
Propensity to purchase an electric car does not vary much with gender or age as shown in Figure 5-3 and Figure 5-4. Males and older respondents are a little bit more in favour of purchasing an electric car but differences are small. It is interesting that younger individuals do not show more interest for innovative cars. Most likely the economic factor (electric cars are more expensive and youngsters have generally lower incomes) does matter.
Figure 5-3: Propensity to consider the purchase of an electric by gender, EU28
0%
10%
20%
30%
40%
50%
60%
70%
80%
90%
100%A
ust
ria
Bel
giu
m
Bu
lgar
ia
Cro
atia
Cyp
rus
Cze
ch R
.
Den
mar
k
Esto
nia
Fin
lan
d
Fran
ce
Ge
rman
y
Gre
ece
Hu
nga
ry
Irel
and
Ital
y
Latv
ia
Lith
uan
ia
Luxe
mb
ou
rg
Mal
ta
Ne
the
rlan
ds
Po
lan
d
Po
rtu
gal
Ro
man
ia
Slo
vaki
a
Slo
ven
ia
Spai
n
Swed
en UK
Propensity to consider the purchase of an electric car
Don't know Certainly not Probably not Maybe yes maybe not Probably yes Certainly yes
0%
10%
20%
30%
40%
50%
60%
70%
80%
90%
100%
Female Male
Propensity to consider the purchase of an electric by gender - EU 28
Certainly yes
Probably yes
Maybe yes maybe not
Probably not
Certainly not
Don't know/no answer

EU Survey on issues related to transport and mobility
46
Figure 5-4: Propensity to consider the purchase of an electric by age, EU28
0%
10%
20%
30%
40%
50%
60%
70%
80%
90%
100%
16-29 years 30-49 years 50+ years
Propensity to consider the purchase of an electric by age - EU28
Certainly yes
Probably yes
Maybe yes maybe not
Probably not
Certainly not
Do not know

EU Survey on issues related to transport and mobility
47
5.3 Car sharing
Nearly two thirds of the respondents in EU28 know what car sharing is (Figure 5-5). However this average share is the result of wide differences at country level (Figure 5-6). The knowledge of this type of service is very high in some countries, mostly North and Centre Europe countries (Austria, Denmark, France, Germany, Luxembourg, the only South Europe country where the knowledge is above the average is Portugal) where car sharing services have been in place since some years. Instead, in most of the East Europe countries much less individuals know what a car sharing service is, sometimes only 20% or even less.
Figure 5-5: Knowledge of car sharing systems, EU28
Figure 5-6: Knowledge of car sharing systems
The limited knowledge of car sharing could be one explanation of the little interest shown by respondents for subscribing such a service. For almost one half of the individuals the specific features of the system
65%
35%
Knowledge of car sharing systems EU28
Yes
No
0%
10%
20%
30%
40%
50%
60%
70%
80%
90%
100%
Au
stri
a
Be
lgiu
m
Bu
lgar
ia
Cro
atia
Cyp
rus
Cze
ch R
.
De
nm
ark
Esto
nia
Fin
lan
d
Fran
ce
Ger
man
y
Gre
ece
Hu
nga
ry
Ire
lan
d
Ital
y
Latv
ia
Lith
uan
ia
Luxe
mb
ou
rg
Mal
ta
Net
her
lan
ds
Po
lan
d
Po
rtu
gal
Ro
man
ia
Slo
vaki
a
Slo
ven
ia
Spai
n
Swed
en
UK
Knowledge of car sharing systems
No
Yes

EU Survey on issues related to transport and mobility
48
would matter to take a decision (Figure 5-7). However, individuals that know car sharing are not significantly more inclined towards it (see table A5.4 in the annex). One third of the sample is simply not interested. A small share of respondents is already client of a car sharing system. Another 20% would become a client in principle. However, noteworthy, half of those interested in car sharing do not see this type of service as an alternative to car ownership. Only 3% of the sample declared that using a car sharing service would give up a car they currently own. Of course conclusions might be different when a specific car sharing scheme is assessed but in terms of general attitude it seems that individuals do not consider car sharing like a mobility model alternative to car ownership but rather like a mobility solutions complementary to the traditional ones.
Figure 5-7: Propensity to subscribe a car sharing system, EU28
Among the minority of countries where the share of respondents interested in car sharing is prevailing the share of those not interested, there are several countries with a limited availability of cars per adult. As shown in Figure 5-8, the interest for car sharing (net of unresolved individuals) prevails in Bulgaria, Croatia, Greece, Italy, Poland, Portugal, Romania, Slovakia and Slovenia. In 6 out of these 8 countries the availability of cars per adult is below the EU average (see Figure 2-12). This might suggest that where individual motorisation is less advanced, a model based on sharing rather than owning vehicles is considered an alternative way forward. This conclusion is however challenged by the observation that in other countries with a car ownership below the average the level of interest for car sharing is quite low, e.g. Czech Republic, Estonia, Hungary, Latvia, Lithuania.
The level of interest for car sharing seems not influenced by elements like gender, age or living area (even though respondents living in rural areas seem slightly less inclined to become clients of car sharing systems than residents in urban areas). Different attitudes can be found across groups based on the main transport mode used for the most frequent trip (Figure 5-9): car drivers, car passengers and pedestrians are less interested than the average (for opposite reasons probably). Propensity is higher among those who use car in combination with public transport and train. This result suggests that car sharing is not necessarily perceived like a solution to optimise the use of car but like an additional mobility opportunity sometimes more convenient than public transport.
3%
10% 6% 3%
45%
33%
Propensity to subscribe a car sharing system - EU 28
Yes I'm already client of a carsharing service
Yes without any influence onmy car ownership
Yes, instead of purchasing anew car
Yes and I would give up onecar I currently own
Maybe yes, maybe not
No, I would not be interestedin this service

EU Survey on issues related to transport and mobility
49
Figure 5-8: Propensity to subscribe a car sharing system by country
Figure 5-9: Propensity to subscribe a car sharing system by mode used, EU28
Data in the annex provides other elements supporting this view, for instance in Ireland and Italy more than 40% of public transport users and car passengers declared to be interested in car sharing whereas only some 15% of car drivers share the same attitude (See table A5.8).
All in all, contrasting results do not allow for drawing clear conclusions, but it seems fair to observe that the mobility model based of individual motorisation and car ownership is still dominant.
0%
10%
20%
30%
40%
50%
60%
70%
80%
90%
100%
Au
stri
a
Bel
giu
m
Bu
lgar
ia
Cro
atia
Cyp
rus
Cze
ch R
.
Den
mar
k
Esto
nia
Fin
lan
d
Fran
ce
Ge
rman
y
Gre
ece
Hu
nga
ry
Irel
and
Ital
y
Latv
ia
Lith
uan
ia
Luxe
mb
ou
rg
Mal
ta
Ne
the
rlan
ds
Po
lan
d
Po
rtu
gal
Ro
man
ia
Slo
vaki
a
Slo
ven
ia
Spai
n
Swed
en
Propensity to subscribe a car sharing system
Yes and I would give up one car Icurrently own
Yes, instead of purchasing a newcar
Yes I'm already client of a carsharing service
Yes without any influence on mycar ownership
Maybe yes, maybe not_ I wouldneed to test the service before
No, I would not be interested inthis service
Don't know / No answer
0%
10%
20%
30%
40%
50%
60%
70%
80%
90%
100%
Propensity to subscribe a car sharing system - EU 28 No, I would not be interested in thisservice
Maybe yes, maybe not_ I would need totest the service before ta
Yes I'm already client of a car sharingservice
Yes without any influence on my carownership
Yes, instead of purchasing a new car
Yes and I would give up one car Icurrently own

EU Survey on issues related to transport and mobility
50
5.4 Level of concern for the impact of traffic on the environment
Respondents are quite concerned about environmental damages caused by the use of cars. On a scale from 1 (not concerned) to 10 (very concerned) the average EU28 rate is very close to 7 (Figure 5-10). Variability across countries is limited; the average is always between 5 and 8. The least concerned countries are Cyprus and Estonia whereas the most concerned are Bulgaria, Italy, Malta and Romania. Car users are only slightly less concerned than the average: 6.7 on average rather than 6.9 (Figure 5-11).
Figure 5-10: Level of concern regarding pollution caused by cars by country
Figure 5-11: Level of concern regarding pollution caused by cars by mode used, EU28
1
2
3
4
5
6
7
8
9
10
Au
stri
a
Be
lgiu
m
Bu
lgar
ia
Cro
atia
Cyp
rus
Cze
ch R
.
De
nm
ark
Esto
nia
Fin
lan
d
Fran
ce
Ger
man
y
Gre
ece
Hu
nga
ry
Ire
lan
d
Ital
y
Latv
ia
Lith
uan
ia
Luxe
mb
ou
rg
Mal
ta
Net
her
lan
ds
Po
lan
d
Po
rtu
gal
Ro
man
ia
Slo
vaki
a
Slo
ven
ia
Spai
n
Swed
en
UK
Level of concern regarding pollution caused by cars
EU28
1
2
3
4
5
6
7
8
9
10
Car CarPax Motorcycle Train PT SlowMode
Leve
l
Level of concern regarding pollution caused by cars by mode - EU 28

EU Survey on issues related to transport and mobility
51
5.5 Attitude towards road charging
More than 40% of the respondents revealed to have no preference or no opinion regarding alternative policy instruments to fight congestion and environmental damages caused by cars: road charging and traffic limitations (Figure 5-12). Among those who have a preference traffic limitations is as twice as popular than road charging. Actually only 16% of respondents explicitly support road pricing measures.
Countries where paying for less congestion is considered more acceptable are Croatia, Luxembourg and Sweden, but even in those countries this option is supported by a minority of individuals (Figure 5-13). Net of undecided responses, the preference for limits to road traffic is overwhelming in Estonia, France, Greece and Italy whereas opinions are more balanced in Denmark, Lithuania, Latvia and Sweden.
Figure 5-12: Preferred policy option to fight urban congestion and pollution - EU28
Figure 5-13: Preferred policy option to fight urban congestion and pollution by country
Since traffic limitations and road charging are measures affecting especially the use of car, it is interesting to note that the opinions of car drivers do not differ much from the average (Figure 5-14). The larger
18%
29%
11%
5%
37%
Preferred policy option to fight urban congestion and pollution - EU 28
Definitely traffic limits
Probably traffic limits
Probably road charging
Definitely road charging
No preferences
0%
10%
20%
30%
40%
50%
60%
70%
80%
90%
100%
Au
stri
a
Be
lgiu
m
Bu
lgar
ia
Cro
atia
Cyp
rus
Cze
ch R
.
De
nm
ark
Esto
nia
Fin
lan
d
Fran
ce
Ger
man
y
Gre
ece
Hu
nga
ry
Ire
lan
d
Ital
y
Latv
ia
Lith
uan
ia
Luxe
mb
ou
rg
Mal
ta
Net
her
lan
ds
Po
lan
d
Po
rtu
gal
Ro
man
ia
Slo
vaki
a
Slo
ven
ia
Spai
n
Swed
en
UK
Preferred policy option to fight urban congestion and pollution
No preferences Definitely traffic limits Probably traffic limits Probably road charging Definitely road charging

EU Survey on issues related to transport and mobility
52
differences are found in Lithuania – where 12% of road drivers support road charging compared to 19% of the whole respondents – in Romania – 26% compared to 20% – and Latvia – 23% compared to 18% (Figure 5-15).
Figure 5-14: Preferred policy option of car drivers to fight urban congestion and pollution, EU28
Figure 5-15: Preferred policy option of car drivers to fight urban congestion and pollution by country
The largest share of respondents opposing road charging motivate their opinion with the already high tax burden for car users (Figure 5-16). Other three reasons (unfairness and ineffectiveness of taxes, lack of alternatives) have a similar relevance on average.
At the country level there are differences (Figure 5-17). In particular two groups of countries can be identified. One group is in agreement with the average view and is against road charging because consider the existing taxation on cars already very high. Belgium, Cyprus, Finland, France, Germany and Greece
16%
28%
11%
4%
41%
Preferred policy option of car drivers to fight urban congestion and pollution - EU 28
Definitely traffic limits
Probably traffic limits
Probably road charging
Definitely road charging
No preferences
0%
10%
20%
30%
40%
50%
60%
70%
80%
90%
100%
Au
stri
a
Be
lgiu
m
Bu
lgar
ia
Cro
atia
Cyp
rus
Cze
ch R
.
De
nm
ark
Esto
nia
Fin
lan
d
Fran
ce
Ger
man
y
Gre
ece
Hu
nga
ry
Ire
lan
d
Ital
y
Latv
ia
Lith
uan
ia
Luxe
mb
ou
rg
Mal
ta
Net
her
lan
ds
Po
lan
d
Po
rtu
gal
Ro
man
ia
Slo
vaki
a
Slo
ven
ia
Spai
n
Swed
en
UK
Preferred policy option of car drivers to fight urban congestion and pollution
No preferences Definitely traffic limits Probably traffic limits Probably road charging Definitely road charging

EU Survey on issues related to transport and mobility
53
belong to this group. In another cluster of countries the most quoted reason against road charging is that they see this measure as ineffective to fight congestion and pollution caused by cars. Austria, Bulgaria, Lithuania, Luxembourg and Slovakia are in this cluster. Both groups include higher income and lower income countries, South Europe and North Europe countries. There is not any apparent variable to justify why one country belongs to one group or another.
Figure 5-16: Reasons for opposing to road charging - EU28
Figure 5-17: Reasons for opposing road charging by country
Assuming that the car use is charged, tolls modulated on the level of pollution (environmental charging) or on the level of traffic (congestion charging) are preferred to fixed taxes (Figure 5-18) and, environmental charging is preferred to congestion charging. Almost 40% of the respondents have no preferences.
Applying tolls proportional to pollution levels of vehicles is better accepted than charging according to the level of traffic in all countries but Finland (Figure 5-19). In several countries even a fixed tax is favoured against congestion charging. Most are East Europe countries (Bulgaria, Lithuania, Latvia, Romania, Slovakia, Slovenia) but also Austria, Belgium, Germany and Portugal are in this group.
17%
39% 20%
21%
3%
Reasons for opposing tolls - EU28
Lack of alternatives tocar
Road users already paya lot
Tolls are unfair
Tolls are ineffective
Don't know
0%
10%
20%
30%
40%
50%
60%
70%
80%
90%
100%
Au
stri
a
Bel
giu
m
Bu
lgar
ia
Cro
atia
Cyp
rus
Cze
ch R
.
Den
mar
k
Esto
nia
Fin
lan
d
Fran
ce
Ge
rman
y
Gre
ece
Hu
nga
ry
Irel
and
Ital
y
Latv
ia
Lith
uan
ia
Luxe
mb
ou
rg
Mal
ta
Ne
the
rlan
ds
Po
lan
d
Po
rtu
gal
Ro
man
ia
Slo
vaki
a
Slo
ven
ia
Spai
n
Swed
en UK
Reasons for opposing tolls
Lack of alternatives to car Road users already pay a lot Tolls are unfair Tolls are ineffective Don't know

EU Survey on issues related to transport and mobility
54
Figure 5-18: Preferred road charging system - EU28
Figure 5-19: Preferred road charging system by country
Restricting the analysis to the minority that declared to prefer road charging to traffic limitations, the picture is somewhat different: the share of respondent without opinion clearly decreases and the share of those in favour of congestion charging is almost double than in the overall sample (Figure 5-20). This more balanced preferences are observed in all countries (Figure 5-21) and Denmark, Sweden and UK join Finland in considering congestion charging preferable to pollution charging.
36%
14% 13%
37%
Preferred road toll system - EU28
Pollution based charge
Traffic based charge
Fixed circulation tax
No preference
0%
10%
20%
30%
40%
50%
60%
70%
80%
90%
100%
Au
stri
a
Bel
giu
m
Bu
lgar
ia
Cro
atia
Cyp
rus
Cze
ch R
.
Den
mar
k
Esto
nia
Fin
lan
d
Fran
ce
Ger
man
y
Gre
ece
Hu
nga
ry
Irel
and
Ital
y
Latv
ia
Lith
uan
ia
Luxe
mb
ou
rg
Mal
ta
Net
her
lan
ds
Po
lan
d
Po
rtu
gal
Ro
man
ia
Slo
vaki
a
Slo
ven
ia
Spai
n
Swed
en UK
Preferred road toll system
Pollution based charge Traffic based charge Fixed circulation tax No preference

EU Survey on issues related to transport and mobility
55
Figure 5-20: Preferred road charging system by those who agree with tolls - EU28
Figure 5-21: Preferred road charging system by those who agree with tolls by country
With respect to the possible alternative uses of road charging revenues respondents did not show clear preferences. The favourite alternative was to use revenues to improve public transport, followed by improvements to roads and parking areas (Figure 5-22). These two alternatives collect more than half of the preferences. Some 16% of respondents did not express a preference. The remaining responses are split into identical shares between reduction of road vehicle taxes and reduction of other taxes.
38%
26%
19%
17%
Preferred road toll system of those who agree with tolls- EU28
Pollution based charge
Traffic based charge
Fixed circulation tax
No preference
0%
10%
20%
30%
40%
50%
60%
70%
80%
90%
100%
Au
stri
a
Bel
giu
m
Bu
lgar
ia
Cro
atia
Cyp
rus
Cze
ch R
.
Den
mar
k
Esto
nia
Fin
lan
d
Fran
ce
Ger
man
y
Gre
ece
Hu
nga
ry
Irel
and
Ital
y
Latv
ia
Lith
uan
ia
Luxe
mb
ou
rg
Mal
ta
Net
her
lan
ds
Po
lan
d
Po
rtu
gal
Ro
man
ia
Slo
vaki
a
Slo
ven
ia
Spai
n
Swed
en UK
Preferred road toll system of those who agree with tolls
Pollution based charge Traffic based charge Fixed circulation tax No preference

EU Survey on issues related to transport and mobility
56
Figure 5-22: Preferred use of road charging revenues, EU28
The hierarchy of preferences is different across countries (Figure 5-23). In most of West Europe countries and in Croatia the improvement of public transport is the most favourite option. In most of the East Europe countries and in Greece respondents would rather see revenues earmarked for improving roads and parking areas. Germany and Ireland are the only two countries where the majority of preferences goes to reduce other taxes on road vehicles (interestingly Ireland is the country with the highest share of individuals living in areas not or badly served by public transport, see Figure 2-6). Nowhere respondents wish to see other taxes reduced to balance the introduction of road charging.
Figure 5-23: Preferred use of road toll revenues
Again, if only the preferences of those who support road charging instead of traffic limitations are considered, there are some differences. More people express a preference and the use of revenues to improve public transport or roads is supported by two thirds of this subsample (Figure 5-24). The different inclinations observed between West Europe and East Europe countries are confirmed and somewhat
29%
23% 16%
16%
16%
Preferred use of road toll revenues - EU28
To improve publictransport
To improve roadsand parking areas
To reduce othertaxes
To reduce taxationon road vehicles
No preference
0%
10%
20%
30%
40%
50%
60%
70%
80%
90%
100%
Au
stri
a
Bel
giu
m
Bu
lgar
ia
Cro
atia
Cyp
rus
Cze
ch R
.
Den
mar
k
Esto
nia
Fin
lan
d
Fran
ce
Ge
rman
y
Gre
ece
Hu
nga
ry
Irel
and
Ital
y
Latv
ia
Lith
uan
ia
Luxe
mb
ou
rg
Mal
ta
Ne
the
rlan
ds
Po
lan
d
Po
rtu
gal
Ro
man
ia
Slo
vaki
a
Slo
ven
ia
Spai
n
Swed
en UK
Preferred use of road toll revenues To reducetaxation on roadvehicles
To reduce othertaxes
To improve roadsand parkingareas
To improvepublic transport
No preference

EU Survey on issues related to transport and mobility
57
emphasised (Figure 5-25). However, Germany joins eastern countries (preference to improve roads) and Ireland aligns with other western countries (preference to improve public transport).
Figure 5-24: Preferred use of road toll revenues of those who agree with tolls, EU28
Figure 5-25: Preferred use of road toll revenues of those who agree with tolls
34%
33%
12%
15% 6%
Preferred use of road toll revenues of those who agree with tolls
- EU28 To improve publictransport
To improve roads andparking areas
To reduce other taxes
To reduce taxation onroad vehicles
No preference
0%
10%
20%
30%
40%
50%
60%
70%
80%
90%
100%
Au
stri
a
Bel
giu
m
Bu
lgar
ia
Cro
atia
Cyp
rus
Cze
ch R
.
Den
mar
k
Esto
nia
Fin
lan
d
Fran
ce
Ge
rman
y
Gre
ece
Hu
nga
ry
Irel
and
Ital
y
Latv
ia
Lith
uan
ia
Lou
xem
bo
urg
Mal
ta
Ne
the
rlan
ds
Po
lan
d
Po
rtu
gal
Ro
man
ia
Slo
vaki
a
Slo
ven
ia
Spai
n
Swed
en UK
Preferred use of road toll revenues of those who agree with tolls
To reducetaxation on roadvehicles
To reduce othertaxes
To improve roadsand parkingareas
To improvepublic transport
No preference

EU Survey on issues related to transport and mobility
58
6 Conclusions The EU Survey on issues related to transport and mobility provided a wide range of elements to describe some key aspects of mobility in the EU countries and to compare countries to each other. Having in mind relevance for transport policy the main considerations emerging from the data seem the followings:
Passenger mobility in EU is heavily centred on personal car. Car is largely the most used transport mode for everyday mobility but also for long distance trips. Public transport is relatively more used in East Europe countries but this seems mainly due to a lower car availability than to better public transport services: the share of inhabitants living in areas with a good quality of public transport connections does not seem higher at East. Therefore, if in East Europe motorisation rate will continue to increase the role of public transport and of other sustainable modes could be reduced. If one objective of the transport policy is to promote sustainable mobility the link between car ownership and car use should not be disregarded.
Local car trips are longer than local trips made with alternative modes (with the exception of train) but their duration is similar. This evidence supports the case that car is used to travel farther rather than faster. This evidence also suggests that transport mode choice is part of several decisions concerning aspects like residential and job location (e.g. if I have a car I can live outside the city where dwellings are cheaper or if I want to live outside where environment is better I need a car). Such decisions are partly a matter of preferences but partly are taken under external constraints (e.g. cost of residences, availability of jobs). Transport policy aimed at supporting sustainable mobility probably needs to frame the use of car in this multidimensional context to be effective.
Electric cars and car sharing can play a role to improve the sustainability of transport. However these options are currently seen more like a possibility than a real alternative. Furthermore both these solutions confirm the role of private mobility. Also car sharing, in fact, seems perceived more like a complementary option, that can allow for using a car instead of public transport for specific trips, rather than an alternative model where sharing replace owning a personal car. For that reason and considering that electric cars can reduce pollution (provided that power is produced by renewable sources) but not congestion, these solutions are probably insufficient for an effective sustainable oriented transport policy.
Internalisation of environmental effects of transport is increasingly popular among policy makers but not so among EU citizens. A large share of individuals do not have a clear preference for one strategy or another, but among those who express themselves road charging is definitely less appreciated than command and control measures. Someone complain that road users already pay a lot, others argue that charges are ineffective, equity concerns are also raised. If policy makers want to extend internalisation as policy instrument should be aware that acceptability is largely to be built.
Should road charges become widely used there is a clear difference of perspective between East and West Europe. The latter would mainly use revenues to improve public transport whereas the former asks especially for more and better roads and parking spaces. This evidence bring back to the initial remarks in this summary: car is still very attractive, especially for those who so far have had less opportunities to drive a personal vehicle. Even measures conceived to promote sustainable transport could eventually lead to improve the conditions for using private solutions.
From a methodological point of view, the survey was able to reach a balanced and representative sample in all the 28 countries without missing any relevant social group and with quite a good coverage also of the European territory (sample segmentation by living region). Also, the methodology allowed to administer the same questionnaire in all countries therefore with basically no issues in terms of comparability. The web-based questionnaire proved to be an efficient and effective alternative to telephone interviews. The result was a large set of data on personal mobility behaviour that passed tests of internal consistency and looked largely comparable to other sources of information.

EU Survey on issues related to transport and mobility
59
The indicators computed using the results of the survey and presented in this report provide a comparable picture of mobility across the 28 EU countries. The same indicators could be used to monitor transformations of mobility over time by repeating the survey in future years with a comparable sample and questionnaire. For instance it could be very interesting to monitor the role of car in East Europe countries to see whether motorisation will tend to close the gap with West Europe countries and, in that case, whether the use of public transport will suffer.
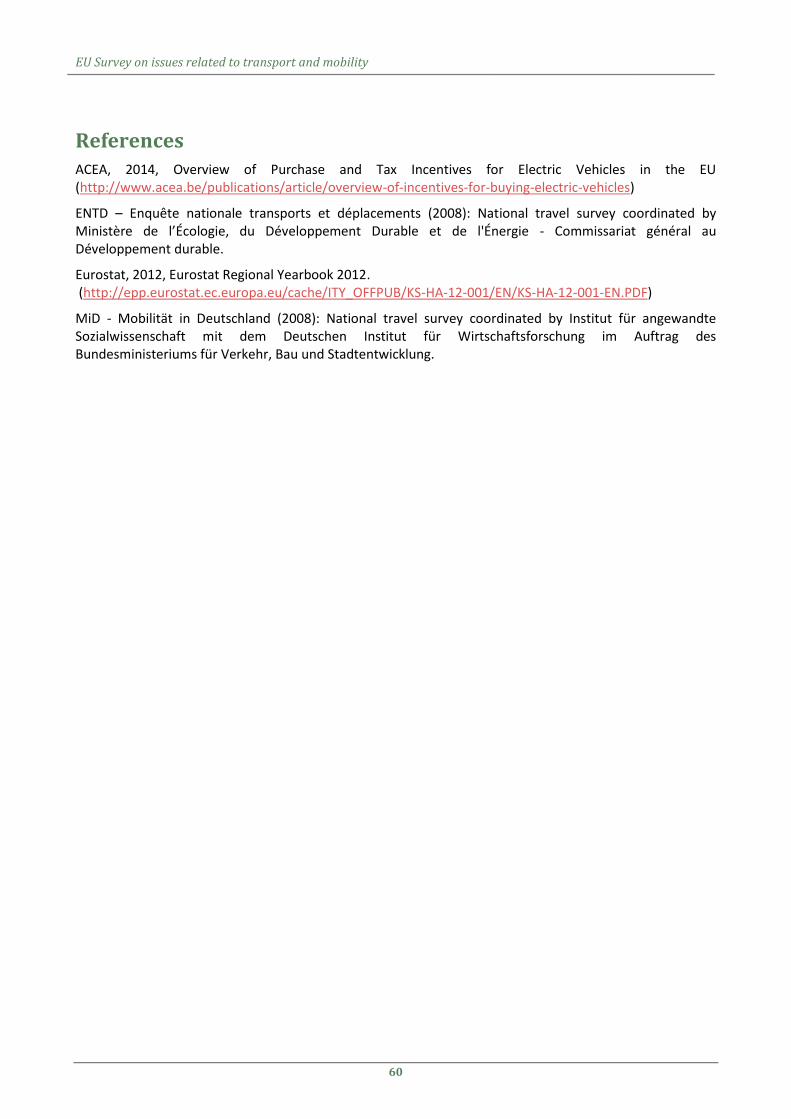
EU Survey on issues related to transport and mobility
60
References ACEA, 2014, Overview of Purchase and Tax Incentives for Electric Vehicles in the EU (http://www.acea.be/publications/article/overview-of-incentives-for-buying-electric-vehicles)
ENTD – Enquête nationale transports et déplacements (2008): National travel survey coordinated by Ministère de l’Écologie, du Développement Durable et de l'Énergie - Commissariat général au Développement durable.
Eurostat, 2012, Eurostat Regional Yearbook 2012. (http://epp.eurostat.ec.europa.eu/cache/ITY_OFFPUB/KS-HA-12-001/EN/KS-HA-12-001-EN.PDF)
MiD - Mobilität in Deutschland (2008): National travel survey coordinated by Institut für angewandte Sozialwissenschaft mit dem Deutschen Institut für Wirtschaftsforschung im Auftrag des Bundesministeriums für Verkehr, Bau und Stadtentwicklung.

EU Survey on issues related to transport and mobility
61
Technical annex – Representativeness of the sample and influences on reliability of results
The results of the survey presented in this report are elaborations of responses provided by a sample of 1000 individuals in each country (500 individuals in Cyprus, Luxembourg and Malta). As explained in the Evaluation report, a stratified sample was defined rather than a simple random sample in order to increase the efficiency of the estimates. Sample strata were defined according to five variables:
gender
age
professional condition (working / not working)
education level (graduated / non graduated)
living region
In each country sample quotas were defined for the sample such as its composition corresponds to that of population for each of these elements. The quotas were defined independently for each element with the exception of age and gender, which were considered jointly. In other words, the sample was aimed at reflecting the age composition of females and the age composition of males whereas the target quota for e.g. graduated respondents was based on total share of graduated individuals in the population without distinction between females and males. Or, another example, age and gender composition considered for the sample quota was the national one not that of each living region.
The reason for using independent quotas was to keep the complexity of the sampling process within workable limits. Setting quotas for the combination of all stratification criteria would mean identify a large number of very small subsamples which would be almost impossible to obtain in practice. Furthermore, it should be considered that available statistical country data does not allow to split the population according to all criteria at the same time. For instance it is unknown the share of males aged 25-55 years, graduated, in working conditions living in region X.
The practical outcome of setting independent quotas is that even if the share of e.g. working respondents in the sample is equal to the share of working respondents in the population and the share of e.g. females is also perfectly reproduced, the share of e.g. working females could be overrepresented or underrepresented. Of course, the more criteria are considered in combination and the more likely is that the sample composition is not the same as population.
A second driver of differences between the composition of the sample and the composition of the population is that for level of education and working status “soft” quotas were defined for the recruitment. “Soft quotas” means that target sizes are identified for the subsamples but some flexibility was allowed to complete the survey. For instance, a quota of n respondents having a higher level of education were set, but it was not strictly required that the sample included exactly n individuals. Again, this methodological choice was made to improve the feasibility of the survey.
Anyway, as documented in the evaluation report, the country samples resulting from the survey match well the composition of the population. In most of the cases, the share of each group is basically the same in the sample as in the population, with very limited discrepancies. Larger differences are detected in the distribution of the sample by education level (the share of graduates is generally overestimated) and some discrepancy exists also regarding the share of employed individuals. These discrepancies can be explained with the uneven accessibility to the internet across social groups especially in countries with a relatively

EU Survey on issues related to transport and mobility
62
lower level of income and economic development. The countries where such discrepancies are larger are those where soft quotas have been relaxed to allow for the completion of the fieldwork.
In the end, the structure of the sample is generally close to the structure of the population with some differences12. Anyway all the results provided in the report take into account the differences in the composition between the population and the sample by weighing individual data with the ratio between the share of the group the individual belongs in the population and the share of the same group in the sample. For example: if U is the share of females in reference population, S is the share of females in the sample the weight W associated to females in the sample is computed with the simple formula W = U / S. When the segmentation concerns several variables, like in this survey, the weight associated to each individual depends on the structure of the population and of the sample according to all the segmentation variables13.
The drawback of weights significantly higher than 1 is that if results for some of the individuals receiving such weights are significantly different from the average, the aggregate statistics can be affected. This risk is usually negligible when the whole population is considered but when the analysis is restricted to some segments (and therefore to a subset of records) the influence can be larger. For instance, if an individual receiving a large weight usually travels by bike over 10 km whereas the average trip length of other bike users is 3 km, the single value of the individual can affect the average distance: the smaller the total number of bike users the larger the influence of that single data.
In the dataset, 847 records out of 26605 (i.e. 3% of records)are associated to a weight larger than 2 and 133 records (i.e. nearly 0.5%) are associated to a weight larger than 4. So the risk of biased results induced by high weighted outliers is in general very low even when subsamples are considered.
Sampling survey results are associated to confidence intervals around estimates. The width of these intervals depend on the sample size and on the value and distribution of the target variable under estimation in the population. Making reference to the estimation of a frequency P (which is actually the target of several questions of the survey e.g. the share of individuals owning a car, the share of individuals using public transport for their most frequent trip, the share of long distance travellers making more than 6 trips per year, the share of respondents supporting road charging, etc.) the confidence intervals for various sample sizes are shown in table A1 below.
Table A1: confidence intervals around the estimates of a frequency in the 95% of cases for various sample sizes
Sample size P = 50% P = 40% P = 30% P = 20% P = 10%
1000 2% 2% 2% 2% 1%
500 3% 3% 3% 3% 2%
200 5% 5% 5% 4% 3%
100 7% 7% 6% 6% 4%
50 10% 10% 9% 8% 6%
25 14% 14% 13% 11% 8%
10 22% 22% 20% 18% 13%
12
The annex to the evaluation report provides, country by country, the population shares and the sample shares for each stratification variables.
13 As mentioned above, the distribution of the population for the combination of all variables together is unknown. Weights have been therefore computed through a procedure constrained to respect the distribution according to each of the segmentation variables.

EU Survey on issues related to transport and mobility
63
When the full sample is used (1000 or 500 individuals) the confidence interval around estimates is no more
than 2% or 3% in the 95% the cases whatever the real value of the frequency in the population. For instance, if the sampling estimation is 35% the actual value in the population will be in the interval 33% - 37% in the 95% of cases.
When subsamples are considered the confidence interval is wider. For instance, when a frequency of 40% is
estimated on 100 individuals, the actual value will be within the interval 30% - 50% (10%) in the 95% of the cases.
These confidence intervals should be considered when results are analysed for specific segments e.g. for respondents living in a certain region.

Europe Direct is a service to help you find answers to your questions about the European Union
Freephone number (*): 00 800 6 7 8 9 10 11
(*) Certain mobile telephone operators do not allow access to 00 800 numbers or these calls may be billed.
A great deal of additional information on the European Union is available on the Internet.
It can be accessed through the Europa server http://europa.eu.
How to obtain EU publications
Our publications are available from EU Bookshop (http://bookshop.europa.eu),
where you can place an order with the sales agent of your choice.
The Publications Office has a worldwide network of sales agents.
You can obtain their contact details by sending a fax to (352) 29 29-42758.
European Commission
EUR 27334 EN – Joint Research Centre – Institute for Prospective Technological Studies
Title: EU survey on issues related to transport and mobility
Author(s): Davide Fiorello, Loredana Zani
Luxembourg: Publications Office of the European Union
2015 – 67 pp. – 21.0 x 29.7 cm
EUR – Scientific and Technical Research series – ISSN 1831-9424 (online)
ISBN 978-92-79-49281-5 (PDF)
doi:10.2791/48322

doi:10.2791/48322
ISBN 978-92-79-49281-5
JRC Mission
As the Commission’s in-house science service, the Joint Research Centre’s mission is to provide EU policies with independent, evidence-based scientific and technical support throughout the whole policy cycle.
Working in close cooperation with policy Directorates-General, the JRC addresses key societal challenges while stimulating innovation through developing new methods, tools and standards, and sharing its know-how with the Member States, the scientific community and international partners.
Serving society Stimulating innovation Supporting legislation
LF-N
A-2
73
34
-EN
-N