eudet pixel telescope data taking manual - updated version
TRANSCRIPT

EUDET-Memo-2009-03
EUDET
EUDET Pixel Telescope Data Taking Manual - UpdatedVersion 2009
EUDET JRA1 Group
August 5, 2009
Abstract
This manual is intended to help users to take data using the EUDET pixel tele-scope. You will find detailed explanation on how to power up the telescope, howto start the run control and pictures of important items.
1

EUDET-Memo-2009-03
1 Introduction
The aim of this document is to help users to take data with the EUDET pixel telescope.It is intended to provide all necessary information in a simple way and to provide helpin case of known problems. Thus no technical details are explained here. For this pleaserefer to our EUDET JRA1 webpage [1].
In Section 2 it is explained how the hardware of the telescope is switched on. Section3 describes the DAQ software while the topic of Section 4 is the TLU control utility.
Here the status of the telescope in August 2009 is described. Since the developmentof the hardware and the DAQ software is still in progress, changes to the presentedinformation are possible. Please report comments to [email protected]. The datamanual from September 2007 is mostly obsolete and should not be used anymore.
Important: We ask all the telescope user group to document the data taking in anelectronics logbook. If this is not done, the possibilities that we give support during thedata analysis is limited. So please write down any changes to the system, any problemsetc. We usually use a simple Google spread sheet, but this is up to the user groups aslong we have access to the information.
2 Switching on the hardware
In general the telescope is already turned on when you start data taking, but there mightbe the situation that the hardware is partially or completely turned off. In summer powerouts or just glitches are rather frequent. Then you can refer to this section to make surethat you do it the right way.
2.1 VME-Crate
After a power cut check if the VME-Crate is turned on. It also houses the CPU com-municating to the rest of the telescope. It should be turned on first. The power switchof the VME-Crate is located at the front side of the device.
2.2 Cooling
A Huber cooling device, as shown in Figure 1, is used for the pixel telescope. Thecooling device uses water as cooling liquid. A typical operating temperature is 14◦ C.At room temperature it takes about 20 minutes until the telescope is cooled after thecooling system was switched on. Please do not reduce the temperature much lower toavoid condensation water and corrosion. These steps need to be followed to switch iton:
• Switch on the power of the cooling device.
2

EUDET-Memo-2009-03
Figure 1: The Huber cooling device
• Press the button Set.
• Adjust the temperature using the wheel to 14◦ C. Probably it is already set to thisvalue.
• Press the button Set again.
• To start the pump press the rightmost of the three blue buttons.
Please also check the water level inside the cooling device ones a week. The device stopscooling if the level is too low and will start an alarm noise. But the sound is probablynot audible in the control room.
2.3 Power supplies for Sensors
The power for the telescope sensors is provided by two AGILENT E3644A power sup-plies. Each power supply provides an electric potential of 8V. By connecting the ”-”potential of the upper and the ”+” potential of the lower supply, +8V and -8V areprovided. Please do not touch the cabling.To switch on the power supplies follow this procedure:
• Press the Power button.
• Press the button Recall three times. Otherwise the default values would be wrong.
• Press the Set Limits button.
3

EUDET-Memo-2009-03
Figure 2: Power supplies for the sensors. Please check then after a power cut or glitch.
• Enable the output using the Output On/Off button. This should be done forboth power supplies at the same time, best by using two hands.
When the sensors get turned on, the drawn current of the upper power supply (+8 V)should be around 3.7 A while the lower one should be about 1.6 . These are the numbersfor six MimoTel. After the chips are properly programmed the currents should decreaseto 2.6 A and 0.8 A. The starting of the DAQ software (EUDAQ) automatically takescare of the sensor programming.
3 Running the DAQ software
The DAQ software is running on the MAC in the control room. In the first subsectiona short tutorial is given how to take a run. The further subsections list the availableconfigurations and provide help in case of problems.
3.1 Starting EUDAQ
• If necessary login as user eudet.
• Open a shell and enter the directory h̃ome/eudaq. The software can be startedby the command ./STARTRUN.
• Several windows are opening. The data taking is controlled in the window eudaqRun Control which is shown in figure 4.
4

EUDET-Memo-2009-03
Figure 3: The EUDAQ Run Control window. You can select the configuration frommany different possibilities. In the status part you can see the Run number,the current rate and the scaler numbers. In the lowest part of the windowyou can see the state of all the different producers. In case of a problem theunderlying colour changes to red.
• Choose a configuration and click on the button Config. Wait until the state of theTLU and EUDRB producers is “Configured”. This is necessary after any changesof the setup. Some configurations are listed in subsection 3.2.
• Runs can be started by hitting the button Start and are stopped using the buttonStop. Please be patient and don’t press too fast the next button. Also don’tforget to change the GeoID if the geometry of the setup was changed.
• In the run control window status you can see the Run number, the current triggerrate and also the scaler numbers. In the lowest part of the window you can seethe state of all the different producers.
• Log messages are displayed in the window EUDAQ Log Collector. In case of aproblem the underlying colour changes to red. The user can add own log messagesby typing some text in the run control window after Log: and then press the Logbutton.
• The data quality can be monitored in the window EUDAQ Root Monitor. Plotsare shown for the whole telescope and for the individual boards. Some plots needa certain number of events to be filled. Hence they typically appear after a fewminutes. If the window was closed and needs to be restarted, please read 3.4.1.
5

EUDET-Memo-2009-03
• Before the size of the output files reaches the limit of 2 GB, the output file ischanged automatically and the data taking continues with a new run number.
3.2 Available configurations
Data can be taken using different configurations. Here some configurations relevant forthe normal user are summarised:
• beam: Data is taken in RAW mode.
• beamzs: Data is taken using zero suppression. This is the default running mode.
• ped: A pedestal run is taken.
3.3 Pedestals
About every 8 hours pedestal should be taken and uploaded to the system. Also if youhad a power cut and everything was powered off and on, please take another pedestaland upload it. All together this takes about 15 minutes.
3.3.1 Taking Pedestals
First you should close the shutter (go to the beam computer in HNA453 and pressthe yellow door in the ”H6 Access Command” window. After about 5 minutes theflash light on the area door will turn to yellow. Now you would also be able to do akey access. After this you take a pedestal file with 500 events (configure eudet-pedestal).
Don’t forget to press the button ”end of key access” on the area door and ”beam on”in the access command window. Otherwise you will wait a long time for the beam.
3.3.2 Uploading to the System
In eudaq/bin you start the pedestal uploading process ./pedestal.sh xxxx in eu-daq/bin. Here xxxx is the run number of the new pedestal just taken. The script willtake a few minutes, during this the native file format is converted to lcio format, thenthe pedestal calculation script is run over the lcio data and histograms and pedestalsare created. The plots are currently not displayed yet (under construction). Finallythe output is copied to the MVME6100. When the next data run is started, this newpedestal file will be used for the threshold setting for the zero suppressed mode.
3.4 Troubleshooting
In the following subsections instructions are given how to solve simple problems duringdata taking.
6

EUDET-Memo-2009-03
3.4.1 Restart Root Monitor
In case the Root Monitor window was closed, it can be restarted from the commandline. Therefore go to the directory h̃ome/eudaq/bin/. To restart the Root Monitortype RootMonitor.exe -f [run number]. During data taking the run number canbe found in the eudaq Run Control window. It is also possible to connect the RootMonitor to the run control. Therefore type ./RootMonitor.exe -r eudet.local at thecommand line.
3.4.2 Crash of DAQ software
Just restart the software by typing ./STARTRUN again. This kills all previous pro-cesses.
3.4.3 Check if sensors are programmed
Watch the currents at the displays of the power supplies. The currents reduce at themoment the sensors are programmed. But this is a bit too difficult when you are sittingthe control room. In Section 5 you will find some reference plots to check if the sensorsare alright.
4 The TLU Control Utility
The program TLUcontrol.exe allows to control the trigger logic unit and to run it standalone. This can be useful for test purposes. In the following, it is described how to startthis utility.
• The EUDAQ program should be exited ( ./KILLRUN)
• Open a shell on the MAC in the control room and type ssh root@tlupc. Nopassword is necessary.
• Enter the directory /home/eudet/eudaq/tlu.
• Help is available typing the command ./TLUcontrol.exe -h.
• The control utility can be started by the command ./TLUcontrol.exe -d [x]-a [y]. Here x is the mask for enabling DUT connections and y is the mask forcoincidence of external triggers. To calculate the masks add the following numbers:1 for PMT1, 2 for PMT2, 4 for PMT3 and 8 for PMT4. For detailed configurationissues check the helpfile.
• The program can be stopped by Ctrl-c.
7

EUDET-Memo-2009-03
5 Reference Plots
In this section you will find some reference plots how things should look like when every-thing is working as it is supposed to work as well some examples of obvious problems.
5.1 RootMonitor
The Root Monitor is automatically started when EUDAQ is started. If not, pleasego to section ??. In order to speed up the monitoring, it is programmed such a waythat only preselected plots are displayed. You can select from the categories ”MainHistogram”, ”CDS Lego Plot” and ”Board Displays”. In Main Histograms all you canfind for example correlation plots, needed during data taking.
Figure 4: The Root Monitor. Please select the plots you want to have displayed andpress ”Apply”.
5.2 Noisemap
As you should take a pedestal about every 8 hours, you should also take a look at thenoise maps. After a power cut or other problems you should also take a new pedestalfile. In Figure 5 example plots from board 0 and board 5 are displayed. You can seeon each sensor the division in fours subarrays, the little ”hot spots” at each of the subarrays. The scale is fixed from 0 to 15 ADCs but should be on average below 4. Inthe plot for board 5 there is a ”blob” of dead pixels in the second from left array. Thisis normal as this sensor is from the very first batch of MimoTels where a production
8

EUDET-Memo-2009-03
problem occurred. We kept the sensor in our system as this blob was always very usefulwhen debugging our system.
Figure 5: 2D noise map of board0 (left) and board 5. Please note the ”blob” of deadpixels on board 5. This is a feature of this sensor and we left it in the systemas we grew fond of it
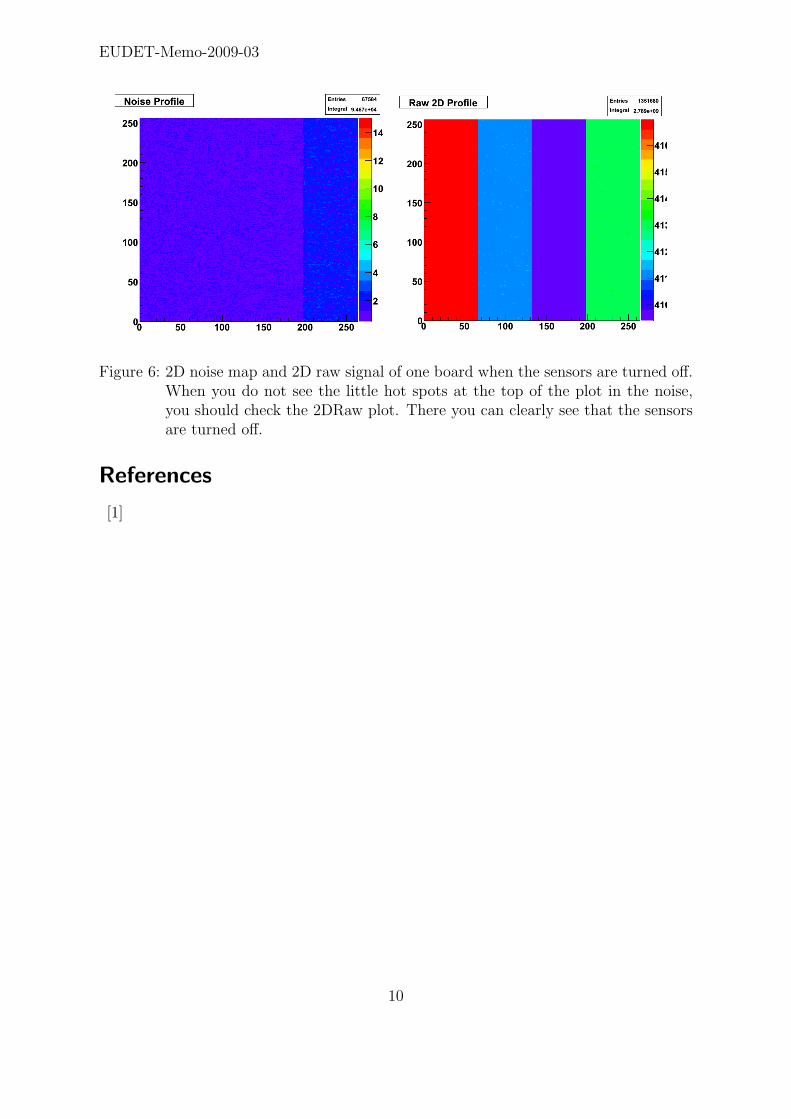
We had the situation, that due to a power cut, the sensors were turned off and this wasnot noticed by the users. Data taking is rather difficult without sensors. In Figure 6,left-hand side, the 2D noise for an example sensor while being turned off is shown.The little hot spots on the top of the arrays are not visible and the noise is in generalextremely low. The final proof that the sensors are turned off can be seen in Figure 6on the right side. Here the RAW values show clearly that no signal is arriving at theADC board.
5.2.1 Beam Data
As soon you take data with the beam on, you should check if really everything is ok.The quickest way to see that this is the case is the correlation plots. For this select”X Cluster correlations” in the Root Monitor. In Figure 7 the X Cluster Correlationplots for board 0 to 1 and board 2 to 3 are shown. The line indicates the correlationbetween the hits in X of the first board versus the hits in x on the second board. In theright plot the line is flipped as this is the correlation between the two sensor boxes. Theorientation of the sensors are rotated between boxes
Acknowledgement
This work is supported by the Commission of the European Communities under the 6th
Framework Programme ”Structuring the European Research Area”, contract numberRII3-026126.
9
EUDET-Memo-2009-03
Figure 6: 2D noise map and 2D raw signal of one board when the sensors are turned off.When you do not see the little hot spots at the top of the plot in the noise,you should check the 2DRaw plot. There you can clearly see that the sensorsare turned off.
References
[1]
10

EUDET-Memo-2009-03
Figure 7: X Cluster Correlation plots for board 0 to 1 and board 2 to 3. The lineindicates the correlation between the hits in X of the first board versus thehits in x on the second board. In the right plot the line is flipped as this is thecorrelation between the two sensor boxes. The orientation of the sensors arerotated between boxes.
11