eugene city council agenda - amazon web …€¦ · eugene city council agenda . march 13, ......
TRANSCRIPT
EUGENE CITY COUNCIL AGENDA March 13, 2017 5:30 p.m. CITY COUNCIL WORK SESSION Harris Hall 125 East 8th Avenue Eugene, Oregon 97401
Meeting of March 13, 2017; Her Honor Mayor Lucy Vinis Presiding
Councilors Alan Zelenka, President Mike Clark, Vice President George Poling Greg Evans Emily Semple Chris Pryor Claire Syrett Betty Taylor 5:30 p.m. CITY COUNCIL WORK SESSION Harris Hall, 125 East 8th Avenue
A. Committee Reports and Items of Interest from Mayor, City Council, and City Manager
B. WORK SESSION:
Review of 2016 Implementation of Bond Measure to Fix Streets and 2017 Pavement Management Report
C. WORK SESSION: Commercial Setback Code Requirements for Downtown
The Eugene City Council welcomes your interest in these agenda items. This meeting location is wheelchair-accessible. For the hearing impaired, an interpreter can be provided with 48 hours' notice prior to the meeting. Spanish-language interpretation will also be provided with 48 hours' notice. To arrange for these services, contact the receptionist at 541-682-5010. City Council meetings are telecast live on Metro Television, Comcast channel 21, and rebroadcast later in the week.
El consejo de la Ciudad de Eugene agradece su interés en estos asuntos de la agenda. El lugar de la reunión tiene acceso para sillas de ruedas. Se puede proveer a un intérprete para las personas con discapacidad auditiva si avisa con 48 horas de anticipación. También se puede proveer interpretación para español si avisa con 48 horas de anticipación. Para reservar estos servicios llame al 541-682-5010. Las reuniones del consejo de la ciudad se transmiten en vivo por Metro Television, Canal 21 de Comcast y son retransmitidas durante la semana.
For more information, contact the Council Coordinator at 541-682-5010,
or visit us online at www.eugene-or.gov.
EUGENE CITY COUNCIL AGENDA ITEM SUMMARY
Work Session: Review of 2016 Implementation of Bond Measure to Fix Streets and 2017 Pavement Management Report
Meeting Date: March 13, 2017 Agenda Item Number: B Department: Public Works Staff Contact: Mark Schoening www.eugene-or.gov Contact Telephone Number: 541-682-5243 ISSUE STATEMENT This work session is an opportunity for the Eugene City Council to review the implementation of Measure 20-197, the 2012 bond measure to fix streets. To facilitate this review, two documents were prepared: the Citizen Street Repair Review Panel 2016 Report, and the independent accountant’s report by Isler CPA. These reports are provided as informational items in compliance with the City Council resolution placing the bond measure on the ballot. This work session will also review the 2017 Pavement Management Report. BACKGROUND Council Action History Following considerable study and discussion, including forming a Council Committee on Transportation Funding and convening an ad hoc citizen Street Maintenance Task Force, Council on July 28, 2008, approved Resolution 4953, calling a city election on a measure authorizing the issuance of $35.9 million of general obligation bonds to fund street preservation projects. Eugene voters on November 4, 2008, approved Measure 20-145, the 2008 bond measure to fix streets. Beginning in April 2010 and continuing through February 2014, Council received annual reports from the Street Repair Review Panel (SRRP) and the independent accountant regarding implementation of the 2008 bond measure. On July 9, 2012, Council approved Resolution 5063, calling a city election on a measure authorizing the issuance of $43 million of general obligation bonds to fund street preservation projects, and bicycle and pedestrian projects. In November 2012, Eugene voters overwhelmingly approved Measure 20-197 that continues the City’s road repair program for another five years. The new bond measure promises to fix 76 more streets and provide an average of $516,000 per year for bicycle and pedestrian projects. The bond measure took effect in 2014 and continues the bond-funded pavement preservation program that was first approved by local voters in 2008. The 2012 bond measure to fix streets continued the requirements related to accountability. The City Council resolution and the information provided to voters specified:
• In order to promote accountability in the use of bond proceeds, the City Manager will contract with an outside auditor to prepare an annual written report on the use of the bond proceeds. The auditor will ascertain and report on whether the bond proceeds were used
for the authorized purposes and in compliance with the restrictions set forth above. The City Manager will provide the report to the Council and make the report publicly available. (Resolution 5063, Section H)
• To further promote accountability and citizen involvement in street preservation projects,
the City Manager will convene the citizen street repair review panel. The citizen street repair review panel will prepare an annual report, separate and distinct from the report prepared by the outside auditor, documenting the City’s use of the bond proceeds and noting whether the bond proceeds were used in compliance with the terms of this Resolution. The City Manager will provide the SRRP’s report to the Council and make the report publicly available. (Resolution 5063, Section I)
Street Repair Review Panel In October 2009, a citizen group was initially formed to review the implementation of the 2008 road bond measure and report whether the bond funds were used in compliance with the council resolution. The citizen member Street Repair Review Panel (SRRP), including four founding members, reconvened in December 2016 to review the ongoing implementation of Measure 20-197. The 13 community members serving on the 2016 SRRP were: John Barofsky, Janet Calvert, Allison Camp, Mel Damewood, Paul Holbo, Jim Mender, Dave Perez, John Quilter, Matt Roberts, Dan Rodriguez, Ollie Snowden (chair), Gary Wildish, and Sue Wolling. During the past year, the committee met three times over a three-month period in preparation of the report, which included a physical inspection of the projects completed in 2016. The Street Repair Review Panel in February unanimously approved its annual report (Attachment A), focusing on the third year of implementing the 2012 bond measure to fix streets, which included the following conclusion:
Based on this limited review and all materials presented to us, we unanimously conclude that the bond proceeds were used for the authorized purposes and in compliance with the limitations and restrictions outlined in Council Resolution 5063.
The 2016 SRRP report recognized the progress made on fixing Eugene’s streets. The projects funded in 2016 resulted in the reconstruction or resurfacing of 15 streets totaling more than 14.2 lane miles. The 2012 bond also allocated funding for bicycle and pedestrian projects guided by the Pedestrian and Bicycle Master Plan, City staff and the Active Transportation Committee (formally known as the Bicycle and Pedestrian Advisory Committee). In 2016, significant safety improvements for people who walk and bike included the installation of sidewalk ramps, additional pedestrian crossing beacons, increased buffer zones and new shared lane markings. The report from the SRRP highlighted the City’s sustainability achievements. Eugene was recognized for its use of recycled asphalt pavement, reducing the mining and production of virgin rock and asphalt materials. The continued use of warm mix asphalt also saves on energy and emissions (as detailed in the attached report), and offers an excellent example of the department’s commitment to sustainability efforts, especially following the approval of the Climate Recovery Ordinance. In addition to helping achieve sustainability goals, the bond measure projects are designed to improve safety and result in complete streets that are safe for people of all ages and abilities,
balance the needs of different modes, and support local land uses, economies, cultures, and natural environments. This ties into Council’s strategy of “Vision Zero,” a resolution which calls for eliminating traffic-related deaths or serious injuries on city streets. The improvements funded through the bond enhance safety for all road users, including those who drive, walk or bike. A web site tracking the bond measure implementation has been established at www.eugene-or.gov/gobonds. The panel’s 2016 report has been placed on the internet, and links to the online report will be included in the weekly community bulletin and provided to other community and business organizations. Independent Accountant’s Report The accounting firm of Isler CPA, who also performed the annual audit of the city’s FY16 financial statements, was contracted to perform sufficient agreed-upon procedures in order to determine whether the expenditure of general obligation bonds were made in accordance with the purposes and limitations outlined in the street repair bond resolution – namely, that expenditures were:
1. used only for costs related to street preservation projects, bicycle and pedestrian projects and payment of bond issuance costs, and not to expand the motor capacity of the street system; and also,
2. limited to projects included in Exhibit A to the resolution, unless upon completion of all of
the projects listed in Exhibit A, the Council adds other street preservation projects to the list in order to utilize unspent bond proceeds.
The accountant’s procedures were performed for expenditures incurred from January 1, 2016, through December 31, 2016, and were conducted in accordance with attestation standards established by the American Institute of Certified Public Accountants. The independent accountant expenditure testing concluded:
All tested expenditures were recorded in the proper account, fund and period and were spent on street projects included in Exhibit A of City Council Resolution No. 5063 or other street preservation projects approved by City Council, as permitted under Resolution 5063. No exceptions were noted.
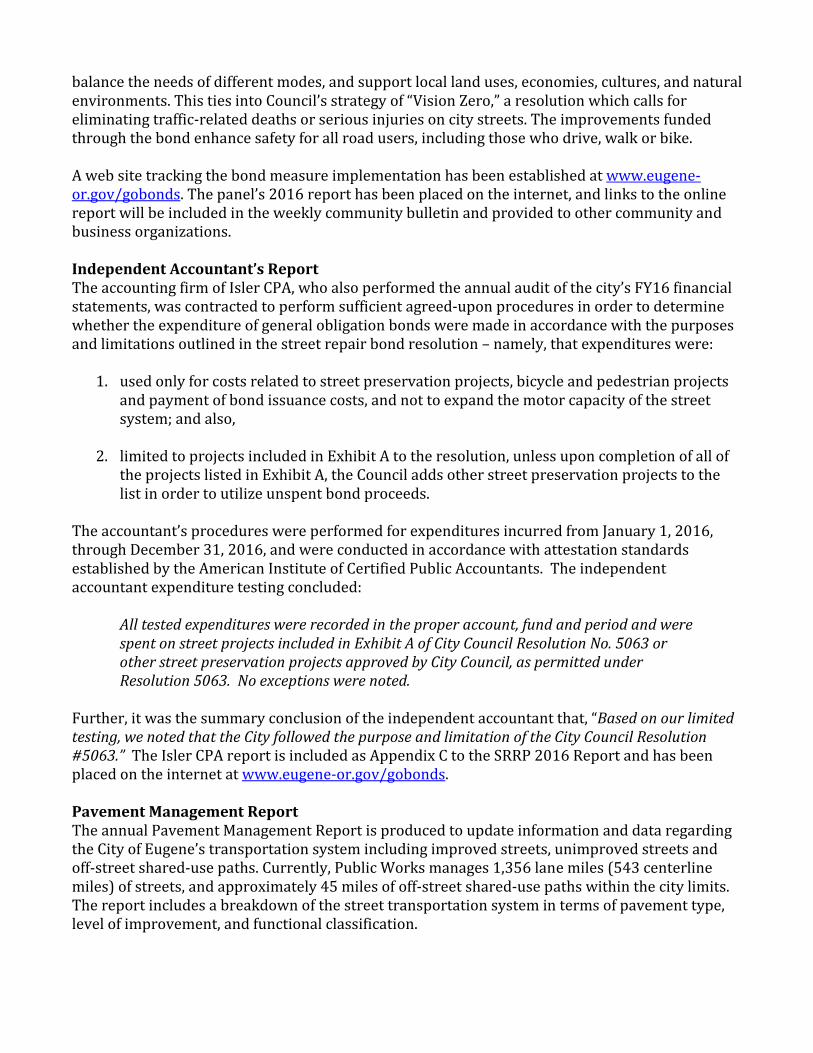
Further, it was the summary conclusion of the independent accountant that, “Based on our limited testing, we noted that the City followed the purpose and limitation of the City Council Resolution #5063.” The Isler CPA report is included as Appendix C to the SRRP 2016 Report and has been placed on the internet at www.eugene-or.gov/gobonds. Pavement Management Report The annual Pavement Management Report is produced to update information and data regarding the City of Eugene’s transportation system including improved streets, unimproved streets and off-street shared-use paths. Currently, Public Works manages 1,356 lane miles (543 centerline miles) of streets, and approximately 45 miles of off-street shared-use paths within the city limits. The report includes a breakdown of the street transportation system in terms of pavement type, level of improvement, and functional classification.
The 2017 Pavement Management Report (Attachment B) reviews current treatment programs and costs and projects future treatment needs using 2016 rating and inventory data. The 2017 Pavement Management Report shows progress has been made on the condition of Eugene’s Arterial and Collector streets, but more work is needed to reduce the backlog of needed repairs of the complete street system. Based on the 2015 ratings and reported in the 2016 report, the calculated backlog of repairs on improved asphalt streets was $79 million. As of the end of 2016, the current backlog has been calculated to be $92 million. The increase is largely due to rising construction costs that are projected to continue. In addition, even with the 2012 bond measure the pavement preservation program is not sufficiently funded to address the pavement preservation backlog. A significant component of the backlog is the declining condition of residential streets. Annually, a number of residential streets are falling into a more costly treatment category due to lack of funding to repair them. Both the 2008 and the 2012 bond measures primarily focused on the City’s arterial and collector street system. The report also details how the pavement management system is used to inspect and rate pavement surfaces, explains Eugene’s pavement preservation program, and includes updated information about treatment types and costs. Electronic copies of the 2017 Pavement Management Report are available at www.eugene-or.gov/DocumentCenter/View/31068. RELATED CITY POLICIES The City Council continues to support initiatives to adequately fund the transportation system for people who drive, walk, and ride bicycles, including maintenance and preservation and capital reconstruction. COUNCIL OPTIONS This work session is informational; no action is requested. CITY MANAGER’S RECOMMENDATION This work session is informational; no action is requested. SUGGESTED MOTION This work session is informational; no motion is requested. ATTACHMENTS A. Citizen Street Repair Review Panel 2016 Report, including Auditor’s Report B. 2017 Pavement Management Report FOR MORE INFORMATION Staff Contact: Mark Schoening, City Engineer Telephone: 541-682-5243 Staff E-Mail: [email protected]
Citizen Street Repair Review Panel 2016 Report
Implementation Update for Measure 20-197 Bonds to Fix Streets
Attachment A
Memorandum
Date: February 8, 2017
To: Jon Ruiz, City Manager
From: Street Repair Review Panel
Subject: 2016 Report of the Street Repair Review Panel
It is our pleasure to present the 2016 annual report of the Street Repair Review Panel, focusing on the third year of implementing the 2012 bond measure to fix streets. This panel initially was formed in 2009 to review the implementation of the 2008 street repair bond. This report was written in response to the accountability provisions in Measure 20-197, the 2012 bond measure to fix streets.
The 13-member panel met three times over a three-month period in preparation of this report, which included a physical inspection of the projects completed in 2016. We reviewed and accepted the report prepared by the City’s external auditor (Appendix D) with respect to the City’s use of the bond proceeds through December 31, 2016.
Based on this limited review and all materials presented to us, we unanimously conclude that the bond proceeds were used for the authorized purposes and in compliance with the limitations and restrictions outlined in Council Resolution 5063. We are also providing a detailed report, prepared at our request and with our approval, from the Public Works staff on the bond projects constructed in 2016.
Highlights from our review of the 2016 street bond projects include the following:
Progress – The projects funded in 2016 by the 2012 voter-approved bond measure resulted in thereconstruction or resurfacing of 15 streets and totaled more than 14.2 lane miles. The backlog of streetrepair projects in 2016 increased to $92 million, primarily due to increasing construction costs over thelast five years. However, as noted in previous reports, the 2007 Pavement Management Reportprojected the anticipated backlog for rehabilitation needs would reach more than $282 million in 2016 ifsteps were not taken to reduce the backlog. That’s a difference of nearly $200 million. In terms of miles,since the implementation of the 2008 bond, more than 130 lane miles of street work has been completedusing bond funds. After accounting for the 14.2 lane miles treated in 2016, just over 436 lane miles ofthe total 1,247 lane miles that make up the improved street system are in need of some level oftreatment at this time. The 2012 measure also allocated funding for bicycle and pedestrian projectsguided by the Pedestrian and Bicycle Master Plan, City staff and the Bicycle and Pedestrian AdvisoryCommittee. In 2016, significant safety improvements for people who walk and bike continued, includingthe installation of sidewalk ramps and pedestrian crossing beacons, increased buffer zones for bicyclelanes, and new shared lane markings.
Acknowledging Variability in Funding Forecasts – Preliminary estimates indicate the City came inunder budget on the 2016 projects, but forecasting future costs remains a challenge. One challenge isthat estimates are based on surface observations while the actual treatment is determined by rigorousproject-specific scientific testing. For the 2016 projects, as shown in Appendix A, the actual costs were$2,083,000 less than programmed—but the actual costs could just as easily have been greater thanprogrammed depending on more significant repairs being needed than originally anticipated, as well asvariability and trends impacting local and macro-economic conditions. We will let you know if weperceive any significant trends developing as the bond measure continues to be implemented. Thepedestrian and bicycle improvement costs for the first three years continues to exceed the expectedannual average of $516,000, but it’s our understanding that staff intentionally “front loaded” the cost of
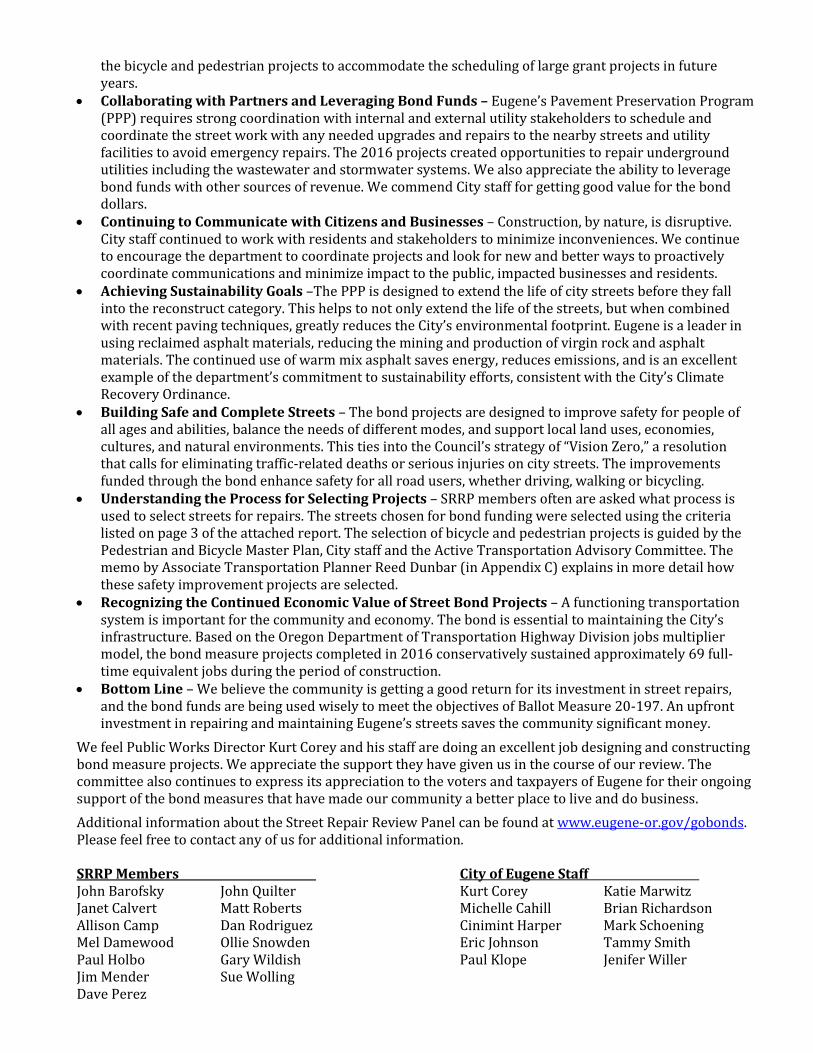
the bicycle and pedestrian projects to accommodate the scheduling of large grant projects in future years.
Collaborating with Partners and Leveraging Bond Funds – Eugene’s Pavement Preservation Program(PPP) requires strong coordination with internal and external utility stakeholders to schedule andcoordinate the street work with any needed upgrades and repairs to the nearby streets and utilityfacilities to avoid emergency repairs. The 2016 projects created opportunities to repair undergroundutilities including the wastewater and stormwater systems. We also appreciate the ability to leveragebond funds with other sources of revenue. We commend City staff for getting good value for the bonddollars.
Continuing to Communicate with Citizens and Businesses – Construction, by nature, is disruptive.City staff continued to work with residents and stakeholders to minimize inconveniences. We continueto encourage the department to coordinate projects and look for new and better ways to proactivelycoordinate communications and minimize impact to the public, impacted businesses and residents.
Achieving Sustainability Goals –The PPP is designed to extend the life of city streets before they fallinto the reconstruct category. This helps to not only extend the life of the streets, but when combinedwith recent paving techniques, greatly reduces the City’s environmental footprint. Eugene is a leader inusing reclaimed asphalt materials, reducing the mining and production of virgin rock and asphaltmaterials. The continued use of warm mix asphalt saves energy, reduces emissions, and is an excellentexample of the department’s commitment to sustainability efforts, consistent with the City’s ClimateRecovery Ordinance.
Building Safe and Complete Streets – The bond projects are designed to improve safety for people ofall ages and abilities, balance the needs of different modes, and support local land uses, economies,cultures, and natural environments. This ties into the Council’s strategy of “Vision Zero,” a resolutionthat calls for eliminating traffic-related deaths or serious injuries on city streets. The improvementsfunded through the bond enhance safety for all road users, whether driving, walking or bicycling.
Understanding the Process for Selecting Projects – SRRP members often are asked what process isused to select streets for repairs. The streets chosen for bond funding were selected using the criterialisted on page 3 of the attached report. The selection of bicycle and pedestrian projects is guided by thePedestrian and Bicycle Master Plan, City staff and the Active Transportation Advisory Committee. Thememo by Associate Transportation Planner Reed Dunbar (in Appendix C) explains in more detail howthese safety improvement projects are selected.
Recognizing the Continued Economic Value of Street Bond Projects – A functioning transportationsystem is important for the community and economy. The bond is essential to maintaining the City’sinfrastructure. Based on the Oregon Department of Transportation Highway Division jobs multipliermodel, the bond measure projects completed in 2016 conservatively sustained approximately 69 full-time equivalent jobs during the period of construction.
Bottom Line – We believe the community is getting a good return for its investment in street repairs,and the bond funds are being used wisely to meet the objectives of Ballot Measure 20-197. An upfrontinvestment in repairing and maintaining Eugene’s streets saves the community significant money.
We feel Public Works Director Kurt Corey and his staff are doing an excellent job designing and constructing bond measure projects. We appreciate the support they have given us in the course of our review. The committee also continues to express its appreciation to the voters and taxpayers of Eugene for their ongoing support of the bond measures that have made our community a better place to live and do business.
Additional information about the Street Repair Review Panel can be found at www.eugene-or.gov/gobonds. Please feel free to contact any of us for additional information.
SRRP Members City of Eugene Staff John Barofsky John Quilter Kurt Corey Katie Marwitz Janet Calvert Matt Roberts Michelle Cahill Brian Richardson Allison Camp Dan Rodriguez Cinimint Harper Mark Schoening Mel Damewood Ollie Snowden Eric Johnson Tammy Smith Paul Holbo Gary Wildish Paul Klope Jenifer Willer Jim Mender Sue Wolling Dave Perez
2016 Report to the SRRP Page i
2016 Report to the Citizen Street Repair Review Panel
TABLE OF CONTENTS
INTRODUCTION ............................................................................................................. 1
CRITERIA FOR PROJECT SELECTION AND SCHEDULING ...................................... 3
FUNDING STATUS AND FORECAST ........................................................................... 7
5TH AVENUE, 6TH AVENUE, 7TH AVENUE, AND COMMERCIAL STREET ................... 9
FAIRFIELD AVENUE AND JACOBS DRIVE ............................................................... 10
8TH AVENUE, LINCOLN STREET, AND WASHINGTON STREET .............................. 11
27TH AVE, CAPITAL DR, POTTER ST, SPRING BLVD, AND VAN NESS ST ............ 12
CENTENNIAL LOOP .................................................................................................... 13
WILLAMETTE STREET ................................................................................................ 14
2016 PEDESTRIAN AND BICYCLE IMPROVEMENT PROJECTS ............................. 15
APPENDIX A (BOND PROJECT COSTS AND FORECAST, BY YEAR) .................... 16
APPENDIX B (MAP OF BOND PROJECTS, BY NUMBER) ........................................ 18
APPENDIX C (PROJECTS FOR PEOPLE WHO WALK AND BIKE) .......................... 21
APPENDIX D (REPORT OF THE INDEPENDENT AUDITOR) .................................... 26
Photos on cover from 2016 projects: Completed paving on 27th Avenue (left); Sign Installation on River Road (upper right); Completed paving on Spring Blvd (lower right)
2016 Report to the SRRP Page 1
INTRODUCTION
BACKGROUND
This report has been compiled for use by the Street Repair Review Panel (SRRP). It is intended to provide background on projects included in the 2012 voter-approved Bond Measure 20-197, the schedule for construction of these projects, and the details of bond projects constructed in 2016. The street repair measure approved $43 million in bonding authority over a five-year period, with construction of bond-funded projects starting in 2014 and completing in 2018.
KEY TERMS
Bond - Bond Measure 20-197, Bonds to Fix Streets, approved by Eugene voters in November 2012.
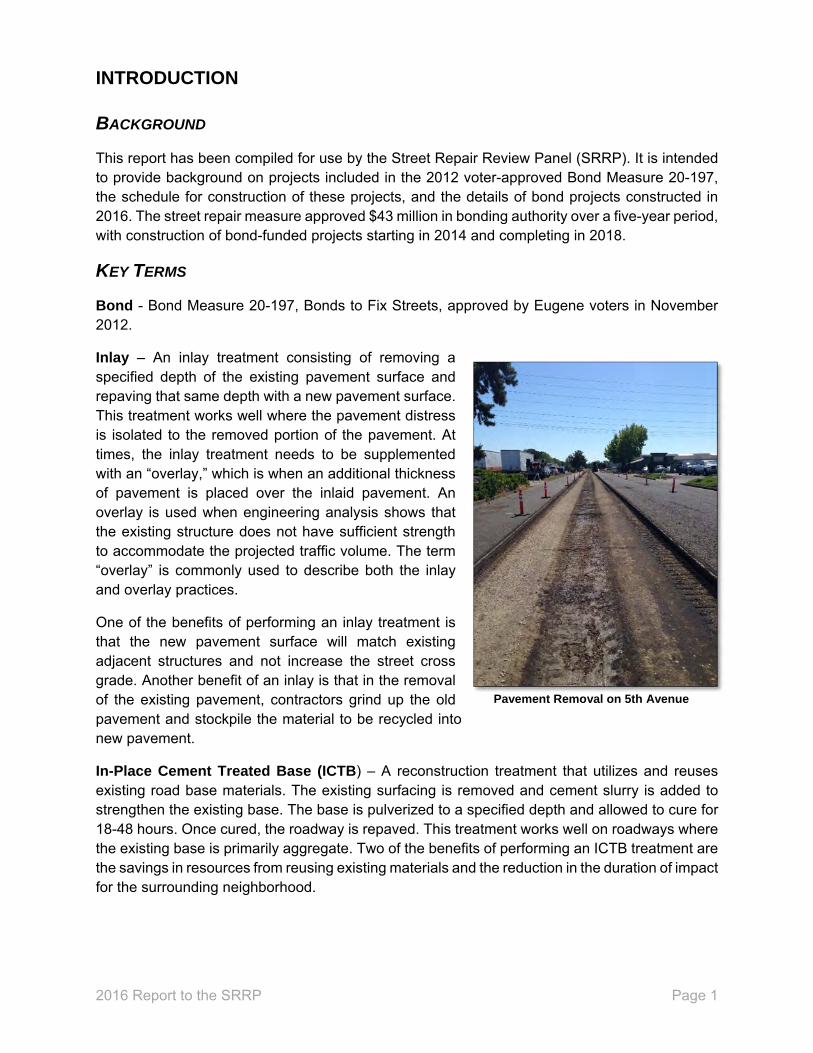
Inlay – An inlay treatment consisting of removing a specified depth of the existing pavement surface and repaving that same depth with a new pavement surface. This treatment works well where the pavement distress is isolated to the removed portion of the pavement. At times, the inlay treatment needs to be supplemented with an “overlay,” which is when an additional thickness of pavement is placed over the inlaid pavement. An overlay is used when engineering analysis shows that the existing structure does not have sufficient strength to accommodate the projected traffic volume. The term “overlay” is commonly used to describe both the inlay and overlay practices.
One of the benefits of performing an inlay treatment is that the new pavement surface will match existing adjacent structures and not increase the street cross grade. Another benefit of an inlay is that in the removal of the existing pavement, contractors grind up the old pavement and stockpile the material to be recycled into new pavement.
In-Place Cement Treated Base (ICTB) – A reconstruction treatment that utilizes and reuses existing road base materials. The existing surfacing is removed and cement slurry is added to strengthen the existing base. The base is pulverized to a specified depth and allowed to cure for 18-48 hours. Once cured, the roadway is repaved. This treatment works well on roadways wherethe existing base is primarily aggregate. Two of the benefits of performing an ICTB treatment arethe savings in resources from reusing existing materials and the reduction in the duration of impactfor the surrounding neighborhood.
Pavement Removal on 5th Avenue
2016 Report to the SRRP Page 2
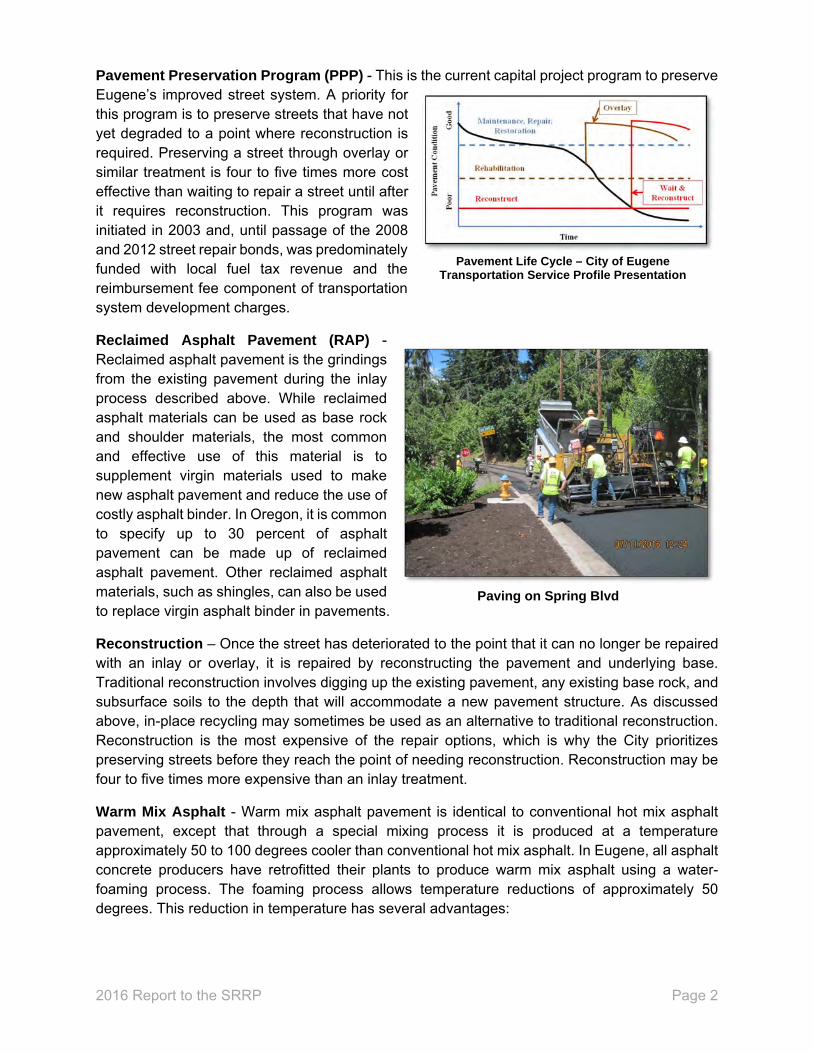
Pavement Preservation Program (PPP) - This is the current capital project program to preserve Eugene’s improved street system. A priority for this program is to preserve streets that have not yet degraded to a point where reconstruction is required. Preserving a street through overlay or similar treatment is four to five times more cost effective than waiting to repair a street until after it requires reconstruction. This program was initiated in 2003 and, until passage of the 2008 and 2012 street repair bonds, was predominately funded with local fuel tax revenue and the reimbursement fee component of transportation system development charges.
Reclaimed Asphalt Pavement (RAP) - Reclaimed asphalt pavement is the grindings from the existing pavement during the inlay process described above. While reclaimed asphalt materials can be used as base rock and shoulder materials, the most common and effective use of this material is to supplement virgin materials used to make new asphalt pavement and reduce the use of costly asphalt binder. In Oregon, it is common to specify up to 30 percent of asphalt pavement can be made up of reclaimed asphalt pavement. Other reclaimed asphalt materials, such as shingles, can also be used to replace virgin asphalt binder in pavements.
Reconstruction – Once the street has deteriorated to the point that it can no longer be repaired with an inlay or overlay, it is repaired by reconstructing the pavement and underlying base. Traditional reconstruction involves digging up the existing pavement, any existing base rock, and subsurface soils to the depth that will accommodate a new pavement structure. As discussed above, in-place recycling may sometimes be used as an alternative to traditional reconstruction. Reconstruction is the most expensive of the repair options, which is why the City prioritizes preserving streets before they reach the point of needing reconstruction. Reconstruction may be four to five times more expensive than an inlay treatment.
Warm Mix Asphalt - Warm mix asphalt pavement is identical to conventional hot mix asphalt pavement, except that through a special mixing process it is produced at a temperature approximately 50 to 100 degrees cooler than conventional hot mix asphalt. In Eugene, all asphalt concrete producers have retrofitted their plants to produce warm mix asphalt using a water-foaming process. The foaming process allows temperature reductions of approximately 50 degrees. This reduction in temperature has several advantages:
Paving on Spring Blvd
Pavement Life Cycle – City of EugeneTransportation Service Profile Presentation
2016 Report to the SRRP Page 3
1. It reduces energy consumption to produce asphalt concrete, lowering costs and greenhouse gas emissions.
2. It reduces off-gassing (smoke) of asphalt concrete by keeping the temperature under the boiling point of “light oils” in the liquid asphalt, benefiting construction workers and the public.
3. Because the light oils are not boiled off, the liquid asphalt coating the rock particles is slightly thicker, which slows the aging process of the asphalt.
4. It reduces the oxidation caused during high temperature production that causes premature aging of the asphalt, which should provide a longer life product.
The use of warm mix asphalt pavement is specified for all City of Eugene paving projects.
SRRP MISSION
Per Resolution No. 5063 the SRRP “will prepare an annual report, separate and distinct from the report prepared by the outside auditor, documenting the City’s use of the bond proceeds and noting whether the bond proceeds were used in compliance with the terms of this Resolution.”
CRITERIA FOR PROJECT SELECTION AND SCHEDULING
STREET PROJECTS
Street projects to be financed by the bond were specifically listed in the Bond (see Appendix A). All street projects were identified by the Public Works Maintenance Pavement Management System as priorities for repair. In addition, the following criteria were used to select streets for the bond measure:
1. Citizen input with respect to prioritizing major streets in need of reconstruction. 2. Scientific information about needed street rehabilitation and reconstruction from the
pavement management system. 3. Geographic distribution throughout the community to ensure all areas of the City receive
a benefit from the bond proceeds.
The City has a longstanding policy to use capital preservation funds on the improved street system. An improved street has been designed for the type of soils and traffic use of the street and includes a storm drainage system. Curb and gutter is the traditional mark of a storm drainage system, but can include roadside swales and planters. The bond measure street list consisted of improved streets in need of preservation as identified in the pavement management system.
The list of the street bond projects, with their estimated repair cost from the Pavement Management System and the year constructed or planned year of construction, is included in Appendix A of this report. In scheduling the street repair projects, the priorities were preserving streets prior to their needing reconstruction, grouping projects by location for cost savings, and coordinating with utility work. The list includes a comparison of programmed costs to actual costs with any difference noted. Differences in total project costs on individual projects may affect the funding available for future projects.
2016 Report to the SRRP Page 4
BICYCLE AND PEDESTRIAN IMPROVEMENT PROJECTS
The 2012 bond measure stated that the City will allocate an annual average of $516,000 to support bicycle and pedestrian projects. These projects were not named in the bond measure; rather, the selection of the projects would be guided by the Pedestrian and Bicycle Master Plan, City staff and the Bicycle and Pedestrian Advisory Committee. In 2016, the practice continued to add pedestrian and bicycle improvements to several paving projects and to complete a stand-alone project. These improvements are further described in the project details, below, and included in Appendix C of this report. COMPLETE STREETS AND USE OF OTHER FUNDS IN CONJUNCTION WITH STREET
BOND FUNDS
The use of street-repair bond funds is limited to the overlay or reconstruction of the driving surface of streets as well as to preserve existing integral elements of the street such as curbs, gutters, sidewalks, on-street bike lanes, traffic signals, street lights, medians, traffic calming devices, and other integral parts of a street preservation project. In addition, the City will allocate an annual average of $516,000 of the bond proceeds over a period of five years to fund bicycle and pedestrian projects. (Resolution 5063, Section D).
However, there is often a need or an opportunity to complete additional work as part of the construction contracts for street preservation. The additional work may be funded by wastewater and stormwater utility funds, local gas taxes, transportation system development charges, or state and federal grants.
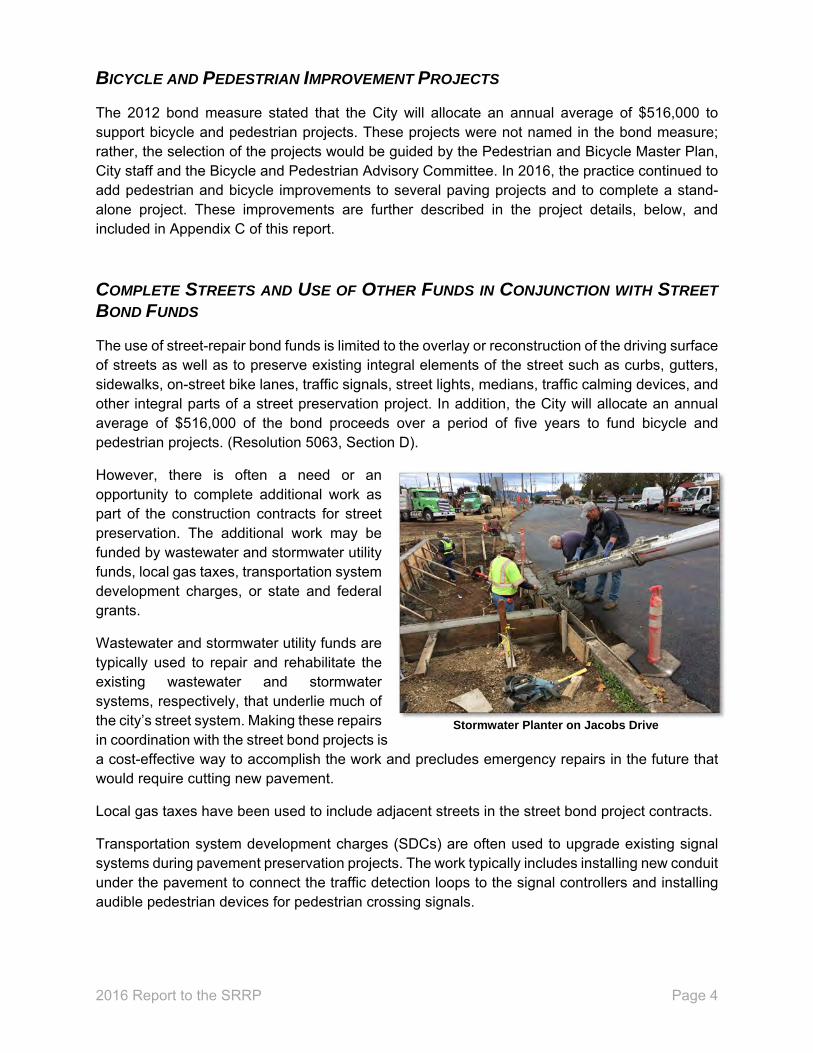
Wastewater and stormwater utility funds are typically used to repair and rehabilitate the existing wastewater and stormwater systems, respectively, that underlie much of the city’s street system. Making these repairs in coordination with the street bond projects is a cost-effective way to accomplish the work and precludes emergency repairs in the future that would require cutting new pavement.
Local gas taxes have been used to include adjacent streets in the street bond project contracts.
Transportation system development charges (SDCs) are often used to upgrade existing signal systems during pavement preservation projects. The work typically includes installing new conduit under the pavement to connect the traffic detection loops to the signal controllers and installing audible pedestrian devices for pedestrian crossing signals.
Stormwater Planter on Jacobs Drive
2016 Report to the SRRP Page 5
Vision Zero
In November of 2015, the Eugene City Council joined a growing number of cities around the country in adopting a Vision Zero Resolution that states “no loss of life or serious injury on our transportation system is acceptable.” Vision Zero is a data-driven approach to educate the community and enable the City to prioritize resources based on evidence of the greatest need and impact.
The City regularly combines Vision Zero principles with ongoing pavement preservation projects. Cost effective intersection enhancements such as countdown pedestrian signals and audible pedestrian signals will continue to be a priority and standard practice on future projects. Enhanced pedestrian crossings have been implemented on a number of recent projects including 13th Avenue, Blair Blvd, and 30th Ave and University Street. In the next two years the City is undertaking large-scale corridor wide improvements on the Amazon corridor. The City is partnering Bond funds with Federal funds to improve the corridor by adding a cycle track and enhanced pedestrian crossings. ODOT has shown that the inclusion of these types of enhancements can significantly reduce fatal and serious injury crashes.
ADA Transition Plan
As part of Title II of the Americans with Disabilities Act (ADA) of 1990, the City of Eugene conducted an evaluation of its public rights-of-way, and developed a transition plan that outlines in detail how the organization will ensure safe access to all of its facilities for all individuals. Public Works collected detailed data on over 15,000 ramps and 250 pedestrian signals to develop transition schedules specific to these facilities. The Public Works Director approved the ADA Transition Plan for the Public Rights-of-Way was approved by Administrative Order in July 2015. All capital rehabilitation projects are evaluated for access compliance and potential improvements during scoping and preliminary design.
238 sidewalk ramps were upgraded as part of 2016 capital paving projects.
Sustainability and Gains through Technical Developments
In 2010, Eugene created the Community Climate and Energy Action Plan (CEAP), joining a growing list of forward-thinking cities around the world that are addressing climate change and energy challenges by planning with vision and creativity. The Climate Recovery Ordinance (CRO), adopted in 2014 and updated in 2016, is our community’s next step toward fulfilling these efforts. The 2016 update established the goal of reducing the 2010 levels of community fossil fuel use by 50 percent by the year 2030. Eugene is on a path to reach this goal.
The City of Eugene continually strives to improve the quality, environmental footprint, and cost efficiency of its projects. In 2016, Eugene continued to use warm mix asphalt pavement and increased use of reclaimed binder to meet these sustainability criteria.
2016 Report to the SRRP Page 6
Warm mix asphalt continued to be specified for all the paving projects in 2016 in place of conventional hot mix asphalt; approximately 35,000 tons of warm mix asphalt pavement was placed on capital paving projects in 2016. As explained in the Key Terms section of this report, warm mix asphalt provides environmental and human health benefits as well as a potentially longer lasting product. The National Cooperative Highway Research Program (NCHRP) estimates that there is a CO2 savings of 12 pounds per ton of pavement when using warm mix as compared to hot mix asphalt. The NCHRP also estimates that the use of warm mix asphalt reduces the energy used in the asphalt batch plant by about 30% compared to hot mix asphalt.
Reclaimed asphalt pavement (RAP) has been used in Eugene for more than 20 years. Like the State of Oregon, Eugene’s current standard specification allows up to 30 percent RAP, by weight, to be used in new asphalt pavement mixes. For several years, local asphalt producers have supplied mixes that maximize the allowed RAP content.
Increasing the amount of reclaimed asphalt binder in pavement mixes potentially impacts the quality and longevity of the asphalt pavement, so increasing the allowed reclaimed asphalt binder in mixes needs to be done with consideration as RAP contents greater than 20 to 30 percent is an emerging technology without much research conducted on long-term impacts to the pavement quality. Nationally, multiple organizations are experimenting with increasing the reclaimed asphalt binder content, and Eugene provided pavement samples for research to the Asphalt Pavement Association of Oregon in 2013.
In Eugene, typical RAP materials result in a one-to-one replacement of the virgin asphalt cement needed for a typical Level 2, ½” dense graded asphalt pavement used on residential and collector streets in Eugene. Since the asphalt cement generally makes up about a quarter of the cost of asphalt pavement, reducing the amount of virgin asphalt cement used has the potential to decrease materials costs as well as conserving virgin resources.
Based on positive test results on pilot projects constructed in 2013 to increase RAP usage, Eugene continued to select projects to increase the reclaimed binder in asphalt pavements. In 2016, the City specified 40 percent binder replacement through the use of reclaimed asphalt materials on Centennial Loop as well as 35 percent binder replacement on several other Bond funded and Local Gas Tax funded roadways. The specification allows flexibility for the contractors to meet the 35 and 40 percent binder replacement value using RAP or a combination of RAP and reclaimed asphalt shingles (RAS) depending on the availability of materials and capabilities of the plant.
By its nature, reclaimed asphalt binders are stiffer and pavements that contain higher contents of reclaimed asphalt binders are more susceptible to cracking. To compensate for this potential, the grade of virgin asphalt binder typically used for Eugene paving with higher than 30 percent binder replacement was replaced with a “softer” binder that should better resist cracking.
In the use of increased reclaimed binder content, Eugene is on the forefront of this technology and while we are being leaders, we are also proceeding with caution and choosing projects on a case-by-case basis. Typically, we are choosing streets with lower traffic volumes in order to minimize the chances of unintended consequences.
2016 Report to the SRRP Page 7
Nearly 12,000 tons of RAP was used on 2016 capital paving projects, reducing the need for nearly 690 tons of asphalt cement and 11,000 tons of aggregate to be mined, refined, processed and subsequently shipped to the pavement producers. Using warm mix asphalt with typical reclaimed asphalt pavement content resulted in an estimated reduction of 911 MT CO2e compared to using hot-mix asphalt pavement with no reclaimed pavement on 2016 capital paving projects.
Funding Status and Forecast
In 2012, project costs were estimated for each street for the purpose of selecting streets to be included in the bond measure. These cost estimates were based on the overall surface condition of each street as described in the City’s Pavement Management System. A unit cost was assigned to each street based on whether the street rehabilitation treatment was assumed to be a reconstruct or an overlay. Approximately 18 months prior to construction, more detailed pavement testing is conducted to determine specific treatments to each street based on the existing pavement structure, subgrade soil conditions and traffic loading. Actual rehabilitation treatments may be different than the original assumptions, requiring more, less or a combination of rehabilitation techniques.
For the streets scheduled for 2016 construction, the 2012 estimated cost with inflation was $7,564,000. As of January 1, 2016, although not all project contracts have been closed out, the projected actual cost for the 2016 bond projects is $5,481,000; a net difference of $2,083,000 below the costs projected in 2012. Several of the 2016 projects that were originally scoped as reconstruct projects were completed with alternative rehab techniques that reduced overall project costs. We continue to see a steady increase in construction costs and we expect that trend to continue over the remaining two years of the Bond. Details on an annual project-by-project basis are provided in the following pages and summarized in Appendix A. As construction is completed each year, Appendix A will be updated and included in future reports to track the funding status of the overall bond funds.
The 2012 bond measure also allocated an average of $516,000 for pedestrian and bicycle improvements each year. In 2016, the project expenditures on all pedestrian and bicycle improvements funded by the bond are estimated at $810,000, which is $293,000 over the annual average allocation. Due to expenditures to date, $547,000 is available for the final two years to maintain the annual average allocation.
2016 Report to the SRRP Page 8
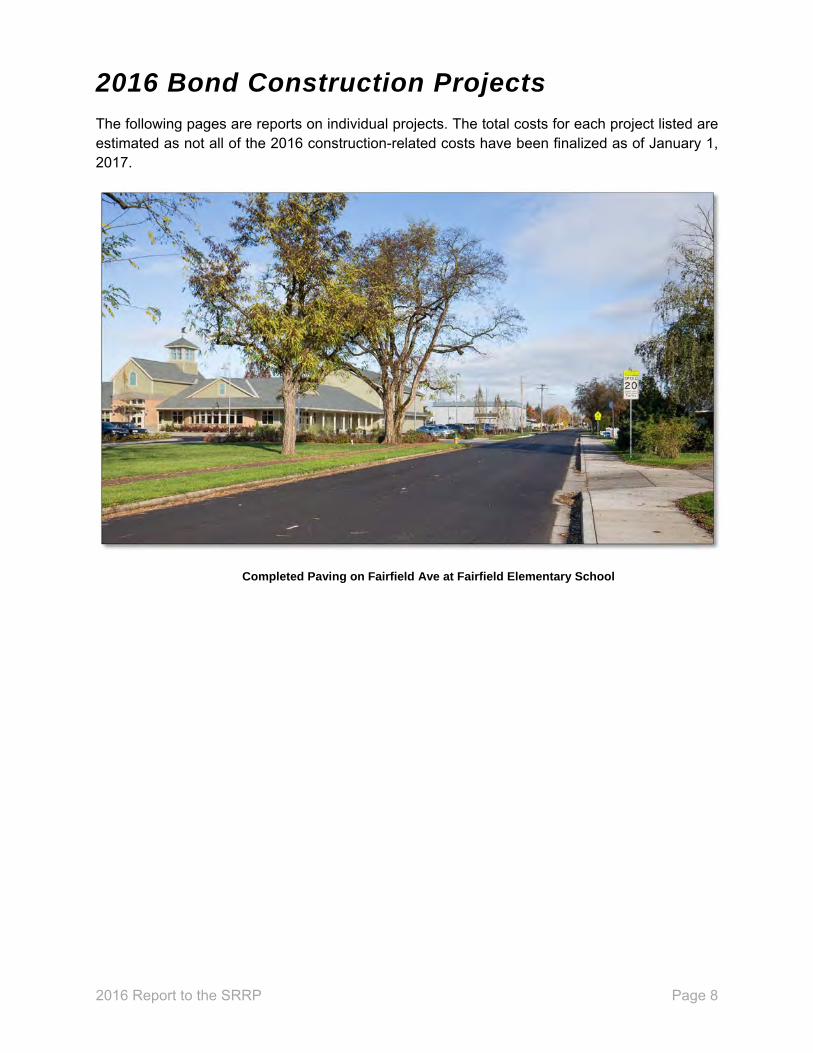
2016 Bond Construction Projects
The following pages are reports on individual projects. The total costs for each project listed are estimated as not all of the 2016 construction-related costs have been finalized as of January 1, 2017.
Completed Paving on Fairfield Ave at Fairfield Elementary School
2016 Report to the SRRP Page 9
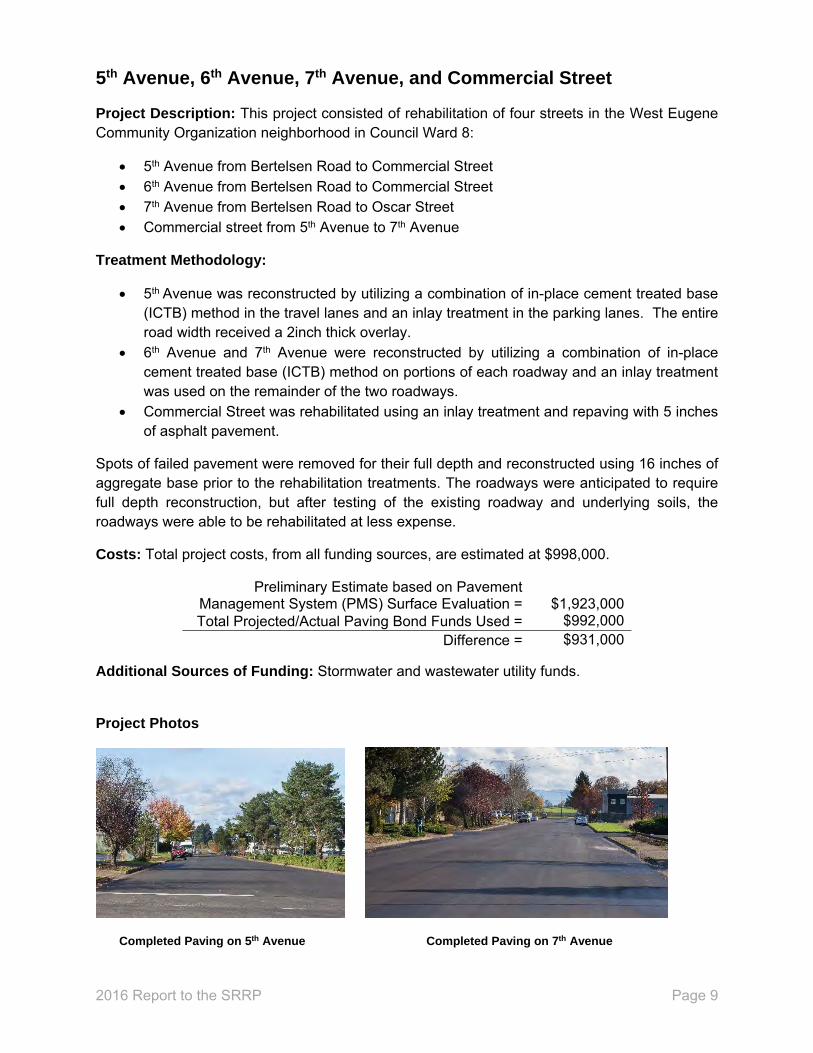
5th Avenue, 6th Avenue, 7th Avenue, and Commercial Street
Project Description: This project consisted of rehabilitation of four streets in the West Eugene Community Organization neighborhood in Council Ward 8:
5th Avenue from Bertelsen Road to Commercial Street 6th Avenue from Bertelsen Road to Commercial Street 7th Avenue from Bertelsen Road to Oscar Street Commercial street from 5th Avenue to 7th Avenue
Treatment Methodology:
5th Avenue was reconstructed by utilizing a combination of in-place cement treated base (ICTB) method in the travel lanes and an inlay treatment in the parking lanes. The entire road width received a 2inch thick overlay.
6th Avenue and 7th Avenue were reconstructed by utilizing a combination of in-place cement treated base (ICTB) method on portions of each roadway and an inlay treatment was used on the remainder of the two roadways.
Commercial Street was rehabilitated using an inlay treatment and repaving with 5 inches of asphalt pavement.
Spots of failed pavement were removed for their full depth and reconstructed using 16 inches of aggregate base prior to the rehabilitation treatments. The roadways were anticipated to require full depth reconstruction, but after testing of the existing roadway and underlying soils, the roadways were able to be rehabilitated at less expense.
Costs: Total project costs, from all funding sources, are estimated at $998,000.
Preliminary Estimate based on Pavement Management System (PMS) Surface Evaluation =
$1,923,000
Total Projected/Actual Paving Bond Funds Used = $992,000 Difference = $931,000
Additional Sources of Funding: Stormwater and wastewater utility funds.
Project Photos
Completed Paving on 5th Avenue Completed Paving on 7th Avenue
2016 Report to the SRRP Page 10
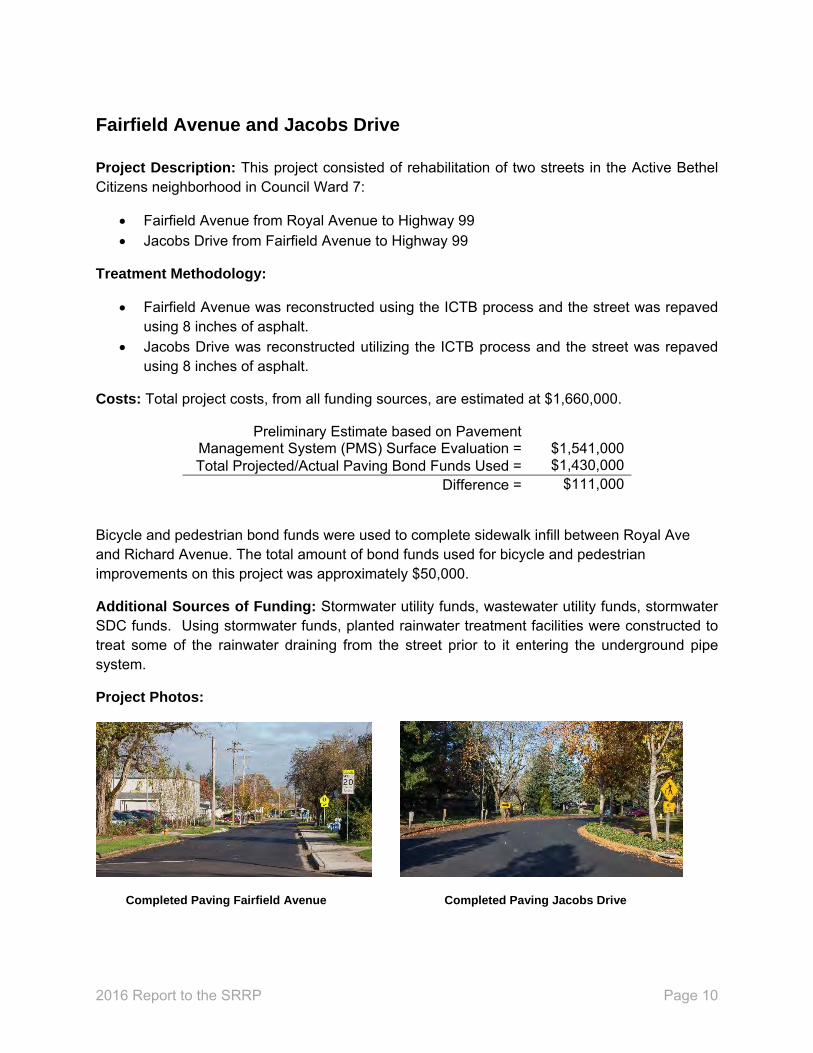
Fairfield Avenue and Jacobs Drive
Project Description: This project consisted of rehabilitation of two streets in the Active Bethel Citizens neighborhood in Council Ward 7:
Fairfield Avenue from Royal Avenue to Highway 99 Jacobs Drive from Fairfield Avenue to Highway 99
Treatment Methodology:
Fairfield Avenue was reconstructed using the ICTB process and the street was repaved using 8 inches of asphalt.
Jacobs Drive was reconstructed utilizing the ICTB process and the street was repaved using 8 inches of asphalt.
Costs: Total project costs, from all funding sources, are estimated at $1,660,000.
Preliminary Estimate based on Pavement Management System (PMS) Surface Evaluation =
$1,541,000
Total Projected/Actual Paving Bond Funds Used = $1,430,000 Difference = $111,000
Bicycle and pedestrian bond funds were used to complete sidewalk infill between Royal Ave and Richard Avenue. The total amount of bond funds used for bicycle and pedestrian improvements on this project was approximately $50,000.
Additional Sources of Funding: Stormwater utility funds, wastewater utility funds, stormwater SDC funds. Using stormwater funds, planted rainwater treatment facilities were constructed to treat some of the rainwater draining from the street prior to it entering the underground pipe system.
Project Photos:
Completed Paving Fairfield Avenue Completed Paving Jacobs Drive
2016 Report to the SRRP Page 11
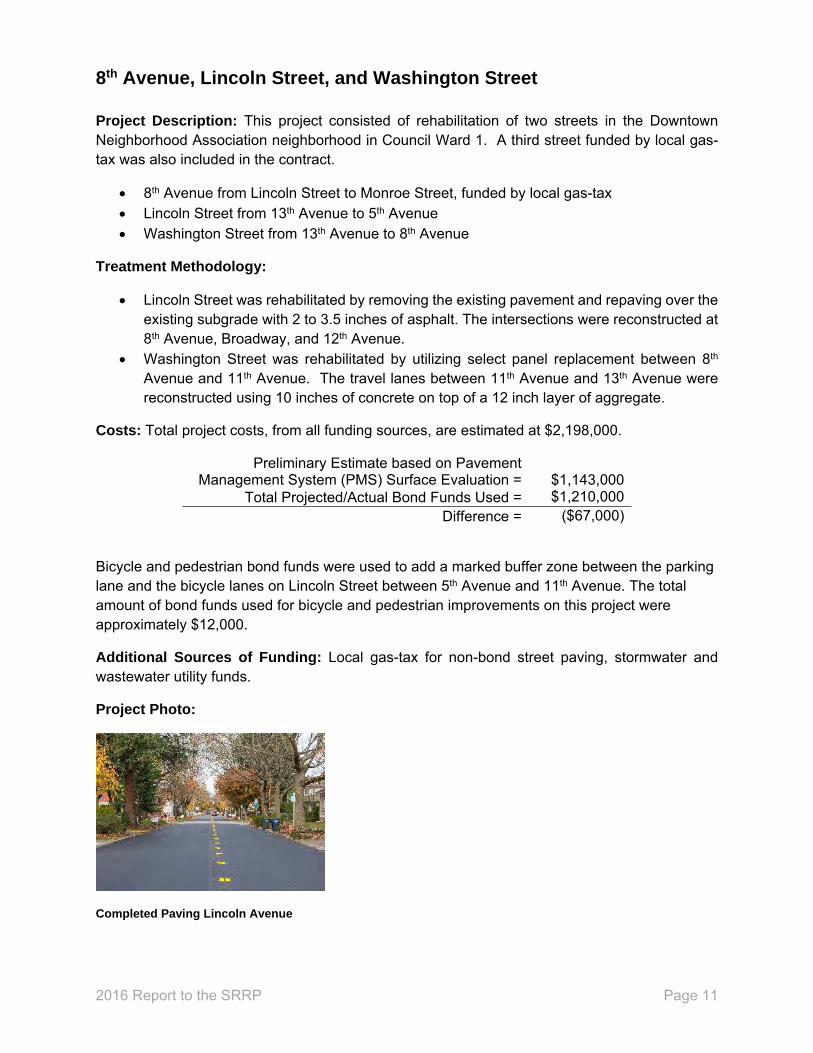
8th Avenue, Lincoln Street, and Washington Street
Project Description: This project consisted of rehabilitation of two streets in the Downtown Neighborhood Association neighborhood in Council Ward 1. A third street funded by local gas-tax was also included in the contract.
8th Avenue from Lincoln Street to Monroe Street, funded by local gas-tax Lincoln Street from 13th Avenue to 5th Avenue Washington Street from 13th Avenue to 8th Avenue
Treatment Methodology:
Lincoln Street was rehabilitated by removing the existing pavement and repaving over theexisting subgrade with 2 to 3.5 inches of asphalt. The intersections were reconstructed at8th Avenue, Broadway, and 12th Avenue.
Washington Street was rehabilitated by utilizing select panel replacement between 8th
Avenue and 11th Avenue. The travel lanes between 11th Avenue and 13th Avenue werereconstructed using 10 inches of concrete on top of a 12 inch layer of aggregate.
Costs: Total project costs, from all funding sources, are estimated at $2,198,000.
Preliminary Estimate based on Pavement Management System (PMS) Surface Evaluation = $1,143,000
Total Projected/Actual Bond Funds Used = $1,210,000 Difference = ($67,000)
Bicycle and pedestrian bond funds were used to add a marked buffer zone between the parking lane and the bicycle lanes on Lincoln Street between 5th Avenue and 11th Avenue. The total amount of bond funds used for bicycle and pedestrian improvements on this project were approximately $12,000.
Additional Sources of Funding: Local gas-tax for non-bond street paving, stormwater and wastewater utility funds.
Project Photo:
Completed Paving Lincoln Avenue
2016 Report to the SRRP Page 12
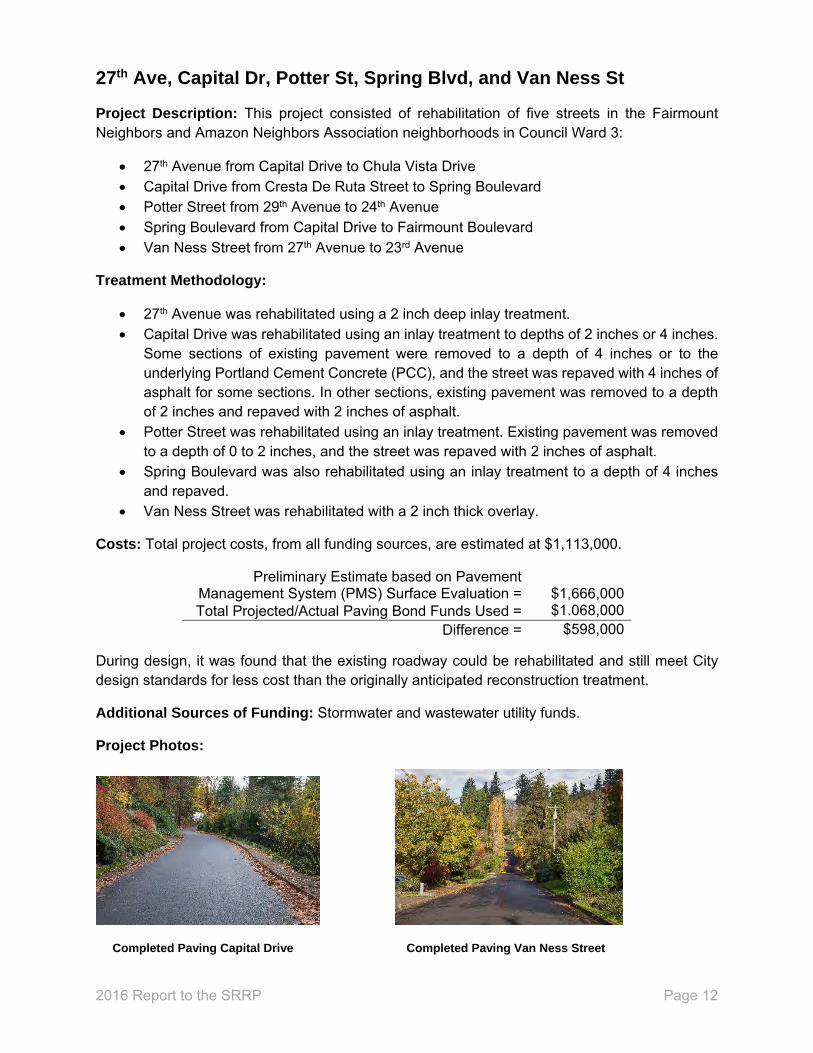
27th Ave, Capital Dr, Potter St, Spring Blvd, and Van Ness St
Project Description: This project consisted of rehabilitation of five streets in the Fairmount Neighbors and Amazon Neighbors Association neighborhoods in Council Ward 3:
27th Avenue from Capital Drive to Chula Vista Drive Capital Drive from Cresta De Ruta Street to Spring Boulevard Potter Street from 29th Avenue to 24th Avenue Spring Boulevard from Capital Drive to Fairmount Boulevard Van Ness Street from 27th Avenue to 23rd Avenue
Treatment Methodology:
27th Avenue was rehabilitated using a 2 inch deep inlay treatment. Capital Drive was rehabilitated using an inlay treatment to depths of 2 inches or 4 inches.
Some sections of existing pavement were removed to a depth of 4 inches or to theunderlying Portland Cement Concrete (PCC), and the street was repaved with 4 inches ofasphalt for some sections. In other sections, existing pavement was removed to a depthof 2 inches and repaved with 2 inches of asphalt.
Potter Street was rehabilitated using an inlay treatment. Existing pavement was removedto a depth of 0 to 2 inches, and the street was repaved with 2 inches of asphalt.
Spring Boulevard was also rehabilitated using an inlay treatment to a depth of 4 inchesand repaved.
Van Ness Street was rehabilitated with a 2 inch thick overlay.
Costs: Total project costs, from all funding sources, are estimated at $1,113,000.
Preliminary Estimate based on Pavement Management System (PMS) Surface Evaluation = $1,666,000 Total Projected/Actual Paving Bond Funds Used = $1.068,000
Difference = $598,000
During design, it was found that the existing roadway could be rehabilitated and still meet City design standards for less cost than the originally anticipated reconstruction treatment.
Additional Sources of Funding: Stormwater and wastewater utility funds.
Project Photos:
Completed Paving Capital Drive Completed Paving Van Ness Street
2016 Report to the SRRP Page 13
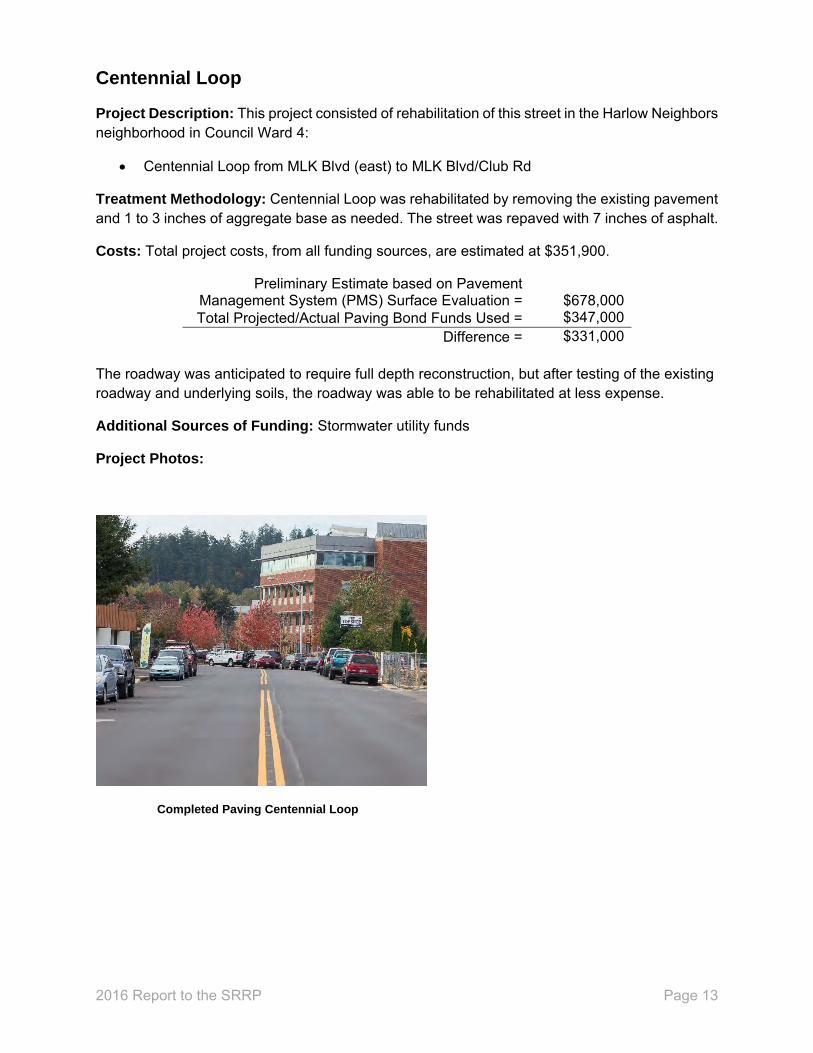
Centennial Loop
Project Description: This project consisted of rehabilitation of this street in the Harlow Neighbors neighborhood in Council Ward 4:
Centennial Loop from MLK Blvd (east) to MLK Blvd/Club Rd
Treatment Methodology: Centennial Loop was rehabilitated by removing the existing pavement and 1 to 3 inches of aggregate base as needed. The street was repaved with 7 inches of asphalt.
Costs: Total project costs, from all funding sources, are estimated at $351,900.
Preliminary Estimate based on Pavement Management System (PMS) Surface Evaluation = $678,000 Total Projected/Actual Paving Bond Funds Used = $347,000
Difference = $331,000
The roadway was anticipated to require full depth reconstruction, but after testing of the existing roadway and underlying soils, the roadway was able to be rehabilitated at less expense.
Additional Sources of Funding: Stormwater utility funds
Project Photos:
Completed Paving Centennial Loop
2016 Report to the SRRP Page 14
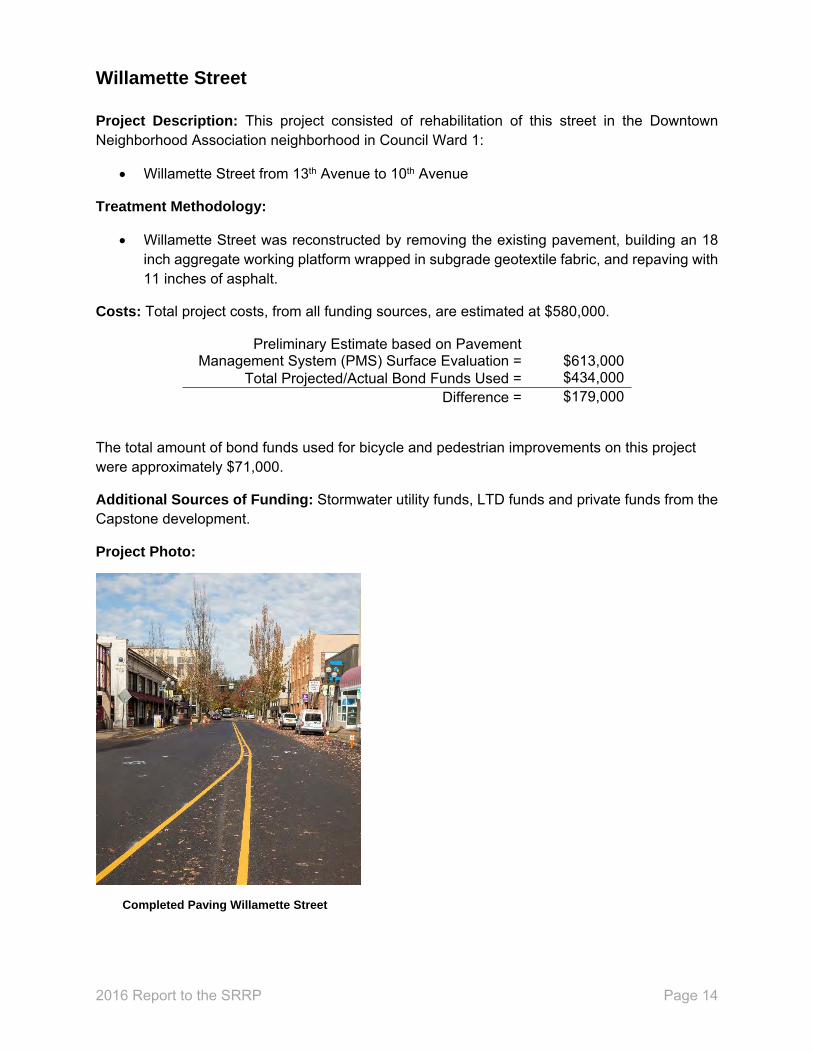
Willamette Street
Project Description: This project consisted of rehabilitation of this street in the Downtown Neighborhood Association neighborhood in Council Ward 1:
Willamette Street from 13th Avenue to 10th Avenue
Treatment Methodology:
Willamette Street was reconstructed by removing the existing pavement, building an 18inch aggregate working platform wrapped in subgrade geotextile fabric, and repaving with11 inches of asphalt.
Costs: Total project costs, from all funding sources, are estimated at $580,000.
Preliminary Estimate based on Pavement Management System (PMS) Surface Evaluation = $613,000
Total Projected/Actual Bond Funds Used = $434,000 Difference = $179,000
The total amount of bond funds used for bicycle and pedestrian improvements on this project were approximately $71,000.
Additional Sources of Funding: Stormwater utility funds, LTD funds and private funds from the Capstone development.
Project Photo:
Completed Paving Willamette Street
2016 Report to the SRRP Page 15
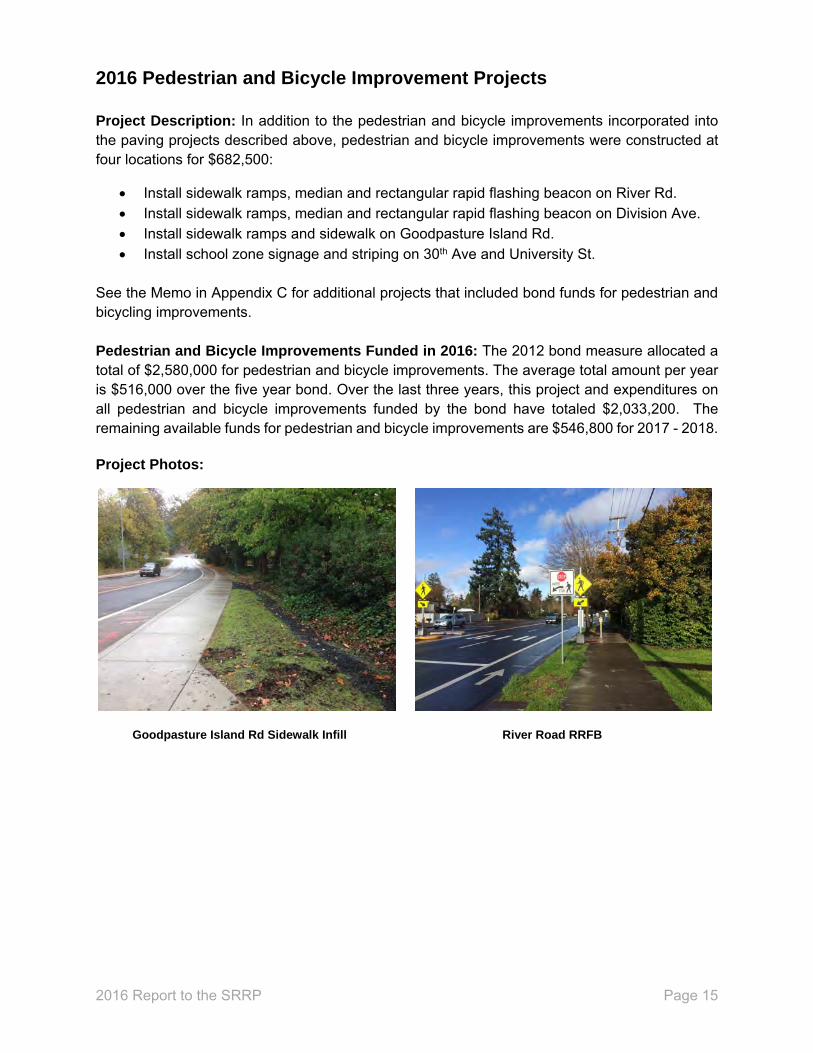
2016 Pedestrian and Bicycle Improvement Projects
Project Description: In addition to the pedestrian and bicycle improvements incorporated into the paving projects described above, pedestrian and bicycle improvements were constructed at four locations for $682,500:
Install sidewalk ramps, median and rectangular rapid flashing beacon on River Rd. Install sidewalk ramps, median and rectangular rapid flashing beacon on Division Ave. Install sidewalk ramps and sidewalk on Goodpasture Island Rd. Install school zone signage and striping on 30th Ave and University St.
See the Memo in Appendix C for additional projects that included bond funds for pedestrian and bicycling improvements.
Pedestrian and Bicycle Improvements Funded in 2016: The 2012 bond measure allocated a total of $2,580,000 for pedestrian and bicycle improvements. The average total amount per year is $516,000 over the five year bond. Over the last three years, this project and expenditures on all pedestrian and bicycle improvements funded by the bond have totaled $2,033,200. The remaining available funds for pedestrian and bicycle improvements are $546,800 for 2017 - 2018.
Project Photos:
Goodpasture Island Rd Sidewalk Infill River Road RRFB
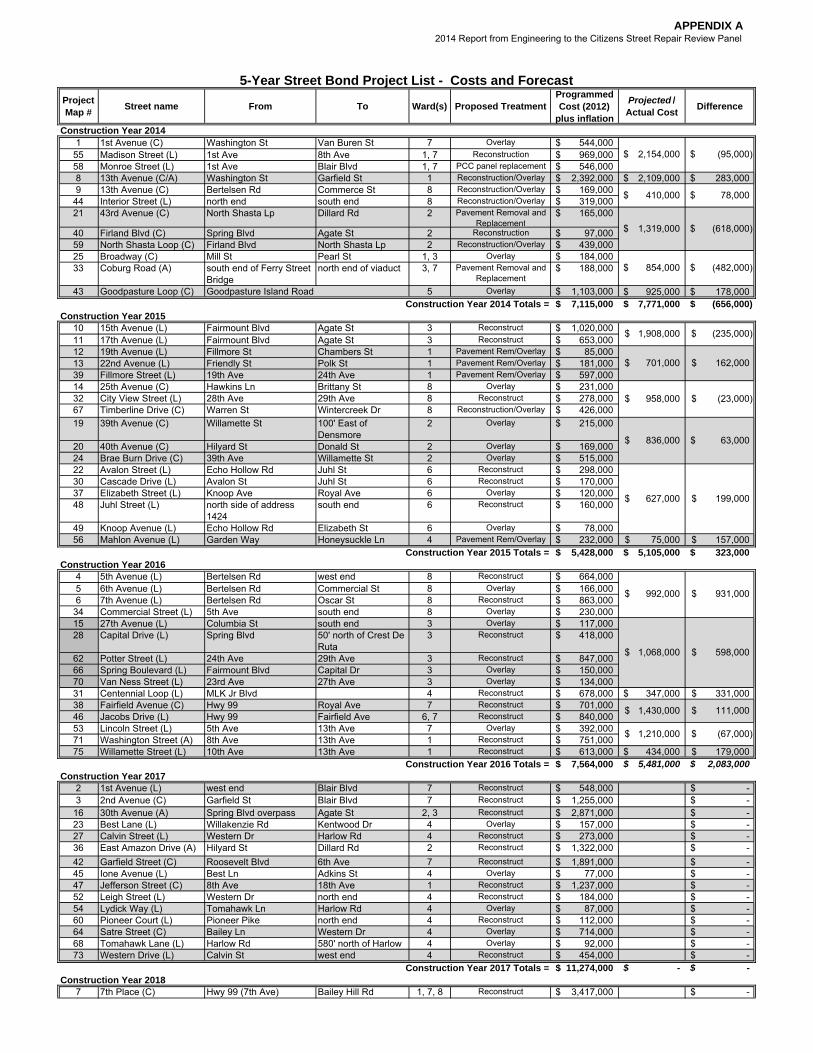
APPENDIX A2014 Report from Engineering to the Citizens Street Repair Review Panel
Project Map # Street name From To Ward(s) Proposed Treatment
Programmed Cost (2012)
plus inflation
Projected / Actual Cost Difference
Construction Year 20141 1st Avenue (C) Washington St Van Buren St 7 Overlay 544,000$
55 Madison Street (L) 1st Ave 8th Ave 1, 7 Reconstruction 969,000$ 58 Monroe Street (L) 1st Ave Blair Blvd 1, 7 PCC panel replacement 546,000$ 8 13th Avenue (C/A) Washington St Garfield St 1 Reconstruction/Overlay 2,392,000$ 2,109,000$ 283,000$ 9 13th Avenue (C) Bertelsen Rd Commerce St 8 Reconstruction/Overlay 169,000$
44 Interior Street (L) north end south end 8 Reconstruction/Overlay 319,000$ 21 43rd Avenue (C) North Shasta Lp Dillard Rd 2 Pavement Removal and
Replacement165,000$
40 Firland Blvd (C) Spring Blvd Agate St 2 Reconstruction 97,000$ 59 North Shasta Loop (C) Firland Blvd North Shasta Lp 2 Reconstruction/Overlay 439,000$ 25 Broadway (C) Mill St Pearl St 1, 3 Overlay 184,000$ 33 Coburg Road (A) south end of Ferry Street
Bridgenorth end of viaduct 3, 7 Pavement Removal and
Replacement188,000$
43 Goodpasture Loop (C) 5 Overlay 1,103,000$ 925,000$ 178,000$ 7,115,000$ 7,771,000$ (656,000)$
Construction Year 201510 15th Avenue (L) Fairmount Blvd Agate St 3 Reconstruct 1,020,000$ 11 17th Avenue (L) Fairmount Blvd Agate St 3 Reconstruct 653,000$ 12 19th Avenue (L) Fillmore St Chambers St 1 Pavement Rem/Overlay 85,000$ 13 22nd Avenue (L) Friendly St Polk St 1 Pavement Rem/Overlay 181,000$ 39 Fillmore Street (L) 19th Ave 24th Ave 1 Pavement Rem/Overlay 597,000$ 14 25th Avenue (C) Hawkins Ln Brittany St 8 Overlay 231,000$ 32 City View Street (L) 28th Ave 29th Ave 8 Reconstruct 278,000$ 67 Timberline Drive (C) Warren St Wintercreek Dr 8 Reconstruction/Overlay 426,000$ 19 39th Avenue (C) Willamette St 100' East of
Densmore2 Overlay 215,000$
20 40th Avenue (C) Hilyard St Donald St 2 Overlay 169,000$ 24 Brae Burn Drive (C) 39th Ave Willamette St 2 Overlay 515,000$ 22 Avalon Street (L) Echo Hollow Rd Juhl St 6 Reconstruct 298,000$ 30 Cascade Drive (L) Avalon St Juhl St 6 Reconstruct 170,000$ 37 Elizabeth Street (L) Knoop Ave Royal Ave 6 Overlay 120,000$ 48 Juhl Street (L) north side of address
1424south end 6 Reconstruct 160,000$
49 Knoop Avenue (L) Echo Hollow Rd Elizabeth St 6 Overlay 78,000$ 56 Mahlon Avenue (L) Garden Way Honeysuckle Ln 4 Pavement Rem/Overlay 232,000$ 75,000$ 157,000$
5,428,000$ 5,105,000$ 323,000$ Construction Year 2016
4 5th Avenue (L) Bertelsen Rd west end 8 Reconstruct 664,000$ 5 6th Avenue (L) Bertelsen Rd Commercial St 8 Overlay 166,000$ 6 7th Avenue (L) Bertelsen Rd Oscar St 8 Reconstruct 863,000$
34 Commercial Street (L) 5th Ave south end 8 Overlay 230,000$ 15 27th Avenue (L) Columbia St south end 3 Overlay 117,000$ 28 Capital Drive (L) Spring Blvd 50' north of Crest De
Ruta3 Reconstruct 418,000$
62 Potter Street (L) 24th Ave 29th Ave 3 Reconstruct 847,000$ 66 Spring Boulevard (L) Fairmount Blvd Capital Dr 3 Overlay 150,000$ 70 Van Ness Street (L) 23rd Ave 27th Ave 3 Overlay 134,000$ 31 Centennial Loop (L) MLK Jr Blvd 4 Reconstruct 678,000$ 347,000$ 331,000$ 38 Fairfield Avenue (C) Hwy 99 Royal Ave 7 Reconstruct 701,000$ 46 Jacobs Drive (L) Hwy 99 Fairfield Ave 6, 7 Reconstruct 840,000$ 53 Lincoln Street (L) 5th Ave 13th Ave 7 Overlay 392,000$ 71 Washington Street (A) 8th Ave 13th Ave 1 Reconstruct 751,000$ 75 Willamette Street (L) 10th Ave 13th Ave 1 Reconstruct 613,000$ 434,000$ 179,000$
7,564,000$ 5,481,000$ 2,083,000$ Construction Year 2017
2 1st Avenue (L) west end Blair Blvd 7 Reconstruct 548,000$ -$ 3 2nd Avenue (C) Garfield St Blair Blvd 7 Reconstruct 1,255,000$ -$
16 30th Avenue (A) Spring Blvd overpass Agate St 2, 3 Reconstruct 2,871,000$ -$ 23 Best Lane (L) Willakenzie Rd Kentwood Dr 4 Overlay 157,000$ -$ 27 Calvin Street (L) Western Dr Harlow Rd 4 Reconstruct 273,000$ -$ 36 East Amazon Drive (A) Hilyard St Dillard Rd 2 Reconstruct 1,322,000$ -$ 42 Garfield Street (C) Roosevelt Blvd 6th Ave 7 Reconstruct 1,891,000$ -$ 45 Ione Avenue (L) Best Ln Adkins St 4 Overlay 77,000$ -$ 47 Jefferson Street (C) 8th Ave 18th Ave 1 Reconstruct 1,237,000$ -$ 52 Leigh Street (L) Western Dr north end 4 Reconstruct 184,000$ -$ 54 Lydick Way (L) Tomahawk Ln Harlow Rd 4 Overlay 87,000$ -$ 60 Pioneer Court (L) Pioneer Pike north end 4 Reconstruct 112,000$ -$ 64 Satre Street (C) Bailey Ln Western Dr 4 Overlay 714,000$ -$ 68 Tomahawk Lane (L) Harlow Rd 580' north of Harlow 4 Overlay 92,000$ -$ 73 Western Drive (L) Calvin St west end 4 Reconstruct 454,000$ -$
11,274,000$ -$ -$ Construction Year 2018
7 7th Place (C) Hwy 99 (7th Ave) Bailey Hill Rd 1, 7, 8 Reconstruct 3,417,000$ -$
Construction Year 2015 Totals =
Construction Year 2016 Totals =
Construction Year 2017 Totals =
1,430,000$ 111,000$
1,210,000$ (67,000)$
Goodpasture Island RoadConstruction Year 2014 Totals =
1,908,000$ (235,000)$
701,000$ 162,000$
5-Year Street Bond Project List - Costs and Forecast
2,154,000$ (95,000)$
410,000$ 78,000$
1,319,000$ (618,000)$
992,000$ 931,000$
1,068,000$ 598,000$
854,000$ (482,000)$
958,000$ (23,000)$
836,000$ 63,000$
627,000$ 199,000$
APPENDIX A2014 Report from Engineering to the Citizens Street Repair Review Panel
Project Map # Street name From To Ward(s) Proposed Treatment
Programmed Cost (2012)
plus inflation
Projected / Actual Cost Difference
5-Year Street Bond Project List - Costs and Forecast
17/18 30th Avenue (L) Willamette Street Ferry Street 2 Reconstruct 437,000$ -$ 26 Buff Way (L) Woodside Dr Forrester Wy 4 Reconstruct 179,000$ -$ 29 Carmel Avenue (L) Minda Dr 400' south 5 Reconstruct 132,000$ -$ 35 Corydon Street (L) Forrester Wy Tandy Turn 4 Reconstruct 41,000$ -$ 41 Forrester Way (L) Coburg Rd west side of
driveway 10334 Reconstruct 248,000$ -$
50 Larkspur Avenue (L) Norkenzie Rd 604' west 5 Reconstruct 211,000$ -$ 51 Larkspur Loop (L) Norkenzie Rd 5 Reconstruct 171,000$ -$ 57 Mill Street (L) 30th Avenue 2 Reconstruct 49,000$ -$ 61 Piper Lane (L) Chasa St Fir Acres Dr 5 Reconstruct 196,000$ -$ 63 Roland Way (L) Oakway Rd Cal Young Rd 5 Reconstruct 216,000$ -$ 65 Sharon Way (L) Coburg Rd east side of driveway
10234 Reconstruct 376,000$ -$
69 Tulip Street (L) Crescent Ave Holly Ave 5 Reconstruct 118,000$ -$ 72 West Amazon Drive (A) Hilyard St Fox Hollow Rd 2 Reconstruct 1,463,000$ -$ 74 Willamette Street (A) 24th Ave 29th Ave 1, 2 Reconstruct 1,232,000$ -$ 76 Woodside Drive (L) Cal Young Rd Sharon Wy 4 Reconstruct 423,000$ -$
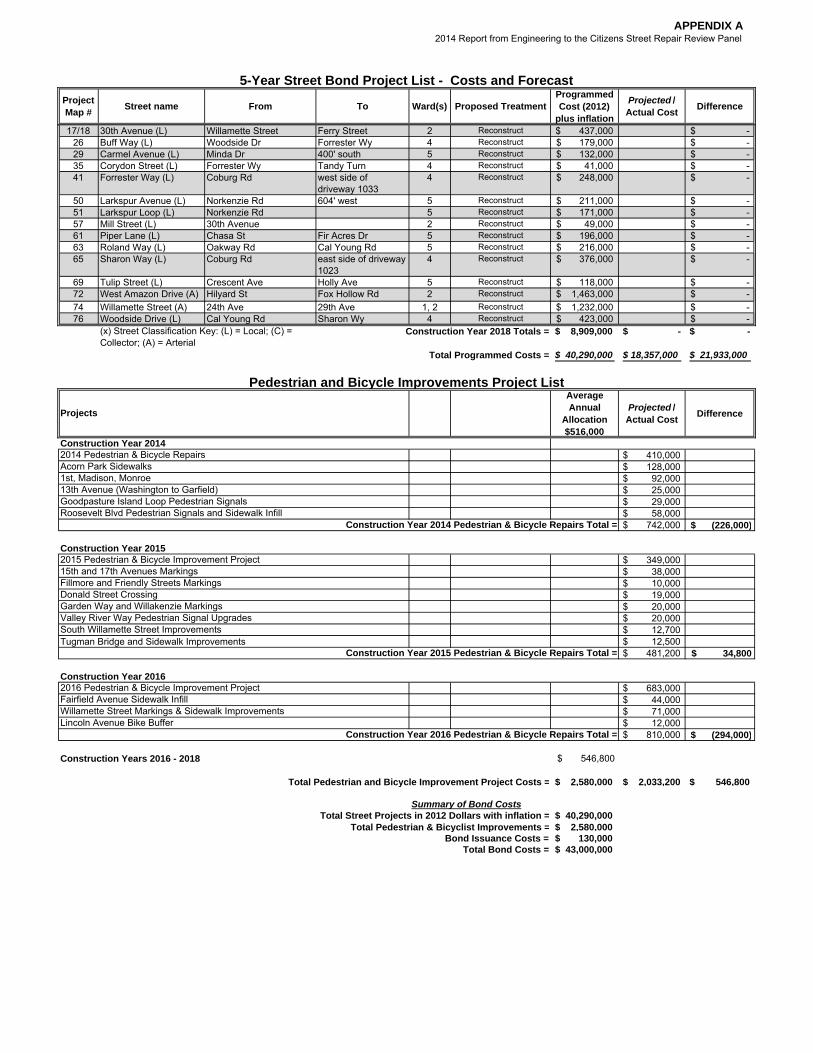
$ 8,909,000 $ - $ -
$ 40,290,000 $ 18,357,000 $ 21,933,000
Average Annual
Allocation $516,000
Projected / Actual Cost Difference
Construction Year 2014 $ 410,000 $ 128,000 $ 92,000 $ 25,000 $ 29,000 $ 58,000 $ 742,000 $ (226,000)
Construction Year 2015 $ 349,000 $ 38,000 $ 10,000 $ 19,000 $ 20,000 $ 20,000 $ 12,700 $ 12,500 $ 481,200 $ 34,800
Construction Year 2016 $ 683,000 $ 44,000 $ 71,000 $ 12,000 $ 810,000 $ (294,000)
Construction Years 2016 - 2018 $ 546,800
$ 2,580,000 $ 2,033,200 $ 546,800
$ 40,290,000 $ 2,580,000 $ 130,000
Total Bond Costs = $ 43,000,000
Construction Year 2016 Pedestrian & Bicycle Repairs Total =
Total Pedestrian and Bicycle Improvement Project Costs =
Summary of Bond CostsTotal Street Projects in 2012 Dollars with inflation =
Total Pedestrian & Bicyclist Improvements =
Fairfield Avenue Sidewalk InfillWillamette Street Markings & Sidewalk ImprovementsLincoln Avenue Bike Buffer
1st, Madison, Monroe
Bond Issuance Costs =
13th Avenue (Washington to Garfield)Goodpasture Island Loop Pedestrian SignalsRoosevelt Blvd Pedestrian Signals and Sidewalk Infill
Construction Year 2014 Pedestrian & Bicycle Repairs Total =
2016 Pedestrian & Bicycle Improvement Project
2014 Pedestrian & Bicycle RepairsAcorn Park Sidewalks
Total Programmed Costs =
Pedestrian and Bicycle Improvements Project List
Projects
(x) Street Classification Key: (L) = Local; (C) = Collector; (A) = Arterial
Construction Year 2018 Totals =
Valley River Way Pedestrian Signal UpgradesSouth Willamette Street ImprovementsTugman Bridge and Sidewalk Improvements
Construction Year 2015 Pedestrian & Bicycle Repairs Total =
2015 Pedestrian & Bicycle Improvement Project15th and 17th Avenues MarkingsFillmore and Friendly Streets MarkingsDonald Street CrossingGarden Way and Willakenzie Markings
W 13th Ave
W 2nd Ave
W 6th Ave
W 11th Ave
W 13th Ave
E 4th Ave
E 3rd Ave
Ci ty
V iew
St
Oa k
Pat
chR
d
Bai
ley
Hi ll
Rd
Oliv
eS
tW
illa m
ette
St
Pea
rlS
t
Pa t
ters
onS
tH
ilya r
dS
t
Linc
oln
St
Ald
erS
t
Aga
teS
t
Franklin Blvd
W 11th Ave
W 18th Ave
SB
erte
lsen
Rd
W 13th Ave
W 7th Ave
W 24th Ave
W 28th Ave
E 33rd Ave
E 19th Ave
Col
umbi
a S
t
E 30th Ave
Crest Dr
Lorane Hwy
City
Vie
w S
t
W 28th Ave
Bailey Hill Rd
W 25th Ave
Cha
mbe
rsS
t
J effe
rson
St
Frie
ndly
St
Pol
kS
t
Kevington Ave
Baile
yHi
ll Rd
W 18th Ave
W 18th Ave
Gimpl Hil l Rd
Willow Creek Rd
Lorane Hwy
Baile
yH
illR
d
Willa
met teSt
Lora
neH
wy
SD
aneb
oA
v e
Ra n
dyP
a pe
Bel
tline
Hw
y
S B
erte
lsen
Rd
W 11th Ave
W 1st Ave
Avalon St
NTe
rry
St
NTe
r ry
St
e
Marshall Ave
Elmira RdRoosevelt Blvd
Hwy 99N
Northwest Expressway
Park Ave
Horn Ln Minda Dr
W 5th Ave
W 1st Ave
Van
Bur
enS
t
N D
aneb
oAv
e
Barger Dr
Clear Lake Rd
River Loop 1
Cro
c ker
Rd
Irving RdIrving Rd
Hya
cin t
hS
t
Hunsaker Ln
Randy Pape Beltline HwyRandy Pape Beltline Hwy
Silver Ln
Northw
est ExpresswayPrairie
Rd
Hwy99N
River R
d
Blackfoot Ave
Irvington Dr
Barstow Ave
River Loop 2
Wilkes DrIrvington Dr
Lynnbrook Dr
Spring Creek Dr
River Loop 2
Beacon Dr
Awbrey Ln
E Enid Rd
Airport Rd
Lynnbrook Dr
River R
d Sc e
nic
Dr
Lancaster Dr
River R
d
Prair ieR
d
Beacon Dr
Hwy99N
Howard Ave
N Park Ave
NTe
rry
St
Crescent Ave
N Delt
a Hwy
Goo
dpasture Lp
Goo
dpas
ture
Isla
ndR
d
Bethel Dr
Hwy99N
Royal Ave
Maxwell Rd
Goodpasture Island Rd
County Farm Rd
Cobur
g Rd
Jeppesen A cres Rd
Oak
wa y
Rd
Country Club Rd
Bailey Ln
CoburgRd
Barger Dr
Ec h
oH
oll o
wR
d
Tane
yS
t
W Shelton Mcmurphey Blvd
Harlow Rd
Martin Luther King Jr Blvd
Leo Harris Pk w y
E 18th Ave
VanD
uynS
t
Ferry
Stre
etBr
idge
Ayres Rd
Green Acres Rd
Randy Pape Beltline Hwy
Cal Young Rd
Willakenzie Rd
Crescent Ave
Chad Dr
Cob
urg
Rd
No r
ken z
ieR
d
Gilh
a mR
d
Fran
Hawkins Ln
Brit t
any
St
Will
owC
reek
Rd
d Cone Blvd
Roosevelt Blvd
Kinsrow Ave
I-105
E 24th Ave
EA
mazon
Dr
E30th Ave
Am
azonP
kwy
Hi ly
ard
St
Har
risS
t
Timberline
Dr
E 40th Ave
Dilla rd
Rd
Fo x HollowR
d
W 39th Ave
E 43rd Ave
E 43rd A ve
Agate St
E 46th Ave
Will
amet
teS
t
Do n
a ld
St
Hily
a rd
St
L inc
o ln
St
Wi ll
amet
teS
t
Bra
eB
urn
Dr
Mc K
inle
yS
t
Ga r
field
St
Gar
field
St
Ch a
mbe
rsS
t
Pol
kS
t
Mo n
roe
St
Was
h ing
ton
St
Jeffe
rson
St
Valley Rive r Dr
E Broadway
I-5
Kin
c aid
St
NS
hasta
Lp
Sprin
g Blv
d
DillardR
d
Oak
St
Hi g
hS
t
Blair Blvd
E 19th Ave
W 13th Ave
W 11th Ave
W 27th Ave
W 29th Ave
E 33rd Ave
WA
mazon
Dr
Fox
Hol
low
Rd
McB
e th
Rd
W 11th Ave
W 5th Ave
W 7th Pl
SS
e ne c
aR
d
Art h
u rS
t
NS
enec
aR
d
Will
agill
espi
e R
d
Club
R
d
Oakmont Way
Goodpasture Island Rd
Del
taH
wy
Gilh
a mR
d
Nor
kenz
ieR
d
Lake
Dr
NP
ark
A ve
NP
ark
Ave
F airf
ield
Ave
Gro
v eS
t
I-105
Cal Young Rd
NG
a rd e
nW
a yS
Gar
d en
Way
Randy Pape Beltl ine Hwy
Am
az
o n Pkwy
W 6th Ave
Ran
dyP
ape
Bel
t line
Hw
y
Co l
ton
Wa y
W7th A ve
River R
d
Don
ald
St
Fox
Hollo
wR
d
Bogart
Ald
erS
t
Coburg Bottom Loop
Coburg Rd
NC
obur
gR
d
Wi
Coburg Rd
Armita
ge R
d
Riv
erLo
op 1
Cob
urg
Indu
stria
l Way
Gle
nwoo
d B
lvd
Blanton Rd
I - 5
I - 5
I - 5
N B
erte
lsen
Rd
ND
aneb
oAv
e
!(36
!(43
!(59
!(7
!(72
!(42
!(8
!(62
!(16
!(28
!(74
!(66!(39
!(24
!(31
!(3
!(65
!(70
!(34
!(64
!(6
!(67
!(56
!(18
!(14
!(1
!(63
!(38
!(27
!(71
!(47
!(23
!(55
!(13
!(40
!(37
!(32
!(68
!(22
!(52
!(69
!(60
!(11
!(29
!(61
!(35
!(44 !(10
!(53
!(46
!(21
!(19
!(2
!(20
!(4
!(5
!(41
!(76!(51
!(54
!(30
!(75
!(17
!(73
!(48
!(15
!(50
!(58
!(9
!(33
!(45
!(26!(49
!(25
!(12
!(57
1
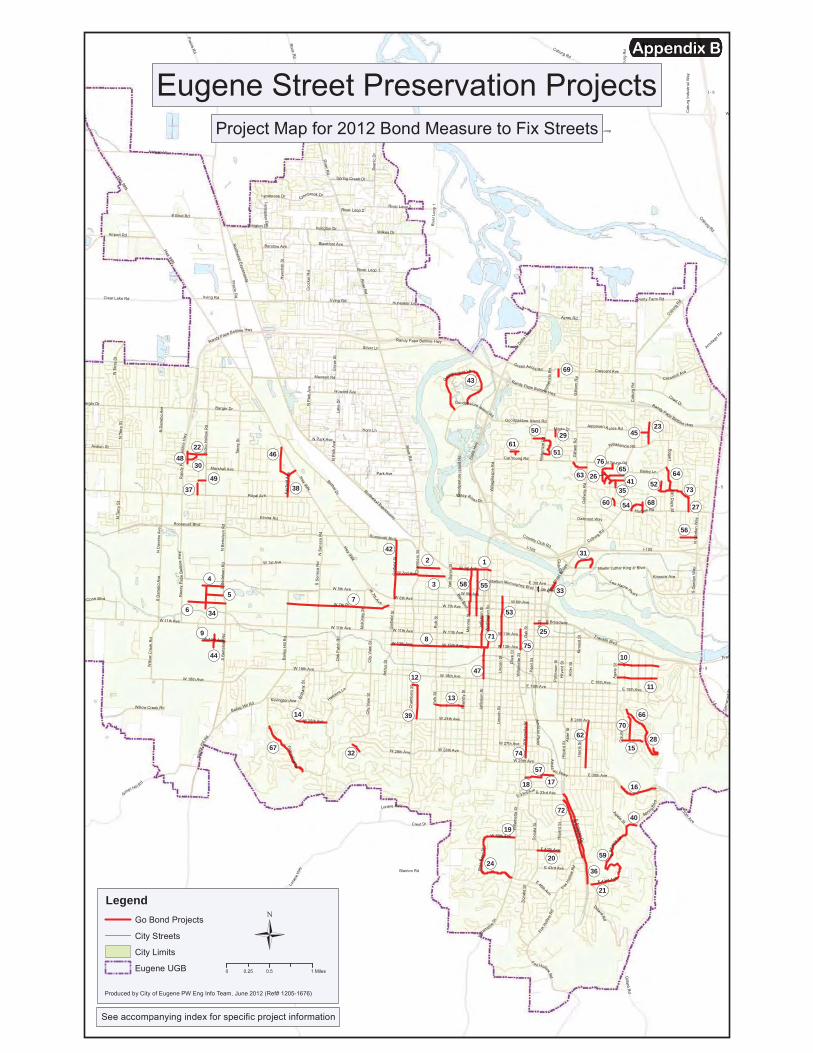
Eugene Street Preservation ProjectsProject Map for 2012 Bond Measure to Fix Streets
Attachment B
See accompanying index for specific project information
LegendGo Bond Projects
City Streets
City Limits
Eugene UGB
Produced by City of Eugene PW Eng Info Team, June 2012 (Ref# 1205-1676)
0 0.5 10.25 Miles
Ü
Attachment BAppendix B
Map # Street Name Limits
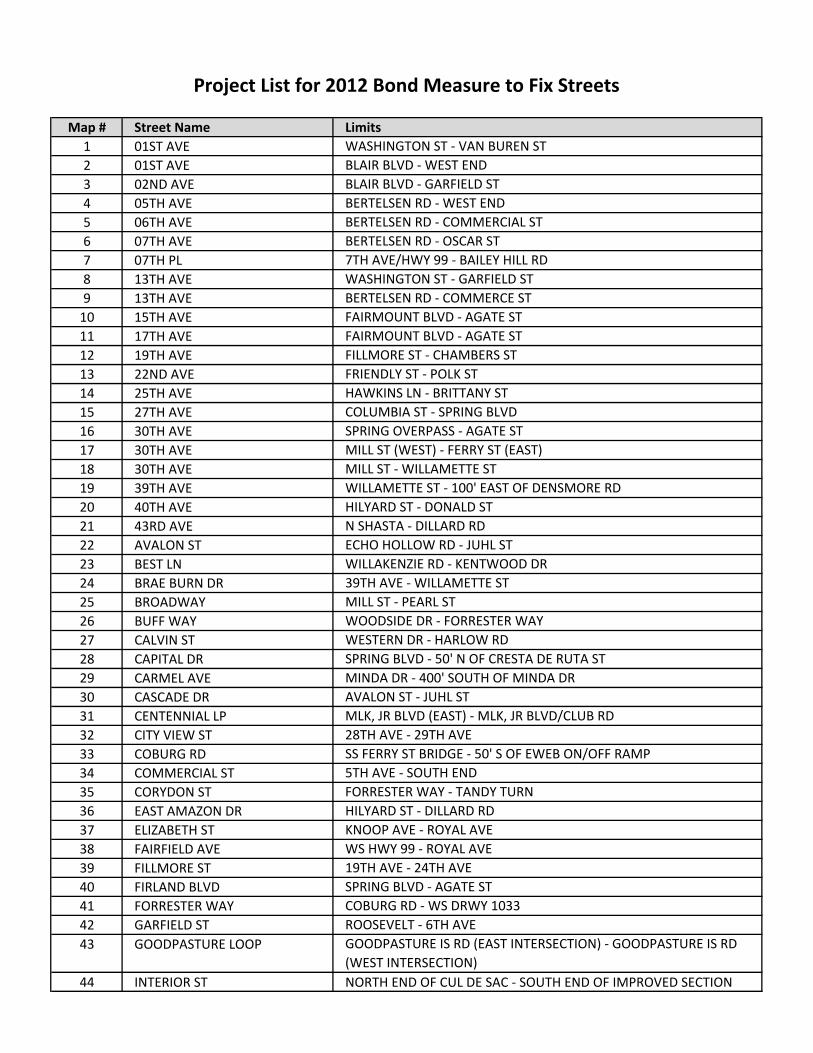
1 01ST AVE WASHINGTON ST ‐ VAN BUREN ST
2 01ST AVE BLAIR BLVD ‐ WEST END
3 02ND AVE BLAIR BLVD ‐ GARFIELD ST
4 05TH AVE BERTELSEN RD ‐ WEST END
5 06TH AVE BERTELSEN RD ‐ COMMERCIAL ST
6 07TH AVE BERTELSEN RD ‐ OSCAR ST
7 07TH PL 7TH AVE/HWY 99 ‐ BAILEY HILL RD
8 13TH AVE WASHINGTON ST ‐ GARFIELD ST
9 13TH AVE BERTELSEN RD ‐ COMMERCE ST
10 15TH AVE FAIRMOUNT BLVD ‐ AGATE ST
11 17TH AVE FAIRMOUNT BLVD ‐ AGATE ST
12 19TH AVE FILLMORE ST ‐ CHAMBERS ST
13 22ND AVE FRIENDLY ST ‐ POLK ST
14 25TH AVE HAWKINS LN ‐ BRITTANY ST
15 27TH AVE COLUMBIA ST ‐ SPRING BLVD
16 30TH AVE SPRING OVERPASS ‐ AGATE ST
17 30TH AVE MILL ST (WEST) ‐ FERRY ST (EAST)
18 30TH AVE MILL ST ‐ WILLAMETTE ST
19 39TH AVE WILLAMETTE ST ‐ 100' EAST OF DENSMORE RD
20 40TH AVE HILYARD ST ‐ DONALD ST
21 43RD AVE N SHASTA ‐ DILLARD RD
22 AVALON ST ECHO HOLLOW RD ‐ JUHL ST
23 BEST LN WILLAKENZIE RD ‐ KENTWOOD DR
24 BRAE BURN DR 39TH AVE ‐ WILLAMETTE ST
25 BROADWAY MILL ST ‐ PEARL ST
26 BUFF WAY WOODSIDE DR ‐ FORRESTER WAY
27 CALVIN ST WESTERN DR ‐ HARLOW RD
28 CAPITAL DR SPRING BLVD ‐ 50' N OF CRESTA DE RUTA ST
29 CARMEL AVE MINDA DR ‐ 400' SOUTH OF MINDA DR
30 CASCADE DR AVALON ST ‐ JUHL ST
31 CENTENNIAL LP MLK, JR BLVD (EAST) ‐ MLK, JR BLVD/CLUB RD
32 CITY VIEW ST 28TH AVE ‐ 29TH AVE
33 COBURG RD SS FERRY ST BRIDGE ‐ 50' S OF EWEB ON/OFF RAMP
34 COMMERCIAL ST 5TH AVE ‐ SOUTH END
35 CORYDON ST FORRESTER WAY ‐ TANDY TURN
36 EAST AMAZON DR HILYARD ST ‐ DILLARD RD
37 ELIZABETH ST KNOOP AVE ‐ ROYAL AVE
38 FAIRFIELD AVE WS HWY 99 ‐ ROYAL AVE
39 FILLMORE ST 19TH AVE ‐ 24TH AVE
40 FIRLAND BLVD SPRING BLVD ‐ AGATE ST
41 FORRESTER WAY COBURG RD ‐ WS DRWY 1033
42 GARFIELD ST ROOSEVELT ‐ 6TH AVE
43 GOODPASTURE LOOP GOODPASTURE IS RD (EAST INTERSECTION) ‐ GOODPASTURE IS RD
(WEST INTERSECTION)
44 INTERIOR ST NORTH END OF CUL DE SAC ‐ SOUTH END OF IMPROVED SECTION
Project List for 2012 Bond Measure to Fix Streets
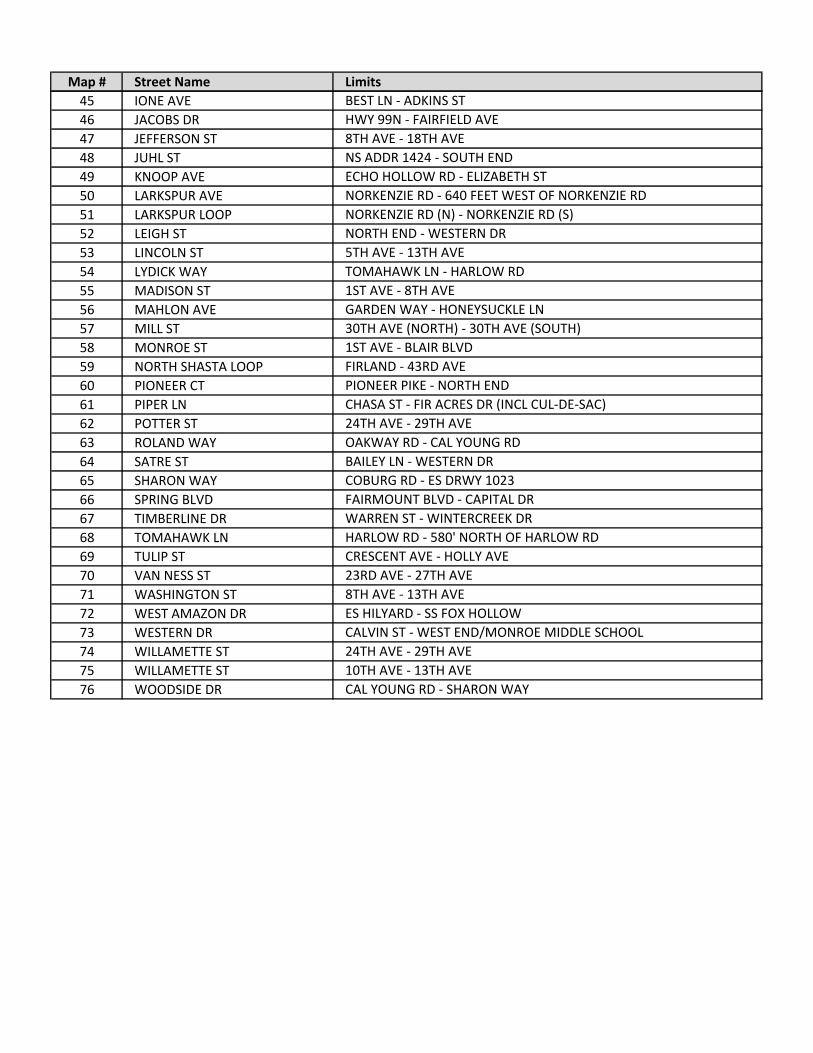
Map # Street Name Limits
45 IONE AVE BEST LN ‐ ADKINS ST
46 JACOBS DR HWY 99N ‐ FAIRFIELD AVE
47 JEFFERSON ST 8TH AVE ‐ 18TH AVE
48 JUHL ST NS ADDR 1424 ‐ SOUTH END
49 KNOOP AVE ECHO HOLLOW RD ‐ ELIZABETH ST
50 LARKSPUR AVE NORKENZIE RD ‐ 640 FEET WEST OF NORKENZIE RD
51 LARKSPUR LOOP NORKENZIE RD (N) ‐ NORKENZIE RD (S)
52 LEIGH ST NORTH END ‐ WESTERN DR
53 LINCOLN ST 5TH AVE ‐ 13TH AVE
54 LYDICK WAY TOMAHAWK LN ‐ HARLOW RD
55 MADISON ST 1ST AVE ‐ 8TH AVE
56 MAHLON AVE GARDEN WAY ‐ HONEYSUCKLE LN
57 MILL ST 30TH AVE (NORTH) ‐ 30TH AVE (SOUTH)
58 MONROE ST 1ST AVE ‐ BLAIR BLVD
59 NORTH SHASTA LOOP FIRLAND ‐ 43RD AVE
60 PIONEER CT PIONEER PIKE ‐ NORTH END
61 PIPER LN CHASA ST ‐ FIR ACRES DR (INCL CUL‐DE‐SAC)
62 POTTER ST 24TH AVE ‐ 29TH AVE
63 ROLAND WAY OAKWAY RD ‐ CAL YOUNG RD
64 SATRE ST BAILEY LN ‐ WESTERN DR
65 SHARON WAY COBURG RD ‐ ES DRWY 1023
66 SPRING BLVD FAIRMOUNT BLVD ‐ CAPITAL DR
67 TIMBERLINE DR WARREN ST ‐ WINTERCREEK DR
68 TOMAHAWK LN HARLOW RD ‐ 580' NORTH OF HARLOW RD
69 TULIP ST CRESCENT AVE ‐ HOLLY AVE
70 VAN NESS ST 23RD AVE ‐ 27TH AVE
71 WASHINGTON ST 8TH AVE ‐ 13TH AVE
72 WEST AMAZON DR ES HILYARD ‐ SS FOX HOLLOW
73 WESTERN DR CALVIN ST ‐ WEST END/MONROE MIDDLE SCHOOL
74 WILLAMETTE ST 24TH AVE ‐ 29TH AVE
75 WILLAMETTE ST 10TH AVE ‐ 13TH AVE
76 WOODSIDE DR CAL YOUNG RD ‐ SHARON WAY
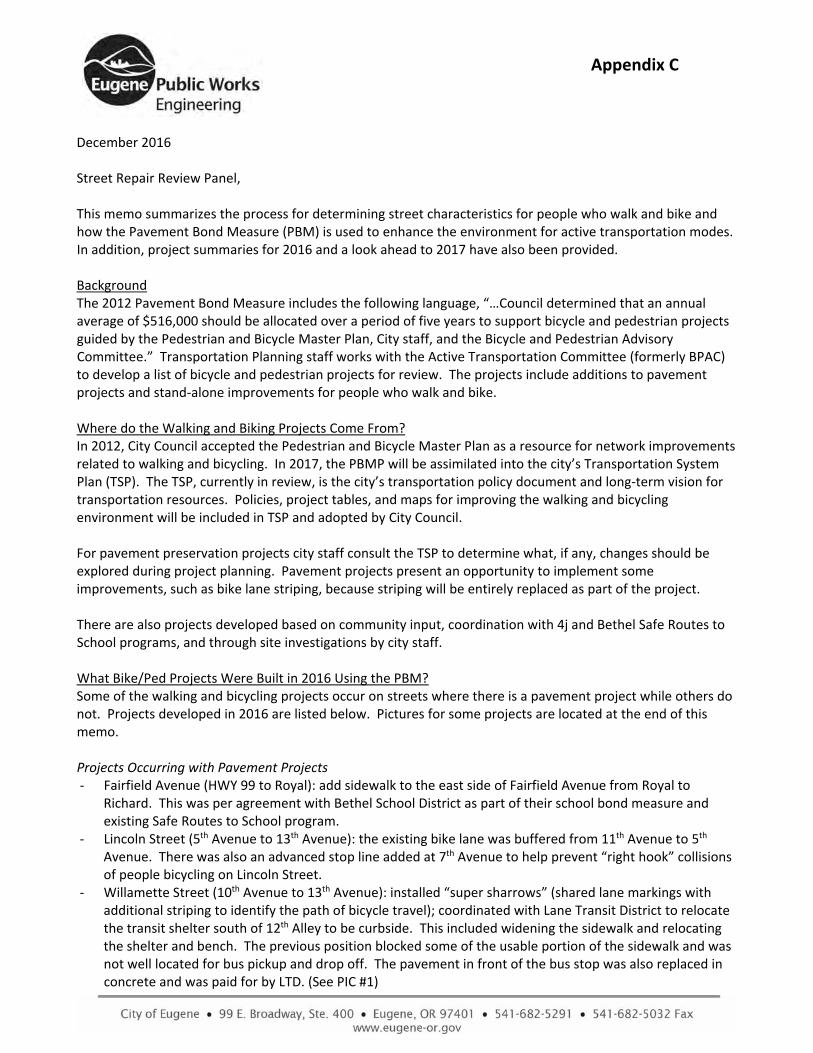
December 2016 Street Repair Review Panel, This memo summarizes the process for determining street characteristics for people who walk and bike and how the Pavement Bond Measure (PBM) is used to enhance the environment for active transportation modes. In addition, project summaries for 2016 and a look ahead to 2017 have also been provided. Background The 2012 Pavement Bond Measure includes the following language, “…Council determined that an annual average of $516,000 should be allocated over a period of five years to support bicycle and pedestrian projects guided by the Pedestrian and Bicycle Master Plan, City staff, and the Bicycle and Pedestrian Advisory Committee.” Transportation Planning staff works with the Active Transportation Committee (formerly BPAC) to develop a list of bicycle and pedestrian projects for review. The projects include additions to pavement projects and stand‐alone improvements for people who walk and bike. Where do the Walking and Biking Projects Come From? In 2012, City Council accepted the Pedestrian and Bicycle Master Plan as a resource for network improvements related to walking and bicycling. In 2017, the PBMP will be assimilated into the city’s Transportation System Plan (TSP). The TSP, currently in review, is the city’s transportation policy document and long‐term vision for transportation resources. Policies, project tables, and maps for improving the walking and bicycling environment will be included in TSP and adopted by City Council. For pavement preservation projects city staff consult the TSP to determine what, if any, changes should be explored during project planning. Pavement projects present an opportunity to implement some improvements, such as bike lane striping, because striping will be entirely replaced as part of the project. There are also projects developed based on community input, coordination with 4j and Bethel Safe Routes to School programs, and through site investigations by city staff. What Bike/Ped Projects Were Built in 2016 Using the PBM? Some of the walking and bicycling projects occur on streets where there is a pavement project while others do not. Projects developed in 2016 are listed below. Pictures for some projects are located at the end of this memo. Projects Occurring with Pavement Projects ‐ Fairfield Avenue (HWY 99 to Royal): add sidewalk to the east side of Fairfield Avenue from Royal to
Richard. This was per agreement with Bethel School District as part of their school bond measure and existing Safe Routes to School program.
‐ Lincoln Street (5th Avenue to 13th Avenue): the existing bike lane was buffered from 11th Avenue to 5th Avenue. There was also an advanced stop line added at 7th Avenue to help prevent “right hook” collisions of people bicycling on Lincoln Street.
‐ Willamette Street (10th Avenue to 13th Avenue): installed “super sharrows” (shared lane markings with additional striping to identify the path of bicycle travel); coordinated with Lane Transit District to relocate the transit shelter south of 12th Alley to be curbside. This included widening the sidewalk and relocating the shelter and bench. The previous position blocked some of the usable portion of the sidewalk and was not well located for bus pickup and drop off. The pavement in front of the bus stop was also replaced in concrete and was paid for by LTD. (See PIC #1)
Appendix C
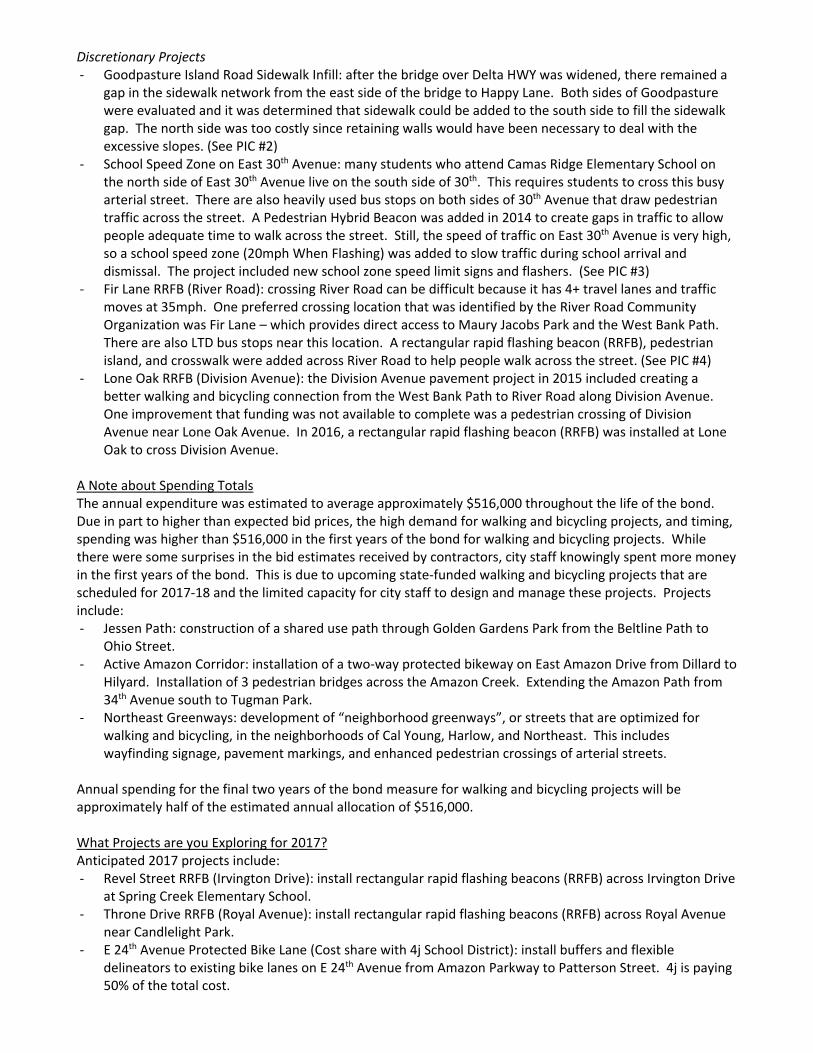
Discretionary Projects ‐ Goodpasture Island Road Sidewalk Infill: after the bridge over Delta HWY was widened, there remained a
gap in the sidewalk network from the east side of the bridge to Happy Lane. Both sides of Goodpasture were evaluated and it was determined that sidewalk could be added to the south side to fill the sidewalk gap. The north side was too costly since retaining walls would have been necessary to deal with the excessive slopes. (See PIC #2)
‐ School Speed Zone on East 30th Avenue: many students who attend Camas Ridge Elementary School on the north side of East 30th Avenue live on the south side of 30th. This requires students to cross this busy arterial street. There are also heavily used bus stops on both sides of 30th Avenue that draw pedestrian traffic across the street. A Pedestrian Hybrid Beacon was added in 2014 to create gaps in traffic to allow people adequate time to walk across the street. Still, the speed of traffic on East 30th Avenue is very high, so a school speed zone (20mph When Flashing) was added to slow traffic during school arrival and dismissal. The project included new school zone speed limit signs and flashers. (See PIC #3)
‐ Fir Lane RRFB (River Road): crossing River Road can be difficult because it has 4+ travel lanes and traffic moves at 35mph. One preferred crossing location that was identified by the River Road Community Organization was Fir Lane – which provides direct access to Maury Jacobs Park and the West Bank Path. There are also LTD bus stops near this location. A rectangular rapid flashing beacon (RRFB), pedestrian island, and crosswalk were added across River Road to help people walk across the street. (See PIC #4)
‐ Lone Oak RRFB (Division Avenue): the Division Avenue pavement project in 2015 included creating a better walking and bicycling connection from the West Bank Path to River Road along Division Avenue. One improvement that funding was not available to complete was a pedestrian crossing of Division Avenue near Lone Oak Avenue. In 2016, a rectangular rapid flashing beacon (RRFB) was installed at Lone Oak to cross Division Avenue.
A Note about Spending Totals The annual expenditure was estimated to average approximately $516,000 throughout the life of the bond. Due in part to higher than expected bid prices, the high demand for walking and bicycling projects, and timing, spending was higher than $516,000 in the first years of the bond for walking and bicycling projects. While there were some surprises in the bid estimates received by contractors, city staff knowingly spent more money in the first years of the bond. This is due to upcoming state‐funded walking and bicycling projects that are scheduled for 2017‐18 and the limited capacity for city staff to design and manage these projects. Projects include: ‐ Jessen Path: construction of a shared use path through Golden Gardens Park from the Beltline Path to
Ohio Street. ‐ Active Amazon Corridor: installation of a two‐way protected bikeway on East Amazon Drive from Dillard to
Hilyard. Installation of 3 pedestrian bridges across the Amazon Creek. Extending the Amazon Path from 34th Avenue south to Tugman Park.
‐ Northeast Greenways: development of “neighborhood greenways”, or streets that are optimized for walking and bicycling, in the neighborhoods of Cal Young, Harlow, and Northeast. This includes wayfinding signage, pavement markings, and enhanced pedestrian crossings of arterial streets.
Annual spending for the final two years of the bond measure for walking and bicycling projects will be approximately half of the estimated annual allocation of $516,000. What Projects are you Exploring for 2017? Anticipated 2017 projects include: ‐ Revel Street RRFB (Irvington Drive): install rectangular rapid flashing beacons (RRFB) across Irvington Drive
at Spring Creek Elementary School. ‐ Throne Drive RRFB (Royal Avenue): install rectangular rapid flashing beacons (RRFB) across Royal Avenue
near Candlelight Park. ‐ E 24th Avenue Protected Bike Lane (Cost share with 4j School District): install buffers and flexible
delineators to existing bike lanes on E 24th Avenue from Amazon Parkway to Patterson Street. 4j is paying 50% of the total cost.
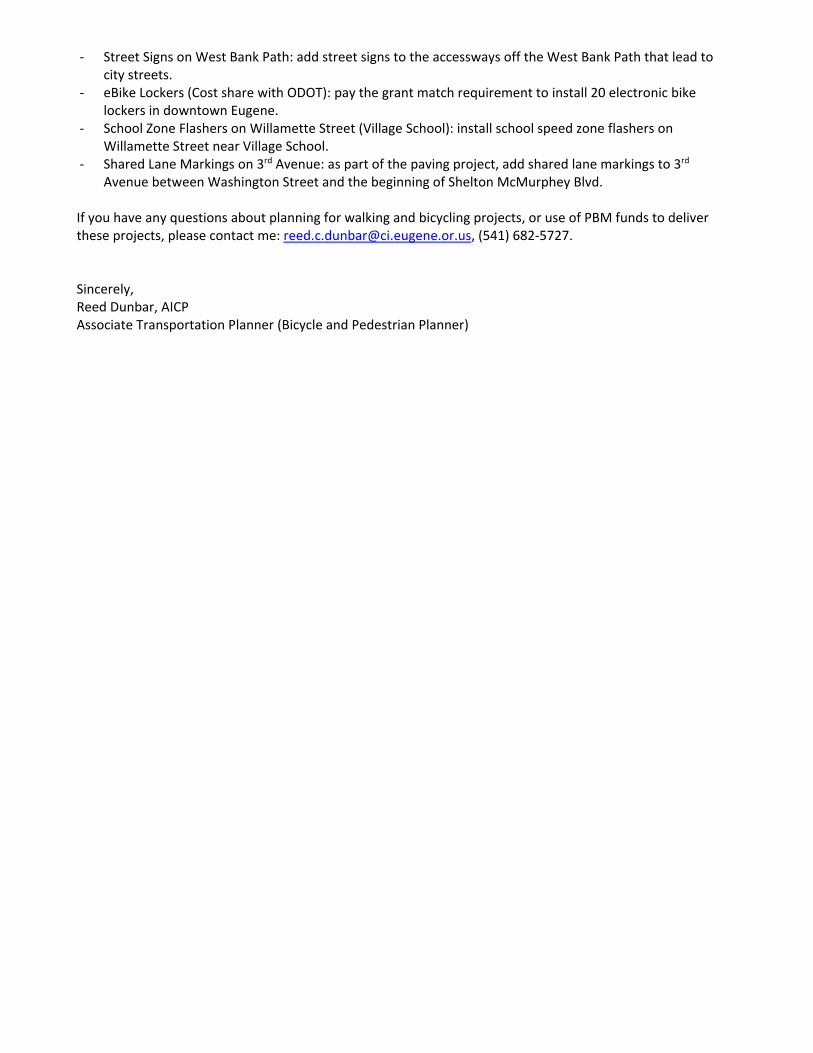
‐ Street Signs on West Bank Path: add street signs to the accessways off the West Bank Path that lead to city streets.
‐ eBike Lockers (Cost share with ODOT): pay the grant match requirement to install 20 electronic bike lockers in downtown Eugene.
‐ School Zone Flashers on Willamette Street (Village School): install school speed zone flashers on Willamette Street near Village School.
‐ Shared Lane Markings on 3rd Avenue: as part of the paving project, add shared lane markings to 3rd Avenue between Washington Street and the beginning of Shelton McMurphey Blvd.
If you have any questions about planning for walking and bicycling projects, or use of PBM funds to deliver these projects, please contact me: [email protected], (541) 682‐5727. Sincerely, Reed Dunbar, AICP Associate Transportation Planner (Bicycle and Pedestrian Planner)
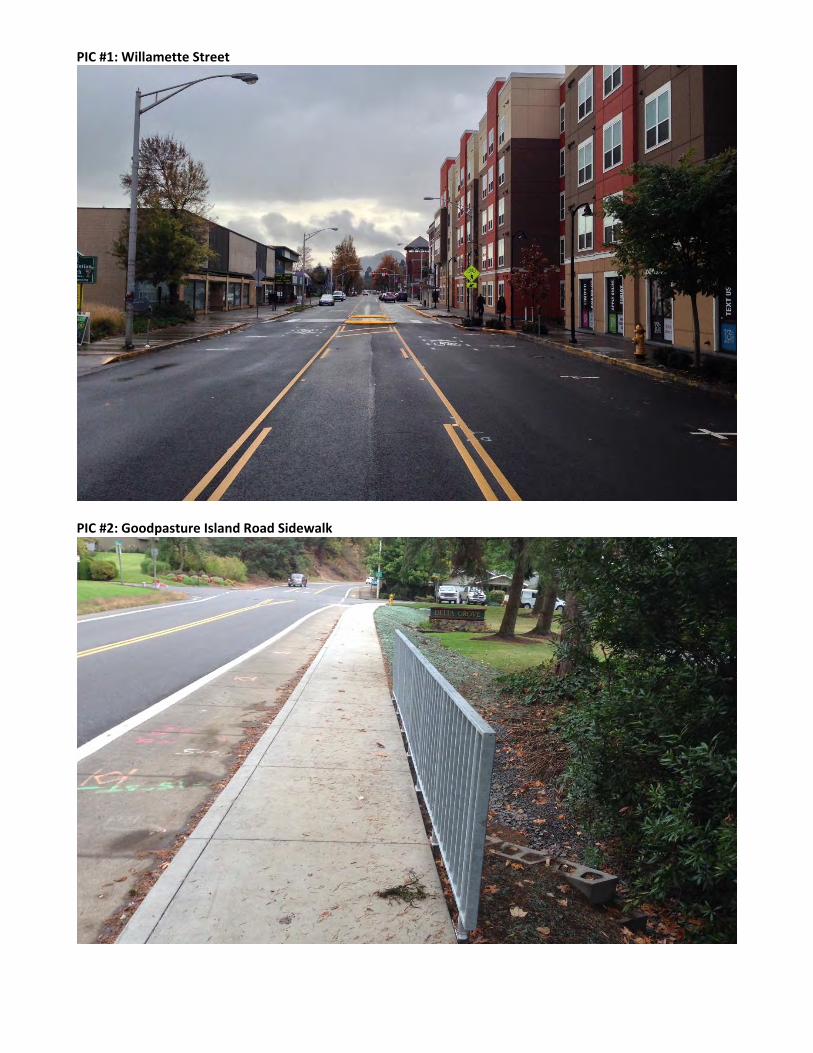
PIC #1: Willamette Street
PIC #2: Goodpasture Island Road Sidewalk
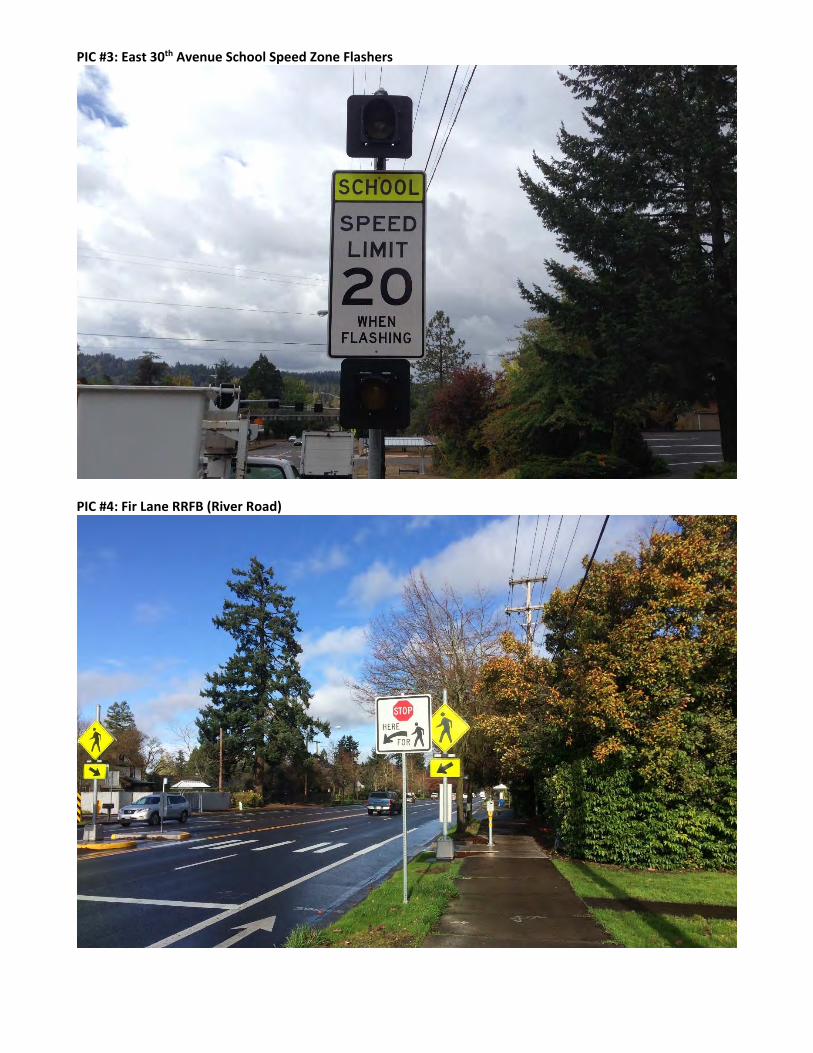
PIC #3: East 30th Avenue School Speed Zone Flashers
PIC #4: Fir Lane RRFB (River Road)

INDEPENDENT ACCOUNTANT’S REPORT ON APPLYING AGREED-UPON PROCEDURES
To Jon Ruiz, City Manager City of Eugene Eugene, Oregon
We have performed the procedures enumerated below, which were agreed to by the City of Eugene (“City”), solely to assist you in connection with the determination of whether expenditure of the 2012 general obligation bond funds approved for issuance through voter’s approval of Ballot Measure 20-197 were expended in accordance with the purposes and limitations outlined in City Council Resolution No. 5063; namely that such expenditures were: a) used only for costs related to street preservation projects, fund bicycle and pedestrian projects and payment of bond issuance costs and not to expand the motor vehicle capacity of the street system; and, b) limited to projects included in Exhibit A to the Resolution unless upon completion of all of the projects listed in Exhibit A the Council adds other street preservation projects to the list in order to utilize unspent bond proceeds. Management is responsible for the accounting records pertaining to the use of the bond proceeds. This agreed-upon procedures engagement was conducted in accordance with attestation standards established by the American Institute of Certified Public Accountants. The sufficiency of these procedures is solely the responsibility of those parties specified in this report. Consequently, we make no representation regarding the sufficiency of the procedures described below either for the purpose for which this report has been requested or for any other purpose.
All procedures were performed for expenditures incurred from January 1, 2016 through December 31, 2016. All procedures we performed were limited to documentation and information supplied to us by the City, as follows:
An Excel spreadsheet detailing all payments made, charges allocated and/or invoices received bythe City for expenditures related to the use of the bond proceeds
Copies of Resolution No. 5063 and Ballot Measure 20-197 Copies of bids and contracts issued by the City for any projects to be completed using the bond
proceeds Copies of supporting documentation including, but not limited to, invoices, cancelled checks,
payroll records, certifications of payments and bank statements; and Copies of the City’s general ledger detail for the bond fund accounts.
The procedures we performed and the associated findings are as follows:
(1) Expenditure testing. From January 1, 2016 through December 31, 2016, total expenditures for theprojects funded by the 2012 bond proceeds were $6,378,148 per the City’s general ledger. Wetested $3,850,753 or 60%, of those expenditures. All tested expenditures were supported byappropriate documentation such as vendor invoices, certifications of payment, payroll records, signedcontracts, and photographs of the work in progress. All tested expenditures were recorded in theproper account, fund and period and were spent on street projects included in Exhibit A of CityCouncil Resolution No. 5063 or other street preservation projects approved by City Council, aspermitted under Resolution 5063. No exceptions were noted.
RSM US Alliance member firms are separate and independent businesses and legal entities that are responsible for their own acts and omissions, and each are separate and independent from RSM US LLP. RSM US LLP is the U.S. member firm of RSM International, a global network of independent audit, tax, and consulting firms. Members of RSM US Alliance have access to RSM International resources through RSM US LLP but are not member firms of RSM International.
Appendix D
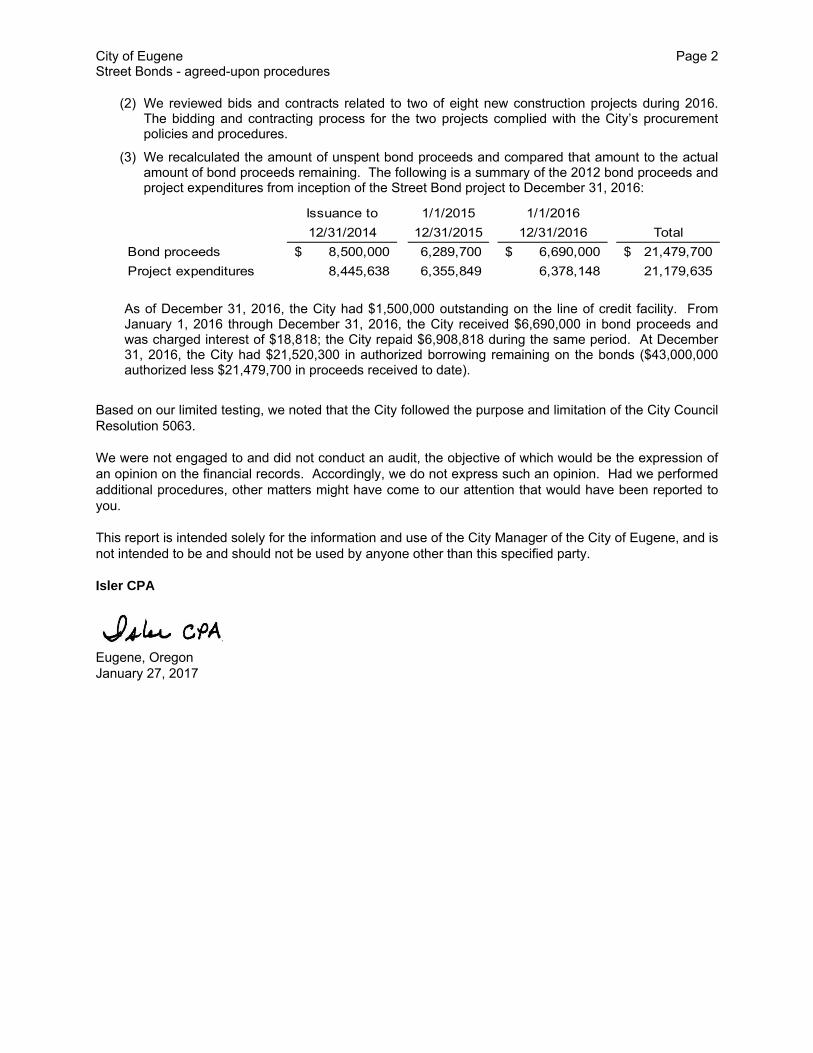
City of Eugene Page 2 Street Bonds - agreed-upon procedures
(2) We reviewed bids and contracts related to two of eight new construction projects during 2016. The bidding and contracting process for the two projects complied with the City’s procurement policies and procedures.
(3) We recalculated the amount of unspent bond proceeds and compared that amount to the actual amount of bond proceeds remaining. The following is a summary of the 2012 bond proceeds and project expenditures from inception of the Street Bond project to December 31, 2016:
Issuance to 1/1/2015 1/1/201612/31/2014 12/31/2015 12/31/2016 Total
Bond proceeds 8,500,000$ 6,289,700 6,690,000$ 21,479,700$ Project expenditures 8,445,638 6,355,849 6,378,148 21,179,635
As of December 31, 2016, the City had $1,500,000 outstanding on the line of credit facility. From January 1, 2016 through December 31, 2016, the City received $6,690,000 in bond proceeds and was charged interest of $18,818; the City repaid $6,908,818 during the same period. At December 31, 2016, the City had $21,520,300 in authorized borrowing remaining on the bonds ($43,000,000 authorized less $21,479,700 in proceeds received to date).
Based on our limited testing, we noted that the City followed the purpose and limitation of the City Council Resolution 5063. We were not engaged to and did not conduct an audit, the objective of which would be the expression of an opinion on the financial records. Accordingly, we do not express such an opinion. Had we performed additional procedures, other matters might have come to our attention that would have been reported to you. This report is intended solely for the information and use of the City Manager of the City of Eugene, and is not intended to be and should not be used by anyone other than this specified party. Isler CPA
Eugene, Oregon January 27, 2017
2017 PAVEMENT MANAGEMENT REPORT An Update on Asphalt Pavement Conditions and Programs (2016 Rating & Inventory Data)
Prepared by:Public Works Maintenance
Surface Technical Team 1820 Roosevelt Blvd.
Eugene, OR 97402
Attachment B

Cover Photos (top left – clockwise): GO BONDS, Trolley Rails in Willamette Street, Fox Hollow after Enhanced Street Repair Program, Durability Cracking in Concrete
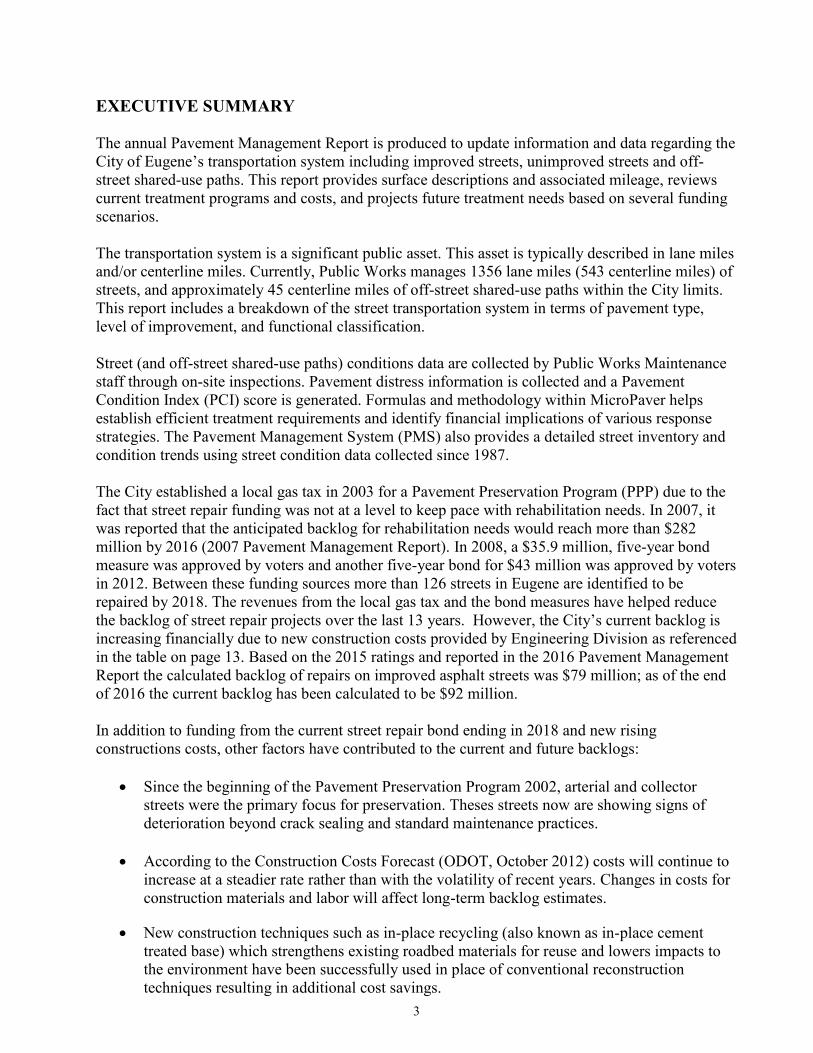
3
EXECUTIVE SUMMARY The annual Pavement Management Report is produced to update information and data regarding the City of Eugene’s transportation system including improved streets, unimproved streets and off-street shared-use paths. This report provides surface descriptions and associated mileage, reviews current treatment programs and costs, and projects future treatment needs based on several funding scenarios. The transportation system is a significant public asset. This asset is typically described in lane miles and/or centerline miles. Currently, Public Works manages 1356 lane miles (543 centerline miles) of streets, and approximately 45 centerline miles of off-street shared-use paths within the City limits. This report includes a breakdown of the street transportation system in terms of pavement type, level of improvement, and functional classification. Street (and off-street shared-use paths) conditions data are collected by Public Works Maintenance staff through on-site inspections. Pavement distress information is collected and a Pavement Condition Index (PCI) score is generated. Formulas and methodology within MicroPaver helps establish efficient treatment requirements and identify financial implications of various response strategies. The Pavement Management System (PMS) also provides a detailed street inventory and condition trends using street condition data collected since 1987. The City established a local gas tax in 2003 for a Pavement Preservation Program (PPP) due to the fact that street repair funding was not at a level to keep pace with rehabilitation needs. In 2007, it was reported that the anticipated backlog for rehabilitation needs would reach more than $282 million by 2016 (2007 Pavement Management Report). In 2008, a $35.9 million, five-year bond measure was approved by voters and another five-year bond for $43 million was approved by voters in 2012. Between these funding sources more than 126 streets in Eugene are identified to be repaired by 2018. The revenues from the local gas tax and the bond measures have helped reduce the backlog of street repair projects over the last 13 years. However, the City’s current backlog is increasing financially due to new construction costs provided by Engineering Division as referenced in the table on page 13. Based on the 2015 ratings and reported in the 2016 Pavement Management Report the calculated backlog of repairs on improved asphalt streets was $79 million; as of the end of 2016 the current backlog has been calculated to be $92 million. In addition to funding from the current street repair bond ending in 2018 and new rising constructions costs, other factors have contributed to the current and future backlogs:
Since the beginning of the Pavement Preservation Program 2002, arterial and collector streets were the primary focus for preservation. Theses streets now are showing signs of deterioration beyond crack sealing and standard maintenance practices.
According to the Construction Costs Forecast (ODOT, October 2012) costs will continue to increase at a steadier rate rather than with the volatility of recent years. Changes in costs for construction materials and labor will affect long-term backlog estimates.
New construction techniques such as in-place recycling (also known as in-place cement
treated base) which strengthens existing roadbed materials for reuse and lowers impacts to the environment have been successfully used in place of conventional reconstruction techniques resulting in additional cost savings.
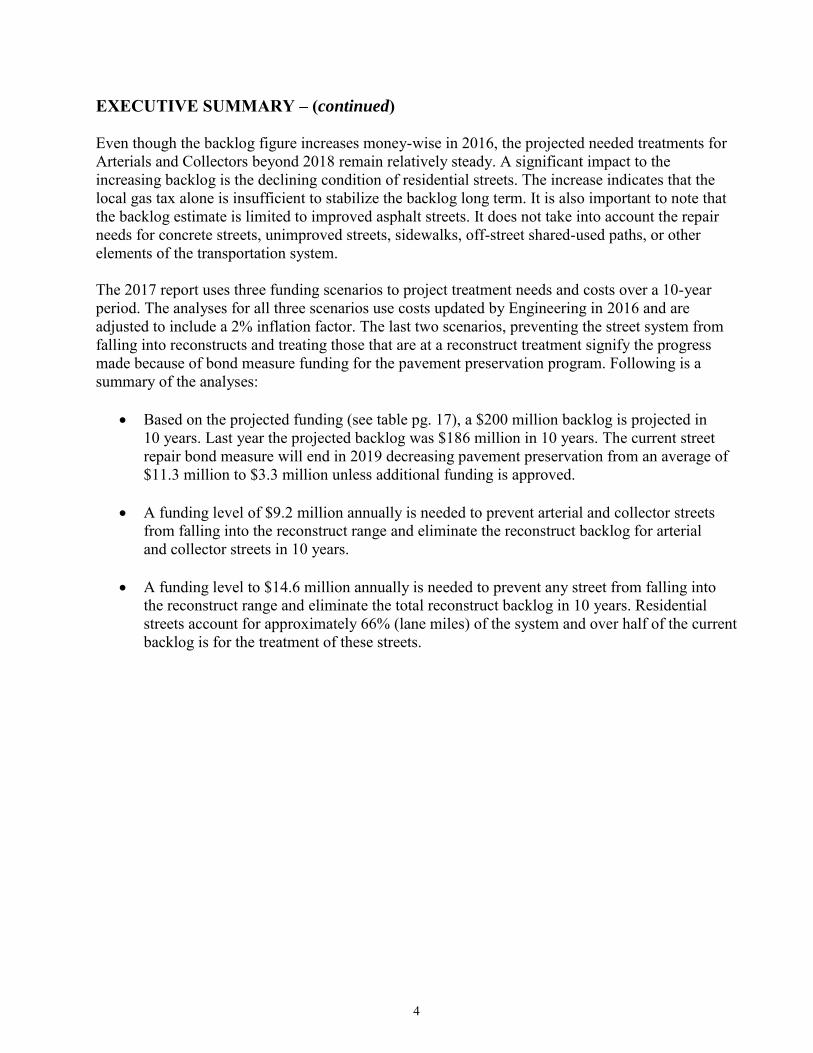
4
EXECUTIVE SUMMARY – (continued) Even though the backlog figure increases money-wise in 2016, the projected needed treatments for Arterials and Collectors beyond 2018 remain relatively steady. A significant impact to the increasing backlog is the declining condition of residential streets. The increase indicates that the local gas tax alone is insufficient to stabilize the backlog long term. It is also important to note that the backlog estimate is limited to improved asphalt streets. It does not take into account the repair needs for concrete streets, unimproved streets, sidewalks, off-street shared-used paths, or other elements of the transportation system. The 2017 report uses three funding scenarios to project treatment needs and costs over a 10-year period. The analyses for all three scenarios use costs updated by Engineering in 2016 and are adjusted to include a 2% inflation factor. The last two scenarios, preventing the street system from falling into reconstructs and treating those that are at a reconstruct treatment signify the progress made because of bond measure funding for the pavement preservation program. Following is a summary of the analyses:
Based on the projected funding (see table pg. 17), a $200 million backlog is projected in 10 years. Last year the projected backlog was $186 million in 10 years. The current street repair bond measure will end in 2019 decreasing pavement preservation from an average of $11.3 million to $3.3 million unless additional funding is approved.
A funding level of $9.2 million annually is needed to prevent arterial and collector streets
from falling into the reconstruct range and eliminate the reconstruct backlog for arterial and collector streets in 10 years.
A funding level to $14.6 million annually is needed to prevent any street from falling into the reconstruct range and eliminate the total reconstruct backlog in 10 years. Residential streets account for approximately 66% (lane miles) of the system and over half of the current backlog is for the treatment of these streets.
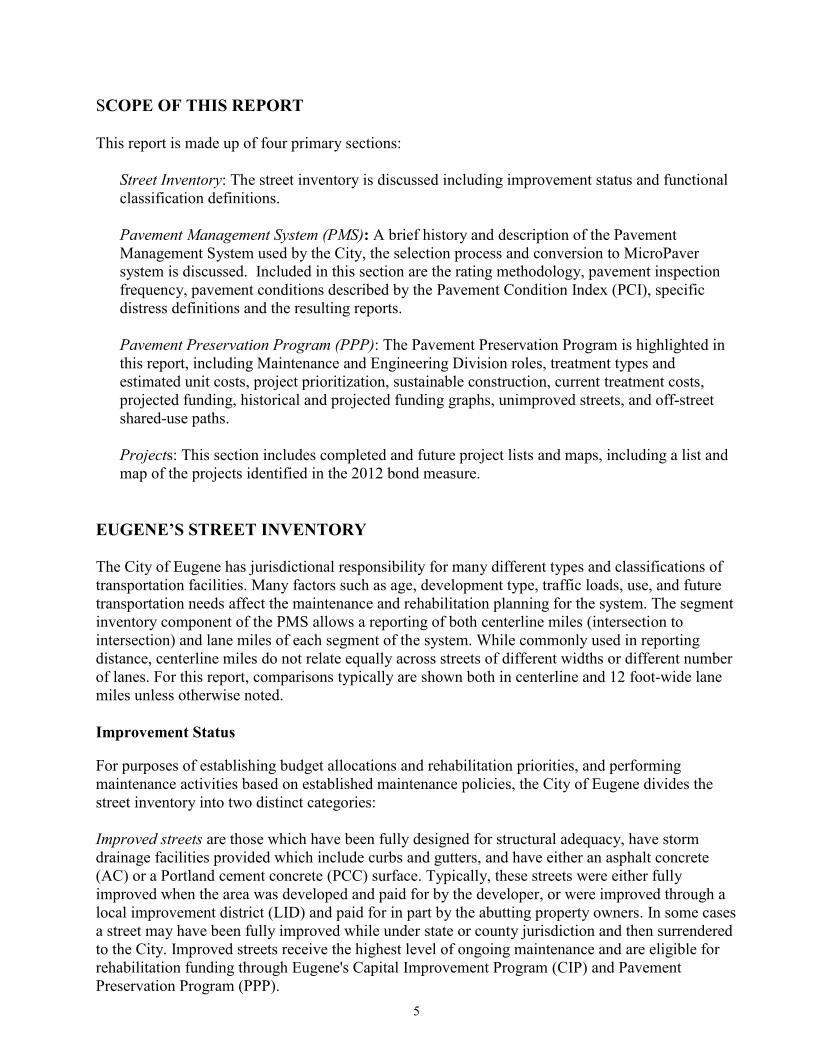
5
SCOPE OF THIS REPORT This report is made up of four primary sections:
Street Inventory: The street inventory is discussed including improvement status and functional classification definitions.
Pavement Management System (PMS): A brief history and description of the Pavement Management System used by the City, the selection process and conversion to MicroPaver system is discussed. Included in this section are the rating methodology, pavement inspection frequency, pavement conditions described by the Pavement Condition Index (PCI), specific distress definitions and the resulting reports.
Pavement Preservation Program (PPP): The Pavement Preservation Program is highlighted in this report, including Maintenance and Engineering Division roles, treatment types and estimated unit costs, project prioritization, sustainable construction, current treatment costs, projected funding, historical and projected funding graphs, unimproved streets, and off-street shared-use paths.
Projects: This section includes completed and future project lists and maps, including a list and map of the projects identified in the 2012 bond measure.
EUGENE’S STREET INVENTORY The City of Eugene has jurisdictional responsibility for many different types and classifications of transportation facilities. Many factors such as age, development type, traffic loads, use, and future transportation needs affect the maintenance and rehabilitation planning for the system. The segment inventory component of the PMS allows a reporting of both centerline miles (intersection to intersection) and lane miles of each segment of the system. While commonly used in reporting distance, centerline miles do not relate equally across streets of different widths or different number of lanes. For this report, comparisons typically are shown both in centerline and 12 foot-wide lane miles unless otherwise noted. Improvement Status For purposes of establishing budget allocations and rehabilitation priorities, and performing maintenance activities based on established maintenance policies, the City of Eugene divides the street inventory into two distinct categories: Improved streets are those which have been fully designed for structural adequacy, have storm drainage facilities provided which include curbs and gutters, and have either an asphalt concrete (AC) or a Portland cement concrete (PCC) surface. Typically, these streets were either fully improved when the area was developed and paid for by the developer, or were improved through a local improvement district (LID) and paid for in part by the abutting property owners. In some cases a street may have been fully improved while under state or county jurisdiction and then surrendered to the City. Improved streets receive the highest level of ongoing maintenance and are eligible for rehabilitation funding through Eugene's Capital Improvement Program (CIP) and Pavement Preservation Program (PPP).
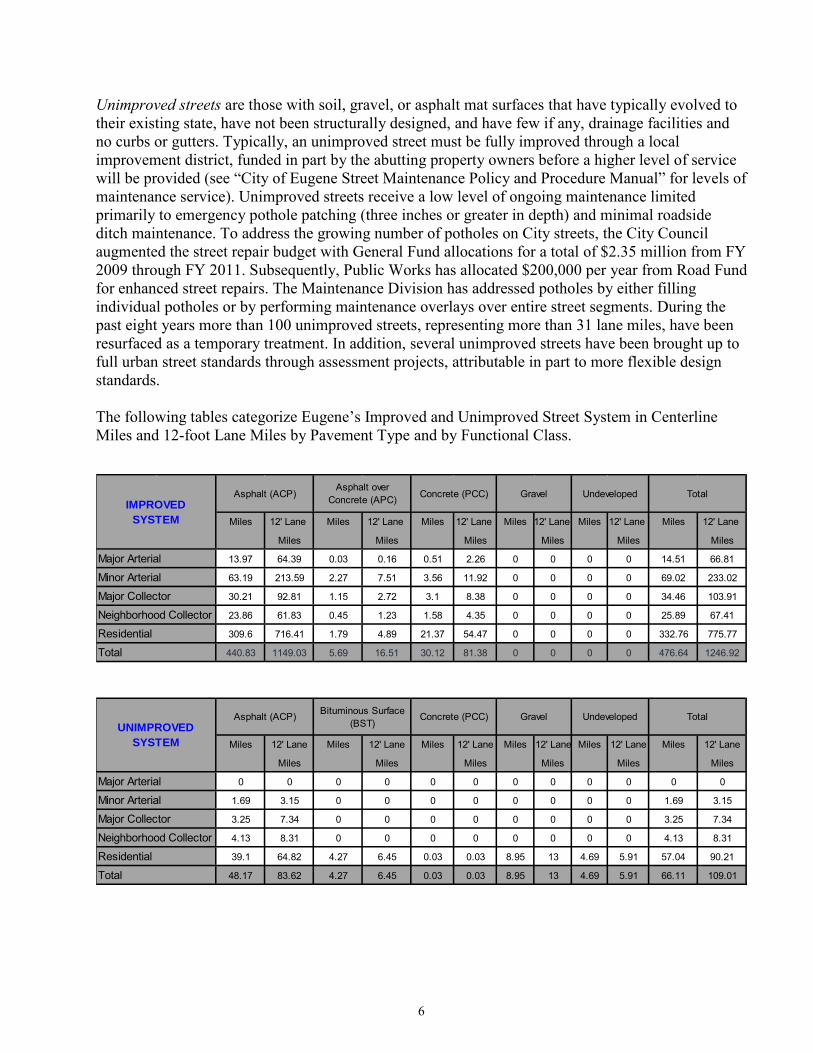
6
Unimproved streets are those with soil, gravel, or asphalt mat surfaces that have typically evolved to their existing state, have not been structurally designed, and have few if any, drainage facilities and no curbs or gutters. Typically, an unimproved street must be fully improved through a local improvement district, funded in part by the abutting property owners before a higher level of service will be provided (see “City of Eugene Street Maintenance Policy and Procedure Manual” for levels of maintenance service). Unimproved streets receive a low level of ongoing maintenance limited primarily to emergency pothole patching (three inches or greater in depth) and minimal roadside ditch maintenance. To address the growing number of potholes on City streets, the City Council augmented the street repair budget with General Fund allocations for a total of $2.35 million from FY 2009 through FY 2011. Subsequently, Public Works has allocated $200,000 per year from Road Fund for enhanced street repairs. The Maintenance Division has addressed potholes by either filling individual potholes or by performing maintenance overlays over entire street segments. During the past eight years more than 100 unimproved streets, representing more than 31 lane miles, have been resurfaced as a temporary treatment. In addition, several unimproved streets have been brought up to full urban street standards through assessment projects, attributable in part to more flexible design standards. The following tables categorize Eugene’s Improved and Unimproved Street System in Centerline Miles and 12-foot Lane Miles by Pavement Type and by Functional Class.
Miles 12' Lane Miles 12' Lane Miles 12' Lane Miles 12' Lane Miles 12' Lane Miles 12' Lane
Miles Miles Miles Miles Miles Miles
13.97 64.39 0.03 0.16 0.51 2.26 0 0 0 0 14.51 66.81
63.19 213.59 2.27 7.51 3.56 11.92 0 0 0 0 69.02 233.02
30.21 92.81 1.15 2.72 3.1 8.38 0 0 0 0 34.46 103.91
23.86 61.83 0.45 1.23 1.58 4.35 0 0 0 0 25.89 67.41
309.6 716.41 1.79 4.89 21.37 54.47 0 0 0 0 332.76 775.77
440.83 1149.03 5.69 16.51 30.12 81.38 0 0 0 0 476.64 1246.92
Miles 12' Lane Miles 12' Lane Miles 12' Lane Miles 12' Lane Miles 12' Lane Miles 12' Lane
Miles Miles Miles Miles Miles Miles
0 0 0 0 0 0 0 0 0 0 0 0
1.69 3.15 0 0 0 0 0 0 0 0 1.69 3.15
3.25 7.34 0 0 0 0 0 0 0 0 3.25 7.34
4.13 8.31 0 0 0 0 0 0 0 0 4.13 8.31
39.1 64.82 4.27 6.45 0.03 0.03 8.95 13 4.69 5.91 57.04 90.21
48.17 83.62 4.27 6.45 0.03 0.03 8.95 13 4.69 5.91 66.11 109.01
Residential
Total
Undeveloped Total
Major Arterial
Minor Arterial
Major Collector
Neighborhood Collector
Total
UNIMPROVED SYSTEM
Asphalt (ACP) Bituminous Surface (BST)
Concrete (PCC) Gravel
Total
Major Arterial
Minor Arterial
Major Collector
Neighborhood Collector
Residential
IMPROVED SYSTEM
Asphalt (ACP)Asphalt over
Concrete (APC) Concrete (PCC) Gravel Undeveloped
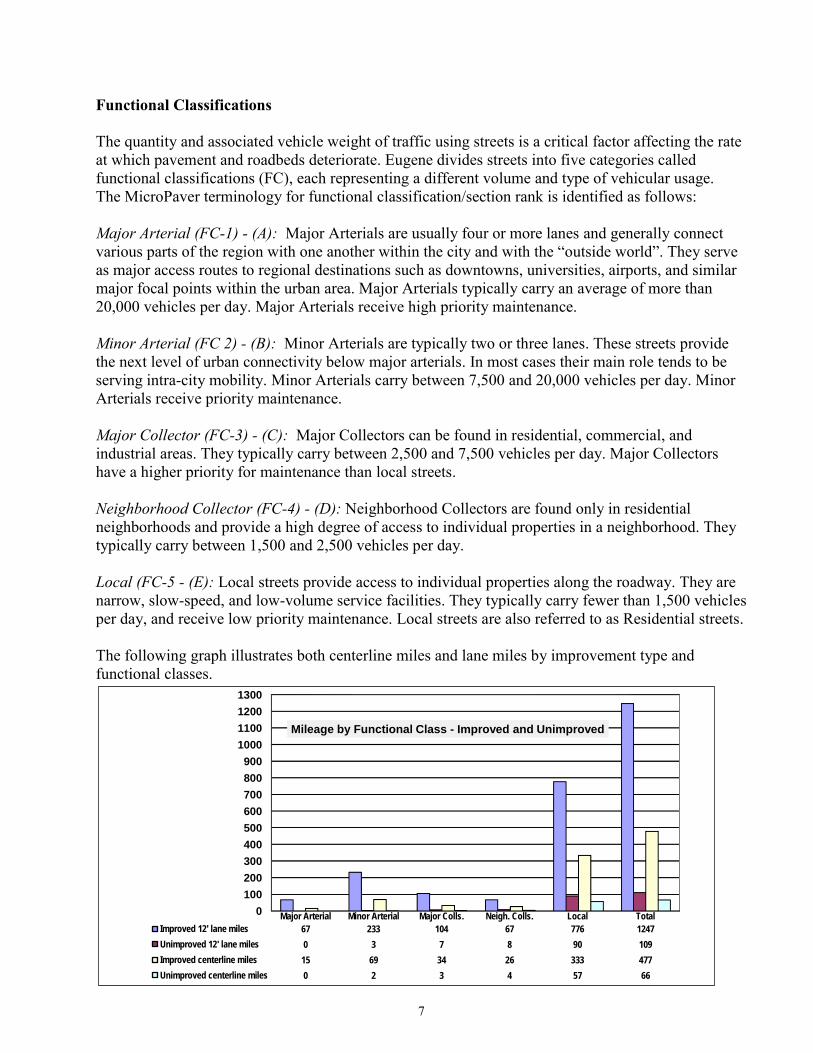
7
Functional Classifications The quantity and associated vehicle weight of traffic using streets is a critical factor affecting the rate at which pavement and roadbeds deteriorate. Eugene divides streets into five categories called functional classifications (FC), each representing a different volume and type of vehicular usage. The MicroPaver terminology for functional classification/section rank is identified as follows: Major Arterial (FC-1) - (A): Major Arterials are usually four or more lanes and generally connect various parts of the region with one another within the city and with the “outside world”. They serve as major access routes to regional destinations such as downtowns, universities, airports, and similar major focal points within the urban area. Major Arterials typically carry an average of more than 20,000 vehicles per day. Major Arterials receive high priority maintenance. Minor Arterial (FC 2) - (B): Minor Arterials are typically two or three lanes. These streets provide the next level of urban connectivity below major arterials. In most cases their main role tends to be serving intra-city mobility. Minor Arterials carry between 7,500 and 20,000 vehicles per day. Minor Arterials receive priority maintenance. Major Collector (FC-3) - (C): Major Collectors can be found in residential, commercial, and industrial areas. They typically carry between 2,500 and 7,500 vehicles per day. Major Collectors have a higher priority for maintenance than local streets. Neighborhood Collector (FC-4) - (D): Neighborhood Collectors are found only in residential neighborhoods and provide a high degree of access to individual properties in a neighborhood. They typically carry between 1,500 and 2,500 vehicles per day. Local (FC-5 - (E): Local streets provide access to individual properties along the roadway. They are narrow, slow-speed, and low-volume service facilities. They typically carry fewer than 1,500 vehicles per day, and receive low priority maintenance. Local streets are also referred to as Residential streets. The following graph illustrates both centerline miles and lane miles by improvement type and functional classes.
0100200300400500600700800900
1000110012001300
Major Arterial Minor Arterial Major Colls. Neigh. Colls. Local Total
Improved 12' lane miles 67 233 104 67 776 1247
Unimproved 12' lane miles 0 3 7 8 90 109
Improved centerline miles 15 69 34 26 333 477
Unimproved centerline miles 0 2 3 4 57 66
Mileage by Functional Class - Improved and Unimproved
8
PAVEMENT MANAGEMENT SYSTEM A Pavement Management System (PMS) performs analysis of collected rating data and reports on the current and projected conditions of the street system. In addition, it is used to evaluate the effectiveness of planning and funding priorities, and provides guidance in the decision making process. The goal of the decision making process is to prevent pavement failures through judicious maintenance. City of Eugene implemented MicroPaver in 2013. MicroPaver combines visual field inspection ratings, compiled under strict criteria, with computer tracking and condition analysis. Beginning in 2010 the rating methodology was revised to the WDOT’s Extended (WSEXT) method, collection of deterioration values by area, lineal footage thus keeping the program consistent with industry standards. This also allowed for smoother transition to MicroPaver with the ability to migrate three years of rating data with some modifications. With this migrated condition data, rating the entire asphalt street system the last three years plus construction history we are able to perform an analysis with rational accuracy to report financial needs and road conditions. There will be some variation in the outcomes of the analysis due to slight differences in rating and calculation methodology but overall the data is consistent. Pavement Inspection Frequency Two predominant work efforts required to maintain the PMS are updating the street inventory and performing the annual inspection of surface conditions. City streets are divided into segments based on their Functional Classification (FC), pavement type, and geometric design. Segments are the basic unit for evaluating streets and surface conditions. A segment is defined as a portion of a street with a beginning and ending description. Changes in geometric features are used as a guide for determining segments. Examples of geometric differences are surface type, segment width, surface age, and extent of past rehabilitations. Field inspections are conducted by pavement raters who walk each individual street segment evaluating the pavement surface for signs of distress. City arterial and collector streets are inspected annually; residential streets inspections are completed in a three-year cycle; and off-street shared-use path inspections are completed in a two-year cycle. Staff performed inspections on the entire street system using MicroPaver for the first three years after implementation 2013-2015. Inspection data was evaluated for accuracy with the assistance from an outside consultant in 2014. It was determined that three years of street inspection provided an accurate baseline in MicroPaver for analysis. In 2015 staff completed inspections of shared-use paths. In 2016, staff returned to the standard inspection cycle inspecting arterial and collector streets plus two residential areas, South Hills and Coburg. Staff managed to inspect all concrete residential streets as well as alleys.
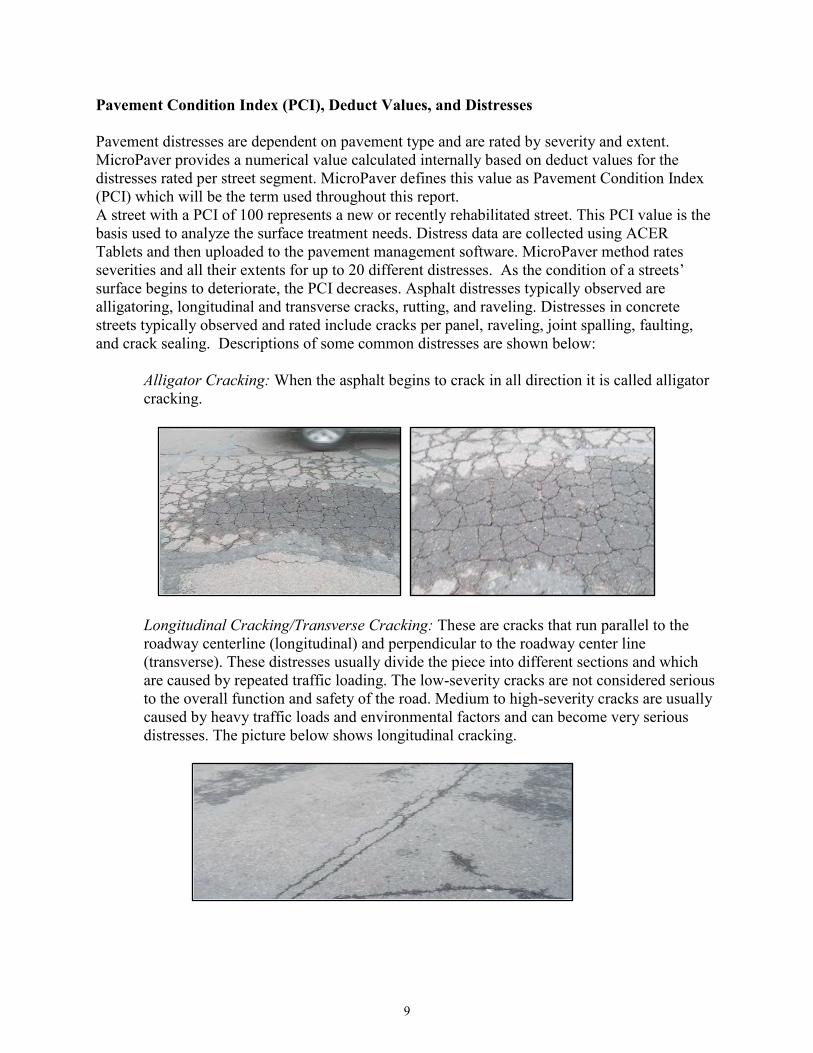
9
Pavement Condition Index (PCI), Deduct Values, and Distresses Pavement distresses are dependent on pavement type and are rated by severity and extent. MicroPaver provides a numerical value calculated internally based on deduct values for the distresses rated per street segment. MicroPaver defines this value as Pavement Condition Index (PCI) which will be the term used throughout this report. A street with a PCI of 100 represents a new or recently rehabilitated street. This PCI value is the basis used to analyze the surface treatment needs. Distress data are collected using ACER Tablets and then uploaded to the pavement management software. MicroPaver method rates severities and all their extents for up to 20 different distresses. As the condition of a streets’ surface begins to deteriorate, the PCI decreases. Asphalt distresses typically observed are alligatoring, longitudinal and transverse cracks, rutting, and raveling. Distresses in concrete streets typically observed and rated include cracks per panel, raveling, joint spalling, faulting, and crack sealing. Descriptions of some common distresses are shown below:
Alligator Cracking: When the asphalt begins to crack in all direction it is called alligator cracking.
Longitudinal Cracking/Transverse Cracking: These are cracks that run parallel to the roadway centerline (longitudinal) and perpendicular to the roadway center line (transverse). These distresses usually divide the piece into different sections and which are caused by repeated traffic loading. The low-severity cracks are not considered serious to the overall function and safety of the road. Medium to high-severity cracks are usually caused by heavy traffic loads and environmental factors and can become very serious distresses. The picture below shows longitudinal cracking.
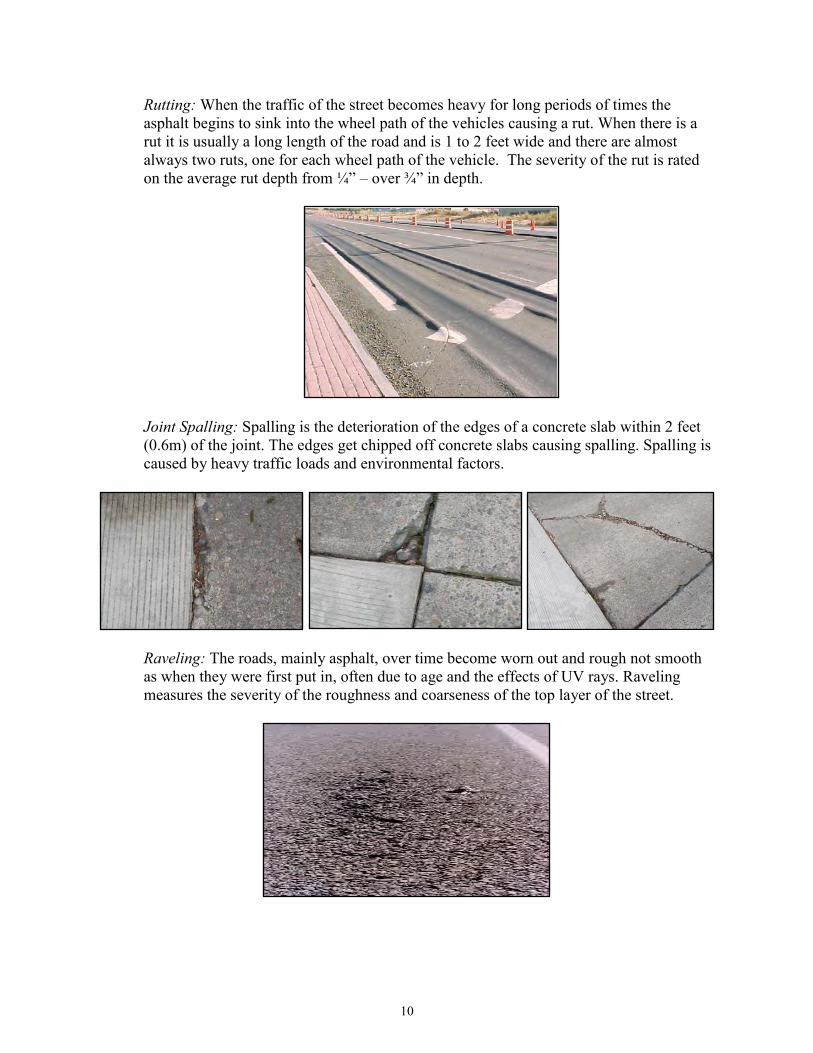
10
Rutting: When the traffic of the street becomes heavy for long periods of times the asphalt begins to sink into the wheel path of the vehicles causing a rut. When there is a rut it is usually a long length of the road and is 1 to 2 feet wide and there are almost always two ruts, one for each wheel path of the vehicle. The severity of the rut is rated on the average rut depth from ¼” – over ¾” in depth.
Joint Spalling: Spalling is the deterioration of the edges of a concrete slab within 2 feet (0.6m) of the joint. The edges get chipped off concrete slabs causing spalling. Spalling is caused by heavy traffic loads and environmental factors.
Raveling: The roads, mainly asphalt, over time become worn out and rough not smooth as when they were first put in, often due to age and the effects of UV rays. Raveling measures the severity of the roughness and coarseness of the top layer of the street.
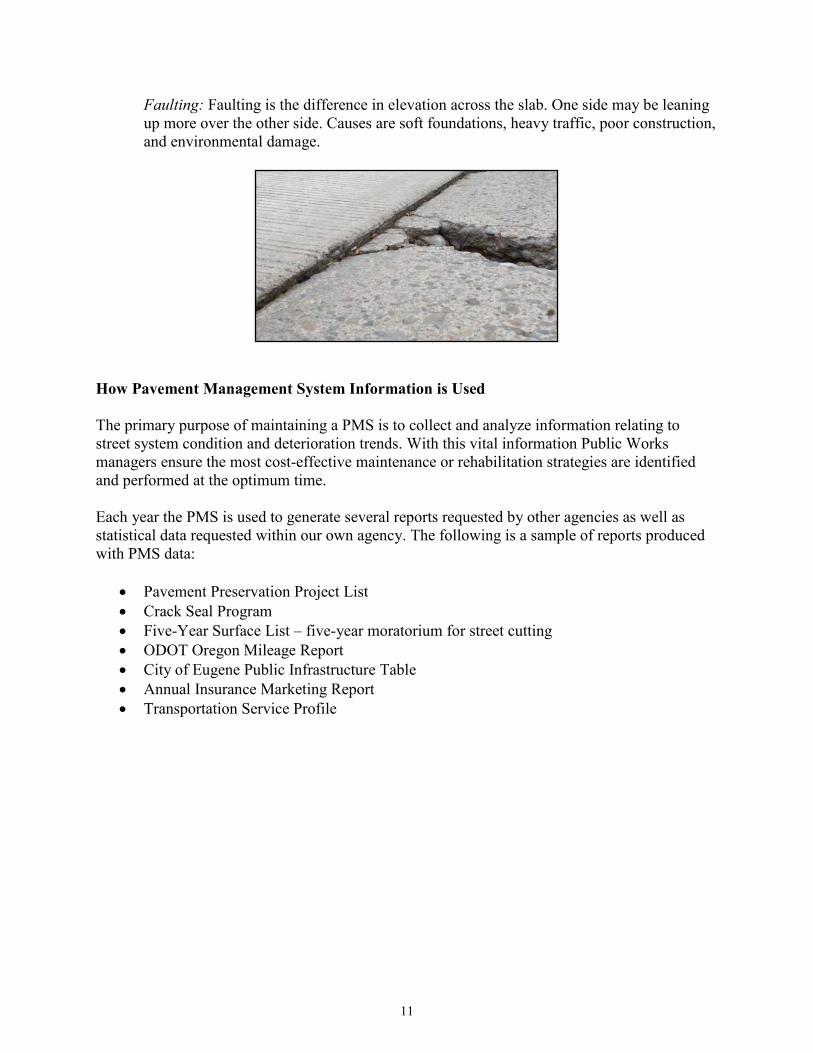
11
Faulting: Faulting is the difference in elevation across the slab. One side may be leaning up more over the other side. Causes are soft foundations, heavy traffic, poor construction, and environmental damage.
How Pavement Management System Information is Used The primary purpose of maintaining a PMS is to collect and analyze information relating to street system condition and deterioration trends. With this vital information Public Works managers ensure the most cost-effective maintenance or rehabilitation strategies are identified and performed at the optimum time. Each year the PMS is used to generate several reports requested by other agencies as well as statistical data requested within our own agency. The following is a sample of reports produced with PMS data:
Pavement Preservation Project List Crack Seal Program Five-Year Surface List – five-year moratorium for street cutting ODOT Oregon Mileage Report City of Eugene Public Infrastructure Table Annual Insurance Marketing Report Transportation Service Profile
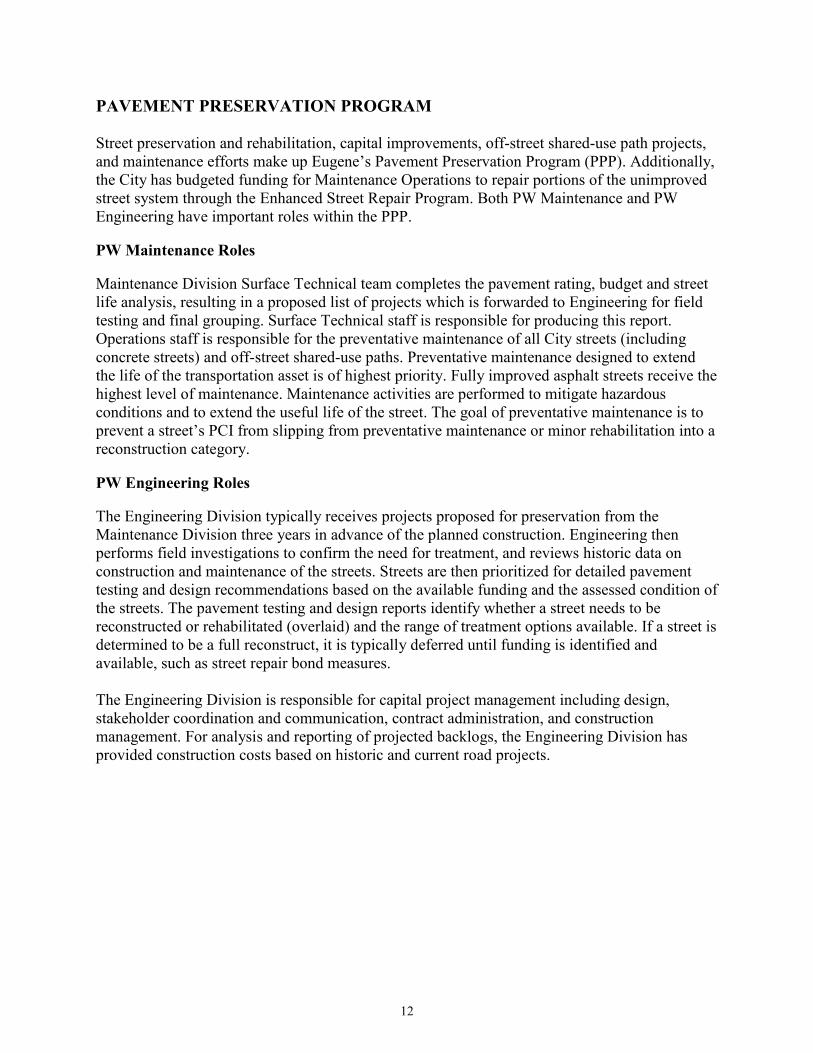
12
PAVEMENT PRESERVATION PROGRAM Street preservation and rehabilitation, capital improvements, off-street shared-use path projects, and maintenance efforts make up Eugene’s Pavement Preservation Program (PPP). Additionally, the City has budgeted funding for Maintenance Operations to repair portions of the unimproved street system through the Enhanced Street Repair Program. Both PW Maintenance and PW Engineering have important roles within the PPP. PW Maintenance Roles Maintenance Division Surface Technical team completes the pavement rating, budget and street life analysis, resulting in a proposed list of projects which is forwarded to Engineering for field testing and final grouping. Surface Technical staff is responsible for producing this report. Operations staff is responsible for the preventative maintenance of all City streets (including concrete streets) and off-street shared-use paths. Preventative maintenance designed to extend the life of the transportation asset is of highest priority. Fully improved asphalt streets receive the highest level of maintenance. Maintenance activities are performed to mitigate hazardous conditions and to extend the useful life of the street. The goal of preventative maintenance is to prevent a street’s PCI from slipping from preventative maintenance or minor rehabilitation into a reconstruction category. PW Engineering Roles The Engineering Division typically receives projects proposed for preservation from the Maintenance Division three years in advance of the planned construction. Engineering then performs field investigations to confirm the need for treatment, and reviews historic data on construction and maintenance of the streets. Streets are then prioritized for detailed pavement testing and design recommendations based on the available funding and the assessed condition of the streets. The pavement testing and design reports identify whether a street needs to be reconstructed or rehabilitated (overlaid) and the range of treatment options available. If a street is determined to be a full reconstruct, it is typically deferred until funding is identified and available, such as street repair bond measures. The Engineering Division is responsible for capital project management including design, stakeholder coordination and communication, contract administration, and construction management. For analysis and reporting of projected backlogs, the Engineering Division has provided construction costs based on historic and current road projects.
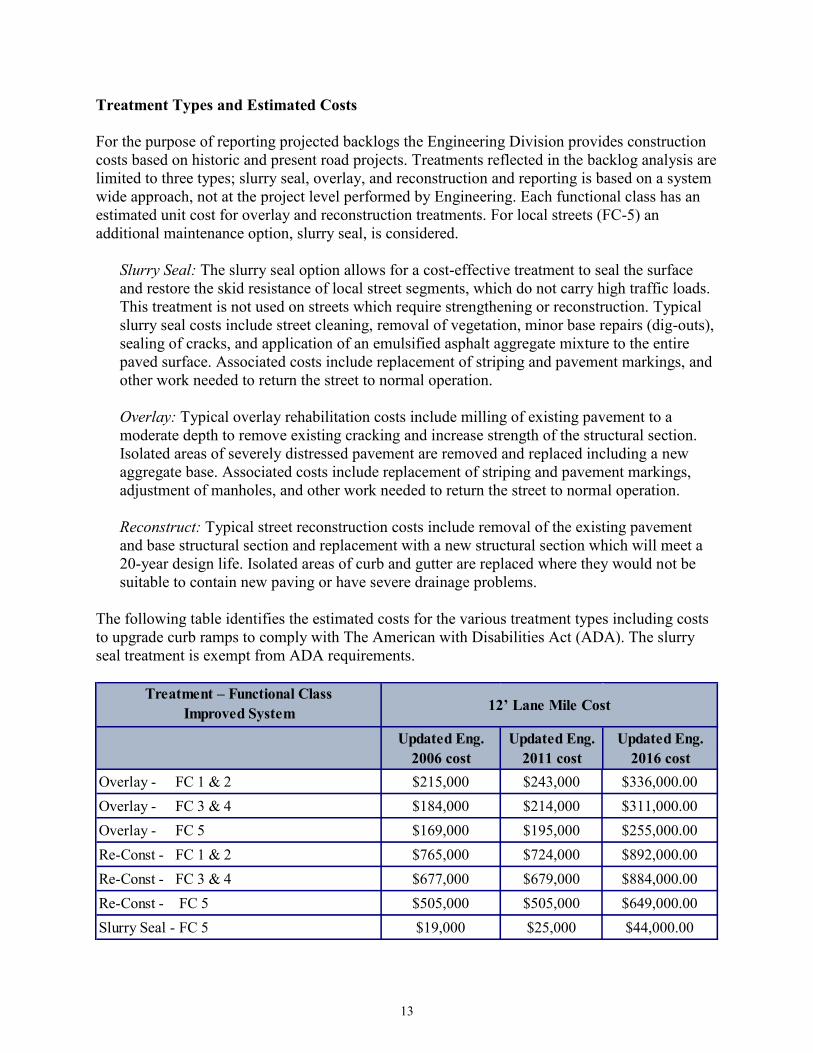
13
Treatment Types and Estimated Costs For the purpose of reporting projected backlogs the Engineering Division provides construction costs based on historic and present road projects. Treatments reflected in the backlog analysis are limited to three types; slurry seal, overlay, and reconstruction and reporting is based on a system wide approach, not at the project level performed by Engineering. Each functional class has an estimated unit cost for overlay and reconstruction treatments. For local streets (FC-5) an additional maintenance option, slurry seal, is considered.
Slurry Seal: The slurry seal option allows for a cost-effective treatment to seal the surface and restore the skid resistance of local street segments, which do not carry high traffic loads. This treatment is not used on streets which require strengthening or reconstruction. Typical slurry seal costs include street cleaning, removal of vegetation, minor base repairs (dig-outs), sealing of cracks, and application of an emulsified asphalt aggregate mixture to the entire paved surface. Associated costs include replacement of striping and pavement markings, and other work needed to return the street to normal operation.
Overlay: Typical overlay rehabilitation costs include milling of existing pavement to a moderate depth to remove existing cracking and increase strength of the structural section. Isolated areas of severely distressed pavement are removed and replaced including a new aggregate base. Associated costs include replacement of striping and pavement markings, adjustment of manholes, and other work needed to return the street to normal operation. Reconstruct: Typical street reconstruction costs include removal of the existing pavement and base structural section and replacement with a new structural section which will meet a 20-year design life. Isolated areas of curb and gutter are replaced where they would not be suitable to contain new paving or have severe drainage problems.
The following table identifies the estimated costs for the various treatment types including costs to upgrade curb ramps to comply with The American with Disabilities Act (ADA). The slurry seal treatment is exempt from ADA requirements.
Treatment – Functional Class Improved System
Re-Const - FC 5 $505,000 $505,000 $649,000.00 Slurry Seal - FC 5 $19,000 $25,000 $44,000.00
Re-Const - FC 1 & 2 $765,000 $724,000 $892,000.00 Re-Const - FC 3 & 4 $677,000 $679,000 $884,000.00
Overlay - FC 3 & 4 $184,000 $214,000 $311,000.00 Overlay - FC 5 $169,000 $195,000 $255,000.00
12’ Lane Mile Cost
Updated Eng. 2011 cost
Updated Eng. 2016 cost
Overlay - FC 1 & 2 $215,000 $243,000 $336,000.00
Updated Eng. 2006 cost
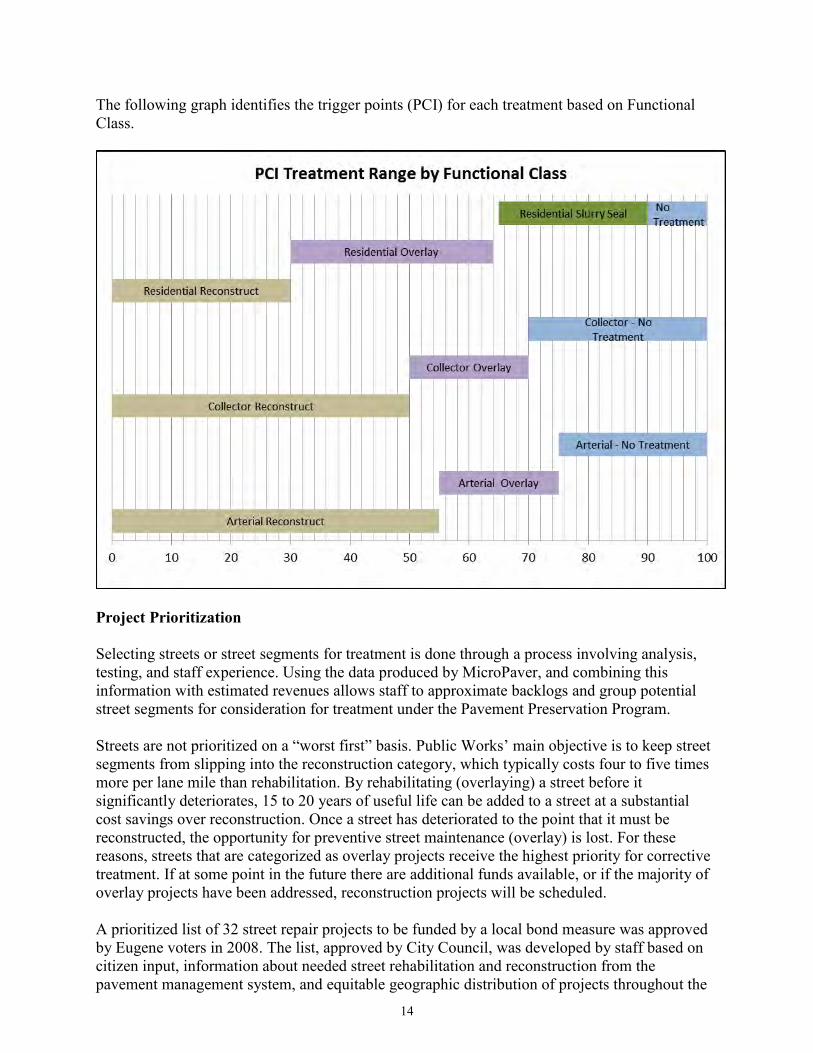
14
The following graph identifies the trigger points (PCI) for each treatment based on Functional Class.
Project Prioritization Selecting streets or street segments for treatment is done through a process involving analysis, testing, and staff experience. Using the data produced by MicroPaver, and combining this information with estimated revenues allows staff to approximate backlogs and group potential street segments for consideration for treatment under the Pavement Preservation Program.
Streets are not prioritized on a “worst first” basis. Public Works’ main objective is to keep street segments from slipping into the reconstruction category, which typically costs four to five times more per lane mile than rehabilitation. By rehabilitating (overlaying) a street before it significantly deteriorates, 15 to 20 years of useful life can be added to a street at a substantial cost savings over reconstruction. Once a street has deteriorated to the point that it must be reconstructed, the opportunity for preventive street maintenance (overlay) is lost. For these reasons, streets that are categorized as overlay projects receive the highest priority for corrective treatment. If at some point in the future there are additional funds available, or if the majority of overlay projects have been addressed, reconstruction projects will be scheduled. A prioritized list of 32 street repair projects to be funded by a local bond measure was approved by Eugene voters in 2008. The list, approved by City Council, was developed by staff based on citizen input, information about needed street rehabilitation and reconstruction from the pavement management system, and equitable geographic distribution of projects throughout the
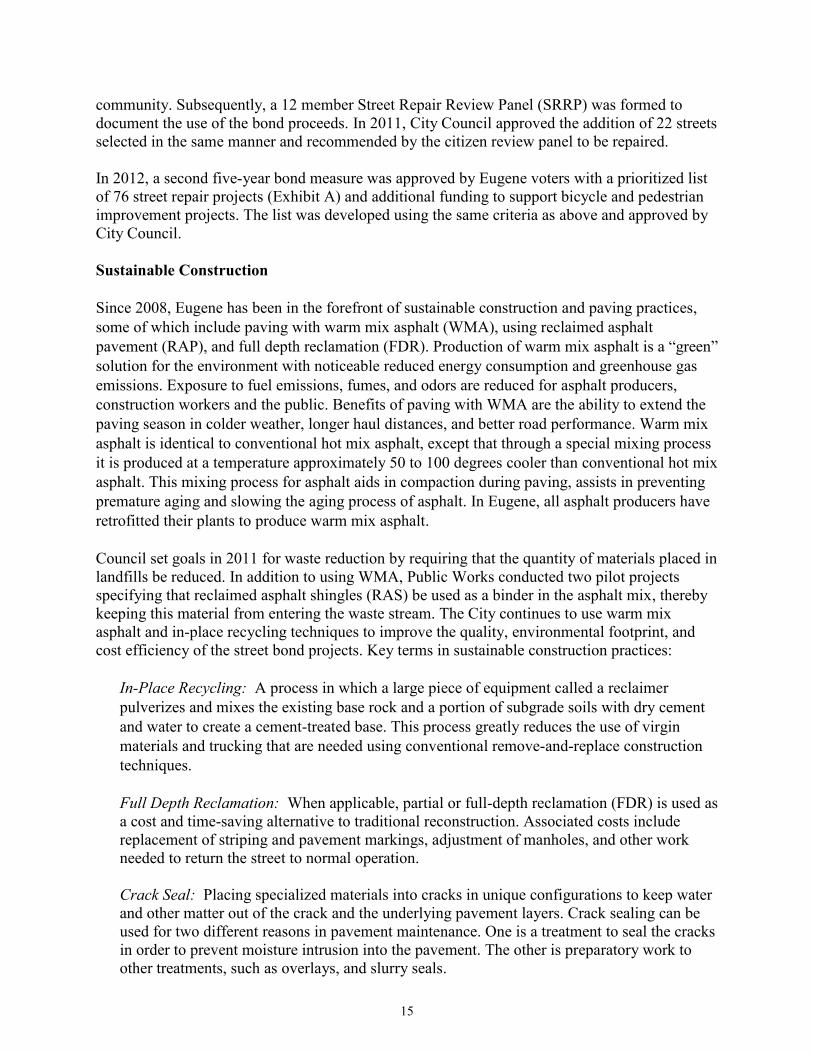
15
community. Subsequently, a 12 member Street Repair Review Panel (SRRP) was formed to document the use of the bond proceeds. In 2011, City Council approved the addition of 22 streets selected in the same manner and recommended by the citizen review panel to be repaired. In 2012, a second five-year bond measure was approved by Eugene voters with a prioritized list of 76 street repair projects (Exhibit A) and additional funding to support bicycle and pedestrian improvement projects. The list was developed using the same criteria as above and approved by City Council. Sustainable Construction Since 2008, Eugene has been in the forefront of sustainable construction and paving practices, some of which include paving with warm mix asphalt (WMA), using reclaimed asphalt pavement (RAP), and full depth reclamation (FDR). Production of warm mix asphalt is a “green” solution for the environment with noticeable reduced energy consumption and greenhouse gas emissions. Exposure to fuel emissions, fumes, and odors are reduced for asphalt producers, construction workers and the public. Benefits of paving with WMA are the ability to extend the paving season in colder weather, longer haul distances, and better road performance. Warm mix asphalt is identical to conventional hot mix asphalt, except that through a special mixing process it is produced at a temperature approximately 50 to 100 degrees cooler than conventional hot mix asphalt. This mixing process for asphalt aids in compaction during paving, assists in preventing premature aging and slowing the aging process of asphalt. In Eugene, all asphalt producers have retrofitted their plants to produce warm mix asphalt. Council set goals in 2011 for waste reduction by requiring that the quantity of materials placed in landfills be reduced. In addition to using WMA, Public Works conducted two pilot projects specifying that reclaimed asphalt shingles (RAS) be used as a binder in the asphalt mix, thereby keeping this material from entering the waste stream. The City continues to use warm mix asphalt and in-place recycling techniques to improve the quality, environmental footprint, and cost efficiency of the street bond projects. Key terms in sustainable construction practices:
In-Place Recycling: A process in which a large piece of equipment called a reclaimer pulverizes and mixes the existing base rock and a portion of subgrade soils with dry cement and water to create a cement-treated base. This process greatly reduces the use of virgin materials and trucking that are needed using conventional remove-and-replace construction techniques.
Full Depth Reclamation: When applicable, partial or full-depth reclamation (FDR) is used as a cost and time-saving alternative to traditional reconstruction. Associated costs include replacement of striping and pavement markings, adjustment of manholes, and other work needed to return the street to normal operation. Crack Seal: Placing specialized materials into cracks in unique configurations to keep water and other matter out of the crack and the underlying pavement layers. Crack sealing can be used for two different reasons in pavement maintenance. One is a treatment to seal the cracks in order to prevent moisture intrusion into the pavement. The other is preparatory work to other treatments, such as overlays, and slurry seals.
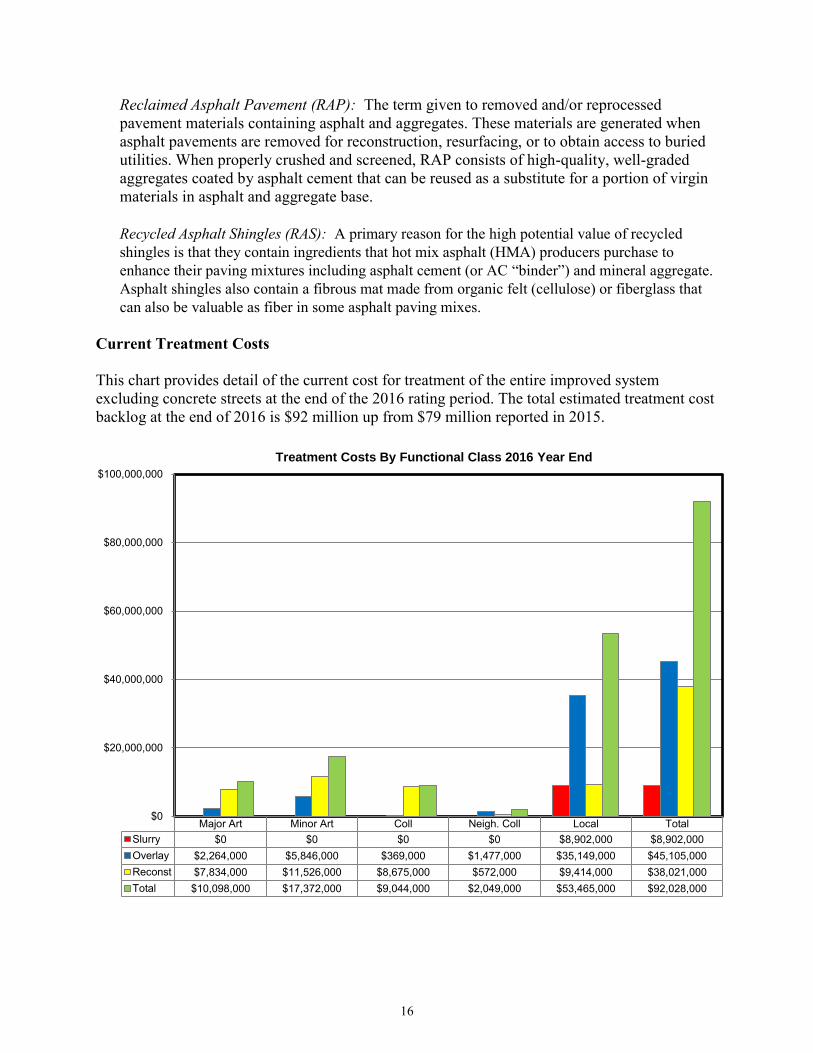
16
Reclaimed Asphalt Pavement (RAP): The term given to removed and/or reprocessed pavement materials containing asphalt and aggregates. These materials are generated when asphalt pavements are removed for reconstruction, resurfacing, or to obtain access to buried utilities. When properly crushed and screened, RAP consists of high-quality, well-graded aggregates coated by asphalt cement that can be reused as a substitute for a portion of virgin materials in asphalt and aggregate base.
Recycled Asphalt Shingles (RAS): A primary reason for the high potential value of recycled shingles is that they contain ingredients that hot mix asphalt (HMA) producers purchase to enhance their paving mixtures including asphalt cement (or AC “binder”) and mineral aggregate. Asphalt shingles also contain a fibrous mat made from organic felt (cellulose) or fiberglass that can also be valuable as fiber in some asphalt paving mixes.
Current Treatment Costs This chart provides detail of the current cost for treatment of the entire improved system excluding concrete streets at the end of the 2016 rating period. The total estimated treatment cost backlog at the end of 2016 is $92 million up from $79 million reported in 2015.
Major Art Minor Art Coll Neigh. Coll Local TotalSlurry $0 $0 $0 $0 $8,902,000 $8,902,000Overlay $2,264,000 $5,846,000 $369,000 $1,477,000 $35,149,000 $45,105,000Reconst $7,834,000 $11,526,000 $8,675,000 $572,000 $9,414,000 $38,021,000Total $10,098,000 $17,372,000 $9,044,000 $2,049,000 $53,465,000 $92,028,000
$0
$20,000,000
$40,000,000
$60,000,000
$80,000,000
$100,000,000Treatment Costs By Functional Class 2016 Year End
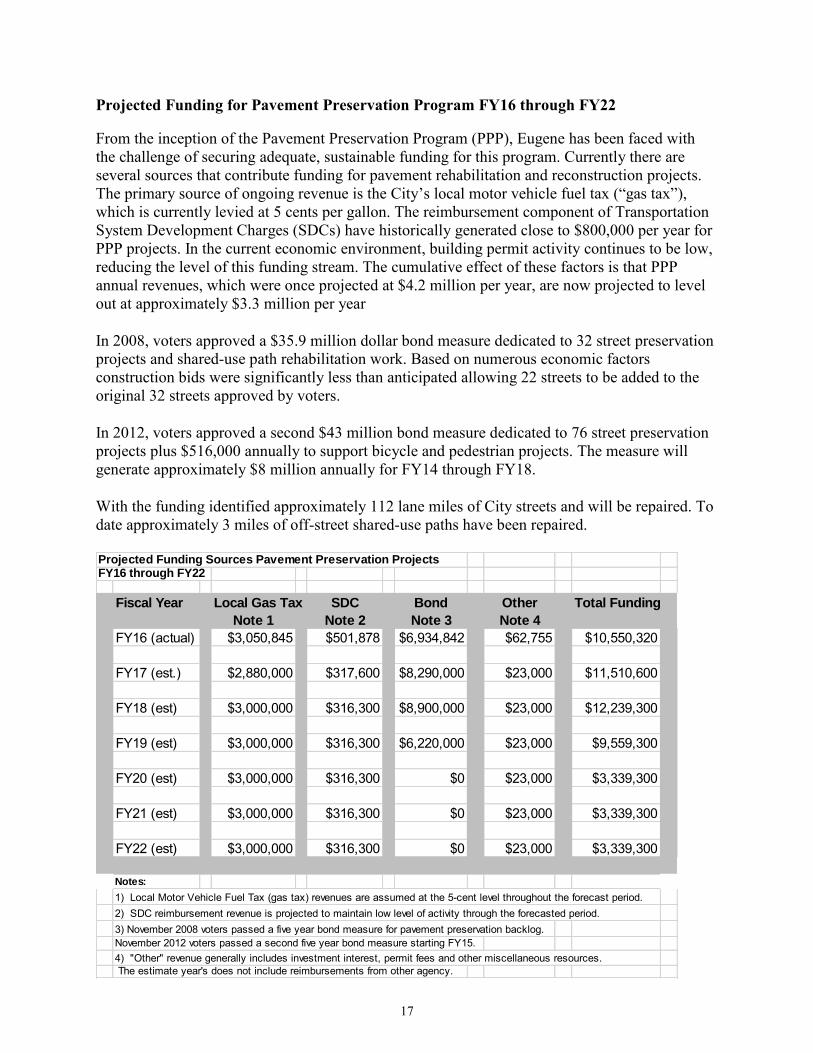
17
Projected Funding for Pavement Preservation Program FY16 through FY22 From the inception of the Pavement Preservation Program (PPP), Eugene has been faced with the challenge of securing adequate, sustainable funding for this program. Currently there are several sources that contribute funding for pavement rehabilitation and reconstruction projects. The primary source of ongoing revenue is the City’s local motor vehicle fuel tax (“gas tax”), which is currently levied at 5 cents per gallon. The reimbursement component of Transportation System Development Charges (SDCs) have historically generated close to $800,000 per year for PPP projects. In the current economic environment, building permit activity continues to be low, reducing the level of this funding stream. The cumulative effect of these factors is that PPP annual revenues, which were once projected at $4.2 million per year, are now projected to level out at approximately $3.3 million per year
In 2008, voters approved a $35.9 million dollar bond measure dedicated to 32 street preservation projects and shared-use path rehabilitation work. Based on numerous economic factors construction bids were significantly less than anticipated allowing 22 streets to be added to the original 32 streets approved by voters.
In 2012, voters approved a second $43 million bond measure dedicated to 76 street preservation projects plus $516,000 annually to support bicycle and pedestrian projects. The measure will generate approximately $8 million annually for FY14 through FY18.
With the funding identified approximately 112 lane miles of City streets and will be repaired. To date approximately 3 miles of off-street shared-use paths have been repaired.
Projected Funding Sources Pavement Preservation ProjectsFY16 through FY22
Fiscal Year Local Gas Tax SDC Bond Other Total FundingNote 1 Note 2 Note 3 Note 4
FY16 (actual) $3,050,845 $501,878 $6,934,842 $62,755 $10,550,320
FY17 (est.) $2,880,000 $317,600 $8,290,000 $23,000 $11,510,600
FY18 (est) $3,000,000 $316,300 $8,900,000 $23,000 $12,239,300
FY19 (est) $3,000,000 $316,300 $6,220,000 $23,000 $9,559,300
FY20 (est) $3,000,000 $316,300 $0 $23,000 $3,339,300
FY21 (est) $3,000,000 $316,300 $0 $23,000 $3,339,300
FY22 (est) $3,000,000 $316,300 $0 $23,000 $3,339,300
Notes:1) Local Motor Vehicle Fuel Tax (gas tax) revenues are assumed at the 5-cent level throughout the forecast period.2) SDC reimbursement revenue is projected to maintain low level of activity through the forecasted period.3) November 2008 voters passed a five year bond measure for pavement preservation backlog. November 2012 voters passed a second five year bond measure starting FY15.4) "Other" revenue generally includes investment interest, permit fees and other miscellaneous resources. The estimate year's does not include reimbursements from other agency.
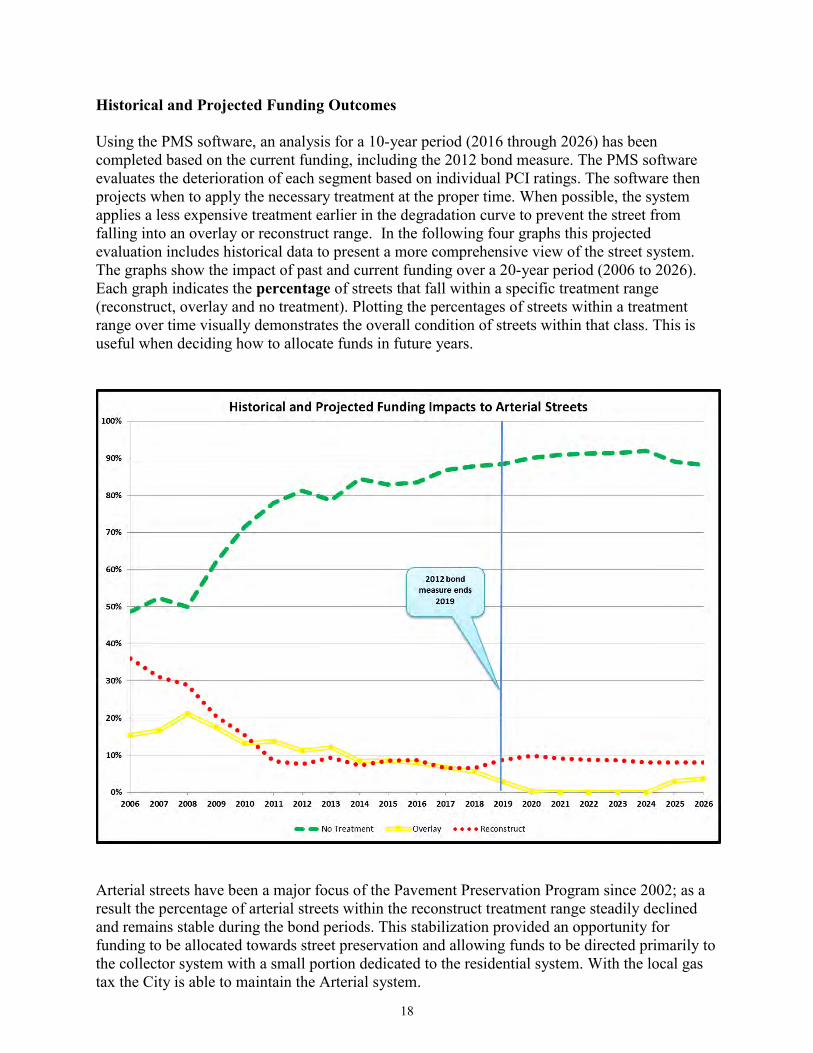
18
Historical and Projected Funding Outcomes Using the PMS software, an analysis for a 10-year period (2016 through 2026) has been completed based on the current funding, including the 2012 bond measure. The PMS software evaluates the deterioration of each segment based on individual PCI ratings. The software then projects when to apply the necessary treatment at the proper time. When possible, the system applies a less expensive treatment earlier in the degradation curve to prevent the street from falling into an overlay or reconstruct range. In the following four graphs this projected evaluation includes historical data to present a more comprehensive view of the street system. The graphs show the impact of past and current funding over a 20-year period (2006 to 2026). Each graph indicates the percentage of streets that fall within a specific treatment range (reconstruct, overlay and no treatment). Plotting the percentages of streets within a treatment range over time visually demonstrates the overall condition of streets within that class. This is useful when deciding how to allocate funds in future years.
Arterial streets have been a major focus of the Pavement Preservation Program since 2002; as a result the percentage of arterial streets within the reconstruct treatment range steadily declined and remains stable during the bond periods. This stabilization provided an opportunity for funding to be allocated towards street preservation and allowing funds to be directed primarily to the collector system with a small portion dedicated to the residential system. With the local gas tax the City is able to maintain the Arterial system.
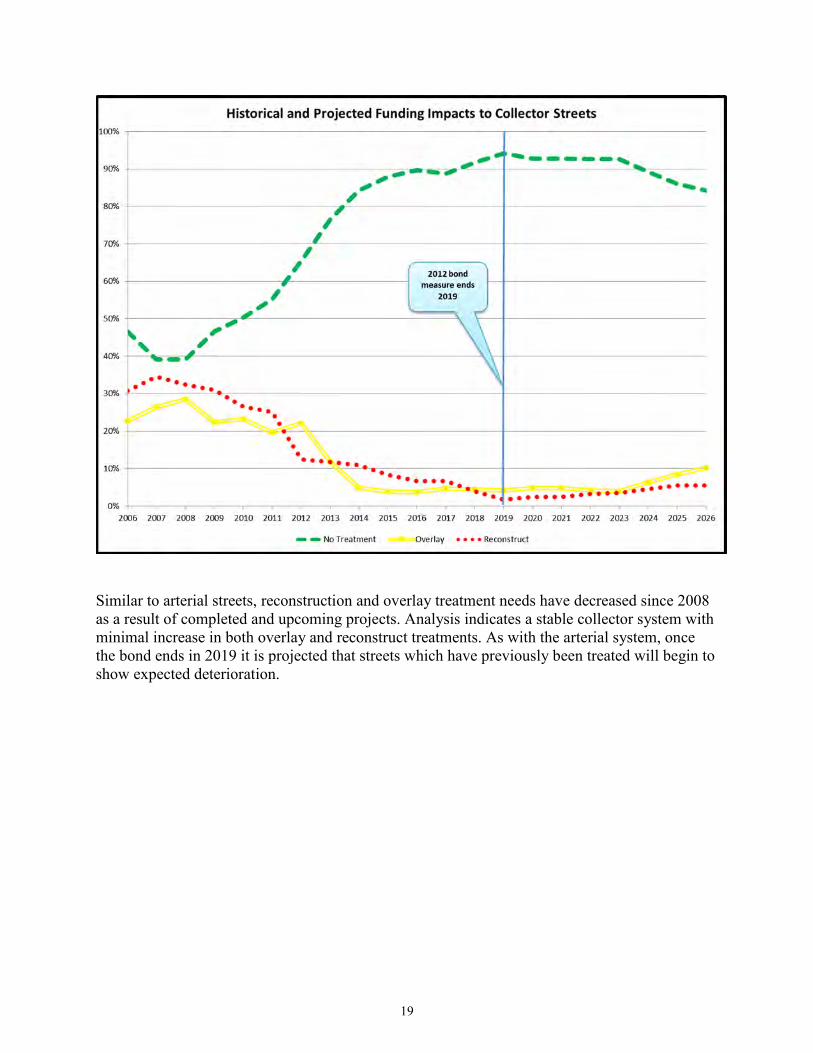
19
Similar to arterial streets, reconstruction and overlay treatment needs have decreased since 2008 as a result of completed and upcoming projects. Analysis indicates a stable collector system with minimal increase in both overlay and reconstruct treatments. As with the arterial system, once the bond ends in 2019 it is projected that streets which have previously been treated will begin to show expected deterioration.
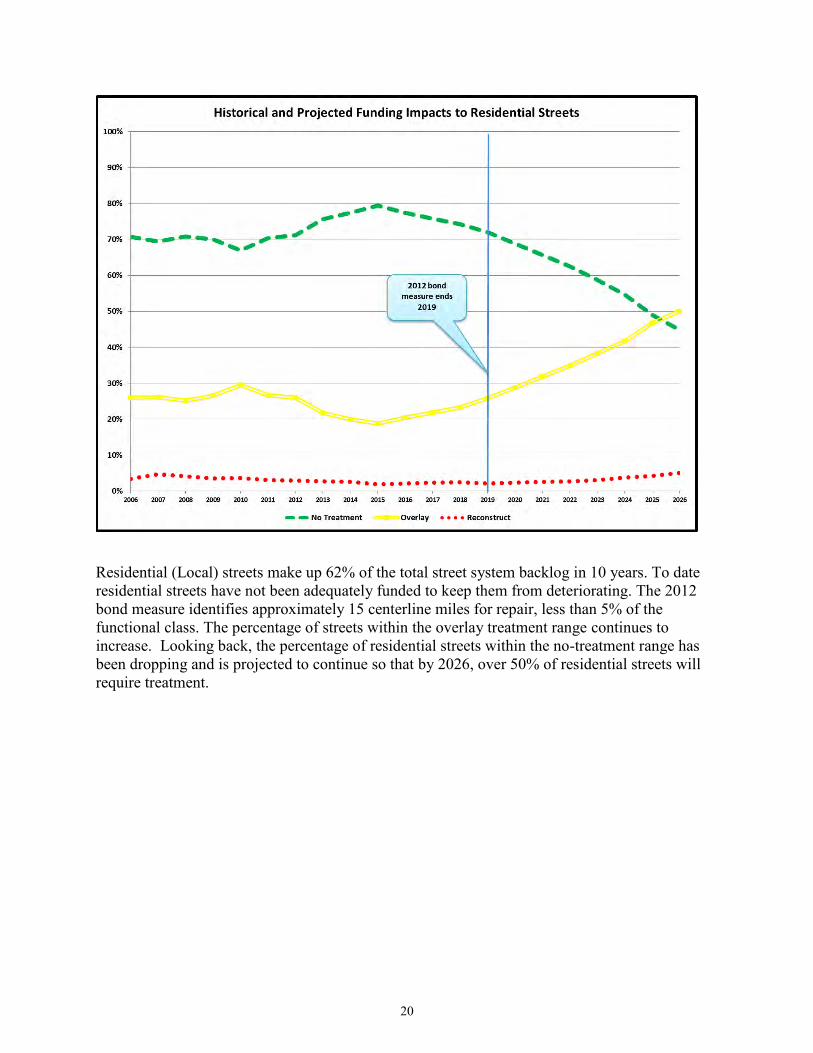
20
Residential (Local) streets make up 62% of the total street system backlog in 10 years. To date residential streets have not been adequately funded to keep them from deteriorating. The 2012 bond measure identifies approximately 15 centerline miles for repair, less than 5% of the functional class. The percentage of streets within the overlay treatment range continues to increase. Looking back, the percentage of residential streets within the no-treatment range has been dropping and is projected to continue so that by 2026, over 50% of residential streets will require treatment.
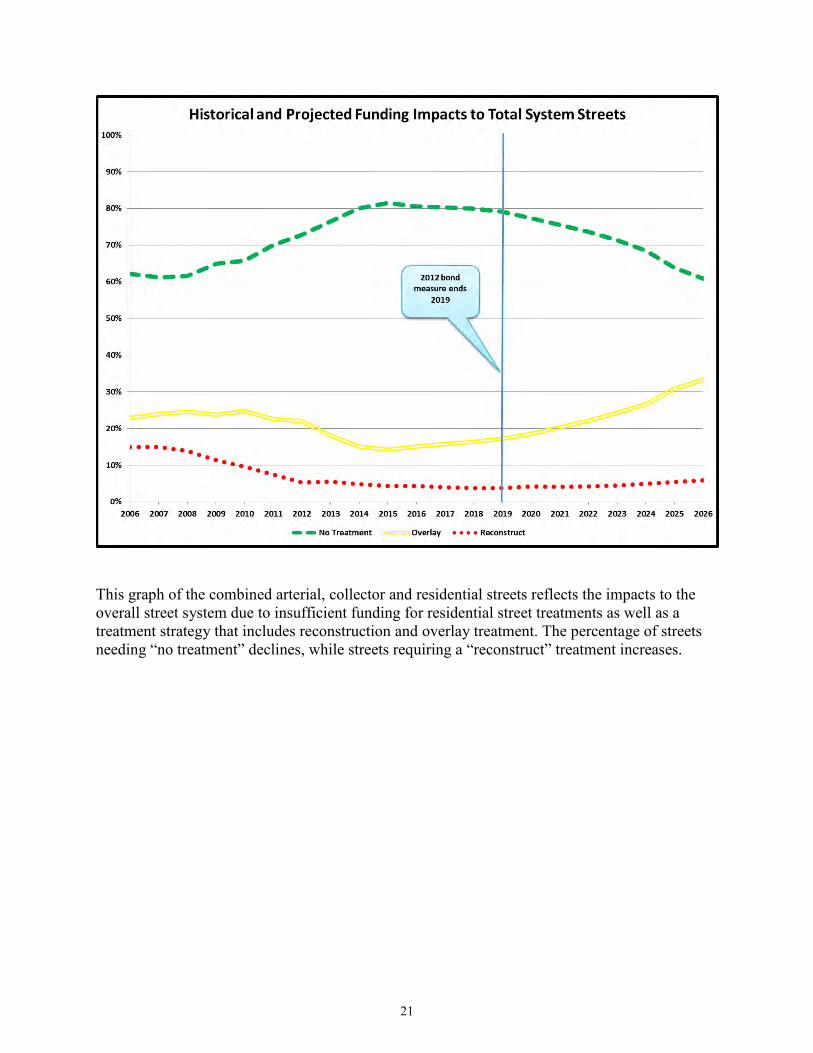
21
This graph of the combined arterial, collector and residential streets reflects the impacts to the overall street system due to insufficient funding for residential street treatments as well as a treatment strategy that includes reconstruction and overlay treatment. The percentage of streets needing “no treatment” declines, while streets requiring a “reconstruct” treatment increases.
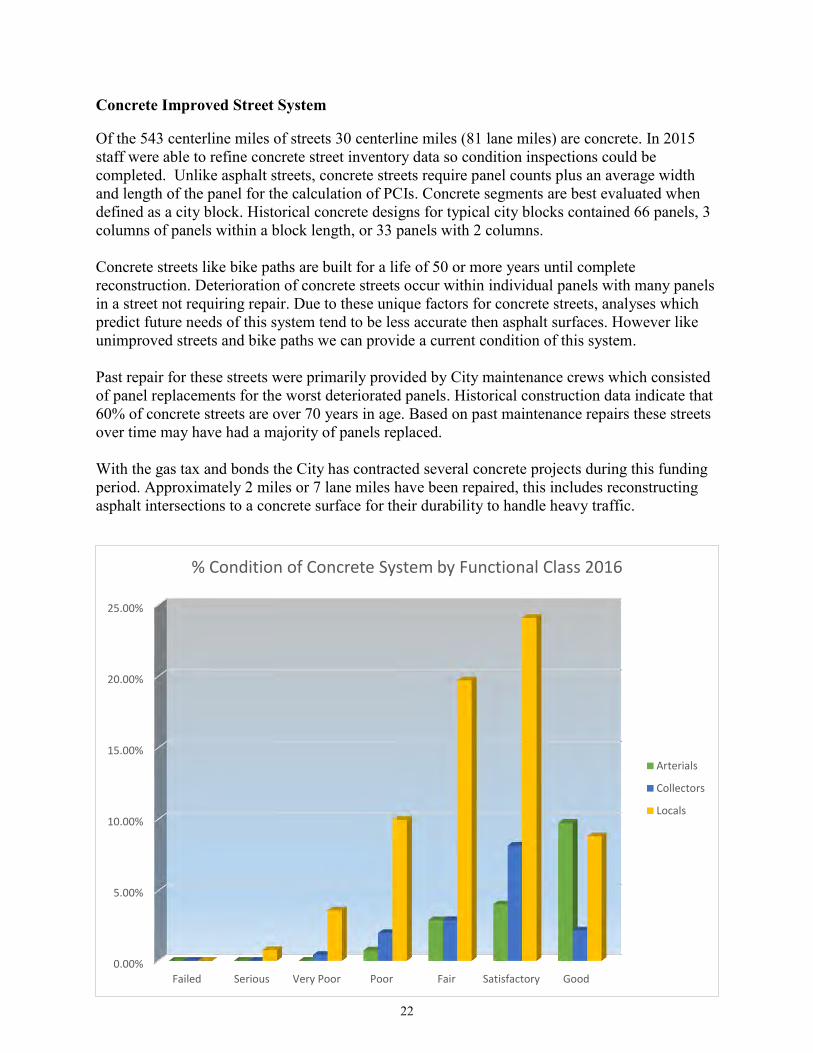
22
Concrete Improved Street System Of the 543 centerline miles of streets 30 centerline miles (81 lane miles) are concrete. In 2015 staff were able to refine concrete street inventory data so condition inspections could be completed. Unlike asphalt streets, concrete streets require panel counts plus an average width and length of the panel for the calculation of PCIs. Concrete segments are best evaluated when defined as a city block. Historical concrete designs for typical city blocks contained 66 panels, 3 columns of panels within a block length, or 33 panels with 2 columns. Concrete streets like bike paths are built for a life of 50 or more years until complete reconstruction. Deterioration of concrete streets occur within individual panels with many panels in a street not requiring repair. Due to these unique factors for concrete streets, analyses which predict future needs of this system tend to be less accurate then asphalt surfaces. However like unimproved streets and bike paths we can provide a current condition of this system. Past repair for these streets were primarily provided by City maintenance crews which consisted of panel replacements for the worst deteriorated panels. Historical construction data indicate that 60% of concrete streets are over 70 years in age. Based on past maintenance repairs these streets over time may have had a majority of panels replaced. With the gas tax and bonds the City has contracted several concrete projects during this funding period. Approximately 2 miles or 7 lane miles have been repaired, this includes reconstructing asphalt intersections to a concrete surface for their durability to handle heavy traffic.
0.00%
5.00%
10.00%
15.00%
20.00%
25.00%
Failed Serious Very Poor Poor Fair Satisfactory Good
% Condition of Concrete System by Functional Class 2016
Arterials
Collectors
Locals
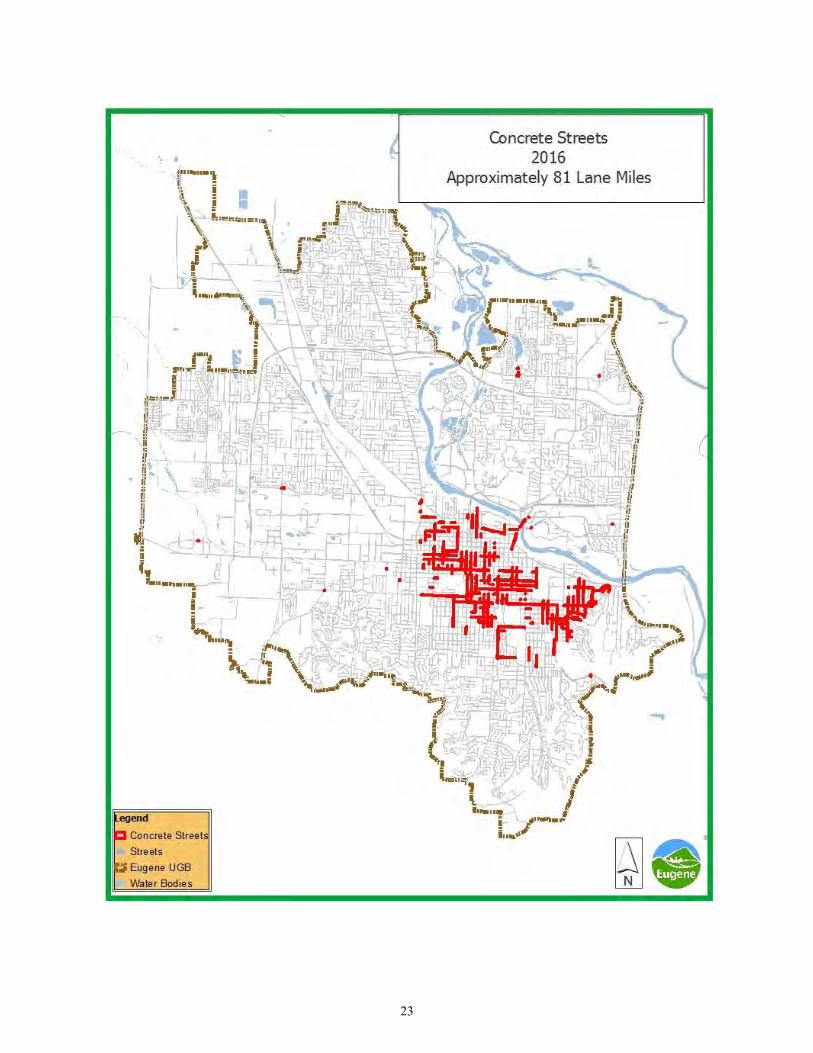
23
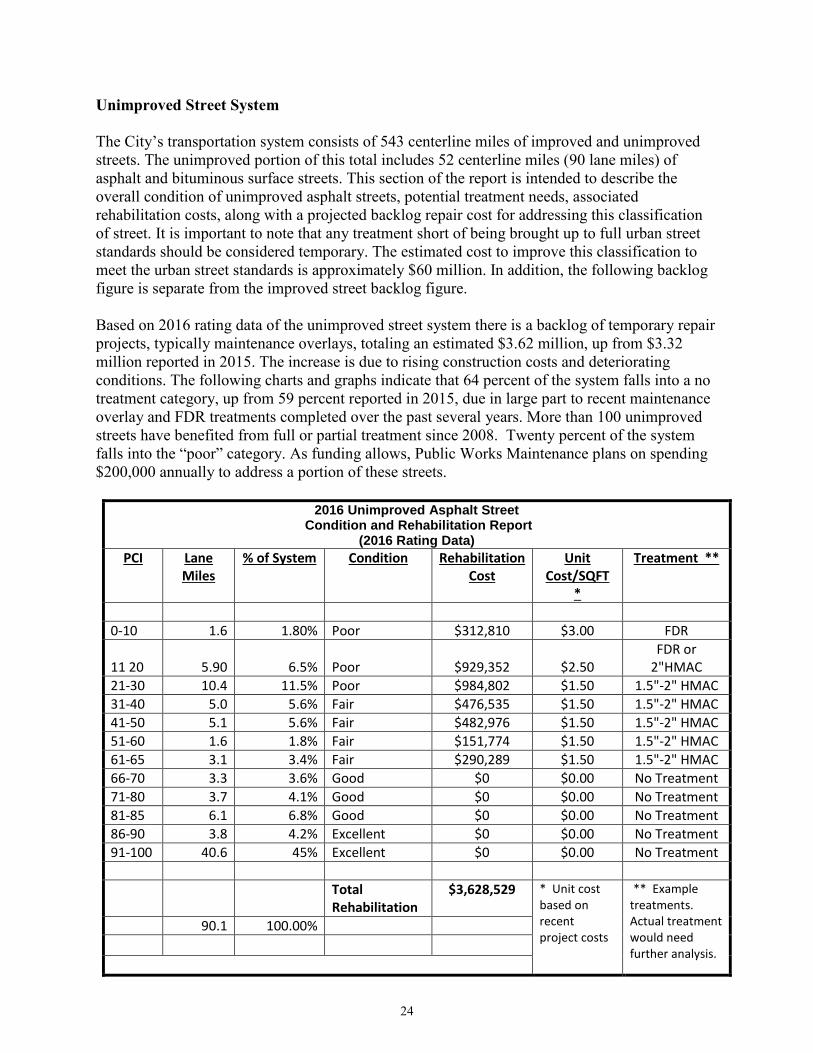
24
Unimproved Street System The City’s transportation system consists of 543 centerline miles of improved and unimproved streets. The unimproved portion of this total includes 52 centerline miles (90 lane miles) of asphalt and bituminous surface streets. This section of the report is intended to describe the overall condition of unimproved asphalt streets, potential treatment needs, associated rehabilitation costs, along with a projected backlog repair cost for addressing this classification of street. It is important to note that any treatment short of being brought up to full urban street standards should be considered temporary. The estimated cost to improve this classification to meet the urban street standards is approximately $60 million. In addition, the following backlog figure is separate from the improved street backlog figure. Based on 2016 rating data of the unimproved street system there is a backlog of temporary repair projects, typically maintenance overlays, totaling an estimated $3.62 million, up from $3.32 million reported in 2015. The increase is due to rising construction costs and deteriorating conditions. The following charts and graphs indicate that 64 percent of the system falls into a no treatment category, up from 59 percent reported in 2015, due in large part to recent maintenance overlay and FDR treatments completed over the past several years. More than 100 unimproved streets have benefited from full or partial treatment since 2008. Twenty percent of the system falls into the “poor” category. As funding allows, Public Works Maintenance plans on spending $200,000 annually to address a portion of these streets.
2016 Unimproved Asphalt Street Condition and Rehabilitation Report
(2016 Rating Data) PCI Lane
Miles % of System Condition Rehabilitation
Cost Unit
Cost/SQFT *
Treatment **
0-10 1.6 1.80% Poor $312,810 $3.00 FDR
11 20 5.90 6.5% Poor $929,352 $2.50 FDR or
2"HMAC
21-30 10.4 11.5% Poor $984,802 $1.50 1.5"-2" HMAC
31-40 5.0 5.6% Fair $476,535 $1.50 1.5"-2" HMAC
41-50 5.1 5.6% Fair $482,976 $1.50 1.5"-2" HMAC
51-60 1.6 1.8% Fair $151,774 $1.50 1.5"-2" HMAC
61-65 3.1 3.4% Fair $290,289 $1.50 1.5"-2" HMAC
66-70 3.3 3.6% Good $0 $0.00 No Treatment
71-80 3.7 4.1% Good $0 $0.00 No Treatment
81-85 6.1 6.8% Good $0 $0.00 No Treatment
86-90 3.8 4.2% Excellent $0 $0.00 No Treatment
91-100 40.6 45% Excellent $0 $0.00 No Treatment
Total Rehabilitation
$3,628,529
* Unit cost based on recent project costs
** Example treatments. Actual treatment would need further analysis.
90.1 100.00%
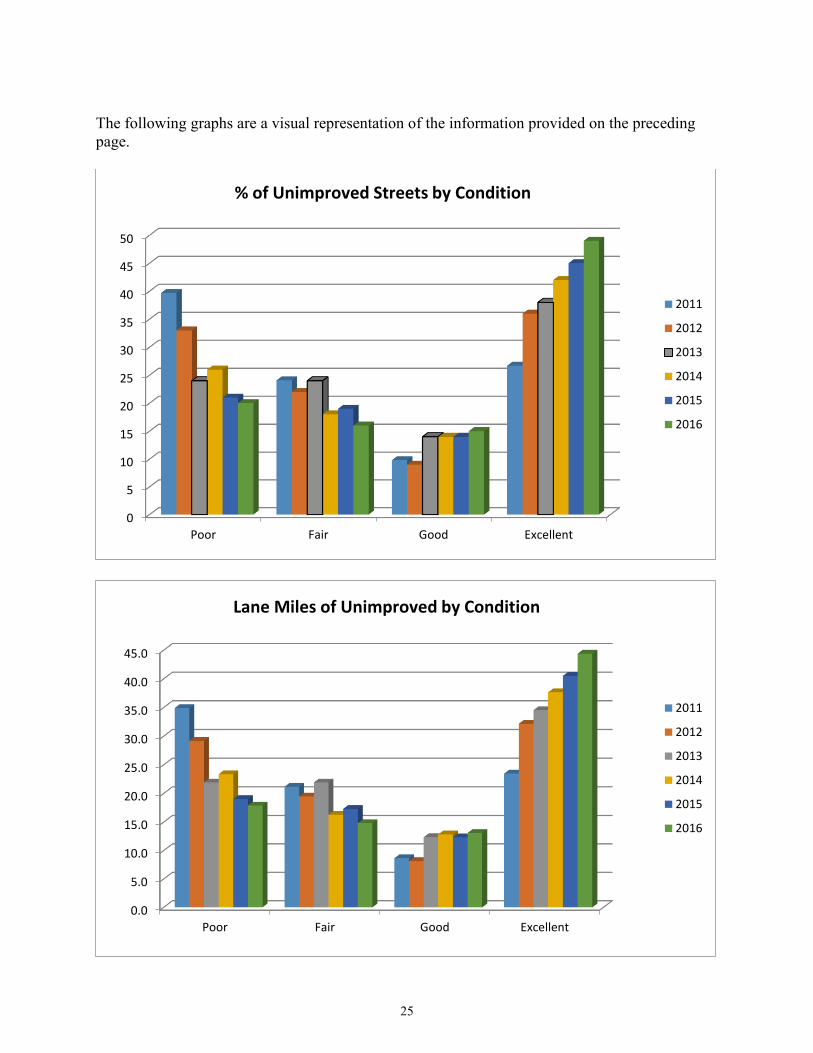
25
The following graphs are a visual representation of the information provided on the preceding page.
0
5
10
15
20
25
30
35
40
45
50
Poor Fair Good Excellent
2011
2012
2013
2014
2015
2016
% of Unimproved Streets by Condition
0.0
5.0
10.0
15.0
20.0
25.0
30.0
35.0
40.0
45.0
Poor Fair Good Excellent
2011
2012
2013
2014
2015
2016
Lane Miles of Unimproved by Condition
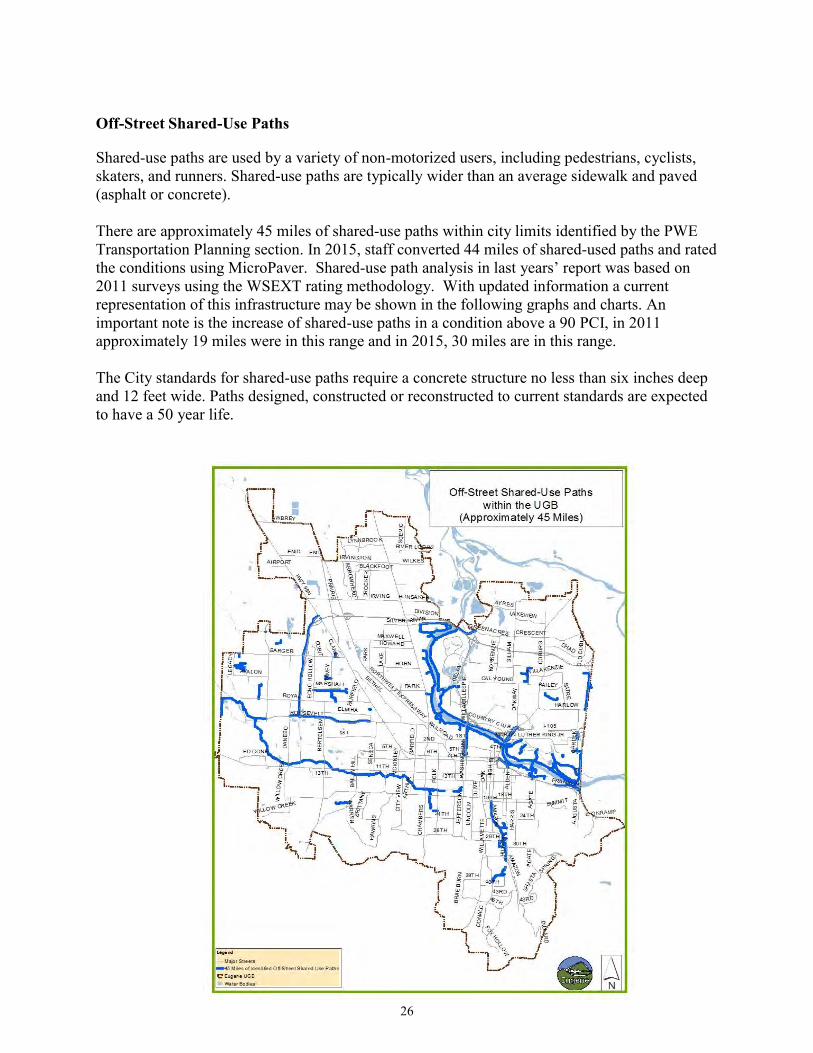
26
Off-Street Shared-Use Paths Shared-use paths are used by a variety of non-motorized users, including pedestrians, cyclists, skaters, and runners. Shared-use paths are typically wider than an average sidewalk and paved (asphalt or concrete). There are approximately 45 miles of shared-use paths within city limits identified by the PWE Transportation Planning section. In 2015, staff converted 44 miles of shared-used paths and rated the conditions using MicroPaver. Shared-use path analysis in last years’ report was based on 2011 surveys using the WSEXT rating methodology. With updated information a current representation of this infrastructure may be shown in the following graphs and charts. An important note is the increase of shared-use paths in a condition above a 90 PCI, in 2011 approximately 19 miles were in this range and in 2015, 30 miles are in this range. The City standards for shared-use paths require a concrete structure no less than six inches deep and 12 feet wide. Paths designed, constructed or reconstructed to current standards are expected to have a 50 year life.
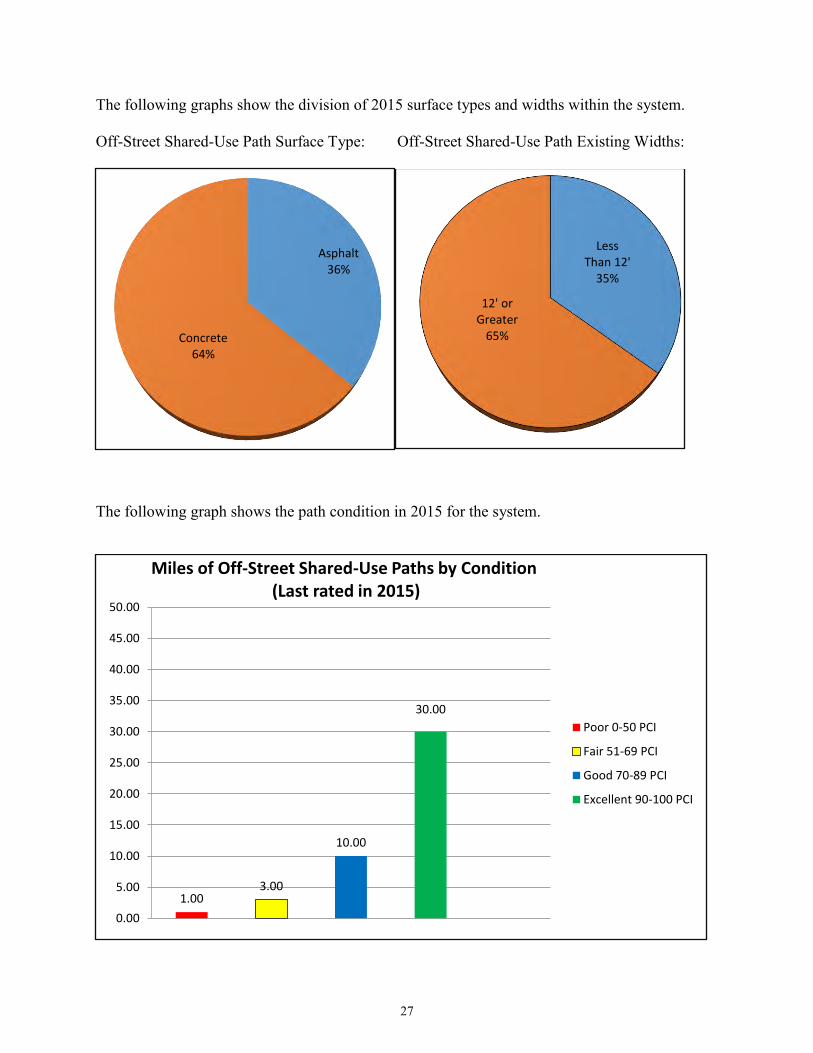
27
The following graphs show the division of 2015 surface types and widths within the system. Off-Street Shared-Use Path Surface Type: Off-Street Shared-Use Path Existing Widths:
The following graph shows the path condition in 2015 for the system.
Asphalt36%
Concrete64%
Less Than 12'
35%
12' or Greater
65%
1.003.00
10.00
30.00
0.00
5.00
10.00
15.00
20.00
25.00
30.00
35.00
40.00
45.00
50.00
Miles of Off-Street Shared-Use Paths by Condition(Last rated in 2015)
Poor 0-50 PCI
Fair 51-69 PCI
Good 70-89 PCI
Excellent 90-100 PCI
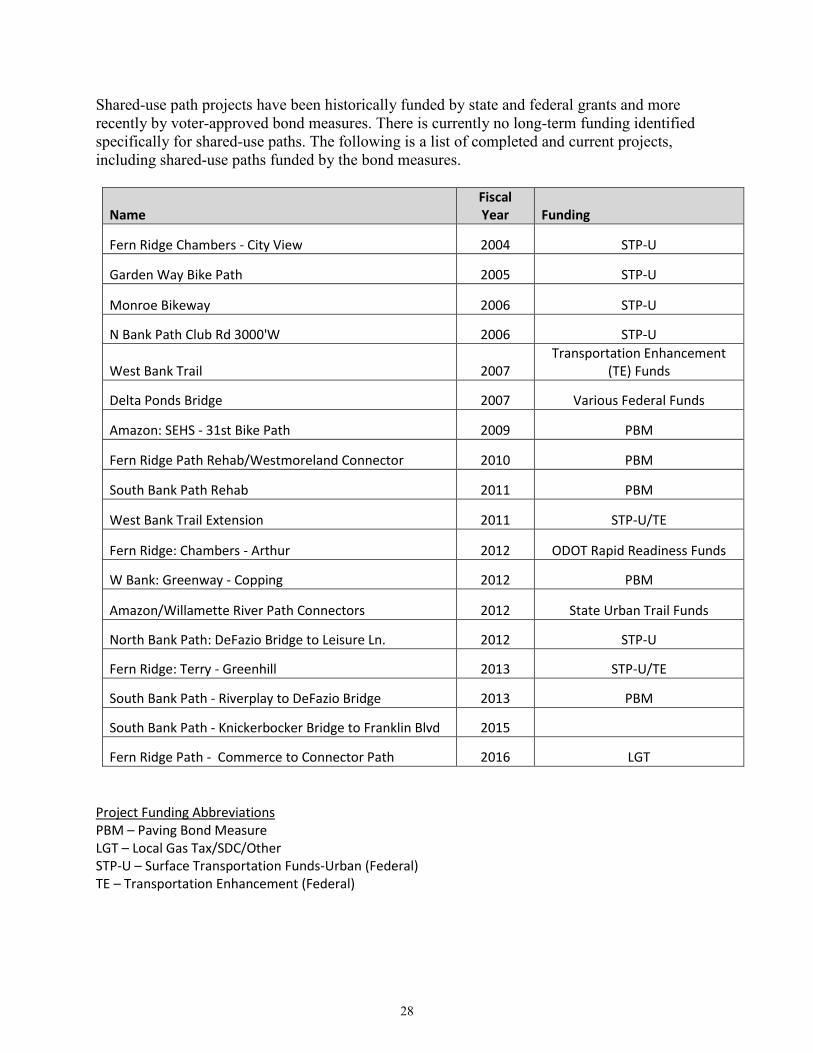
28
Shared-use path projects have been historically funded by state and federal grants and more recently by voter-approved bond measures. There is currently no long-term funding identified specifically for shared-use paths. The following is a list of completed and current projects, including shared-use paths funded by the bond measures.
Name Fiscal Year Funding
Fern Ridge Chambers - City View 2004 STP-U
Garden Way Bike Path 2005 STP-U
Monroe Bikeway 2006 STP-U
N Bank Path Club Rd 3000'W 2006 STP-U
West Bank Trail 2007 Transportation Enhancement
(TE) Funds
Delta Ponds Bridge 2007 Various Federal Funds
Amazon: SEHS - 31st Bike Path 2009 PBM
Fern Ridge Path Rehab/Westmoreland Connector 2010 PBM
South Bank Path Rehab 2011 PBM
West Bank Trail Extension 2011 STP-U/TE
Fern Ridge: Chambers - Arthur 2012 ODOT Rapid Readiness Funds
W Bank: Greenway - Copping 2012 PBM
Amazon/Willamette River Path Connectors 2012 State Urban Trail Funds
North Bank Path: DeFazio Bridge to Leisure Ln. 2012 STP-U
Fern Ridge: Terry - Greenhill 2013 STP-U/TE
South Bank Path - Riverplay to DeFazio Bridge 2013 PBM
South Bank Path - Knickerbocker Bridge to Franklin Blvd 2015
Fern Ridge Path - Commerce to Connector Path 2016 LGT
Project Funding Abbreviations PBM – Paving Bond Measure LGT – Local Gas Tax/SDC/Other STP-U – Surface Transportation Funds-Urban (Federal) TE – Transportation Enhancement (Federal)
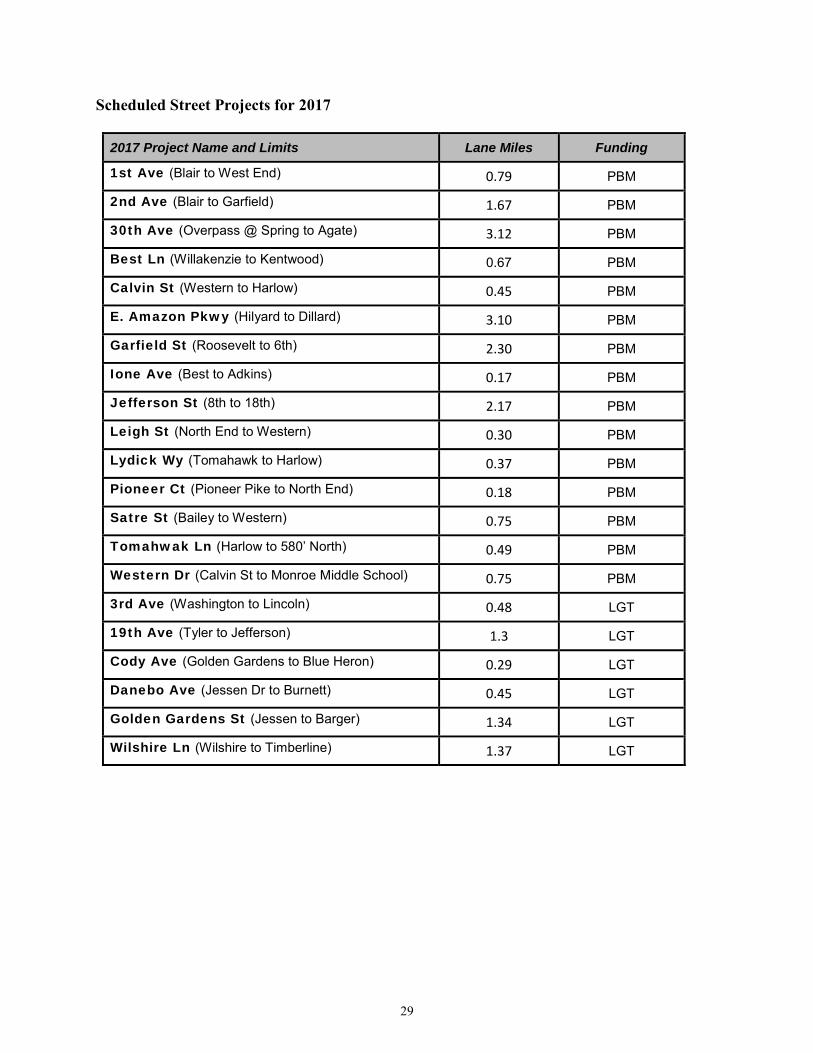
29
Scheduled Street Projects for 2017
2017 Project Name and Limits Lane Miles Funding
1st Ave (Blair to West End) 0.79 PBM
2nd Ave (Blair to Garfield) 1.67 PBM
30th Ave (Overpass @ Spring to Agate) 3.12 PBM
Best Ln (Willakenzie to Kentwood) 0.67 PBM
Calvin St (Western to Harlow) 0.45 PBM
E. Amazon Pkwy (Hilyard to Dillard) 3.10 PBM
Garfield St (Roosevelt to 6th) 2.30 PBM
Ione Ave (Best to Adkins) 0.17 PBM
Jefferson St (8th to 18th) 2.17 PBM
Leigh St (North End to Western) 0.30 PBM
Lydick Wy (Tomahawk to Harlow) 0.37 PBM
Pioneer Ct (Pioneer Pike to North End) 0.18 PBM
Satre St (Bailey to Western) 0.75 PBM
Tomahwak Ln (Harlow to 580’ North) 0.49 PBM
Western Dr (Calvin St to Monroe Middle School) 0.75 PBM
3rd Ave (Washington to Lincoln) 0.48 LGT
19th Ave (Tyler to Jefferson) 1.3 LGT
Cody Ave (Golden Gardens to Blue Heron) 0.29 LGT
Danebo Ave (Jessen Dr to Burnett) 0.45 LGT
Golden Gardens St (Jessen to Barger) 1.34 LGT
Wilshire Ln (Wilshire to Timberline) 1.37 LGT
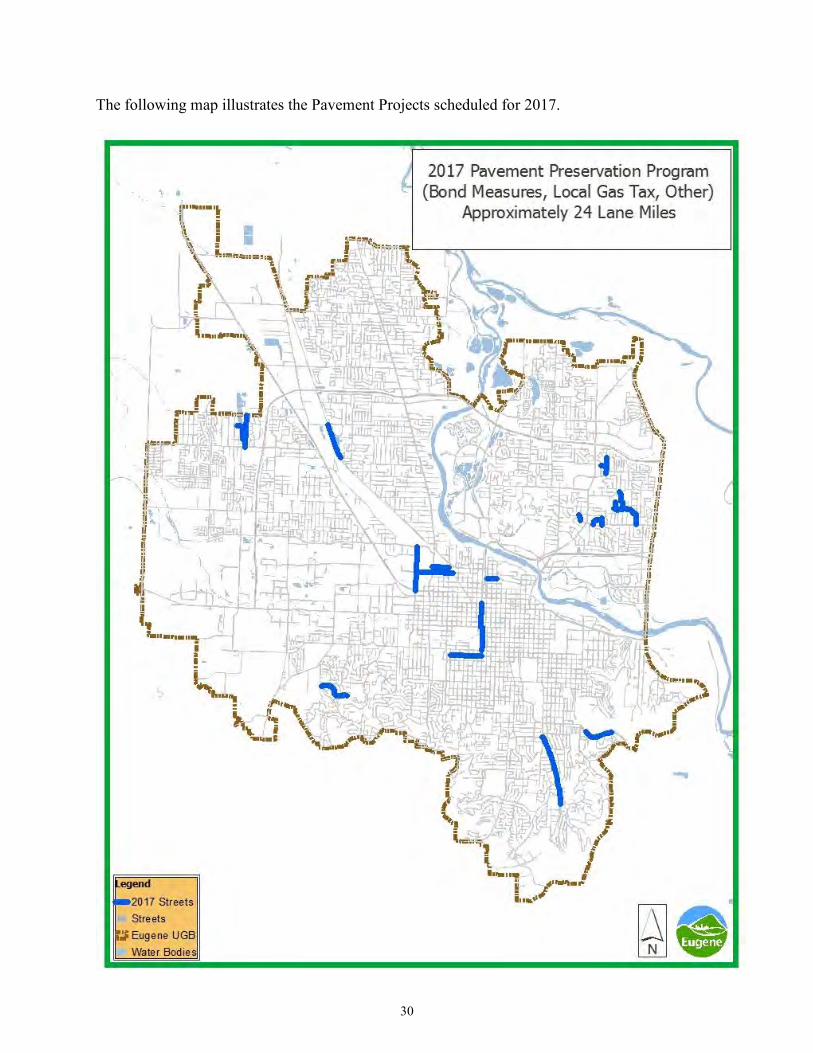
30
The following map illustrates the Pavement Projects scheduled for 2017.
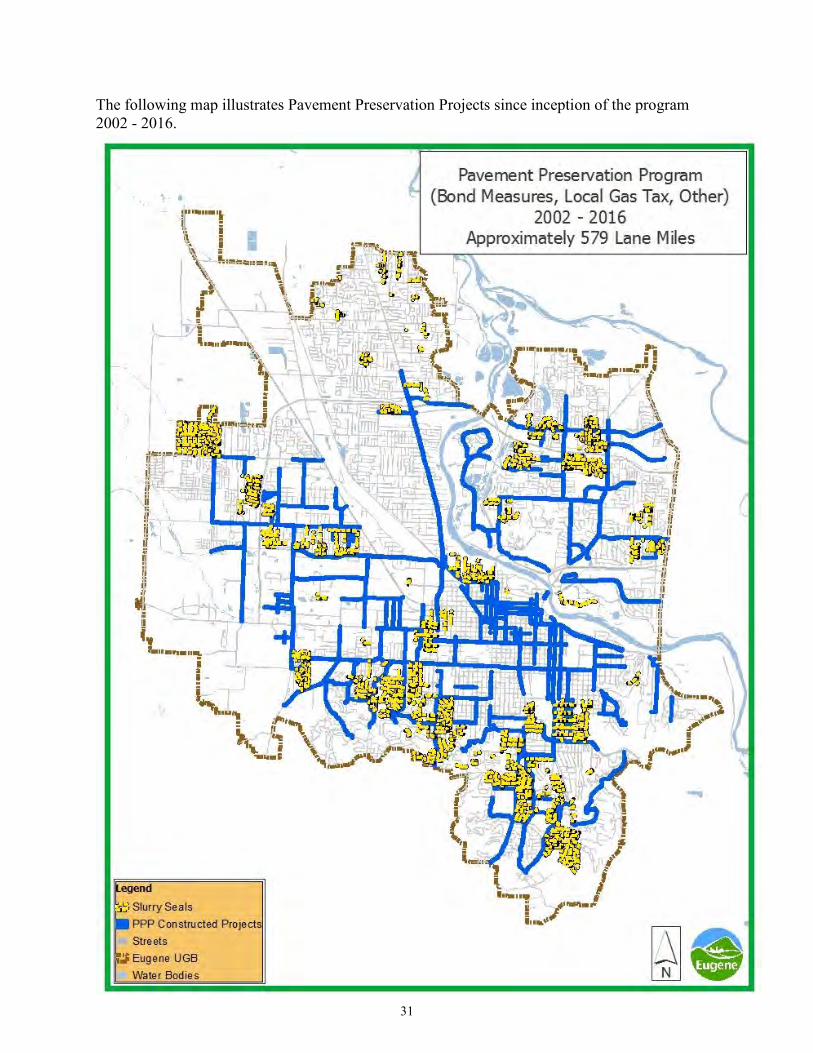
31
The following map illustrates Pavement Preservation Projects since inception of the program 2002 - 2016.
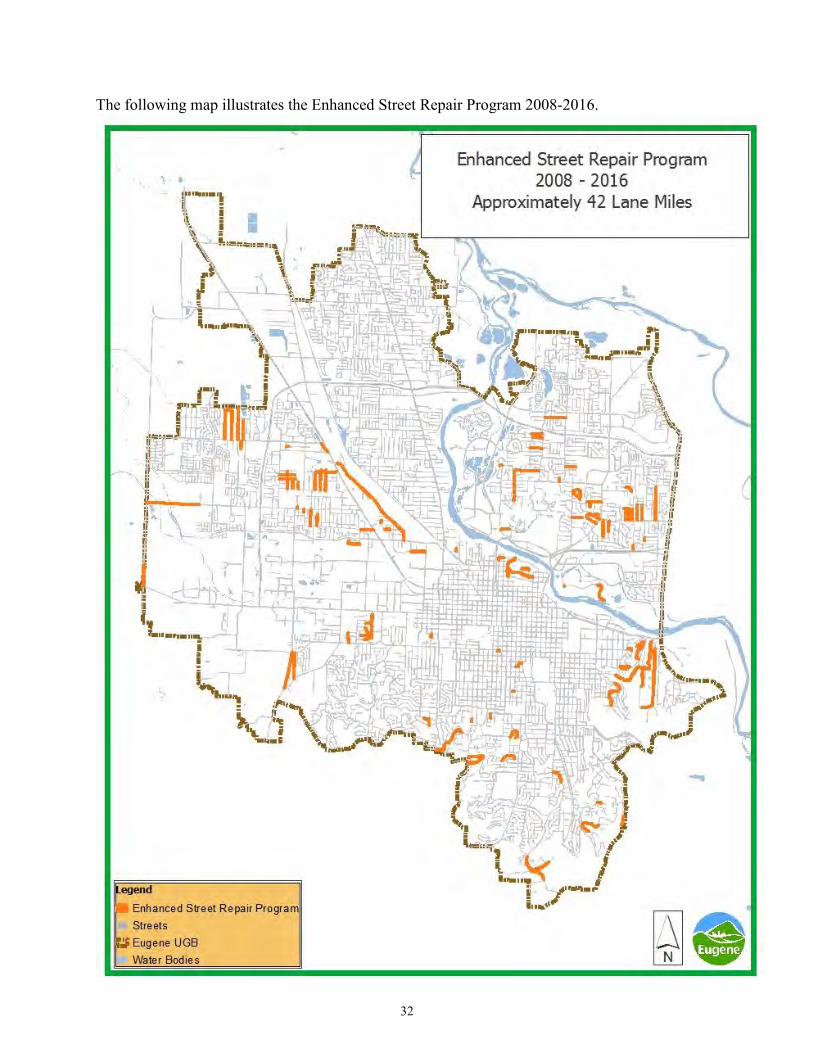
32
The following map illustrates the Enhanced Street Repair Program 2008-2016.
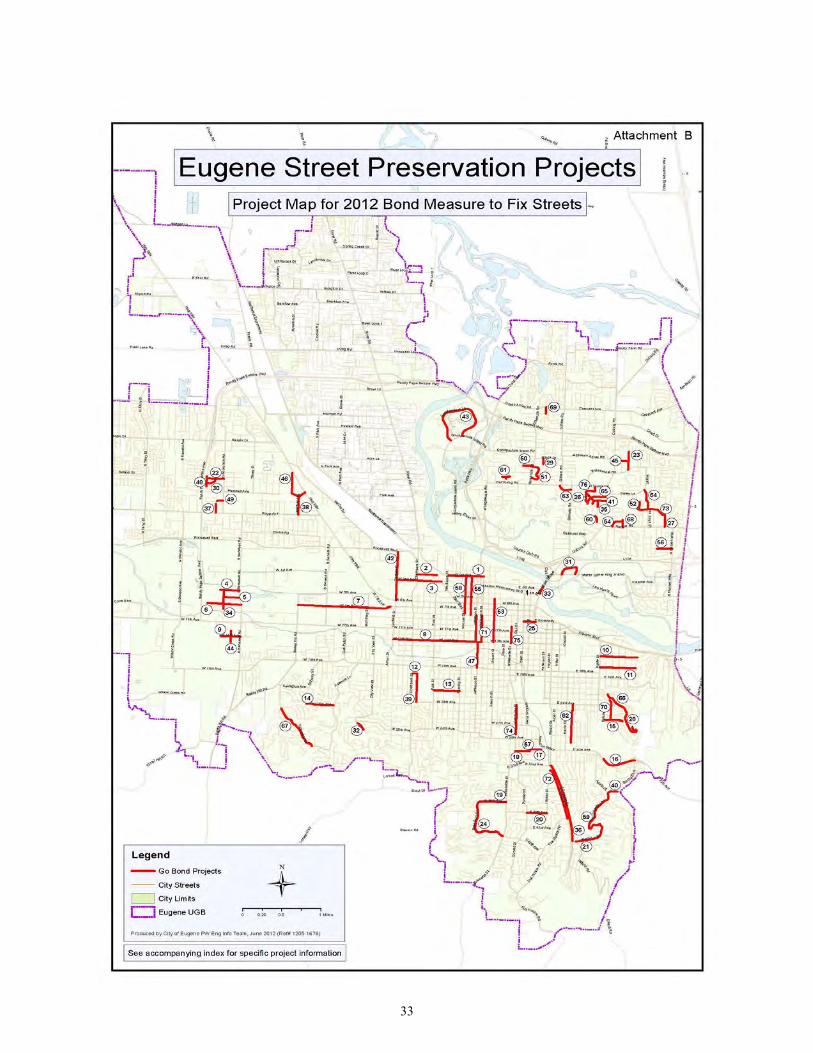
33
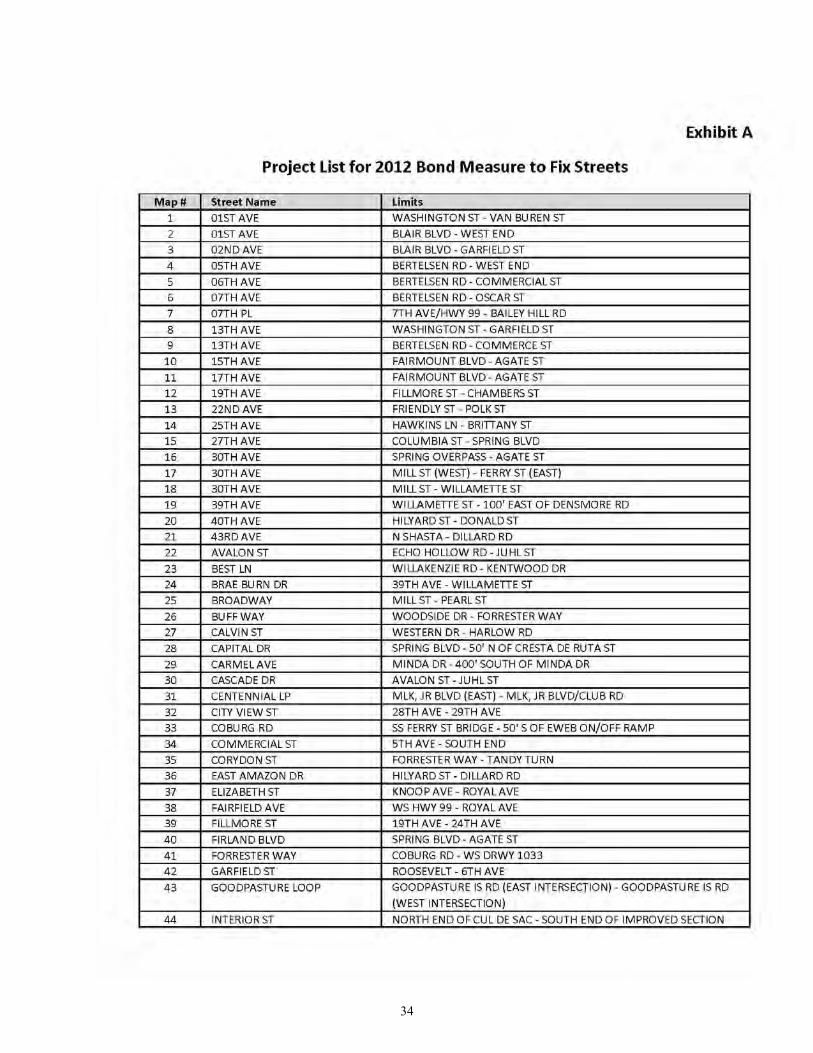
34
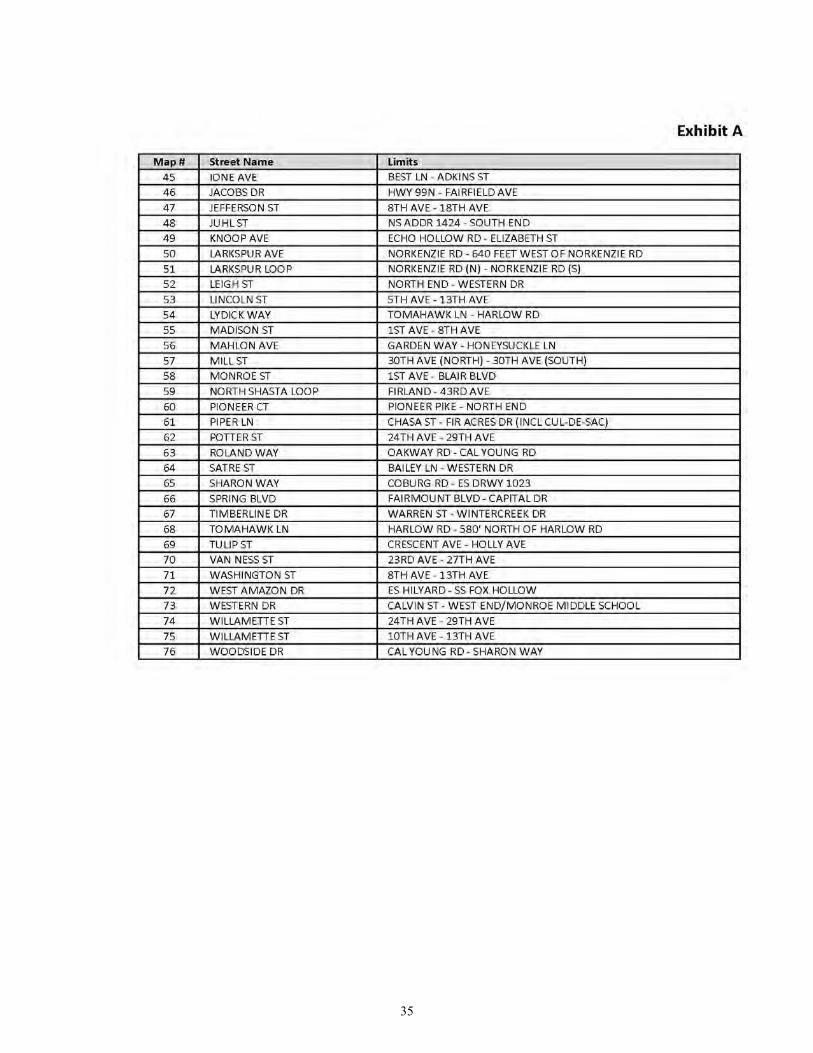
35
EUGENE CITY COUNCIL AGENDA ITEM SUMMARY
Work Session: Commercial Setback Code Requirements for Downtown Meeting Date: March 13, 2017 Agenda Item Number: C Department: Planning & Development Staff Contact: Zach Galloway www.eugene-or.gov Contact Telephone Number: 541.682.5485 ISSUE STATEMENT This City Council work session will explore setback standards in the land use code and other related development factors affecting the pedestrian environment in downtown Eugene. This is an informational item and no Council action is requested. BACKGROUND The Downtown Plan, Envision Eugene and the economic development-focused Regional Economic Prosperity Plan all recognize the importance of supporting a thriving downtown. To that end, City Council has taken recent actions to advance related policy objectives. The Downtown and Mixed Use Code Amendments and the reauthorization of the Multiple-Unit Property Tax Exemption (MUPTE) program in the area are actions intended to increase residential development. More recently, the Downtown Placemaking project seeks to activate our public spaces and manage them in a way that creates a welcoming and thriving downtown for all Eugene residents. The pedestrian environment, or “streetscape” is the connective tissue between private establishments and our public spaces. Our streets are the largest component of public space in the downtown. Thus, the design, dimensions, and relationships between buildings and public spaces must be considered holistically in creating the pedestrian environment. Our community has shown a desire to support a thriving, walkable downtown and “20-minute neighborhoods” throughout the city. Land Use Code regulations should reflect these community values and help create a downtown that meets the community’s needs and expectations. The following questions were posed in advance of the work session. What are the current commercial development setback code requirements? Where do they
apply? Should we eliminate the developer option for no setbacks which allows them to develop right
up to the sidewalk (e.g., Capstone on 11th, new Hilton downtown, and others)? How does that impact the development costs? What are the public benefits?
Should we require, in certain areas, landscaping between the sidewalk and the building/development? If so, what kind and how much?
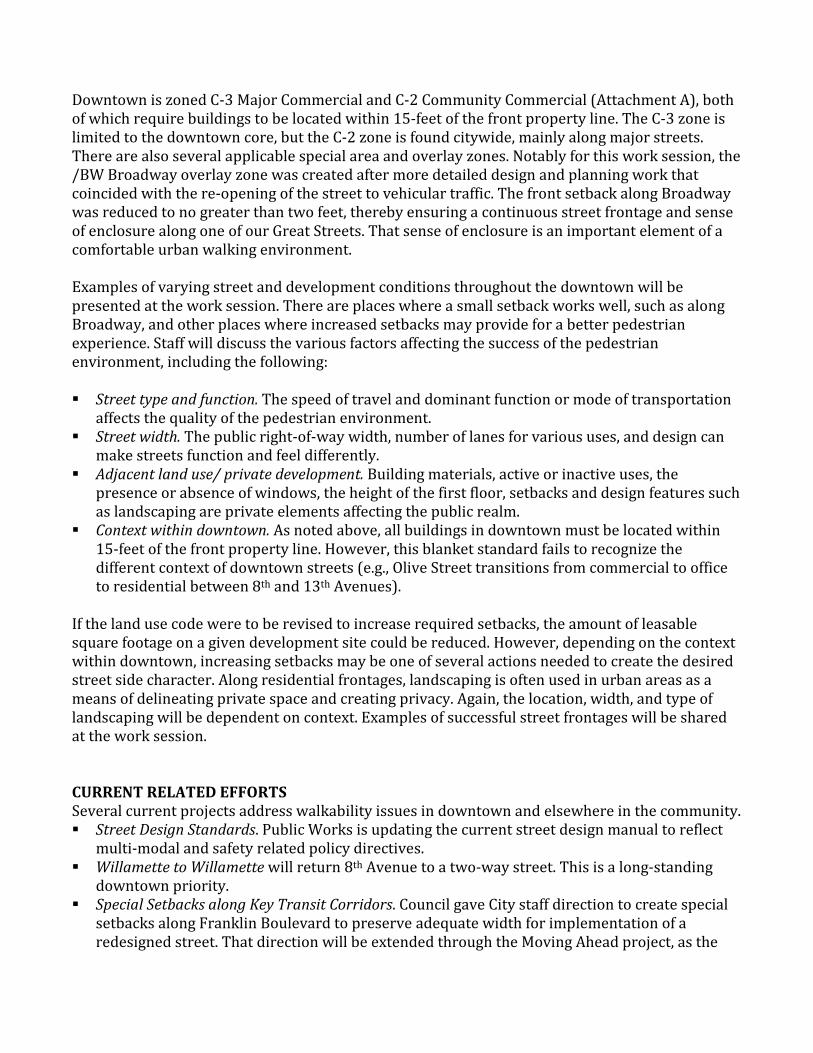
Downtown is zoned C-3 Major Commercial and C-2 Community Commercial (Attachment A), both of which require buildings to be located within 15-feet of the front property line. The C-3 zone is limited to the downtown core, but the C-2 zone is found citywide, mainly along major streets. There are also several applicable special area and overlay zones. Notably for this work session, the /BW Broadway overlay zone was created after more detailed design and planning work that coincided with the re-opening of the street to vehicular traffic. The front setback along Broadway was reduced to no greater than two feet, thereby ensuring a continuous street frontage and sense of enclosure along one of our Great Streets. That sense of enclosure is an important element of a comfortable urban walking environment. Examples of varying street and development conditions throughout the downtown will be presented at the work session. There are places where a small setback works well, such as along Broadway, and other places where increased setbacks may provide for a better pedestrian experience. Staff will discuss the various factors affecting the success of the pedestrian environment, including the following: Street type and function. The speed of travel and dominant function or mode of transportation
affects the quality of the pedestrian environment. Street width. The public right-of-way width, number of lanes for various uses, and design can
make streets function and feel differently. Adjacent land use/ private development. Building materials, active or inactive uses, the
presence or absence of windows, the height of the first floor, setbacks and design features such as landscaping are private elements affecting the public realm.
Context within downtown. As noted above, all buildings in downtown must be located within 15-feet of the front property line. However, this blanket standard fails to recognize the different context of downtown streets (e.g., Olive Street transitions from commercial to office to residential between 8th and 13th Avenues).
If the land use code were to be revised to increase required setbacks, the amount of leasable square footage on a given development site could be reduced. However, depending on the context within downtown, increasing setbacks may be one of several actions needed to create the desired street side character. Along residential frontages, landscaping is often used in urban areas as a means of delineating private space and creating privacy. Again, the location, width, and type of landscaping will be dependent on context. Examples of successful street frontages will be shared at the work session. CURRENT RELATED EFFORTS Several current projects address walkability issues in downtown and elsewhere in the community. Street Design Standards. Public Works is updating the current street design manual to reflect
multi-modal and safety related policy directives. Willamette to Willamette will return 8th Avenue to a two-way street. This is a long-standing
downtown priority. Special Setbacks along Key Transit Corridors. Council gave City staff direction to create special
setbacks along Franklin Boulevard to preserve adequate width for implementation of a redesigned street. That direction will be extended through the Moving Ahead project, as the
setbacks are tailored to the locally preferred transit and street design. Community Design Handbook. The draft Community Design Handbook is a non-regulatory tool
that offers guidance and photographic examples of best practices to create a walkable street with buildings that fit the context. This document has been employed in design review for MUPTE projects and regular Project Consultations.
RELATED CITY POLICIES Regional Economic Prosperity Plan (2010) An identified Priority Next Step is to “support and enhance vitality in [the] city center.” Downtown Plan (2004) III. 1. Emphasize Broadway, Willamette Street, 5th and 8th Avenues as Great Streets through
public improvements and development guidelines. IV. 1. Enhance public places throughout downtown through the careful design of civic buildings,
streetscapes, parks and plazas. Include public art and other elements to create special places for all ages.
IX. 3. Enhance functional designs for streets, sidewalks and related public improvements with carefully chosen design elements, including materials, alignments, plantings, and streetscape elements.
DRAFT Eugene Transportation System Plan (2017) Pedestrian Policies 1. Encourage walking as the most attractive mode of transportation for short trips (e.g., within
one half miles) within and to activity centers, downtown, key corridors, and major destinations, and as a means of accessing transit.
2. Ensure that there are safe, accessible, comfortable, and direct sidewalk connections between residential areas, major destinations, and transit stops. Continually improve walking comfort, safety, and accessibility through design, operations, retrofits, and maintenance. Provide landscaped setback sidewalks of ample width and safe street crossings to encourage people to walk.
COUNCIL OPTIONS Informational item. No action requested. CITY MANAGER’S RECOMMENDATION No recommended action. SUGGESTED MOTION Not applicable
ATTACHMENTS A. Downtown Zoning Map FOR MORE INFORMATION Staff Contact: Zach Galloway Telephone: 541.682.5485 Staff E-Mail: [email protected]
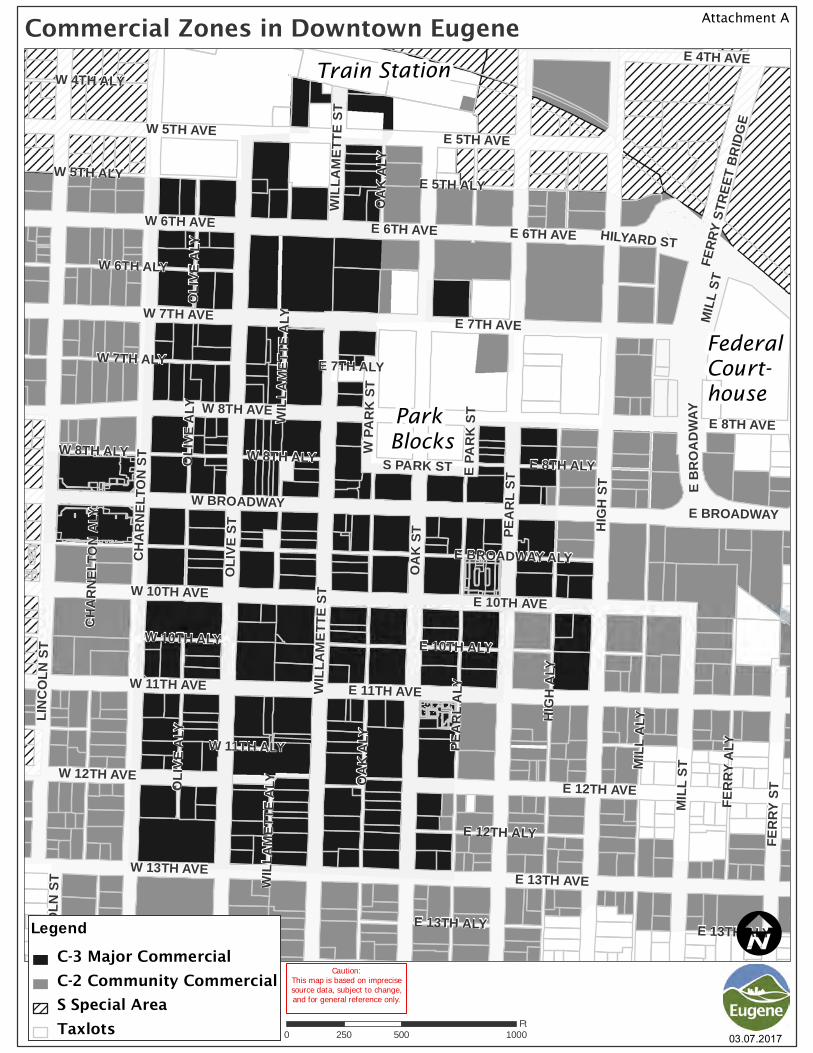
Caution:This map is based on imprecisesource data, subject to change,and for general reference only.
Commercial Zones in Downtown Eugene
0 500 1000250Ft
HIGH
ST
OAK
ST PEAR
L ST
OLIV
E ST
HIGH
ALY
CHAR
NELT
ON ST
MILL
ALY
OAK
ALY
PEAR
L ALY
E 13TH AVE
E 11TH AVEWILL
AMET
TE S
T
E 12TH AVE
E 10TH AVE
E 7TH AVE
FERR
Y ST
W 5TH AVE
W 6TH AVE
W 7TH AVE
W 8TH AVE
E 5TH AVE
W 10TH AVE
W 11TH AVE
E 4TH AVE
E 10TH ALY
W 13TH AVE
W BROADWAY
FERR
Y ALY
W 5TH ALY
MILL
ST
W 6TH ALY
W 7TH ALY
E 6TH AVE
OLIV
E ALY
W 12TH AVE
E 12TH ALY
HILYARD ST
E 8TH AVE
E 8TH ALY
E BROADWAY ALY
W PA
RK ST
W 4TH ALY
FERR
Y STR
EET B
RIDG
E
E 13TH ALY
E BRO
ADWA
Y
S PARK STW 8TH ALY
LINCO
LN S
T
W 10TH ALY
W 11TH ALY
WILL
AMET
TE A
LY
CHAR
NELT
ON A
LY
E PAR
K ST
E 5TH ALY
E 7TH ALY
E 6TH AVE
E BROADWAY
W 8TH ALY
OLIV
E ALY
WILL
AMET
TE S
T
MILL
ST
LINCO
LN S
T
OLIV
E ALY
E 13TH ALY
OAK
ALY
WILL
AMET
TE A
LY
I
03.07.2017
LegendC-3 Major CommercialC-2 Community CommercialS Special AreaTaxlots
Park Blocks
Train Station
Federal Court-house
Attachment A