eurocontrol experimental centre · eurocontrol experimental centre rams simulation of ... lugano,...
TRANSCRIPT

EUROPEAN ORGANISATIONFOR THE SAFETY OF AIR NAVIGATION
EUROCONTROL EXPERIMENTAL CENTRE
RAMS SIMULATION of
MILANO TMA
EEC Note No. 24/98
Project SIM-F-E1 (F14)
Issued: December 1998
The information contained in this document is the property of the EUROCONTROL Agency and no part should bereproduced in any form without the Agency’s permission.
The views expressed herein do not necessarily reflect the official views or policy of the Agency.
EUROCONTROL


REPORT DOCUMENTATION PAGE
Reference:EEC Note No. 24 / 98
Security Classification:Unclassified
Originator:EEC - AMS
(Air Traffic Control Model Simulations)
Originator (Corporate Author) Name/Location:EUROCONTROL Experimental CentreB.P.15F - 91222 Brétigny-sur-Orge CEDEXFRANCETelephone : +33 (0)1 69 88 75 00
Sponsor: Sponsor (Contract Authority) Name/Location:EUROCONTROL AgencyRue de la Fusée, 96B -1130 BRUXELLESTelephone : +32 2 729 9011
TITLE:RAMS SIMULATION
ofMILANO TMA
AuthorsDiarmuid HoulihanSeán Mc Morrow
Date
12/98Pages
viii + 107Figures
45
Tables
8
Maps
7
Appendices
3
EATCHIP TaskSpecification
-
Project
SIM-F-E1 (F14)
Task No. Sponsor Period
06/97 - 12/98
Distribution Statement:(a) Controlled by: Head of AMS(b) Special Limitations: None(c) Copy to NTIS: YES / NO
Descriptors (keywords):
Ente Nazionale di Assistenza al Volo, ENAV, EUROCONTROL, ARN2, ARN3, Linate, Malpensa, Milano,SAAM, SAAM 14, DED4, RVSM, CVSM, IFPU2, Danger Area, D47, SITCA, Cloning, OLDI Links, Bergamo,Padua, Marseille, Lugano, Roma, Shuttle, HLT, ADN, ADS, PARMA, GENOVA, FARAK, Alitalia, Workload,Penetrations, 2000, 2005, FLOS, Bi-directional, Appropriate Authority, CFMU, Moderate, Heavy, Severe,CAPAN, Weighting, Trigger, Participant, Object,
Abstract:Ente Nazionale di Assistenza al Volo (ENAV) of Italy requested that the AMS Centre of Expertise at theEUROCONTROL Experimental Centre (EEC) in Brétigny-sur-Orge, France, conduct a Fast-TimeSimulation study for Milano ACC. The purpose of the study was to evaluate the impacts of theimplementation of ARN2 / ARN3 Route Network structures upon operations within the Milano TMA whenoperating with different proposed airspace Organisations, and of the planned transfer of the majority ofaircraft operations from Linate Airport to Malpensa Airport. The study was undertaken using theEUROCONTROL Reorganised ATC Mathematical Simulator (RAMS).

This document has been collated by mechanical means. Should there be missing pages, please report to:
EUROCONTROL Experimental CentrePublications Office
B.P. 1591222 - BRETIGNY-SUR-ORGE CEDEX
France

RAMS Simulation of Milano TMA
EUROCONTROL
v
TABLE OF CONTENTS
1. INTRODUCTION 2
2. OBJECTIVES 2
3. METHODOLOGY 3
4. SIMULATION DATA DESCRIPTIONS / PARAMETERS 3
4.1 Traffic Sample - Preparation / Enhancement 34.1.1 Traffic Samples - Origin / Preparation 34.1.2 Traffic Sample - SITCA Forecasts for Italy 44.1.3 Traffic Sample - Enhancement 4
4.2 Traffic Samples - Amendment of Route Descriptions 4
4.3 RVSM Methodology 5
4.4 Sectors Simulated 5
5. ORGANISATIONS 6
5.1 Organisations Simulated 6
5.2 Reference Organisation A 65.2.1 General Parameters 65.2.2 Current Sectorisation 75.2.3 Exercises Conducted - Reference Organisation A 85.2.4 Exercise Parameters 8
5.2.4.1 Exercise A98A2 85.2.4.2 Exercise B98A2 85.2.4.3 Exercise C98A2 8
5.2.5 Illustration of Traffic Transferred - Linate / Malpensa 8
5.3 Proposed Organisation B 95.3.1 General Parameters 95.3.2 One-Way Routes 95.3.3 Exercises Conducted - Proposed Organisation B 105.3.4 Exercise Parameters 10
5.3.4.1 Exercise C98A2P 105.3.5 Proposed Sectorisation - Lower Sectors (1500 FT - FL275) 115.3.6 Proposed Sectorisation - Upper Sectors (FL275 - FL460) 125.3.7 Transit Routes - Upper Sectors (FL275 - FL460) 13
5.3.7.1 Exercise C00A2P 145.3.7.2 Exercise C00A3P 145.3.7.3 Exercise C05A3P 14

RAMS Simulation of Milano TMA
EUROCONTROL
vi
5.3.7.4 Exercise C05A3PR 14
5.4 Proposed Organisation C 145.4.1 General 145.4.2 General Parameters 155.4.3 Different Scenarios Considered - Proposed Organisation C 155.4.4 Scenario 1 - Chart 155.4.5 Scenario 2 - Chart 165.4.6 Vertical Limits - Scenario 1 / Scenario 2 165.4.7 Exercises Conducted - Proposed Organisation C 175.4.8 Exercise Parameters 17
5.5 Proposed Organisation D 175.5.1 General 175.5.2 General Parameters 185.5.3 Exercises Conducted - Proposed Organisation D 18
5.6 Sector Manning Arrangements - General 18
5.7 ATC Task Specifications 19
5.8 Aircraft Performance Data 19
6. ORGANISATIONS EXAMINED - RESULTS AND COMPARATIVEANALYSIS 20
6.1 Reference Organisation A 206.1.1 Traffic Distribution per Sector 216.1.2 Distribution of Working Times 236.1.3 Executive Controller Workload 256.1.4 Planning Controller Workload 27
6.2 Proposed Organisation B 296.2.1 Traffic Distribution and Working Time Comparison 316.2.2 Controller Workload Comparison 326.2.3 Controller Workload - Year 2000 - ARN2 / ARN3 356.2.4 Controller Workload - Year 2005 - ARN3 366.2.5 RVSM / CVSM - Flight Level Distribution 37
6.2.5.1 Uni-Directional Routes 396.2.5.2 Bi-directional Routes 396.2.5.3 Bi-directional Routes - Northwestbound 406.2.5.4 Bi-directional Routes - Southeastbound 416.2.5.5 Bi-directional Routes - RVSM Flight Level Allocation Plan 426.2.5.6 Controller Workload in the Upper Sectors 436.2.5.7 Total Working Time over 24 Hours - Upper Sectors 44
6.3 Proposed Organisation C 456.3.1 General Parameters 456.3.2 Different Scenarios Considered 456.3.3 Exercises Conducted 466.3.4 Exercise Parameters 466.3.5 Executive Controller Workload 47
6.4 Proposed Organisation D 496.4.1 Capacity Determination - Technique 49

RAMS Simulation of Milano TMA
EUROCONTROL
vii
6.4.2 Parameters - General 516.4.3 Exercises Conducted - Proposed Organisation D 526.4.4 Sector Capacity Assessment Results - All Sectors Examined 526.4.5 Sector Capacity Assessment Results - Individual Sectors 53
7. RAMS STUDY - CONCLUSIONS/RECOMMENDATIONS 59
APPENDIX I - ATC TASK SPECIFICATIONS P. 65
APPENDIX II - HOLDSTACK CHARTS P. 79
APPENDIX III - TABLES OF RESULTS P. 83

RAMS Simulation of Milano TMA
EUROCONTROL
viii
LIST OF ABBREVIATIONS
ACC Area Control CentreAMS Air Traffic Control Model SimulationsARN ATS Route NetworkARR ArrivalATC Air Traffic ControlATCO Air Traffic Control OfficerATSU Air Traffic Service UnitCAPAN Capacity AnalyserCFMU Central Flow Management UnitCVSM Conventional Vertical Separation Minimum / MinimaDED Directorate, EATCHIP DevelopmentDEP DepartureEC European CommunityECAC European Civil Aviation ConferenceEEC EUROCONTROL Experimental CentreENAV Ente Nazionale di Assistenza al VoloFIR Flight Information RegionFL Flight LevelFLOS Flight Level Orientation SchemeFT FeetGAT General Aviation TrafficHLT Heavy Load ThresholdHQ HeadquartersICAO International Civil Aviation OrganisationIFPU2 IFPS Unit 2 - Brétigny-sur-Orge (France)IFR Instrument Flight RulesMSP Multi-Sector PlanningOLDI On-Line Data InterchangePC Planning ControllerR/T Radio TelephonyRAMS Re-Organised ATC Mathematical SimulatorRVSM Reduced Vertical Separation Minimum / MinimaSAAM System for Analysis and Assignment at Macro LevelsSID Standard Instrument DepartureSITCA Sistemi Innovativi per il Controllo del Traffico AereoSTAR Standard Arrival RouteTMA Terminal Control AreaTOSCA Testing Operational Scenarios for Concepts in ATMVFR Visual Flight Rules

RAMS Simulation of Milano TMA
EUROCONTROL
1
RAMS SIMULATIONof
MILANO TMA
Foreward
Ente Nazionale di Assistenza al Volo (ENAV) of Italy requested that the AMS Centreof Expertise at the EUROCONTROL Experimental Centre (EEC) in Brétigny-sur-Orge, France, conduct a Fast-Time Simulation study for Milano ACC. The purposeof the study was to evaluate the impacts of the implementation of ARN2 / ARN3Route Network Structures upon operations within the Milano TMA when operatingwith different proposed Airspace Organisations, and of the planned transfer of themajority of aircraft operations from Linate Airport to Malpensa Airport. The study wasundertaken using the EUROCONTROL Reorganised ATC Mathematical Simulator(RAMS).
The prime function of RAMS, which is the latest ATC simulation tool underdevelopment at the EUROCONTROL Experimental Centre in Brétigny, is themeasurement of Workload values associated with either existing or proposed ATCSystems or Airspace / Manning Organisations under evaluation. The RAMS systemcan also be used in the implementation of planning, organisational, high level andin-depth studies of a wide range of ATC concepts, including 4-dimensional flightprofiles. The design includes sophisticated conflict detection / resolutionmechanisms, modern user interfaces and a data preparation environment.
In addition, Eurocontrol HQ / DED4 completed a SAAM (System for Analysis andAssignment at Macroscopic Level) Tool Analysis with respect to Milano TMA andproduced a Report (Airspace Organisation at Milano TMA - SAAM 14) to assist theStudy Team in their investigation. SAAM is a software tool which provides specificassistance to route planners, giving rapid but broad assessment of loads on ATCstructures such as route segments, sectors etc. Route networks, Airspace structuresand traffic flow assignments can be created and modified. A 4D profiler calculatesoptimal trajectory data. Multiple queries are possible and several analysis functionsare provided to permit the user to evaluate and compare results from differentOrganisations. While it is unable to provide the degree of detail offered by RAMS,the SAAM tool is nevertheless quick and flexible in operation and has the addedadvantage that results are available instantly. It is particularly useful for the readypreparation of scenarios prior to Fast Time simulations, and it may also be usedinteractively during meetings.
The Fast Time Simulation study was commenced in June 1997. Meetings were heldbetween ENAV Representatives and the EUROCONTROL Study Team throughout

RAMS Simulation of Milano TMA
EUROCONTROL
2
the project period in order to outline methodology, define traffic samples, verify inputdata, agree exercises to be conducted, and to review the interim results obtained.
The Final Results were presented by the EUROCONTROL Study Team in Roma on10th July 1998.
This Report presents the results of the study, together with analysis thereof, andcomment where appropriate.
Acknowledgements
The members of the EUROCONTROL Study Team wish to express theirappreciation for the assistance afforded them by Ente Nazionale di Assistenza alVolo (ENAV) during the course of the simulation, and especially to Messrs. NazarenoPatrizi, Pietro Paglia and Angelo Scorciarino, whose expertise and support wereinvaluable. The excellent input provided by Messrs. Umberto Corvari, GiancarloFerrara and Gennaro Graziano during the project was also much appreciated, as wasthe valuable advice, support and liaison tendered by Messrs. Kevin Harvey and TerrySymmans of EUROCONTROL HQ / DED4. A special thankyou to Veronique Begaultof the Eurocontrol Experimental Centre in Brétigny-sur-Orge for her excellent work inproducing the Airspace Maps used in this Report.
1. IntroductionENAV plans to implement ARN2 / ARN3 Route Network Structures within the MilanoACC around the turn of the century. In addition, the majority of aircraft operations to /from Linate Airport are to be transferred to the new hub currently being developed atMalpensa Airport, commencing in October 1998. To this end, the effects of theproposed changes, in terms of Controller Workload, new Sectorisation options,manning configurations, planning procedures, forecast traffic levels, and ReducedVertical Separation Minimum (RVSM) are considered. This Report describes theobjectives, working Organisations, and parameters used in the Study, together withan analysis of the results obtained and of the conclusions drawn.
2. ObjectivesThe objectives of the Study were:-
• To evaluate the effects, in terms of Controller Workload, of the planned transferof the majority of aircraft operations from Linate Airport to Malpensa Airport.
• To assess the impacts of the implementation of ARN2 / ARN3 Route Network
Structures using several proposed new Airspace Organisations and operationalparameters, and to identify the most advantageous thereof for considerationtoward eventual implementation.
• To determine existing Sector Capacity within the Milano TMA in order to enable
updating of the data presently in use at the CFMU.
The decision to examine Sector Capacity arose out of an ENAV request toEUROCONTROL to evaluate / review the ENAV Programme with the objective ofimproving Air Traffic Services in Italy.

RAMS Simulation of Milano TMA
EUROCONTROL
3
3. MethodologyThe methodology used entails the development and evaluation of a ReferenceOrganisation based upon operational parameters currently in use in the Milano TMA,in order to both validate the EUROCONTROL RAMS simulator tool, and to establisha baseline against which the results obtained when modelling other Organisationsmay be measured. The facility to make such comparisons frequently enables theimmediate identification of the most / least promising of the proposed Organisations.Where weaknesses are identified the appropriate remedial solutions are oftenobvious. Where this is not the case, then the findings generally precipitatesupplementary studies that lead to an overall improvement in the results that can beachieved under the proposed Organisation.
4. Simulation Data Descriptions / Parameters
4.1 Traffic Sample - Preparation / Enhancement
4.1.1 Traffic Samples - Origin / PreparationIn order to enable a realistic replication of existing operations within the Milano TMAENAV supplied a 24 Hour traffic sample consisting of all Civil and Military trafficrecorded as having operated under the Control of Milano ACC on Friday 9th May1997. The traffic sample supplied was segregated into five traffic categories asfollows:-
• Arrivals / Departures To / From Lombardy.• Arrivals / Departures To / From the FIR.• Overflights.
Following re-formatting by IFPU2 to ensure compatibility with the RAMS System, twoexamples of the traffic sample were supplied to AMS, one segregated as above, andanother in combined format.
Careful analysis of the traffic sample showed that aircraft classified as LombardyArrivals were in fact duplications that were already included in one of the othercategories. Such anomalies, where they occurred, were eliminated. All Routes werechecked for Track accuracy and all aircraft profiles for Entry, Cruise and Exit Levelcompliance.
Studies of relevant Military activity in the area, including data supplied by MilitaryAuthorities, determined that the number of Military aircraft using Danger Area D47was sufficiently low as not to be of operational significance in terms of its impactupon the outcome of the study. The Working Committee therefore decided to deleteboth Military and low level VFR aircraft from the traffic sample. All corrections andamendments agreed by the Working Group were implemented.

RAMS Simulation of Milano TMA
EUROCONTROL
4
4.1.2 Traffic Sample - SITCA Forecasts for Italy
Forecast Traffic Levels - Years 1997 to 2001 InclusiveYEAR 1997 1998 1999 2000 2001
Domestic 236,125 237,104 237,982 238,780 239,510Int. Arrival 234,781 251,612 270,033 290,043 311,642Int. Dep. 242,952 262,778 284,733 308,817 335,031Overflights 212,064 215,232 217,737 219,580 220,760TOTAL 925,923 966,726 1,010,485 1,057,219 1,106,942
Table 1
Table 1 above shows the traffic increases forecast for Italy in respect of years 1997 /1998 / 1999 / 2000 and 2001, as supplied by Sistemi Innovativi per il Controllo delTraffico Aereo (SITCA). The figures are segregated into four categories representingDomestic, International Arrivals, International Departures and Overflights,respectively.
The global increase in traffic from 1997 to 1998 was assessed at 4.41%. Asforecasts were not available for the period beyond year 2001, trends for previousyears were used to calculate anticipated levels in respect of year 2005. Indicationssuggested a global increase in traffic of some 26%, on year 2000 figures, to year2005.
4.1.3 Traffic Sample - EnhancementEnhancement of the amended traffic sample was effected by the EUROCONTROLExperimental Centre at Brétigny in late 1997, utilising the cloning facilities of RAMS.
Number of Flights Simulated per 24 Hours - Years 1998 / 2000 / 2005YEAR 1998 2000 2005Domestic 401 405 429Int. Arrivals 454 523 737Int. Departures 441 518 751Overflights 404 412 461TOTAL 1700 1858 2378
Table 2
Table 2 above shows the total number of flights modelled in each 24 Hour exercisewith respect to years 1998 / 2000 and 2005. Traffic was segregated into the fourcategories first illustrated in Table 1 above.
4.2 Traffic Samples - Amendment of Route DescriptionsAt the time of traffic sample enhancement the opportunity was taken to amend routedescriptions in respect of future forecast traffic levels to ensure compliance withARN2 and ARN3 Route Network Structure requirements. Details of the methodsused and the amendments effected are given at 6.2.2 below.

RAMS Simulation of Milano TMA
EUROCONTROL
5
4.3 RVSM MethodologyPreferred new RVSM Flight Levels, utilising a single alternate Level methodology,were allocated to concerned aircraft in one of the exercises relating to year 2005forecast traffic levels. Details of the Level allocation system used can be found at6.2.5 below.
4.4 Sectors Simulated
Sector Name Sector Code Vertical Limits
ARR/DEP NORTH LIMMADN 1500’ to FL 185
ARR/DEP SOUTH LIMMADS 1500’ to FL 175
EAST NORTH LIMMEN FL 085 to FL 275
EAST SOUTH LIMMES FL 085 to FL 275
EAST UPPER LIMMEU FL 275 to FL 315
EAST UPPER/UPPER LIMMEUU FL 315 to FL 460
WEST TERMINAL LIMMWTER FL 085 to FL 205
WEST AIRWAYS LIMMWAWY FL 205 to FL 275
WEST UPPER LIMMWU FL 275 to FL 315
WEST UPPER/UPPER LIMMWUU FL 315 to FL 460
WEST NORTH LIMMWNRT FL 085 to FL 275
WEST SOUTH LIMMWSTH FL 085 to FL 275
ARR/DEP EAST LIMMADE 1500’ to FL 185*
ARRIVAL LIMMARR 1500’ to FL 095
DEPARTURE LIMMDEP 1500’ to FL 095
* The portion of LIMMADE replacing the Airspace originally under the Control ofLIMMADS had a maximum upper limit of FL175.
Table 3
Table 3 above provides an overview of the Sectors examined in this study. Therelevant Sector Designators, Sector Codes and Vertical Limits are included for each.
Data printed in Red refers to those Sectors used as replacements for SectorsLIMMWTER and LIMMWAWY in the proposed Sectorisation plan.
Data printed in Blue refers to those Sectors used in the optional Scenarios.

RAMS Simulation of Milano TMA
EUROCONTROL
6
5. Organisations
5.1 Organisations SimulatedOne Reference Organisation and three Proposed Organisations were simulated.
Figure 1
Figure 1 above summarises the basic elements of the four Organisations simulatedin this study.
5.2 Reference Organisation A
5.2.1 General ParametersReference Organisation A was based upon forecast traffic levels for year 1998 andused the Sectorisation configurations in operation in the Milano TMA at the date ofthe original traffic sample.
OLDI Links were assumed to exist with Zurich and Geneva at all Flight Levels, andwith Marseille above FL195.
Dedicated telephone links were assumed to exist with Marseille below FL195, andwith Padua and Roma ACCs. A time allocation of 22 Seconds was assumed foreach instance of telephone co-ordination.
Co-ordination between Milano ACC and Malpensa, Bergamo and Lugano Airportswas effected by dedicated telephone. A time allocation of 30 Seconds was assumedfor each instance of telephone co-ordination.
REFERENCE ORGANISATION A
1998 TRAFFICTHREE EXERCISESCURRENT SYSTEM
CURRENT SECTORISATIONSTEPPED MOVEMENT OF TRAFFIC
FROM LINATE TO MALPENSA
PROPOSED ORGANISATION B
1998/2000/2005 TRAFFICFIVE EXERCISES
CURRENT SYSTEM / OLDI LINKSPROPOSED SECTORISATION
ARN2 / ARN3 ROUTE NETWORKRVSM
PROPOSED ORGANISATION C
1998/2000/2005 TRAFFICTHREE EXERCISES
CURRENT SYSTEM / OLDI LINKSSECTORISATION OPTIONS
FOR ARRIVALS / DEPARTURESARN2 / ARN3 ROUTE NETWORK
PROPOSED ORGANISATION D
2005 TRAFFICONE EXERCISE
SECTOR CAPACITY ASSESSMENTCURRENT SYSTEM / OLDI LINKS
PROPOSED SECTORISATIONARN3 ROUTE NETWORK

RAMS Simulation of Milano TMA
EUROCONTROL
7
5.2.2 Current Sectorisation
CURRENT SECTORISATION - LOWER SECTORS (1500FT - FL275)
Map 1
Map 1 above illustrates the current Sectorisation layout, as modelled underReference Organisation A. Current Sectorisation - Upper Sectors (FL275 FL460)was as depicted in Map 4 below.
PADOVA
MARSEILLE
ZURICH
GENEVA
ROMA
ADN 015/185EN 185/275
EN 085/275
EN 085/275
EN 175/275
ES 175/275
ES 085/275
WTER 085/205
WTER 175/205
WAWY 205/275
ADN/ADS

RAMS Simulation of Milano TMA
EUROCONTROL
8
5.2.3 Exercises Conducted - Reference Organisation AA total of three exercises were conducted using year 1998 forecast traffic levels.These were designed to examine the effects of the progressive transfer of aircraftoperations from Linate Airport to the new hub under development at MalpensaAirport.
5.2.4 Exercise ParametersDetails of the parameters used in each of the exercises under ReferenceOrganisation A are listed hereunder.
5.2.4.1 Exercise A98A2Exercise A98A2 simulated year 1998 forecast traffic levels, based upon those ofFriday 9th May 1997.
5.2.4.2 Exercise B98A2Exercise B98A2 simulated the same year 1998 forecast traffic levels as in exerciseA98A2 above, but in this case all Alitalia flights to / from Milano, with the soleexception of those involved in the Milano / Roma / Milano Shuttle, used MalpensaAirport.
5.2.4.3 Exercise C98A2Exercise C98A2 simulated all major airline movements as using Malpensa Airport,with the following exceptions:-
• The Milano / Roma / Milano Shuttle. • Traffic to / from the Paris and London TMAs. • General Aviation Traffic (GAT).
This exercise completed the simulation of the progressive transfer of aircraftoperations from Linate Airport to Malpensa Airport.
5.2.5 Illustration of Traffic Transferred - Linate / Malpensa
Total Traffic Movements Simulated for Linate and Malpensa AirportsExercise Linate Airport Malpensa Airport
Arrivals Departures Arrivals DeparturesA98A2 272 281 45 39TOTAL 553 84B98A2 176 187 141 133TOTAL 363 274C98A2 92 103 225 217TOTAL 195 442
Table 4
Table 4 above illustrates the total Arrivals / Departures simulated for both Linate andMalpensa Airports in each of the Scenarios examined under Reference OrganisationA. The combined movement figures for each airport are also shown. The

RAMS Simulation of Milano TMA
EUROCONTROL
9
progressive drop in combined movements with respect to Linate, from 553 underExercise A98A2 to 195 in Exercise C98A2, is balanced by a corresponding increasefrom 84 in Exercise A98A2 to 442 in Exercise C98A2 in the case of MalpensaAirport. The Table may be considered as a model for subsequent exercises.
5.3 Proposed Organisation B
5.3.1 General ParametersProposed Organisation B simulated forecast traffic levels in respect of years 1998 /2000 / 2005
5.3.2 One-Way Routes
ONE-WAY ROUTES - ARR / DEP - MILANO AIRPORTS
BEROK
FARAK LIN
PAR
PIS
DORINCOD
PIA
FARAK
KEPPO
LAGEN
NIZ
BORDI
GEN
VOG
PADOVA
MARSEILLE
ZURICHGENEVA
ROMA
LIMC/LIRF DEPARTURES
LIML/LIRF DEPARTURES
LIMC/LIML ARRIVALS
LIMC/LIML MARSEILLE
MARSEILLE LIMC/LIML
LIMC
LIML
PIKOT
Map 2
Map 2 above illustrates the One-Way Routeings To / From the Milano Airports, asdescribed in the following paragraphs with respect to the Exercises conducted underProposed Organisation B.

RAMS Simulation of Milano TMA
EUROCONTROL
10
5.3.3 Exercises Conducted - Proposed Organisation BThe Proposed Organisation consisted of five exercises designed to examine theimpacts of modifications planned for implementation in the future. These includednew Sectorisation configurations, amended local and international ATC procedures,implementation of the ARN3 Route Network Structure, and the introduction of RVSM.
5.3.4 Exercise ParametersDetails of the parameters used in each of the exercises under ProposedOrganisation B are listed hereunder.
5.3.4.1 Exercise C98A2PExercise C98A2P simulated forecast traffic levels for year 1998. The same routeingsas in Exercise A98A2 of Reference Organisation A above were used, with thefollowing exceptions:-.
A one-way route structure was established in respect of the Milano / Roma / MilanoShuttle, with Arrival / Departure Routes as follows:-
• Roma / Linate Arrivals routed SIPLO-BEROK-COD. • Linate / Roma Departures routed DORIN-PAR-BEROK-SIPLO • Roma / Malpensa Arrivals routed SIPLO-BEROK-COD. • Malpensa / Roma Departures routed FARAK-LIN-PAR. This was to avoid
penetration of Sectors LIMMWNRT and LIMMWSTH. A one-way route structure was also established for traffic to / from both Linate andMalpensa Airports from / to the Marseille FIR. The corresponding Arrival / Departurerouteings were as follows:- • Both Linate and Malpensa Arrivals ex the Marseille FIR entered the Milano TMA
at BORDI, routeing thereafter direct to GEN, from whence they were transferredto LIMMADS and provided with sequencing to the appropriate destination airport.This routeing avoided penetration of Sector LIMMWNRT.
• Both Linate and Malpensa Departures entering the Marseille FIR, and exiting via
NIZ, routed LAGEN-KEPPO-NIZ. This routeing ensured that such trafficremained within Sector LIMMWNRT.
Transit aircraft ex Marseille FIR entered Milano TMA at BORDI.
Transit aircraft entering Marseille FIR via the Milano TMA exited at NIZ.
The superimposed Sectors LIMMWTER (FL85 - FL205) and LIMMWAWY (FL205 -FL275) were replaced by two contiguous Sectors LIMMWNRT (FL85 - FL275) andLIMMWSTH (FL85 - FL275).
The time allocated for telephone co-ordination between Malpensa and Milano ACCwas reduced from 30 Seconds to 15 Seconds per instance, based upon recentimprovements in local operating techniques. However, the allocation in respect ofboth Bergamo and Lugano Airports remained at 30 Seconds.

RAMS Simulation of Milano TMA
EUROCONTROL
11
The ARN2 Route Network Structure remained in force for the Upper AirspaceSectors.
5.3.5 Proposed Sectorisation - Lower Sectors (1500 FT - FL275)
PROPOSED SECTORISATION - LOWER SECTORS (1500 FT - FL275)
PADOVA
MARSEILLE
ZURICH
GENEVA
ROMA
ADN 015/185
ADS 015/175
EN 185/275EN 085/275
EN 085/275
EN 175/275
ES 085/275
ES 175/275
WN 085/275
WN 175/275
WS 085/275
ADN/ADS
Map 3
Map 3 above illustrates the Lower Sector layout as simulated under ProposedOrganisation B.

RAMS Simulation of Milano TMA
EUROCONTROL
12
5.3.6 Proposed Sectorisation - Upper Sectors (FL275 - FL460)
PROPOSED SECTORISATION - UPPER SECTORS (FL275 - FL460)
PADOVA
MARSEILLE
ZURICH
GENEVA
ROMA
EU 275/315
EU 275/315
WU 275/315
EUU 315/460
EUU 315/460
WUU 315/460
Map 4
Map 4 above illustrates the Upper Sector layout as simulated under ProposedOrganisation B.

RAMS Simulation of Milano TMA
EUROCONTROL
13
5.3.7 Transit Routes - Upper Sectors (FL275 - FL460)
TRANSIT ROUTES - UPPER SECTORS (FL275 - FL460)
BOA
BORDI
BZO
CANNE
GEN
GIGGI
GOLAS
LAGEN
LUSIL
NIZ
SRN
TESTO
TRA
TZO
VOG
PADOVA
MARSEILLE
ZURICHGENEVA
ROMA
OVERFLIGHTS TO SOUTHOVERFLIGHTS FROM SOUTH
LIMC
LIML
Map 5
Map 5 above illustrates the Transit Route layout in the Upper Sectors underProposed Organisation B.

RAMS Simulation of Milano TMA
EUROCONTROL
14
5.3.7.1 Exercise C00A2PExercise C00A2P simulated forecast traffic levels for year 2000. The parametersused in this exercise were basically the same as those used in Exercise C98A2P,with the following additions:-
• OLDI links were implemented between Milano, Padua and Roma ACCs, therebyenabling a reduction in co-ordination time between these ATSUs from 22Seconds to 4 Seconds.
• A Datalink was considered as being available between Milano ACC and
Malpensa, Bergamo and Lugano airports, thereby effecting a reduction in co-ordination time between these ATSUs to 4 Seconds.
• The ARN2 Route Network Structure remained in force for the Upper Airspace
Sectors.
5.3.7.2 Exercise C00A3PExercise C00A3P simulated all of the parameters of Exercise C00A2P above, withthe sole exception that the ARN3 Route Network Structure was used instead ofARN2 in order to more accurately evaluate the impacts thereof on ATC operations inthe Upper Sectors LIMMEU (FL275 - FL315), LIMMEUU (FL315 - FL460), LIMMWU(FL275 - FL315) and LIMMWUU (FL315 - FL460).
The definition of the ARN3 Route Network Structure was based upon advice fromrepresentatives of EUROCONTROL HQ / DED4, Brussels, whose experience in thisfield is considerable.
5.3.7.3 Exercise C05A3PExercise C05A3P simulated forecast traffic levels for year 2005. The ARN3 RouteNetwork Structure was utilised for the Upper Sectors. OLDI links were implementedbetween Milano and Marseille below FL195, thereby enabling a reduction in co-ordination time from 22 Seconds to 4 Seconds between the two ATSUs in respect ofthe Airspace concerned.
5.3.7.4 Exercise C05A3PRExercise C05A3PR was simulated using forecast traffic levels for year 2005. TheARN3 Route Network Structure was utilised for the Upper Sectors. Preferred newFlight Levels for aircraft operating under RVSM were also introduced in order toevaluate the impacts of Continental RVSM. Details of the application of the preferrednew Flight Level system may be found at 6.2.5 below.
5.4 Proposed Organisation C
5.4.1 GeneralEvaluation and analysis of the results of earlier exercises identified areas of likelysevere Controller Workload, especially when handling the levels of traffic forecast forthe later years of the study.
In order to address these problems the Milano ACC Working Group developedalternative configurations based upon the Arrival and Departure Sectors LIMMADN

RAMS Simulation of Milano TMA
EUROCONTROL
15
and LIMMADS. As it was considered that the results from the modelling of theseconfigurations would greatly assist the forthcoming Real Time Simulation of MilanoTMA scheduled for January 1999, the EUROCONTROL EEC / AMS Team agreed toinclude them in the study, despite their late introduction.
5.4.2 General ParametersProposed Organisation C simulated forecast traffic levels in respect of years 1998,2000 and 2005.
5.4.3 Different Scenarios Considered - Proposed Organisation CTwo different Scenarios were considered under Proposed Organisation C as follows:-
Scenario 1The Airspace of the LIMMADN and LIMMADS Sectors was reconfigured byincreasing the lateral dimensions thereof, thereby precipitating the creation of twoextra Sectors LIMMADE and LIMMARR.Scenario 2Scenario 2 consisted of the Airspace layout described under Scenario 1, plus that ofan additional Sector LIMMDEP.
5.4.4 Scenario 1 - Chart
PROPOSED SECTORISATION - SCENARIO 1
ABENA
ARLES
BENGO
BERIS
BOTAL
BRUSA
CANNE
COD
DIXER
DORIN
ELTAR
FARAK
GAZ
GHE
GIGGI
GOLTO
HANNY
IXORA
KAMPALISAP
LUSIL
MAL
MIRAX
NOV
ODINA OGERO
OMETOOSKOR
PABRO
PAR
PIA
PIKOT
PINIK
RESIA
RMG
SOSPI
SRN
TELVA
TONDA
TOPVOG
RIGONBEKAN
VERCE
LIML
LIMB
LIMCLIME
LIMN
ADN
ADS
ADS
ARR
ARR
ADN
ADE
ADE
185085
175085
015
185095
175095015
175085
185085
Map 6

RAMS Simulation of Milano TMA
EUROCONTROL
16
Map 6 above illustrates the Proposed Sectorisation layout under Scenario 1 ofProposed Organisation C.
5.4.5 Scenario 2 - Chart
PROPOSED SECTORISATION - SCENARIO 2
ABENA
ARLES
BENGO
BERIS
BOTAL
BRUSA
CANNE
COD
DIXER
DORIN
ELTAR
FARAK
GAZ
GHE
GIGGI
GOLTO
HANNY
IXORA
KAMPALISAP
LUSIL
MAL
MIRAX
NOV
ODINA OGERO
OMETOOSKOR
PABRO
PAR
PIA
PIKOT
PINIK
RESIA
RMG
SOSPI
SRN
TELVA
TONDA
TOPVOG
RIGONBEKAN
VERCE
LIML
LIMB
LIMCLIME
LIMN
ADN
ADS
ADSARR
ARR
DEP
ADN
ADN
ADE
ADE
185015
175015
015
015
185095
185095
175095015
175015
185015
Map 7
Map 7 above illustrates the Proposed Sectorisation layout of Scenario 2 of ProposedOrganisation C.
5.4.6 Vertical Limits - Scenario 1 / Scenario 2
Proposed Organisation C Sectorisation - Vertical LimitsSECTOR LIMMADN LIMMADS LIMMADE LIMMARR LIMMDEP
SCENARIO FLIGHT LEVELSScenario 1 ↑ FL185 ↑ FL175 ↑ FL185* ↑ FL095 xScenario 2 ↑ FL185 ↑ FL175 ↑ FL185* ↑ FL095 ↑ FL095* The portion of LIMMADE replacing the Airspace originally under the control ofLIMMADS had a maximum upper limit of FL175.
Table 5

RAMS Simulation of Milano TMA
EUROCONTROL
17
Table 5 above depicts the Vertical Limits of the Sectors used under ProposedOrganisation C.
5.4.7 Exercises Conducted - Proposed Organisation CProposed Organisation C consisted of three exercises designed to test thealternative configurations suggested by the Milano ACC Working Group. The firsttwo of these were tested under Scenario 1 and the third under Scenario 2.
5.4.8 Exercise ParametersDetails of the three exercises conducted under Proposed Organisation C are listedhereunder:-
Exercise C98A2P1Exercise C98A2P1 simulated forecast traffic levels in respect of year 1998,combined with the revised Sectorisation of Scenario 1, and the appropriate VerticalLimits expressed in Table 5, respectively.
Exercise C002AP1Exercise C002AP1 simulated forecast traffic levels in respect of year 2000,combined with the revised Sectorisation of Scenario 1, and the appropriate VerticalLimits expressed in Table 5, respectively.
Exercise C05A3P1Exercise C05A3P1 simulated forecast traffic levels in respect of year 2005,combined with the revised Sectorisation of Scenario 2, and the appropriate VerticalLimits expressed in Table 5, respectively.
5.5 Proposed Organisation D
5.5.1 GeneralProposed Organisation D was simulated to determine the Sector Capacity of allSectors in the Milano TMA, in order to enable updating of the data in use at theCFMU.
The capacity estimation technique used in RAMS is based upon the theory that ATCcapacity can be defined as the maximum number of flights that can enter a particularControl Area within a specified period, while still permitting an acceptable level ofController Workload. This Controller Workload level is known as the Heavy LoadThreshold (HLT).
The following technique is applied in respect of each Sector simulated:-
• Simulate a sufficiently large traffic sample for the area of interest in order topermit the generation of a suitable number of distinct Traffic / Workloadrelationships.
• Make an average assessment for the three main levels of Controller Workload
(Moderate, Heavy and Severe), with the provision that ultra high and ultra lowvalues are excluded so that there are no distortion effects, and that the width ofeach Loading band is sufficiently great to allow for variance due to conflict loadeffects.

RAMS Simulation of Milano TMA
EUROCONTROL
18
• Identify a formula to suit the relationship between Traffic Loading and ControllerWorkload.
• Apply this formula to estimate the Average Traffic Loading that would represent
the defined Heavy Load Threshold (HLT).
Note 1The use of Workload estimates from a model based simulation assumes that themodel is calibrated sufficiently well to give reasonable assessment of Workload andthat the defined HLT is suitable for that calibration.
Note 2It is stressed that ENAV is solely responsible for the issue of Declared CapacityValues in respect of its Sectors. In consequence, and under no circumstancesshould the values presented and / or considered in this document be construed asDeclared Capacity Values.
5.5.2 General ParametersProposed Organisation D simulated forecast traffic levels in respect of year 2005.
5.5.3 Exercises Conducted - Proposed Organisation DProposed Organisation D consisted of exercise C05A3P only. Exercise C05A3Psimulated forecast traffic levels for year 2005, utilising the ARN3 Route NetworkStructure for the Upper Sectors. OLDI links were implemented between Milano andMarseille below FL195.
LIMMADN
38
LIMMADS
29
LIMMEN
50
LIMMES
38
LIMMEU
35
LIMMEUU
37
LIMMWNRT
39
LIMMWSTH
41
LIMMWU
37
LIMMWUU
39
Figure 2
Figure 2 depicts the capacity assessment figures obtained for each Sector examinedunder Proposed Organisation D.
5.6 Sector Manning Arrangements - GeneralTwo ATCO positions, those of Executive Controller (EC) and Planning Controller(PC) were simulated in all Sectors.

RAMS Simulation of Milano TMA
EUROCONTROL
19
In reality, certain Sectors operate with just one ATCO position. Where this is thecase the values recorded in respect of the second ATCO position were consideredas being insignificant, and were disregarded.
5.7 ATC Task SpecificationsThe specification and definition of the ATC Tasks used in this study were developedby both the Milano ACC and EUROCONTROL EEC / AMS Working Group members.Comprehensive details may be found at APPENDIX I to this Report.
5.8 Aircraft Performance DataThe RAMS Simulator recognises in excess of 250 aircraft types, and these aregrouped into different categories for performance purposes. Detailed data on Climb,Cruise and Descent Speeds, Rate of Climb and Descent in each Level Band, andMaximum and Minimum acceptable Flight Levels for each category of aircraft areavailable. The RAMS Simulator can also distinguish between long, medium andshort range flights.
The aircraft performance data used to construct the actual and requested profiles foreach aircraft within the simulated airspace are derived from studies of actualperformance, airline operating practices, and particular characteristics observed byexperienced Controllers during previous simulations, or in the field.
In the case of the Milano TMA study, the ENAV Working Group proposed the use offactored performance data with respect to certain aircraft types in order to both betterreplicate their own in-field experience, and to provide a more realistic representationof equipment scheduled for introduction during the period to be simulated.
Detailed information on the performance data utilised in this simulation is held by theAMS Centre of Expertise at the EUROCONTROL Experimental Centre in Brétigny-sur-Orge, France.

RAMS Simulation of Milano TMA
EUROCONTROL
20
6. Organisations Examined - Results andComparative Analysis
6.1 Reference Organisation A
The objectives of the Study were:-
• To evaluate the effects, in terms of Controller Workload, of the planned transferof the majority of aircraft operations from Linate Airport to Malpensa Airport.
• To assess the impacts of the implementation of ARN2 / ARN3 Route Network
Structures using several proposed new Airspace Organisations and operationalparameters, and to identify the most advantageous thereof for considerationtoward eventual implementation.
• To determine existing Sector Capacity within the Milano TMA in order to enable
updating of the data presently in use at the CFMU.
The purpose of Reference Organisation A was to both validate the RAMS simulatortool, and to establish a baseline against which the results obtained when modellingother Organisations could be measured.
Using the forecast traffic levels for year 1998, and the Sectorisation configurations inoperation in the Milano TMA at the date of the original traffic sample, a total of threeexercises were simulated. These were designed to examine the effects of thephased transfer of certain aircraft operations from Linate Airport to Malpensa Airportin furtherance of the development of the latter airport’s hub strategy.
Analysis of the results obtained from the exercises conducted under ReferenceOrganisation A concentrated on Controller Workload criteria. However, associateddetermining factors such as Traffic Distribution per Sector and Distribution ofWorking Times in respect of each of the defined ATC Task Categories were alsoconsidered.
RAMS Simulation of Milano TMA
EUROCONTROL
21
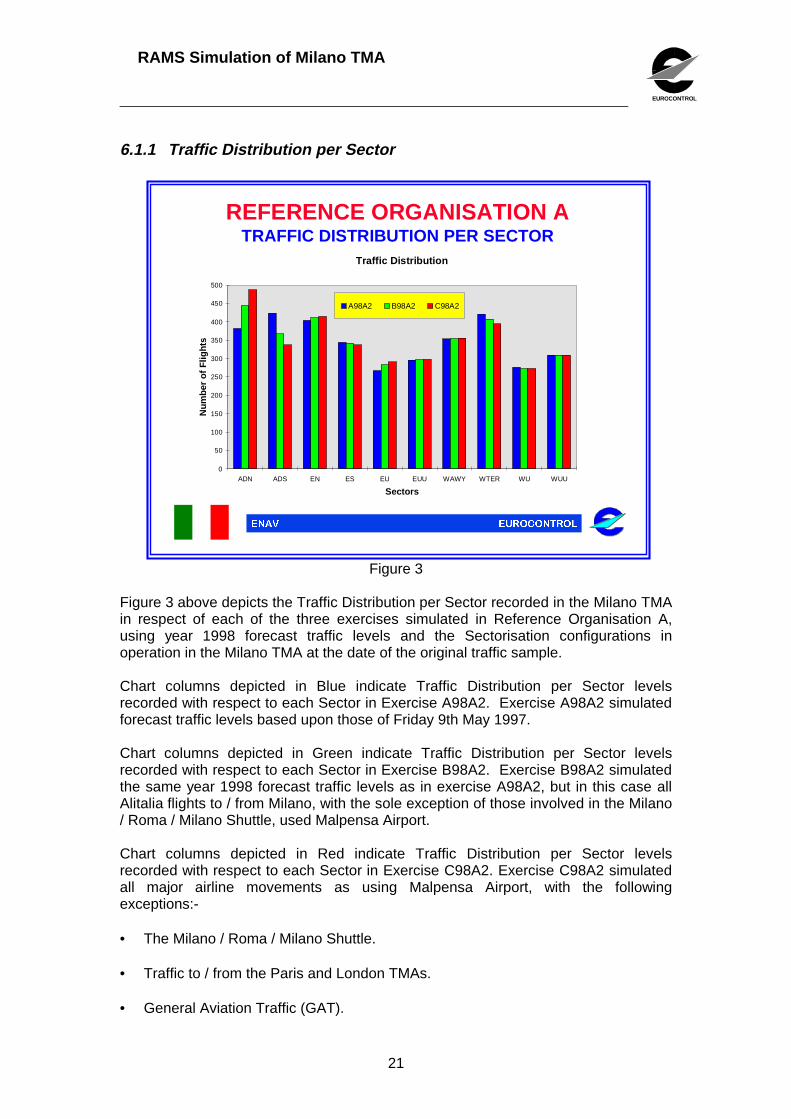
6.1.1 Traffic Distribution per Sector
(852&21752/(1$9
REFERENCE ORGANISATION ATRAFFIC DISTRIBUTION PER SECTOR
Traffic Distribution
0
50
100
150
200
250
300
350
400
450
500
ADN ADS EN ES EU EUU WAWY WTER WU WUU
Sectors
Nu
mb
er o
f F
ligh
ts
A98A2 B98A2 C98A2
Figure 3
Figure 3 above depicts the Traffic Distribution per Sector recorded in the Milano TMAin respect of each of the three exercises simulated in Reference Organisation A,using year 1998 forecast traffic levels and the Sectorisation configurations inoperation in the Milano TMA at the date of the original traffic sample.
Chart columns depicted in Blue indicate Traffic Distribution per Sector levelsrecorded with respect to each Sector in Exercise A98A2. Exercise A98A2 simulatedforecast traffic levels based upon those of Friday 9th May 1997.
Chart columns depicted in Green indicate Traffic Distribution per Sector levelsrecorded with respect to each Sector in Exercise B98A2. Exercise B98A2 simulatedthe same year 1998 forecast traffic levels as in exercise A98A2, but in this case allAlitalia flights to / from Milano, with the sole exception of those involved in the Milano/ Roma / Milano Shuttle, used Malpensa Airport.
Chart columns depicted in Red indicate Traffic Distribution per Sector levelsrecorded with respect to each Sector in Exercise C98A2. Exercise C98A2 simulatedall major airline movements as using Malpensa Airport, with the followingexceptions:-
• The Milano / Roma / Milano Shuttle. • Traffic to / from the Paris and London TMAs. • General Aviation Traffic (GAT).

RAMS Simulation of Milano TMA
EUROCONTROL
22
Reference to Figure 3 above shows that, with respect to the two Sectors - Arrival /Departure North (ADN) and Arrival / Departure South (ADS) - the originalarrangement as represented in Exercise A98A2 afforded a comfortable balancebetween the number of aircraft handled by each over the 24 Hour period examined.However, with the introduction of the phased movement of traffic from Linate Airportto Malpensa Airport, as progressively represented in Exercises B98A2 and C98A2respectively, this balance, of necessity, changed. However, as will be seen below,this change was to have a positive influence on Executive Controller Workload levelsin the Sectors concerned.
Comparison of Traffic Level Changes with Progressive Transfer of Flightsfrom Linate Airport to the Planned Hub Operation at Malpensa Airport
Exercise SectorsIdentification Arrival / Departure ADN Arrival / Departure ADS
MovementsA98A2 382 423B98A2 444 367C98A2 486 337
Table 6
Table 6 above further illustrates the points made in the preceding paragraph withrespect to the changes in traffic levels with progression through the three exercisesof Reference Organisation A.
A significant contributing factor to the changes in Sector traffic Loading betweenSectors ADN and ADS was that, Departures from Linate to the South using PARMAand GENOVA SIDs penetrated Sector ADS, and were recorded as such. Whenoperating from Malpensa Airport these Departures penetrated Sector ADN, andirrespective of the fact that they might, or not, have passed through a small portion ofSector ADS on their southbound FARAK SID climb-out, were neverthelesstransferred directly to the Control of the overlying Sector appropriate to that portion ofSector ADS. Such aircraft movements were therefore not recorded in the ADSSector. As already stated, and as will be noted later in this Report, this procedurewent some way towards optimising the Executive Controller Workload levelsrecorded in respect of Sectors ADN and ADS.
Examination of the other Sectors simulated shows only minor changes in TrafficDistribution per Sector, the change from Linate to Malpensa precipitating anacceptable balance between all of the en-route Sectors. Sectors LIMMEN andLIMMWTER showed the highest penetrations .
The movement of aircraft from Linate Airport to Malpensa Airport resulted in a veryslight increase in the number of Sectors Penetrated per Aircraft, from 2.04 to 2.06.

RAMS Simulation of Milano TMA
EUROCONTROL
23
6.1.2 Distribution of Working Times
(852&21752/(1$9
REFERENCE ORGANISATION A24 HOUR WORKING TIME
Distribution of Working Times
0
500
1000
1500
2000
2500
3000
3500
4000
4500
5000
A98A2 B98A2 C98A2
Exercise
Wo
rkin
g T
ime
ove
r 24
Ho
urs
(in
min
ute
s)
Stack
Radar
R/T
C/Search
Co-Ord.
Fgt. Data
439143364258
Figure 4
Figure 4 above depicts the Distribution of Working Times, in minutes, for the entire24 hour period examined. The columns represent the recordings derived for each ofthe three exercises conducted under Reference Organisation A. Each column is, inturn, appropriately segmented and colour-coded to highlight the readings obtained inrespect of each of the ATC Task categories evaluated.
Figure 4 shows that the highest readings recorded were those in respect of routineR/T Tasks, followed by Radar, Co-ordination and Flight Data Management,respectively. There was an operationally insignificant increase in Working Time perAircraft from 1.23 to 1.26 Minutes with the movement of traffic from Linate Airport toMalpensa Airport.
In terms of Working Time per ATC Task Category the greatest effects of the transferof traffic from Linate Airport to Malpensa Airport were seen in Sector ADN. With anincrease in aircraft penetrations of 27%, Working Time increased from 357 Minutesto 586 Minutes in this Sector over the 24 Hour period examined, an increase of some60%. The most significant increases were in respect of Radar, Co-ordination andR/T, respectively.
With particular reference to Working Times in respect of Holdstacks simulated in theexercises, it should be noted that the RAMS system has not, as yet, attained thefacility to process the specification, definition, operation and evaluation of Holdstackdata to the exacting standards demanded for ATC operations. That is to say, theTMA functionalities of the system are presently unable to accurately quantifyoperational parameters relating to correct Holding Techniques, Runway Schedulingfor Arrivals and Departures, and Multiple Holdstack Management using different

RAMS Simulation of Milano TMA
EUROCONTROL
24
Approach Sectors. It is nevertheless considered that the results that were producedin this instance can be used to provide a reasonably realistic indication of thedifficulties and delays to be anticipated using both current and future traffic levels. Inaddition, and since each exercise used the same basic specification, comparativeanalysis of data derived may be effected with a reasonable degree of confidence.
Following the migration of traffic from Linate Airport to Malpensa Airport the 24 HourWorking Time values in respect of Holdstack operations between the two Arrival /Departure Sectors ADN and ADS were more evenly balanced.
It should be borne in mind that the ADN Sector was responsible for one Holdstack atSaronno (SRN) which, by virtue of its location, is affected by all Arrivals fromNorthern Europe to both Linate and Malpensa, and by Northbound Departures fromLinate and Eastbound Departures from Malpensa. In addition, the fact that it issituated close to the Alps, and between the Arrival / Departure Routes to / fromLinate, Malpensa, Lugano and Bergamo suggests that considerable operationaldifficulties will be presented with the onset of the traffic levels forecast for the earlypart of the next century. On the other hand, Sector ADS handled three Holdstacks atVoghera (VOG), Golto (GOLTO) and Codogno (COD).
In this regard, charts detailing the measurements recorded with respect to Minutes ofHoldstack Occupancy for each of the Holdstacks concerned, using years 1998, 2000and 2005 forecast traffic levels may be found at APPENDIX II to this Report.

RAMS Simulation of Milano TMA
EUROCONTROL
25
6.1.3 Executive Controller Workload
(852&21752/(1$9
REFERENCE ORGANISATION AEXECUTIVE CONTROLLER WORKLOAD
0
10
20
30
40
50
60
70
80
90
100
ADN ADS EN ES EU EUU WAWY WTER WU WUU
Sectors
Per
cen
tag
e o
n 3
Ho
urs EC/A98A2 EC/B98A2 EC/C98A2
Figure 5
Figure 5 above depicts the Executive Controller Workload per Sector in respect ofyear 1998 forecast traffic levels, as recorded for each of the three exercisesconducted under Reference Organisation A.
Chart columns depicted in Blue represent Executive Controller Workload levelsmeasured in Exercise A98A2. Exercise A98A2 simulated year 1998 forecast trafficlevels, based upon those of Friday 9th May 1997.
Chart columns depicted in Green represent Executive Controller Workload levelsmeasured in Exercise B98A2. Exercise B98A2 simulated the same year 1998forecast traffic levels as in exercise A98A2 above, but in this case all Alitalia flights to/ from Milano, with the sole exception of those involved in the Milano / Roma / MilanoShuttle, used Malpensa Airport.
Chart columns depicted in Red represent Executive Controller Workload levelsmeasured in Exercise C98A2. Exercise C98A2 simulated all major airlinemovements as using Malpensa Airport, with the following exceptions:-
• The Milano / Roma / Milano Shuttle. • Traffic to / from the Paris and London TMAs. • General Aviation Traffic (GAT).

RAMS Simulation of Milano TMA
EUROCONTROL
26
This exercise completed the simulation of the progressive transfer of aircraftoperations from Linate Airport to Malpensa Airport.
The Average Percentage Loading Analysis is based upon the three hour periodsidentified within each Sector for the 24 Hour simulation runs of each exercise.
Reference to the two Red columns with respect to Sectors ADN and ADS (ExerciseC98A2) shows that an excellent Executive Controller Workload balance has beenrecorded. Effectively, the planned migration of traffic from Linate to Malpensa hasco-incidentally redressed the significant imbalance in Executive Controller Workloadlevels that hitherto existed between the Sectors.
Although balanced under Exercise C98A2, the Executive Controller Workload valuesare nevertheless still heavy to severe, even though they are based upon year 1998forecast traffic levels. Urgent remedial procedures, whether operational ororganisational, will be required if forecast traffic levels in respect of years 2000 and2005 are to be safely and efficiently accommodated.
The Executive Controller Workload levels in respect of the en-route Sectors weremoderate, with the exception of Sectors WTER and EN, both of which producedvalues bordering on the Heavy category.

RAMS Simulation of Milano TMA
EUROCONTROL
27
6.1.4 Planning Controller Workload
(852&21752/(1$9
REFERENCE ORGANISATION APLANNING CONTROLLER WORKLOAD
0
10
20
30
40
50
60
70
80
90
100
ADN ADS EN ES EU EUU WAWY WTER WU WUU
Sectors
Per
cen
tag
e o
n 3
Ho
urs
PC/A98A2 PC/B98A2 PC/C98A2
Figure 6
Figure 6 above depicts the Planning Controller Workloads per Sector in respect ofyear 1998 forecast traffic levels, as recorded for each of the three exercisesconducted under Reference Organisation A.
Chart columns depicted in Blue represent Planning Controller Workload levelsmeasured in Exercise A98A2. Exercise A98A2 simulated year 1998 forecast trafficlevels, based upon those of Friday 9th May 1997.
Chart columns depicted in Green represent Planning Controller Workload levelsmeasured in Exercise B98A2. Exercise B98A2 simulated the same year 1998forecast traffic levels as in exercise A98A2 above, but in this case all Alitalia flights to/ from Milano, with the sole exception of those involved in the Milano / Roma / MilanoShuttle, used Malpensa Airport.
Chart columns depicted in Red represent Planning Controller Workload levelsmeasured in Exercise C98A2. Exercise C98A2 simulated all major airlinemovements as using Malpensa Airport, with the following exceptions:-
• The Milano / Roma / Milano Shuttle. • Traffic to / from the Paris and London TMAs. • General Aviation Traffic (GAT).

RAMS Simulation of Milano TMA
EUROCONTROL
28
This exercise completed the simulation of the progressive transfer of aircraftoperations from Linate Airport to Malpensa Airport.
The Average Percentage Loading Analysis is based upon the three hour periodsidentified within each Sector for the 24 Hour simulation runs of each exercise.
Planning Controller Workload was of moderate level in all Sectors. This suggeststhat future traffic demands, at least in so far as they have been assessed at present,are unlikely to pose handling difficulties on the Planning Controller positions. Thisshould be particularly the case as more efficient work practices are introduced andOn Line Data Interchange (OLDI) links are more widely used. Planning ControllerWorkload was also reasonably well balanced from Sector to Sector.
It will be noted that the Planning Controller Workload levels recorded in respect ofSector ADS show insignificant readings. This is because a Planning Controller is notin fact assigned to Sector ADN. Instead, the ATC Tasks that would normally becarried out by the Planning Controller are, in this case, effected by the ExecutiveController.

RAMS Simulation of Milano TMA
EUROCONTROL
29
6.2 Proposed Organisation B
The second objective of the Study was:-
• To assess the impacts of the implementation of ARN2 / ARN3 Route NetworkStructures using several proposed new Airspace Organisations and operationalparameters, and to identify the most advantageous thereof for considerationtoward eventual implementation.
The assessment of any new Airspace Organisation is effected by comparing theresults produced therefrom with those obtained when simulating the baselineReference Organisation. A total of five exercises were simulated under Proposed Organisation B, usingforecast traffic levels for years 1998 / 2000 and 2005, respectively. The exercisesconcerned were designed to evaluate a proposed basic Sectorisation configurationand to examine the effects thereon of amended ATC procedures, new RouteNetworks and RVSM operating techniques. Exercise C98A2P, the first of the five exercises, simulated forecast traffic levels foryear 1998. The same routeings as in Exercise A98A2 of Reference Organisation Aabove (see Map 2) were used, with the following exceptions:-. A one-way route structure was established in respect of the Milano / Roma / MilanoShuttle, with Arrival / Departure Routes as follows:- • Roma / Linate Arrivals routed SIPLO-BEROK-COD. • Linate / Roma Departures routed DORIN-PAR-BEROK-SIPLO • Roma / Malpensa Arrivals routed SIPLO-BEROK-COD. • Malpensa / Roma Departures routed FARAK-LIN-PAR. This was to avoid
penetration of Sectors LIMMWNRT and LIMMWSTH. A one-way route structure was also established for traffic to / from both Linate andMalpensa Airports from / to Marseille FIR. The corresponding Arrival / Departurerouteings were as follows:- • Both Linate and Malpensa Arrivals ex Marseille FIR entered the Milano TMA at
BORDI, routeing thereafter direct to GEN, from whence they were transferred toLIMMADS Sector and provided with sequencing to the appropriate destinationairport. This routeing avoided penetration of Sector LIMMWNRT.
• Both Linate and Malpensa Departures to Marseille FIR, and exiting via NIZ,
routed LAGEN-KEPPO-NIZ. This routeing ensured that such traffic remainedwithin Sector LIMMWNRT.
Transit aircraft ex Marseille FIR entered Milano TMA at BORDI. Transit aircraft entering Marseille FIR via the Milano TMA exited at NIZ.

RAMS Simulation of Milano TMA
EUROCONTROL
30
The superimposed Sectors LIMMWTER (FL85 - FL205) and LIMMWAWY (FL205 -FL275) were replaced by two contiguous Sectors LIMMWNRT (FL85 - FL275) andLIMMWSTH (FL85 - FL275). The time allocated for telephone co-ordination between Malpensa and Milano ACCwas reduced from 30 Seconds to 15 Seconds per instance, based upon recentimprovements in local operating techniques. However, the allocation in respect ofboth Bergamo and Lugano Airports remained at 30 Seconds. The ARN2 Route Network Structure remained in force for the Upper AirspaceSectors. When compared with the results obtained in Reference Organisation A ExerciseC98A2, those of Proposed Organisation B Exercise C98A2P provide an accurateanalysis of the benefits that could accrue with implementation of the proposedSectorisation and ATC procedures specified in the latter exercise, based upon theuse of year 1998 forecast traffic levels. A comparative analysis of the results obtained from Reference Organisation AExercise A98A2, and those from Proposed Organisation B Exercise C98A2P, ispresented below. The analysis is based upon comparison of the results obtained ineach of the exercises with respect to the following :- • Traffic Distribution in terms of the total number of Sector penetrations per
Sectorisation configuration. • Total Working Time over 24 Hours per Sectorisation configuration. • Controller Workload per Sectorisation configuration.

RAMS Simulation of Milano TMA
EUROCONTROL
31
6.2.1 Traffic Distribution and Working Time Comparison
(852&21752/(1$9
REFERENCE ORGANISATION A v PROPOSED ORGANISATION BEXERCISE C98A2 / C98A2P
TRAFFIC DISTRIBUTION AND WORKING TIME COMPARISON
3494
4391
3378
4220
Total Sector Penetrations Total Working Time (mins)
C98A2
C98A2P
Figure 7
Figure 7 above depicts both the Total Sector Penetrations and the Total WorkingTimes in minutes recorded with respect to the two different Sectorisationconfigurations simulated in Reference Organisation A Exercise C98A2, andProposed Organisation B Exercise C98A2P, respectively.
Columns depicted in Blue represent values in respect of Reference Organisation AExercise C98A2.
Columns depicted in Red represent values in respect of Proposed Organisation BExercise C98A2P.
Examination of the Total Sector Penetration figures shows that there was a smallreduction in recorded values from 2.06 Sectors Penetrated per Aircraft underReference Organisation A Exercise C98A2 to 1.99 under Proposed Organisation BExercise C98A2P.
Penetrations in respect of the WNRT / WSTH Sectorisation configuration producedvalues some 20% lower than those recorded when using the WTER / WAWYarrangement. This indicates that the proposed configuration is considerably moreefficient than that in use in 1997.
In the case of Total Working Time, results showed a drop from 4391 Minutes inReference Organisation A Exercise C98A2, to 4220 Minutes under ProposedOrganisation B Exercise C98A2P. That is to say, there was a very slight reductionin average working time per aircraft.

RAMS Simulation of Milano TMA
EUROCONTROL
32
It is also worthy of note that the reduction in the time allocated for telephone co-ordination between Malpensa and Milano ACC from 30 Seconds to 15 Secondsgenerated a 30% lowering in the Working Time recorded in respect of that parameterin Sector LIMMADN.
6.2.2 Controller Workload Comparison
(852&21752/(1$9
REFERENCE ORGANISATION A v PROPOSED ORGANISATION BEXERCISE C98A2/EXERCISE C98A2P
CONTROLLER WORKLOAD COMPARISON
0
10
20
30
40
50
60
70
80
90
100
WAWY WTER WNRT WSTH
Sectors
Per
cen
tag
e o
n 3
Ho
urs EC/C98A2
PC/C98A2
EC/PC - C98A2P
Figure 8
Figure 8 above depicts the Executive and Planning Controller Workloads asrecorded in respect of Sectors WAWY and WTER in Reference Organisation AExercise C98A2, and Sectors WNRT and WSTH in Proposed Organisation BExercise C98A2P, respectively, using year 1998 forecast traffic levels. The reasonfor the selection of these two Sector-pairs for examination in isolation was becausetheir different Airspace layouts constituted the only significant parameter change withrespect to the two exercises concerned.
Reference to Figure 8 above shows that the Average Percentage Loadings for allController positions under the WNRT / WSTH Sectorisation configuration weremoderate. However, Executive Controller Workload was not as well balanced as thatmeasured in respect of Planning Controller Workload under the same Sectorisationconfiguration.
In general, however, Controller Workload values were lower under the ProposedOrganisation B Exercise C98A2P Sectorisation configuration arrangement .
Following the comparison of results obtained from Proposed Organisation B ExerciseC98A2P with those of Reference Organisation A Exercise C98A2, three furtherexercises were run, two using year 2000 forecast traffic levels, and the third basedupon those of year 2005.

RAMS Simulation of Milano TMA
EUROCONTROL
33
Exercises C00A2P and C00A3P simulated the application of the ARN2 and ARN3route structures, respectively. The two exercises were designed to provide acomparison of the effects, whether positive or negative, of the implementation ofARN3 in respect of the Upper Airspace Sectors using year 2000 forecast traffic levelswithin the proposed Sectorisation structure.
Exercise C05A3P simulated year 2005 forecast traffic levels.
Analysis of the results obtained from each of these exercises focused upon theController Workload levels recorded.
Exercise C00A2P simulated forecast traffic levels for year 2000. The parametersused in this exercise were basically the same as those used in Excercise C98A2P,with the following additions:-
• OLDI links were implemented between Milano, Padua and Roma ACCs, therebyenabling a reduction in co-ordination time between these ATSUs from 22Seconds to 4 Seconds.
• An upgraded Datalink was considered as being available between Milano ACC
and Malpensa, Bergamo and Lugano airports, thereby permitting a reduction inco-ordination time between these ATSUs to 4 Seconds.
• The ARN2 Route Network Structure remained in force for the Upper Airspace
Sectors. Exercise C00A3P simulated all of the parameters of Exercise C00A2P above, withthe sole exception that the ARN3 Route Network Structure was used instead ofARN2 in order to more accurately evaluate the impacts thereof on ATC operations inthe Upper Sectors LIMMEU (FL275 - FL315), LIMMEUU (FL315 - FL460), LIMMWU(FL275 FL315) and LIMMWUU (FL315 - FL460). The definition of the ARN3 Route Network Structure was based upon advice fromrepresentatives of EUROCONTROL HQ / DED4, Brussels, whose experience in thisfield is considerable. Two representatives from ENAV, Sr Aiossa and Sr Ruzzolini participated in theSAAM analysis of Italian Airspace conducted on 25th and 26th November 1997, atHQ EUROCONTROL. This analysis evaluated a series of future route networkdevelopment plans prepared by ENAV and resulted in agreement on a proposedroute structure for Version 3 of the ARN. In order to avoid any misunderstanding, the difference between the proposal foramendment to the ARN and the progress of the actual implementation programme,as it affected the simulation , was explained to the Italian representatives. While it was stressed that the Version 3 plans were still under development it wasnevertheless emphasised that, in order to progress preparation of the exercises forthe Milano TMA simulation it was essential that agreement be reached on a routestructure representing, as closely as possible, that expected to be in operation inyears 2000 / 2005. Following due consideration, the group agreed that the structuretested by ENAV in the SAAM analysis, and proposed for Version 3, should be usedin the relevant exercises in the Milano Fast Time simulation.

RAMS Simulation of Milano TMA
EUROCONTROL
34
The main features of the agreed ARN3 route structure were as follows:- • Traffic entering / exiting the Milano TMA to follow the new SIDS / STARS
connected to the en-route system, via existing Reporting Points.
• Southbound route TRA-0DINA-PAMLA-LAGEN-SODRI to replace the existingTRA-CANNE-SRN-VOG-GEN-AKUTI.
• Southbound route TRA-ODINA-PAMLA-LAGEN-KEPPO-NIZ to replace the
existing TRA-CANNE-SRN-VOG-LAGEN-KEPPO-NIZ. • Southbound route TRA-ODINA-SRN-PAR-AMTEL to replace the existing TRA-
CANNE-TZO-PAR-AMTEL. • Southbound route GIGGI-LUSIL-SRN-PAMLA-LAGEN-KEPPO-NIZ to replace the
existing GIGGI-LUSIL-TZO-VOG-LAGEN-KEPPO-NIZ. • Southbound route GIGGI-LUSIL-SRN-PAMLA-LAGEN-SODRI to replace the
existing GIGGI-LUSIL-TZO-VOG-GEN-AKUTI. • Northbound route ODENA-SRN-CANNE-AGERI to replace the existing AMTEL-
PAR-TZO-CANNE-AGERI. • Northbound route ELB-TOP-SPR to replace the existing ELB-GEN-SPR. • Westbound route ODENA-SRN-ARLES-FRANE to replace the existing ODENA-
SRN-AOSTA-SPR. • Northbound traffic from SRN to route via CANNE or ABENA, thus avoiding the
Southbound Routes. • Northbound route AKUTI-TORTU to replace the existing SODRI-TORTU. • Some of the CDRs in the existing network to be regarded as permanent under
ARN3. (e.g. UW 95).
Exercise C05A3P simulated forecast traffic levels for year 2005. The ARN3 RouteNetwork Structure was utilised for the Upper Sectors. OLDI Links were implementedbetween Milano and Marseille below FL195, thereby enabling a reduction in co-ordination time from 22 Seconds to 4 Seconds between the two ATSUs in respect ofthe Airspace concerned.

RAMS Simulation of Milano TMA
EUROCONTROL
35
6.2.3 Controller Workload - Year 2000 - ARN2 / ARN3
(852&21752/(1$9
PROPOSED ORGANISATION BCONTROLLER WORKLOAD 2000 ARN2/ARN3
0
10
20
30
40
50
60
70
80
90
100
ADN ADS EN ES EU EUU WNRT WSTH WU WUU
Sectors
Per
cen
tag
e o
n 3
Ho
urs EC/C00A2P PC/C00A2P EC/PC - C00A3P
Figure 9
Figure 9 above depicts the Average Three Hour Loadings measured in respect ofboth the Executive and Planning Controller positions for each of the Sectorsexamined under Proposed Organisation B Exercises C00A2P and C00A3P,respectively.
Columns depicted in Blue represent Controller Workload values recorded in respectof the Executive Controller positions in Proposed Organisation B Exercise C00A2P.
Columns depicted in Green represent Controller Workload values recorded inrespect of the Planning Controller positions in Proposed Organisation B ExerciseC00A2P.
Columns depicted in Red represent Controller Workload values recorded in respectof the Executive and Planning Controller positions in Proposed Organisation BExercise C00A3P.
Figure 9 above clearly indicates that the implementation of ARN3 under ExerciseC00A3P produced little effect in terms of changes to either Executive or PlanningController Workload values. This was largely due to the fact that the route changesenvisaged under the Pan-European plan do not materially alter the existing entry /exit arrangements with respect to the Milano TMA. In effect, if a much larger sampleof Airspace were to be examined, the impacts of changes to traffic flow patterns andother parameters resulting from the implementation of ARN3 could perhaps be morereadily detected and quantified.

RAMS Simulation of Milano TMA
EUROCONTROL
36
Figure 9 above also emphasises the high Controller Workload measurementsrecorded when operating with year 2000 forecast traffic levels. Executive ControllerWorkloads increased significantly, being classified as Severe in Sectors LIMMADNand LIMMADS, and as Moderate / Heavy in all other Sectors.
Planning Controller Workload levels were measured as being lower than thoserecorded in respect of Proposed Organisation B Exercise C98A2P, which used year1998 forecast traffic levels. These lower values largely resulted from the availabilityof OLDI Links for all inter-ACC co-ordination, with the exception of Milano TMA /Marseille FIR with respect to traffic below FL195. Upgraded Datalinks withMalpensa, Lugano and Bergamo airports were also in operation.
6.2.4 Controller Workload - Year 2005 - ARN3
(852&21752/(1$9
PROPOSED ORGANISATION BCONTROLLER WORKLOAD 2005 ARN3
0
10
20
30
40
50
60
70
80
90
100
ADN ADS EN ES EU EUU WNRT WSTH WU WUU
Sectors
Per
cen
tag
e o
n 3
Ho
urs EC/C05A3P PC/C05A3P
Figure 10
Figure 10 above depicts the Average Three Hour Loadings measured in respect ofboth the Executive and Planning Controller positions for each of the Sectorsexamined under Exercise C05A3P.
Columns depicted in Blue represent Controller Workload values recorded in respectof the Executive Controller positions in Proposed Organisation B Exercise C05A3P.
Columns depicted in Red represent Controller Workload values recorded in respectof the Planning Controller positions in Proposed Organisation B Exercise C05A3P.
Reference to Figure 10 shows that, with the exception of Sector LIMMWSTH,Executive Controller Workload values recorded when operating with year 2005forecast traffic levels attained Heavy / Severe classification. Indeed, the Arrival /

RAMS Simulation of Milano TMA
EUROCONTROL
37
Departure Sector LIMMADN actually exceeded capacity parameter limits, while thatof LIMMADS attained the maximum value. These results indicate the very seriousExecutive Controller Workload problems that can be anticipated with increase intraffic levels to those forecast for year 2005, and the absolute requirement forappropriate remedial action to ensure that the safety of flight operations is notcompromised in consequence.
Controller Workload levels with respect to Planning Controller positions weremoderate in all Sectors. This was mainly due to the enhancements in co-ordinationprocedures anticipated with the full implementation of OLDI Links with adjacentATSUs.
6.2.5 RVSM / CVSM - Flight Level DistributionRVSM is an International Civil Aviation Organisation (ICAO) approved conceptdesigned to permit the reduction of Vertical Separation from that of the ConventionalVertical Separation Minimum (CVSM) figure of 2000 Feet in respect of aircraftoperating between Flight Levels 290 and 410 inclusive, to 1000 Feet. An aircraftmay only benefit from the reduced Vertical Separation criteria afforded by RVSM if itis RVSM Approved.
Exercise C05A3PR was the fifth and final exercise conducted under ProposedOrganisation B. It was designed to evaluate the benefits that might be anticipatedwith the implementation of Reduced Vertical Separation Minima (RVSM) within theEuropean Civil Aviation Conference (ECAC) Member States Airspace, which isscheduled for introduction in November 2001. The exercise was conducted usingyear 2005 forecast traffic levels.
Exercise C05A3PR used the same parameters as those of Exercise C05A3P above,with the introduction of preferred new Flight Levels in Airspace where RVSM wasimplemented. All aircraft in the exercise were considered as being RVSM Approved,and RVSM was introduced on all Routes between FL290 and FL410, inclusive.

RAMS Simulation of Milano TMA
EUROCONTROL
38
(852&21752/(1$9
PROPOSED ORGANISATION BRVSM-CVSM FLIGHT LEVELS
FL 290FL 290
FL 310FL 310
FL 330FL 330
FL 350FL 350
FL 370FL 370
FL 330FL 330FL 330
FL 290FL 290FL 290
FL 300FL 300
FL 320FL 320FL 320
FL 340FL 340FL 350FL 350FL 350
FL 360FL 360
FL 310FL 310FL 310
FL 370FL 370FL 370
RVSMRVSM CVSM
FL 390390FL
FL 380FL 380FL 390390FL
FL 360FL 400FL 410410FLFLFL 410410
Figure 11
Figure 11 above illustrates the RVSM / CVSM Flight Level distribution pattern usinga Flight Level Orientation Scheme (FLOS) arrangement based upon a SingleAlternate Flight Level, as used in Exercise C05A3PR under Proposed OrganisationB.
The Flight Level Orientation Scheme (FLOS) chosen for Exercise C05A3PR utilisedSingle, rather than Dual, Alternate Flight Levels. In the case of the Single AlternateFlight Level FLOS selected, the upper vertical limit for use of the CVSM figure of1000 Feet, which is conventionally set at FL290, was raised to FL410. HemisphericalLevel conventions were retained, with Even Flight Levels being allocated toWestbound flights, and Odd Flight Levels to Eastbound flights. However, and as canbe seen by reference to Figure 11 above, choice of the Single Alternate Flight Levelsystem determined that FL310, FL350 and FL390 became Eastbound Flight Levels.
The conventions to be applied in revising the Flight Levels of selected aircraft in theyear 2005 forecast traffic sample to ensure ready integration at the newly availableRVSM Flight Levels were presented to, and agreed by, the Milano TMA WorkingGroup. Both Uni-directional and Bi-directional Routes were considered.

RAMS Simulation of Milano TMA
EUROCONTROL
39
6.2.5.1 Uni-Directional Routes
(852&21752/(1$9
PROPOSED ORGANISATION BEXERCISE C05A3PR - RVSM 2005
UNI-DIRECTIONAL ROUTES
&960 5960
FL 370
FL 360
FL 350
50%
50%
Figure 12Figure 12 above depicts the method used in allocating RVSM Flight Levels to aircraftoperating on Uni-directional Routes.
As will be seen with reference to Figure 12, the redistribution of traffic operating onUni-directional Routes to new RVSM Flight Levels was achieved by random selectionof 50% of the aircraft occupying a given Flight Level and descending those selectedto the Flight Level directly below.
6.2.5.2 Bi-directional RoutesThe allocation of RVSM Flight levels to aircraft operating on Bi-directional Routeswas somewhat more complex than in the case of Uni-directional Routes. This wasbecause Single Alternate FLOS precipitated a requirement for certain aircraft in thetraffic sample at FL 310, FL350 and FL390 to be allocated a new Flight Level,consequent upon their change in direction of flight to Southeastbound /Northwestbound.

RAMS Simulation of Milano TMA
EUROCONTROL
40
6.2.5.3 Bi-directional Routes - Northwestbound
(852&21752/(1$9
PROPOSED ORGANISATION BEXERCISE C05A3PR - RVSM 2005
BI-DIRECTIONAL ROUTES - NORTHWESTBOUND
FL 330
FL 310
FL 290
&960 5960
FL 320
FL 300
Figure 13
Figure 13 above illustrates the methodology used for the allocation of RVSM FlightLevels to Northwestbound aircraft on Bi-directional Routes.
In allocating RVSM Flight Levels to Nortwestbound aircraft on Bi-directional Routes,the following procedures were adopted:-
• Aircraft operating at FL 290 were maintained at that Flight Level. • 50% of aircraft operating at FL310, selected at random, were re-allocated RVSM
FL300. • 50% of aircraft operating at FL310, selected at random, were allocated RVSM
FL320. • 50% of aircraft operating at FL350, selected at random, were re-allocated RVSM
FL340. • 50% of aircraft operating at FL350, selected at random, were allocated RVSM
FL360.
• 50% of aircraft operating at FL390, selected at random, were re-allocated RVSMFL380.
• 50% of aircraft operating at FL390, selected at random, were allocated RVSM
FL400.

RAMS Simulation of Milano TMA
EUROCONTROL
41
6.2.5.4 Bi-directional Routes - Southeastbound
(852&21752/(1$9
PROPOSED ORGANISATION BEXERCISE C05A3PR - RVSM 2005
BI-DIRECTIONAL ROUTES - SOUTHEASTBOUND
FL 330
FL 310
FL 320
FL 310
FL 330
&960 5960
50%
Figure 14
Figure 14 above illustrates the methodology used for the allocation of RVSM FlightLevels to Southeastbound aircraft on Bi-directional Routes.
In allocating RVSM Flight Levels to Southeastbound aircraft on Bi-directional Routes,50% of those operating at each of the three CVSM Fight Levels of FL330, FL370 andFL 410 were, by random selection, re-allocated the RVSM Flight Levels of FL310,FL350 and FL390, respectively.
In actual operations the density of traffic at or above RVSM FL350 is likely to besomewhat lower than that resulting from the re-allocation procedure adopted here,the higher concentrations being expected in the FL320 - FL360 band. With studiesin respect of Flight Level Band Occupancy still in progress, and taking account of thetimeframe of this simulation, it was felt that the method adopted for RVSM FlightLevel allocation in the study was appropriate in the circumstances.
The RVSM Flight Level allocation plan with respect to Bi-directional Routes wastherefore as shown below.

RAMS Simulation of Milano TMA
EUROCONTROL
42
6.2.5.5 Bi-directional Routes - RVSM Flight Level Allocation Plan
(852&21752/(1$9
PROPOSED ORGANISATION BEXERCISE C05A3PR - RVSM 2005
BI-DIRECTIONAL ROUTES - LEVEL ALLOCATION
NORTH-WEST BOUND������������������������������������������������������������������������������������������������������������������
����������������������������������������������������������������������������������������������������������������������
SOUTH-EAST BOUND
Figure 15
Figure 15 above illustrates the RVSM Flight Level allocation arrangement used withrespect to Southeastbound and Northwestbound aircraft on Bi-directional Routesunder Proposed Organisation B Exercise C05A3PR.
When compared with the results from Proposed Organisation B Exercise C05A3P,those of Exercise C05A3PR provide a reasonable representation of the operationalbenefits that could accrue with scheduled implementation of RVSM procedureswithin ECAC Airspace in year 2001. More specifically, the comparison provides aninsight into the likely impacts upon ATC operations within the Milano TMA UpperSectors LIMMEU (FL275 - FL315), LIMMEUU (FL315 - FL460), LIMMWU (FL275 -FL315) and LIMMWUU (FL315 - FL460), at year 2005 forecast traffic levels.
Comparative analyses in terms of Controller Workload in the Upper Sectors, andTotal Working Time over 24 Hours for the Upper Sectors is presented hereafter.

RAMS Simulation of Milano TMA
EUROCONTROL
43
6.2.5.6 Controller Workload in the Upper Sectors
(852&21752/(1$9
PROPOSED ORGANISATION BCONTROLLER WORKLOAD 2005 ARN3UPPER SECTORS (NO RVSM v RVSM)
0
10
20
30
40
50
60
70
80
90
100
EU EUU WU WUU
Sectors
Per
cen
tag
e o
n 3
Ho
urs
EC/PC - C05A3P
EC/PC - C05A3PR
Figure 16
Figure 16 above depicts Executive and Planning Controller Workload three houraverage values recorded in respect of the Milano TMA Upper Sectors LIMMEU(FL275 - FL315), LIMMEUU (FL315 - FL460), LIMMWU (FL275 - FL315) andLIMMWUU (FL315 - FL460), at year 2005 forecast traffic levels.
Chart columns depicted in Blue represent Controller Workloads, in respect of bothExecutive and Planning Controllers, recorded when using Version 3 of the ATSRoute Network (ARN) within ECAC Airspace, but without the implementation ofRVSM.
Chart columns depicted in Red represent Controller Workloads, in respect of bothExecutive and Planning Controllers, recorded when using Version 3 of the ATSRoute Network (ARN) within ECAC Airspace, with RVSM implemented.
With respect to the effects of the implementation, or not, of RVSM, Figure 16 abovefails to provide a uniformly conclusive pattern of results in terms of ControllerWorkload values recorded across the spectrum of Sectors examined. While SectorsLIMMEU and LIMMWU each show little variance in the values recorded with, orwithout, implementation of RVSM, Upper Sectors LIMMEUU and LIMMWUU producemore tangible differences. Whereas, Sector LIMMEUU recorded a reduction inController Workload values with implementation of RVSM, Sector LIMMWUUproduced the opposite result, with increases in Controller Workload values in respectof both Executive and Planning Controller positions.

RAMS Simulation of Milano TMA
EUROCONTROL
44
With the implementation of RVSM in Sectors LIMMEU and LIMMWU, only one extraFlight Level (FL300) was made available in each case, whereas, Sectors LIMMEUUand LIMMWUU acquired five extra Flight Levels (FL320, FL340 , FL360, FL380 andFL400) in the same circumstance.
Whether the re-assignment of aircraft to newly available Flight Levels might facilitateor obstruct traffic flows on certain Transit Routes through Sector LIMMEUU and / orSector LIMMWUU is not known. Indeed, another traffic sample, handled in exactlythe same way as that used here, might well produce a completely different set ofresults.
6.2.5.7 Total Working Time over 24 Hours - Upper Sectors
(852&21752/(1$9
PROPOSED ORGANISATION BWORKING TIME 2005 ARN3
UPPER SECTORS (NO RVSM v RVSM)
0
100
200
300
400
500
600
700
Wo
rkin
g T
ime
ove
r 24
Ho
urs
(m
inu
tes) EU EUU WU WUU
Figure 17
Figure 17 above depicts the Working Time in Minutes recorded over a 24 Hourperiod in respect of Milano TMA Upper Sectors LIMMEU (FL275 - FL315), LIMMEUU(FL315 - FL460), LIMMWU (FL275 - FL315) and LIMMWUU (FL315 - FL460)respectively, using year 2005 forecast traffic levels.
Chart columns depicted in Blue represent Working Times recorded when usingVersion 3 of the ATS Route Network (ARN) within ECAC Airspace, but without theimplementation of RVSM.
Chart columns depicted in Red represent Working Times recorded when usingVersion 3 of the ATS Route Network (ARN) within ECAC Airspace, with RVSMimplemented.

RAMS Simulation of Milano TMA
EUROCONTROL
45
Reference to Figure 17 shows that, with the single exception of Upper SectorLIMMWUU, in which no changes were recorded, lower Working Time values wereachieved in all other Upper Sectors with implementation of RVSM.
6.3 Proposed Organisation CThe benefits obtainable by comparing the results of different exercises in multi-organisational studies, particularly those involving forecast traffic levels, can beclearly seen in the case of Proposed Organisation B Exercise C05A3P.
Exercise C05A3P, which used year 2005 forecast traffic levels, the ARN3 RouteNetwork Structure in the Upper Sectors, and OLDI Links between Milano andMarseille below FL195 giving a reduction in co-ordination time from 22 Seconds to 4Seconds, identified Executive Controller Workload values in the Severe category inall En-Route Sectors, with the exception of LIMMWSTH and LIMMWUU. Indeed, theExecutive Controller Workload values measured with respect to the Arrival /Departure Sector LIMMADN actually exceeded capacity parameter limits, while thoseof the LIMMADS Sector attained the maximum value. These results highlighted therequirement on the part of the Appropriate Authority to introduce timely andappropriate remedial procedures to ensure that the safety of flight operations is notcompromised as traffic demands approach these levels.
In order to address these problems, and because they had particular relevance tooperations at Milan, the Milano ACC Working Group developed alternativeconfigurations based upon the Arrival and Departure Sectors LIMMADN andLIMMADS. As it was considered that the results from the modelling of theseconfigurations would greatly assist the forthcoming Real Time Simulation of MilanoTMA scheduled for January 1999, the EUROCONTROL EEC / AMS Team agreed toinclude them in the study, despite their late introduction. No solutions to theproblems encountered in the En-Route Sectors, Control of which is scheduled topass to ROMA ACC in year 2000, or in the Intermediate Sectors LIMMEN, LIMMESor LIMMWNRT, were proposed.
6.3.1 General ParametersProposed Organisation C simulated forecast traffic levels in respect of years 1998,2000 and 2005.
6.3.2 Different Scenarios ConsideredTwo different Scenarios were considered under Proposed Organisation C as follows:-Scenario 1The Airspace of the LIMMADN and LIMMADS Sectors was reconfigured byincreasing the lateral dimensions thereof, thereby precipitating the creation of twoadditional Sectors LIMMADE and LIMMARR.
Proposed Organisation C Sectorisation - Vertical Limits - Scenario 1SECTOR LIMMADN LIMMADS LIMMADE LIMMARR XXXXXX
SCENARIO FLIGHT LEVELSScenario 1 ↑ FL185 ↑ FL175 ↑ FL185* ↑ FL095 xxxxxxx
* The portion of LIMMADE replacing the Airspace originally under the control ofLIMMADS had a maximum upper limit of FL175.
Table 7

RAMS Simulation of Milano TMA
EUROCONTROL
46
Table 7 above depicts the Vertical Limits of the Sectors used in Scenario 1 ofProposed Organisation C.Scenario 2Scenario 2 consisted of the Airspace layout described under Scenario 1, plus that ofan additional Sector LIMMDEP, as illustrated below.
Proposed Organisation C Sectorisation - Vertical Limits - Scenario 2SECTOR LIMMADN LIMMADS LIMMADE LIMMARR LIMMDEP
SCENARIO FLIGHT LEVELSScenario 2 ↑ FL185 ↑ FL175 ↑ FL185* ↑ FL095 ↑ FL095* The portion of LIMMADE replacing the Airspace originally under the control ofLIMMADS had a maximum upper limit of FL175.
Table 8
Table 8 above depicts the Vertical Limits of the Sectors used in Scenario 2 ofProposed Organisation C.
6.3.3 Exercises ConductedProposed Organisation C consisted of three exercises designed to test thealternative configurations suggested by the Milano ACC Working Group. The firsttwo of these were tested under Scenario 1 and the third under Scenario 2. Details ofthe three exercises conducted are as follows:-
Exercise C98A2P1Exercise C98A2P1 simulated forecast traffic levels in respect of year 1998,combined with the revised Sectorisation of Scenario 1, and the appropriate VerticalLimits expressed in Table 7, respectively.
Exercise C002AP1Exercise C002AP1 simulated forecast traffic levels in respect of year 2000,combined with the revised Sectorisation of Scenario 1, and the appropriate VerticalLimits expressed in Table 7, respectively.
Exercise C05A3P1Exercise C05A3P1 simulated forecast traffic levels in respect of year 2005,combined with the revised Sectorisation of Scenario 2, and the appropriate VerticalLimits expressed in Table 8, respectively.
6.3.4 Exercise ParametersIn each of the exercises, modifications to ATC procedures, appropriate to theScenario being simulated, were implemented. These modifications included thefollowing:-
• Malpensa Arrivals via LUSIL to SRN to route LUSIL - COD. • Malpensa Departures via NIZ on the FARAK SID - (thereafter - LAGEN -
KEPPO - NIZ) to use RMG SID - (thereafter - BLA-TOP-LAGEN-KEPPO-NIZ).

RAMS Simulation of Milano TMA
EUROCONTROL
47
• Malpensa Departures via KINES on the FARAK SID - (thereafter - TOP-KINES)to use the RMG SID - (thereafter - BLA-TOP-KINES).
• Malpensa Departures via GEN on the FARAK SID - (thereafter - VOG-GEN) to
use the RMG SID - (thereafter - BLA-TOP-ASTOR-TESTO-GEN). • Malpensa Departures via TOP on the FARAK SID - (thereafter - TOP), and
landing at Torino (LIMF), to use the RMG SID - (thereafter - BLA-TOP).
The original time allocation in respect of Traffic Sequencing R/T Tasks (i.e.Vectoring, Altitude and Speed Control etc.) with respect to Sectors LIMMADN andLIMMADS was reduced from 40 Seconds to 10 Seconds per instance. The timeallocation in respect of Traffic Sequencing R/T Tasks in the newly created LIMMADESector was set at 10 Seconds per instance, while a figure of 30 Seconds was used inthe LIMMARR Sector since it was anticipated that the bulk of the Controller Workloadgenerated by Traffic Sequencing would occur in that Sector.
In view of the severe time constraints imposed by the Study Timetable thesechanges could be reasonably regarded as an attempt to supply a quick-fix solution tothe difficult problem of providing a more equitable distribution of Controller Workloadthroughout the various Sectors concerned.
6.3.5 Executive Controller Workload
(852&21752/(1$9
PROPOSED ORGANISATION CEXECUTIVE CONTROLLER WORKLOAD
OPTIONAL SCENARIOS 1998 - 2005
0
10
20
30
40
50
60
70
80
90
100
LIMMADN LIMMADS LIMMADE LIMMARR LIMMDEP
Sectors
Per
cen
tag
e o
n 3
Ho
urs C98A2P1 C00A2P1 C05A3P1
Figure 18
Figure 18 above depicts the Average Three Hour Loadings measured in respect ofthe Executive Controller positions in each of the three exercises conducted underScenarios 1 and 2 of Proposed Organisation C.

RAMS Simulation of Milano TMA
EUROCONTROL
48
Columns depicted in Blue represent values measured under Exercise C98A2P1.
Columns depicted in Green represent values measured under Exercise C00A2P1.
Columns depicted in RED represent values measured under Exercise C05A3P1.
Reference to Figure 18 above shows that, with respect to both Exercise C98A2P1and Exercise C00A2P1 under Scenario 1, using years 1998 and 2000 forecast trafficsample levels respectively, the reconfiguration of the Sectors responsible for Arrivals/ Departures to / from both Malpensa and Linate Airports resulted in acceptableExecutive Controller Workload values. Executive Controller Workload was Moderatein Sectors LIMMADS and LIMMADE, and marginally above the minimum limit of theHeavy category in Sectors LIMMADN and LIMMARR.
It should be borne in mind that these results were only possible with the provision oftwo extra Sectors.
Further reference to Figure 18 above shows that, with particular respect to ExerciseC05A3P1, which used year 2005 forecast traffic levels combined with the revisedSectorisation of Scenario 2, and the appropriate Vertical Limits outlined in Table 8,the results obtained were not as encouraging as those from Exercises C98A2P1 orC00A2P1 above, despite the addition of an extra Sector LIMMDEP.
Executive Controller Workload values classified as Severe were identified in respectof Sectors LIMMADN and LIMMARR, while Sector LIMMADE produced values in theHeavy category. Of these, Sectors LIMMADN and LIMMADE each handled a singleHoldstack at SRN and COD, respectively. Despite the fact that it handled the twoHoldstacks at VOG and GOLTO, Sector LIMMADS suffered no Executive ControllerWorkload problems.
Future re-definition of the ATC Procedures e.g. the SIDS / STARS may offer someanswers to the problems seen above. Improvements might also accrue from:-
• Refinement of Holdstack Management by the provision of Stack Controllers orStack Co-ordinators.
• Improved co-ordination procedures with Sector LIMMARR in respect of aircraft
leaving the four separate Holdstacks. • Use of a Co-ordinator in any Sector when dictated by traffic demand. • Use of two Radar Rated Executive Controllers, rather than one Executive
Controller and one Planning Controller, to assist in the re-distribution of criticalhigh Workload ATC Task categories such as R/T and Radar.
Both Fast Time and Real Time simulation of Air Traffic Control Systems presentlysuggests that the role of the Planning Controller will diminish in the future, thusprompting research projects into such areas as Multi-Sector Planning (MSP). Indeed,Work Package 6 of TOSCA (Testing Operational Scenarios for Concepts in ATM)examines the potential applications of MSP.

RAMS Simulation of Milano TMA
EUROCONTROL
49
6.4 Proposed Organisation DProposed Organisation D was simulated to determine the Sector Capacity of allSectors in the Milano TMA, in order to enable updating of the data in use at theCFMU.
6.4.1 Capacity Determination - TechniqueThe capacity estimation technique used in RAMS is based upon the theory that ATCcapacity can be defined as the maximum number of aircraft that can enter aparticular Control Area within a specified period, while still permitting an acceptablelevel of Controller Workload. This Controller Workload level is known as the HeavyLoad Threshold (HLT).
The following technique is applied in respect of each Sector simulated:-
• Simulate a sufficiently large traffic sample for the area of interest in order topermit the generation of a suitable number of distinct Traffic / Workloadrelationships
(852&21752/(1$9
PROPOSED ORGANISATION DSECTOR CAPACITY ASSESSMENT
Figure 19
Figure 19 above illustrates how a sample Traffic / Workload relationship might begenerated.

RAMS Simulation of Milano TMA
EUROCONTROL
50
• Make an average assessment for the three main levels of Controller Workload(Moderate, Heavy and Severe), with the provision that ultra high and ultra lowvalues are excluded so that there are no distortion effects, and that the width ofeach Loading band is sufficient to allow for variance due to conflict load effects.
(852&21752/(1$9
PROPOSED ORGANISATION DSECTOR CAPACITY ASSESSMENT
Figure 20
• Identify a formula to suit the relationship between Traffic Loading and ControllerWorkload.
(852&21752/(1$9
PROPOSED ORGANISATION DSECTOR CAPACITY ASSESSMENT
Figure 21

RAMS Simulation of Milano TMA
EUROCONTROL
51
• Apply this formula to estimate the average Traffic Loading that would representthe defined Heavy Load Threshold (HLT).
(852&21752/(1$9
PROPOSED ORGANISATION DSECTOR CAPACITY ASSESSMENT
Figure 22 Note 1 The use of Workload estimates from a model based simulation assumes that the
model is calibrated sufficiently well to give reasonable assessment of Workload, andthat the defined HLT is suitable for that calibration.
In modelling, the determination of qualitative values (Heavy Load, Severe Load etc.)
from quantitative values (Numbers) is, of necessity, a function of the realism orfidelity of the particular model to that of the real world environment being simulated,appropriately factored by experience gleaned from previous simulations, or in thefield. The thresholds used by the RAMS simulator tool are based upon those appliedby the EUROCONTROL ATC Capacity Analyser (CAPAN), which, in turn, have beenvalidated by several real-time studies.
Note 2 It is stressed that ENAV is solely responsible for the issue of Declared Capacity
Values in respect of its Sectors. It is axiomatic therefore that the values presentedand / or considered in this document should, under no circumstances, be construedas being Declared Capacity Values.
6.4.2 Parameters - GeneralProposed Organisation D simulated forecast traffic levels in respect of year 2005only.

RAMS Simulation of Milano TMA
EUROCONTROL
52
6.4.3 Exercises Conducted - Proposed Organisation DProposed Organisation D consisted of exercise C05A3P only. Exercise C05A3Psimulated forecast traffic levels for year 2005, utilising the ARN3 Route NetworkStructure for the Upper Sectors. OLDI links were implemented between Milano andMarseille below FL195.
6.4.4 Sector Capacity Assessment Results - All Sectors Examined
(852&21752/(1$9
PROPOSED ORGANISATION D
SECTOR CAPACITY ASSESSMENT RESULTS
LIMMADN38
LIMMADS29
LIMMEN50
LIMMES38
LIMMEU35
LIMMEUU37
LIMMWNRT39
LIMMWSTH41
LIMMWU37
LIMMWUU39
Figure 23
Figure 23 above depicts a result table in respect of the capacity assessmentsconducted for all of the Sectors examined under Proposed Organisation D.
Capacity assessment graphs with respect to the results obtained from examination ofthe individual Sectors are contained in the following pages.

RAMS Simulation of Milano TMA
EUROCONTROL
53
6.4.5 Sector Capacity Assessment Results - Individual Sectors
(852&21752/(1$9
PROPOSED ORGANISATION DSECTOR CAPACITY ASSESSMENT
SECTOR LIMMADN
0
10
20
30
40
50
60
70
80
90
100
0 5 10 15 20 25 30 35 40 45 50 55 60 65 70 75 80 85 90 95 100
Number of Flights
Per
cen
tag
e W
ork
load
HLT
38
Figure 24
Figure 24 above shows the graph resulting from the Sector Capacity Assessmentconducted under Exercise C05A3P, with respect to Sector LIMMADN.
The horizontal line depicted in Red represents the Heavy Load Threshold (HLT) of70%. The 70% threshold, which is based upon empirical experimentation,corresponds to 42 minutes measured working time in one hour, leaving 18 minutesavailable for other Tasks that are not defined within the simulation parameters, andfor general recuperation.
The intersection of the Black trend line with the Red HLT line, and as read from theX-axis of the graph, determines the result predicted by the RAMS simulator tool.
Experience gained with other capacity estimation tools such as CAPAN indicatesthat, although correctly derived mathematically, the values determined by the RAMSSimulator tend to be too high, and hence, operationally unrealistic. After several runsof the simulation using CAPAN the analyser determines the resulting Workloads onthe control positions, and based upon this analysis, proceeds to increase ordecrease the traffic flows. The simulation is then re-run and re-analysed, thus givinga more accurate operational assessment of the capacity values determined.
In order to compensate for the over estimation of capacity values described above,the EUROCONTROL Study Team further analysed the “point-clouds” in the graph foreach Sector to identify the worst case value that would offer an operationally realisticand safe assessment of Sector capacity. This determination of the Sector capacity isdepicted by the Green line, which includes a Yellow Box indicating the final result.

RAMS Simulation of Milano TMA
EUROCONTROL
54
(852&21752/(1$9
PROPOSED ORGANISATION DSECTOR CAPACITY ASSESSMENT
SECTOR LIMMADS
0
10
20
30
40
50
60
70
80
90
100
0 5 10 15 20 25 30 35 40 45 50 55 60 65 70 75 80 85 90 95 100
Number of Flights
Per
cen
tag
e W
ork
load
HLT
29
Figure 25
Figure 25 above shows the graph resulting from the Sector Capacity Assessmentconducted under Exercise C05A3P, with respect to Sector LIMMADS.
(852&21752/(1$9
PROPOSED ORGANISATION DSECTOR CAPACITY ASSESSMENT
SECTOR LIMMEN
0
10
20
30
40
50
60
70
80
90
100
0 5 10 15 20 25 30 35 40 45 50 55 60 65 70 75 80 85 90 95 100
Number of Flights
Per
cen
tag
e W
ork
load
HLT
50
Figure 26
Figure 26 above shows the graph resulting from the Sector Capacity Assessmentconducted under Exercise C05A3P, with respect to Sector LIMMEN.

RAMS Simulation of Milano TMA
EUROCONTROL
55
(852&21752/(1$9
PROPOSED ORGANISATION DSECTOR CAPACITY ASSESSMENT
SECTOR LIMMES
0
10
20
30
40
50
60
70
80
90
100
0 10 20 30 40 50 60 70 80 90 100
Number of Flights
Per
cen
tag
e W
ork
load
HLT
38
Figure 27
Figure 27 above shows the graph resulting from the Sector Capacity Assessmentconducted under Exercise C05A3P, with respect to Sector LIMMES.
(852&21752/(1$9
PROPOSED ORGANISATION DSECTOR CAPACITY ASSESSMENT
SECTOR LIMMEU
0
10
20
30
40
50
60
70
80
90
100
0 5 10 15 20 25 30 35 40 45 50 55 60 65 70 75 80 85 90 95 100
Number of Flights
Per
cen
tag
e W
ork
load
HLT
35
Figure 28
Figure 28 above shows the graph resulting from the Sector Capacity Assessmentconducted under Exercise C05A3P, with respect to Sector LIMMEU.

RAMS Simulation of Milano TMA
EUROCONTROL
56
(852&21752/(1$9
PROPOSED ORGANISATION DSECTOR CAPACITY ASSESSMENT
SECTOR LIMMEUU
0
10
20
30
40
50
60
70
80
90
100
0 5 10 15 20 25 30 35 40 45 50 55 60 65 70 75 80 85 90 95 100
Number of Flights
Per
cen
tag
e W
ork
load
HLT
37
Figure 29
Figure 29 above shows the graph resulting from the Sector Capacity Assessmentconducted under Exercise C05A3P, with respect to Sector LIMMEUU.
(852&21752/(1$9
PROPOSED ORGANISATION DSECTOR CAPACITY ASSESSMENT
SECTOR LIMMWNRT
0
10
20
30
40
50
60
70
80
90
100
0 5 10 15 20 25 30 35 40 45 50 55 60 65 70 75 80 85 90 95 100
Number of Flights
Per
cen
tag
e W
ork
load
HLT
39
Figure 30
Figure 30 above shows the graph resulting from the Sector Capacity Assessmentconducted under Exercise C05A3P, with respect to Sector LIMMWNRT.

RAMS Simulation of Milano TMA
EUROCONTROL
57
(852&21752/(1$9
PROPOSED ORGANISATION DSECTOR CAPACITY ASSESSMENT
SECTOR LIMMWSTH
0
10
20
30
40
50
60
70
80
90
100
0 5 10 15 20 25 30 35 40 45 50 55 60 65 70 75 80 85 90 95 100
Number of Flights
Per
cen
tag
e W
ork
load
HLT
41
Figure 31
Figure 31 above shows the graph resulting from the Sector Capacity Assessmentconducted under Exercise C05A3P, with respect to Sector LIMMWSTH.
(852&21752/(1$9
PROPOSED ORGANISATION DSECTOR CAPACITY ASSESSMENT
SECTOR LIMMWU
0
10
20
30
40
50
60
70
80
90
100
0 5 10 15 20 25 30 35 40 45 50 55 60 65 70 75 80 85 90 95 100
Number of Flights
Per
cen
tag
e W
ork
load
HLT
37
Figure 32
Figure 32 above shows the graph resulting from the Sector Capacity Assessmentconducted under Exercise C05A3P, with respect to Sector LIMMWU.

RAMS Simulation of Milano TMA
EUROCONTROL
58
(852&21752/(1$9
PROPOSED ORGANISATION DSECTOR CAPACITY ASSESSMENT
SECTOR LIMMWUU
0
10
20
30
40
50
60
70
80
90
100
0 5 10 15 20 25 30 35 40 45 50 55 60 65 70 75 80 85 90 95 100
Number of Flights
Per
cen
tag
e W
ork
load
HLT
39
Figure 33
Figure 33 above shows the graph resulting from the Sector Capacity Assessmentconducted under Exercise C05A3P, with respect to Sector LIMMWUU.

RAMS Simulation of Milano TMA
EUROCONTROL
59
7. RAMS Study - Conclusions / Recommendations
The objectives of the Study were:-
• To evaluate the effects, in terms of Controller Workload, of the planned transferof the majority of aircraft operations from Linate Airport to Malpensa Airport.
• To assess the impacts of the implementation of ARN2 / ARN3 Route Network
Structures using several proposed new Airspace Organisations and operationalparameters, and to identify the most advantageous thereof for considerationtoward eventual implementation.
• To determine existing Sector Capacity within the Milano TMA in order to enable
updating of the data presently in use at the CFMU.
Reference Organisation A evaluated the progressive migration of traffic from LinateAirport to Malpensa Airport. A major effect of this migration, when completed, was areversal in the balance of traffic recorded with respect to Sectors LIMMADN andLIMMADS, when compared with those of the original traffic sample.
A significant contributing factor to the changes in Sector Traffic Loading betweenSectors ADN and ADS was that, Departures from Linate to the South using PARMAand GENOVA SIDs penetrated Sector ADS, and were recorded as such. Whenoperating from Malpensa Airport these Departures penetrated Sector ADN, andirrespective of the fact that they might, or not, have passed through a small portion ofSector ADS on their southbound FARAK SID climb-out, were neverthelesstransferred directly to the Control of the overlying Sector appropriate to that portion ofSector ADS. Such aircraft movements were therefore not recorded in the ADSSector.
In effect, the planned migration of traffic from Linate Airport to Malpensa Airport co-incidentally and satisfactorily redressed the significant imbalance in ExecutiveController Workload that had hitherto existed between Sectors ADN and ADS.However, and despite the very acceptable balance that now existed, ExecutiveController Workload values, even though they were based upon year 1998 forecasttraffic samples, were still classified as being Heavy to Severe. Urgent remedialprocedures, whether operational or organisational, will therefore be required ifforecast traffic levels in respect of years 2000 and 2005 are to be safely andefficiently accommodated.
The Executive Controller Workload levels in respect of the other Sectors wereModerate to Heavy.
With implementation of the revised airspace layout tested under ProposedOrganisation B, Sector penetrations in respect of the WNRT / WSTH Sectorisationconfiguration produced values some 20% lower than those recorded when using theWTER / WAWY arrangement. This indicated that the proposed configuration wasconsiderably more efficient than that in use in 1997.Implementation of ARN3 under Exercise C00A3P produced little effect in terms ofchanges to either Executive or Planning Controller Workload values. This was largely

RAMS Simulation of Milano TMA
EUROCONTROL
60
due to the fact that the route changes envisaged under the Pan-European plan didnot materially alter the existing entry / exit arrangements with respect to the MilanoTMA. In effect, had a much larger sample of Airspace been examined, the impactsof changes to traffic flow patterns and other parameters resulting from theimplementation of ARN3 might perhaps have been more easily detected andquantified.
Of greater interest were the high Controller Workload measurements recorded whenoperating with year 2000 forecast traffic levels. Executive Controller Workloadsincreased significantly, being classified as Severe in Sectors LIMMADN andLIMMADS, and as Moderate / Heavy in all other Sectors.
With the exception of Sector LIMMWSTH, Executive Controller Workload valuesrecorded when operating with year 2005 forecast traffic levels were classified asHeavy / Severe. Indeed, the Arrival / Departure Sector LIMMADN actually exceededcapacity parameter limits, while that of LIMMADS attained the maximum value.These results pointed to the very serious Executive Controller Workload problemsthat can be anticipated with increase in traffic levels to those forecast for year 2005,and to the requirement on the part of the Appropriate Authority to introduce timelyand appropriate remedial procedures to ensure that the safety of flight operations isnot compromised as traffic demands approach these levels.
Planning Controller Workload levels were Moderate in all Sectors. This was mainlydue to the enhancements in co-ordination procedures anticipated with the fullimplementation of OLDI Links with adjacent ATSUs.
With particular reference to Holdstacks simulated in the study, it should be noted thatthe RAMS system has not, as yet, attained the facility to process the specification,definition, operation and evaluation of Holdstack data to the exacting standardsdemanded for ATC operations. That is to say, the TMA functionalities of the systemare presently unable to accurately quantify operational parameters relating to correctHolding Techniques, Runway Scheduling for Arrivals and Departures, and MultipleHoldstack Management using different Approach Sectors. It is neverthelessconsidered that the results that were produced can be used to provide a reasonablyrealistic indication of the difficulties and delays to be anticipated using both currentand future traffic levels. In addition, and since each exercise used the same basicspecification, comparative analysis of data derived may be effected with areasonable degree of confidence.
Following the migration of traffic from Linate Airport to Malpensa Airport the 24 HourWorking Time values measured in respect of Holdstack operations between the twoArrival / Departure Sectors ADN and ADS were more evenly balanced.
With reference to the previous paragraph, it should be borne in mind that the ADNSector was responsible for one Holdstack at Saronno (SRN) which, by virtue of itslocation, is affected by all Arrivals from Northern Europe to both Linate andMalpensa, and by Northbound Departures from Linate and Eastbound Departuresfrom Malpensa. In addition, the fact that it is situated close to the Alps, and betweenthe Arrival / Departure Routes to / from Linate, Malpensa, Lugano and Bergamosuggests that considerable operational difficulties will be presented with the onset ofthe traffic levels forecast for the early part of the next century. Sector ADS handledthree Holdstacks at Voghera (VOG), Golto (GOLTO) and Codogno (COD).

RAMS Simulation of Milano TMA
EUROCONTROL
61
With respect to the effects of the implementation of RVSM, the pattern of results interms of Controller Workload values recorded across the spectrum of Sectorsexamined was not uniformly conclusive. While Sectors LIMMEU and LIMMWU eachshowed little variance in the values recorded with, or without, implementation ofRVSM, Upper Sectors LIMMEUU and LIMMWUU produced more tangibledifferences. Whereas, Sector LIMMEUU recorded a reduction in ControllerWorkload values with implementation of RVSM, Sector LIMMWUU produced theopposite result, with increases in Controller Workload values in respect of bothExecutive and Planning Controller positions.
With the implementation of RVSM in Sectors LIMMEU and LIMMWU, only one extraFlight Level (FL300) was made available in each case, whereas, Sectors LIMMEUUand LIMMWUU acquired five extra Flight Levels (FL320, FL340 , FL360, FL380 andFL400) in the same circumstance.
Whether the re-assignment of aircraft to newly available Flight Levels eitherfacilitated or obstructed traffic flows on certain Transit Routes through SectorLIMMEUU and / or Sector LIMMWUU is not known. Indeed, another traffic sample,handled in exactly the same way as that used in this instance, might well produce acompletely different set of results.
It is interesting to note that, with the single exception of Upper Sector LIMMWUU, inwhich no changes were recorded, lower Working Time values were achieved in allUpper Sectors with implementation of RVSM.
In order to address the serious Executive Controller Workload problemsencountered with both years 2000 and 2005 forecast traffic levels, and becausethese had particular relevance to operations in the Milano TMA, the Milano ACCWorking Group developed alternative configurations based upon the Arrival andDeparture Sectors LIMMADN and LIMMADS. As it was considered that the resultsfrom the modelling of these configurations would greatly assist the forthcoming RealTime Simulation of Milano TMA scheduled for January 1999, the EUROCONTROLEEC / AMS Team agreed to include them in the study, despite their late introduction.No solutions to the problems encountered in the En-Route Sectors, Control of whichis scheduled to pass to ROMA ACC in year 2000, or in the Intermediate SectorsLIMMEN, LIMMES or LIMMWNRT, were proposed.
Under Proposed Organisation C the Optional Scenarios simulated did result in areduction in the Severe / Heavy Executive Controller Workload values seen withrespect to year 2005 forecast traffic levels in Proposed Organisation B, particularly inthe LIMMADN and LIMMARR Sectors. In reality however, and particularly in view ofthe severe time constraints imposed by the Study Timetable, the introduction ofthese optional Scenarios could reasonably be regarded as an attempt to supply aquick-fix solution to the difficult problem of providing a more equitable distribution ofController Workload throughout the various Sectors concerned.The root cause of the high Executive Controller Workload values recorded underProposed Organisation B may well lie in the high values obtained in the simulationwith respect to R/T Communications and Radar related Tasks. These shortcomingsmight well be successfully addressed by one or more of the following:-
• Re-definition of ATC Procedures. • Revision of SIDS / STARS.

RAMS Simulation of Milano TMA
EUROCONTROL
62
• Refinement of Holdstack Management by the provision of Stack Controllers or
Stack Co-ordinators. • Improved co-ordination procedures with Sector LIMMARR in respect of aircraft
leaving the four separate Holdstacks. • Use of a Co-ordinator in any Sector, as and when dictated by traffic demand. • Use of two Radar Rated Executive Controllers, rather than one Executive
Controller and one Planning Controller, to assist in the re-distribution of criticalhigh Workload ATC Task categories such as R/T Communications.
• The provision of equipment that could provide functionalities such as Medium or
Short Term Conflict Alert.
With respect to the Capacity Assessments determined in this study, it should benoted that experience gained with other capacity estimation tools such as CAPANindicates that, although correctly derived mathematically, the values determined bythe RAMS Simulator tend to be too high, and hence, operationally unrealistic. Inorder to compensate for this over estimation of capacity values the EUROCONTROLStudy Team further analysed the “point-clouds” in the graphs for each Sector in orderto identify the worst case value that would offer an operationally realistic and safeassessment of Sector capacity.
On the subject of Capacity, it is stressed that ENAV is solely responsible for thedetermination of Declared Capacity Values in respect of its Sectors. It is axiomatictherefore that the values presented and / or considered in this document should,under no circumstances, be construed as constituting Declared Capacity Values.
In conclusion, it should be borne in mind that in Fast-Time model simulations themeasurement of workload is derived from the mathematical calculation of the totalworking times recorded for each ATC Task Category (Flight Data Management; Co-ordinations; Conflict Search; Routine R/T; Radar etc.). The standard execution timesfor these Tasks can not be dynamically altered during the course of a simulationexercise.
In reality however, and at times of severe Executive Controller Workload, theexecution times of many of these Tasks are accelerated. In fact some Tasks relatingto Flight Data Management and R/T Communications are often not executed at all. Inaddition, the Planning Controller may assist the Executive Controller by handling theinternal and external Co-ordination Tasks normally attributed to the ExecutiveController.
Another element not considered in these simulations is that of Random SystemEffects. That is to say, the effects of system failures, non-standard operationscovering aircraft alerts and emergencies, and of inclement weather upon operations.Such effects can have a significant impact on Controller Workload, and hence uponthe capacity of the Sector.

RAMS Simulation of Milano TMA
EUROCONTROL
63
Sector Capacity declared to the CFMU must always be based on normal operatingconditions. Where random effect situations occur the CFMU should be requested toadjust the protection required.

RAMS Simulation of Milano TMA
EUROCONTROL
64
Intentionally Left Blank

RAMS Simulation of Milano TMA
EUROCONTROL
65
APPENDIX I
Re-Organised ATC MathematicalSimulator
Simulation of the Milano TMA
Project SIM-F-E1 (F14)
ATC TASK SPECIFICATIONS
This APPENDIX contains the Definitions and Task Execution Times used in thisstudy with respect to the Milano TMA.

RAMS Simulation of Milano TMA
EUROCONTROL
66

RAMS Simulation of Milano TMA
EUROCONTROL
67
MILANO TMA ATC Task Specifications
The specification and definition of Tasks in the RAMS Simulator is inherent to thetool’s simulation event philosophy. The RAMS Simulator is, in effect, an ATC EventGenerator that reports its discreet Events, or Triggers, thereby enabling the Modellerto program a unique set of activities, including user-defined sets of ATC Tasks andATC Participants as required, to perform a simulation project. The ATC Participantsare those ATCO Positions described for the Sector manning arrangements.
ATC Task sets are grouped by Category. The main Categories used in the MilanoTMA study were as follows:-
• Flight Data Management (Fgt. Data) • Co-ordination (Co-ord) - within both the simulated ATCU and with other
concerned ATCUs. • Conflict Search (C/Search) - to formulate ATC Clearances. • Routine R/T Communications (R/T). • Radar (Radar) - to represent Radar activities such as Conflict Detection and
Resolution. • Holdstack (Stack) - to measure activities related to Holdstack Management.
All ATC Tasks are activated by a pre-defined Trigger. The Trigger (e.g. ATC SectorPierce) is the event that initiates / ensures the recording of a specific ATC Task.
Each ATC Task is allocated a Weighting. The Weighting concerned is an arbitraryunit value assigned to the Task’s Actor when triggered by a simulation event.Examples of unit values would be - Time in Seconds, in the case of a ControllerWorkload study, or Units of Cost, in a Cost Benefit study.
The Time specified is the average time spent on the Task by an experienced andfully trained Controller, ignoring extreme situations which could favourably orunfavourably affect the standard execution time.
The Weighting allocated is not intended to represent the actual duration of the Task,but the amount of time the Controller is considered to be totally committed to theTask, to the exclusion of all other Tasks.
In certain cases a Task may involve more than one Control Position, and differentWeightings may be allocated to each.
Different Weightings may be allocated to the same Task occurring in differentSectors.
A Time Offset can be applied to each Task. The Time Offset, defined in Seconds,affords the Modeller the flexibility to record a Task before or after a specified Trigger.

RAMS Simulation of Milano TMA
EUROCONTROL
68
Where one Trigger instigates multiple activities, these can be specified to occur atdifferent times.
All Tasks are related to an Object. An Object is defined as the place or positionwhere the Task is recorded. This may be defined either globally for All ControlCentres, or more specifically in respect of a particular Control Centre, Sector, Airport,Navigational Aid etc.
The dynamic conditions of all Tasks can be fine-tuned to afford the highest degree offlexibility to the ATC Task specification.
The specification and definition of all ATC Tasks used in this study were developedby both the Milano ACC and the EUROCONTROL EEC / AMS Working Groupmembers.
Controller Percentage LoadingATC Tasks are allocated to Control positions in accordance with the Sectorisationmanning and distribution of duties specified for each Sector simulated. The RAMSSimulator can therefore calculate both the actual Workload, and the PercentageLoading, on each position. Results can be obtained for either the entire simulationperiod, or for specified peak periods, as required.
Note: The analysis presented in this Report is based upon three hour peak periodsidentified within the 24 hour simulation runs conducted for each exercise.
In general, the values used in the interpretation of Controller Loadings are:
• Peak Hour Percentage Loading, and• Average Percentage Loading.
Peak Hour Percentage Loading represents the total time spent by a workingposition on the Tasks recorded by the RAMS Simulator during the busiest 60 minuteperiod for that position, and is expressed as a percentage of that 60 minutes. Theactual time of the peak hour varies from one position to another. Peak HourPercentage Loading is used to assess Workload problems on individual workingpositions.
Average Percentage Loading represents the total time spent by a working positionon the Tasks recorded by the RAMS Simulator for the duration of a simulationexercise (or part thereof, in excess of one hour), and is expressed as a percentage ofthat time. A peak three hour duration is normally selected when simulation exercisesexceed 12 hours. Average Percentage Loading is used primarily to assess thebalance of Workload between working positions, especially in Sectors in the samearea of the airspace being simulated. It may also be used to compare resultsobtained from different Organisations.
In order to assist in the interpretation of these Loadings approximate criteria are usedto describe each level as follows:Severe Peak Hour Loading In excess of 70%Heavy Peak Loading In excess of 55%Severe Average Loading (3 hour duration) In Excess of 50%Heavy Average Loading (3 hour duration) In excess of 40%

RAMS Simulation of Milano TMA
EUROCONTROL
69
COORDINATION TASKS
Taskname Description Position and Execution TimeDepReq Receive clearance request from local airport.
This Task was recorded in Sector LIMMADN for alldepartures from Malpensa, Bergamo and Luganoairports.
PC 30 Secs. (Org.A).Reduced to 15” for MalpensaDepartures in exerciseC98A2PReduced to 4” for all threeairports in 2000/2005.
CODNRxE Receive telephone estimate in Sector LIMMADNfrom previous centre.
PC 22 Secs. EC 0 Secs.
CODNRxE1 Receive estimate via OLDI link in SectorLIMMADN from previous centre.
PC 4 Secs. EC 0 Secs.
CODNTxE Transmit telephone estimate from SectorLIMMADN to next centre.
PC 22 Secs. EC 0 Secs.
CODNTxE1 Transmit estimate via OLDI link from SectorLIMMADN to next centre.
PC 4 Secs. EC 0 Secs.
CODSRxE Receive telephone estimate in Sector LIMMADSfrom previous centre.
PC 22 Secs. EC 0 Secs.
CODSRxE1 Receive estimate via OLDI link in SectorLIMMADS from previous centre.
PC 4 Secs. EC 0 Secs.
CODSTxE Transmit telephone estimate from SectorLIMMADS to next centre.
PC 22 Secs. EC 0 Secs.
CODSTxE1 Transmit estimate via OLDI link from SectorLIMMADS to next centre.
PC 4 Secs. EC 0 Secs.
COENRxE Receive telephone estimate in Sector LIMMENfrom previous centre.
PC 22 Secs. EC 0 Secs.
COENRxE1 Receive estimate via OLDI link in Sector LIMMENfrom previous centre.
PC 4 Secs. EC 0 Secs.
COENTxE Transmit telephone estimate from Sector LIMMENto next centre.
PC 22 Secs. EC 0 Secs.
COENTxE1 Transmit estimate via OLDI link from SectorLIMMEN to next centre.
PC 4 Secs. EC 0 Secs.
COESRxE Receive telephone estimate in Sector LIMMESfrom previous centre.
PC 22 Secs. EC 0 Secs.
COESRxE1 Receive estimate via OLDI link in Sector LIMMESfrom previous centre.
PC 4 Secs. EC 0 Secs.
COESTxE Transmit telephone estimate from Sector LIMMESto next centre.
PC 22 Secs. EC 0 Secs.
COESTxE1 Transmit estimate via OLDI link from SectorLIMMES to next centre.
PC 4 Secs. EC 0 Secs.
COEURxE Receive telephone estimate in Sector LIMMEUfrom previous centre.
PC 22 Secs. EC 0 Secs.
COEURxE1 Receive estimate via OLDI link in Sector LIMMEUfrom previous centre.
PC 4 Secs. EC 0 Secs.
COEUTxE Transmit telephone estimate from Sector LIMMEUto next centre.
PC 22 Secs. EC 0 Secs.

RAMS Simulation of Milano TMA
EUROCONTROL
70
Taskname Description Position and Execution TimeCOEUTxE1 Transmit estimate via OLDI link from Sector
LIMMEU to next centre.PC 4 Secs. EC 0 Secs.
COEUURxE Receive telephone estimate in Sector LIMMEUUfrom previous centre.
PC 22 Secs. EC 0 Secs.
COEUURxE1 Receive estimate via OLDI link in SectorLIMMEUU from previous centre.
PC 4 Secs. EC 0 Secs.
COEUUTxE Transmit telephone estimate from SectorLIMMEUU to next centre.
PC 22 Secs. EC 0 Secs.
COEUUTxE1 Transmit estimate via OLDI link from SectorLIMMEUU to next centre.
PC 4 Secs. EC 0 Secs.
COWURxE Receive telephone estimate in Sector LIMMWUfrom previous centre.
PC 22 Secs. EC 0 Secs.
COWURxE1 Receive estimate via OLDI link in Sector LIMMWUfrom previous centre.
PC 4 Secs. EC 0 Secs.
COWUTxE Transmit telephone estimate from Sector LIMMWUto next centre.
PC 22 Secs. EC 0 Secs.
COWUTxE1 Transmit estimate via OLDI link from SectorLIMMWU to next centre.
PC 4 Secs. EC 0 Secs.
COWUURxE Receive telephone estimate in Sector LIMMWUUfrom previous centre.
PC 22 Secs. EC 0 Secs.
COWUURxE1 Receive estimate via OLDI link in SectorLIMMWUU from previous centre.
PC 4 Secs. EC 0 Secs.
COWUUTxE Transmit telephone estimate from SectorLIMMWUU to next centre.
PC 22 Secs. EC 0 Secs.
COWUUTxE1 Transmit estimate via OLDI link from SectorLIMMWUU to next centre.
PC 4 Secs. EC 0 Secs.
COWNRxE Receive telephone estimate in Sector LIMMWNRTfrom previous centre.
PC 22 Secs. EC 0 Secs.
COWNRxE1 Receive estimate via OLDI link in SectorLIMMWNRT from previous centre.
PC 4 Secs. EC 0 Secs.
COWNTxE Transmit telephone estimate from SectorLIMMWNRT to next centre.
PC 22 Secs. EC 0 Secs.
COWNTxE1 Transmit estimate via OLDI link from SectorLIMMWNTR to next centre.
PC 4 Secs. EC 0 Secs.
COWSRxE Receive telephone estimate in Sector LIMMWSTHfrom previous centre.
PC 22 Secs. EC 0 Secs.
COWSRxE1 Receive estimate via OLDI link in SectorLIMMWSTH from previous centre.
PC 4 Secs. EC 0 Secs.
COWSTxE Transmit telephone estimate from SectorLIMMWSTH to next centre.
PC 22 Secs. EC 0 Secs.
COWSTxE1 Transmit estimate via OLDI link from SectorLIMMWSTH to next centre.
PC 4 Secs. EC 0 Secs.
COWNATD Receive in Sector LIMMWNRT the actual time ofdeparture for flights departing from local airports.
PC 22 Secs. EC 0 Secs.
COWNETA Transmit from Sector LIMMWNRT the estimatedtime of arrival for flights arriving to local airports.
PC 22 Secs. EC 0 Secs.

RAMS Simulation of Milano TMA
EUROCONTROL
71
Taskname Description Position and Execution TimeCOWSATD Receive in Sector LIMMWSTH the actual time of
departure for flights departing from local airports.PC 22 Secs. EC 0 Secs.
COWSETA Transmit from Sector LIMMWSTH the estimatedtime of arrival for flights arriving to local airports.
PC 22 Secs. EC 0 Secs.
COSK1 Transmit an inter-Sector co-ordination for askipped flight. A skipped flight is a flight that entersthe airspace of a sector but remains under thecontrol of another sector.
PC 0 Secs. EC 7 Secs.
COSK2 Receive an inter-sector co-ordination for a skippedflight. A skipped flight is a flight that enters theairspace of a sector but remains under the controlof another sector.
PC 0 Secs. EC 7 Secs.
COVBENP1 First verbal co-ordination by the LIMMEN PlanningController with the Executive Controller of thesame sector
PC 4 Secs. EC 0 Secs.
COVBENP2 Second verbal co-ordination by the LIMMENPlanning Controller with the Executive Controller ofthe same sector
PC 4 Secs. EC 0 Secs.
COVBENE1 First verbal co-ordination by the LIMMENExecutive Controller with the Planning Controller ofthe same sector
PC 0 Secs. EC 4 Secs.
COVBENE2 Second verbal co-ordination by the LIMMENExecutive Controller with the Planning Controller ofthe same sector
PC 0 Secs. EC 4 Secs.
COVBESP1 First verbal co-ordination by the LIMMES PlanningController with the Executive Controller of thesame sector
PC 4 Secs. EC 0 Secs.
COVBESP2 Second verbal co-ordination by the LIMMESPlanning Controller with the Executive Controller ofthe same sector
PC 4 Secs. EC 0 Secs.
COVBESE1 First verbal co-ordination by the LIMMESExecutive Controller with the Planning Controller ofthe same sector
PC 0 Secs. EC 4 Secs.
COVBESE2 Second verbal co-ordination by the LIMMESExecutive Controller with the Planning Controller ofthe same sector
PC 0 Secs. EC 4 Secs.
COVBEUP1 First verbal co-ordination by the LIMMEU PlanningController with the Executive Controller of thesame sector
PC 4 Secs. EC 0 Secs.
COVBEUP2 Second verbal co-ordination by the LIMMEUPlanning Controller with the Executive Controller ofthe same sector
PC 4 Secs. EC 0 Secs.
COVBEUE1 First verbal co-ordination by the LIMMEUExecutive Controller with the Planning Controller ofthe same sector
PC 0 Secs. EC 4 Secs.

RAMS Simulation of Milano TMA
EUROCONTROL
72
Taskname Description Position and Execution TimeCOVBEUE2 Second verbal co-ordination by the LIMMEU
Executive Controller with the Planning Controller ofthe same sector
PC 0 Secs. EC 4 Secs.
COVBEUUP1 First verbal co-ordination by the LIMMEUUPlanning Controller with the Executive Controller ofthe same sector
PC 4 Secs. EC 0 Secs.
COVBEUUP2 Second verbal co-ordination by the LIMMEUUPlanning Controller with the Executive Controller ofthe same sector
PC 4 Secs. EC 0 Secs.
COVBEUE1 First verbal co-ordination by the LIMMEUUExecutive Controller with the Planning Controller ofthe same sector
PC 0 Secs. EC 4 Secs.
COVBEUE2 Second verbal co-ordination by the LIMMEUUExecutive Controller with the Planning Controller ofthe same sector
PC 0 Secs. EC 4 Secs.
COVBWNP1 First verbal co-ordination by the LIMMWNRTPlanning Controller with the Executive Controller ofthe same sector
PC 4 Secs. EC 0 Secs.
COVBWNP2 Second verbal co-ordination by the LIMMWNRTPlanning Controller with the Executive Controller ofthe same sector
PC 4 Secs. EC 0 Secs.
COVBWNE1 First verbal co-ordination by the LIMMWNRTExecutive Controller with the Planning Controller ofthe same sector
PC 0 Secs. EC 4 Secs.
COVBWNE2 Second verbal co-ordination by the LIMMWNRTExecutive Controller with the Planning Controller ofthe same sector
PC 0 Secs. EC 4 Secs.
COVBWSP1 First verbal co-ordination by the LIMMWSTHPlanning Controller with the Executive Controller ofthe same sector
PC 4 Secs. EC 0 Secs.
COVBWSP2 Second verbal co-ordination by the LIMMWSTHPlanning Controller with the Executive Controller ofthe same sector
PC 4 Secs. EC 0 Secs.
COVBWSE1 First verbal co-ordination by the LIMMWSTHExecutive Controller with the Planning Controller ofthe same sector
PC 0 Secs. EC 4 Secs.
COVBWSE2 Second verbal co-ordination by the LIMMWSTHExecutive Controller with the Planning Controller ofthe same sector
PC 0 Secs. EC 4 Secs.
COVBWUP1 First verbal co-ordination by the LIMMWU PlanningController with the Executive Controller of thesame sector
PC 4 Secs. EC 0 Secs.
COVBWUP2 Second verbal co-ordination by the LIMMWUPlanning Controller with the Executive Controller ofthe same sector
PC 4 Secs. EC 0 Secs.

RAMS Simulation of Milano TMA
EUROCONTROL
73
Taskname Description Position and Execution TimeCOVBWUE1 First verbal co-ordination by the LIMMWU
Executive Controller with the Planning Controller ofthe same sector
PC 0 Secs. EC 4 Secs.
COVBWUE2 Second verbal co-ordination by the LIMMWUExecutive Controller with the Planning Controller ofthe same sector
PC 0 Secs. EC 4 Secs.
COVBWUP1 First verbal co-ordination by the LIMMWU PlanningController with the Executive Controller of thesame sector
PC 4 Secs. EC 0 Secs.
COVBWUP2 Second verbal co-ordination by the LIMMWUPlanning Controller with the Executive Controller ofthe same sector
PC 4 Secs. EC 0 Secs.
COVBWUE1 First verbal co-ordination by the LIMMWUExecutive Controller with the Planning Controller ofthe same sector
PC 0 Secs. EC 4 Secs.
COVBWUE2 Second verbal co-ordination by the LIMMWUUExecutive Controller with the Planning Controller ofthe same sector
PC 0 Secs. EC 4 Secs.
COVBWUUP1 First verbal co-ordination by the LIMMWUUPlanning Controller with the Executive Controller ofthe same sector
PC 4 Secs. EC 0 Secs.
COVBWUUP2 Second verbal co-ordination by the LIMMWUUPlanning Controller with the Executive Controller ofthe same sector
PC 4 Secs. EC 0 Secs.
COVBWUUE1 First verbal co-ordination by the LIMMWUUExecutive Controller with the Planning Controller ofthe same sector
PC 0 Secs. EC 4 Secs.
COVBWUUE2 Second verbal co-ordination by the LIMMWUUExecutive Controller with the Planning Controller ofthe same sector
PC 0 Secs. EC 4 Secs.

RAMS Simulation of Milano TMA
EUROCONTROL
74
FLIGHT DATA MANAGEMENT TASKS
Taskname Description Position and Execution TimeFD1N Monitoring of airborne information updates in
sector LIMMADN concerning flights departing fromLinate and / or Malpensa airports
PC 4 Secs. EC 0 Secs.
FD1S Monitoring of airborne information updates insector LIMMADS concerning flights departing fromLinate and / or Malpensa airports
PC 4 Secs. EC 0 Secs.
FD2EN Loading and distribution of flight progress strips insector LIMMEN
PC 6 Secs. EC 0 Secs.
FD2ES Loading and distribution of flight progress strips insector LIMMES
PC 9 Secs. EC 0 Secs.
FD2EU Loading and distribution of flight progress strips insector LIMMEU
PC 12 Secs. EC 0 Secs.
FD2EUU Loading and distribution of flight progress strips insector LIMMEUU
PC 12 Secs. EC 0 Secs.
FD2WN Loading and distribution of flight progress strips insector LIMMWNRT
PC 6 Secs. EC 0 Secs.
FD2WS Loading and distribution of flight progress strips insector LIMMWSTH
PC 9 Secs. EC 0 Secs.
FD2WU Loading and distribution of flight progress strips insector LIMMWU
PC 9 Secs. EC 0 Secs.
FD2WUU Loading and distribution of flight progress strips insector LIMMWUU
PC 9 Secs. EC 0 Secs.
FD3EN Removal of flight progress strips from the sectorconsole in sector LIMMEN
PC 2 Secs. EC 0 Secs.
FD3ES Removal of flight progress strips from the sectorconsole in sector LIMMES
PC 3 Secs. EC 0 Secs.
FD3EU Removal of flight progress strips from the sectorconsole in sector LIMMEU
PC 4 Secs. EC 0 Secs.
FD3EUU Removal of flight progress strips from the sectorconsole in sector LIMMEUU
PC 4 Secs. EC 0 Secs.
FD3WN Removal of flight progress strips from the sectorconsole in sector LIMMWNRT
PC 2 Secs. EC 0 Secs.
FD3WS Removal of flight progress strips from the sectorconsole in sector LIMMWSTH
PC 3 Secs. EC 0 Secs.
FD3WU Removal of flight progress strips from the sectorconsole in sector LIMMWU
PC 3 Secs. EC 0 Secs.
FD3WUU Removal of flight progress strips from the sectorconsole in sector LIMMWUU
PC 3 Secs. EC 0 Secs.

RAMS Simulation of Milano TMA
EUROCONTROL
75
ROUTINE R/T COMMUNICATION TASKS
Taskname Description Position and Execution TimeRT1 First call from an aircraft entering a sector from
another sector. This Task also applied to inter -centre first calls
PC 0 Secs. EC 14 Secs.
RT2 Last message to an aircraft leaving a sector foranother sector. This Task applied to inter - centrelast messages
PC 0 Secs. EC 5 Secs.
RT3 Traffic sequencing instructions (vectoring, speedrestrictions, traffic information etc.) to aircraft onapproach to LIMC from APPC1, a pseudo - navaidcreated for modelling purposes.
PC 0 Secs. EC 40 Secs.(10 Secs inORG. C)
RT4 Traffic sequencing instructions (vectoring, speedrestrictions, traffic information etc.) to aircraft onapproach to LIMC from APPC2, a pseudo - navaidcreated for modelling purposes.
PC 0 Secs. EC 40 Secs.(10 Secs inORG. C)
RT5 Traffic sequencing instructions (vectoring, speedrestrictions, traffic information etc.) to aircraft onapproach to LIMC from APPC3, a pseudo - navaidcreated for modelling purposes.
PC 0 Secs. EC 40 Secs.(10 Secs inORG. C)
RT6 Traffic sequencing instructions (vectoring, speedrestrictions, traffic information etc.) to aircraft onapproach to LIMC from APPC4, a pseudo - navaidcreated for modelling purposes.
PC 0 Secs. EC 40 Secs.(10 Secs inORG. C)
RT7 Traffic sequencing instructions (vectoring, speedrestrictions, traffic information etc.) to aircraft onapproach to LIML from APPL1, a pseudo - navaidcreated for modelling purposes.
PC 0 Secs. EC 40 Secs.(Remainedthe same inORG. C)
RT8 Traffic sequencing instructions (vectoring, speedrestrictions, traffic information etc.) to aircraft onapproach to LIML from APPL2, a pseudo - navaidcreated for modelling purposes.
PC 0 Secs. EC 40 Secs.(10 Secs inORG. C)
RT9 Traffic sequencing instructions (vectoring, speedrestrictions, traffic information etc.) to aircraft onapproach to LIML from APPL3, a pseudo - navaidcreated for modelling purposes.
PC 0 Secs. EC 40 Secs.(10 Secs inORG. C)
RT10 Traffic sequencing instructions (vectoring, speedrestrictions, traffic information etc.) to aircraft onapproach to LIML from APPL4, a pseudo - navaidcreated for modelling purposes.
PC 0 Secs. EC 40 Secs.(10 Secs inORG. C)
RT11 Traffic sequencing instructions (vectoring, speedrestrictions, traffic information etc.) to aircraft onapproach to LIME from APPE1, a pseudo - navaidcreated for modelling purposes.
PC 0 Secs. EC 40 Secs.(10 Secs inORG. C)
RT12 Report from an aircraft on reaching a specifiedlevel.
PC 0 Secs. EC 5 Secs.
RT13 Report from an aircraft on leaving a specifiedlevel.
PC 0 Secs. EC 5 Secs.

RAMS Simulation of Milano TMA
EUROCONTROL
76
Taskname Description Position and Execution TimeRT14 Traffic sequencing instructions (vectoring, speed
restrictions, traffic information etc.) to aircraft onapproach to LIMC from APPC5, a pseudo - navaidcreated for modelling purposes.
PC 0 Secs. EC 40 Secs.
RT15 Traffic sequencing instructions (vectoring, speedrestrictions, traffic information etc.) to aircraft onapproach to LIMC from RIGN, a pseudo - navaidcreated for modelling purposes.This Task applied solely in Organisation C wherethe time allocated for traffic sequencing wasapportioned mainly to the EC in sector LIMMARR.
PC 0 Secs. EC 30 Secs.
RADAR TASKS
Taskname Description Position and Execution TimeRD1 Operation of tracker ball for inter - sector radar
handovers within Milano TMA.PC 0 Secs. EC 3 Secs.
RD2 Resolution of tactical radar conflicts. PC 0 Secs. EC 72 Secs.RD3 Monitor compliance to traffic sequencing
instructions issued at pseudo - navaid APPC1.PC 0 Secs. EC 3 Secs.
RD4 Monitor compliance to traffic sequencinginstructions issued at pseudo - navaid APPC2.
PC 0 Secs. EC 3 Secs.
RD5 Monitor compliance to traffic sequencinginstructions issued at pseudo - navaid APPC3.
PC 0 Secs. EC 3 Secs.
RD6 Monitor compliance to traffic sequencinginstructions issued at pseudo - navaid APPC4.
PC 0 Secs. EC 3 Secs.
RD6A Monitor compliance to traffic sequencinginstructions issued at pseudo - navaid APPC5.
PC 0 Secs. EC 3 Secs.
RD7 Monitor compliance to traffic sequencinginstructions issued at pseudo - navaid APPL1.
PC 0 Secs. EC 3 Secs.
RD8 Monitor compliance to traffic sequencinginstructions issued at pseudo - navaid APPL2.
PC 0 Secs. EC 3 Secs.
RD9 Monitor compliance to traffic sequencinginstructions issued at pseudo - navaid APPL3.
PC 0 Secs. EC 3 Secs.
RD10 Monitor compliance to traffic sequencinginstructions issued at pseudo - navaid APPL4.
PC 0 Secs. EC 3 Secs.
RD11 Monitor compliance to traffic sequencinginstructions issued at pseudo - navaid APPE1.
PC 0 Secs. EC 3 Secs.
RD12 Radar surveillance in sector LIMMEU. PC 0 Secs. EC 20 Secs.RD12A Radar surveillance in sector LIMMEUU. PC 0 Secs. EC 20 Secs.RD13 Radar surveillance in sector LIMMWU. PC 0 Secs. EC 20 Secs.RD13A Radar surveillance in sector LIMMWUU. PC 0 Secs. EC 20 Secs.RD14 Radar surveillance in sector LIMMWNRT. PC 0 Secs. EC 10 Secs.RD15 Radar surveillance in sector LIMMWSTH. PC 0 Secs. EC 10 Secs.RD16 Radar surveillance in sector LIMMEN. PC 0 Secs. EC 10 Secs.RD17 Radar surveillance in sector LIMMES. PC 0 Secs. EC 10 Secs.

RAMS Simulation of Milano TMA
EUROCONTROL
77
CONFLICT SEARCH TASKS
Taskname Description Position and Execution TimeCS1 Conflict search by an Executive Controller to
establish a sector planning clearancePC 0 Secs. EC 2 Secs.
CS2 Conflict search by an Executive Controller toestablish a new sector planning clearancefollowing a tactical conflict resolution
PC 0 Secs. EC 2 Secs.
HOLD STACK TASKS
Taskname Description Position and Execution TimeRTHoldEC Transmission to aircraft of entry instructions to
CODL hold stackPC 0 Secs. EC 3 Secs.
RTHoldEG Transmission to aircraft of entry instructions toGOLTO hold stack
PC 0 Secs. EC 3 Secs.
RTHoldES Transmission to aircraft of entry instructions toSRN hold stack
PC 0 Secs. EC 3 Secs.
RTHoldEV Transmission to aircraft of entry instructions toVOGHERA hold stack.
PC 0 Secs. EC 3 Secs.
RTHoldCC Transmission to aircraft of level changeinstructions in CODL hold stack
PC 0 Secs. EC 8 Secs.
RTHoldCG Transmission to aircraft of level changeinstructions in GOLTO hold stack
PC 0 Secs. EC 8 Secs.
RTHoldCS Transmission to aircraft of level changeinstructions in SRN hold stack
PC 0 Secs. EC 8 Secs.
RTHoldCV Transmission to aircraft of level changeinstructions in VOGHERA hold stack.
PC 0 Secs. EC 8 Secs.
RTHoldXC Transmission to aircraft of exit instructions fromCODL hold stack
PC 0 Secs. EC 5 Secs.
RTHoldXG Transmission to aircraft of exit instructions fromGOLTO hold stack
PC 0 Secs. EC 5 Secs.
RTHoldXS Transmission to aircraft of exit instructions fromSRN hold stack
PC 0 Secs. EC 5 Secs.
RTHoldXV Transmission to aircraft of exit instructions fromVOGHERA hold stack.
PC 0 Secs. EC 5 Secs.

RAMS Simulation of Milano TMA
EUROCONTROL
78
Intentionally Left Blank

RAMS Simulation of Milano TMA
EUROCONTROL
79
APPENDIX II
Re-Organised ATC MathematicalSimulator
Simulation of the Milano TMA
Project SIM-F-E1 (F14)
HOLDSTACK CHARTS
The Charts contained in APPENDIX II illustrate the duration for which aircraft wereHeld in each of the Holdstacks simulated in this study, together with the time of dayduring which such Holding was recorded, based upon a 24 Hour cycle. SeparateCharts are provided with respect to forecast traffic levels for years 1998, 2000 and2005.

RAMS Simulation of Milano TMA
EUROCONTROL
80

RAMS Simulation of Milano TMA
EUROCONTROL
81
(852&21752/(1$9
HOLD STACK OCCUPANCY 1998
SARONNO
00:00
00:07
00:14
00:21
00:28
00:36
00:43
00:50
00 06 12 18
Time
Du
rati
on
(h
h:m
m)
Figure 34
(852&21752/(1$9
HOLD STACK OCCUPANCY 1998
CODOGNO
00:00
00:07
00:14
00:21
00:28
00:36
00:43
00:50
00 06 12 18
Time
Du
rati
on
(h
h:m
m)
Figure 35

RAMS Simulation of Milano TMA
EUROCONTROL
82
(852&21752/(1$9
HOLD STACK OCCUPANCY 1998
GOLTO
00:00
00:07
00:14
00:21
00:28
00:36
00:43
00:50
00 06 12 18
Time
Du
rati
on
(h
h:m
m)
Figure 36
(852&21752/(1$9
HOLD STACK OCCUPANCY 1998
VOGHERA
00:00
00:07
00:14
00:21
00:28
00:36
00:43
00:50
00 06 12 18
Time
Du
rati
on
(h
h:m
m)
Figure 37

RAMS Simulation of Milano TMA
EUROCONTROL
83
(852&21752/(1$9
HOLD STACK OCCUPANCY 2000
SARONNO
00:00
00:07
00:14
00:21
00:28
00:36
00:43
00:50
00 06 12 18
Time
Du
rati
on
(h
h:m
m)
Figure 38
(852&21752/(1$9
HOLD STACK OCCUPANCY 2000
CODOGNO
00:00
00:07
00:14
00:21
00:28
00:36
00:43
00:50
00 06 12 18
Time
Du
rati
on
(h
h:m
m)
Figure 39

RAMS Simulation of Milano TMA
EUROCONTROL
84
(852&21752/(1$9
HOLD STACK OCCUPANCY 2000
GOLTO
00:00
00:07
00:14
00:21
00:28
00:36
00:43
00:50
00 06 12 18
Time
Du
rati
on
(h
h:m
m)
Figure 40
(852&21752/(1$9
HOLD STACK OCCUPANCY 2000
VOGHERA
00:00
00:07
00:14
00:21
00:28
00:36
00:43
00:50
00 06 12 18
Time
Du
rati
on
(h
h:m
m)
Figure 41

RAMS Simulation of Milano TMA
EUROCONTROL
85
(852&21752/(1$9
HOLD STACK OCCUPANCY 2005
SARONNO
00:00
00:07
00:14
00:21
00:28
00:36
00:43
00:50
00 06 12 18
Time
Du
rati
on
(h
h:m
m)
Figure 42
(852&21752/(1$9
HOLD STACK OCCUPANCY 2005
CODOGNO
00:00
00:07
00:14
00:21
00:28
00:36
00:43
00:50
00 06 12 18
Time
Du
rati
on
(h
h:m
m)
Figure 43

RAMS Simulation of Milano TMA
EUROCONTROL
86
(852&21752/(1$9
HOLD STACK OCCUPANCY 2005
GOLTO
00:00
00:07
00:14
00:21
00:28
00:36
00:43
00:50
00 06 12 18
Time
Du
rati
on
(h
h:m
m)
Figure 44
(852&21752/(1$9
HOLD STACK OCCUPANCY 2005
VOGHERA
00:00
00:07
00:14
00:21
00:28
00:36
00:43
00:50
00 06 12 18
Time
Du
rati
on
(h
h:m
m)
Figure 45

RAMS Simulation of Milano TMA
EUROCONTROL
87
APPENDIX III
Re-Organised ATC MathematicalSimulator
Simulation of the MILANO TMA
Project SIM-F-E1 (F14)
TABLES OF RESULTS
This APPENDIX contains the Final Results produced by the Re-OrganisedMathematical Simulator for the different simulation runs conducted in respect of theMILANO TMA.

RAMS Simulation of Milano TMA
EUROCONTROL
88

RAMS Simulation of Milano TMA
EUROCONTROL
89
REFERENCE ORGANISATION A
EXERCISE A98A2
DISTRIBUTION OF TRAFFIC
SECTORNAME
TOTAL NUMBEROF FLIGHTS
TOTAL FLIGHT TIMEIN MINUTES
AVERAGE FLIGHTTIME
LIMMADN 382 2972.52 7.78LIMMADS 423 2890.30 6.83LIMMEN 404 2172.13 5.38LIMMES 344 2979.75 8.66LIMMEU 267 2257.35 8.45LIMMEUU 296 3456.37 11.68LIMMWAWY 353 2390.53 6.77LIMMWTER 421 3072.38 7.30LIMMWU 276 3083.40 11.17LIMMWUU 309 5121.32 16.57TOTAL 3475 30396.05 8.75
REFERENCE ORGANISATION A
EXERCISE A98A2
DISTRIBUTION OF ATC WORKLOAD PER SECTOR(EXPRESSED IN MINUTES)
SECTOR ATC TASK CATEGORY SECTORNAME C/ SEARCH CO-ORD FGT DATA R/T RADAR STACK TOTAL
LIMMADN 12.83 61.73 15.47 211.90 42.65 11.86 356.44LIMMADS 14.13 8.63 10.60 324.80 72.20 31.52 461.88LIMMEN 13.77 93.48 54.10 143.20 113.60 418.15LIMMES 12.50 156.00 72.40 130.40 122.00 493.30LIMMEU 9.17 96.47 71.47 96.38 123.90 397.39LIMMEUU 10.17 180.60 78.93 98.57 133.00 501.27LIMMWAWY 12.07 50.00 71.15 130.70 98.48 362.40LIMMWTER 14.57 121.60 56.40 144.60 136.50 473.67LIMMWU 9.47 86.57 55.15 98.82 118.60 368.61LIMMWUU 10.40 122.80 61.65 101.50 126.70 423.05TOTAL 119.08 977.88 547.32 1480.87 1087.63 43.38 4256.16

RAMS Simulation of Milano TMA
EUROCONTROL
90
REFERENCE ORGANISATION A
EXERCISE A98A2
EXECUTIVE AND PLANNING CONTROLLER WORKLOADS
CONTROLLER HIGHEST PERCENTAGE LOADING IN ANY PERIOD OFWORKING POSITION 1 HOUR 3 HOURS
PC - LIMMADN 11% 9%PC - LIMMADS 2% 1%PC - LIMMEN 23% 17%PC - LIMMES 29% 26%PC - LIMMEU 24% 22%PC - LIMMEUU 36% 28%PC - LIMMWAWY 19% 15%PC - LIMMWTER 24% 21%PC - LIMMWU 19% 16%PC - LIMMWUU 22% 19%EC - LIMMADN 52% 34%EC - LIMMADS 73% 59%EC - LIMMEN 50% 38%EC - LIMMES 40% 34%EC - LIMMEU 40% 34%EC - LIMMEUU 46% 39%EC - LIMMWAWY 44% 33%EC - LIMMWTER 49% 43%EC - LIMMWU 39% 33%EC - LIMMWUU 42% 33%

RAMS Simulation of Milano TMA
EUROCONTROL
91
REFERENCE ORGANISATION A
EXERCISE B98A2
DISTRIBUTION OF TRAFFIC
SECTORNAME
TOTAL NUMBEROF FLIGHTS
TOTAL FLIGHT TIMEIN MINUTES
AVERAGE FLIGHTTIME
LIMMADN 444 3702.92 8.34LIMMADS 367 2427.10 6.61LIMMEN 411 2170.53 5.28LIMMES 341 2973.62 8.72LIMMEU 283 2416.18 8.54LIMMEUU 297 3459.68 11.65LIMMWAWY 354 2441.72 6.90LIMMWTER 407 3035.05 7.46LIMMWU 272 3104.77 11.41LIMMWUU 309 5134.70 16.62TOTAL 3485 30866.27 8.86
REFERENCE ORGANISATION A
EXERCISE B98A2
DISTRIBUTION OF ATC WORKLOAD PER SECTOR(EXPRESSED IN MINUTES)
SECTOR ATC TASK CATEGORY SECTORNAME C/ SEARCH CO-ORD FGT DATA R/T RADAR STACK TOTAL
LIMMADN 15.23 115.60 18.87 250.20 64.65 10.93 475.48LIMMADS 12.23 14.35 7.87 297.70 64.75 25.12 422.02LIMMEN 14.13 94.02 55.07 146.50 118.80 428.52LIMMES 12.17 154.90 71.60 128.90 101.00 468.57LIMMEU 9.80 105.60 76.00 103.00 136.80 431.20LIMMEUU 10.23 180.90 79.20 99.05 134.60 503.98LIMMWAWY 12.03 50.40 71.35 130.40 97.45 361.63LIMMWTER 14.03 119.20 54.47 141.00 127.40 456.10LIMMWU 9.33 84.33 54.55 97.78 118.90 364.89LIMMWUU 10.43 122.20 61.65 101.70 128.00 423.98TOTAL 119.61 1041.50 550.63 1496.23 1092.35 36.05 4336.37

RAMS Simulation of Milano TMA
EUROCONTROL
92
REFERENCE ORGANISATION A
EXERCISE B98A2
EXECUTIVE AND PLANNING CONTROLLER WORKLOADS
CONTROLLER HIGHEST PERCENTAGE LOADING IN ANY PERIOD OFWORKING POSITION 1 HOUR 3 HOURS
PC - LIMMADN 18% 15%PC - LIMMADS 1% 1%PC - LIMMEN 23% 17%PC - LIMMES 30% 27%PC - LIMMEU 27% 24%PC - LIMMEUU 36% 29%PC - LIMMWAWY 19% 15%PC - LIMMWTER 24% 20%PC - LIMMWU 18% 16%PC - LIMMWUU 22% 19%EC - LIMMADN 62% 46%EC - LIMMADS 68% 53%EC - LIMMEN 50% 41%EC - LIMMES 37% 33%EC - LIMMEU 42% 39%EC - LIMMEUU 46% 39%EC - LIMMWAWY 39% 32%EC - LIMMWTER 49% 42%EC - LIMMWU 41% 33%EC - LIMMWUU 42% 32%

RAMS Simulation of Milano TMA
EUROCONTROL
93
REFERENCE ORGANISATION A
EXERCISE C98A2
DISTRIBUTION OF TRAFFIC
SECTORNAME
TOTAL NUMBEROF FLIGHTS
TOTAL FLIGHT TIMEIN MINUTES
AVERAGE FLIGHTTIME
LIMMADN 486 4148.93 8.54LIMMADS 337 2258.93 6.70LIMMEN 414 2152.20 5.20LIMMES 337 2970.73 8.82LIMMEU 290 2482.63 8.56LIMMEUU 298 3456.70 11.60LIMMWAWY 356 2475.38 6.95LIMMWTER 394 2988.92 7.59LIMMWU 273 3132.78 11.48LIMMWUU 309 5141.55 16.64TOTAL 3494 31208.75 8.93
REFERENCE ORGANISATION A
EXERCISE C98A2
DISTRIBUTION OF ATC WORKLOAD PER SECTOR(EXPRESSED IN MINUTES)
SECTOR ATC TASK CATEGORY SECTORNAME C/ SEARCH CO-ORD FGT DATA R/T RADAR STACK TOTAL
LIMMADN 17.10 167.60 21.13 276.90 87.75 15.20 585.68LIMMADS 11.30 23.92 6.33 280.80 56.00 22.00 400.35LIMMEN 14.17 91.67 53.37 148.10 119.80 427.11LIMMES 12.17 153.70 67.90 127.40 96.38 457.55LIMMEU 10.03 98.90 78.60 105.50 136.30 429.33LIMMEUU 10.30 159.00 80.13 99.45 137.30 486.18LIMMWAWY 12.13 50.90 71.15 132.10 98.98 365.26LIMMWTER 13.57 120.20 52.13 136.60 124.90 447.40LIMMWU 9.47 83.17 55.30 98.10 124.40 370.44LIMMWUU 10.43 122.20 61.65 101.70 128.00 423.98TOTAL 120.67 1071.26 547.69 1506.65 1109.81 37.20 4393.28

RAMS Simulation of Milano TMA
EUROCONTROL
94
REFERENCE ORGANISATION A
EXERCISE C98A2
EXECUTIVE AND PLANNING CONTROLLER WORKLOADS
CONTROLLER HIGHEST PERCENTAGE LOADING IN ANY PERIOD OFWORKING POSITION 1 HOUR 3 HOURS
PC - LIMMADN 22% 21%PC - LIMMADS 1% 1%PC - LIMMEN 22% 17%PC - LIMMES 29% 26%PC - LIMMEU 24% 23%PC - LIMMEUU 35% 26%PC - LIMMWAWY 19% 15%PC - LIMMWTER 24% 20%PC - LIMMWU 18% 16%PC - LIMMWUU 22% 19%EC - LIMMADN 72% 50%EC - LIMMADS 66% 51%EC - LIMMEN 53% 41%EC - LIMMES 40% 34%EC - LIMMEU 43% 39%EC - LIMMEUU 46% 39%EC - LIMMWAWY 39% 31%EC - LIMMWTER 48% 40%EC - LIMMWU 41% 33%EC - LIMMWUU 42% 32%

RAMS Simulation of Milano TMA
EUROCONTROL
95
PROPOSED ORGANISATION B
EXERCISE C98A2P
DISTRIBUTION OF TRAFFIC
SECTORNAME
TOTAL NUMBEROF FLIGHTS
TOTAL FLIGHT TIMEIN MINUTES
AVERAGE FLIGHTTIME
LIMMADN 488 4266.73 8.74LIMMADS 316 2201.60 6.97LIMMEN 405 2074.58 5.12LIMMES 383 3282.25 8.57LIMMEU 315 2632.03 8.36LIMMEUU 292 3413.02 11.69LIMMWNRT 343 3037.10 8.85LIMMWSTH 253 2154.05 8.51LIMMWU 277 3133.05 11.31LIMMWUU 306 5111.95 16.71TOTAL 3378 31306.36 9.27
PROPOSED ORGANISATION B
EXERCISE C98A2P
DISTRIBUTION OF ATC WORKLOAD PER SECTOR(EXPRESSED IN MINUTES)
SECTOR ATC TASK CATEGORY SECTORNAME C/ SEARCH CO-ORD FGT DATA R/T RADAR STACK TOTAL
LIMMADN 16.87 117.00 22.13 276.70 88.45 16.14 537.29LIMMADS 10.63 21.23 5.00 277.20 55.20 22.18 391.44LIMMEN 13.57 91.35 54.27 144.10 98.48 401.77LIMMES 13.63 170.30 80.00 145.00 108.90 517.83LIMMEU 10.87 111.20 84.47 114.70 145.80 467.04LIMMEUU 10.10 155.00 77.87 97.38 129.30 469.65LIMMWNRT 11.60 79.83 51.80 125.80 96.90 365.93LIMMWSTH 8.60 62.35 46.57 90.52 64.73 272.77LIMMWU 9.57 84.18 55.35 98.72 126.20 374.02LIMMWUU 10.43 123.00 61.25 100.10 127.10 421.88TOTAL 115.87 1015.44 538.71 1470.22 1041.06 38.32 4219.62

RAMS Simulation of Milano TMA
EUROCONTROL
96
PROPOSED ORGANISATION B
EXERCISE C98A2P
EXECUTIVE AND PLANNING CONTROLLER WORKLOADS
CONTROLLER HIGHEST PERCENTAGE LOADING IN ANY PERIOD OFWORKING POSITION 1 HOUR 3 HOURS
PC - LIMMADN 16% 13%PC - LIMMADS 1% 1%PC - LIMMEN 23% 16%PC - LIMMES 33% 29%PC - LIMMEU 27% 25%PC - LIMMEUU 33% 25%PC - LIMMWNRT 18% 14%PC - LIMMWSTH 16% 12%PC - LIMMWU 18% 16%PC - LIMMWUU 22% 18%EC - LIMMADN 70% 50%EC - LIMMADS 60% 50%EC - LIMMEN 47% 38%EC - LIMMES 40% 35%EC - LIMMEU 47% 40%EC - LIMMEUU 45% 37%EC - LIMMWNRT 41% 34%EC - LIMMWSTH 28% 22%EC - LIMMWU 41% 35%EC - LIMMWUU 43% 32%

RAMS Simulation of Milano TMA
EUROCONTROL
97
PROPOSED ORGANISATION B
EXERCISE C00A2P
DISTRIBUTION OF TRAFFIC
SECTORNAME
TOTAL NUMBEROF FLIGHTS
TOTAL FLIGHT TIMEIN MINUTES
AVERAGE FLIGHTTIME
LIMMADN 545 4820.23 8.84LIMMADS 341 2534.52 7.43LIMMEN 467 2388.90 5.12LIMMES 396 3426.48 8.65LIMMEU 344 2927.88 8.51LIMMEUU 318 3703.58 11.65LIMMWNRT 390 3446.98 8.84LIMMWSTH 268 2272.38 8.48LIMMWU 311 3604.12 11.59LIMMWUU 323 5346.78 16.55TOTAL 3703 34471.85 9.31
PROPOSED ORGANISATION B
EXERCISE C00A2P
DISTRIBUTION OF ATC WORKLOAD PER SECTOR(EXPRESSED IN MINUTES)
SECTOR ATC TASK CATEGORY SECTORNAME C/ SEARCH CO-ORD FGT DATA R/T RADAR STACK TOTAL
LIMMADN 18.77 61.37 24.27 302.90 100.70 19.33 527.34LIMMADS 11.43 29.17 5.33 292.70 66.85 27.04 432.52LIMMEN 15.77 66.55 62.77 166.80 123.30 435.19LIMMES 14.17 75.40 83.00 149.40 110.70 432.67LIMMEU 11.87 66.07 92.40 125.50 160.00 455.84LIMMEUU 11.03 91.20 84.80 106.10 145.60 438.73LIMMWNRT 13.30 89.00 59.15 143.00 115.40 419.85LIMMWSTH 9.10 42.88 49.32 95.52 71.53 268.35LIMMWU 10.70 52.58 62.15 110.60 145.80 381.83LIMMWUU 11.00 75.40 64.65 105.60 134.50 391.15TOTAL 127.14 649.62 587.84 1598.12 1174.38 46.37 4183.47

RAMS Simulation of Milano TMA
EUROCONTROL
98
PROPOSED ORGANISATION B
EXERCISE C00A2P
EXECUTIVE AND PLANNING CONTROLLER WORKLOADS
CONTROLLER HIGHEST PERCENTAGE LOADING IN ANY PERIOD OFWORKING POSITION 1 HOUR 3 HOURS
PC - LIMMADN 7% 6%PC - LIMMADS 1% 1%PC - LIMMEN 17% 13%PC - LIMMES 19% 17%PC - LIMMEU 21% 19%PC - LIMMEUU 21% 17%PC - LIMMWNRT 19% 16%PC - LIMMWSTH 14% 10%PC - LIMMWU 14% 13%PC - LIMMWUU 16% 13%EC - LIMMADN 73% 55%EC - LIMMADS 76% 60%EC - LIMMEN 58% 44%EC - LIMMES 41% 37%EC - LIMMEU 49% 43%EC - LIMMEUU 49% 40%EC - LIMMWNRT 45% 41%EC - LIMMWSTH 36% 26%EC - LIMMWU 44% 39%EC - LIMMWUU 43% 34%

RAMS Simulation of Milano TMA
EUROCONTROL
99
PROPOSED ORGANISATION B
EXERCISE C00A3P
DISTRIBUTION OF TRAFFIC
SECTORNAME
TOTAL NUMBEROF FLIGHTS
TOTAL FLIGHT TIMEIN MINUTES
AVERAGE FLIGHTTIME
LIMMADN 543 4723.50 8.70LIMMADS 349 2430.47 6.96LIMMEN 461 2349.45 5.10LIMMES 407 3523.55 8.66LIMMEU 339 2836.33 8.37LIMMEUU 322 3581.05 11.12LIMMWNRT 379 3383.22 8.93LIMMWSTH 276 2350.95 8.52LIMMWU 313 3557.10 11.36LIMMWUU 323 5323.77 16.50TOTAL 3712 34059.39 9.18
PROPOSED ORGANISATION B
EXERCISE C00A3P
DISTRIBUTION OF ATC WORKLOAD PER SECTOR(EXPRESSED IN MINUTES)
SECTOR ATC TASK CATEGORY SECTORNAME C/ SEARCH CO-ORD FGT DATA R/T RADAR STACK TOTAL
LIMMADN 18.80 54.43 24.33 307.90 100.20 17.47 523.13LIMMADS 11.83 21.88 5.33 303.30 72.05 28.95 443.34LIMMEN 15.50 64.73 62.00 164.00 118.70 424.93LIMMES 14.60 79.30 85.20 153.50 118.60 451.20LIMMEU 11.60 65.27 91.40 123.10 153.70 445.07LIMMEUU 11.27 96.33 86.60 107.90 150.70 452.80LIMMWNRT 12.90 87.97 57.55 140.50 106.10 405.02LIMMWSTH 9.33 44.15 50.60 97.90 70.55 272.53LIMMWU 10.80 55.30 62.55 111.50 146.10 386.25LIMMWUU 11.00 74.47 64.65 105.80 138.30 394.22TOTAL 127.63 643.83 590.21 1615.40 1175.00 46.42 4198.49

RAMS Simulation of Milano TMA
EUROCONTROL
100
PROPOSED ORGANISATION B
EXERCISE C00A3P
EXECUTIVE AND PLANNING CONTROLLER WORKLOADS
CONTROLLER HIGHEST PERCENTAGE LOADING IN ANY PERIOD OFWORKING POSITION 1 HOUR 3 HOURS
PC - LIMMADN 7% 6%PC - LIMMADS 1% 1%PC - LIMMEN 17% 13%PC - LIMMES 22% 17%PC - LIMMEU 20% 18%PC - LIMMEUU 23% 19%PC - LIMMWNRT 21% 16%PC - LIMMWSTH 14% 10%PC - LIMMWU 16% 14%PC - LIMMWUU 15% 13%EC - LIMMADN 77% 57%EC - LIMMADS 70% 57%EC - LIMMEN 53% 42%EC - LIMMES 44% 39%EC - LIMMEU 47% 42%EC - LIMMEUU 54% 42%EC - LIMMWNRT 44% 39%EC - LIMMWSTH 38% 27%EC - LIMMWU 51% 42%EC - LIMMWUU 44% 34%

RAMS Simulation of Milano TMA
EUROCONTROL
101
PROPOSED ORGANISATION B
EXERCISE C05A3P
DISTRIBUTION OF TRAFFIC
SECTORNAME
TOTAL NUMBEROF FLIGHTS
TOTAL FLIGHT TIMEIN MINUTES
AVERAGE FLIGHTTIME
LIMMADN 715 6178.40 8.64LIMMADS 414 2961.13 7.15LIMMEN 640 3219.23 5.03LIMMES 501 4251.55 8.49LIMMEU 439 3661.88 8.34LIMMEUU 407 4567.75 11.22LIMMWNRT 487 4379.20 8.99LIMMWSTH 339 2894.50 8.54LIMMWU 423 4865.38 11.50LIMMWUU 399 6487.45 16.26TOTAL 4764 43466.47 9.12
PROPOSED ORGANISATION B
EXERCISE C05A3P
DISTRIBUTION OF ATC WORKLOAD PER SECTOR(EXPRESSED IN MINUTES)
SECTOR ATC TASK CATEGORY SECTORNAME C/ SEARCH CO-ORD FGT DATA R/T RADAR STACK TOTAL
LIMMADN 24.67 66.45 32.13 407.90 407.90 27.06 966.11LIMMADS 13.90 26.67 6.00 361.90 361.90 36.42 806.79LIMMEN 21.60 86.78 86.27 229.80 229.80 654.25LIMMES 18.10 100.40 105.80 189.20 189.20 602.70LIMMEU 15.40 83.13 118.60 160.60 160.60 538.33LIMMEUU 14.23 122.40 109.30 136.40 136.40 518.73LIMMWNRT 16.77 92.28 74.15 179.60 179.60 542.40LIMMWSTH 11.43 43.02 62.15 118.90 118.90 354.40LIMMWU 14.63 75.05 84.55 149.70 149.70 473.63LIMMWUU 13.77 90.76 80.05 131.60 131.60 447.78TOTAL 164.50 786.94 759.00 2065.60 2065.60 63.48 5905.12

RAMS Simulation of Milano TMA
EUROCONTROL
102
PROPOSED ORGANISATION B
EXERCISE C05A3P
EXECUTIVE AND PLANNING CONTROLLER WORKLOADS
CONTROLLER HIGHEST PERCENTAGE LOADING IN ANY PERIOD OFWORKING POSITION 1 HOUR 3 HOURS
PC - LIMMADN 8% 7%PC - LIMMADS 1% 1%PC - LIMMEN 23% 18%PC - LIMMES 25% 21%PC - LIMMEU 26% 23%PC - LIMMEUU 29% 24%PC - LIMMWNRT 21% 18%PC - LIMMWSTH 17% 13%PC - LIMMWU 21% 19%PC - LIMMWUU 19% 16%EC - LIMMADN 91% 76%EC - LIMMADS 87% 69%EC - LIMMEN 70% 56%EC - LIMMES 58% 51%EC - LIMMEU 74% 57%EC - LIMMEUU 61% 52%EC - LIMMWNRT 57% 51%EC - LIMMWSTH 49% 35%EC - LIMMWU 66% 56%EC - LIMMWUU 57% 42%

RAMS Simulation of Milano TMA
EUROCONTROL
103
PROPOSED ORGANISATION B
EXERCISE C05A3PR
DISTRIBUTION OF TRAFFIC
SECTORNAME
TOTAL NUMBEROF FLIGHTS
TOTAL FLIGHT TIMEIN MINUTES
AVERAGE FLIGHTTIME
LIMMADN 727 6236.35 8.58LIMMADS 428 3092.28 7.22LIMMEN 613 3146.93 5.13LIMMES 466 3911.40 8.39LIMMEU 426 3614.68 8.49LIMMEUU 387 4448.05 11.49LIMMWNRT 505 4410.18 8.73LIMMWSTH 327 2847.25 8.71LIMMWU 424 4745.30 11.19LIMMWUU 406 6618.38 16.30TOTAL 4709 43070.80 9.15
PROPOSED ORGANISATION B
EXERCISE C05A3PR
DISTRIBUTION OF ATC WORKLOAD PER SECTOR(EXPRESSED IN MINUTES)
SECTOR ATC TASK CATEGORY SECTORNAME C/ SEARCH CO-ORD FGT DATA R/T RADAR STACK TOTAL
LIMMADN 25.10 66.28 31.67 423.40 174.10 29.60 750.15LIMMADS 14.43 27.30 6.40 376.00 82.70 39.25 546.08LIMMEN 20.70 84.72 82.63 217.20 177.70 582.95LIMMES 16.60 87.80 97.05 174.60 142.50 518.55LIMMEU 14.63 86.07 114.60 154.20 193.90 563.40LIMMEUU 13.30 118.60 103.20 129.40 173.20 537.70LIMMWNRT 17.30 92.48 76.65 184.60 158.80 529.83LIMMWSTH 11.20 40.38 60.50 116.60 97.75 326.43LIMMWU 14.40 71.43 85.15 149.80 196.20 516.98LIMMWUU 13.73 94.20 81.00 133.30 174.60 496.83TOTAL 161.39 769.26 738.85 2059.10 1571.45 68.85 5368.90

RAMS Simulation of Milano TMA
EUROCONTROL
104
PROPOSED ORGANISATION B
EXERCISE C05A3PR
EXECUTIVE AND PLANNING CONTROLLER WORKLOADS
CONTROLLER HIGHEST PERCENTAGE LOADING IN ANY PERIOD OFWORKING POSITION 1 HOUR 3 HOURS
PC - LIMMADN 8% 7%PC - LIMMADS 2% 1%PC - LIMMEN 21% 18%PC - LIMMES 24% 20%PC - LIMMEU 26% 23%PC - LIMMEUU 27% 22%PC - LIMMWNRT 23% 18%PC - LIMMWSTH 16% 12%PC - LIMMWU 22% 19%PC - LIMMWUU 21% 19%EC - LIMMADN 106% 85%EC - LIMMADS 91% 70%EC - LIMMEN 71% 59%EC - LIMMES 58% 47%EC - LIMMEU 74% 58%EC - LIMMEUU 55% 46%EC - LIMMWNRT 64% 51%EC - LIMMWSTH 45% 33%EC - LIMMWU 73% 55%EC - LIMMWUU 60% 47%

RAMS Simulation of Milano TMA
EUROCONTROL
105
PROPOSED ORGANISATION C
EXERCISE C98A2P1 - SCENARIO 1
DISTRIBUTION OF TRAFFIC
SECTORNAME
TOTAL NUMBEROF FLIGHTS
TOTAL FLIGHT TIMEIN MINUTES
AVERAGE FLIGHTTIME
LIMMADE 292 1979.53 6.78LIMMADN 425 3441.58 8.10LIMMADS 135 764.15 5.66LIMMARR 278 1676.72 6.03LIMMDEP 0.00 0.00 0.00TOTAL 1130 7861.98 6.96
PROPOSED ORGANISATION C
EXERCISE C98A2P1 - SCENARIO 1
DISTRIBUTION OF ATC WORKLOAD PER SECTOR(EXPRESSED IN MINUTES)
SECTOR ATC TASK CATEGORY SECTORNAME C/ SEARCH CO-ORD FGT DATA R/T RADAR STACK TOTAL
LIMMADE 9.80 38.38 7.33 163.50 38.17 11.87 269.05LIMMADN 14.63 104.80 19.47 180.90 68.70 16.27 404.77LIMMADS 4.53 10.27 0.47 71.17 25.42 10.40 122.26LIMMARR 9.40 6.88 0.00 248.50 31.90 0.00 296.68LIMMDEP 0.00 0.00 0.00 0.00 0.00 0.00 0.00TOTAL 38.36 160.33 27.27 664.07 164.19 38.54 1092.76
PROPOSED ORGANISATION C
EXERCISE C98A2P1 - SCENARIO 1
EXECUTIVE CONTROLLER WORKLOADS
CONTROLLER HIGHEST PERCENTAGE LOADING IN ANY PERIOD OFWORKING POSITION 1 HOUR 3 HOURS
EC - LIMMADE 37% 30%EC - LIMMADN 56% 41%EC - LIMMADS 23% 18%EC - LIMMARR 50% 38%EC - LIMMDEP 0% 0%

RAMS Simulation of Milano TMA
EUROCONTROL
106
PROPOSED ORGANISATION C
EXERCISE C00A2P1 - SCENARIO 1
DISTRIBUTION OF TRAFFIC
SECTORNAME
TOTAL NUMBEROF FLIGHTS
TOTAL FLIGHT TIMEIN MINUTES
AVERAGE FLIGHTTIME
LIMMADE 349 2299.17 6.59LIMMADN 468 3506.18 7.49LIMMADS 153 856.72 5.60LIMMARR 310 1855.53 5.99LIMMDEP 0.00 0.00 0.00TOTAL 1280 8517.60 6.65
PROPOSED ORGANISATION C
EXERCISE C00A2P1 - SCENARIO 1
DISTRIBUTION OF ATC WORKLOAD PER SECTOR(EXPRESSED IN MINUTES)
SECTOR ATC TASK CATEGORY SECTORNAME C/ SEARCH CO-ORD FGT DATA R/T RADAR STACK TOTAL
LIMMADE 11.73 22.62 10.20 185.10 46.97 13.47 290.09LIMMADN 16.10 44.43 21,07 200.60 80.63 19.33 389.09LIMMADS 5.20 7.82 0.67 80.45 31.32 14.18 139.64LIMMARR 10.47 7.82 0.00 273.00 33.50 0.00 324.79LIMMDEP 0.00 0.00 0.00 0.00 0.00 0.00 0.00TOTAL 43.50 82.69 38.87 739.15 192.42 46.98 1143.61
PROPOSED ORGANISATION C
EXERCISE C00A2P1 - SCENARIO 1
EXECUTIVE CONTROLLER WORKLOADS
CONTROLLER HIGHEST PERCENTAGE LOADING IN ANY PERIOD OFWORKING POSITION 1 HOUR 3 HOURS
EC - LIMMADE 42% 33%EC - LIMMADN 55% 43%EC - LIMMADS 31% 22%EC - LIMMARR 55% 41%EC - LIMMDEP 0% 0%

RAMS Simulation of Milano TMA
EUROCONTROL
107
PROPOSED ORGANISATION C
EXERCISE C05A3P1 - SCENARIO 2
DISTRIBUTION OF TRAFFIC
SECTORNAME
TOTAL NUMBEROF FLIGHTS
TOTAL FLIGHT TIMEIN MINUTES
AVERAGE FLIGHTTIME
LIMMADE 437 2915.98 6.67LIMMADN 568 3022.33 5.32LIMMADS 199 1195.78 6.01LIMMARR 397 2352.32 5.93LIMMDEP 417 1299.53 3.12TOTAL 2018 10785.94 5.34
PROPOSED ORGANISATION C
EXERCISE C05A3P1 - SCENARIO 2
DISTRIBUTION OF ATC WORKLOAD PER SECTOR(EXPRESSED IN MINUTES)
SECTOR ATC TASK CATEGORY SECTORNAME C/ SEARCH CO-ORD FGT DATA R/T RADAR STACK TOTAL
LIMMADE 14.73 29.20 13.33 225.10 80.47 17.83 380.66LIMMADN 19.37 48.32 23.87 236.70 102.90 27.33 458.49LIMMADS 6.67 9.22 0.93 101.80 40.10 19.17 177.89LIMMARR 13.40 8.98 0.00 342.10 48.65 0.00 413.13LIMMDEP 13.97 8.28 0.00 144.60 42.15 0.00 209.00TOTAL 68.14 104.00 38.13 1050.30 314.27 64.33 1639.17
PROPOSED ORGANISATION C
EXERCISE C05A3P1 - SCENARIO 2
EXECUTIVE CONTROLLER WORKLOADS
CONTROLLER HIGHEST PERCENTAGE LOADING IN ANY PERIOD OFWORKING POSITION 1 HOUR 3 HOURS
EC - LIMMADE 60% 43%EC - LIMMADN 61% 54%EC - LIMMADS 39% 30%EC - LIMMARR 67% 56%EC - LIMMDEP 31% 26%