european banking sector facts and figures 2012 · pean banking sector from the european union and...
TRANSCRIPT
1
EUROPEAN BANKING SECTOR
Facts and Figures 2012

2
CREDITS
Editor Responsible:
Editor-in-Chief:
Authors:
Special thanks to:
Sub-Editor:
Designer:
Launched in 1960, the European Banking Federation is the voice of the Euro-pean banking sector from the European Union and European Free Trade Asso-ciation countries. The EBF represents the interests of almost 4,500 banks, large and small, wholesale and retail, local and cross-border financial institutions. To-gether, these banks account for over 80% of the total assets and deposits and some 80% of all bank loans in the EU only.
The EBF is committed to supporting EU policies to promote the single market in financial services in general and in banking activities in particular. It advocates free and fair competition in the EU and world markets and supports the banks’ efforts to increase their efficiency and competitiveness.
Use of pictures: www.fotolia.comEuropean Banking Federation a.i.s.b.l.56 Avenue des Arts 1000 Brusselswww.ebf-fbe.euEBF© October 2012
Guido Ravoet, EBF Chief Executive
Florence Ranson, Head of Communications [email protected]
Viktorija Proskurovska, Adviser, Economic Affairs [email protected]
Statistics Working Group and Economic and Monetary Affairs Committee Members Katarzyna Pawlik, Seconded Adviser from the Polish Bank Association
Alison Bell, Coordinator & Editor, Economic and Monetary Affairs
Sébastien Dieu

3
TABLE OF CONTENTS
Introduction from the authors
Chapter 1: European Banking Sector in Figures
1. Number of banks; bank assets, deposits, loans2. Assets3. Loans4. Deposits5. Loan-to-deposit ratio6. Payments
Chapter 2: EU Banking Sector Performance
1. Economic environment2. Bank capital3. Banks’ ROE
Chapter 3: Lending to Small and Medium-sized Enterprises in the EU
Chapter 4: Types of Banks, Banking Activity, and their Usefulness to the Economy
Chapter 5: National Chapters:
1. Austria2. Belgium3. Czech Republic4. Denmark5. Finland6. France7. Greece8. Ireland9. Italy10. Liechtenstein11. Luxembourg12. The Netherlands13. Poland14. Portugal15. Sweden16. Switzerland
Statistical Annex
5
678
111314
161821
24
28
32343739414346495256596264666975
78
INTRODUCTION FROM THE AUTHORS
The EBF is delighted to present the third issue of the European Banking Sector: Facts and Figures 2012.
The publication follows the tradition of starting off with the general overview of the EU banking sector in 2011, and its trends, followed by a description of the banking sector performance over the same period.
The two articles featured in this publication are devoted to lending to SMEs; and to the types of banks, banking activity, and their usefulness to the economy.
Having witnessed the interest and demand for this kind of material both in Brussels and elsewhere in Europe, even overseas, it was decided to enhance this publication, which usually focuses on EU-level information, with descrip-tions of national banking sectors across the EU and EFTA countries, prepared by the respective national banking associations. This year’s publication fea-tures 16 national chapters. Authors aim to complete the set of the EU national banking sector descriptions in the next publication of Facts and Figures 2013.
A methodological remark is in order: this year, the EBF has switched from bas-ing its analysis on the banking sector figures collected from each EU Member State’s national banking associations, to the data provided by the ECB. These figures were compiled by the EBF Secretariat, and were verified and approved by the European Central Bank. This new database can be accessed on the EBF website via the following link:
http://www.ebf-fbe.eu/index.php?page=statistics
The EBF hopes that this Facts and Figures edition will be of interest and that the information and identification of EU banking sector trends it provides will prove a useful reference.

6
CHAPTER 1: EUROPEAN BANKING SECTOR IN FIGURES
1. NUMBER OF BANKS; BANK ASSETS, DEPOSITS, LOANS
According to the European Central Bank’s fi gures on Credit Insti tuti ons op-erati ng in the EU, the decade-long trend of a decline in the number of Credit Insti tuti ons1 (CI) conti nued into 2011. Over the past decade, the EU-27 Credit Insti tuti on populati on shrank by some fi ft een hundred insti tuti ons, resulti ng in just over 8,060 Credit Insti tuti ons by the end of 2011. This fi nancial consolida-ti on has been accompanied by a solid bank asset growth, total aggregated as-sets witnessing an 85% increase in 2011 compared with 2001. Over the same period, the loan base grew by 69% to fi nance the EU businesses and private persons, and 79% more deposits are now held by the EU banks.
The EU fi nancial sector ended 2011 on a positi ve note: total assets grew by 4.4%, while both loans and deposits increased by almost 3.7% and 4.3% re-specti vely. However, these fi gures hide a much more complex picture.
1The focus of this publication is on banks; however, the pure data on banks is not available from the ECB. This is why the EBF uses both of the notions of Credit Institutions (CI) and of Monetary Financial Institutions (MFI) depending on which type of data is available. Since banks represent around 75-80% of the entire fi nancial system in the EU, the EBF deems it feasible to base the analysis of the banking sector on the ECB’s CI and MFI data. For your convenience, the ECB defi nitions of CI and MFI are presented below:Credit Institution (CI) = Any institution that is either (i) an undertaking whose business is to receive deposits or other repayable funds from the public and to grant credit for its own account, or (ii) an undertaking or any other legal person, other than those under (i), which issues means of payment in the form of electronic money. (source)Monetary Financial Institution (MFI) = Financial institutions which together form the money-issuing sector of the euro area. These include: the Eurosystem, resident credit institutions (as defi ned in EU law) and all other resident fi nancial institutions whose business is to receive deposits and/or close substitutes for deposits from entities other than MFIs and, for their own account (at least in economic terms), to grant credit and/or invest in securities. The latter group consists predominantly of money market funds. (source)
3,08
3,05
8,208
8,060
23,62
24,49
21,30
22,22
44,39
46,34
0,00 10,00 20,00 30,00 40,00 50,00 60,00
Employment, 2010
Employment, 2011
Number of CIs, 2010
Number of CIs, 2011
Loans, 2010
Loans, 2011
Deposits, 2010
Deposits, 2011
Assets, 2010
Assets, 2011
Figure 1: Total assets, loans, deposits (in trillion euro); number of credit institutions and number of staff employed (in thousands), Europe, 2010 and 2011
EU-27 EFTA EBF Associates
7
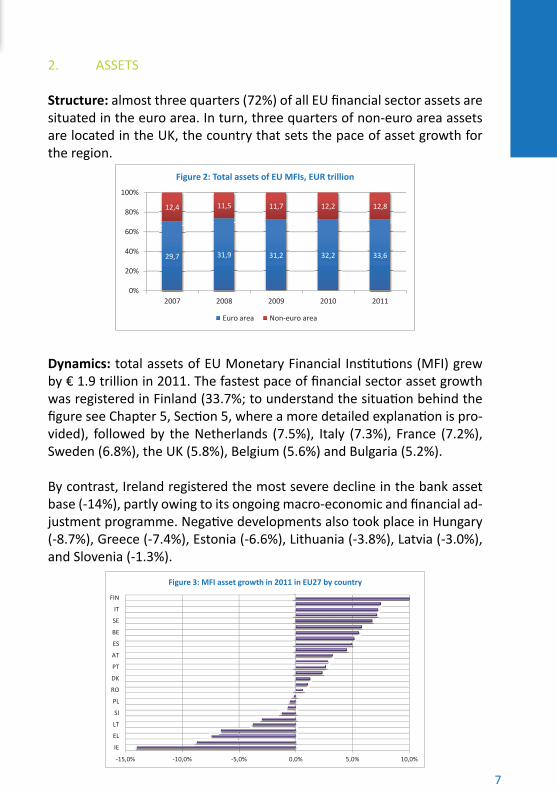
2. ASSETS
Structure: almost three quarters (72%) of all EU fi nancial sector assets are situated in the euro area. In turn, three quarters of non-euro area assets are located in the UK, the country that sets the pace of asset growth for the region.
Dynamics: total assets of EU Monetary Financial Insti tuti ons (MFI) grew by € 1.9 trillion in 2011. The fastest pace of fi nancial sector asset growth was registered in Finland (33.7%; to understand the situati on behind the fi gure see Chapter 5, Secti on 5, where a more detailed explanati on is pro-vided), followed by the Netherlands (7.5%), Italy (7.3%), France (7.2%), Sweden (6.8%), the UK (5.8%), Belgium (5.6%) and Bulgaria (5.2%).
By contrast, Ireland registered the most severe decline in the bank asset base (-14%), partly owing to its ongoing macro-economic and fi nancial ad-justment programme. Negati ve developments also took place in Hungary (-8.7%), Greece (-7.4%), Estonia (-6.6%), Lithuania (-3.8%), Latvia (-3.0%), and Slovenia (-1.3%).
29,7 31,9 31,2 32,2 33,6
12,4 11,5 11,7 12,2 12,8
0%
20%
40%
60%
80%
100%
2007 2008 2009 2010 2011
Figure 2: Total assets of EU MFIs, EUR trillion
Euro area Non-euro area
-15,0% -10,0% -5,0% 0,0% 5,0% 10,0%
IE
EL
LT
SI
PL
RO
DK
PT
AT
ES
BE
SE
IT
FIN
Figure 3: MFI asset growth in 2011 in EU27 by country

8
CHAPTER 1: EUROPEAN BANKING SECTOR IN FIGURES
3. LOANS
Structure: just over three quarters of all EU MFI loans reside in the euro area, and almost one quarter are in the EU countries outside the euro area. In 2011, total EU MFI loans grew by € 0.88 trillion, or 3.7%. Within the euro area, total loans grew by 4% in 2011, while in the EU countries outside the area, total loans increased by a more modest 2%.
Dynamics: the lion’s share of loan growth in the EU was on the account of inter-bank lending, € 0.84 trillion, which represents over 12% annual growth of this loan portf olio component. This represents a signifi cant increase aft er a sharp fall in 2010 (-8%) and a largely neutral result the year before that (0.8%). France, Germany, the Netherlands and Finland have all strongly contributed to the increase in the stock of MFI lending to MFI’s by the end of 2011. This strong inter-bank lending growth was secured by the European Central Bank’s two 3-year liquidity operati ons performed at the end of 2011, the total amount of which totalled around € 1 trillion. With this acti on, the ECB, as a lender of last resort, ensured that the euro area banking sector (narrowly) avoided a credit crunch. As a result, the vast majority of the provided liquidity was used at the inter-bank market, and only a fracti on of it was passed on to the real economy. Taking this loan portf olio component out of the equati on, the remaining com-ponents combined present a rather stagnant situati on in the EU.
17,0 18,1 17,7 17,8 18,5
5,8 5,2 5,8 5,8 6,0
0%
20%
40%
60%
80%
100%
2007 2008 2009 2010 2011
Figure 4: Total loans in the EU MFIs , EUR trillion
Euro area Non-euro area
9
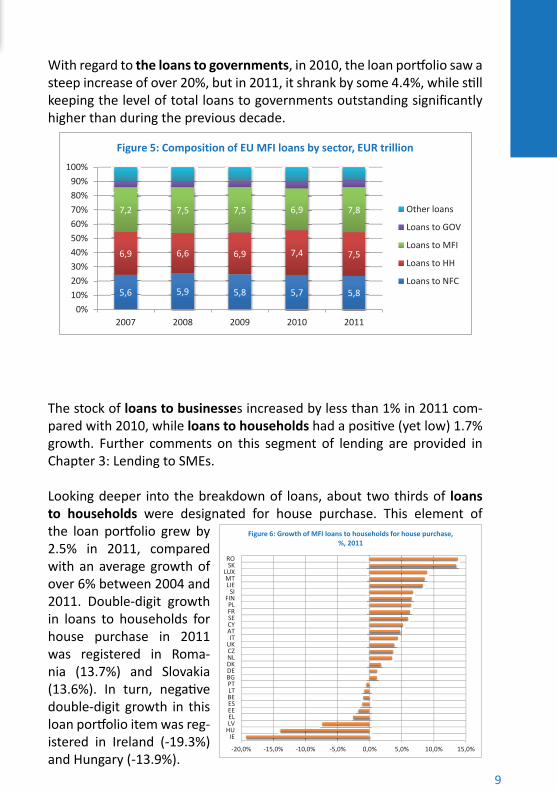
With regard to the loans to governments, in 2010, the loan portf olio saw a steep increase of over 20%, but in 2011, it shrank by some 4.4%, while sti ll keeping the level of total loans to governments outstanding signifi cantly higher than during the previous decade.
The stock of loans to businesses increased by less than 1% in 2011 com-pared with 2010, while loans to households had a positi ve (yet low) 1.7% growth. Further comments on this segment of lending are provided in Chapter 3: Lending to SMEs.
Looking deeper into the breakdown of loans, about two thirds of loans to households were designated for house purchase. This element of the loan portf olio grew by 2.5% in 2011, compared with an average growth of over 6% between 2004 and 2011. Double-digit growth in loans to households for house purchase in 2011 was registered in Roma-nia (13.7%) and Slovakia (13.6%). In turn, negati ve double-digit growth in this loan portf olio item was reg-istered in Ireland (-19.3%) and Hungary (-13.9%).
5,6 5,9 5,8 5,7 5,8
6,9 6,6 6,9 7,4 7,5
7,2 7,5 7,5 6,9 7,8
0% 10% 20% 30% 40% 50% 60% 70% 80% 90%
100%
2007 2008 2009 2010 2011
Figure 5: Composition of EU MFI loans by sector, EUR trillion
Other loans
Loans to GOV
Loans to MFI
Loans to HH
Loans to NFC
-20,0% -15,0% -10,0% -5,0% 0,0% 5,0% 10,0% 15,0%
IE HU LV EL EE ES BE LT PT BG DE DK NL CZ UK IT
AT CY SE FR PL
FIN SI
LIE MT
LUX SK
RO
Figure 6: Growth of MFI loans to households for house purchase, %, 2011
10
CHAPTER 1: EUROPEAN BANKING SECTOR IN FIGURES
Consumer credit, which represents 12% of lending to households, decreased on average by 2.8% over 2011. More than half the countries registered nega-ti ve growth in consumer credit, with Germany’s fi gure standing just above zero.
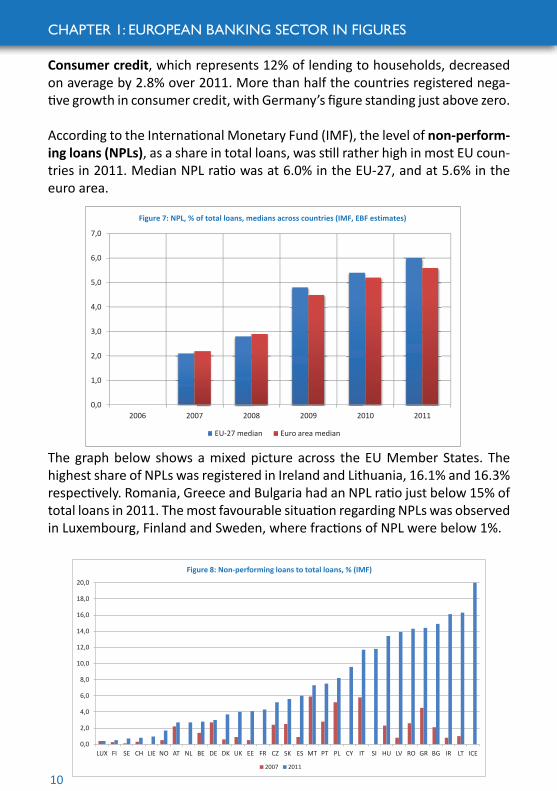
According to the Internati onal Monetary Fund (IMF), the level of non-perform-ing loans (NPLs), as a share in total loans, was sti ll rather high in most EU coun-tries in 2011. Median NPL rati o was at 6.0% in the EU-27, and at 5.6% in the euro area.
The graph below shows a mixed picture across the EU Member States. The highest share of NPLs was registered in Ireland and Lithuania, 16.1% and 16.3% respecti vely. Romania, Greece and Bulgaria had an NPL rati o just below 15% of total loans in 2011. The most favourable situati on regarding NPLs was observed in Luxembourg, Finland and Sweden, where fracti ons of NPL were below 1%.
0,0
1,0
2,0
3,0
4,0
5,0
6,0
7,0
2006 2007 2008 2009 2010 2011
Figure 7: NPL, % of total loans, medians across countries (IMF, EBF estimates)
EU-27 median Euro area median
0,0
2,0
4,0
6,0
8,0
10,0
12,0
14,0
16,0
18,0
20,0
LUX FI SE CH LIE NO AT NL BE DE DK UK EE FR CZ SK ES MT PT PL CY IT SI HU LV RO GR BG IR LT ICE
Figure 8: Non-performing loans to total loans, % (IMF)
2007 2011
11
4. DEPOSITS
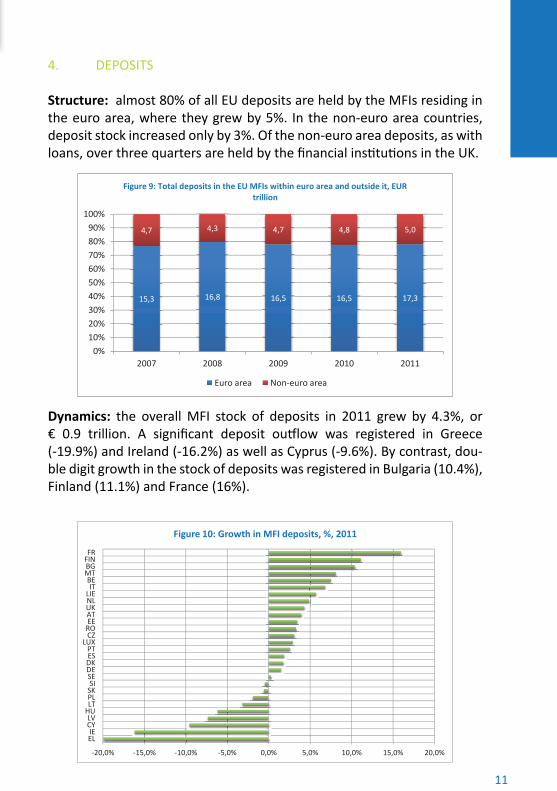
Structure: almost 80% of all EU deposits are held by the MFIs residing in the euro area, where they grew by 5%. In the non-euro area countries, deposit stock increased only by 3%. Of the non-euro area deposits, as with loans, over three quarters are held by the fi nancial insti tuti ons in the UK.
Dynamics: the overall MFI stock of deposits in 2011 grew by 4.3%, or € 0.9 trillion. A signifi cant deposit outf low was registered in Greece (-19.9%) and Ireland (-16.2%) as well as Cyprus (-9.6%). By contrast, dou-ble digit growth in the stock of deposits was registered in Bulgaria (10.4%), Finland (11.1%) and France (16%).
15,3 16,8 16,5 16,5 17,3
4,7 4,3 4,7 4,8 5,0
0% 10% 20% 30% 40% 50% 60% 70% 80% 90%
100%
2007 2008 2009 2010 2011
Figure 9: Total deposits in the EU MFIs within euro area and outside it, EUR trillion
Euro area Non-euro area
-20,0% -15,0% -10,0% -5,0% 0,0% 5,0% 10,0% 15,0% 20,0%
EL IE
CY LV
HU LT PL SK SI
SE DE DK ES PT
LUX CZ RO EE AT UK NL LIE IT
BE MT BG FIN FR
Figure 10: Growth in MFI deposits, %, 2011
12
CHAPTER 1: EUROPEAN BANKING SECTOR IN FIGURES
As with fi nancial sector loans, the major part of growth in deposits in 2011 took place on the account of inter-bank deposits (€ 0.7 trillion out of a total deposit growth of € 0.9 trillion), although this development comes aft er the same amount of outf low of inter-bank deposits was registered in the year be-fore that. The remaining increase in deposits equivalent to € 0.2 trillion is on the account of deposits made by non-monetary fi nancial insti tuti ons.
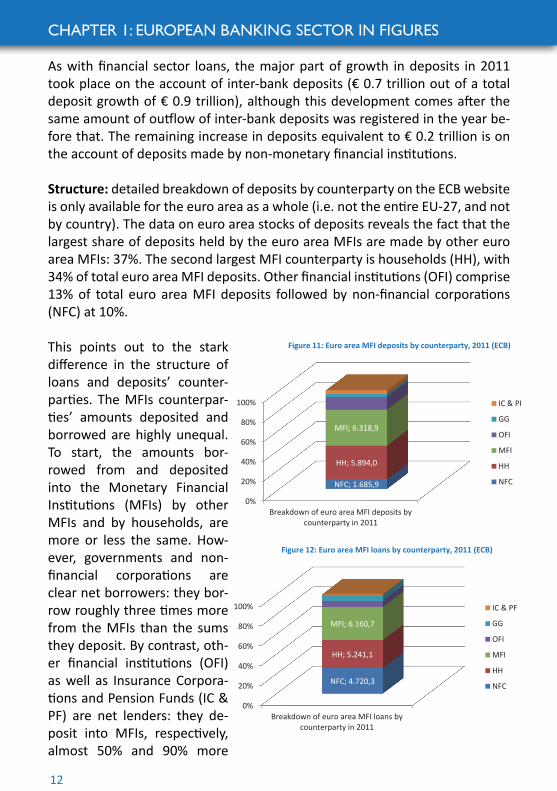
Structure: detailed breakdown of deposits by counterparty on the ECB website is only available for the euro area as a whole (i.e. not the enti re EU-27, and not by country). The data on euro area stocks of deposits reveals the fact that the largest share of deposits held by the euro area MFIs are made by other euro area MFIs: 37%. The second largest MFI counterparty is households (HH), with 34% of total euro area MFI deposits. Other fi nancial insti tuti ons (OFI) comprise 13% of total euro area MFI deposits followed by non-fi nancial corporati ons (NFC) at 10%.
This points out to the stark diff erence in the structure of loans and deposits’ counter-parti es. The MFIs counterpar-ti es’ amounts deposited and borrowed are highly unequal. To start, the amounts bor-rowed from and deposited into the Monetary Financial Insti tuti ons (MFIs) by other MFIs and by households, are more or less the same. How-ever, governments and non-fi nancial corporati ons are clear net borrowers: they bor-row roughly three ti mes more from the MFIs than the sums they deposit. By contrast, oth-er fi nancial insti tuti ons (OFI) as well as Insurance Corpora-ti ons and Pension Funds (IC & PF) are net lenders: they de-posit into MFIs, respecti vely, almost 50% and 90% more
0%
20%
40%
60%
80%
100%
Breakdown of euro area MFI deposits by counterparty in 2011
NFC; 1.685,9
HH; 5.894,0
MFI; 6.318,9
Figure 11: Euro area MFI deposits by counterparty, 2011 (ECB)
IC & PF
GG
OFI
MFI
HH
NFC
0%
20%
40%
60%
80%
100%
Breakdown of euro area MFI loans by counterparty in 2011
NFC; 4.720,3
HH; 5.241,1
MFI; 6.160,7
Figure 12: Euro area MFI loans by counterparty, 2011 (ECB)
IC & PF
GG
OFI
MFI
HH
NFC
13
Dynamics: in 2011, the stock of deposits from each of the euro area’s MFI counterparti es increased. Euro area non-fi nancial corporati ons’ deposits grew by 0.9% and euro area households’ deposits by 2.7%. Deposits from monetary fi nancial insti tuti ons grew by a stark 9.4%, which is partly ex-plained by the near onset of a credit crunch in the second half of 2011, prevented, in the event, by the ECB. Banks preferred, prudently, to deposit their excess liquidity on other banks’ accounts (in some countries, also including nati onal central banks) instead of lending it onwards. There may be a number of reasons for that; including low demand for bank loans in the broader context of conti nued economic and politi cal turmoil in the EU; restricti ons related to bank leverage, to name but a few.
5. LOAN-TO-DEPOSIT RATIO
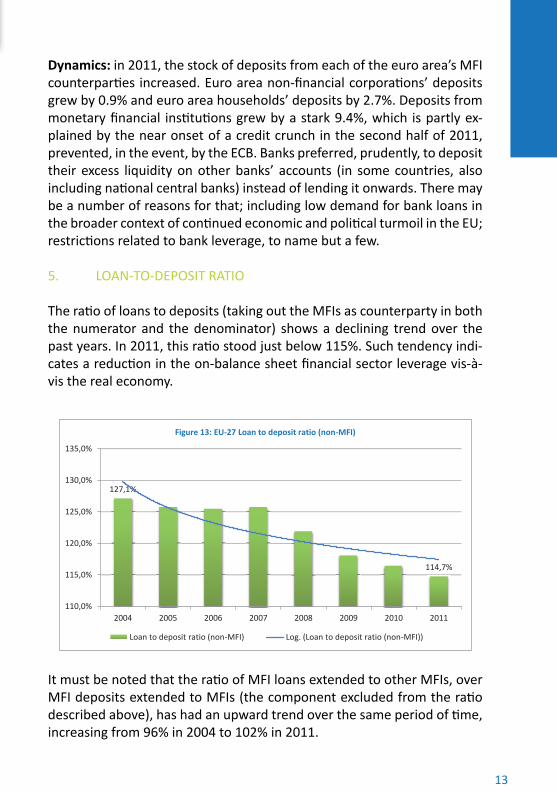
The rati o of loans to deposits (taking out the MFIs as counterparty in both the numerator and the denominator) shows a declining trend over the past years. In 2011, this rati o stood just below 115%. Such tendency indi-cates a reducti on in the on-balance sheet fi nancial sector leverage vis-à-vis the real economy.
It must be noted that the rati o of MFI loans extended to other MFIs, over MFI deposits extended to MFIs (the component excluded from the rati o described above), has had an upward trend over the same period of ti me, increasing from 96% in 2004 to 102% in 2011.
127,1%
114,7%
110,0%
115,0%
120,0%
125,0%
130,0%
135,0%
2004 2005 2006 2007 2008 2009 2010 2011
Figure 13: EU-27 Loan to deposit ratio (non-MFI)
Loan to deposit ratio (non-MFI) Log. (Loan to deposit ratio (non-MFI))
14
CHAPTER 1: EUROPEAN BANKING SECTOR IN FIGURES
6. PAYMENTS
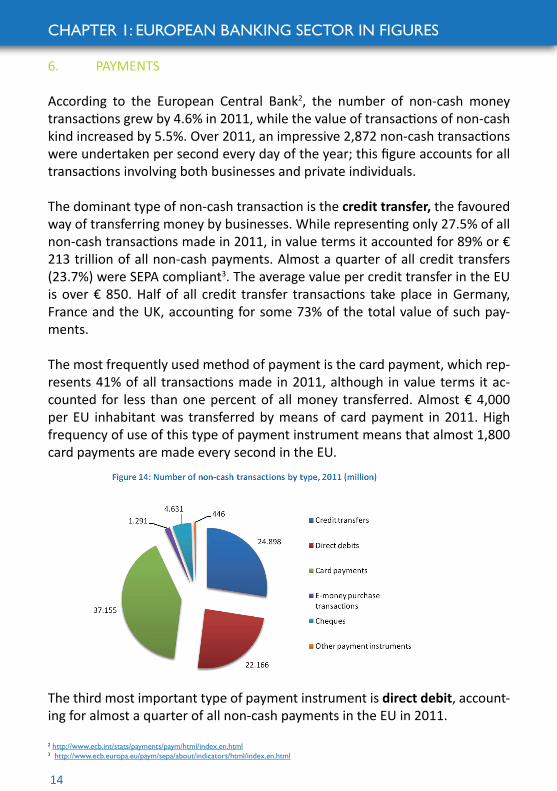
According to the European Central Bank2, the number of non-cash money transacti ons grew by 4.6% in 2011, while the value of transacti ons of non-cash kind increased by 5.5%. Over 2011, an impressive 2,872 non-cash transacti ons were undertaken per second every day of the year; this fi gure accounts for all transacti ons involving both businesses and private individuals.
The dominant type of non-cash transacti on is the credit transfer, the favoured way of transferring money by businesses. While representi ng only 27.5% of all non-cash transacti ons made in 2011, in value terms it accounted for 89% or € 213 trillion of all non-cash payments. Almost a quarter of all credit transfers (23.7%) were SEPA compliant3. The average value per credit transfer in the EU is over € 850. Half of all credit transfer transacti ons take place in Germany, France and the UK, accounti ng for some 73% of the total value of such pay-ments.
The most frequently used method of payment is the card payment, which rep-resents 41% of all transacti ons made in 2011, although in value terms it ac-counted for less than one percent of all money transferred. Almost € 4,000 per EU inhabitant was transferred by means of card payment in 2011. High frequency of use of this type of payment instrument means that almost 1,800 card payments are made every second in the EU.
The third most important type of payment instrument is direct debit, account-ing for almost a quarter of all non-cash payments in the EU in 2011.
2 http://www.ecb.int/stats/payments/paym/html/index.en.html 3 http://www.ecb.europa.eu/paym/sepa/about/indicators/html/index.en.html

15
Only 0.5% of all direct debit transacti ons were SEPA compliant in 2011. The value of money transferred with direct debit grew by 13% in 2011; the average value per this kind of transacti on being around € 82. Remarkably, 39% of all direct debit transacti ons in the EU are made in Germany, cor-responding to 74% of all the money debited directly in the EU.
It is worthwhile noti ng that cheques are sti ll of high relevance in the area of payments. Cheques represent just over 5% of all non-cash payment transacti ons, but their value is only at 2.3%. The average value per cheque-type transfer is almost € 119, and in 2011, 147 cheques were writt en every second of every day in the EU. It must be noted that not all countries use cheques: the French are by far the most heavily reliant on this payment type, followed by the Briti sh, and to a much lesser extent by the Italians, the Irish and the Spanish.
In 2011, there were 437,400 Automati c Teller Machines (ATMs) in the EU-27, an increase of 1%, or almost 4,100 units since a year before. This means that over a year, the number of people per ATM in Europe fell by 11 to 1,148. Germany, Spain, France, and the UK combined, account for 60% of all ATMs in the EU. The ATMs are also used more frequently: the number of transacti ons in the EU grew on average by 1.3% in 2011; how-ever the number of cash withdrawals grew only by 0.3%.
Finally, it should be remarked that the amount of banknotes and coins in circulati on has been growing conti nuously in the euro area. The ECB sta-ti sti cs suggest that the amount of banknotes has quadrupled since Janu-ary 2002 (the moment of introducti on of the euro currency), while the number of coins has almost doubled.
213.472
18.080
1.915 38 5.496
1.238
Figure 15: Value of non-cash transactions by type, 2011 (EUR billion)
Credit transfers
Direct debits
Card payments
E-money purchase transactions
Cheques
Other payment instruments

16
CHAPTER 2: EU BANKING SECTOR PERFORMANCE
1. ECONOMIC ENVIRONMENT
In the course of 2011, the economic conditi ons gradually deteriorated. EU-average unemployment rate climbed above 10%, and GDP slid into the nega-ti ve in some EU Member States. There are a number of reasons for a fall in economic acti vity. On the one hand, following an increase in unemployment, domesti c demand has signifi cantly slowed down; while on the other hand, the export-led countries in the EU have also been hit by a slowdown in growth of the main export markets, such as Brazil, Russia, India, China and South Africa.
Moreover, the vicious circle of dependence of nati onal governments on banks to take on more debt from the banks in order to conti nue daily operati ons as usual, and the dependence of banks on the need to hold suffi cient levels of government bonds (which are sti ll considered to be safest and highly liquid as-set), has taken an unprecedented proporti on. Given the strenuous economic conditi ons, in 2011 the euro area governments went into a 4.1% defi cit and the EU governments into a 4.5% defi cit, resulti ng in an increasing debt pile reach-ing 87.2% in the euro area and 82.5% in the EU in 20114.
In response to the deteriorati ng economic situati on, early in 2012, the Euro-pean Commission took a number of measures. To boost growth, the European Commission has developed a Roadmap for Stability, Growth and Jobs. To this eff ect, at the end of May 2012 the Commission published a package of country-specifi c recommendati ons for budgetary measures and economic reforms. An additi onal element of the package is the recommendati ons for the euro area as a whole.
In response to the high level of unemployment in Europe, the European Com-mission launched the Employment Package in April 2012. The Package calls on the EU Member States to implement a number of changes to the demand-side employment situati on. The Commission measures are yet to be implemented and take eff ect before their success can be assessed.
4htt p://epp.eurostat.ec.europa.eu/portal/page/portal/government_fi nance_stati sti cs/introducti on (defi cit) (debt)

17
In parallel, mounti ng pressure on the funding markets created challenging conditi ons for banks to be able to conti nue operati ng smoothly. Adjust-ment of the monetary policy by the ECB at the end of 2011 proved to be crucial to staving off a credit crunch in the euro area. The two 3-year refi -nancing operati ons (LTROs) of the ECB, one introduced in December 2011, and the second one in February 2012, with an aggregate volume of over € 1 trillion, eased the funding pressures on many banks in the euro area, but they did not remove a number of banks’ potenti al solvency problems.
-8,0 -6,0 -4,0 -2,0 0,0 2,0 4,0 6,0 8,0
10,0 12,0
Liec
hten
stei
n Gr
eece
Po
rtug
al
Slov
enia
Ita
ly
Cypr
us
Irela
nd
Spai
n De
nmar
k U
K N
ethe
rland
s EU
27
EA17
Lu
xem
bour
g Hu
ngar
y Bu
lgar
ia
Czec
h R
Fran
ce
Belg
ium
M
alta
Ro
man
ia
Aust
ria
Finl
and
Germ
any
Slov
akia
Sw
eden
Po
land
La
tvia
Li
thua
nia
Esto
nia
Figure 16: GDP real growth rate, % (Eurostat)
2007 2011
0,0
5,0
10,0
15,0
20,0
25,0
Liec
hten
stei
n Au
stria
N
ethe
rland
s Lu
xem
bour
g Ge
rman
y
Mal
ta
Czec
h R
Belg
ium
Ro
man
ia
Swed
en
Denm
ark
Cypr
us
Finl
and
UK
Slov
enia
Ita
ly
EU27
Fr
ance
Po
land
EA
17
Hung
ary
Bulg
aria
Es
toni
a Po
rtug
al
Slov
akia
Ire
land
La
tvia
Li
thua
nia
Gree
ce
Spai
n
Figure 17: Unemployment rate, annual average, % (Eurostat)
2007 2011
18
CHAPTER 2: EU BANKING SECTOR PERFORMANCE
The ECB main refi nancing rate and in mid-2012 the deposit facility rate were brought down to a very low level (0.75% and 0.00% respecti vely). Reducing the offi cial rates further would lower banks’ refi nancing cost, but the eff ect would be incomparable to the magnitude of the challenges faced by some banks, such as additi onal capital requirements, or writi ng off of bad loans. Banks’ need to sati sfy market and regulatory demands can only be addressed by banks them-selves, or – at a stretch - by the states in which they are located.
2. BANK CAPITAL
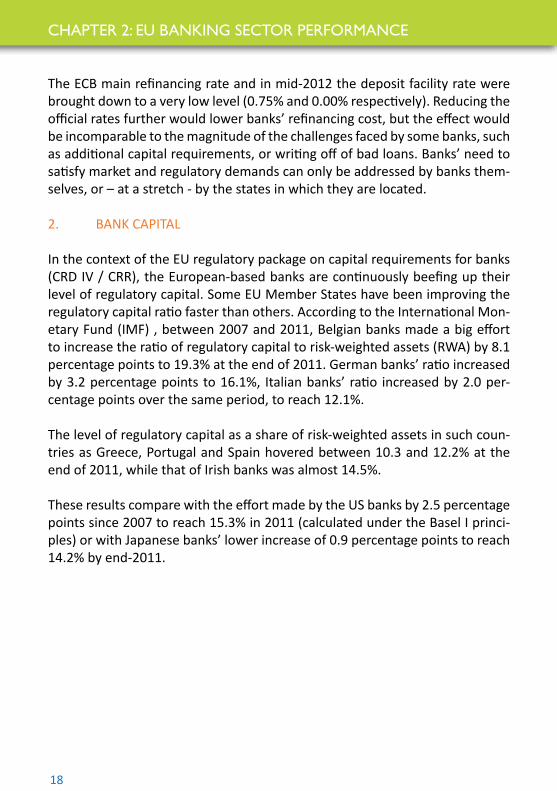
In the context of the EU regulatory package on capital requirements for banks (CRD IV / CRR), the European-based banks are conti nuously beefi ng up their level of regulatory capital. Some EU Member States have been improving the regulatory capital rati o faster than others. According to the Internati onal Mon-etary Fund (IMF) , between 2007 and 2011, Belgian banks made a big eff ort to increase the rati o of regulatory capital to risk-weighted assets (RWA) by 8.1 percentage points to 19.3% at the end of 2011. German banks’ rati o increased by 3.2 percentage points to 16.1%, Italian banks’ rati o increased by 2.0 per-centage points over the same period, to reach 12.1%.
The level of regulatory capital as a share of risk-weighted assets in such coun-tries as Greece, Portugal and Spain hovered between 10.3 and 12.2% at the end of 2011, while that of Irish banks was almost 14.5%.
These results compare with the eff ort made by the US banks by 2.5 percentage points since 2007 to reach 15.3% in 2011 (calculated under the Basel I princi-ples) or with Japanese banks’ lower increase of 0.9 percentage points to reach 14.2% by end-2011.
19
0,0
5,0
10,0
15,0
20,0
25,0
Port
ugal
Sl
oven
ia
Spai
n Sw
eden
Ita
ly
Gree
ce
Cypr
us
Fran
ce
Slov
ak R
epub
lic
Mal
ta
Hung
ary
Latv
ia
Net
herla
nds
Pola
nd
Nor
way
Fi
nlan
d Ire
land
Li
thua
nia
Rom
ania
Cz
ech
Repu
blic
Au
stria
U
nite
d Ki
ngdo
m
Denm
ark
Germ
any
Liec
hten
stei
n Sw
itzer
land
Lu
xem
bour
g Bu
lgar
ia
Belg
ium
Ic
elan
d Es
toni
a
Figure 18: Bank Regulatory Capital to RWA, % (IMF)
2007 2011
0,0
2,0
4,0
6,0
8,0
10,0
12,0
14,0
16,0
18,0
20,0
Net
herla
nds
Finl
and
Germ
any
Belg
ium
Fr
ance
Cy
prus
De
nmar
k U
K Po
rtug
al
Switz
erla
nd
Luxe
mbo
urg
Gree
ce
Spai
n Ire
land
Cz
ech
R M
alta
N
orw
ay
Aust
ria
Pola
nd
Rom
ania
Es
toni
a Ita
ly
Latv
ia
Hung
ary
Liec
hten
stei
n Bu
lgar
ia
Lith
uani
a Sl
ovak
ia
Icel
and
Slov
enia
Sw
eden
Figure 19: Bank Capital to Assets, % (IMF)
2007 2011
20
CHAPTER 2: EU BANKING SECTOR PERFORMANCE
Overall, the capital cushion of banks is much more sizeable now than a few years ago, implying banks’ bett er ability to cope in case of force majeure. That said, the level of strain of the current economic, fi nancial and politi cal situati on puts in questi on the suffi ciency of this regulatory requirement for weathering the storms. Indeed, a systemic approach to solving the situati on is needed, and this is what the European leaders have been discussing in the 28-29 June 2012 meeti ng, notably, the creati on of a Banking Union. Introducing a banking un-ion in the EMU, with its indispensible elements of a single supervisory author-ity, single European Deposit Guarantee Scheme and single Crisis Management Framework, is the right way to ensuring proper functi oning of an integrated fi nancial market. The role of the single supervisory authority was granted to the ECB, the scope being all euro area banks as well as banks of any other interested EU Member State. The ECB will phase in its role of the euro area supervisor during 2013; which will give a more holisti c touch to the EU banking supervision, and contribute to the fi nancial stability in the EU.
21
3. BANKS’ RETURN ON EQUITY
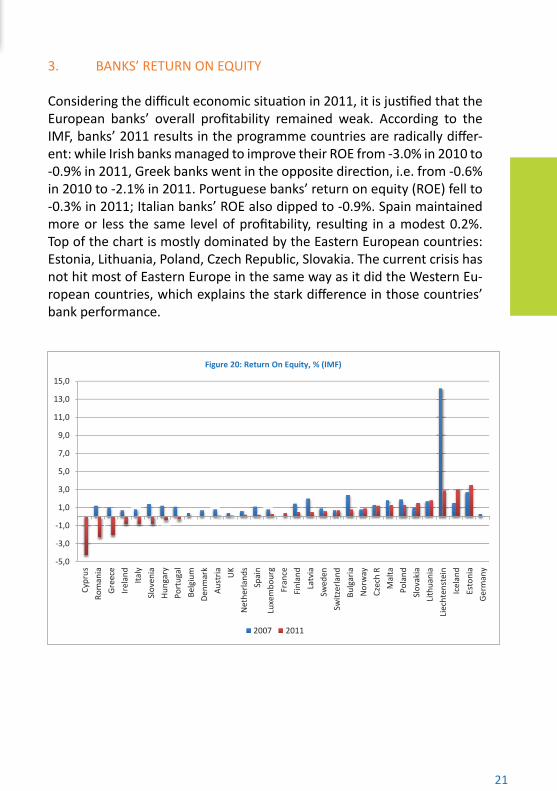
Considering the diffi cult economic situati on in 2011, it is justi fi ed that the European banks’ overall profi tability remained weak. According to the IMF, banks’ 2011 results in the programme countries are radically diff er-ent: while Irish banks managed to improve their ROE from -3.0% in 2010 to -0.9% in 2011, Greek banks went in the opposite directi on, i.e. from -0.6% in 2010 to -2.1% in 2011. Portuguese banks’ return on equity (ROE) fell to -0.3% in 2011; Italian banks’ ROE also dipped to -0.9%. Spain maintained more or less the same level of profi tability, resulti ng in a modest 0.2%. Top of the chart is mostly dominated by the Eastern European countries: Estonia, Lithuania, Poland, Czech Republic, Slovakia. The current crisis has not hit most of Eastern Europe in the same way as it did the Western Eu-ropean countries, which explains the stark diff erence in those countries’ bank performance.
-5,0
-3,0
-1,0
1,0
3,0
5,0
7,0
9,0
11,0
13,0
15,0
Cypr
us
Rom
ania
Gr
eece
Ire
land
Ita
ly
Slov
enia
Hu
ngar
y Po
rtug
al
Belg
ium
De
nmar
k Au
stria
U
K N
ethe
rland
s Sp
ain
Luxe
mbo
urg
Fran
ce
Finl
and
Latv
ia
Swed
en
Switz
erla
nd
Bulg
aria
N
orw
ay
Czec
h R
Mal
ta
Pola
nd
Slov
akia
Li
thua
nia
Liec
hten
stei
n Ic
elan
d Es
toni
a Ge
rman
y
Figure 20: Return On Equity, % (IMF)
2007 2011

22
CHAPTER 3: LENDING TO SMALL AND MEDIUM-SIZED ENTERPRISES
Small and Medium-sized Enterprises (SMEs) lie at the heart of most EU policy, and a ‘think small fi rst’ principle requires legislati on to take the interests of SMEs into account when policies are conceived. It is recognised that a healthy industrial sector is essenti al for the economic and social well-being of the EU. Under the current EU defi niti on, medium-sized companies may have up to 250 employees, and turnover of up to € 50 million or balance sheet of up to € 43 million. In practi ce, this means that at least 99% of companies in the EU are SMEs. Moreover, these companies employ around 72% of the labour force and generate 85% of new jobs in the EU. It is no surprise that they are prized so highly.
Table1: EU SME Defi niti on
EU policy in recent years has concentrated on freeing SMEs from unnecessary burdens and obstacles such as red tape and market barriers, and easing their ability to tap into fi nancial resources. Access to external fi nance has remained at the forefront of discussion, as it enables companies to grow faster, feeding economic recovery and creati ng jobs. The fi nancial and economic crisis of the last four years has intensifi ed concern about this, as smaller companies have been hard hit: demand for their products has weakened; customer payment terms have lengthened; and working capital has been eroded, causing an acute fi nancial squeeze for many of them. On the other hand, the weak economy has led many companies to retrench and postpone investments. This has tended to dampen their demand for fi nance, in turn limiti ng their growth.
THE IMPORTANCE OF BANK-SME LENDING
Up to now, EU companies have relied heavily on banks for external funding. As Chapter 4 notes, around 75% of corporate fi nancing in the EU is obtained from banks, compared to about 30% in the US. This situati on refl ects the relati ve lack of development of other commercial and market sources of fi nance for smaller businesses in the EU, for a variety of historical reasons. The fi nancial crisis has highlighted the fact that this structural diff erence can be a source of vulnerability for EU companies.
Company category Employees Turnover or Balance sheet total
Medium-sized < 250 ≤ € 50 million ≤ € 43 million
Small < 50 ≤ € 10 million ≤ € 10 million
Micro < 10 ≤ € 2 million ≤ € 2 million

23
EU policy is addressing the problem. It aims to improve the effi ciency of fi nan-cial markets; and to sti mulate sources of fi nance suited to the diff erent stages in the life cycle of companies, such as venture capital, mezzanine fi nance and equity markets6, so that smaller companies have the widest possible array of fi nancing opti ons. Att enti on is also being brought to bear on a less publicised problem, which is a serious source of pressure on company cash-fl ow: late payments from customers. The Commission is pushing to accelerate imple-mentati on of a new EU Directi ve on Late Payments, due to enter into force in March 2013. Last year it esti mated that late payments account for some € 1.1 trillion of delayed turnover for EU companies. These diff erent initi ati ves will help to diversify fi nancial sources, although traditi onal banks will undoubtedly remain an important fi nancing partner for industry in the future.
SME relati onships are among the highest prioriti es for banks. Financing indus-try and trade lies at the origin of the banking industry and is central to banks’ role in fuelling economic growth. These relati onships are complex, and may include services beyond ‘plain vanilla’ loans, such as payments, cash manage-ment, leasing and trade fi nance. In some cases, banks are off ering services that are not profi table for them in the conventi onal way of lending business, moti vated by the aim of developing future creditworthy customers, or by Cor-porate Social Responsibility objecti ves.
6See the SME Acti on Plan, a Communicati on issued by the European Commission in December 2011: htt p://eur-lex.europa.eu/LexUriServ/LexUriServ.do?uri=COM:2011:0870:FIN:EN:PDF
Figure 21: CSR and microfinance
Figure 21: CSR and microfi nance
24
CHAPTER 3: LENDING TO SMALL AND MEDIUM-SIZED ENTERPRISES
Services for enterprises impact both the liability and asset sides of the bank’s balance sheet. The volume of company deposits placed with EU banks typically equals about one third of the volume of corporate lending (see Figure 11 in Chapter 2). They provide a valued source of funding, and fi nancial stability for banks, parti cularly at ti mes of market turbulence.
THE SME DATA CHALLENGE
Despite their importance, accurate fi gures for lending to SMEs in the EU are surprisingly hard to come by. Although there is an offi cial EU defi niti on for an SME, it is not comprehensively applied. With the average size of company dif-fering greatly around the EU, the defi niti on cannot refl ect the diverse reality of the Member States, which limits its use in policy-making. Another obstacle to capturing data on SME lending is that a loan to a smaller company may not be recorded as such by the lender. It may be reported as a consumer loan (for example, in the case of a loan secured by a mortgage that is used to fi nance a start-up), or simply as ‘corporate’.
The smallest company or ‘micro-fi rm’ is the most ferti le part of the SME market in terms of job creati on. It is also the type of company that faces special dif-fi culti es in obtaining fi nance because of the higher risk elements, such as the absence of a borrower track record and the uncertainti es connected to a start-up. A 2010 EBF report on microfi nance in the EU banking industry7 pointed to the diffi culty in defi ning - and therefore in measuring – microfi nance acti vity. Here, too, there are diff erences around the EU, with the average size of a mi-crocredit esti mated at around € 10,000-15,000 in the older Member States of the EU, and considerably lower in the newer Member States.
The ECB’s monthly report on the balance sheets of MFIs in the EU is the most consistent and reliable publicly available data on lending to companies. In the absence of a sub-division of this data by the size of the corporate borrower, and given that most EU companies are SMEs according to the EU defi niti on, the EBF considers this report a good guide to the scale and evoluti on of bank lending to SMEs.
The European insti tuti ons are fi lling in some of the gaps in informati on on con-diti ons for SMEs. The ECB’s monthly MFI data is supplemented by regular re-ports developed by the ECB and the European Commission.
8htt p://www.ebf-fb e.eu/uploads/D1093k%20Microfi nance%20EU%20banking%20industry.pdf
25
A regular survey on the access to fi nance of SMEs, covering a broad sample of fi rms, gives informati on on the fi nancial situati on and needs, access to fi -nancing and expectati ons of SMEs.8 The ECB’s six-monthly bank lending sur-vey complements this report by providing the banks’ perspecti ve on lending capacity and trends for the euro area9.
TRENDS AND THEIR INTERPRETATION
Since 2008, the ECB-MFI data has been under constant scruti ny to deter-mine whether the crisis has caused a credit crunch. As the tables for MFI lending in Chapter 1 show, for the EU as a whole, the aggregate volume of credit supplied to non-fi nancial corporati ons has remained robust despite the crisis, with a stock of close to € 6 trillion in 2011. Overall, the credit sup-plied by banks appears to have broadly matched the credit demand. There are some nati onal markets which have suff ered from specifi c diffi culti es linked to weaker local economies, as outlined in Chapter 2, but in these cas-es restricti ons on credit availability have oft en been associated with banks’ funding diffi culti es, and/or the weaker fi nancial conditi on of businesses.
Credit volume is not the only angle from which to view the bank-SME lend-ing business. Banks’ strategies, and their atti tude to risk, feed through to their relati ons with corporate clients, and determine the lending environ-ment. At the level of an individual SME, the terms and conditi ons att ached to loans and other bank services - parti cularly pricing and collateral require-ments - and the nature of the service provided by the lender, are impor-tant parts of the picture. The crisis has led to major changes in both bank strategy and atti tude to risk. From a strategic perspecti ve, the traditi onal core businesses of banks are more highly valued. Banks are making eff orts to consolidate SME client relati onships and in parti cular to increase new and smaller enterprises’ fi nancial knowledge, so that they are bett er able to access and exploit the fi nance that is available.10 On the other hand, the crisis and the economic downturn have increased lenders’ risk-awareness. The eff ect of new banking regulati on - reducing the size of banks’ balance sheets, limiti ng the availability of credit and raising its cost - is evident now, and will probably become more apparent in the next few years as the rules are fully introduced. There is a legiti mate concern that, as the economic re-covery strengthens, and companies’ need for fi nance grows, banks may be hampered in fulfi lling their traditi onal role. 8htt p://www.ecb.int/stats/money/surveys/sme/html/index.en.html9htt p://www.ecb.int/stats/money/surveys/lend/html/index.en.html10See EBF report “Financial Dialogue: bank measures to foster SME fi nancial knowledge”, December 2010, htt p://www.ebf-fb e.eu/uploads/20-December%202010-D0812-EBF%20Report%20Financial%20Dialogue.pdf
26
CHAPTER 3: LENDING TO SMALL AND MEDIUM-SIZED ENTERPRISES
PUBLIC AND PRIVATE SOURCES
In additi on to the nearly € 6 trillion of MFI lending to corporati ons, govern-ments are providing important fi nancial support to SMEs in areas of market failure, where commercial insti tuti ons would not normally do business. This support is oft en provided in conjuncti on with loan fi nance from commercial banks.
In the EU, an array of programmes is available, to promote enterprise in gen-eral, research and innovati on, and other broader EU objecti ves touching on industry.
The EU’s principal programme of support for enterprise, the Competi ti veness and Innovati on Framework Programme (CIP), with a budget of € 1.1 billion, is expected to enable fi nancial insti tuti ons to provide about € 30 billion of new fi nance for more than 315,000 SMEs11. CIP fi nancial instruments are managed by the European Investment Fund through nati onal and regional fi nancial in-termediaries (banks and venture capital funds) in the EU. The CIP’s successor, the Programme for the Competi ti veness of Enterprises and SMEs (COSME) will conti nue to provide faciliti es for loan guarantees and venture capital to supple-ment the resources of the private sector, which will require the experti se and intermediati on of the banking industry. In the case of the loan guarantees, EU funds assist entrepreneurs or small enterprises when more collateral is needed to obtain a bank loan. The Commission reports that 90% of benefi ciaries have 10 or fewer employees, which is the category of enterprise that has most dif-fi culty in obtaining a loan. Here the average guaranteed loan is about € 65,000. Other EU resources are directed specifi cally towards the smaller micro-credits.
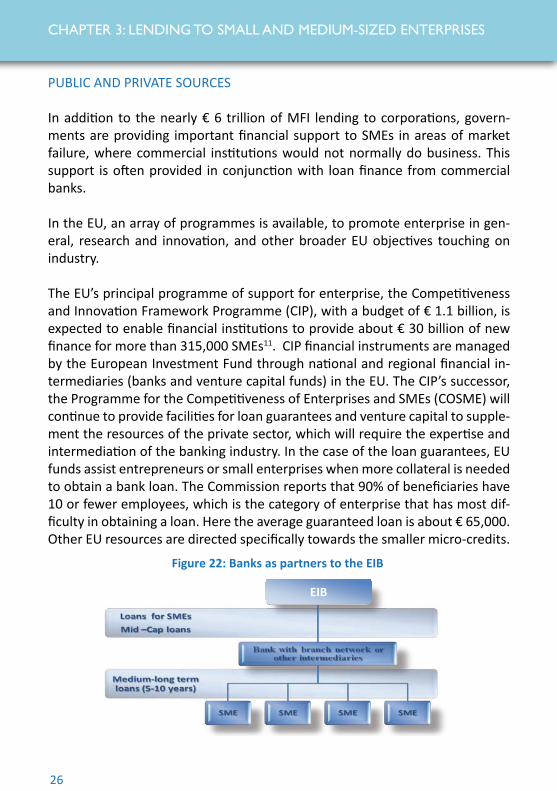
Figure 22: Banks as partners to the EIB
EIB
27
Banks are also working with the European Investment Bank (EIB) as fi nan-cial intermediaries for its lending to SMEs. In 2009-2011, EIB loans for SMEs and midcaps with intermediary banks reached some € 33 billion, benefi tti ng more than 180,000 enterprises. The EIB’s role is set to grow further, with a €10 billion increase in its fully paid-in capital proposed earlier this year. It calculates that the new capital will allow it to provide up to € 60 billion in additi onal long-term lending for economically viable projects in the EU over the next few years.
THE PUBLIC RELATIONS CHALLENGE
Banks are accustomed to scruti ny and criti cism about their willingness to lend to industry. This is to be expected given the importance of their role in fi nancing enterprise, and the fundamental importance of industry to the economy and society.
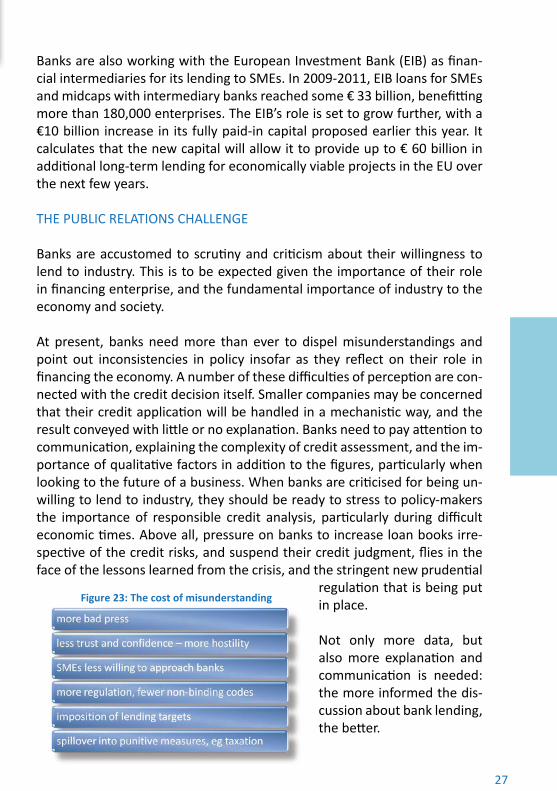
At present, banks need more than ever to dispel misunderstandings and point out inconsistencies in policy insofar as they refl ect on their role in fi nancing the economy. A number of these diffi culti es of percepti on are con-nected with the credit decision itself. Smaller companies may be concerned that their credit applicati on will be handled in a mechanisti c way, and the result conveyed with litt le or no explanati on. Banks need to pay att enti on to communicati on, explaining the complexity of credit assessment, and the im-portance of qualitati ve factors in additi on to the fi gures, parti cularly when looking to the future of a business. When banks are criti cised for being un-willing to lend to industry, they should be ready to stress to policy-makers the importance of responsible credit analysis, parti cularly during diffi cult economic ti mes. Above all, pressure on banks to increase loan books irre-specti ve of the credit risks, and suspend their credit judgment, fl ies in the face of the lessons learned from the crisis, and the stringent new prudenti al
regulati on that is being put in place.
Not only more data, but also more explanati on and communicati on is needed: the more informed the dis-cussion about bank lending, the bett er.
Figure 23: The cost of misunderstanding

28
CHAPTER 4: TYPES OF BANKS, BANKING ACTIVITY, AND THEIR USEFULNESS TO THE ECONOMY 12
The EU market can be described as having a ‘bank-based’ model, where most customers and enterprises are fi nanced by banks, as opposed to capital mar-kets. The ECB reports that the share of banks in credit intermediati on in Europe represents around 70%-75% of debt fi nancing to households and enterprises. In the US this number is around 20%-30%.
Both in prosperous ti mes and in turmoil, Europe’s banks seek to fulfi l the im-portant role of credit intermediati on by accepti ng deposits and by lending to the economy. The ECB’s bank lending surveys have consistently demonstrated this commitment notwithstanding anecdotal reports to the contrary during the period of economic hardship. The absence of a pan-European capital market that could off er an adequate alternati ve source of funding to Europe’s enter-prises (over 90% of which are SMEs) means that structural reform of banks risks disproporti onately aff ecti ng their prevailing role of credit intermediati on in Europe.
Banks play an important role in the European economy by providing essen-ti al fi nancial services to households and businesses. Supporti ng customers through strong, sustainable and focused relati onships is at the core of suc-cessful banking. Banks play an important role in providing consumers with ac-cess to banking services that enable them to live their daily lives: facilitati ng payments and fi nancial transacti ons; supporti ng small and medium-sized en-terprises through fi nance and advice; enabling investments in infrastructure and private fi nance; and helping businesses take and manage risks so that they can grow quickly. Banks also mediate between suppliers and users of capital in the market. All these functi ons are essenti al to the proper workings of a modern market economy.
The European banking sector incorporates a rich array of banks, with diff erent business models, legal forms and ownership structures. Apart from the larger commercial, retail and investment banks, which focus on a broad mix of bank-ing acti viti es, a large number of specialised insti tuti ons with diff erent owner-ship structures - public banks, cooperati ves and saving insti tuti ons - co-exist in this highly diversifi ed market. Such a diversifi ed banking landscape is in itself already a strong protecti on against fi nancial shocks as diff erent banking types react diff erently to specifi c events. Having small and large banks, domesti c and
12For more details see EBF Report on possible reform of the EU banking structures (July 2012): htt p://www.ebf-fb e.eu/uploads/EBF%20study%20on%20the%20issue%20of%20possible%20reforms%20to%20the%20structure%20of%20the%20EU%20banking%20sector.pdf
29
internati onal banks, specialised and universal banks, all contribute to a di-versifi ed, competi ti ve and safe banking sector. Such banks can be defi ned either as ‘diversifi ed’ banks – i.e. banks that combine diff erent banking ac-ti viti es; such as investment banking and corporate banking – or as ‘special-ised’ banks, i.e. banks that restrict themselves to only a few acti viti es, e.g. investment banking.
So, business models, to a large extent, can be disti nguished by the scope of acti viti es and funding strategies they engage in. Most retail-oriented banks, e.g. commercial, savings and cooperati ve banks, provide traditi onal bank-ing services to the general public. Investment-oriented banks focus more on trading acti viti es, relying on a variety of funding sources whilst oft en main-taining a retail network of their own. Other banks provide services to their insti tuti onal clients, including large and mid-sized corporati ons, real estate developers, internati onal trade fi nance businesses, network insti tuti ons and other fi nancial insti tuti ons.
Broadly speaking, there are two main categories of acti viti es worth disti n-guishing:
• Retail acti viti es. Retail banking acti viti es deal with banking products most people use on a day-to-day basis: payment services, loans and deposits. Re-tail banks are more likely to provide loans, and retail acti viti es oft en use customer deposits as the primary source of funding. Banks performing retail services need to be present in a broader geographical area through an ex-tensive network of branches, and have more employees, in order to be able to engage directly with their retail customers. Retail banks are less likely to engage in trading acti viti es. However, it must be noted that, given the vola-ti lity of the fi nancial markets, even ‘specialised’ retail banks have to adjust their risk profi le, taking positi ons in the wholesale markets since interest rate risk, credit/currency risk, etc. have to be conti nuously and dynamically managed. ‘Specialised’ retail banks need the experti se and capacity to enter these markets.
30
CHAPTER 4: TYPES OF BANKS, BANKING ACTIVITY, AND THEIR USEFULNESS TO THE ECONOMY 12
• Investment acti viti es. Investment banking is useful for the economy and is generally also customer-driven. Some examples of investment banking acti vi-ti es are:
o to help individuals secure mortgages they need to buy a home, investment banks market and distribute covered bonds. This lowers the price of mortgages for household borrowers; o to help companies hedge interest rate and foreign exchange risks related to their expansion, thus creati ng fi nancial sec- rity and allowing prudent fi nancial budgeti ng; o to help fi nance large infrastructure projects like schools or hospitals by providing syndicated loans or infrastructure funds that invest into public-private partnerships; o to provide funding to, and market-making of, sovereign and local authoriti es’ bonds in order to lower their cost of fund- ing.
In many markets there is a signifi cant, and growing, demand from SMEs for investment banking products. The level of demand for these products varies from one market to the other, depending on a range of factors, such as: the nature of the economy, especially the role of exports; the prevalence of inter-nati onal sources and uses of cash in SME accounts; and the sophisti cati on of the SME customer base, oft en driven by the sophisti cati on of the latt er’s own customers. These factors are widely observable in the EU where companies, including SMEs, act increasingly across borders within the EU and beyond.
Almost all banking acti vity, be it agreeing to an individual’s mortgage; lending € 10,000 to a small business; helping a farm or large company hedge com-modity price risks; or helping a government price and sell its bonds, involves risk-taking by a bank. By their very nature, banks must carry and manage that risk in order to meet the needs of their customers and the economy. Removing that risk from banks implies either removing it from the economy or placing it outside the regulated banking sector.
It is important to stress that banks need access to wholesale fi nancial markets in order to play their important role in balancing the fi nancial accounts in the region they operate. Banks’ balance sheets are the natural result of a popula-ti on’s savings in the form of deposits, and loans to households, businesses and governments.
31
In open economies, including in economies comprising a monetary union, supply and demand of funds is not necessarily in equilibrium. This is be-cause certain countries have a structural surplus (e.g. Belgium), whilst oth-ers have a defi cit (e.g. the Netherlands), rendering Dutch banks net import-ers of foreign capital. This demonstrates the fact that cross-border fl ows of funds are essenti al for open economies, and are one of the major reasons for the creati on of the common fi nancial market in Europe. In this frame-work, banks act as natural intermediaries, balancing out the demand and supply of funds by importi ng or exporti ng capital. Thus, countries with a surplus are prevented from developing a bubble, and defi cit countries from a entering a credit crunch. The most straightf orward way to do this is to use wholesale fi nancial markets.
Moreover, banks perform a socially useful role of maturity transformati on by collecti ng short term deposits and granti ng long term credits. On the one hand, they allow customers to keep deposits that are liquid and safe. On the other hand, they provide long term loans, oft en with fi xed interest rates, to companies and individuals. To hedge their risk, banks must transfer this risk to investors with the help of fi nancial market products.
To summarise, a balanced diversifi cati on of sources of revenues and of fund-ing represents a clear advantage to preserve the stability of fi nancial insti tu-ti ons, having the capacity to absorb external shocks in a much more resil-ient way than a specialised enti ty could. Diversifi ed banks have been less aff ected by the fi nancial crisis than specialised banks, and have a greater resilience based on clear synergies between private banking, retail and cor-porate banking, and investment banking. Diversifi ed full-service banks are diversifi ed by geography, product lines and customers, and this helps to di-versify risk and reduce concentrati on. Overall, this is benefi cial to fi nancial stability.

32
CHAPTER 5: NATIONAL BANKING SECTOR DESCRIPTIONS
1. AUSTRIA
Austria has a highly developed banking sector. Access to banking services, measured as number of inhabitants per bank branch, is among the highest in Europe (1,673 inhabitants per branch in 2010). The Austrian banking sec-tor consists of 842 banks with a total of 4,180 branches (2010 year-end num-bers). Employment in the industry reached about 78,000 people in 2010. The Austrian banking sector can be divided into 7 subsectors (joint stock banks and private banks, savings banks, state mortgage banks, Raiff eisen credit coop-erati ves, Volksbanken credit cooperati ves, building and loan associati ons and special purpose banks). The biggest sectors are the joint stock banks and pri-vate banks, the Raiff eisen credit cooperati ves and the savings banks. The Aus-trian banks’ geographical focus is Central and Eastern Europe (CEE), branching out into Central Eastern and South-Eastern European (CESEE) countries. Apart from their home country, Austrian banks and their subsidiaries are present in-ter alia in Albania, Bosnia-Herzegovina, Bulgaria, Belarus, Serbia, Montenegro, the Czech Republic, Croati a, Hungary, Poland, Romania, Russia, Slovenia, Slo-vakia and the Ukraine. While there is a signifi cant exposure in CEE and CESEE, Austrian banks are facing only relati vely small risks with respect to markets currently in severe conditi ons.
The Austrian banking sector’s total assets amounted to € 978 billion in 2010.€ 581 billion of these are total loans, with the most important consti tuent sums being loans to MFIs (€ 218 billion), loans to non-fi nancial corporati ons (€ 159 billion) and loans to households (€ 140 billion). Corporate fi nancing of Austrian non-fi nancials is dominated by loans and internal fi nancing. Financing through bonds and equity instruments have tentati vely been gaining ground over the past years, especially prior to 2008 and during the then ensuing crisis. One noteworthy detail about loans to households is the relati vely high propor-ti on of foreign currency loans. Due to interest rate diff erenti als and favourable exchange rate developments compared to euro-denominated loans, foreign currency loans off ered lower fi nancing costs for borrowers and used to be a popular fi nancing method. The Euro’s depreciati on since the beginning of the fi nancial and economic crisis in 2008 has prompted regulators to introduce stricter rules by considerably ti ghtening standards for granti ng of foreign cur-rency loans in March 2010. Aiming at a signifi cant reducti on of the overall vol-ume of foreign-currency denominated loans to consumers, they can now only be granted to people with suffi ciently large income in the relevant foreign cur-rency, and to individuals who are considered top-rated debtors.
33
By the end of 2010, total deposits received accrued to € 525 billion. Depos-its from MFIs were € 219 billion, whereas deposits received from non-MFIs were as high as € 302 billion. Deposits are the private households’ preferred way of holding fi nancial assets in Austria. Insurance products are ranking second, but they have a far smaller volume than deposits. They are followed by stocks and interest bearing securiti es.
At the end of 2011, Austrian authoriti es came up with a package of ‘sustain-ability-boosti ng’ measures for Austrian banks and their subsidiaries acti ve in Central and Eastern Europe. On the one hand the implementati on of the Basel III rules will be very ti mely, as a measure to bolster banking groups’ capital bases. On the other hand, credit growth in the future will be made conditi onal on the growth of sustainable local refi nancing (comprising main-ly local deposits) in order to improve the subsidiaries’ refi nancing structure. Thus in the future, subsidiaries that are parti cularly exposed must ensure that the rati o of new loans to local refi nancing (i.e. the loan-to-deposit rati o including local refi nancing) does not exceed 110%.
The Austrian Banking Sector generally displays solid numbers regarding regulatory capital, the cost-to-income rati o, the return on equity, as well as profi ts before taxes. The insti tuti ons’ eff orts to improve their capital rati os, especially with the imminent burden and prospect of the CRD IV, are in full progress. The regulatory burden emanati ng from the EU and its subordinat-ed authoriti es are further aggravated by various new nati onal regulati ons including a yearly general levy for banks totalling € 500 million in order to pay for the eff ects of the crisis and a new capital gains tax.
Contributors: Stephanus Kogler - [email protected], Stefan Rossmanith - [email protected]
34
CHAPTER 5: NATIONAL BANKING SECTOR DESCRIPTIONS
2. BELGIUM
The Belgian banking community is characterised by the presence of a large variety of players who are acti ve in diff erent market segments. BNP Paribas Forti s, KBC, Belfi us and ING Belgium are the four leading banks (with a cumu-lated balance sheet total of more than 65% of the enti re sector) off ering an extensive range of services in the fi eld of retail banking, private banking and corporate fi nance. In additi on, a number of smaller insti tuti ons are oft en acti ve in a limited number of market segments.
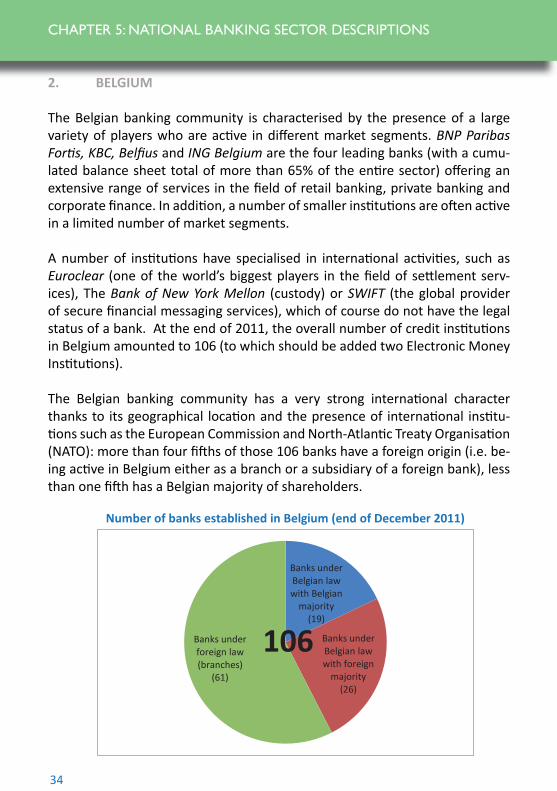
A number of insti tuti ons have specialised in internati onal acti viti es, such as Euroclear (one of the world’s biggest players in the fi eld of sett lement serv-ices), The Bank of New York Mellon (custody) or SWIFT (the global provider of secure fi nancial messaging services), which of course do not have the legal status of a bank. At the end of 2011, the overall number of credit insti tuti ons in Belgium amounted to 106 (to which should be added two Electronic Money Insti tuti ons).
The Belgian banking community has a very strong internati onal character thanks to its geographical locati on and the presence of internati onal insti tu-ti ons such as the European Commission and North-Atlanti c Treaty Organisati on (NATO): more than four fi ft hs of those 106 banks have a foreign origin (i.e. be-ing acti ve in Belgium either as a branch or a subsidiary of a foreign bank), less than one fi ft h has a Belgian majority of shareholders.
Number of banks established in Belgium (end of December 2011)
Banks under Belgian lawwith Belgian
majority(19)
Banks under Belgian lawwith foreign
majority(26)
Banks under foreign law (branches)
(61)
106
35
At the end of 2011, the number of bank branches in Belgium was almost 4,000. If one adds to this the number of points of sales held by independ-ent agents, then this number reaches almost 7,500. In additi on, there are more than 15,000 ATMs, including more than 8,000 cash dispensers. About 60,000 people are bank employees in Belgium, while the total number of staff workers in the fi nancial sector is more than 130,000 (out of a total Belgian workforce of about 4.7 million people). The fi nancial sector’s gross added value to the Belgian economy as a whole, reaches a fi gure of approxi-mately 5.5%.
At the end of 2011, the Belgian banks’ total assets (on a consolidated basis) amounted to more than € 1,100 billion. Loans granted to households and small enterprises make up the biggest part of those assets (more than one fi ft h of total assets), with corporate lending to non-fi nancial companies and interbank claims coming next (each taking approx. 15% of the total assets). Another important bank balance sheet item is investment in government debt securiti es.
Traditi onally, almost half of bank liabiliti es are made up of customer de-posits (including more than € 200 billion savings deposits of Belgian house-holds). As for derivati ves and interbank debts, each makes up less than one fi ft h of liabiliti es.
The 2008 banking crisis had a massive impact on the Belgian banking sector. The government extended support to three major banks by means of capital injecti ons and/or government guarantees. As a result, the banks concerned shrank their balance sheets by eliminati ng (nati onal or foreign) acti viti es or subsidiaries. This is clearly apparent in the rati o between the Belgian bank-ing sector’s balance sheet total (on a corporate basis) and the GDP: at the end of 2007, this rati o amounted to more than 400%, but by the end of 2011, it had been reduced to less than 330%. However, lending to domesti c households and non-fi nancial corporati ons did not suff er from this reduc-ti on of the balance sheet, for indeed it has grown considerably throughout the period.
36
CHAPTER 5: NATIONAL BANKING SECTOR DESCRIPTIONS
2. BELGIUM
The diffi cult situati on (including at the euro area level) entailed a reducti on of exposure to foreign counterparti es, as well as a return to the principal strate-gic markets. Belgian banks’ exposure to the public authoriti es of its European neighbour countries fell by around a third, from € 50 billion at the end of 2008 to € 16 billion at the end of 2011. In additi on, there was a substanti al decrease of the Belgian banks’ leverage (loan capital/equity capital rati o) from 31.9 at the end of 2007 down to 21.7 at the end of 2011. This was achieved by down-sizing the exposure and by increasing equity capital.
The fi nancial crisis led to far-reaching changes for the structure of banking su-pervision in Belgium. On 1 April 2011, this structure evolved into a new bipolar supervision model (‘Twin Peaks’). As a result, the Financial Services and Mar-kets Authority (FSMA) transferred its competence in the fi eld of micro-pruden-ti al supervision to the Nati onal Bank of Belgium (NBB, i.e. the central bank), but is sti ll in charge of supervising the fi nancial markets and products, as well as consumer protecti on in the fi eld of fi nancial services. Moreover, supervi-sion of the fi nancial insti tuti ons’ compliance with the Codes of Conduct, on the marketi ng of fi nancial products and on fi nancial educati on, has been added to its areas of competency. Since the introducti on of the Twin Peaks model, the NBB has been given responsibility for the macro- and micro-prudenti al supervi-sion of banks.
Contributors: Dirk De Cort – dirk.de.cort@febelfi n.be and Raf Rollier – raf.rollier@febelfi n.be
37
3. CZECH REPUBLIC
The Czech fi nancial sector is for various reasons (traditi on, under-develop-ment of the capital market, politi cal hesitati on with pension reform, etc.) dominated by the banks, i.e. the economy’s dependence on bank fi nancing is even more pronounced than in Western Europe. The banking sector in the Czech Republic is largely foreign-owned, more than 95 % of all assets are con-trolled by parent banks in developed countries, in parti cular in the EU.
As of 1 January 2012 there were 58 credit insti tuti ons directly present on the market: 44 banks (approx. 99.4 % of assets) and 14 credit unions (approx. 0.6 % of all Credit Insti tuti ons’ assets).
Out of forty four banks there were fi ve building societi es (with a specialised banking licence), twenty one branches of foreign banks. Since joining the EU the trend of a rising number of branches (with a single European passport/ licence) has become more apparent, partly by transforming former subsidiar-ies or representati ons and partly by just opening new branches on a relati vely fast growing and att racti ve new market.
In general, the structure of the banking sector has been relati vely stable from a long-term perspecti ve. Four ‘large banks’ (assets over approx. EUR 8 billion) – Ceska sporitelna (Erste Group), Komercni banka (Societe Generale Group), CSOB (KBC Group) and UniCredit Bank – manage approximately 57.5% of all assets. Their market share, however, is slowly declining due to relati vely strong competi ti on from small and medium-sized banks.
The Czech banking sector has been so far only marginally hit by the fi nancial, mortgage and sovereign-debt crisis. There was neither public assistance nor taxpayers’ money needed to be pumped into the banking sector, mainly for following reasons:
• very few exoti c ‘toxic assets’, low exposure to Greece’s government bonds;• focus on traditi onal conservati ve commercial banking concentrated on the domesti c market (relati vely litt le internati onal presence and internati onal fi -nancial markets’ acti vity);
38
CHAPTER 5: NATIONAL BANKING SECTOR DESCRIPTIONS
3. CZECH REPUBLIC
• most acti viti es are undertaken in domesti c currency (both on the assets’ and liabiliti es’ side of the balance sheets), implying low exposure to foreign exchange risk;• centralised and conservati ve supervision (and relati vely recent experience of bank restructuring in 1990s); • very favourable loan-to-deposit rati o due to high volume of domesti c depos-its (constantly under 80%, which is excepti onal in Europe), favourable systemic liquidity positi on (and liquidity positi on of major banks), leading to a very low dependence on the inter-bank market or on refi nancing operati ons of the central bank (liquidity provisioning facility is in place, but is rarely used); • good systemic capitalisati on (capital adequacy of 15.2%) and high quality of capital (mostly Tier 1) enables the banks to sustain even extremely stressful sce-narios simulated by the central bank.
For the reasons above, the Czech banking sector does not need to deleverage, the assets-to-GDP rati o is around 114%. There has been no credit crunch and vol-umes of bank loans have been steadily rising (at a slower pace than before, how-ever: 5.97% in 2011 even though the lending standards had ti ghtened somewhat in the crisis year 2009. Moreover, the demand for fi nancing from non-fi nancial corporates went down (due to an economic slowdown of some 4 percentage points). Since mid-2010 the volumes of credit to non-fi nancial corporates has been rising again and the volume of non-performing loans has stabilised before starti ng to decline slowly (apparent for the corporate credits especially, partly also for households). In general, companies have also learnt from the hard les-sons experienced. They are now in a bett er fi nancial shape than before 2009, and hence, are bett er protected from a likely economic slowdown in 2012.
In spite of the increased credit (and market) risk, the Czech banking sector has re-mained consistently very profi table throughout the crisis (Return on Equity (ROE) between 15 and 20%). The 2011 sector performance and results were only mar-ginally aff ected by the parti cipati on of several major banks in the Greek Public Sector Involvement (PSI), debt restructuring programme. One of the reasons for consistent profi tability is sector-wide strategy of cost opti misati on which is best evidenced by very favourable cost-to-income rati os (around 40%). The number of employees in Czech banks has been relati vely stable in previous years (reach-ing slightly over 40,000 in 2011).
Contributor: Jiří Bušek - [email protected]

39
4. DENMARK
The compositi on of Danish credit insti tuti ons has been evolving over the last decade. Owing to the increase in the consolidati on of the Danish fi nancial sector the number of credit insti tuti ons has declined from 196 in 2000 to 131 at the end of 2010. This has been followed by a decline in the number of branches from 2,374 in 2000 to 1,674 in 2011, whereas the employment fi gures have been much more stable. In 2000, 48,498 people were domesti -cally employed in the Danish banks compared to 47,739 at the end of 2011.
The sector is managing assets of € 1,145 billion in 2011, an increase from€ 432 billion in 2000 with an annual average growth rate of 9.3%. When the market share is based on total assets, the two largest banks in Denmark – Danske Bank and Nordea – manage 67% of the total market.
Since the beginning of the fi nancial crisis the Danish banks have slowly recovered, but are sti ll suff ering from low earnings. The Danish banks ran negati ve return on equity in 2008 (-3.4%) and in 2009 (-3.8%). In 2010 the fi gure improved to 2.4%. The same applies to profi t before tax as a share of total assets, which stayed at -0.1% in 2008 and 2009, but eventually turned to positi ve 0.2% in 2010. The Danish banking sector had an overall solvency rati o of 16.2% in 2010, which is 3.1 percentage points larger than in 2008. In additi on, the core capital rati o rose from 10.7% in 2008 to 15.2% in 2010. At the end of 2010, the outstanding debt with individual government guar-antees amounted to DKK 193 billion. Since then, a few banks have prema-turely redeemed or cancelled debt with individual government guarantees, and by December 2011 the remaining debt issuance totalled DKK 165 billion.
Denmark maintains a fi xed exchange rate policy vis-à-vis the euro area. This means that the aim of monetary and foreign exchange rate policy is to keep the DKK stable in relati on to the Euro. The Danish Central Bank (In Danish: Danmarks Nati onalbank) maintains this aim – independently without gov-ernmental interfering - by adjusti ng its monetary policy rates and by selling and buying foreign currency in the market. Consequently the Danish mon-etary policy rates tend to follow the monetary policy rates which the Euro-pean Central Bank (ECB) controls. By obligati on the exchange rate has to be 7.4038 DKK/€ where fl uctuati ons in the order of +/- 2.25% are acceptable.
40
CHAPTER 5: NATIONAL BANKING SECTOR DESCRIPTIONS
4. DENMARK
Since the beginning of the currency cooperati on in 1999, the exchange rate stayed within this fl uctuati on band. Before this, the monetary policy rates were fi xed with regard to the German D-Mark, which was offi cially initi ated in 1982.
Danish Central Bank has recently expanded its credit faciliti es, including the introducti on of 3-year loans and the expansion of the collateral basis to include the banks’ credit claims of good quality. Danish Central Bank’s initi ati ves are in-tended to supplement the banks’ access to loans, thereby easing the transiti on to a situati on without government guarantees when these guarantees expire in 2012-13.
The Danish Financial Supervisory Authority (FSA) is a part of the Ministry of Business and Growth, and their main task is supervision of fi nancial enterprises (mortgage-credit insti tuti ons, banks, pensions and insurance companies, etc.). By monitoring to ensure enterprises have adequate own funds to cover their risks (supervision of solvency), the Danish FSA plays an acti ve role in stabilising the fi nancial markets in Denmark. Their authority in declaring enterprises in-capable of managing their business makes them quite powerful. In additi on to supervisory acti viti es, the Danish FSA assists in drawing up fi nancial legislati on, and issues executi ve orders for the fi nancial area. The FSA has recently identi -fi ed a small group of banks on intensifi ed supervision due to potenti al solvency problems. In the beginning of 2011 this group accounted for a share of 3% of the total market (measured in assets). This said, the number is currently at a lower 2% level.
In additi on to the Danish FSA, the Ministry of Business and Growth established in 2008 - by agreement between the Danish State and the Danish fi nancial sector – The Financial Stability Company. Their main purpose is to wind-up dis-tressed banks which decide to be wound up under the Financial Stability Com-pany. Seven enterprises have recently been incorporated into the Financial Stability Company. The fi nancial basis of the new winding-up rules is based on the existi ng banking sector through guarantees provided by the Deposit Guar-antee Fund. The assets of the winding-up department in the Deposit Guaran-tee Fund total DKK 3.2 billion, which the fi nancial sector guarantees. So far, The Financial Stability Company has taken over banks, accounti ng for a market share of just below 4%. However, the Danish Government has made a profi t of DKK 9.9 billion on rescuing banks due to sector contributi ons.
Contributor: Morten Aastrup - moa@fi nansraadet.dk
41
5. FINLAND
In spite of the sovereign debt crisis in Europe, the Finnish banking sector has remained strong during the crisis. Finnish banks do not hold substan-ti al amounts of debt in the so called GIIPS countries (Greece, Ireland, Italy, Portugal, and Spain), so they have not been directly aff ected by the crisis. On the contrary, Scandinavian banks have been seen by markets as ‘safe havens’ during the crisis and banks have been able to issue bonds per usual during 2011. In parti cular, covered bonds issuance grew signifi cantly in Fin-land during 2011. Finnish banks have acquired considerable extra liquidity from the markets, which they have then deposited in the Bank of Finland. Deposits in the Central Bank have grown signifi cantly, from € 20 billion in August 2011 to € 70 billion in December 2011. In additi on to bond issuance growth, banks att racted numerous customer deposits during 2011. House-holds are the most important depositor sector in Finland. Household de-posits cover two thirds of all deposits by non-MFIs. Household deposits are mainly in current accounts paying very low rates. In additi on, the Monetary Financial Insti tuti ons (MFI) intra-group deposits substanti ally increased dur-ing 2011. On the whole, there were no funding problems among Finnish banks in 2011.
Contrary to many European countries, lending to public increased rapidly in Finland during 2011, especially loan growth to non-fi nancial companies, which conti nued to increase at the rate of 11 % per year. Also housing loans grew 6.5% from the previous year. The growth of housing loans was much faster in Finland than in the euro area on average. The increase in economic uncertainty and the downturn in house prices towards the end of the year were not refl ected in the growth of housing loans. One of the reasons for this is that interest rates on new housing loans have remained among the lowest in the euro area, because over 80% of new housing loans are ti ed to Euribor rates.
On the whole, total balance sheet of Finnish MFIs grew substanti ally dur-ing 2011. At the end of 2011, the aggregated balance sheet of Finnish MFIs stood at € 643 billion (338% of GDP). The balance sheet total increased by € 162 billion (33%) from a year ago. Credit insti tuti ons account for 98% of the aggregated MFI balance sheet. In Finland, the MFI balance sheet was boosted parti cularly by loans granted to the euro area, liabiliti es to outside the euro area, and derivati ves included in other assets and liabiliti es.

42
CHAPTER 5: NATIONAL BANKING SECTOR DESCRIPTIONS
5. FINLAND
At the close of 2011, there were about € 200 billion of derivati ves on both sides of the total MFIs balance sheets. Most of the derivati ves are interest rates and currency derivati ves whose balance sheet values change rapidly, refl ecti ng market volati lity. The amount of derivati ves on the assets and liabiliti es’ side of the aggregated balance sheet are almost equal, hence they are practi cally net to zero. If these derivati ves are nett ed, the total balance sheet would be substanti ally smaller. That is why the total balance sheet is not an adequate indicator of the size of the banking industry in Finland.
In additi on, loans granted to non-MFIs outside Finland exhibited strong growth in 2011. This was largely due to a signifi cant increase in repo agreements made with extra-euro area non-fi nancial corporati ons, insurance corporati ons and central counterparti es. A large proporti on of the extra-euro area assets and li-abiliti es comprised internal items within the Nordic banking groups. At the end of 2011, about half of the extra-euro area assets and 70% of extra-euro area li-abiliti es were intra-group items. Groups’ internal extra-euro area liabiliti es are mainly channelled as deposits to other MFIs in Finland, parti cularly the Bank of Finland. Also a considerable proporti on of loans and deposits between domes-ti c MFIs consist of intra-group loans and deposits. As a result of the growth in loans and deposits, growth in market values of derivati ves and growth of inter-MFI items, the aggregated balance sheet of MFIs expanded in 2011 faster in Finland than in any other euro area country.
Contributor: Elina Salminen - Elina.Salminen@fk l.fi
43
6. FRANCE
The French banking system, which has been modernised and restructured over the past two decades, is large, sophisti cated, and of internati onal impor-tance. The system is dominated by fi ve verti cally integrated universal banks and their subsidiaries: BNP Paribas, Société Générale, Crédit Agricole, BPCE and Crédit Mutuel. Three of the fi ve are organised on a mutual basis. Two large fi nancial insti tuti ons, La Poste and the Caisse des Dépôts et Consigna-ti ons (CDC), remain in government ownership.
The majority of French banks operate according to the ‘universal banking’ model in the sense that diversifi cati on of business lines serves to protect more effi ciently a universal bank from idiosyncrati c shocks that adversely impact individual lines of business: domesti c retail banking (households, corporates, SMEs), internati onal retail banking, specialised fi nancial services (consumer credit, leasing, etc), corporate and investment banking, and asset manage-ment and conservati on. 60% of French banks’ 2011 revenues are generated by retail networks. Fees represent, on average, 27.5% of revenues, including 75% on payments. Funding remains the main role of French banks, and rev-enues are thus very sensiti ve to refi nancing costs.
As of 1 January 2011, there were 678 credit insti tuti ons in France authorised by the Prudenti al Control Authority (Autorité de Contrôle Prudenti el, ACP), in-cluding 370 ‘General-purpose credit insti tuti ons’ (including branches of com-panies in the European Economic Area operati ng under freedom of establish-ment), 18 municipal credit banks, 287 fi nancial companies, three specialised fi nancial insti tuti ons, as well as Investment service providers. At the close of 2010, four payment insti tuti ons were authorised to do business in France (three authorised by the ACP, one under the freedom of establishment).
The French banking and fi nancial system is very open to internati onal mar-kets. This is seen in the large number of foreign-owned insti tuti ons in France and the presence of French-owned credit insti tuti ons in other countries.
At the end of 2010, 479 of the 683 credit insti tuti ons doing business in France were under French ownership (70%), and 204 (30%), were foreign-owned. Of the latt er, most were from the European Union. This was the case for 125 in-sti tuti ons, including 32 from the United Kingdom, 22 from Germany, 15 from Belgium, 14 from the Netherlands and 12 from Italy. The 79 credit insti tu-ti ons controlled by third-country owners are mainly American (34, including 11 banks, 21 fi nancial companies and one specialised fi nancial insti tuti on).
44
CHAPTER 5: NATIONAL BANKING SECTOR DESCRIPTIONS
6. FRANCE
Of the total 683, 74% were owned by banking groups, including 38% by French mutual banking groups, and 26% were controlled by shareholders in other economic sectors (manufacturing, trade and service groups, insurance groups, other fi nancial groups or a mix of shareholders, private individuals or the pub-lic sector). Industrial and trade groups have always held a signifi cant stake in France’s populati on of credit insti tuti ons, which is not necessarily the case in comparable countries such as Germany, Italy or the United States. By contrast, insurance groups hold a relati vely small stake in banks in France.
In the European Economic Area, 166 French bank branches operate under the European Passport (106 in 2000). More than 400 French credit insti tuti ons (subsidiaries and branches) operate outside the European Economic Area.
Corporate debt in France consists of bank credit (two thirds) and market fund-ing (one third). Banks and fi nancial intermediaries provide 100% of house-holds’ external fi nance and 12.5% of administrati ons’. Outstanding customer loans account for 31% of total assets.
France has a mature retail banking market. 99% of French residents over the age of 18 have a banking account (‘Basic banking rights’); they possess an av-erage of seven products per client. Banks also off er insurance products and France is the second largest European market for collecti ve investment funds. The French banking system contribute 3%-4% to GDP, and accounts for 48 mil-lion customers; 6.8 million current accounts and 157 million savings accounts (148.5 million for households and 6.6 million for corporate); 39,000 bank branches (including 12,700 Banque Postale branches) and 64 million bank cards, mostly debit cards which can be used for both payments and cash with-drawals through a nati onwide network of Points-of-Sale (POS) terminals and ATMs.
All authorised insti tuti ons must belong to a professional organisati on or cen-tral body, which is in turn affi liated to the Associati on Française des Etablisse-ments de Crédit et des Entreprises d’Investi ssement (AFECEI), which represents them before the government authoriti es. The professional organisati ons are: the Fédérati on Bancaire Française (FBF), the Associati on française des Sociétés Financières (ASF), the Groupement des Insti tuti ons Financières Spécialisées (GIFS), the Associati on Française des Marchés Financiers (AMAFI), the Associa-ti on Française de la Gesti on fi nancière (AFG), etc.

45
The legal and regulatory framework for banking supervision in France is clear, easily accessible and updated periodically.
France has separate supervisory insti tuti ons for the main fi nancial sectors: banking, insurance and securiti es. Arrangements have been put in place to en-sure adequate coordinati on between these authoriti es. The ACP and the AMF are the supervisory and regulatory agencies for the banking system, insurance, and securiti es industries. The Ministry of Economy issues regulati ons directly under its own name, aft er consultati on with the Comité Consultati f pour la Lé-gislati on et la Réglementati on Financières (CCLRF).
The Autorité de contrôle prudenti el (ACP) was created in January 2010 aft er the authoriti es in charge of licensing and controlling banking and insurance acti vi-ti es merged.
The Comité consultati f du secteur fi nancier (CCSF) is an advisory committ ee in charge of reviewing issues mainly in the area of relati ons between fi nancial insti tuti ons and their customers (individual customers and businesses) and pro-posing appropriate measures to resolve them. The scope of its authority covers the enti re fi nancial sector, i.e. credit insti tuti ons, insurance companies and in-vestment fi rms. The CCSF may call upon itself or be called upon by the Minister of the Economy or by professional or consumer organisati ons.
All banking and fi nancial laws are codifi ed in the Code Monétaire et Financier (COMOFI). The COMOFI also incorporates legislati on on the Fonds de Garanti e des Dépôts (FGD), and on the Autorité des Marchés Financiers (AMF), which regulates and supervises securiti es operati ons, including banks’ asset manage-ment acti viti es for third parti es. The main banking and accounti ng regulati ons are collected in the Recueil des Textes Réglementaires published by the CRBF.
The legal framework to conduct banking business is also well developed, with clear and concise legislati on. The legal profession and the judiciary are well trained and have a strong understanding of fi nancial and banking issues. Super-visory staff is well versed in the applicati on of fi nancial sector legislati on. Rules on contracts and contract enforcement, as well as establishment and foreclos-ure of security interests are well developed, although legal procedures are lengthy. The accounti ng and auditi ng professions are well regulated, and sub-ject to rigorous training and entry requirements. They are subject to regulati on and codes of conduct issued by the Haut Conseil du Commissariat aux Comptes (HCCC) and the Compagnie Nati onale des Commissaires aux Comptes (CNCC).
Contributor: Estelle Brack - ebrack@fb f.fr
46
CHAPTER 5: NATIONAL BANKING SECTOR DESCRIPTIONS
7. GREECE
I. The structure of the Greek Banking sector
The Greek banking sector consists of 53 credit insti tuti ons13 with 4,005 branches and 63,400 employees14. There are 4 main categories of banks operati ng in Greece:
• 17 commercial banks established in Greece • 13 cooperati ve banks established in Greece • 19 branches of banks established in another EU Member State • 4 branches of banks established in third countries (outside the EU)
Banks in Greece manage an equivalent of 113% of the Greek GDP (loans to house-holds and businesses), hold an equivalent of 96% of the Greek GDP in deposits and repos and lend € 113.4 billion for house purchase and consumer credit, an equiva-lent of € 10,300 per inhabitant. With an aggregate balance sheet (total assets) at 220% of GDP, the size of the Greek banking system is not excessive compared to other countries. However, the average loan-to-deposit and repos rati o increased in January 2012 to 146.5% (from 132.3% in January 2011 and 119.9% in January 2010) mainly owing to the sharp decline in deposits since the start of the fi scal crisis in early 2010.
II. Greek banks and the recent global fi nancial crisis, 2007-2009
Greek banks were not exposed to the risks that triggered the recent global fi nan-cial crisis. Thus, the spillover eff ects from the global fi nancial crisis on the Greek banking system were limited. Accordingly, there was no need to acti vate a bank rescue programme. Hence, the recovery plan adopted by the Greek government (worth € 28 billion) in late 2008 was mainly aimed at the enhancement of liquidity conditi ons in the system15. Moreover, the level of deposit guarantee was raised to € 100,000 (from € 20,000) per depositor immediately aft er the bankruptcy of Leh-man Brothers in order to enhance depositor confi dence in the system16.
As was expected, during the global fi nancial crisis, liquidity conditi ons have de-teriorated as Greek banks had limited access to wholesale markets to fund their lending acti vity, and maturing inter-bank liabiliti es put additi onal pressure on their liquidity positi on. Despite the problems, Greek banks have shown remarkable resilience and were able to refi nance their loan portf olios owing, inter alia, to a number of factors:
13 Bank of Greece, List of Credit Insti tuti ons authorised in Greece, March 2012. 14 European Central Bank, Structural Indicators for the EU Banking Sector, December 2011. 15Law 3723/2008, Offi cial Gazett e A’ 250/9.12.2008. 16Law 37143/2008, Offi cial Gazett e A’ 231/7.11.2008, arti cle 6.
47
•
•
•
During the global fi nancial crisis, the Greek banking system remained healthy, adequately capitalised, and highly profi table.
III. The impact of the Greek fi scal crisis on the banking system, 2009-2012
The Greek banking system was negati vely aff ected by the Greek debt crisis. The recession and losses from government debt exposures have had considerable implicati ons on the banking system, undermining the fi nancial stability of the previous years, and necessitati ng the adopti on of diff erent strategies.
Greek banks faced the following main challenges which provoked signifi cant capital and liquidity pressures:
• • • • •
•
bank deposits and repos have declined by 18% since the end of 2010 (and 27.5% since the end of 2009);bank credit to the domesti c private sector has declined signifi cantly (see Table 1);the rati o of non-performing loans (NPLs) to total loans reached 14.7% at close of September 2011 (see Table 2);extremely limited access to the inter-bank money and debt capital markets;reliance on Eurosystem credit and Emergency Liquidity Assistance (ELA) by the Bank of Greece reached € 130 billion by close of 2011. Borrowing from the ECB represents, currently, nearly 16% of banks’ total liabiliti es (December 2011: € 76.1 billion, December 2010: € 97.7 billion).in January 2012 interest rates for new deposits from households with agreed maturity of up to one year were the highest (4.79%) in the euro area (2.96%).
they had a strong capital base and steadily increased their provi-sions (more than 40%, year-on-year);they were facilitated by measures taken by the European Central Bank and the Greek government;the eff ecti ve prudenti al supervision by the Bank of Greece ensured the stability of the Greek banking system.
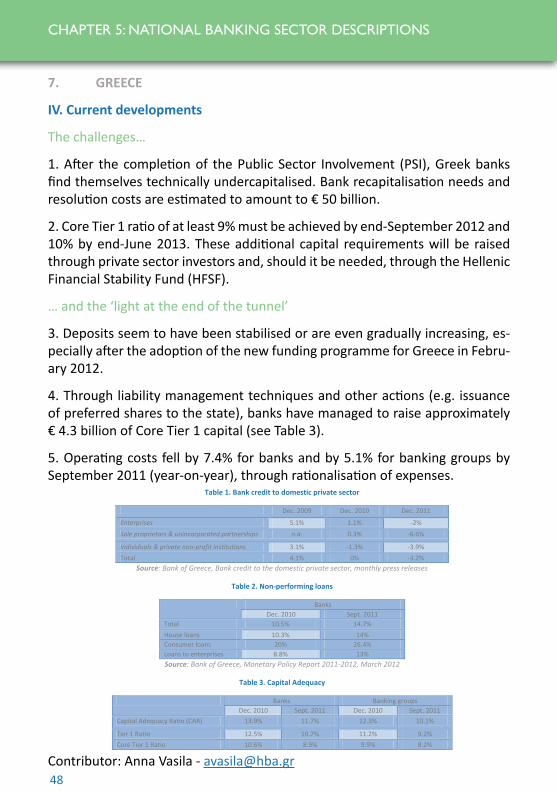
48
CHAPTER 5: NATIONAL BANKING SECTOR DESCRIPTIONS
7. GREECE
IV. Current developments
The challenges…
1. Aft er the completi on of the Public Sector Involvement (PSI), Greek banks fi nd themselves technically undercapitalised. Bank recapitalisati on needs and resoluti on costs are esti mated to amount to € 50 billion.
2. Core Tier 1 rati o of at least 9% must be achieved by end-September 2012 and 10% by end-June 2013. These additi onal capital requirements will be raised through private sector investors and, should it be needed, through the Hellenic Financial Stability Fund (HFSF).
… and the ‘light at the end of the tunnel’
3. Deposits seem to have been stabilised or are even gradually increasing, es-pecially aft er the adopti on of the new funding programme for Greece in Febru-ary 2012.
4. Through liability management techniques and other acti ons (e.g. issuance of preferred shares to the state), banks have managed to raise approximately € 4.3 billion of Core Tier 1 capital (see Table 3).
5. Operati ng costs fell by 7.4% for banks and by 5.1% for banking groups by September 2011 (year-on-year), through rati onalisati on of expenses.
Contributor: Anna Vasila - [email protected]
Table 1. Bank credit to domestic private sector
Dec. 2009 Dec. 2010 Dec. 2011
Enterprises 5.1% 1.1% -2% Sole proprietors & unincorporated partnerships n.a. 0.3% -6.6%
Individuals & private non-profit institutions 3.1% -1.3% -3.9% Total 4.1% 0% -3.2%
Source: Bank of Greece, Bank credit to the domestic private sector, monthly press releases
Table 2. Non-performing loans
Banks Dec. 2010 Sept. 2011
Total 10.5% 14.7% House loans 10.3% 14% Consumer loans 20% 26.4% Loans to enterprises 8.8% 13% Source: Bank of Greece, Monetary Policy Report 2011-2012, March 2012
Table 3. Capital Adequacy
Banks Banking groups Dec. 2010 Sept. 2011 Dec. 2010 Sept. 2011
Capital Adequacy Ratio (CAR) 13.9% 11.7% 12.3% 10.1%
Tier 1 Ratio 12.5% 10.7% 11.2% 9.2% Core Tier 1 Ratio 10.6% 8.9% 9.9% 8.2%
Source: Bank of Greece, Monetary Policy Report 2011-2012, March 2012

49
8. IRELAND
Ireland is a small open economy that places strong emphasis on internati on-al trade. The banking system comprises insti tuti ons focused on the domesti c market and a large number of foreign-owned insti tuti ons (including insti tu-ti ons headquartered in Ireland) that mainly serve internati onal or multi na-ti onal clients.
The Banking Sector in Ireland
Credit insti tuti ons in Ireland employed some 40,000 people at the end of 2010. Gross value added (GVA) by the banking sector was esti mated at € 7.3 billion in 2009, equivalent to 8% of total GVA by businesses in Ireland (excluding agriculture), according to the Central Stati sti cs Offi ce.
The Domesti c Banking Sector
There were some 20 banks and building societi es with signifi cant business with Irish resident household or non-fi nancial corporate credit or deposit markets at the end of 2011, according to the Central Bank of Ireland. These included four Irish-owned banking groups: three of them majority-owned by the government (AIB Group, Irish Bank Resoluti on Corporati on and Per-manent tsb Group), while the government also had a minority stake in the Bank of Ireland Group. The Irish banking groups are collecti vely known as the “covered” banks because a porti on of their liabiliti es have been covered under the government guarantee schemes introduced in 2008.
The Irish-owned banks have undergone signifi cant restructuring since 2010, in line with the recapitalisati on of the banks by the Irish government, which was completed in July 2011. Most building societi es in Ireland have given up their mutual status and been merged into banking groups. The government aims to wind down the Irish Bank Resoluti on Corporati on by 2020. The re-maining banking groups must meet a loan-to-deposit target of 122.5% by 2013, mainly by divesti ng non-core loan assets.
Credit institutions in Ireland (December 2011)
Institutions Assets (€, bn) Domestic market institution banks/building societies 20 620 International banks <60 391 Credit unions (estimated) >400 14 Total credit institutions 480 1,025
Sources: Central Bank of Ireland, Department of Finance

50
CHAPTER 5: NATIONAL BANKING SECTOR DESCRIPTIONS
8. IRELAND
This downsizing is parti cularly evident in covered banks’ foreign claims, which declined by 26% between December 2010 and December 2011 as they dis-posed of overseas’ units.
Credit insti tuti ons in Ireland include more than 400 credit unions, which are non-profi t, member-owned fi nancial cooperati ves funded primarily by mem-ber deposits that compete with banks in the personal lending and deposits markets. Each credit union operates a single branch, and its membership is drawn from a specifi c community, industrial or geographic group.
The Central Bank of Ireland, and the European Central Bank, report on-balance sheet data for credit insti tuti ons, with on-balance sheet loans to the Irish resi-dent households and non-fi nancial corporati ons of € 198 billion at the end of 2011. However, this excludes some € 52 billion in securiti sed loans from banks to Irish residents of which about € 50 billion was securiti sed mortgages.
An Post, the State-owned postal service operator, provides a range of fi nancial services directly, such as payment services and government savings and invest-ment schemes, and indirectly through its subsidiary One Direct, such as credit cards and insurance. It also off ers some cash-based banking services in its of-fi ces to customers of partner banks.
Central bank data on credit insti tuti on deposits does not include some € 12 bil-lion held in nati onal savings schemes and administered by An Post.
The Internati onal Financial Services Sector
Ireland has emerged as a major internati onal fi nancial services centre. It was the sixth-largest exporter of fee-based fi nancial services and insurance servic-es in 2011 according to United Nati ons Conference on Trade and Development (UNCTAD). Ireland supports the full range of banking acti viti es, including cor-porate and investment banking, funds industry services, asset management, corporate treasury, securiti sati on, leasing and asset fi nance, trade fi nance, and wealth management. Many operati ons provide services to other parts of their group: services as diverse as middle and back offi ce operati ons supporti ng a trading operati on to management of group liquidity.

51
Internati onal banking, insurance and funds services companies employ al-most 25,000 people in Ireland, with around 40% of this employment ac-counted for by banks. Internati onal fi nances services contributes an esti -mated 16% of overall corporate tax receipts in Ireland.
Banking Regulati on and Policy
The Central Bank of Ireland is responsible for central banking and fi nancial regulati on in Ireland, including maintaining price stability through monetary policy formulati on at Eurosystem level, contributi ng to fi nancial stability both in Ireland and across the euro area, ensuring proper and eff ecti ve regu-lati on of fi nancial insti tuti ons and markets, protecti ng customers and inves-tors through conduct of business rules and other measures and maintaining oversight of the payment system. The role of the Department of Finance’s Banking Division is to advise and support the Minister for Finance’s and the Government’s objecti ves and strategies for the banking sector in Ireland. Contributor: Anthony O’Brien - [email protected]
52
CHAPTER 5: NATIONAL BANKING SECTOR DESCRIPTIONS
9. ITALY
Structure of the banking industry
Italy is home to the fourth largest banking market in Europe (aft er Germany, UK and France) with total asset value esti mated at € 4,042 billion at the end of 2011. It accounts for approximately 9% of total European banks’ assets.
The Italian banking sector comprises 740 banks, of which 214, or 29%, are joint stock companies (SpA) and account for around 75% of the domesti c banking market. The sector also features two types of enti ty operati ng under a coop-erati ve structure, namely 37 cooperati ve banks (banche popolari) and a large number (411) of small mutual banks (Banche di credito cooperati vo – BCC). The subsidiaries of foreign companies or banks operati ng in Italy are 72, two of which fi gured among the top ten banking groups.
With the excepti on of small mutual banks (BCCs), which are subject to specifi c regulati ons and have mutual ends, all the other sector players undertake their acti vity as private enti ti es pursuing profi tability. Even the cooperati ve banks, though sti ll characterised by the one-person-one-vote principle, operate on the market exactly like their SpA counterparts, and some of them are listed on the stock market; a few of them are leading players in the Italian banking sec-tor. By contrast, BCCs are very small in size. They are organised around regional federati ons providing centralised services to the individual members.
The Italian banking sector is totally private. Following the intense privati sati on process of the 1990s, the state’s share in Italian banks is below one percent. Before the start of the privati sati on process of the 1990s, the state and local public authoriti es owned around 70% of total banking assets. This result was achieved both by the sale of the stakes held directly by the state, and through regulatory interventi on to encourage the conversion of public banks – mainly savings banks (Casse di Risparmio) – into SpAs, with the concurrent creati on of Foundati ons and the separati on of the banking side from the foundati on via conferral in exchange for shares of the new banking companies. Having under-taken a series of regulatory changes, the bank foundati ons today are private non-profi t legal enti ti es with statutory and operati ng independence, whose aims are social good and the promoti on of economic growth.
53
In conclusion, the Italian banking sector is fully private and largely character-ised by SpA banks (except for cooperati ve banks and BCCs). The shareholder base of the banks is quite widespread, considering that a large proporti on of the capital of the 24 listed banks is free fl oat. Alongside this, the foundati ons are stable shareholders, whose aim is constant profi tability over ti me and medium/long-term investment.
Italian banks and the recent global fi nancial crisis
The current euro area crisis can be divided into three stages: i) a purely fi -nancial crisis originated in the United States in 2007-2008, which ii) then transformed into a downturn in the real economy in 2008-2009 and iii) fi -nally led to the ongoing debt crisis.
Initi ally, it endangered the stability of those banks which essenti ally based their funding on the wholesale market. In that phase, the Italian banks were substanti ally immune due to their traditi onal commercial banking business model, which basically means taking deposits from customers and granti ng loans to households and fi rms. The impact and reacti ons of EU governments depended on the structure and the size of the nati onal or internati onal banks they hosted. In general, governments supported or saved banks by granti ng them liquidity. However, for certain banks the scale of the fi nancial crisis was so signifi cant that it required more detailed interventi on on the part of governments. The State aid to Italian banks remained close to zero. In other countries, nati onal governments needed funds to support banks and to off set the fall in tax revenues induced by the growing economic crisis, which triggered the second phase of the crisis: the real economy crisis.
Bankruptcies, reducti on in bank credit, substanti al losses in the fi nancial markets, growing budget defi cits which drew funds from the capital market and other outcomes of the fi nancial crisis dramati cally reduced economic acti vity, bringing company closures and job losses. As a result of the crisis in the real economy between 2008 and 2010, Italian banks suff ered losses in terms of devaluati on and loss of credit equivalent to around € 38 billion.
54
CHAPTER 5: NATIONAL BANKING SECTOR DESCRIPTIONS
9. ITALY
Finally, the Italian banking market was seriously aff ected by the subsequent phase of the crisis, the sovereign one, which, since the summer of 2011, has resulted in an intensifi cati on of European sovereign debt risk, aft er having benefi ted in the previous months from the slight improvement in the macr-oeconomic outlook and the relati ve stability of fi nancial markets. Uncertainty around the creditworthiness of some euro area governments translated into higher instability of the European banking system. The link between sovereign and banking risk is refl ected in the positi ve correlati on between banks and sov-ereign credit default swaps (CDSs).
For the Italian banks, strains in the fi nancial markets and downgrades of the country’s credit rati ng led to diffi culti es in accessing internati onal markets and higher funding costs. Over the year, wholesale funding as a share of total fund-ing declined by 4.8 percentage points, banks’ liabiliti es to the Eurosystem ex-panded sharply, and the average cost of total funding rose by 33 basis points compared with the previous year.
In the fi rst half of 2011, lending to residents by banks operati ng in Italy grew at a faster pace than in the previous two years. In June the twelve-month rate of increase, net of repos and bad debts, was 3.4%. In the second half of the year the sovereign debt crisis dampened the supply of credit. The slowing of economic acti vity weakened the demand for loans and caused deteriora-ti on in borrowers’ quality, pushing up the value of the bad debt rati o. This in turn aff ected the pace of lending, principally in the last quarter of the year: the twelve-month rate of growth in loans by Italian banks declined sharply, to around 1% in December 2011.
Given the relati vely favourable conditi ons in the internati onal funding mar-kets in the fi rst half of 2011, Italian banks issued suffi cient bonds to refi nance the whole amount falling due during the year. Non-residents’ deposits also in-creased, and in June, were 8.2% above the level of the previous year. However, from the summer 2011 onwards, the performance and compositi on of funding were heavily aff ected by the spread of the sovereign debt crisis to Italy, which led to diffi culti es in accessing the wholesale market and higher funding costs. In the twelve months leading up to December 2011, Italian banks’ total fund-ing, excluding liabiliti es to other Italian banks, grew by 4.3%, the same as in
55
2010. The increase can be ascribed almost enti rely to liabiliti es vis-à-vis the Eurosystem, which more than off set the contracti on in fund-raising on inter-nati onal markets in the second half of the year. In 2011, the profi tability of the Italian banking system was strongly aff ected by the huge one-off write-downs of goodwill made by the leading groups to bring their book values more closely into line with market developments, and increase the transparency of their balance sheets. The return on equity was negati ve, but net of the write-downs to goodwill banks’ profi t before tax would have been positi ve, although signifi cantly lower than in 2010.
Italian banks signifi cantly strengthened their highest-quality capital resourc-es, those best able to absorb losses, thanks to massive capital increases and, to a lesser extent, self-fi nancing. At the end of 2011, the core Tier 1 rati o was 9.3% for the banking system as a whole, and 8.9% for the fi ve largest groups. The gap in capitalisati on, with respect to the main European banks, narrowed. Financial leverage, measured as the rati o of total balance-sheet assets to Tier 1 capital, is well below that of the main European banks. In the early months of 2012 banks conti nued to strengthen their capital bases in order to meet the European Banking Authority’s recommendati on on banks’ capital and the Basel III capital requirements, which are to enter into force in 2013.
Recent European policy responses should help to break the negati ve feed-back loop between banks and sovereign risk. The Outright Monetary Trans-acti ons programme (OMTs) set up on the 6 of September 2012 allows the ECB to buy unlimited sovereign debt with maturiti es of one to three years. It should help restore market confi dence in Italy’s ability to meet its debt obligati ons and should help to acti vate a virtuous circle: it shrinks the high ‘unfair’ risk premiums paid by the Italian government to cover its funding needs, it reduces the cost of public debt and thus fosters the achievement of the government objecti ves; it helps to create the economic conditi ons for government to implement policies for growth; at the level of the bank-ing sector, it reduces the cost of bank funding and therefore supports the economic performance of banks and fosters an easing of conditi ons for the granti ng of loans to households and fi rms.
Contributors: Riccardo Benincampi – [email protected],Francesco Masala – [email protected]

56
CHAPTER 5: NATIONAL BANKING SECTOR DESCRIPTIONS
10. LIECHTENSTEIN
The Principality of Liechtenstein is a consti tuti onal hereditary monarchy on a democrati c and parliamentary basis. The country is situated in the middle of Europe, embedded between Switzerland and Austria on the Alpine Rhine, with a populati on of about 36,000.
In Liechtenstein, the nati onal economic signifi cance of the fi nancial centre is disproporti onately high compared to other countries. Securing a fi nancial cen-tre with long-term orientati on based on conti nuity and sustainability is thus of fundamental importance for Liechtenstein. The fi nancial sector contributes a total of 27% to Liechtenstein’s GDP and generates more than a third of state revenue. Alongside industry, trades and other services, it is thus one of the central pillars of Liechtenstein’s nati onal economy.
By the end of 2011, there were 17 banks licensed in Liechtenstein. Of these, seven banks were subsidiaries of Swiss or Austrian insti tuti ons. Thus, the bank-ing industry plays a major role in the Liechtenstein fi nancial centre. Their ac-ti viti es traditi onally focus on private banking and wealth management. They do not engage in investment banking and carry comparati vely low risks. Due to the very limited home market, the banks in Liechtenstein are highly inter-nati onally oriented and have about 60 representati ons in more than 14 coun-tries, most of them outside Europe, and especially in Asia. The three biggest Liechtenstein banking groups have expanded their presence abroad in recent years in order to open up areas for growth. Two of these are listed companies at the Swiss Stock Exchange (SWX) in Zurich. Notwithstanding the share of the Liechtenstein banks in the global market for cross-border acti vity, private as-sets under management comprise approximately only 1%. In an internati onal context, the Liechtenstein fi nancial sector thus occupies a niche positi on.
Thanks to Liechtenstein’s membership in the European single market, the banks enjoy full freedom of services throughout the enti re European Economic Area (EEA). This makes it possible to off er fi nancial products from Liechtenstein that are based on the Swiss franc and authorised throughout the enti re European Union (EU). Consequently, Liechtenstein’s fi nancial service providers benefi t from the free movement of capital and services. The membership in the EEA and the close relati onship to Switzerland, as part of the Swiss economic area, is unique worldwide, and enables the Liechtenstein fi nancial centre to off er its clients the combinati on of fi nancial strength, stability, and the so-called EU passport. On the other hand, the same legal requirements apply to banks in
57
Liechtenstein as in all EU countries. As of March 2012, Liechtenstein has implemented 99.6% of the EU single market directi ves according to the EFTA Surveillance Agency (ESA), and therewith ranks under the top-fi ve countries EU/EEA-wide.
Liechtenstein banks have solid and high-quality equity capital resources. During the fi nancial crisis, no bank required aid by the state. They already meet the future core capital rati o, sti pulated by Basel III, with a Tier 1-Ra-ti o of 17.2%, putti ng them among the best-capitalised banks in Europe. Liechtenstein has traditi onally stood for politi cal stability, debt-free nati onal budget and conditi ons favourable to business. Liechtenstein’s AAA rati ng by Standard and Poor’s, confi rmed in September 2011, underscores the country’s reliability. According to the Internati onal Monetary Fund (IMF), Liechtenstein fulfi ls ‘high standards in fi nancial market supervision and anti -money-laundering measures’. The Liechtenstein fi nancial centre is acti vely engaged in the fi ght against money laundering and terrorist fi nancing, and fully implemented the Third EU Money Laundering Directi ve in 2009. In to-tal, Liechtenstein commits itself to a zero-tolerance policy with respect to abuse.
For some ti me now, Liechtenstein has been on the path towards greater internati onal integrati on and cooperati on in tax matt ers. With the ‘Liech-tenstein Declarati on’ issued on March 13, 2009, the country committ ed it-self to the Organisati on for Economic Cooperati on and Development (OECD) standards on cooperati on in tax matt ers and thus accepts and implements the internati onally valid rules of transparency and informati on exchange on tax matt ers. Meanwhile, Liechtenstein has concluded OECD-compat-ible tax agreements with numerous countries (for more informati on, see www.regierung.li).
To support the ongoing transformati on process, the newly adopted fi nancial centre strategy - the so-called Roadmap 2015 - promotes the development of sustainable, future-oriented products and business models that do justi ce to clients’ great sense of responsibility toward society and the environment. The Roadmap 2015 comprises more than 40 fi elds of acti vity whose aim is that the fi nancial centre will conti nue to be a place of choice and be able to provide tailor-made products and excellent services to demanding, interna-ti onal clients in a fully compliant world. Two examples of innovati ve ideas in this fi eld are the Microfi nance Initi ati ve Liechtenstein and the LIFE Climate Foundati on Liechtenstein.
58
CHAPTER 5: NATIONAL BANKING SECTOR DESCRIPTIONS
10. LIECHTENSTEIN
Be that as it may, the diffi cult internati onal market environment has also infl u-enced the development of the Liechtenstein fi nancial sector in the past years. Liechtenstein banks and their foreign group companies managed client assets to the total amount of CHF 166 billion and the consolidated net infl ow of new assets reached nearly CHF 7.1 billion (+21.5%). The cost-income-rati o was at a remarkably low level, as under pressure owing to the extraordinarily diffi cult market conditi ons (strong Swiss franc combined with excepti onally low inter-est rates), as well as the increasing regulatory and administrati ve costs.
Finally, the Liechtenstein Financial Market Authority (FMA) has been a mem-ber of the Internati onal Organizati on of Securiti es Commissions (IOSCO) since April 2011, and gained observer status in the European Securiti es and Markets Authority (ESMA) in May 2011. Thus, the FMA represents Liechtenstein in all three European Supervisory Authoriti es. This is an expression of recogniti on of Liechtenstein, its fi nancial centre and quality of supervision as an equal partner within the internati onal and European community. At the same ti me, this fur-ther strengthens the integrati on of the fi nancial centre, and facilitates market access for Liechtenstein intermediaries to foreign markets.
Contributor: Simon Tribelhorn - [email protected]
59
11. LUXEMBOURG
Luxembourg’s economy is dominated by the service sector (82% of GDP and 75% of employment), following the strong growth of the fi nancial sector, with the presence of both global and smaller fi nancial insti tuti ons. Luxem-bourg’s reputati on of an internati onal fi nancial centre is based on its ability to deliver tailored and innovati ve soluti ons to an internati onal client base. The Luxembourg domesti c fi nancial market represents less than 1%.
Five strategic pillars can be identi fi ed: - wealth management; - asset management and investment funds; - Internati onal Loans; - insurance; - structured fi nance.
The common denominator of all these acti viti es is the internati onal charac-ter and cross-border fi nancial transacti ons.
Luxembourg is the leading wealth management centre in the euro area. In line with the fi nancial centre as a whole, local private banks, fi nancial advisers and family offi ces specialise in handling internati onal clients who oft en have complex business and family profi les stretching across several countries or even conti nents. Over the past ten years, Luxembourg’s private banking sector developed strong geographical diversifi cati on. From 90%, the share of the three neighbouring countries (Belgium, France and Ger-many) has fallen to 49%, while assets under management have increased globally. 19% of the acti vity has a geographic origin in the European Union (other than Belgium, France and Germany). All other private banking clients are located around the world (Asia, Lati n America, Middle East, etc). Gener-ally speaking, acti viti es in wealth management can be split into three large categories: bank transacti ons, investment advice and wealth planning.
The Luxembourg fi nancial centre is also a major internati onal distributi on platf orm for investment funds. Collecti ve investment management has been developing since the mid 1980s. Today, Luxembourg is the world’s sec-ond investment fund centre aft er the United States, and Europe’s fi rst with over € 2,000 billion in assets under management.
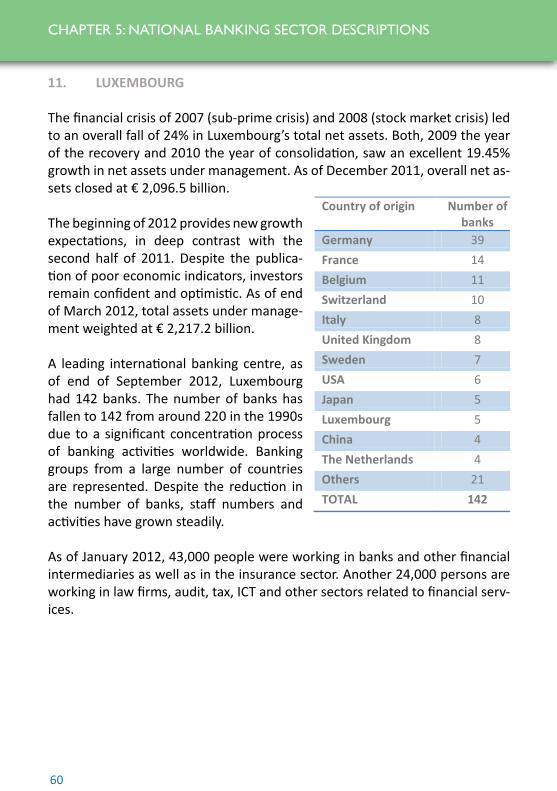
60
CHAPTER 5: NATIONAL BANKING SECTOR DESCRIPTIONS
11. LUXEMBOURG
The fi nancial crisis of 2007 (sub-prime crisis) and 2008 (stock market crisis) led to an overall fall of 24% in Luxembourg’s total net assets. Both, 2009 the year of the recovery and 2010 the year of consolidati on, saw an excellent 19.45% growth in net assets under management. As of December 2011, overall net as-sets closed at € 2,096.5 billion.
The beginning of 2012 provides new growth expectati ons, in deep contrast with the second half of 2011. Despite the publica-ti on of poor economic indicators, investors remain confi dent and opti misti c. As of end of March 2012, total assets under manage-ment weighted at € 2,217.2 billion.
A leading internati onal banking centre, as of end of September 2012, Luxembourg had 142 banks. The number of banks has fallen to 142 from around 220 in the 1990s due to a signifi cant concentrati on process of banking acti viti es worldwide. Banking groups from a large number of countries are represented. Despite the reducti on in the number of banks, staff numbers and acti viti es have grown steadily.
As of January 2012, 43,000 people were working in banks and other fi nancial intermediaries as well as in the insurance sector. Another 24,000 persons are working in law fi rms, audit, tax, ICT and other sectors related to fi nancial serv-ices.
Country of origin Number of banks
Germany 39 France 14 Belgium 11 Switzerland 10 Italy 8 United Kingdom 8 Sweden 7 USA 6 Japan 5 Luxembourg 5 China 4 The Netherlands 4 Others 21 TOTAL 142
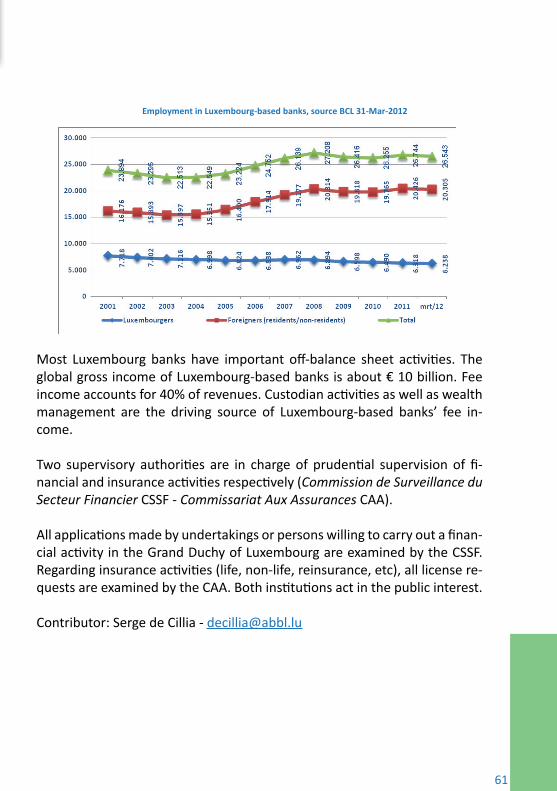
61
Most Luxembourg banks have important off -balance sheet acti viti es. The global gross income of Luxembourg-based banks is about € 10 billion. Fee income accounts for 40% of revenues. Custodian acti viti es as well as wealth management are the driving source of Luxembourg-based banks’ fee in-come.
Two supervisory authoriti es are in charge of prudenti al supervision of fi -nancial and insurance acti viti es respecti vely (Commission de Surveillance du Secteur Financier CSSF - Commissariat Aux Assurances CAA).
All applicati ons made by undertakings or persons willing to carry out a fi nan-cial acti vity in the Grand Duchy of Luxembourg are examined by the CSSF. Regarding insurance acti viti es (life, non-life, reinsurance, etc), all license re-quests are examined by the CAA. Both insti tuti ons act in the public interest.
Contributor: Serge de Cillia - [email protected]
Employment in Luxembourg-based banks, source BCL 31-Mar-2012

62
CHAPTER 5: NATIONAL BANKING SECTOR DESCRIPTIONS
12. NETHERLANDS
The Dutch banking sector is characterised by the relati vely large size, high level of concentrati on and internati onal orientati on.
Measured against the size of the Dutch economy, the Dutch banking sector is large, also in internati onal perspecti ve. It makes a signifi cant contributi on to the economy, about 7% of GDP.
Regarding the high degree of concentrati on: the four largest banks in the Neth-erlands have a combined share of 80% of total banking assets. They play an important role in providing payment services to other fi nancial insti tuti ons and consumers.
About 95% of Dutch consumers have their savings in deposits at one of the four largest banks. These banks have a similar share in the mortgage market.
The Dutch banking industry is internati onally oriented, which fi ts into the open, export-oriented, Dutch economy.
The global crisis makes structural reforms of the banking sector imperati ve so as to ensure greater resilience of the fi nancial sector, limit the systemic risks, bett er protect consumers and reduce moral hazard. The Dutch banking market is emerging solidly from the conti nued period of global economic turbulence. The stress test results for the major Dutch banks underline the strong capital positi on Dutch banking currently enjoys.
The awareness of its importance in the economy and society is primarily the responsibility of the fi nancial sector itself. In that perspecti ve, the implementa-ti on of the self regulatory Banking Code in the Netherlands throughout 2010 was the cornerstone of the Dutch Banking Associati on’s (NVB) restoring trust theme, in which the clients’ needs were to be placed central to banking busi-ness in the Netherlands.
Nevertheless, banks have been in the spotlight of regulators, politi cians, the press and the general public ever since the beginning of the crisis. Proposals were made by the regulatory authoriti es to increase capital, liquidity and risk requirements. What is more, a bank tax has been introduced by the Dutch government.
Dutch banks have spent considerable eff ort in preparing for these changes in the regulatory environment.
63
The Dutch banking sector aims to remain competi ti ve at nati onal, European and global level, thus ensuring the health of the nati onal and European econ-omy. Whilst Dutch banks have returned to the ‘basics of banking’ focussing in parti cular on taking deposits and granti ng loans, the Dutch banking sec-tor has benefi ted from ever increasing diversity and external investment with a number of well known European banks expanding their operati ons in the Netherlands over the period.
Whilst the Dutch banking market is emerging in relati vely good shape follow-ing an extended period of turmoil, it will, as will other European markets, have to create capacity to absorb the tremendous amount of regulatory change. The fi nancial crisis led to a range of initi ati ves to regulate the fi nancial sector further, not only at nati onal level, but also at EU and internati onal. Examples of regulati on are fi nancial supervision, remunerati on, capital requirements and risk management.
That change, coupled with the uncertainti es produced by fi nancial reform in the US, specifi cally for the larger banks which have operati ons in exposure to US markets, imply tumultuous operati ng conditi ons where legal certainty in the regulatory environment will be at a premium.
It is clear that all of these changes create an enti rely new framework for banks to conduct their business. It is also clear that these changes will have a mate-rial impact on banks’ balance sheets and profi tability.
The policymakers will need to strike a delicate balance between their insti nc-ti ve reacti on in ti mes of stress to regulate and control, on the one hand; and on the other, the need to preserve the fi nancial sector’s ability to serve the economy and society. It is up to the Dutch banks to communicate and explain at all levels the important role banks play in society and the economy. With this in mind, the Dutch Banking Associati on (NVB) will conti nue to fi ll the criti -cally important space between the banking and politi cal worlds in the Nether-lands, Europe, and United States in the coming months and years.
With the Banking Code, the Dutch banks underlined their responsibility in restoring trust and fi nancial stability. And restoring trust will be their main mission and responsibility for the future; this means working further on de-creasing risk, strengthening the liquidity positi on, and a stronger relati onship with clients.
Contributor: Koen Holdtgrefe - [email protected]

64
CHAPTER 5: NATIONAL BANKING SECTOR DESCRIPTIONS
13. POLAND
Poland has the largest banking industry out of the countries that comprised the most recent wave of the EU enlargement. Growing economy, with rising credit demand, makes Poland a favourable desti nati on for investment in the banking sector. It has a competi ti ve landscape, focused on domesti c business, and playing an important role in fi nancing private households, SMEs, big infra-structure projects, and project fi nancing.
In 2011, the banking landscape in Poland was characterised by 67 commercial banks and a branch network of 574 cooperati ve banks. The overall number of inhabitants per bank branch stood at 2,821. Polish banking sector is dominat-ed by foreign-owned insti tuti ons: foreign owners hold majority stakes in most commercial banks, totalling 70% of the sector’s assets. Cooperati ve banks are members of two associati ng banks; despite the large number of cooperati ve banks, their market share is under 6% of total assets of the sector.
The Polish banking sector’s assets reached the value of EUR 309,803 million in 2011. Banks’ deposit structure is dominated by household deposits, while corporate deposits represent about 29% as a share of all non-fi nancial sector deposits.
In Poland, there is a high demand for bank loans. The bulk of credit was granted to households: 56% of total loans, of which 59% comprised lending for house purchase. Loans to non-fi nancial corporati ons represented 26%. In recent years, loan-to-deposit rati o was quite stable, at around 112%.
Polish banks register a high level of profi tability: in 2011, return on equity stood at 15.4% return on assets at 1.3%.
Low penetrati on of banking services makes Poland an att racti ve desti nati on to capture the market with standard or customised products depending on the needs of Poland’s citi zens. Strong regulatory environment creates a level play-ing fi eld and equal opportuniti es for all market players.

65
Along with the rest of the economy, and owing to strict supervision, the Polish banking system is showing resilience and has avoided serious prob-lems during fi nancial crisis. The Polish Financial Supervision Authority (Komisja Nadzoru Finansowego, KNF) is a public administrati on body re-sponsible for state supervision of the Polish fi nancial market. The Authority includes seven Members: the Chairman of the KNF, two Vice-Chairpersons and the representati ves of the Minister of Finance, the Minister of Labour and Social Policy, the President of the Nati onal Bank of Poland, and the Pres-ident of the Republic of Poland.
Polish banks strongly support the improvements of the stability and govern-ance of the European fi nancial sector. One of the main objecti ves is imple-mentati on of new capital requirements for the banking sector, parti cularly strengthening the economic potenti al of banks, as well as increasing harmo-nisati on of regulati on and supervision throughout Europe in order to ensure a level-playing fi eld, and improve functi oning of the market economy.
It must be stressed that the specifi c characteristi cs of Central and Eastern European economies should be taken into account when implementi ng any EU fi nancial services’ legislati on, to ensure that the investment climate is not harmed, and that the region can conti nue to be an area of signifi cant growth within the EU. In parti cular, there is a concern that Basel III / CRD IV criteria would have a more deeply negati ve impact on Central and Eastern Europe than elsewhere in Europe.
While being exposed to the global downturn, regional uncertainti es and de-clining asset quality, the Polish banking sector may sti ll be considered as a promising growth market. Demand for credit remains remarkably strong; and most Polish banks entered the fi nancial crisis with relati vely healthy fundamentals.
Contributor: Katarzyna Pawlik - [email protected]
66
CHAPTER 5: NATIONAL BANKING SECTOR DESCRIPTIONS
14. PORTUGAL
The Portuguese banking system consists of 155 credit insti tuti ons, of which 59 are banks, 91 are mutual agricultural credit banks and fi ve are savings banks. At the end of 2011, the aggregate assets of the whole system amounted to € 513 billion, corresponding to 300.5% of Portugal’s GDP (in nominal terms) while the industry employed 55,485 people. The fi nancial intermediati on sector contrib-utes to approximately 6% of nati onal GDP.
At the end of 2011, loans and advances to customers represented more than half of the sector’s aggregate balance sheet (55.5%), followed by fi nancial investments which accounted for over 20% of the total. This refl ects the im-portance of the banking sector to the nati onal economy, as borrowing is the dominant source of fi nance for the vast majority of Portuguese businesses. It is also essenti al and decisive in enabling households to purchase a home or consumer goods.
Deposits from customers are the main source of funding for Portuguese banks, representi ng around 41.5% of the sector’s total balance sheet in 2011, fol-lowed by deposits from central banks and other credit insti tuti ons (approxi-mately 26.4%). Debt securiti es issued, which includes subordinated liabiliti es, is the third source of funding reaching around 14% of the total.
A combinati on of a solid deposit base and an intense lending acti vity shows that Portuguese banks essenti ally follow a traditi onal fi nancial intermediati on model. As a result, net interest income is the principal source of profi t and represented 54.4% of the annual operati ng income in 2011. Nonetheless, cus-tomer services and market acti viti es are almost as important, with parti cular emphasis on fees and commissions which accounted for 28.6% of the annual operati ng income.
The Portuguese banking system showed great resilience to the fi nancial crisis, in that no fi nancial insti tuti ons had to be bailed out by the authoriti es. No funds from the aid package that the Portuguese Government had made avail-able to the fi nancial system had been used for recapitalisati on by the end of 2011. However, due to the stricter rules imposed by Banco de Portugal under the current Economic Adjustment Programme for Portugal, and by the EBA, during the fi rst semester of 2012 two banks issued € 4.500 million in hybrid instruments which were fully subscribed by the Portuguese State.
67
The stricter capital requirements imposed on to Portuguese banks by Banco de Portugal include fulfi lling a core Tier 1 rati o of 9% and 10% by the end of 2011 and 2012, respecti vely. Additi onally, the eight largest banking groups were assessed in 2011 under a Special Inspecti ons Programme that aimed at evaluati ng the suffi ciency of the impairments registered for the loan port-folios, as well as validati ng the data that supports the calculati on of their solvency positi on. These banks were also required to reduce their Loan-to-Deposit Rati o to 120% by 2014.
At the end of 2011, Portuguese banks showed an aggregated solvency rati o of 10.5% and a core Tier 1 rati o of 9.4%, which demonstrates the eff orts to att ain the required level of the highest quality capital. Moreover, some fi nancial insti tuti ons used guarantees provided by the Portuguese Govern-ment when issuing debt and chose to off er the Government as guarantor of the debt in the event of default. Important to noti ce that there has been no default on any of these debts.
The branch network of Portuguese banks has grown in recent years and totalled 6,087 branches at the end of 2011. The number of branches has grown faster than the Portuguese populati on, leading to a signifi cant im-provement in the number of inhabitants per branch, thereby resulti ng in greater proximity and bett er service for customers. Concretely, while there was one branch for every 1,849 inhabitants in 2007, there was one for every 1,750 in 2011.
In spite of the commitment to augmenti ng their branch networks, Portu-guese banks have also been trying to open alternati ve distributi on channels, as demonstrated by the number of external promoters for att racti ng bank-ing business. At the end of 2011, the Portuguese Banking Associati on (APB) member insti tuti ons had 44,715 external promoters, around 26.8% of which were estate agents and 10% insurance agents.
Portugal’s vast network of ATMs and the wide range of functi ons that it pro-vides contribute to a bett er, faster and more diversifi ed range of banking services for customers. It also makes the banking system more effi cient, as it reduces the need for the branch network to expand and to increase the size of its workforce by diverti ng outside a large number of simple, low-value banking operati ons.
68
CHAPTER 5: NATIONAL BANKING SECTOR DESCRIPTIONS
14. PORTUGAL
Internati onalisati on is an important opti on for Portuguese banks to expand their business and improve their performance. Internati onal acti vity makes an important contributi on to a number of consolidated performance variables, especially in terms of income. For instance, of the eight largest banking groups in 2011, foreign acti vity contributed to around 30% of the total consolidated net interest income. In the same year, net assets in internati onal acti vity ac-counted for 17.2% of the total consolidated assets. Regarding gross loans and advances to customers and deposits from customers abroad, these represent-ed 15.3% and 18.4% of the corresponding consolidated fi gures, respecti vely.
Factors that off er some kind of competi ti ve advantage are parti cularly impor-tant in the choice of geographical areas for expansion on the part of Portu-guese banks. The cultural and linguisti c ti es that Brazil, Timor, Angola and Ma-cao have with Portugal place them among the preferred desti nati ons. There are also countries that traditi onally have large Portuguese immigrant commu-niti es, such as France, Luxembourg and Switzerland. There is also a preference for countries with parti cularly developed fi nancial systems, such as the United States and the United Kingdom. Finally, Spain is also a favoured market due to its proximity and the intense reciprocal business acti vity. The most important business areas in internati onal acti vity are retail banking, investment banking, venture capital and asset management.
Contributors: Carolina Mota - [email protected], Vera Flores - vera.fl [email protected]

69
15. SWEDEN
The Swedish fi nancial market
The economic role of the fi nancial sector
Effi cient and reliable systems for saving, fi nancing, mediati ng payments, and risk management are of fundamental importance for Sweden’s economic prosperity. These systems are operated by banks and other credit insti tu-ti ons, insurance companies, securiti es companies and other companies in the fi nancial sector. The fi nancial sector effi ciently channels savings in so-ciety to investment and consumpti on, such as household needs, to smooth out the consumpti on of various life stages and the need for companies to fi nance investment.
In 2010, the fi nancial industry accounted for 4.3% of the total output in Swe-den, expressed as its GDP. Around 85,000 people, representi ng about 2% of the total workforce, work in the fi nancial industry. This can be compared with the manufacturing industry that employs 14% of the workforce and the hotel and restaurant sector that employs 3%.
Types of fi nancial enterprise
The fi nancial companies’ overall balance sheet in 2010 was SEK 14,940 bil-lion. The three largest groups of companies on the Swedish fi nancial market, measured in total assets, are banks, mortgage insti tuti ons and insurance companies. Banks’ share of the total assets of the fi nancial market was 39% at the end of 2010. In additi on to the above menti oned companies, there are also private equity companies. Private equity companies mediate risk capital by investi ng and taking a part in the ownership of companies.
Market changes
The fi nancial sector is experiencing a signifi cant change in its structure. Established companies have broadened the scope of their business, while many new companies, both Swedish and foreign, have entered the market. One important change has been the industry slip between banking and in-surance.
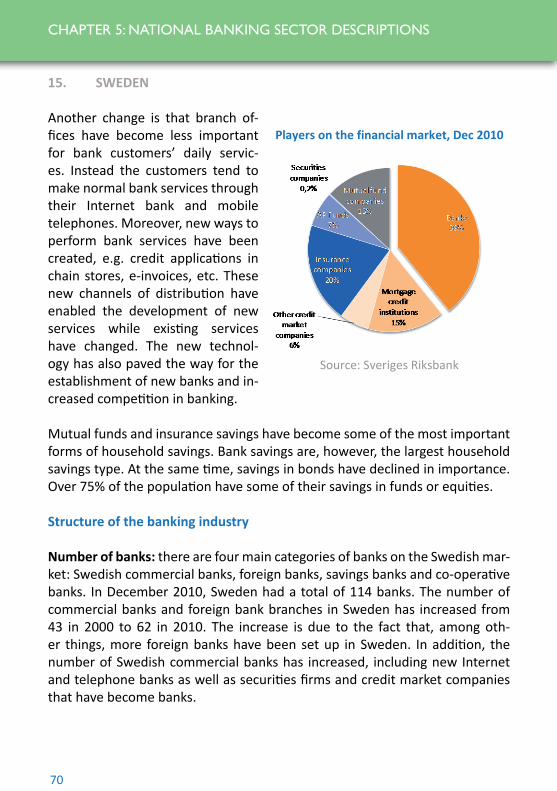
70
CHAPTER 5: NATIONAL BANKING SECTOR DESCRIPTIONS
15. SWEDEN
Another change is that branch of-fi ces have become less important for bank customers’ daily servic-es. Instead the customers tend to make normal bank services through their Internet bank and mobiletelephones. Moreover, new ways to perform bank services have been created, e.g. credit applicati ons in chain stores, e-invoices, etc. These new channels of distributi on have enabled the development of new services while existi ng services have changed. The new technol-ogy has also paved the way for the establishment of new banks and in-creased competi ti on in banking.
Mutual funds and insurance savings have become some of the most important forms of household savings. Bank savings are, however, the largest household savings type. At the same ti me, savings in bonds have declined in importance. Over 75% of the populati on have some of their savings in funds or equiti es.
Structure of the banking industry
Number of banks: there are four main categories of banks on the Swedish mar-ket: Swedish commercial banks, foreign banks, savings banks and co-operati ve banks. In December 2010, Sweden had a total of 114 banks. The number of commercial banks and foreign bank branches in Sweden has increased from 43 in 2000 to 62 in 2010. The increase is due to the fact that, among oth-er things, more foreign banks have been set up in Sweden. In additi on, the number of Swedish commercial banks has increased, including new Internet and telephone banks as well as securiti es fi rms and credit market companies that have become banks.
Players on the financial market, Dec 2010
Source: Sveriges Riksbank
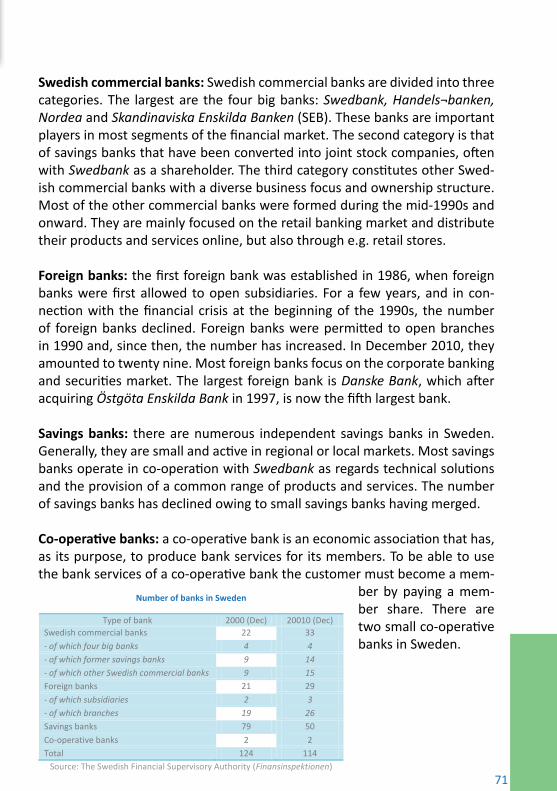
71
Swedish commercial banks: Swedish commercial banks are divided into three categories. The largest are the four big banks: Swedbank, Handels¬banken, Nordea and Skandinaviska Enskilda Banken (SEB). These banks are important players in most segments of the fi nancial market. The second category is that of savings banks that have been converted into joint stock companies, oft en with Swedbank as a shareholder. The third category consti tutes other Swed-ish commercial banks with a diverse business focus and ownership structure. Most of the other commercial banks were formed during the mid-1990s and onward. They are mainly focused on the retail banking market and distribute their products and services online, but also through e.g. retail stores.
Foreign banks: the fi rst foreign bank was established in 1986, when foreign banks were fi rst allowed to open subsidiaries. For a few years, and in con-necti on with the fi nancial crisis at the beginning of the 1990s, the number of foreign banks declined. Foreign banks were permitt ed to open branches in 1990 and, since then, the number has increased. In December 2010, they amounted to twenty nine. Most foreign banks focus on the corporate banking and securiti es market. The largest foreign bank is Danske Bank, which aft er acquiring Östgöta Enskilda Bank in 1997, is now the fi ft h largest bank.
Savings banks: there are numerous independent savings banks in Sweden. Generally, they are small and acti ve in regional or local markets. Most savings banks operate in co-operati on with Swedbank as regards technical soluti ons and the provision of a common range of products and services. The number of savings banks has declined owing to small savings banks having merged.
Co-operati ve banks: a co-operati ve bank is an economic associati on that has, as its purpose, to produce bank services for its members. To be able to use the bank services of a co-operati ve bank the customer must become a mem-
ber by paying a mem-ber share. There are two small co-operati ve banks in Sweden.
Number of banks in Sweden
Type of bank 2000 (Dec) 20010 (Dec) Swedish commercial banks 22 33 - of which four big banks 4 4 - of which former savings banks 9 14 - of which other Swedish commercial banks 9 15 Foreign banks 21 29 - of which subsidiaries 2 3 - of which branches 19 26 Savings banks 79 50 Co-operative banks 2 2 Total 124 114
Source: The Swedish Financial Supervisory Authority (Finansinspektionen)
72
CHAPTER 5: NATIONAL BANKING SECTOR DESCRIPTIONS
15. SWEDEN
The Bank’s Role
Deposits and lending: banks’ core business is to accept deposits and provide credit. In December 2010, the banks’ deposits from the public amounted to SEK 2,403 billion. The bulk of these deposits, some 45%, come from Swedish households. Swedish companies account for 27% of the deposits and foreign public for 18 %.
Previously, only banks were allowed to receive deposits from the public, but since 1 July 2004, credit market insti tuti ons are also allowed to receive de-posits. From 2008, all credit insti tuti ons that are permitt ed to accept deposits in accounts are covered by the deposit insurance. In additi on, the so-called deposit companies may, with some restricti ons, receive deposits. However, de-posits in deposit companies are not covered by the deposit insurance.
Lending to the public in Sweden takes place mainly through banks and mort-gage insti tuti ons. Banks provide loans with diff erent types of security and also smaller loans without collateral. Banks, like mortgage insti tuti ons, also provide loans secured on homes and other buildings and property. Unlike mortgage insti tuti ons, in additi on to the fi rst mortgage, banks can also provide a second mortgage. Lending to the public from banks amounted to SEK 2,874 billion in December 2010. 37% of lending to the public goes to Swedish businesses, while households and foreign borrowers account for 28% and 30%, respec-ti vely.
Interest rates: the interest rates that banks set for their deposits and credits are highly dependent on the interest rates prevailing on the money market. Other factors aff ecti ng interest rates include the borrower’s credit-worthiness, the risk in the undertaking, the banks’ fi nancing costs, the competi ti on among credit insti tuti ons, and the competi ti on between diff erent savings and loan forms. The banks’ average deposit and lending rates have shown a clear down-ward trend since the early 1990s. In recent years, the interest rates have varied but are sti ll generally lower than in the 1990s.
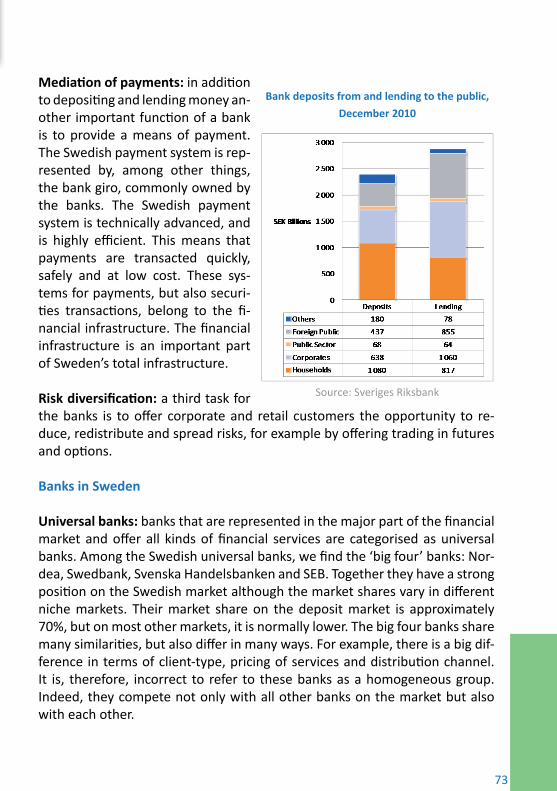
73
Mediati on of payments: in additi on to depositi ng and lending money an-other important functi on of a bank is to provide a means of payment. The Swedish payment system is rep-resented by, among other things, the bank giro, commonly owned by the banks. The Swedish payment system is technically advanced, and is highly effi cient. This means that payments are transacted quickly, safely and at low cost. These sys-tems for payments, but also securi-ti es transacti ons, belong to the fi -nancial infrastructure. The fi nancial infrastructure is an important part of Sweden’s total infrastructure.
Risk diversifi cati on: a third task for the banks is to off er corporate and retail customers the opportunity to re-duce, redistribute and spread risks, for example by off ering trading in futures and opti ons.
Banks in Sweden
Universal banks: banks that are represented in the major part of the fi nancial market and off er all kinds of fi nancial services are categorised as universal banks. Among the Swedish universal banks, we fi nd the ‘big four’ banks: Nor-dea, Swedbank, Svenska Handelsbanken and SEB. Together they have a strong positi on on the Swedish market although the market shares vary in diff erent niche markets. Their market share on the deposit market is approximately 70%, but on most other markets, it is normally lower. The big four banks share many similariti es, but also diff er in many ways. For example, there is a big dif-ference in terms of client-type, pricing of services and distributi on channel. It is, therefore, incorrect to refer to these banks as a homogeneous group. Indeed, they compete not only with all other banks on the market but also with each other.
Bank deposits from and lending to the public, December 2010
Source: Sveriges Riksbank

74
CHAPTER 5: NATIONAL BANKING SECTOR DESCRIPTIONS
15. SWEDEN
On the Swedish market, Svenska Handelsbanken and Swedbank have the most branch offi ces, 461 and 340, respecti vely. Many of the banks also off er their services in co-operati on with other players, such as supermarkets and petrol stati ons. Most of the services off ered by banks´ branch offi ces are also off ered through their internet channels. Branch offi ces have, therefore, to a large ex-tent shift ed their focus to providing advisory services and selling the banks´ products and services.
Other banks: over the past ten years, other commercial banks and foreign bank branches have gained market shares in Sweden. Banks, such as Skandi-aBanken, Länsförsäkringar Bank and Ikano Banken, established telephone and internet banks in the mid-1990s and ICA Banken in the early 2000s. Although they have gradually expanded their range of services, they are sti ll mainly fo-cused on retail banking. Several of the newest banks started as securiti es fi rms and are primarily focused on trading and asset management, such as the banks Avanza and Nordnet.
The presence of foreign banks in Sweden has strengthened, mainly due to Dan-ske Bank, with some 50 branch offi ces. In certain segments, such as investment banking, foreign banks have large market shares.
Savings banks: the independ-ent savings banks operate on the local or regional markets. The savings banks have a market share of 10% in Swe-den, but an individual savings bank’s local market share can be much higher. At the end of 2010, the savings banks had 182 branch offi ces, represent-ing around 10% of the 1,883 branch offi ces in Sweden.
Contributor: Christi an Nilsson - Christi [email protected]
Deposits from Swedish households, share of the total. December 2010
Swedbank 23%
Handelsbanken 18%
Nordea 16%
SEB 12%
Oth. commer. banks 18%
Savings banks 9%
Foreign bank branches 3%
Other institutions 1%
Source: Statistics Sweden (SCB)

75
16. SWITZERLAND
The Swiss fi nancial centre, with banking as the leading sector, is of major internati onal importance and among the global market leaders in many ar-eas. Banks are hugely important to the Swiss economy in many respects. As employers, they off er a host of skilled jobs paying above-average salaries; as taxpayers, they provide a considerable porti on of public-sector funding; and, fi nally, as drivers of value added and centres of innovati on they generate mo-mentum for the enti re economy.
Alongside the generous supply of credit, which experienced no restricti ons during the last fi nancial crisis, Switzerland, as a business locati on, benefi ts from internati onally favourable fi nancing conditi ons. This is owing not only to generally low interest rates, but also to banks’ low interest margins.
Value added. Including insurers and other fi nancial service providers, the fi -nancial sector as a whole accounts for 11.5% (CHF 61.1 billion) of value added in Switzerland. The banking sector alone, therefore, accounts for CHF 32.4 bil-lion of value added, corresponding to 6.1% of Switzerland‘s gross value added.
During the global fi nancial crisis in 2008 and 2009, the Swiss banking sector‘s real value added fell by 10%. In a ti me of rapid global economic change, more stringent regulatory conditi ons and protecti onist tendencies have amplifi ed the challenges facing banks on a broad front, while rising risk premiums and falling margins have hampered their earning power. These adverse develop-ments came about aft er the crisis broke out in 2007 and caused value added in the banking sector to decline by an average of 0.3 percentage points per year from 2000 to 2011. However, the benefi t banks create for other eco-nomic sectors remains high, since a thriving banking sector is an important consumer of goods and services. This interconnecti vity means that for every 100 bank employees, another 115 jobs are created in other sectors by indirect eff ects. Alongside the CHF 32.4 billion generated by the Swiss banking sector, the indirect eff ects of this interconnecti vity contribute an additi onal CHF 17 billion of value added, leading to a total 9.3% share of Switzerland’s overall economy.
76
CHAPTER 5: NATIONAL BANKING SECTOR DESCRIPTIONS
16. SWITZERLAND
Employment. More than 195,000 people or 5.7% of the enti re Swiss workforce are employed in the fi nancial sector. Of these:
o 108,100 work for banks and securiti es dealers; o 34,700 work for other fi nancial services providers (e.g. independent asset managers, etc.); and o 53,034 work for insurance companies.
Swiss banks also employ around 106,760 staff abroad (branches and subsidiar-ies). In 2011 banks trained over 3,800 commercial apprenti ces or more than 12% of all commercial apprenti ces in Switzerland.
Taxes. The fi nancial centre (including staff and shareholders) pays an esti mated CHF 14-18 billion each year in direct and indirect taxes. This equates to 12-15% of all federal, cantonal and municipal tax receipts. In 2011 CHF 11.2 billion17 or nearly 10% of all tax receipts could be att ributed to the banking sector.
Number of banks. As of year-end 2011 there were 312 banks, 3,382 branches and 5,555 ATM in Switzerland. In additi on, banks in Switzerland dispose of 269 branches abroad. The aggregate balance sheet of all the banks in Switzerland grew by 2.9% to CHF 2,793 billion in 2011 (approx. € 2,318 billion). This result was due, in parti cular, to the marked increase in cash (+144%) and renewed rise in mortgage receivables (+5.3%). The total credit made available by the banks rose in 2011 by 5.1%, with credit take-up increasing by 4.3% to CHF 937 billion (approx. € 778 billion).
17 Taxes on earnings and capital, income tax and taxes on dividends are direct taxes; withholding tax, stamp duty and VAT are indirect taxes. Exact fi gures for the insurance industry are not available and have therefore been esti mated.
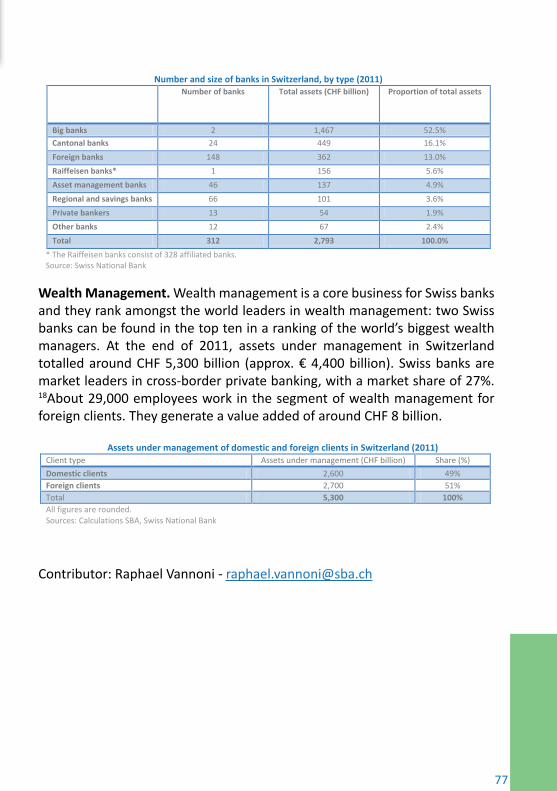
77
Wealth Management. Wealth management is a core business for Swiss banks and they rank amongst the world leaders in wealth management: two Swiss banks can be found in the top ten in a ranking of the world’s biggest wealth managers. At the end of 2011, assets under management in Switzerland totalled around CHF 5,300 billion (approx. € 4,400 billion). Swiss banks are market leaders in cross-border private banking, with a market share of 27%. 18About 29,000 employees work in the segment of wealth management for foreign clients. They generate a value added of around CHF 8 billion.
Contributor: Raphael Vannoni - [email protected]
Number and size of banks in Switzerland, by type (2011) Number of banks Total assets (CHF billion) Proportion of total assets
Big banks 2 1,467 52.5% Cantonal banks 24 449 16.1% Foreign banks 148 362 13.0% Raiffeisen banks* 1 156 5.6% Asset management banks 46 137 4.9% Regional and savings banks 66 101 3.6% Private bankers 13 54 1.9% Other banks 12 67 2.4% Total 312 2,793 100.0%
* The Raiffeisen banks consist of 328 affiliated banks. Source: Swiss National Bank
Assets under management of domestic and foreign clients in Switzerland (2011) Client type Assets under management (CHF billion) Share (%) Domestic clients 2,600 49% Foreign clients 2,700 51% Total 5,300 100% All figures are rounded. Sources: Calculations SBA, Swiss National Bank
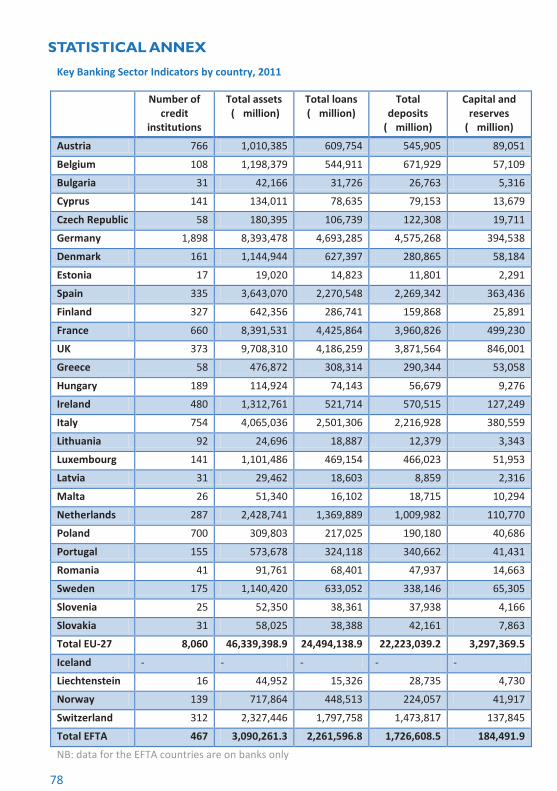
78
CHAPTER 5: NATIONAL BANKING SECTOR DESCRIPTIONSSTATISTICAL ANNEX
1
Key Banking Sector Indicators by country, 2011
Number of credit
institutions
Total assets (€ million)
Total loans (€ million)
Total deposits
(€ million)
Capital and reserves
(€ million)
Austria 766 1,010,385 609,754 545,905 89,051
Belgium 108 1,198,379 544,911 671,929 57,109
Bulgaria 31 42,166 31,726 26,763 5,316
Cyprus 141 134,011 78,635 79,153 13,679
Czech Republic 58 180,395 106,739 122,308 19,711
Germany 1,898 8,393,478 4,693,285 4,575,268 394,538
Denmark 161 1,144,944 627,397 280,865 58,184
Estonia 17 19,020 14,823 11,801 2,291
Spain 335 3,643,070 2,270,548 2,269,342 363,436
Finland 327 642,356 286,741 159,868 25,891
France 660 8,391,531 4,425,864 3,960,826 499,230
UK 373 9,708,310 4,186,259 3,871,564 846,001
Greece 58 476,872 308,314 290,344 53,058
Hungary 189 114,924 74,143 56,679 9,276
Ireland 480 1,312,761 521,714 570,515 127,249
Italy 754 4,065,036 2,501,306 2,216,928 380,559
Lithuania 92 24,696 18,887 12,379 3,343
Luxembourg 141 1,101,486 469,154 466,023 51,953
Latvia 31 29,462 18,603 8,859 2,316
Malta 26 51,340 16,102 18,715 10,294
Netherlands 287 2,428,741 1,369,889 1,009,982 110,770
Poland 700 309,803 217,025 190,180 40,686
Portugal 155 573,678 324,118 340,662 41,431
Romania 41 91,761 68,401 47,937 14,663
Sweden 175 1,140,420 633,052 338,146 65,305
Slovenia 25 52,350 38,361 37,938 4,166
Slovakia 31 58,025 38,388 42,161 7,863
Total EU-27 8,060 46,339,398.9 24,494,138.9 22,223,039.2 3,297,369.5
Iceland - - - - -
Liechtenstein 16 44,952 15,326 28,735 4,730
Norway 139 717,864 448,513 224,057 41,917
Switzerland 312 2,327,446 1,797,758 1,473,817 137,845
Total EFTA 467 €3,090,261.3 €2,261,596.8 €1,726,608.5 €184,491.9
NB: data for the EFTA countries are on banks only