european bicycle market & industry profile 2010
DESCRIPTION
This document is the third edition of the European Industry & Market Profile, an economic study carried out by COLIBI, the Association of the European Bicycle Industry and COLIPED, the Association of the European Two-Wheeler Parts' & Accessories' Industry.TRANSCRIPT
1
EUROPEAN BICYCLE MARKET
2011 edition
Industry & Market Profile (2010 statistics)
August 2011
2
FOREWORD This document is the third edition of the European Industry & Market Profile, an economic study carried out by COLIBI , the Association of the European Bicycle Industry and COLIPED, the Association of the European Two-Wheeler Parts' & Accessories' Industry. The document is based on figures provided by our member associations and data kindly put at our disposal by non-member countries. It gives an overview of the European bicycle industry’s activities (production and employment), relevant market data (sales) and highlights the economic bicycle activity in the member countries. We wish to extend our sincere thanks to our member associations, the European bicycle manufacturers associations, the Chambers of Commerce and Embassies for their valuable and much appreciated contribution in the compilation of this work. Copyright 2011 COLIBI - COLIPED The information contained in this document may only be reproduced with explicit mention of: Source: COLIBI-COLIPED
COLIBI – COLIPED Boulevard de la Woluwe 46 b16
B – 1200 Brussels Belgium
Tel.: +32 – (0)2 778 64 58 Fax: +32 – (0)2 762 81 71
E-mail: [email protected] [email protected]
Web: www.colibi.com and www.coliped.com
August 2011
3
BACKGROUND
COLIBI is the Association of the European Bicycle Industry; COLIPED is the Association of the European Two-Wheeler Parts' & Accessories' Industry. The aim of the European associations is to promote the common interests of the European bicycle and bicycle parts’ & accessories’ industries. COLIBI and COLIPED are the official spokespartners of the relevant European industry. As such, they keep in regular contact with European policy makers, European bicycle trade and cyclists’ associations, the European standardization body CEN, the industry, mobility experts and the press. COLIBI and COLIPED campaign for:
- the appointment of a European Bicycle Officer within the European Commission. COLIBI & COLIPED launched this idea and presented it to the EC in 2007. Since then, this initiative has been supported by several national and international associations, among them also the ECF and ETRA;
- fair trade and the fight of unfair practices in view of safeguarding the European bicycle industry; - the application of a reduced VAT rate on all bicycle products and services; - a better recognition of the (potential of the) bicycle and cycling in European policies and the
development of a bicycle (cycling) strategy by European policy makers; - the introduction at European level of reliable and comparable statistics related to cycle infrastructure,
costs & benefits of cycle use, traffic accidents, etc.; - a better and easier access to European funding and financial means; - the introduction in the allocation of European funding of effective criteria that serve sustainability; - an increased cycle usage throughout the EU and beyond; - etc…
The European associations fully support the European (EN) safety standards for bicycles. COLIBI & COLIPED have a Liaison status with CEN TC 333 ‘Cycles’ and are member of the Global Alliance for EcoMobility. To promote the European bicycle parts’ & accessories’ industry, COLIPED annually organizes a joint European participation in the Taipei Cycle Show (Taiwan). Initiated in 1993, the joint European booth has known an ever increasing success. In 2011, 28 European bicycle parts’ & accessories’ manufacturers participated in the joint European COLIPED booth, which occupied a total surface of 783 m². Our members are the national bicycle industry associations in 13 different countries: Austria, Belgium, Bulgaria, Denmark, Germany, Great Britain, Finland, France, Hungary, Italy, the Netherlands, Poland and Turkey.
August 2011
4
THE EUROPEAN BICYCLE INDUSTRY 20,000,000 bicycles are sold annually across Europe. This total exceeds that of any other means of mobility (cars, motorcycles etc.). On average, European citizens own more bicycles than any other means of transport. Via their national associations, all major players on the European bicycle market are represented within COLIBI & COLIPED. The bicycle is:
- the most environmentally friendly, energy efficient and sustainable means of mobility; - the cheapest means of mobility (no ownership- motorway or registration taxes, no insurances, no
driving license or parking costs and no high service maintenance costs); - the most healthy and social means of mobility; - the most time-saving and silent mode in urban areas; - the most accessible mode of transport; - simply the best mobility mode in urban areas.
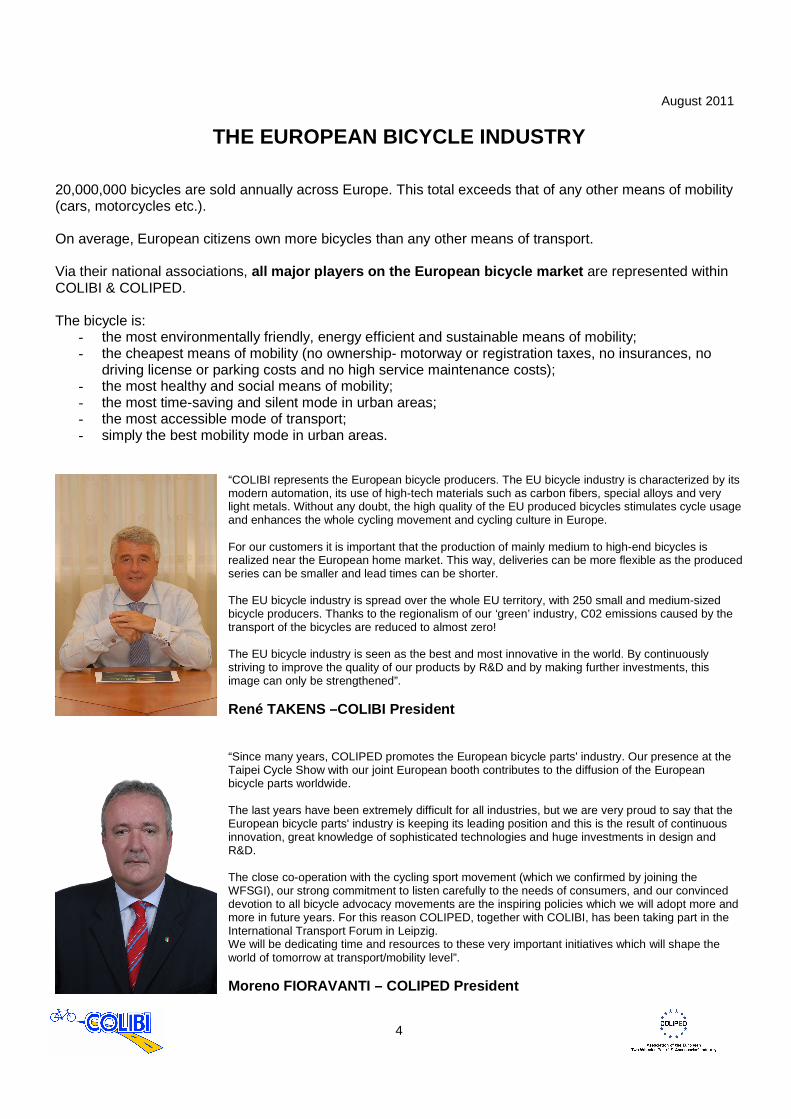
“COLIBI represents the European bicycle producers. The EU bicycle industry is characterized by its modern automation, its use of high-tech materials such as carbon fibers, special alloys and very light metals. Without any doubt, the high quality of the EU produced bicycles stimulates cycle usage and enhances the whole cycling movement and cycling culture in Europe. For our customers it is important that the production of mainly medium to high-end bicycles is realized near the European home market. This way, deliveries can be more flexible as the produced series can be smaller and lead times can be shorter. The EU bicycle industry is spread over the whole EU territory, with 250 small and medium-sized bicycle producers. Thanks to the regionalism of our ‘green’ industry, C02 emissions caused by the transport of the bicycles are reduced to almost zero! The EU bicycle industry is seen as the best and most innovative in the world. By continuously striving to improve the quality of our products by R&D and by making further investments, this image can only be strengthened”. René TAKENS –COLIBI President
“Since many years, COLIPED promotes the European bicycle parts' industry. Our presence at the Taipei Cycle Show with our joint European booth contributes to the diffusion of the European bicycle parts worldwide. The last years have been extremely difficult for all industries, but we are very proud to say that the European bicycle parts' industry is keeping its leading position and this is the result of continuous innovation, great knowledge of sophisticated technologies and huge investments in design and R&D. The close co-operation with the cycling sport movement (which we confirmed by joining the WFSGI), our strong commitment to listen carefully to the needs of consumers, and our convinced devotion to all bicycle advocacy movements are the inspiring policies which we will adopt more and more in future years. For this reason COLIPED, together with COLIBI, has been taking part in the International Transport Forum in Leipzig. We will be dedicating time and resources to these very important initiatives which will shape the world of tomorrow at transport/mobility level”. Moreno FIORAVANTI – COLIPED President
August 2011
5
THE COLIBI & COLIPED MEMBERS
Austria FFÖ Wiedner Hauptstrasse 63 Postfach 337 A – 1045 Wien
Tel. +43 - 1 50 105 4805 Fax +43 - 1 50 105 289
E-mail: [email protected] Web: www.wko.at/fahrzeuge
Belgium AGORIA Diamant Building Bd A. Reyers 80 B – 1030 Brussels
Tel. +32 – (0)2 706 79 69 Fax +32 – (0)2 706 79 76
E-mail: [email protected] Web: www.agoria.be
Bulgaria ABPB Dim. Nestonov Blvd. BL. 120 BG – 1612 Sofia
Tel. +359 - 2 812 70 60 Fax +359 - 2 812 70 61
E-mail: [email protected] Web: www.abpb-bg.com
Denmark FAPIC Foreningen af Producenter og Importører i Cykelbranchen P/a Michael D. Prince Nyhavn 4, 1. DK - 1051 København K
Tel. + 45 - 3333 9010 Fax + 45 - 3377 3300
E-mail: [email protected] Web : www.di.dk
Germany Z.I.V. Königsteiner Strasse 20A D – 65812 Bad Soden/Ts.
Tel. +49 - (0)6196-5077 0 Fax +49 - (0)6196-5077 20
E-mail: [email protected] Web: www.ziv-zweirad.de
Great Britain BAGB 3, The Quadrant GB – Coventry CV1 2DY
Tel. +44-2476-55 38 38 Fax +44-2476-22 83 66
E-mail: [email protected] Web: www.ba-gb.com
Finland Technology Industries of Finland Vehicle Manuf. Branch Group / Bicycle Manufacturers’ Section Etelaranta 10, POB 10 FIN – 00131 Helsinki
Tel. +358-919 231 Fax +358 962 44 62
E-mail: [email protected] Web: www.techind.fi
France CNPC “Tous à Vélo !” Rue J.J. Rousseau 79 F – 92150 Suresnes
Tel. +33-1 46 250 234 Fax +33-1 40 990 620
E-mail: [email protected] Web: www.tousavelo.fr
August 2011
6
Hungary MKKSZ P/a Accell Hunland Kft. 5091 Tószeg HU - Parkoló tér 1.
Tel. +36 - 56 586 505 Fax +36 - 56 586 484
E-mail: [email protected]
Italy ANCMA Via A. Da Recanate 1 I – 20124 Milan
Tel. +39 – 02 677 35 11 Fax +39 – 02 6698 20 72
E-mail: [email protected] Web: www.ancma.it
Poland Polskie Stowarzyszenie Rowerowe Ul. Fabryczna 6 PL - 98-300 Wielun
Tel. +48 – (0)43 843 42 93 Fax +48 – (0)43 843 42 93
E-mail: [email protected] Web: www.polskiestowarzyszenierowerowe.pl
The Netherlands RAI-Vereniging Postbus 74800 NL – 1070 DM Amsterdam
Tel. +31-(0)20-504 49 49 Fax +31-(0)20-504 49 98
E-mail: [email protected] Web: www.raivereniging.nl
Turkey BISED Organize Sanayi Bölgesi 3.kisim Ahmet Tütüncüoðlu Cad. - NO:1 TR - Manisa
Tel. +90-236-213 0045 Fax + 90-236-213 0050
E-mail: [email protected]
August 2011
7
EUROPEAN BICYCLE PRODUCTION

August 2011
8
EUROPEAN BICYCLE PRODUCTION (EU 27) (1,000 units) 2000 – 2010
0
2 000
4 000
6 000
8 000
10 000
12 000
14 000
16 000
2000 2001 2002 2003 2004 2005 2006 2007 2008 2009 2010
14 531
13 009
12 27212 828
13 232 13 218 13 320 13 086 13 246
12 178 12 266
Year 2000 2001 2002 2003 2004 2005 2006 2007 2008 2009 2010
Bicycle Production (x 1,000) 14,531 13,009 12,272 12,828 13,232 13,218 13,320 13,086 13,246 12,178 12,266
Evolution year/year-1 (%) -10.47 -5.67 4.53 3.15 -0.11 0.77 -1.76 1.22 -8.06 0.72
August 2011
9
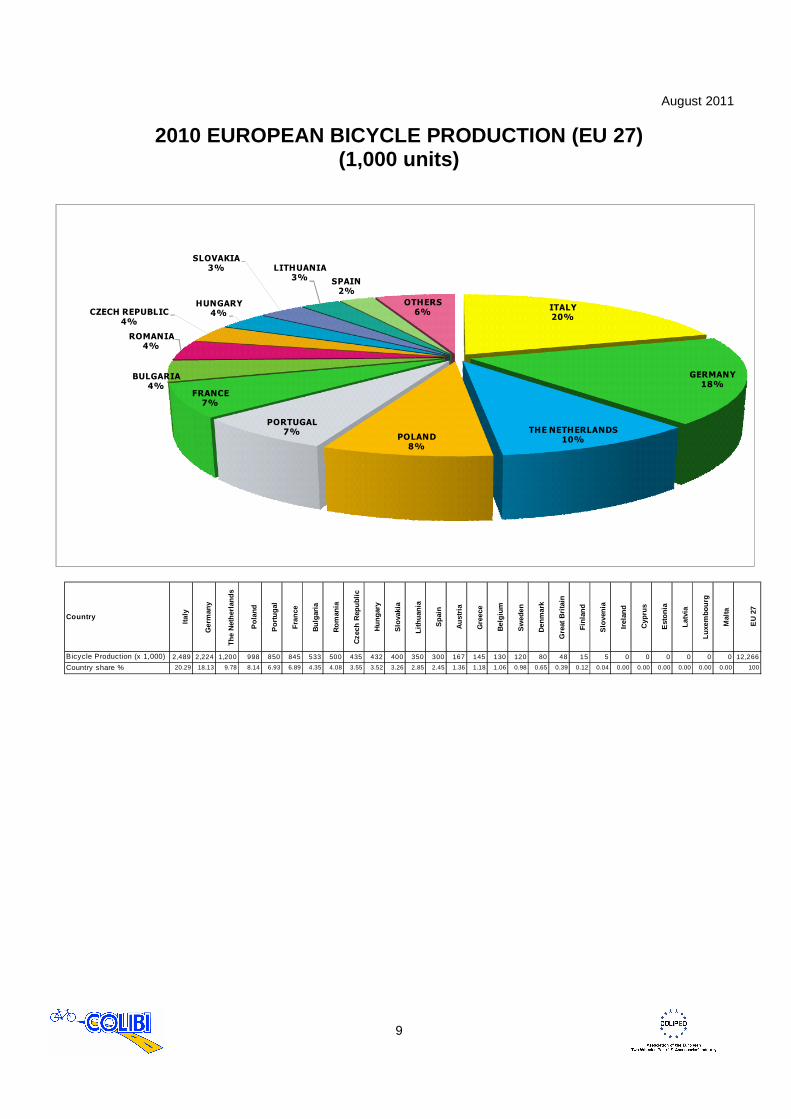
2010 EUROPEAN BICYCLE PRODUCTION (EU 27) (1,000 units)
ITALY
20%
GERMANY
18%
THE NETHERLANDS
10%POLAND
8%
PORTUGAL
7%
FRANCE
7%
BULGARIA
4%
ROMANIA
4%
CZECH REPUBLIC
4%
HUNGARY
4%
SLOVAKIA
3% LITHUANIA
3%SPAIN
2%
OTHERS
6%
Country
Italy
Ger
man
y
The
Net
herl
ands
Pol
and
Por
tuga
l
Fra
nce
Bul
garia
Rom
ania
Cze
ch R
epub
lic
Hun
gary
Slo
vaki
a
Lith
uani
a
Spa
in
Aus
tria
Gre
ece
Bel
gium
Sw
eden
Den
mar
k
Gre
at B
ritai
n
Fin
land
Slo
veni
a
Irel
and
Cyp
rus
Est
onia
Latv
ia
Luxe
mbo
urg
Mal
ta
EU
27
Bicycle Production (x 1,000) 2,489 2,224 1,200 998 850 845 533 500 435 432 400 350 300 167 145 130 120 80 48 15 5 0 0 0 0 0 0 12,266
Country share % 20.29 18.13 9.78 8.14 6.93 6.89 4.35 4.08 3.55 3.52 3.26 2.85 2.45 1.36 1.18 1.06 0.98 0.65 0.39 0.12 0.04 0.00 0.00 0.00 0.00 0.00 0.00 100

August 2011
10
2010 EUROPEAN BICYCLE PRODUCTION (EU 27) COUNTRY RANKING (1,000 units )
0
500
1 000
1 500
2 000
2 5002 489
2 224
1 200
998
850 845
533500
435 432 400
350300
167 145 130 12080
4815 5
0
Country
Italy
Ger
man
y
The
Net
herla
nds
Pol
and
Por
tuga
l
Fra
nce
Bul
gari
a
Rom
ania
Cze
ch R
epub
lic
Hun
gary
Slo
vaki
a
Lith
uani
a
Spa
in
Aus
tria
Gre
ece
Bel
gium
Sw
eden
Den
mar
k
Gre
at B
ritai
n
Fin
land
Slo
veni
a
Irel
and
Cyp
rus
Est
onia
Latv
ia
Luxe
mbo
urg
Mal
ta
EU
27
Bicycle Production (x 1,000) 2,489 2,224 1,200 998 850 845 533 500 435 432 400 350 300 167 145 130 120 80 48 15 5 0 0 0 0 0 0 12,266
Ranking 1 2 3 4 5 6 7 8 9 10 11 12 13 14 15 16 17 18 19 20 21 22
August 2011
11
EUROPEAN BICYCLE PARTS AND ACCESSORIES PRODUCTION
August 2011
12
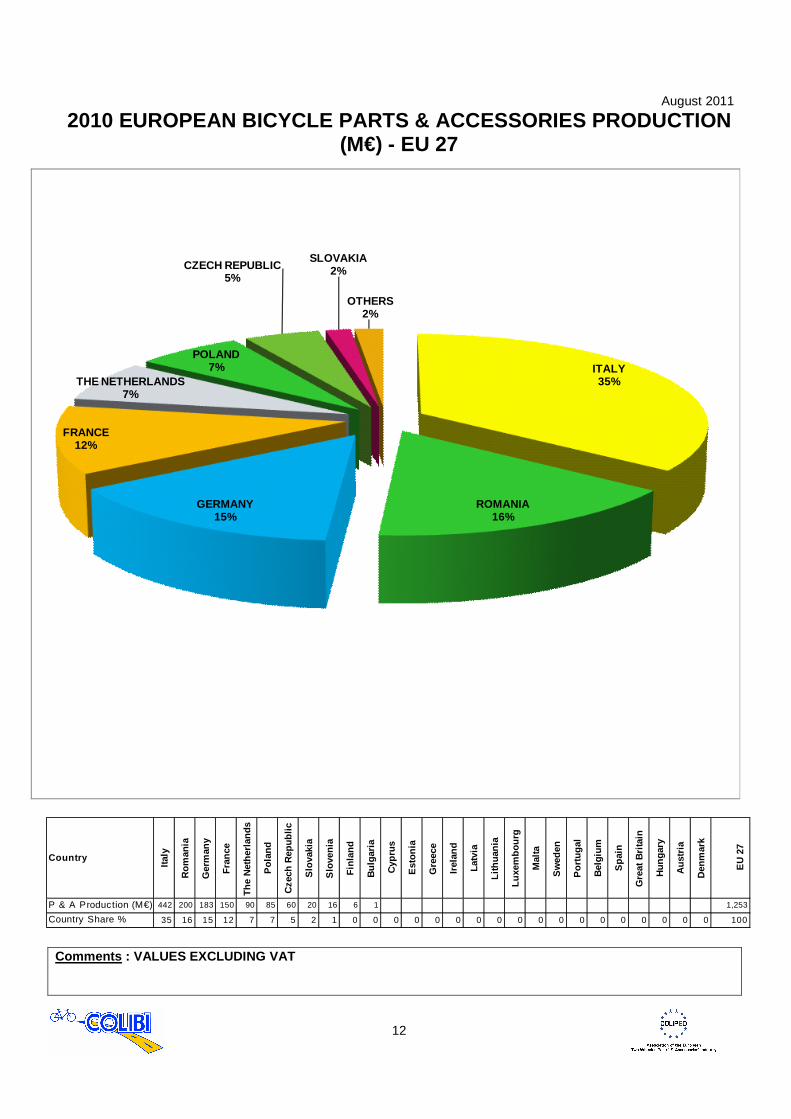
2010 EUROPEAN BICYCLE PARTS & ACCESSORIES PRODUCTIO N (M€) - EU 27
ITALY35%
ROMANIA16%
GERMANY15%
FRANCE12%
THE NETHERLANDS7%
POLAND7%
CZECH REPUBLIC5%
SLOVAKIA2%
OTHERS2%
Country
Italy
Rom
ania
Ger
man
y
Fra
nce
The
Net
herla
nds
Pol
and
Cze
ch R
epub
lic
Slo
vaki
a
Slo
veni
a
Fin
land
Bul
garia
Cyp
rus
Est
onia
Gre
ece
Irel
and
Latv
ia
Lith
uani
a
Luxe
mbo
urg
Mal
ta
Sw
eden
Por
tuga
l
Bel
gium
Spa
in
Gre
at B
ritai
n
Hun
gary
Aus
tria
Den
mar
k
EU
27
P & A Production (M€) 442 200 183 150 90 85 60 20 16 6 1 1,253
Country Share % 35 16 15 12 7 7 5 2 1 0 0 0 0 0 0 0 0 0 0 0 0 0 0 0 0 0 0 100
Comments : VALUES EXCLUDING VAT
August 2011
13
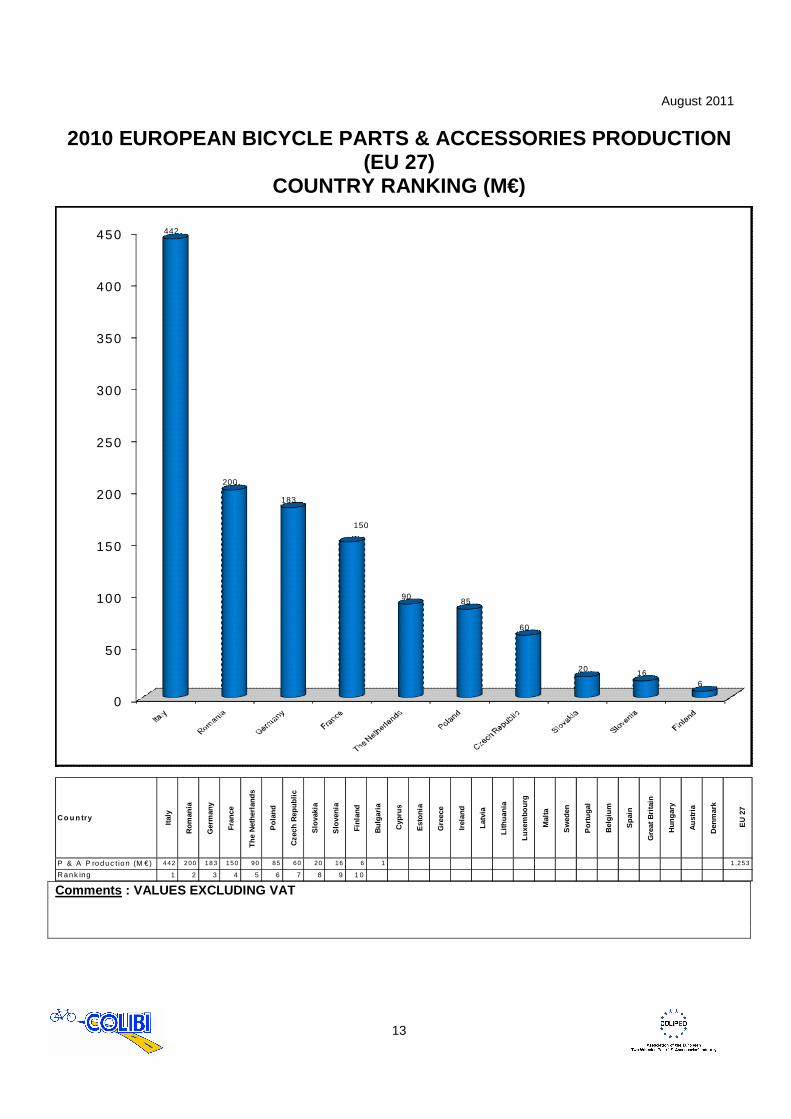
2010 EUROPEAN BICYCLE PARTS & ACCESSORIES PRODUCTIO N (EU 27)
COUNTRY RANKING (M€)
0
50
100
150
200
250
300
350
400
450 442
200
183
150
9085
60
20 166
Co u n try
Italy
Rom
ania
Ger
man
y
Fra
nce
The
Net
herl
ands
Pol
and
Cze
ch R
epub
lic
Slo
vaki
a
Slo
veni
a
Fin
land
Bul
garia
Cyp
rus
Est
onia
Gre
ece
Irel
and
Latv
ia
Lith
uani
a
Luxe
mbo
urg
Mal
ta
Sw
eden
Por
tuga
l
Bel
gium
Spa
in
Gre
at B
ritai
n
Hun
gary
Aus
tria
Den
mar
k
EU
27
P & A P roduc t ion (M €) 4 42 200 18 3 150 90 85 60 20 16 6 1 1 ,253
Rank ing 1 2 3 4 5 6 7 8 9 1 0 Comments : VALUES EXCLUDING VAT
August 2011
14
EUROPEAN BICYCLE SALES
August 2011
15
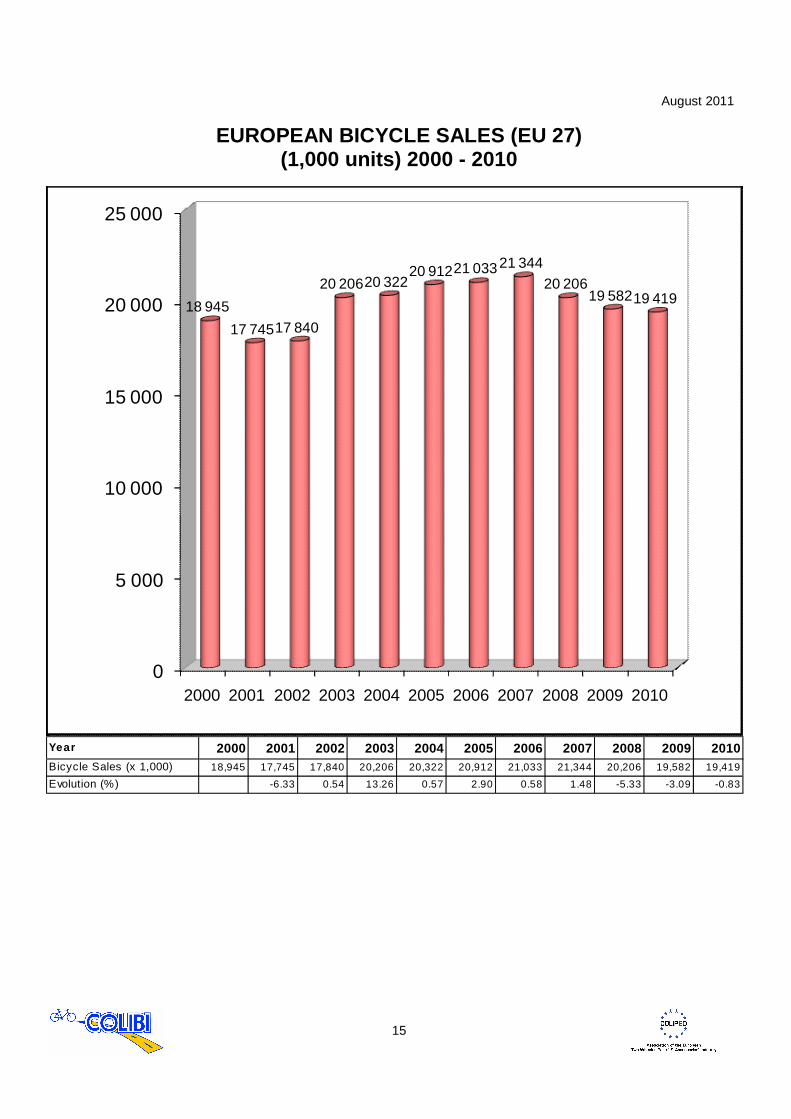
EUROPEAN BICYCLE SALES (EU 27) (1,000 units) 2000 - 2010
0
5 000
10 000
15 000
20 000
25 000
2000 2001 2002 2003 2004 2005 2006 2007 2008 2009 2010
18 945
17 74517 840
20 20620 32220 91221 03321 344
20 20619 58219 419
Year 2000 2001 2002 2003 2004 2005 2006 2007 2008 2009 2010Bicycle Sales (x 1,000) 18,945 17,745 17,840 20,206 20,322 20,912 21,033 21,344 20,206 19,582 19,419
Evolution (%) -6.33 0.54 13.26 0.57 2.90 0.58 1.48 -5.33 -3.09 -0.83
August 2011
16
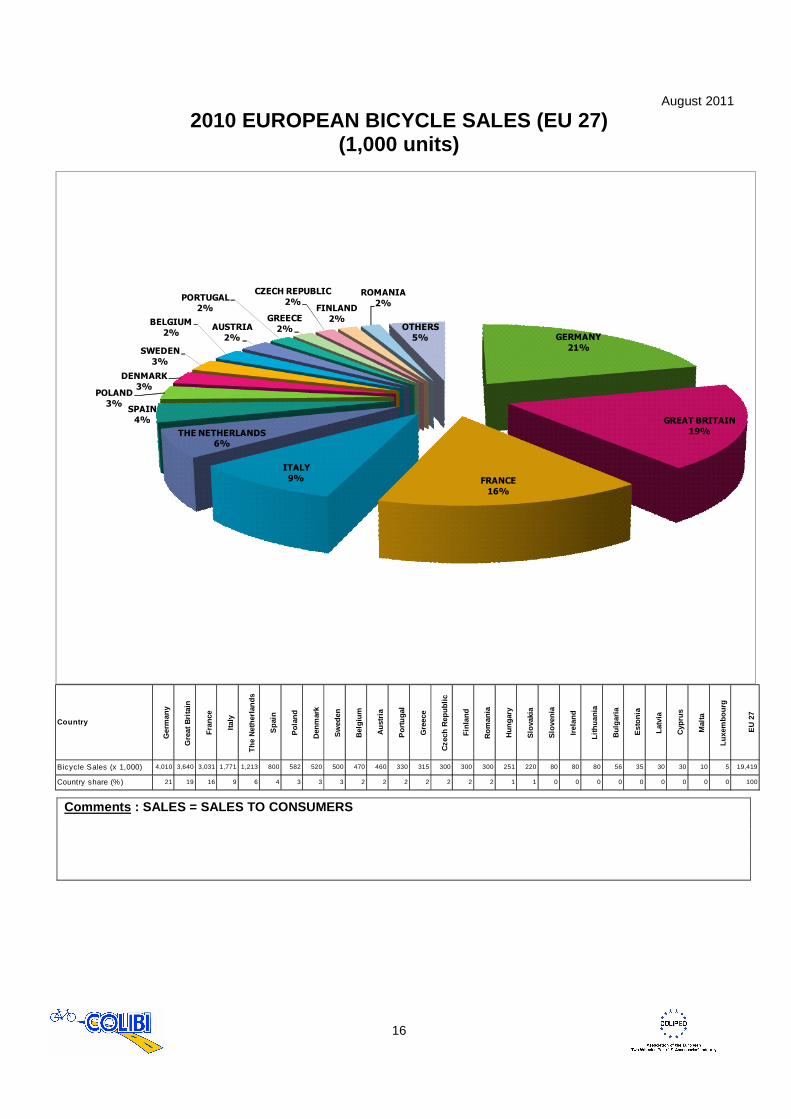
2010 EUROPEAN BICYCLE SALES (EU 27) (1,000 units)
GERMANY
21%
GREAT BRITAIN
19%
FRANCE
16%
ITALY
9%
THE NETHERLANDS
6%
SPAIN
4%
POLAND
3%
DENMARK
3%
SWEDEN
3%
BELGIUM
2%AUSTRIA
2%
PORTUGAL
2%
GREECE
2%
CZECH REPUBLIC
2%FINLAND
2%
ROMANIA
2%
OTHERS
5%
Country
Ger
man
y
Gre
at B
ritai
n
Fra
nce
Italy
The
Net
herla
nds
Spa
in
Pol
and
Den
mar
k
Sw
eden
Bel
gium
Aus
tria
Por
tuga
l
Gre
ece
Cze
ch R
epub
lic
Fin
land
Rom
ania
Hun
gary
Slo
vaki
a
Slo
veni
a
Irel
and
Lith
uani
a
Bul
garia
Est
onia
Latv
ia
Cyp
rus
Mal
ta
Luxe
mbo
urg
EU
27
Bicycle Sales (x 1,000) 4,010 3,640 3,031 1,771 1,213 800 582 520 500 470 460 330 315 300 300 300 251 220 80 80 80 56 35 30 30 10 5 19,419
Country share (%) 21 19 16 9 6 4 3 3 3 2 2 2 2 2 2 2 1 1 0 0 0 0 0 0 0 0 0 100
Comments : SALES = SALES TO CONSUMERS
August 2011
17
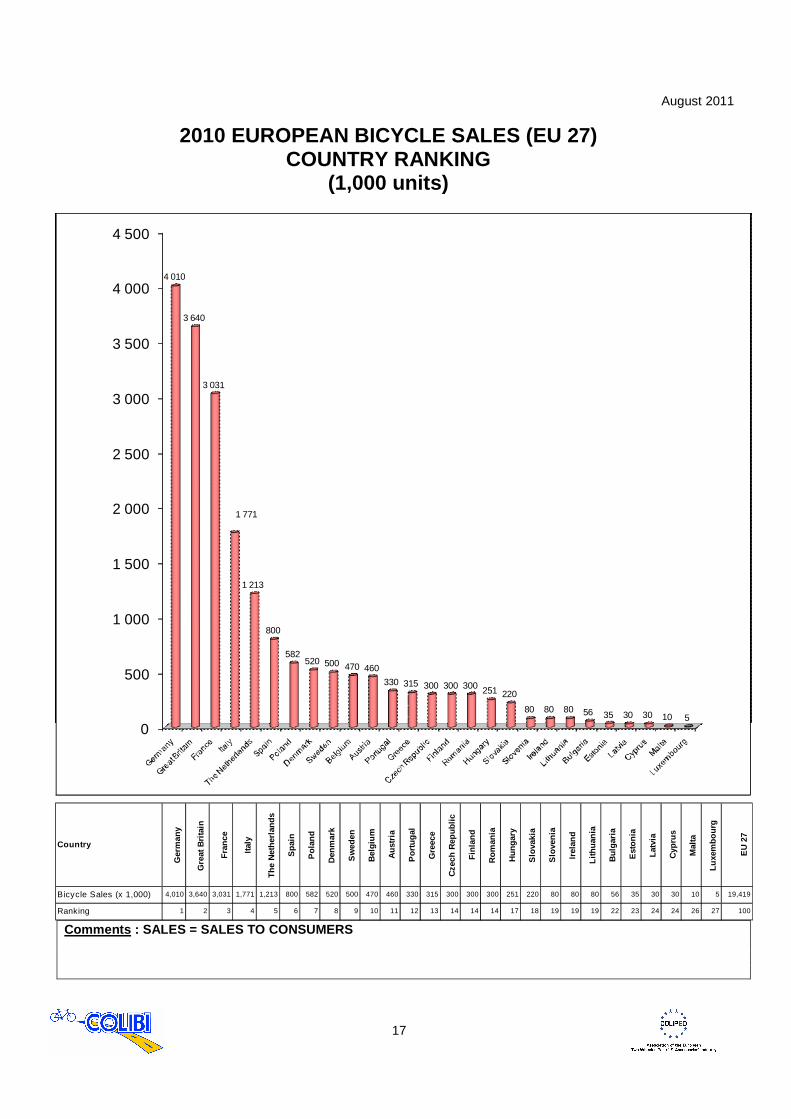
2010 EUROPEAN BICYCLE SALES (EU 27) COUNTRY RANKING
(1,000 units)
0
500
1 000
1 500
2 000
2 500
3 000
3 500
4 000
4 500
4 010
3 640
3 031
1 771
1 213
800
582520 500 470 460
330 315 300 300 300 251 220
80 80 80 56 35 30 30 10 5
Country
Ger
man
y
Gre
at B
ritai
n
Fra
nce
Italy
The
Net
herla
nds
Spa
in
Pol
and
Den
mar
k
Sw
eden
Bel
gium
Aus
tria
Por
tuga
l
Gre
ece
Cze
ch R
epub
lic
Fin
land
Rom
ania
Hun
gary
Slo
vaki
a
Slo
veni
a
Irel
and
Lith
uani
a
Bul
garia
Est
onia
Latv
ia
Cyp
rus
Mal
ta
Luxe
mbo
urg
EU
27
Bicycle Sales (x 1,000) 4,010 3,640 3,031 1,771 1,213 800 582 520 500 470 460 330 315 300 300 300 251 220 80 80 80 56 35 30 30 10 5 19,419
Ranking 1 2 3 4 5 6 7 8 9 10 11 12 13 14 14 14 17 18 19 19 19 22 23 24 24 26 27 100
Comments : SALES = SALES TO CONSUMERS

August 2011
18
2010 EUROPEAN BICYCLE SALES (EU 27) AVERAGE PRICE/COUNTRY (€)
0
100
200
300
400
500
600
700
800
745
460
400 400390
380 380
300
280 275262 260
220
190
140130 130
120 120110 110
100 100 100 100 10081
Country
The
Net
herla
nds
Ger
man
y
Aus
tria
*
Bel
gium
*
Den
mar
k *
Luxe
mbo
urg
*
Sw
eden
*
Fin
land
*
Gre
at B
ritai
n
Gre
ece
*
Fra
nce
Italy
Spa
in *
Irel
and
*
Por
tuga
l *
Cze
ch R
epub
lic *
Pol
and
*
Hun
gary
*
Mal
ta *
Slo
vaki
a *
Slo
veni
a *
Lith
uani
a *
Rom
ania
*
Cyc
pus
*
Est
onia
*
Latv
ia *
Bul
garia
EU
27
A v erage pric e (€) 745 460 400 400 390 380 380 300 280 275 262 260 220 190 140 130 130 120 120 110 110 100 100 100 100 100 81
Comments : AVERAGE PRICES INCLUDE VAT
August 2011
19
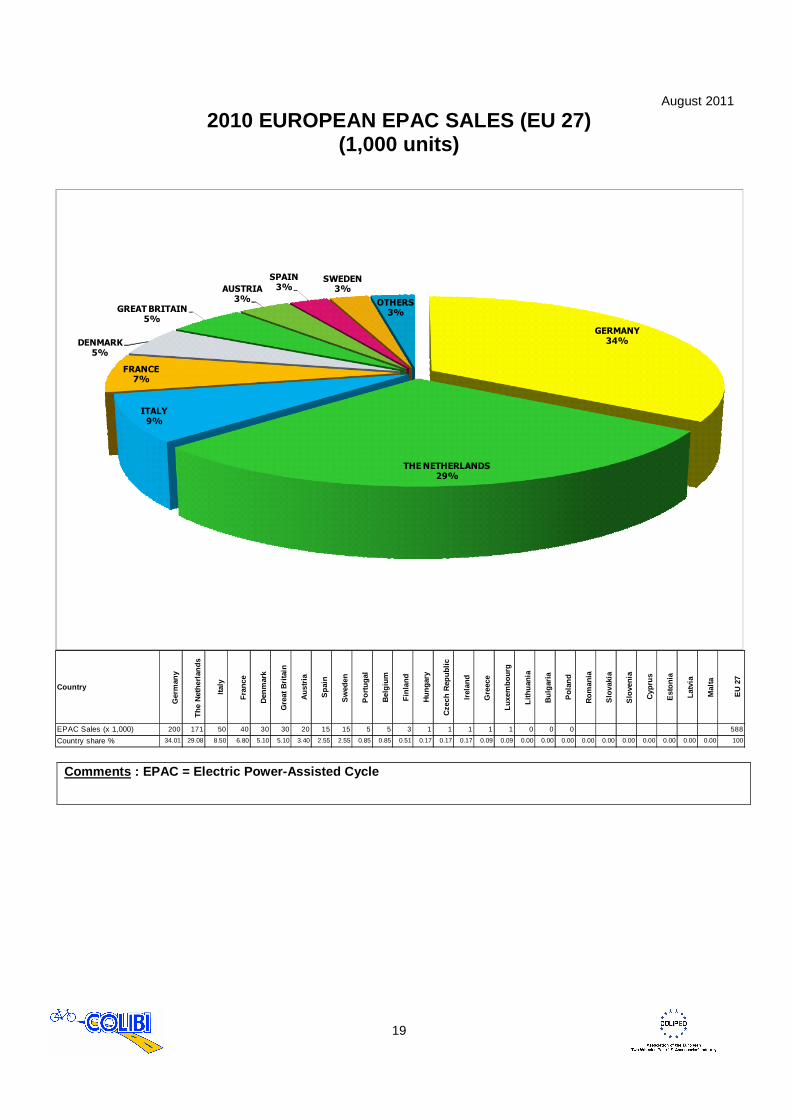
2010 EUROPEAN EPAC SALES (EU 27) (1,000 units)
GERMANY
34%
THE NETHERLANDS
29%
ITALY
9%
FRANCE
7%
DENMARK
5%
GREAT BRITAIN
5%
AUSTRIA
3%
SPAIN
3%SWEDEN
3%
OTHERS
3%
Country
Ger
man
y
The
Net
herla
nds
Italy
Fra
nce
Den
mar
k
Gre
at B
ritai
n
Aus
tria
Spa
in
Sw
eden
Por
tuga
l
Bel
gium
Fin
land
Hun
gary
Cze
ch R
epub
lic
Irel
and
Gre
ece
Luxe
mbo
urg
Lith
uani
a
Bul
garia
Pol
and
Rom
ania
Slo
vaki
a
Slo
veni
a
Cyp
rus
Est
onia
Latv
ia
Mal
ta
EU
27
EPAC Sales (x 1,000) 200 171 50 40 30 30 20 15 15 5 5 3 1 1 1 1 1 0 0 0 588
Country share % 34.01 29.08 8.50 6.80 5.10 5.10 3.40 2.55 2.55 0.85 0.85 0.51 0.17 0.17 0.17 0.09 0.09 0.00 0.00 0.00 0.00 0.00 0.00 0.00 0.00 0.00 0.00 100
Comments : EPAC = Electric Power-Assisted Cycle
August 2011
20
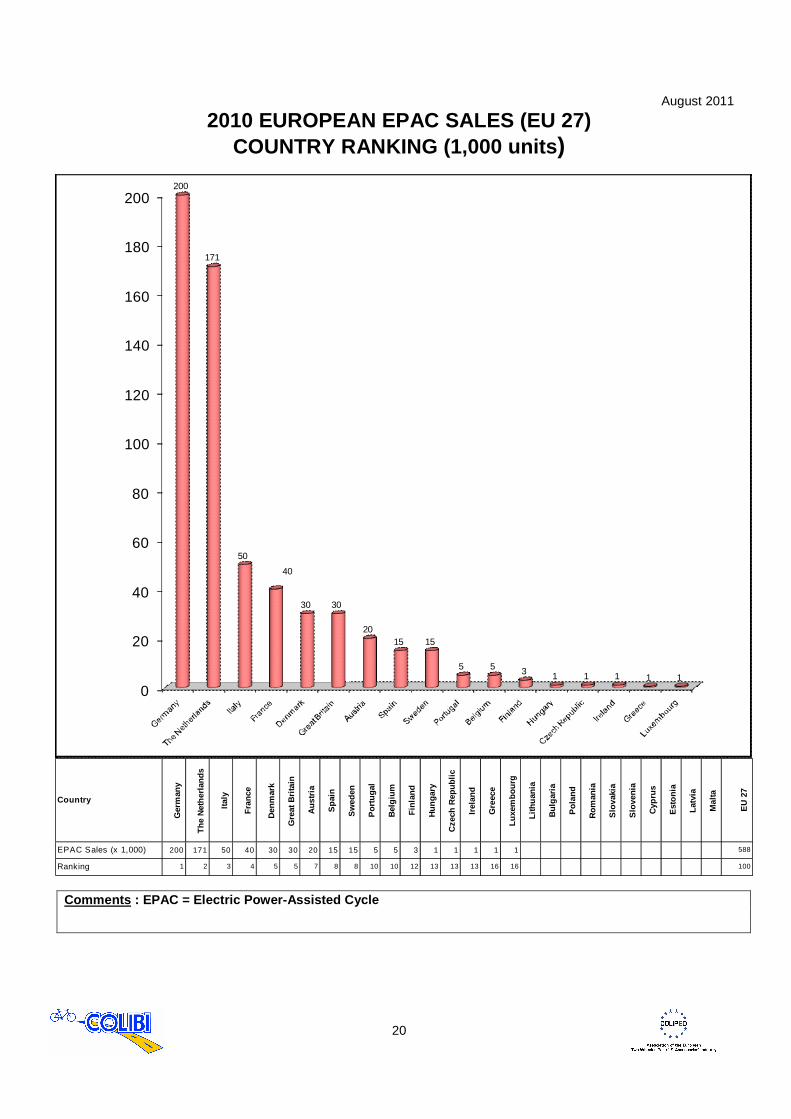
2010 EUROPEAN EPAC SALES (EU 27) COUNTRY RANKING (1,000 units )
0
20
40
60
80
100
120
140
160
180
200200
171
50
40
30 30
2015 15
5 5 3 1 1 1 1 1
Country
Ger
man
y
The
Net
herla
nds
Italy
Fra
nce
Den
mar
k
Gre
at B
ritai
n
Aus
tria
Spa
in
Sw
eden
Por
tuga
l
Bel
gium
Fin
land
Hun
gary
Cze
ch R
epub
lic
Irel
and
Gre
ece
Luxe
mbo
urg
Lith
uani
a
Bul
garia
Pol
and
Rom
ania
Slo
vaki
a
Slo
veni
a
Cyp
rus
Est
onia
Latv
ia
Mal
ta
EU
27
EPAC Sales (x 1,000) 200 171 50 40 30 30 20 15 15 5 5 3 1 1 1 1 1 588
Ranking 1 2 3 4 5 5 7 8 8 10 10 12 13 13 13 16 16 100
Comments : EPAC = Electric Power-Assisted Cycle
August 2011
21
2010 EUROPEAN BICYCLE INDUSTRY EMPLOYMENT

August 2011
22
2010 EMPLOYMENT IN THE EUROPEAN BICYCLE AND BICYCLE PARTS & ACCESSORIES INDUSTRIES (EU27)
0
500
1 000
1 500
2 000
2 500
3 000
3 500
4 000
3 5503 450
2 450
2 000
1 600
1 300
1 040
855 850
640
420375 370
300250 200 190
110 90 90 70
Country
Ger
man
y
Italy
The
Net
herla
nds
Fra
nce
Pol
and
Por
tuga
l
Cze
ch R
epub
lic
Bul
garia
Rom
ania
Hun
gary
Slo
vaki
a
Bel
gium
Aus
tria
Spa
in
Gre
at B
ritai
n
Lith
uani
a
Gre
ece
Slo
veni
a
Den
mar
k
Sw
eden
Fin
land
Cyp
rus
Est
onia
Irel
and
Latv
ia
Luxe
mbo
urg
Mal
ta
EU
27
Bicycle Employment 2,450 1,700 1,850 1,100 1,200 750 560 800 550 370 200 290 200 75 200 190 10 80 90 30 0 0 0 0 0 0 12,695
Parts & Accessories Employment 1,100 1,750 600 900 400 550 480 55 850 90 50 175 80 100 175 0 0 100 10 0 40 0 0 0 0 0 0 7,505
Total 3,550 3,450 2,450 2,000 1,600 1,300 1,040 855 850 640 420 375 370 300 250 200 190 110 90 90 70 0 0 0 0 0 0 20,200
August 2011
23
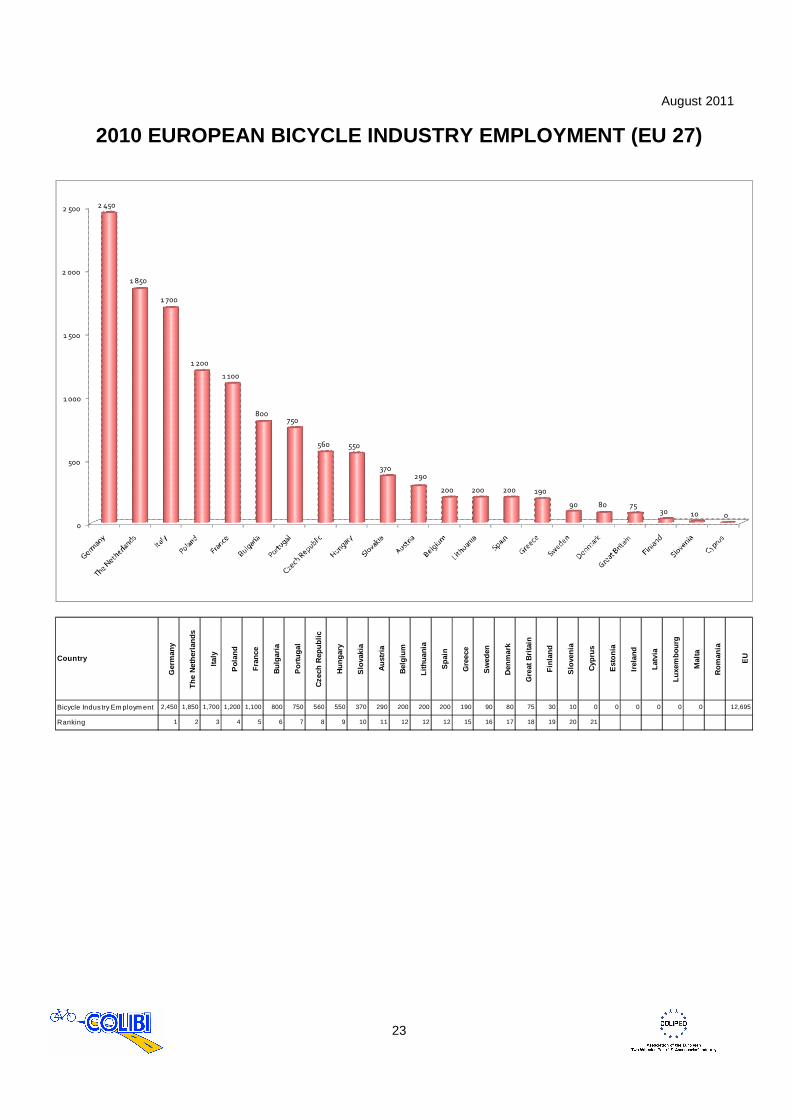
2010 EUROPEAN BICYCLE INDUSTRY EMPLOYMENT (EU 27)
0
500
1 000
1 500
2 000
2 5002 450
1 850
1 700
1 200
1 100
800750
560 550
370290
200 200 200 190
90 80 7530 10 0
Country
Ger
man
y
The
Net
herla
nds
Italy
Pol
and
Fra
nce
Bul
garia
Por
tuga
l
Cze
ch R
epub
lic
Hun
gary
Slo
vaki
a
Aus
tria
Bel
gium
Lith
uani
a
Spa
in
Gre
ece
Sw
eden
Den
mar
k
Gre
at B
ritai
n
Fin
land
Slo
veni
a
Cyp
rus
Est
onia
Irel
and
Latv
ia
Luxe
mbo
urg
Mal
ta
Rom
ania
EU
Bicycle Indus try Em ploym ent 2,450 1,850 1,700 1,200 1,100 800 750 560 550 370 290 200 200 200 190 90 80 75 30 10 0 0 0 0 0 0 12,695
Ranking 1 2 3 4 5 6 7 8 9 10 11 12 12 12 15 16 17 18 19 20 21

August 2011
24
2010 EUROPEAN BICYCLE PARTS AND ACCESSORIES INDUSTRY EMPLOYMENT (EU 27)
0
200
400
600
800
1 000
1 200
1 400
1 600
1 800 1 750
1 100
900850
600550
480
400
175 175
100 100 90 8055 50 40
10
Country
Italy
Ger
man
y
Fra
nce
Rom
ania
The
Net
herla
nds
Por
tuga
l
Cze
ch R
epub
lic
Pol
and
Bel
gium
Gre
at B
ritai
n
Slo
veni
a
Spa
in
Hun
gary
Aus
tria
Bul
garia
Slo
vaki
a
Fin
land
Den
mar
k
Cyp
rus
Est
onia
Gre
ece
Irel
and
Latv
ia
Lith
uani
a
Luxe
mbo
urg
Mal
ta
Sw
eden
EU
27
P & A Industry Employment 1,750 1,100 900 850 600 550 480 400 175 175 100 100 90 80 55 50 40 10 0 0 0 0 0 0 0 0 0 7,505
Ranking 1 2 3 4 5 6 7 8 9 9 11 11 13 14 15 16 17 18 19 19 19 19 19 19 19 19 19

August 2011
25
FRANCE/GERMANY/GREAT BRITAIN/ ITALY/THE NETHERLANDS
Industry & Market Profile 2000-2010
August 2011
26
France

August 2011
27
2010 FRENCH CYCLE MARKET :
“Mobility bicycle sales are still increasing French specialist dealers are the first economic ac tors “
The 2010 Cycle sales (bikes + Components and accessories) represent a turnover of 1,280 M€ 3,031,300 bikes were sold in 2010 for a total value of 794 million Euros. Sales dropped by -3.5% in volume and value compared to 2009.
• ATB (adults and junior) represent 47% of the total with 1,420 million units. • Junior Bikes (except ATB): 517,700 units. • Hybrids: 412,500 units. • City and Folding Bikes: 237,500 units. • Racing bikes: 166,300 units. • Kids’ Bikes: 122,700 units. • BMX: 116,300 units. • 40,000 EPACs were sold in 2010, compared to 23,700 in 2009.
(EPAC = Electric Power-Assisted Cycle) The MOBILITY Bicycle market (city bikes, folding bikes and EPACs) is steadily growing and represents 27% of the sales (17% in 2000). The LEISURE Bicycle market (ATB, Hybrids and Junior bikes) is decreasing but keeps the major share with 63% (73% in 2000). The SPORTS Bicycle segment (Racing Bikes, ATB and BMX competition ranges) is stable with a 10% share of the total sales. The value of the after sales market components and accessories amounts to 486 M€ (-4%) Distribution networks’ activity (Bicycles + Components and Accessories):
• Specialist dealers represent 51.5% of the total sales’ value. • Sports’ Chains manage 38.5% of the total sales’ value. • Mass Merchants manage 10% of the total sales’ value.
The French Cycle Manufacturers and Traders Council is the meeting point of all professional cycle actors in France: bicycle manufacturers, cycle components and accessories producers, distributors of bicycles, brand equipments and accessories and all actors in favour of the promotion of the bicycle.
August 2011
28
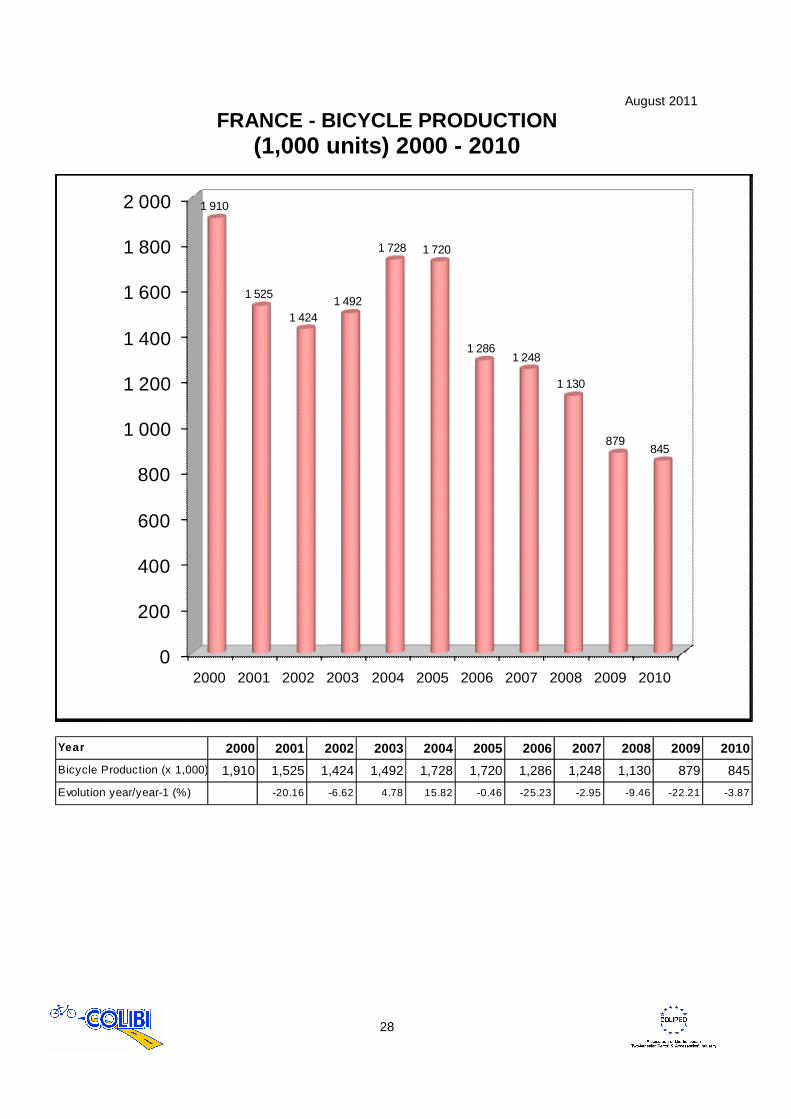
FRANCE - BICYCLE PRODUCTION (1,000 units) 2000 - 2010
0
200
400
600
800
1 000
1 200
1 400
1 600
1 800
2 000
2000 2001 2002 2003 2004 2005 2006 2007 2008 2009 2010
1 910
1 525
1 4241 492
1 728 1 720
1 2861 248
1 130
879845
Year 2000 2001 2002 2003 2004 2005 2006 2007 2008 2009 2010
Bicycle Production (x 1,000) 1,910 1,525 1,424 1,492 1,728 1,720 1,286 1,248 1,130 879 845
Evolution year/year-1 (%) -20.16 -6.62 4.78 15.82 -0.46 -25.23 -2.95 -9.46 -22.21 -3.87
August 2011
29
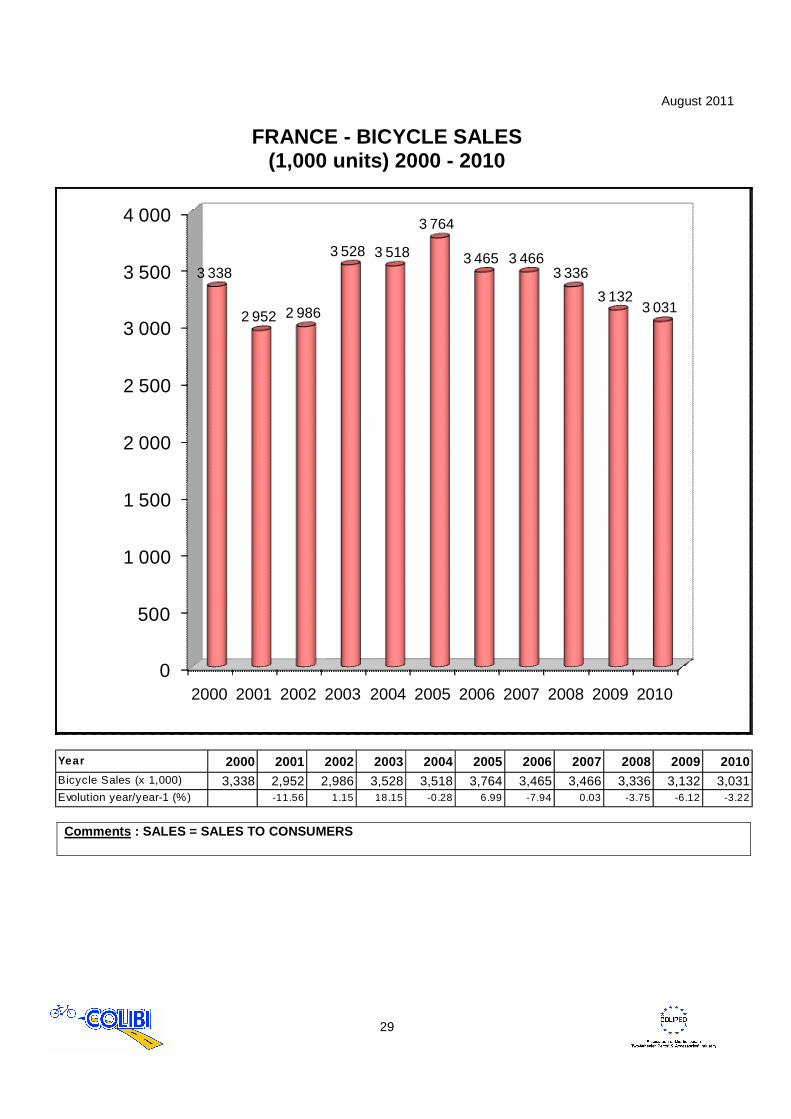
FRANCE - BICYCLE SALES (1,000 units) 2000 - 2010
0
500
1 000
1 500
2 000
2 500
3 000
3 500
4 000
2000 2001 2002 2003 2004 2005 2006 2007 2008 2009 2010
3 338
2 952 2 986
3 528 3 518
3 764
3 465 3 4663 336
3 1323 031
Year 2000 2001 2002 2003 2004 2005 2006 2007 2008 2009 2010Bicycle Sales (x 1,000) 3,338 2,952 2,986 3,528 3,518 3,764 3,465 3,466 3,336 3,132 3,031Evolution year/year-1 (%) -11.56 1.15 18.15 -0.28 6.99 -7.94 0.03 -3.75 -6.12 -3.22
Comments : SALES = SALES TO CONSUMERS
August 2011
30
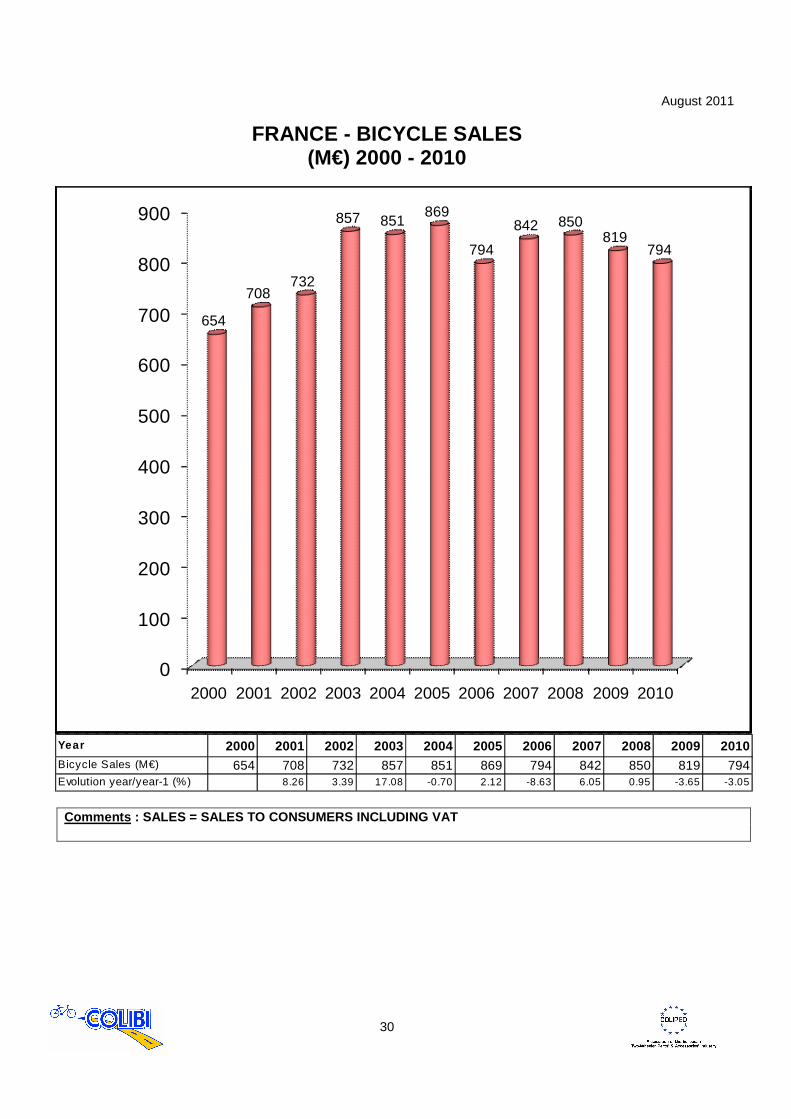
FRANCE - BICYCLE SALES (M€) 2000 - 2010
0
100
200
300
400
500
600
700
800
900
2000 2001 2002 2003 2004 2005 2006 2007 2008 2009 2010
654
708732
857 851869
794
842 850819
794
Year 2000 2001 2002 2003 2004 2005 2006 2007 2008 2009 2010Bicycle Sales (M€) 654 708 732 857 851 869 794 842 850 819 794Evolution year/year-1 (%) 8.26 3.39 17.08 -0.70 2.12 -8.63 6.05 0.95 -3.65 -3.05
Comments : SALES = SALES TO CONSUMERS INCLUDING VAT

August 2011
31
FRANCE - PARTS & ACCESSORIES PRODUCTION
(M€) 2000 - 2010
0
20
40
60
80
100
120
140
160
2000 2001 2002 2003 2004 2005 2006 2007 2008 2009 2010
139
120 118
130
140
150 150
157
150
140
150
Year 2000 2001 2002 2003 2004 2005 2006 2007 2008 2009 2010P & A Production (M€) 139 120 118 130 140 150 150 157 150 140 150Evolution year/year-1 (%) -13.67 -1.67 10.17 7.69 7.14 0.00 4.67 -4.46 -6.67 7.14
Comments : VALUES EXCLUDING VAT

August 2011
32
FRANCE - PARTS AND ACCESSORIES SALES (M€) 2000 – 2010
0
100
200
300
400
500
600
2000 2001 2002 2003 2004 2005 2006 2007 2008 2009 2010
260
349
444
493
519532 525
553536
506486
Year 2000 2001 2002 2003 2004 2005 2006 2007 2008 2009 2010P & A Sales (M€) 260 349 444 493 519 532 525 553 536 506 486Evolution year/year-1 (%) 34.23 27.22 11.04 5.27 2.50 -1.32 5.33 -3.07 -5.60 -3.95
Comments : SALES = SALES TO CONSUMERS INCLUDING VAT
August 2011
33
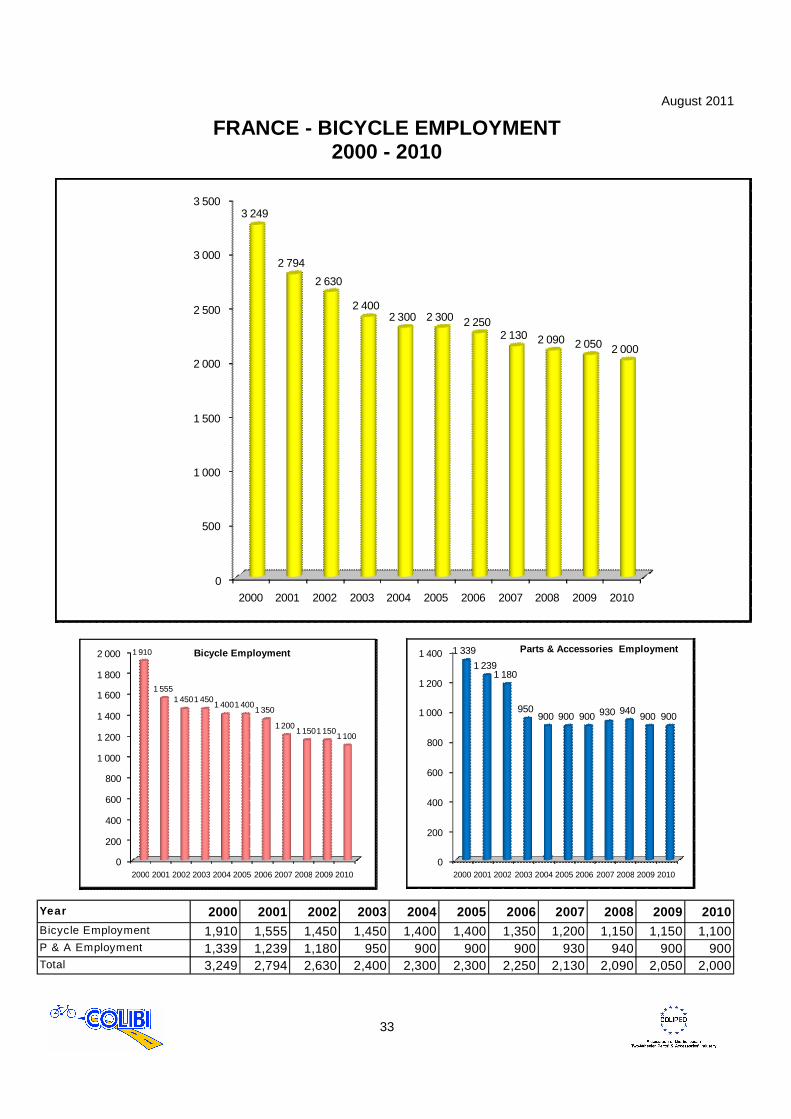
FRANCE - BICYCLE EMPLOYMENT 2000 - 2010
0
500
1 000
1 500
2 000
2 500
3 000
3 500
2000 2001 2002 2003 2004 2005 2006 2007 2008 2009 2010
3 249
2 794
2 630
2 4002 300 2 300 2 250
2 130 2 090 2 050 2 000
0
200
400
600
800
1 000
1 200
1 400
1 600
1 800
2 000
2000 2001 2002 2003 2004 2005 2006 2007 2008 2009 2010
1 910
1 5551 4501 450
1 4001 4001 350
1 2001 1501 150
1 100
Bicycle Employment
0
200
400
600
800
1 000
1 200
1 400
2000 2001 2002 2003 2004 2005 2006 2007 2008 2009 2010
1 339
1 2391 180
950900 900 900 930 940
900 900
Parts & Accessories Employment
Year 2000 2001 2002 2003 2004 2005 2006 2007 2008 2009 2010Bicycle Employment 1,910 1,555 1,450 1,450 1,400 1,400 1,350 1,200 1,150 1,150 1,100P & A Employment 1,339 1,239 1,180 950 900 900 900 930 940 900 900Total 3,249 2,794 2,630 2,400 2,300 2,300 2,250 2,130 2,090 2,050 2,000
August 2011
34
Germany
August 2011
35
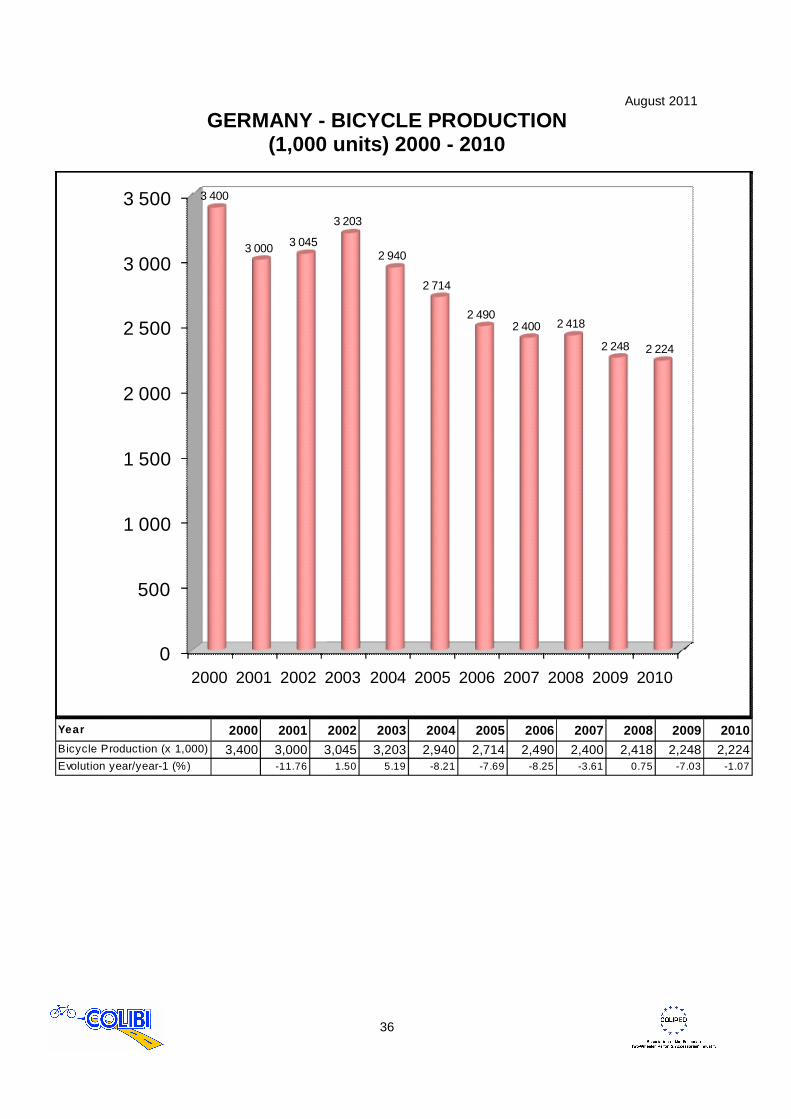
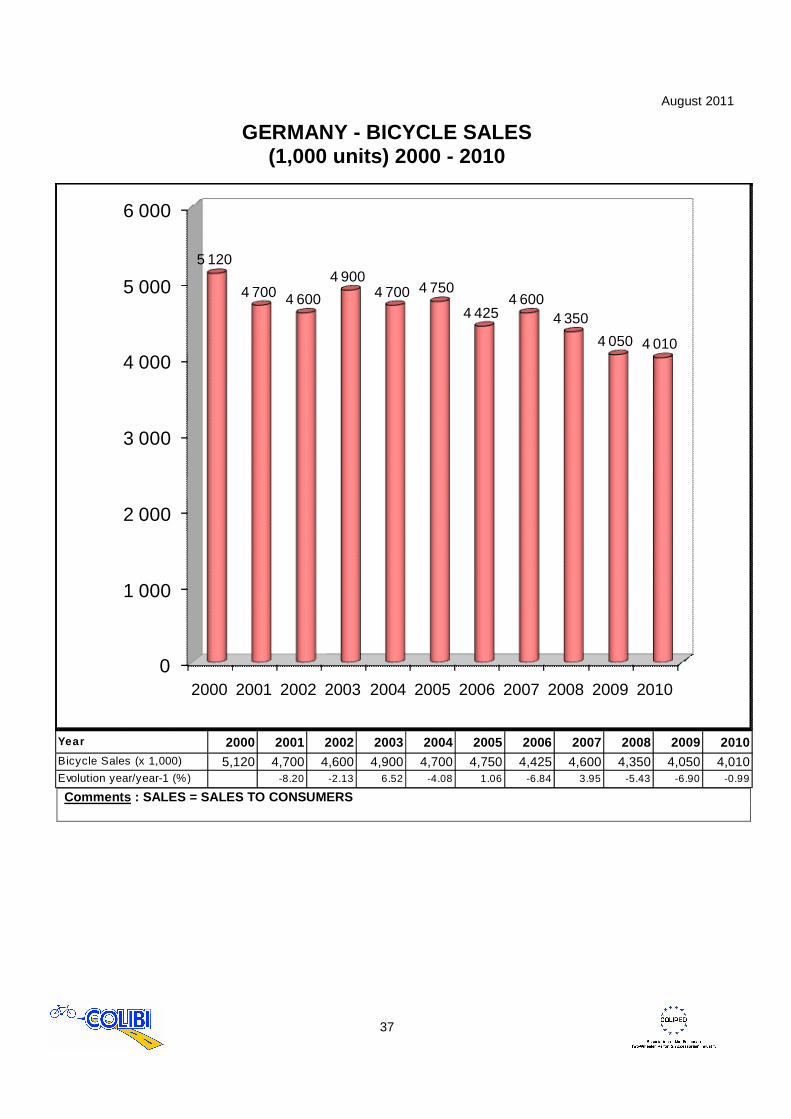
GERMAN BICYCLE INDUSTRY LOOKS OPTIMISTIC IN THE FUT URE In 2010, the German bicycle and bicycle components’ industry produced 2.22 million bicycles and a large number of bicycle components and accessories. The production of bicycles in 2010 was nearly at the same level as in 2009 which shows that the “quality made in Germany" is highly asked for. Compared with the previous year, the average production value increased by 7% to 306.00 € per piece. Responsible for this positive development is the higher amount of EPACs as well as the higher quality awareness at the consumers’ side. In 2010, the German industry produced bicycles and EPACs with a total value of 680 million €. 48.4% of all imports into Germany originated in the other Member States of the European Union. These EU countries slightly strengthened their position in 2010. Imports from Asia represented about 49% and was, therefore, at the same level as last year. The total import value in 2010 amounted to 557 million €, or 6% more than in 2009 (528 million €). In the same period, the number of imported bicycles decreased by 0.62% to 2.71 million pieces. Responsible for the increase in the import value is, of course, the higher price of EPACs. These electric power-assisted cycles are also responsible for the increase of the average value of the imported bicycles to Germany of 6.2% to 206 €/piece (year 2009: 194 €/piece). "Quality made in Germany" is particularly asked for in EU and EFTA countries, where 94 percent of the exports went to. Although exports are stable since 3 years at about 1 million units per year, the average export value per bicycle increased by 27.5% to 352.00 €/piece in the year 2010. Bicycle sales were stable with around 4.01 million bicycles in the year 2010. The average sales price in the year 2010 was about 460.00 €/piece. The share of bicycles sold by the IBDs (independent bicycle dealers) increased to 69% compared to 68% in the year 2009. This clearly shows that the IBDs were successful in a difficult economic environment. In Germany the EPAC market grew from 150,000 in 2009 to about 200,000 units sold in the year 2010. The German Two-Wheeler Industry Association (ZIV) represents the interests of the German bicycle-, bicycle parts-, accessories- and EPAC-industry. The ZIV has around 80 member companies and is located nearby Frankfurt / Main.
August 2011
36
GERMANY - BICYCLE PRODUCTION (1,000 units) 2000 - 2010
0
500
1 000
1 500
2 000
2 500
3 000
3 500
2000 2001 2002 2003 2004 2005 2006 2007 2008 2009 2010
3 400
3 000 3 045
3 203
2 940
2 714
2 4902 400 2 418
2 248 2 224
Year 2000 2001 2002 2003 2004 2005 2006 2007 2008 2009 2010Bicycle Production (x 1,000) 3,400 3,000 3,045 3,203 2,940 2,714 2,490 2,400 2,418 2,248 2,224Evolution year/year-1 (%) -11.76 1.50 5.19 -8.21 -7.69 -8.25 -3.61 0.75 -7.03 -1.07
August 2011
37
GERMANY - BICYCLE SALES (1,000 units) 2000 - 2010
0
1 000
2 000
3 000
4 000
5 000
6 000
2000 2001 2002 2003 2004 2005 2006 2007 2008 2009 2010
5 120
4 700 4 600
4 9004 700 4 750
4 4254 600
4 350
4 050 4 010
Year 2000 2001 2002 2003 2004 2005 2006 2007 2008 2009 2010Bicycle Sales (x 1,000) 5,120 4,700 4,600 4,900 4,700 4,750 4,425 4,600 4,350 4,050 4,010Evolution year/year-1 (%) -8.20 -2.13 6.52 -4.08 1.06 -6.84 3.95 -5.43 -6.90 -0.99 Comments : SALES = SALES TO CONSUMERS

August 2011
38
GERMANY - BICYCLE SALES (M€) 2000 - 2010
1 350
1 400
1 450
1 500
1 550
1 600
1 650
1 700
1 750
1 800
1 850
2000 2001 2002 2003 2004 2005 2006 2007 2008 2009 2010
1 772
1 697
1 624
1 686
1 6031 620
1 542
1 688 1 679
1 806
1 842
Year 2000 2001 2002 2003 2004 2005 2006 2007 2008 2009 2010Bicycle Sales (M€) 1,772 1,697 1,624 1,686 1,603 1,620 1,542 1,688 1,679 1,806 1,842Evolution year/year-1 (%) -4.23 -4.30 3.82 -4.92 1.06 -4.81 9.47 -0.53 7.56 1.99 Comments : SALES = SALES TO CONSUMERS INCLUDING VAT
August 2011
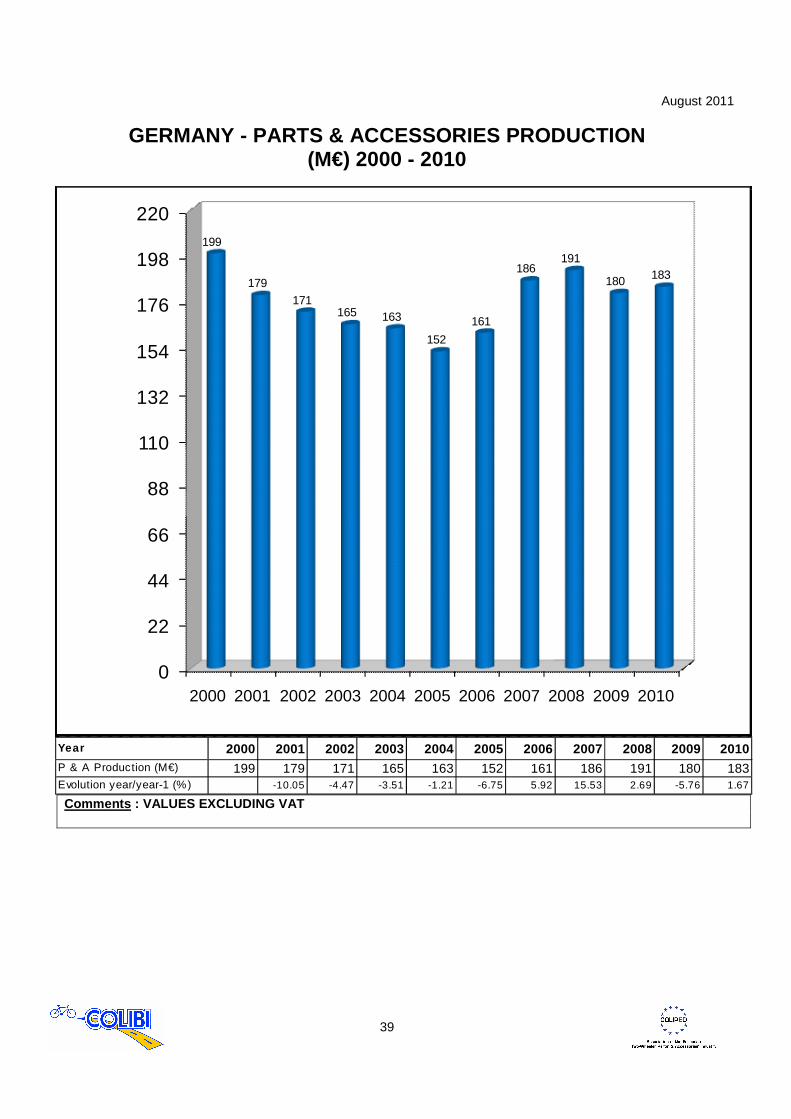
39
GERMANY - PARTS & ACCESSORIES PRODUCTION (M€) 2000 - 2010
0
22
44
66
88
110
132
154
176
198
220
2000 2001 2002 2003 2004 2005 2006 2007 2008 2009 2010
199
179
171165 163
152
161
186191
180 183
Year 2000 2001 2002 2003 2004 2005 2006 2007 2008 2009 2010P & A Production (M€) 199 179 171 165 163 152 161 186 191 180 183Evolution year/year-1 (%) -10.05 -4.47 -3.51 -1.21 -6.75 5.92 15.53 2.69 -5.76 1.67 Comments : VALUES EXCLUDING VAT
August 2011
40
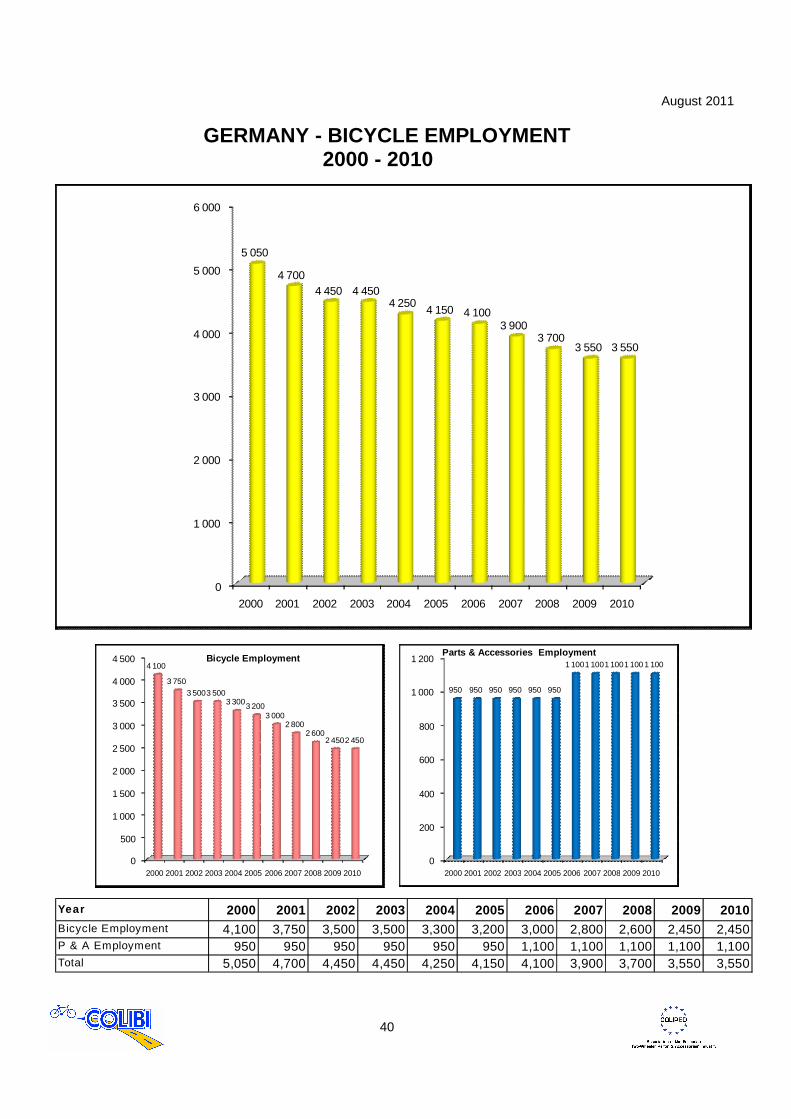
GERMANY - BICYCLE EMPLOYMENT 2000 - 2010
0
1 000
2 000
3 000
4 000
5 000
6 000
2000 2001 2002 2003 2004 2005 2006 2007 2008 2009 2010
5 050
4 7004 450 4 450
4 2504 150 4 100
3 9003 700
3 550 3 550
0
500
1 000
1 500
2 000
2 500
3 000
3 500
4 000
4 500
2000 2001 2002 2003 2004 2005 2006 2007 2008 2009 2010
4 100
3 750
3 5003 5003 3003 200
3 0002 800
2 6002 4502 450
Bicycle Employment
0
200
400
600
800
1 000
1 200
2000 2001 2002 2003 2004 2005 2006 2007 2008 2009 2010
950 950 950 950 950 950
1 1001 1001 1001 100 1 100
Parts & Accessories Employment
Year 2000 2001 2002 2003 2004 2005 2006 2007 2008 2009 2010Bicycle Employment 4,100 3,750 3,500 3,500 3,300 3,200 3,000 2,800 2,600 2,450 2,450P & A Employment 950 950 950 950 950 950 1,100 1,100 1,100 1,100 1,100Total 5,050 4,700 4,450 4,450 4,250 4,150 4,100 3,900 3,700 3,550 3,550

August 2011
41
Great Britain
August 2011
42
UK – Statistics 2010: Commentary Bicycle imports to UK increased 24% in units, compared with 2009. This growth is not reflected in unofficial estimates of sales to the consumer in 2010. Bad weather in Q4, and uncertainty about the Government’s changes in regulations for commuter cycling purchase schemes created a sharp fall in demand, with a consequent rise in stocks. Specialist retailers (about 40% of the total market) estimated a 3% growth in units sold in 2010. However, Halfords and mass merchants appear to have seen up to 15% increase in (predominantly cheap) bike sales. A rough estimate of consumer sales for 2010 is, therefore, about 3.6 million units. Expectations for 2011 are disappointing. Imports to the end of May were 10% below 2010, with May alone being 30% below May 2010. High stocks and poor weather in Q1 were the principal cause. Little information is available about internet sales direct to consumers, though this sector appears to be growing strongly. Electric power-assisted cycles (EPACs) have not yet made an impact on the UK market, with unit sales at about 20-25,000 in 2010. Factors influencing this low growth include: o Relatively high price (1500+) vs. pedal cycles. o History of poor quality/performance/reliability in the past. o Target audience (over 50 years of age) unlikely to visit cycle shops. o Trade uncertainty about regulations regarding EPACs vs. scooters/mopeds. The import value of bicycles in 2010 has risen sharply (+39%) vs. 2010. This is attributed to the general increases in production costs in Asia, as well as the weaker value of sterling. The role of the bicycle in the UK remains principally for leisure purposes. It is estimated that about one third of the sales are for children’s bikes. Mountain bikes are by far the most popular type of bike, even when used on road. Increasing commuter cycling was encouraged by the previous Government, though is not now a priority of the present coalition. London continues to lead the nation, with about 500,000 trips a day by bike, and usage of the Cycle Hire Scheme is about 30,000 trips a day.

August 2011
43
GREAT BRITAIN - BICYCLE PRODUCTION (1,000 units) 2000 - 2010
0
200
400
600
800
1 000
1 200
2000 2001 2002 2003 2004 2005 2006 2007 2008 2009 2010
1 200
1 000
350325
250
13594
27 28 2048
Year 2000 2001 2002 2003 2004 2005 2006 2007 2008 2009 2010Bicycle Production (x 1,000) 1,200 1,000 350 325 250 135 94 27 28 20 48Evolution year/year-1 (%) -16.67 -65.00 -7.14 -23.08 -46.00 -30.37 -71.28 3.70 -28.57 140.00

August 2011
44
GREAT BRITAIN - BICYCLE SALES (1,000 units) 2000 - 2010
0
500
1 000
1 500
2 000
2 500
3 000
3 500
4 000
2003 2004 2005 2006 2007 2008 2009 2010
3 7273 905
3 8003 920
3 771
3 3113 400
3 640
Year 2000 2001 2002 2003 2004 2005 2006 2007 2008 2009 2010Bicycle Sales (x 1,000) 2,300 2,400 2,300 3,727 3,905 3,800 3,920 3,771 3,311 3,400 3,640Evolution year/year-1 (%) 4.35 -4.17 62.04 4.78 -2.69 3.16 -3.80 -12.20 2.69 7.06
Comments : SALES = SALES TO CONSUMERS
August 2011
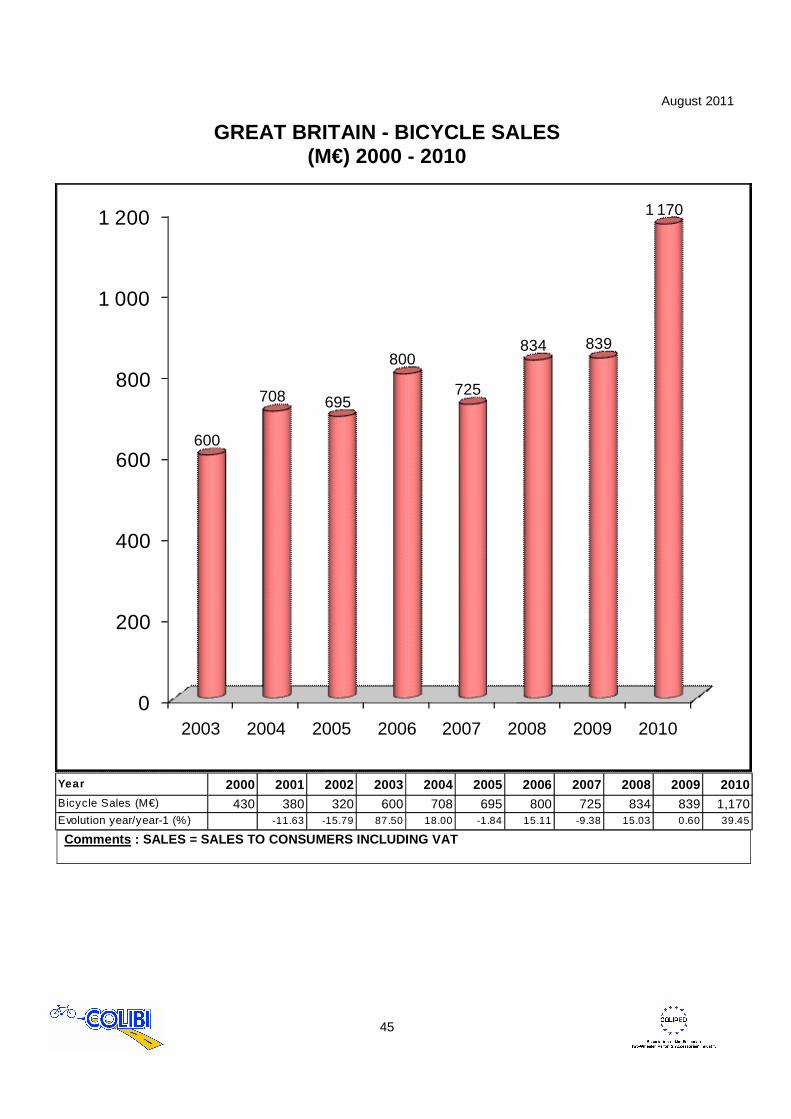
45
GREAT BRITAIN - BICYCLE SALES (M€) 2000 - 2010
0
200
400
600
800
1 000
1 200
2003 2004 2005 2006 2007 2008 2009 2010
600
708 695
800
725
834 839
1 170
Year 2000 2001 2002 2003 2004 2005 2006 2007 2008 2009 2010Bicycle Sales (M€) 430 380 320 600 708 695 800 725 834 839 1,170Evolution year/year-1 (%) -11.63 -15.79 87.50 18.00 -1.84 15.11 -9.38 15.03 0.60 39.45 Comments : SALES = SALES TO CONSUMERS INCLUDING VAT
August 2011
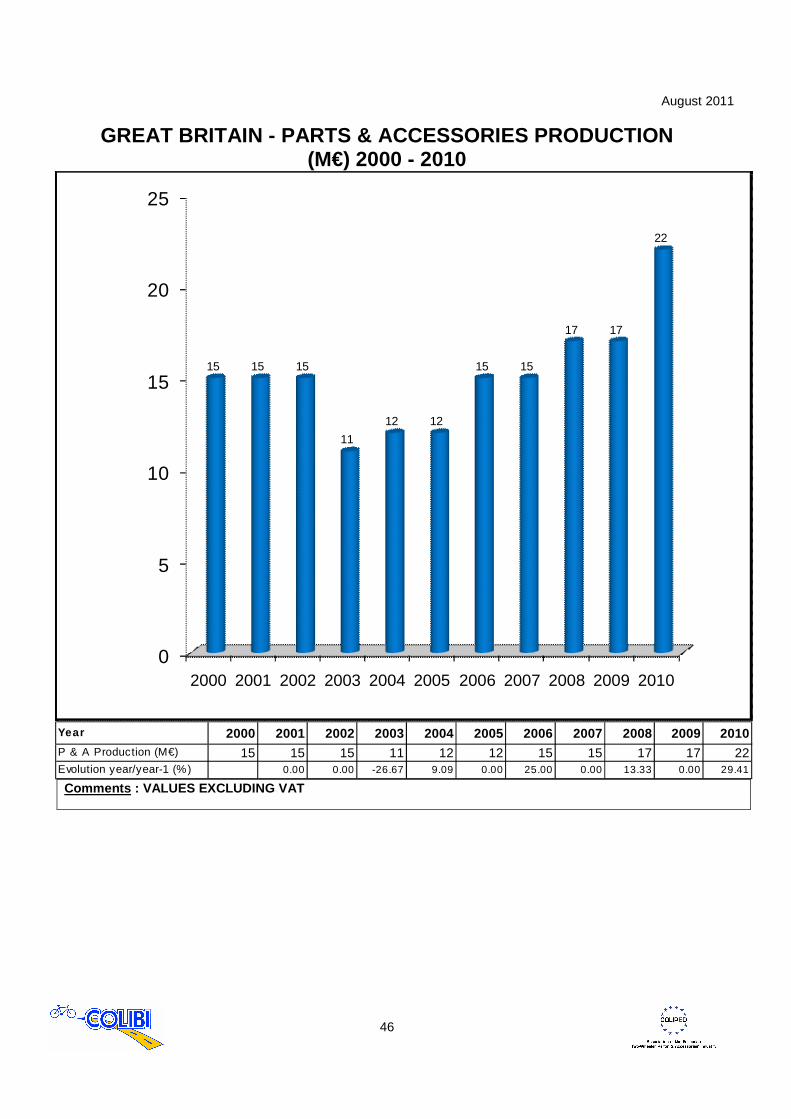
46
GREAT BRITAIN - PARTS & ACCESSORIES PRODUCTION (M€) 2000 - 2010
0
5
10
15
20
25
2000 2001 2002 2003 2004 2005 2006 2007 2008 2009 2010
15 15 15
11
12 12
15 15
17 17
22
Year 2000 2001 2002 2003 2004 2005 2006 2007 2008 2009 2010P & A Production (M€) 15 15 15 11 12 12 15 15 17 17 22Evolution year/year-1 (%) 0.00 0.00 -26.67 9.09 0.00 25.00 0.00 13.33 0.00 29.41 Comments : VALUES EXCLUDING VAT
August 2011
47
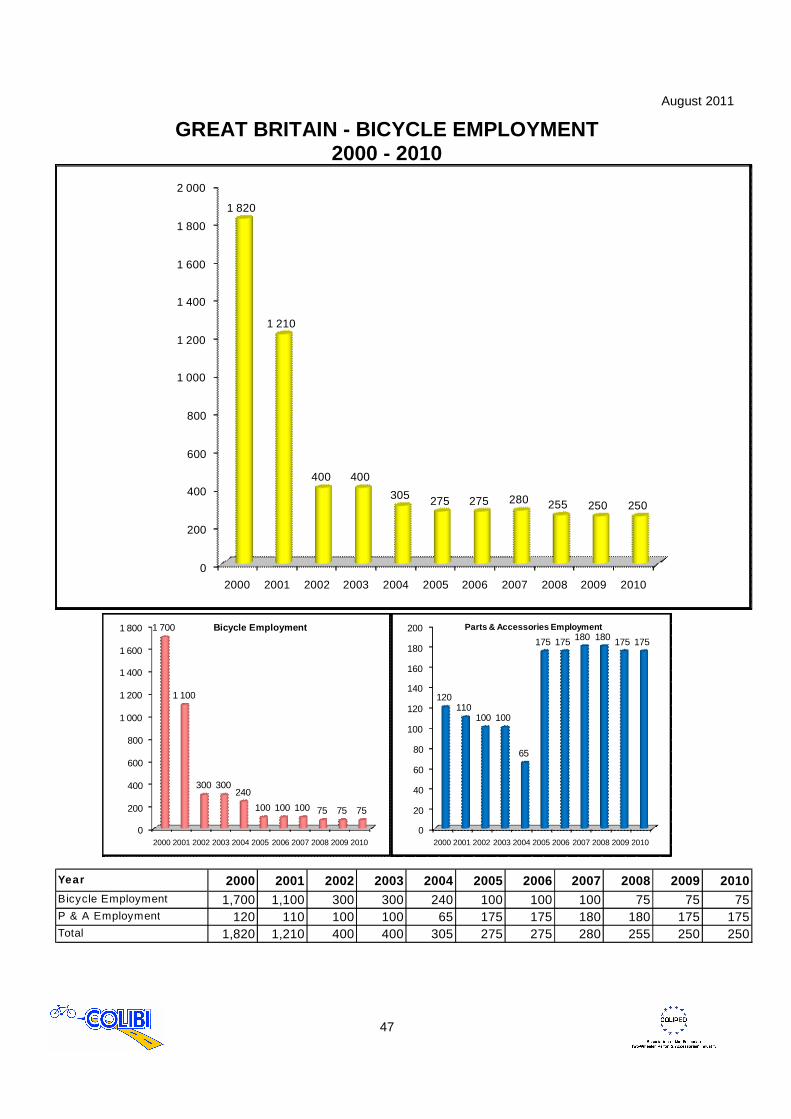
GREAT BRITAIN - BICYCLE EMPLOYMENT 2000 - 2010
0
200
400
600
800
1 000
1 200
1 400
1 600
1 800
2 000
2000 2001 2002 2003 2004 2005 2006 2007 2008 2009 2010
1 820
1 210
400 400
305 275 275 280 255 250 250
0
200
400
600
800
1 000
1 200
1 400
1 600
1 800
2000 2001 2002 2003 2004 2005 2006 2007 2008 2009 2010
1 700
1 100
300 300240
100 100 100 75 75 75
Bicycle Employment
0
20
40
60
80
100
120
140
160
180
200
2000 2001 2002 2003 2004 2005 2006 2007 2008 2009 2010
120110
100 100
65
175 175 180 180 175 175
Parts & Accessories Employment
Year 2000 2001 2002 2003 2004 2005 2006 2007 2008 2009 2010Bicycle Employment 1,700 1,100 300 300 240 100 100 100 75 75 75P & A Employment 120 110 100 100 65 175 175 180 180 175 175Total 1,820 1,210 400 400 305 275 275 280 255 250 250
August 2011
48
Italy
August 2011
49
The Italian bicycle market – some comments
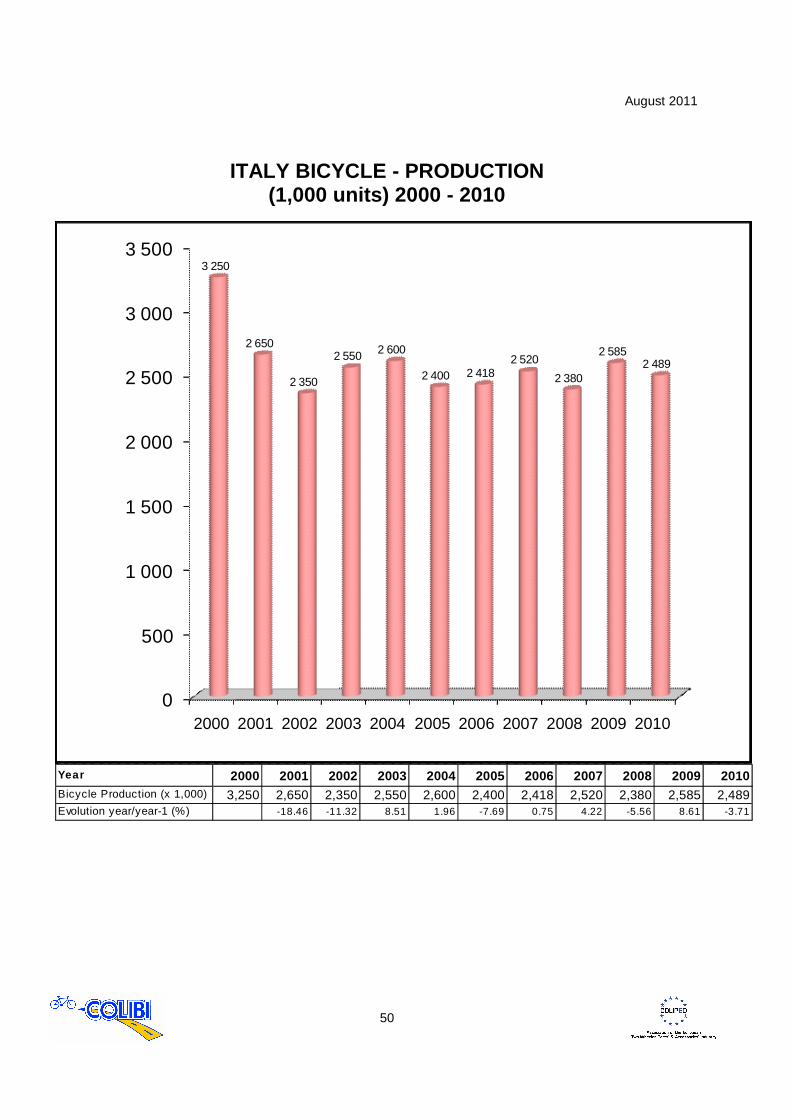
In 2010, the Italian bicycle market reached a normal level of sales, even though 2009 closed with a very significant increase in sales (+ 8%). This in absolute contrast with all the other European countries, where there was an average drop of - 5% in the same period. The Italian boom in bicycle sales was mainly due to the Incentives’ campaign of the Ministry of the Environment. In 2010, bicycle sales amounted to 1,771,000 units or 7% less compared with 2009. The result was a fall in production to 2,489,000 units. This was a decrease of almost 4% compared to 2009. Italy is still the country that produces and exports the largest number of bicycles in Europe. 1,354,000 bicycles were exported (an increase of 5.4%), while imports remained basically stable with 636,000 bikes, almost all imported from Asia. The parts (frames, groups, saddles and many other high-end components) have seen an increase in exports, scoring nearly 400 million in revenue, an increase of 13% compared to 2009. The first quarter of 2011 was one of the worst in recent years, especially due to the bad weather. As from April, instead of seeing a recovery in the market, the signals were not marked by optimism. Only by the end of September, market trends can be assessed. In many European countries, bicycles are used for commuting purposes throughout the year. In Italy, however, bicycles are seasonal products: in summer, Italians go biking. There are more and more bicycle lanes and tracks and greater attention is given to this vehicle, especially in large urban centers. New lifestyles and new individual travel behavior have to be promoted, while remembering that the bicycle is the perfect vehicle to use for journeys of less than 5 km. Moreover, cycling (more) is good for one’s health and for the environment. Bicycles are mainly sold in hypermarkets, but as a result of higher demand for quality, also the share of the Specialist distribution channels is growing. In Italy, the bicycle’s main purpose is SPORTS, followed by LEISURE and only on the third place by COMMUTING (urban mobility).
* * *
August 2011
50
ITALY BICYCLE - PRODUCTION (1,000 units) 2000 - 2010
0
500
1 000
1 500
2 000
2 500
3 000
3 500
2000 2001 2002 2003 2004 2005 2006 2007 2008 2009 2010
3 250
2 650
2 350
2 550 2 600
2 400 2 4182 520
2 380
2 5852 489
Year 2000 2001 2002 2003 2004 2005 2006 2007 2008 2009 2010Bicycle Production (x 1,000) 3,250 2,650 2,350 2,550 2,600 2,400 2,418 2,520 2,380 2,585 2,489Evolution year/year-1 (%) -18.46 -11.32 8.51 1.96 -7.69 0.75 4.22 -5.56 8.61 -3.71

August 2011
51
ITALY - BICYCLE SALES (1,000 units) 2000 - 2010
0
200
400
600
800
1 000
1 200
1 400
1 600
1 800
2 000
2000 2001 2002 2003 2004 2005 2006 2007 2008 2009 2010
1 722 1 684
1 384 1 418
1 666
1 8771 943
1 998
1 780
1 927
1 771
Year 2000 2001 2002 2003 2004 2005 2006 2007 2008 2009 2010Bicycle Sales (x 1,000) 1,722 1,684 1,384 1,418 1,666 1,877 1,943 1,998 1,780 1,927 1,771Evolution year/year-1 (%) -2.21 -17.81 2.46 17.49 12.67 3.52 2.83 -10.91 8.26 -8.10
Comments : SALES = SALES TO CONSUMERS
August 2011
52
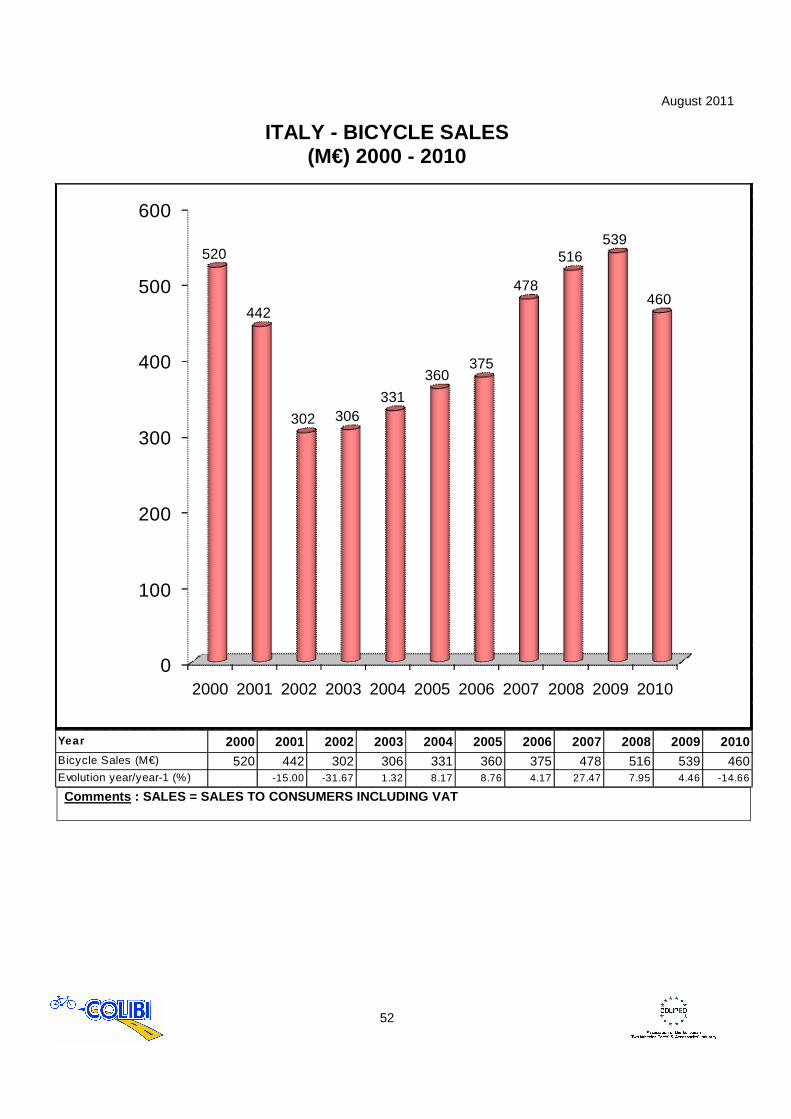
ITALY - BICYCLE SALES (M€) 2000 - 2010
0
100
200
300
400
500
600
2000 2001 2002 2003 2004 2005 2006 2007 2008 2009 2010
520
442
302 306331
360375
478
516539
460
Year 2000 2001 2002 2003 2004 2005 2006 2007 2008 2009 2010Bicycle Sales (M€) 520 442 302 306 331 360 375 478 516 539 460Evolution year/year-1 (%) -15.00 -31.67 1.32 8.17 8.76 4.17 27.47 7.95 4.46 -14.66 Comments : SALES = SALES TO CONSUMERS INCLUDING VAT
August 2011
53
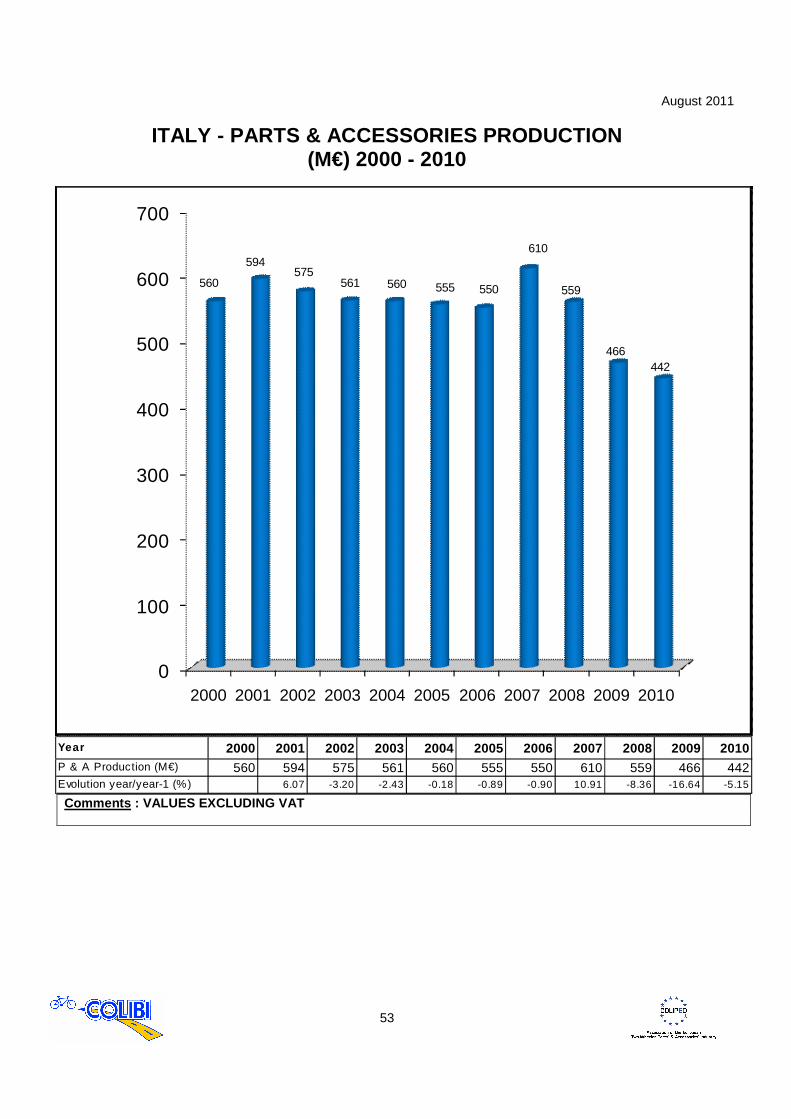
ITALY - PARTS & ACCESSORIES PRODUCTION (M€) 2000 - 2010
0
100
200
300
400
500
600
700
2000 2001 2002 2003 2004 2005 2006 2007 2008 2009 2010
560
594575
561 560 555 550
610
559
466442
Year 2000 2001 2002 2003 2004 2005 2006 2007 2008 2009 2010P & A Production (M€) 560 594 575 561 560 555 550 610 559 466 442Evolution year/year-1 (%) 6.07 -3.20 -2.43 -0.18 -0.89 -0.90 10.91 -8.36 -16.64 -5.15
Comments : VALUES EXCLUDING VAT
August 2011
54
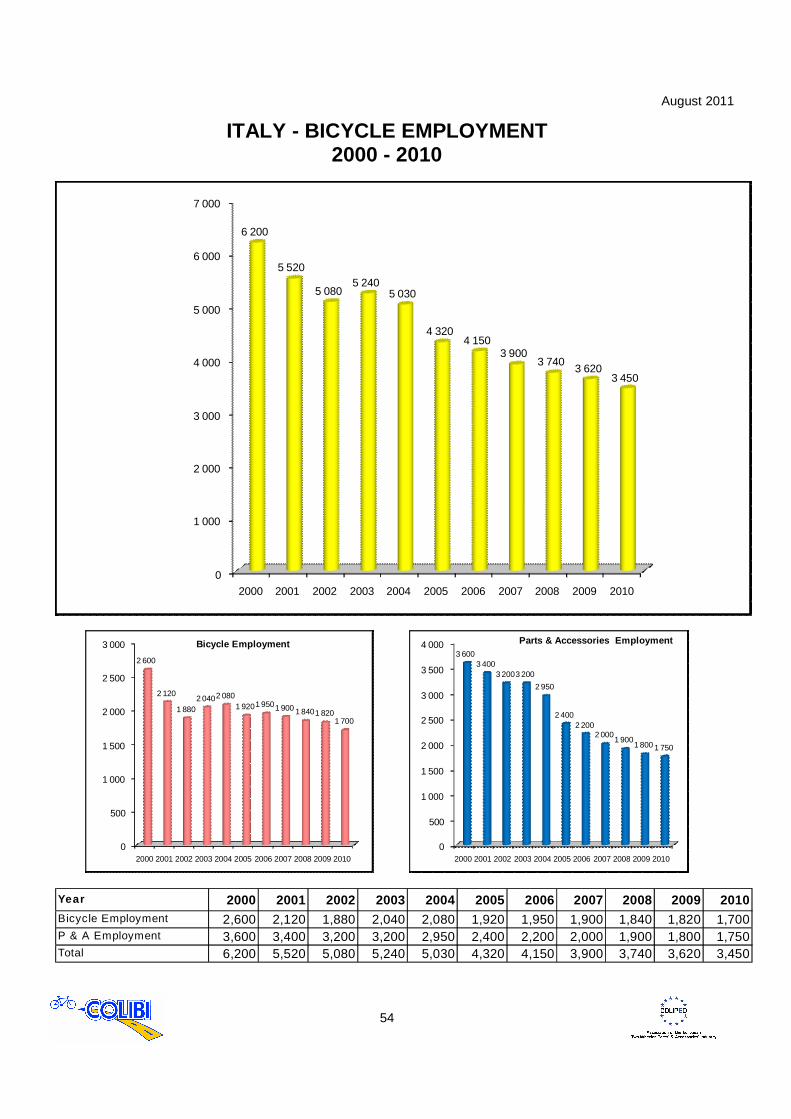
ITALY - BICYCLE EMPLOYMENT 2000 - 2010
0
1 000
2 000
3 000
4 000
5 000
6 000
7 000
2000 2001 2002 2003 2004 2005 2006 2007 2008 2009 2010
6 200
5 520
5 0805 240
5 030
4 3204 150
3 9003 740
3 6203 450
0
500
1 000
1 500
2 000
2 500
3 000
2000 2001 2002 2003 2004 2005 2006 2007 2008 2009 2010
2 600
2 120
1 8802 0402 080
1 9201 9501 900 1 8401 8201 700
Bicycle Employment
0
500
1 000
1 500
2 000
2 500
3 000
3 500
4 000
2000 2001 2002 2003 2004 2005 2006 2007 2008 2009 2010
3 6003 400
3 2003 200
2 950
2 4002 200
2 0001 900
1 800 1 750
Parts & Accessories Employment
Year 2000 2001 2002 2003 2004 2005 2006 2007 2008 2009 2010Bicycle Employment 2,600 2,120 1,880 2,040 2,080 1,920 1,950 1,900 1,840 1,820 1,700P & A Employment 3,600 3,400 3,200 3,200 2,950 2,400 2,200 2,000 1,900 1,800 1,750Total 6,200 5,520 5,080 5,240 5,030 4,320 4,150 3,900 3,740 3,620 3,450
August 2011
55
The Netherlands
August 2011
56
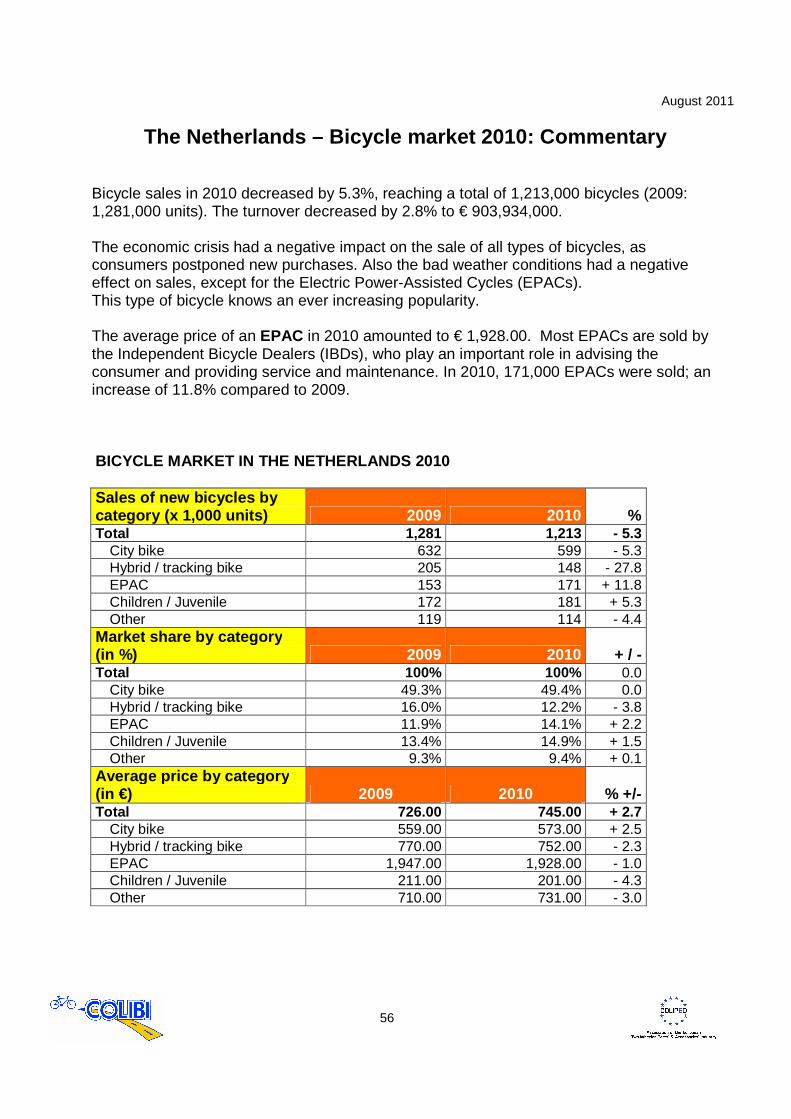
The Netherlands – Bicycle market 2010: Commentary Bicycle sales in 2010 decreased by 5.3%, reaching a total of 1,213,000 bicycles (2009: 1,281,000 units). The turnover decreased by 2.8% to € 903,934,000. The economic crisis had a negative impact on the sale of all types of bicycles, as consumers postponed new purchases. Also the bad weather conditions had a negative effect on sales, except for the Electric Power-Assisted Cycles (EPACs). This type of bicycle knows an ever increasing popularity. The average price of an EPAC in 2010 amounted to € 1,928.00. Most EPACs are sold by the Independent Bicycle Dealers (IBDs), who play an important role in advising the consumer and providing service and maintenance. In 2010, 171,000 EPACs were sold; an increase of 11.8% compared to 2009. BICYCLE MARKET IN THE NETHERLANDS 2010 Sales of new bicycles by category (x 1,000 units) 2009 2010 % Total 1,281 1,213 - 5.3
City bike 632 599 - 5.3 Hybrid / tracking bike 205 148 - 27.8 EPAC 153 171 + 11.8 Children / Juvenile 172 181 + 5.3 Other 119 114 - 4.4
Market share by category (in %) 2009 2010 + / - Total 100% 100% 0.0
City bike 49.3% 49.4% 0.0 Hybrid / tracking bike 16.0% 12.2% - 3.8 EPAC 11.9% 14.1% + 2.2 Children / Juvenile 13.4% 14.9% + 1.5 Other 9.3% 9.4% + 0.1
Average price by category (in €) 2009 2010 % +/- Total 726.00 745.00 + 2.7
City bike 559.00 573.00 + 2.5 Hybrid / tracking bike 770.00 752.00 - 2.3 EPAC 1,947.00 1,928.00 - 1.0 Children / Juvenile 211.00 201.00 - 4.3 Other 710.00 731.00 - 3.0
August 2011
57
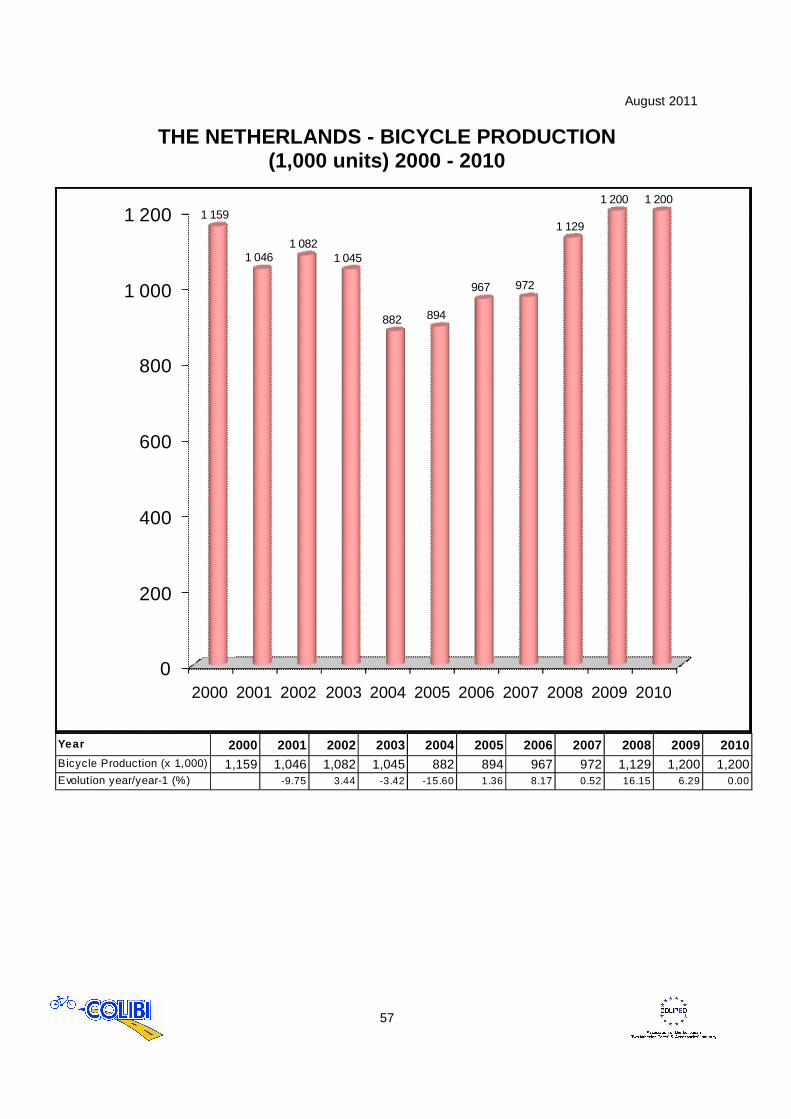
THE NETHERLANDS - BICYCLE PRODUCTION (1,000 units) 2000 - 2010
0
200
400
600
800
1 000
1 200
2000 2001 2002 2003 2004 2005 2006 2007 2008 2009 2010
1 159
1 0461 082
1 045
882 894
967 972
1 129
1 200 1 200
Year 2000 2001 2002 2003 2004 2005 2006 2007 2008 2009 2010Bicycle Production (x 1,000) 1,159 1,046 1,082 1,045 882 894 967 972 1,129 1,200 1,200Evolution year/year-1 (%) -9.75 3.44 -3.42 -15.60 1.36 8.17 0.52 16.15 6.29 0.00
August 2011
58
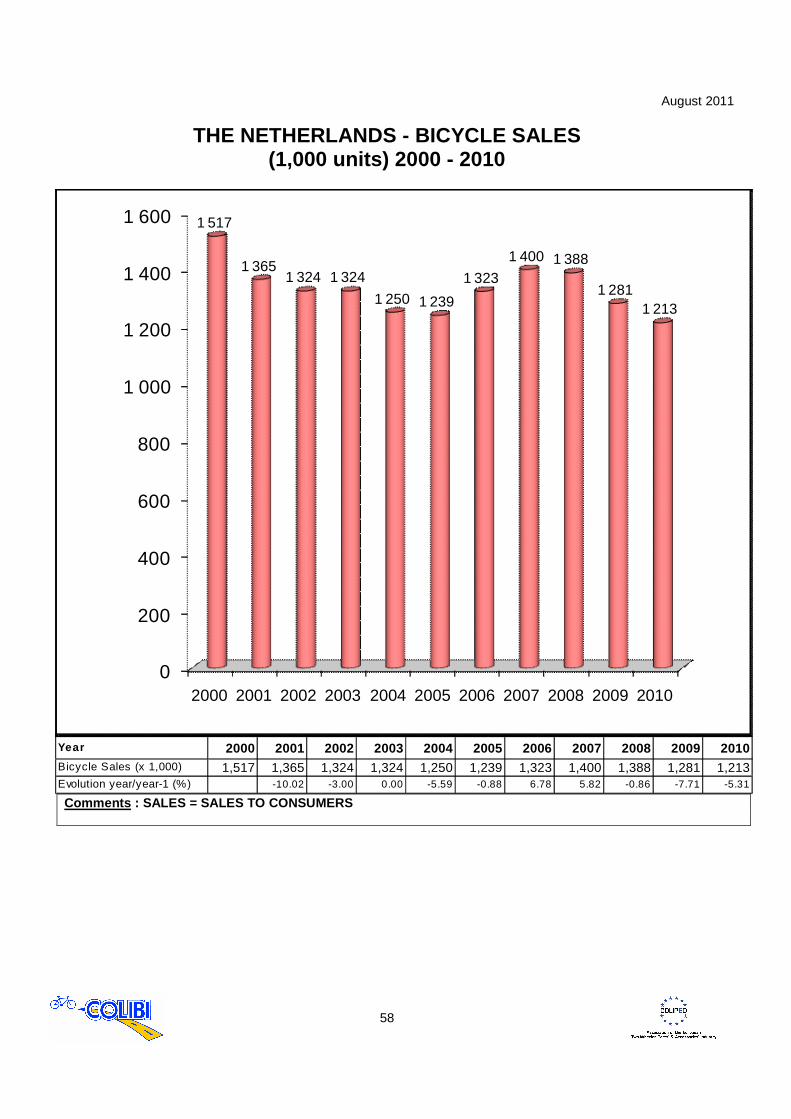
THE NETHERLANDS - BICYCLE SALES (1,000 units) 2000 - 2010
0
200
400
600
800
1 000
1 200
1 400
1 600
2000 2001 2002 2003 2004 2005 2006 2007 2008 2009 2010
1 517
1 3651 324 1 324
1 250 1 239
1 323
1 400 1 388
1 2811 213
Year 2000 2001 2002 2003 2004 2005 2006 2007 2008 2009 2010Bicycle Sales (x 1,000) 1,517 1,365 1,324 1,324 1,250 1,239 1,323 1,400 1,388 1,281 1,213Evolution year/year-1 (%) -10.02 -3.00 0.00 -5.59 -0.88 6.78 5.82 -0.86 -7.71 -5.31
Comments : SALES = SALES TO CONSUMERS
August 2011
59
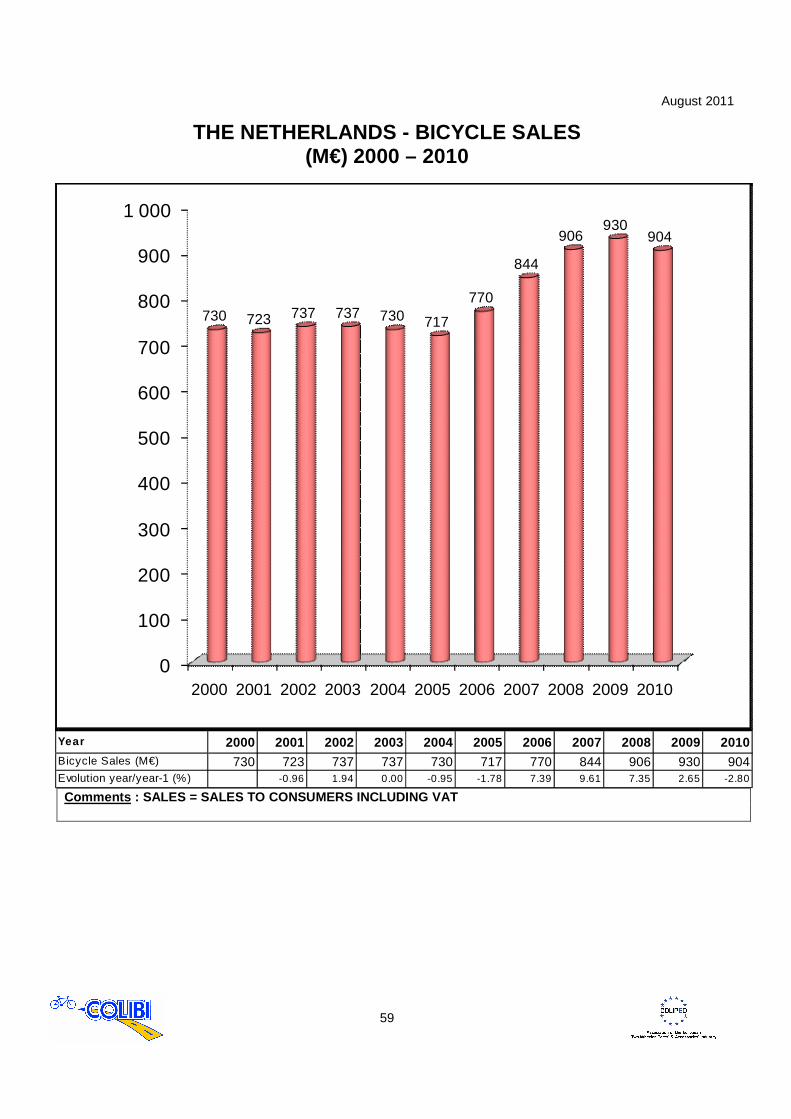
THE NETHERLANDS - BICYCLE SALES (M€) 2000 – 2010
0
100
200
300
400
500
600
700
800
900
1 000
2000 2001 2002 2003 2004 2005 2006 2007 2008 2009 2010
730 723 737 737 730 717
770
844
906930
904
Year 2000 2001 2002 2003 2004 2005 2006 2007 2008 2009 2010Bicycle Sales (M€) 730 723 737 737 730 717 770 844 906 930 904Evolution year/year-1 (%) -0.96 1.94 0.00 -0.95 -1.78 7.39 9.61 7.35 2.65 -2.80 Comments : SALES = SALES TO CONSUMERS INCLUDING VAT
August 2011
60
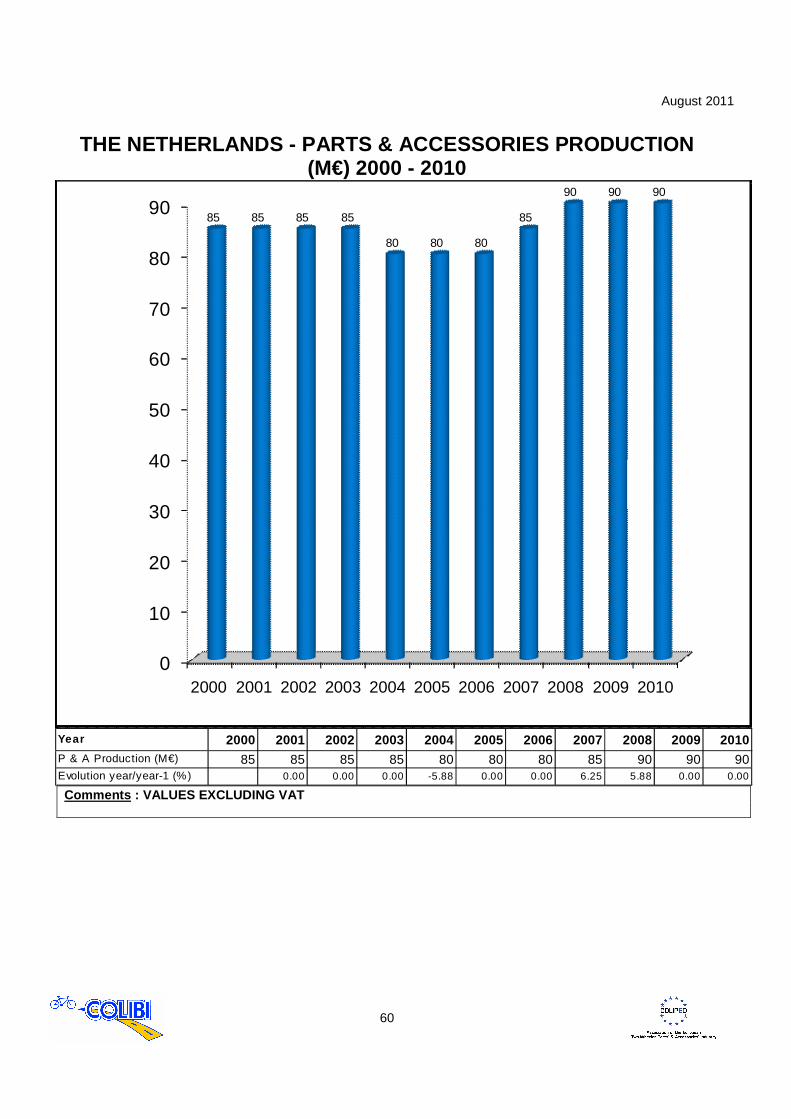
THE NETHERLANDS - PARTS & ACCESSORIES PRODUCTION
(M€) 2000 - 2010
0
10
20
30
40
50
60
70
80
90
2000 2001 2002 2003 2004 2005 2006 2007 2008 2009 2010
85 85 85 85
80 80 80
85
90 90 90
Year 2000 2001 2002 2003 2004 2005 2006 2007 2008 2009 2010P & A Production (M€) 85 85 85 85 80 80 80 85 90 90 90Evolution year/year-1 (%) 0.00 0.00 0.00 -5.88 0.00 0.00 6.25 5.88 0.00 0.00 Comments : VALUES EXCLUDING VAT
August 2011
61
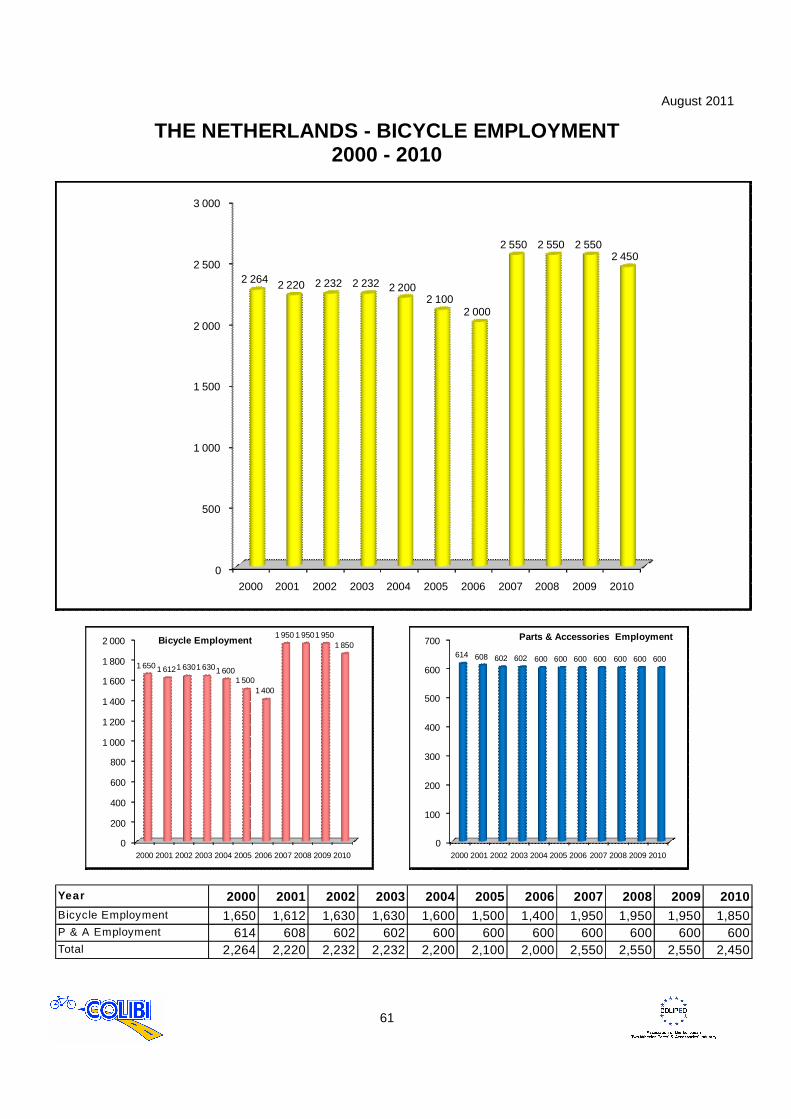
THE NETHERLANDS - BICYCLE EMPLOYMENT 2000 - 2010
0
500
1 000
1 500
2 000
2 500
3 000
2000 2001 2002 2003 2004 2005 2006 2007 2008 2009 2010
2 264 2 220 2 232 2 232 2 2002 100
2 000
2 550 2 550 2 5502 450
0
200
400
600
800
1 000
1 200
1 400
1 600
1 800
2 000
2000 2001 2002 2003 2004 2005 2006 2007 2008 2009 2010
1 650 1 6121 6301 6301 6001 500
1 400
1 950 1 9501 9501 850Bicycle Employment
0
100
200
300
400
500
600
700
2000 2001 2002 2003 2004 2005 2006 2007 2008 2009 2010
614 608 602 602 600 600 600 600 600 600 600
Parts & Accessories Employment
Year 2000 2001 2002 2003 2004 2005 2006 2007 2008 2009 2010Bicycle Employment 1,650 1,612 1,630 1,630 1,600 1,500 1,400 1,950 1,950 1,950 1,850P & A Employment 614 608 602 602 600 600 600 600 600 600 600Total 2,264 2,220 2,232 2,232 2,200 2,100 2,000 2,550 2,550 2,550 2,450