european commission decisions on anti-competitive behavior · iese business school-university of...
TRANSCRIPT
IESE Business School-University of Navarra - 1
EUROPEAN COMMISSION DECISIONS ON ANTI-COMPETITIVE BEHAVIOR
Jordi Gual
Núria Mas
IESE Business School – University of Navarra Av. Pearson, 21 – 08034 Barcelona, Spain. Phone: (+34) 93 253 42 00 Fax: (+34) 93 253 43 43 Camino del Cerro del Águila, 3 (Ctra. de Castilla, km 5,180) – 28023 Madrid, Spain. Phone: (+34) 91 357 08 09 Fax: (+34) 91 357 29 13 Copyright © 2010 IESE Business School.
Working Paper
WP-846
March, 2010
IESE Business School-University of Navarra
The Public-Private Sector Research Center is a Research Center based at IESE Business School. Its mission is to develop research that analyses the relationships between the private and public sectors primarily in the following areas: regulation and competition, innovation, regional economy and industrial politics and health economics.
Research results are disseminated through publications, conferences and colloquia. These activities are aimed to foster cooperation between the private sector and public administrations, as well as the exchange of ideas and initiatives.
The sponsors of the SP-SP Center are the following:
Accenture Ajuntament de Barcelona Caixa Manresa Cambra Oficial de Comerç, Indústria i Navegació de Barcelona Consell de l’Audiovisual de Catalunya Departament d’ Economia i Finances de la Generalitat de Catalunya Departament d’ Innovació, Universitats i Empresa de la Generalitat de Catalunya Diputació de Barcelona Endesa Fundació AGBAR Garrigues Mediapro Microsoft Sanofi Aventis ATM, FGC y TMB
The contents of this publication reflect the conclusions and findings of the individual authors, and not the opinions of the Center's sponsors.
IESE Business School-University of Navarra
EUROPEAN COMMISSION DECISIONS ON ANTI-COMPETITIVE BEHAVIOR
Jordi Gual1
Núria Mas2
Abstract
This paper provides an analysis of all the European Commission’s decisions on anti-trust cases between January 1999 and February 2004. We use a unique dataset that contains information not only on the cases that were analyzed by the Commission and for which a decision was finally made public, but also on all the cases that were never pursued any further and those for which there is no final public decision. We have two goals. First, this data allows us, for the first time in the literature, to determine whether there is any type of bias in the selection process followed by the Commission when deciding which cases to pursue until a final decision is reached. Our results show that the selection of cases is not random and that it is quite efficient. Second, we can contribute to determine whether the criteria that have been shown by the economic literature to play an important role in anti-competitive behavior, are also important for the Commission’s decisions in anti-trust cases. Our results suggest that this is the case.
Keywords: anti-trust, competition, selection bias.
1 Professor, Economics, IESE
2 Assistant Professor, Economics, IESE
IESE Business School-University of Navarra
EUROPEAN COMMISSION DECISIONS ON ANTI-COMPETITIVE BEHAVIOR
1. Introduction The task of ensuring that there is free competition in the European Union (EU) has been entrusted to the European Commission by the Member States. Hence, the Commission, and more precisely the Directorate General for Competition (DG Comp), monitors and investigates suspected breaches of competition law. The Commission may prohibit certain firms’ conducts and impose conduct restraints and fines on the firms found guilty of anti-competitive practices. In the EU, competition policy is based on three main pillars: anti-trust, merger control and monitoring state aid. Our analysis focuses on anti-trust policy. In this context, the Commission is concerned with restrictive agreements and practices that imply an abuse of market power.
In this paper, we provide an analysis of all of the Commission’s decisions on anti-trust cases between January 1999 and February 2004. We use a unique dataset that contains information not only on the cases that were analyzed by the Commission and for which a decision was finally made public, but also on all the cases that were never pursued any further and those for which there is no final public decision. Our goal is twofold: first, we wish to understand the process that the Commission follows in its decisions by looking at which types of cases it decides to pursue. Second, we are interested in determining which industry characteristics have led the Commission to decide against an investigated firm on anti-trust grounds. In particular, our goal is to determine whether the Commission’s decisions are correlated to certain industry characteristics that economic theory predicts should affect anti-competitive behavior.
There is a very extensive industrial organization literature which provides the theoretical and empirical background that associates industry features with the likelihood of practices that restrict competition and the relationship between competition and economic efficiency and productivity. Nickell (1996) uses data on United Kingdom firms to show that competition leads
We thank Luis Cabral, Bruno Cassiman, Giulio Federico, Vivek Ghosal, Angel López and the participants of the CEPR Research Workshop for their comments. We are also grateful for the assistance received from officials at DGCOMP (European Commission) and for the outstanding research assistance provided by Mireia Raluy. Part of the data used in this paper comes from a report written under contract #COMP/A1/2003/Si2 355390 and was provided by the European Commission. All mistakes are our own. Núria Mas has financial support in the form of a grant from the Spanish Ministry of Education and Science SEJ2006-11833.
2 - IESE Business School-University of Navarra
to an improvement in productivity over time. Ahn (2002) concludes that competition encourages innovation and improves firms’ efficiency.
However, the literature that evaluates the decisions made by the competition authority is much scarcer and has focused mainly on the analysis of merger policy. Coate and McChesney (1992) look at 70 merger cases analyzed by the Federal Trade Commission and find that entry barriers were an important factor in blocking a merger, while the likelihood of future collusion was not. They concluded that many mergers were likely to be approved, even if they were above the critical level of concentration indicated in the “Merger Guidelines”. Weir (1993), in a similar study for the United Kingdom, uses a probit analysis to determine whether efficiency reasons were the main considerations taken into account by the Monopolies and Mergers Commission (MMC). The author found that a key element for blocking a merger bid was an expected decrease in competition. However, when he tried to determine which were the regular sources of competition taken into account by the MMC, he found a considerable degree of variability, concluding that the authorities were following a case-by-case approach. Khemani and Shapiro (1993) look at the decisions made by the Bureau of Competition Policy in Canada. Using a probit model, they conclude that concentration and market share are the most important determinants of the Bureau’s decisions, followed in importance by input competition and entry barriers. Davies et al. (1999) use data from 73 reports from the United Kingdom Monopolies and Mergers Commission (MMC). Applying a probabilistic model, the authors find that market share of the investigated firm is one of the main determinants of the MMC’s decisions. Their results also suggest that it is possible to predict the result of the MMC’s decisions with a high degree of accuracy. More recently, Bergman et al. (2003) look at the European Commission’s merger decision process and show that the probability of deciding against a merger increases with the parties’ market shares.
This paper contributes to the literature in several ways: first, to our knowledge, this is the first time that the availability of a unique data set has enabled analysis of the criteria used by the Commission when deciding which cases will be selected for further consideration. We can determine whether there is any type of bias in its selection and, if so, whether it would be justified by any economic rationale (for instance, studying more cases that take place in sectors with a high market power). Carree et al. (2008) provide a very extensive survey on the DGComp’s anti-trust decisions from 1957 to 2004, but they use only publicly available data and, consequently, they are not able to say much about the Commission’s case selection criteria. Second, we can contribute to determining whether the economic criteria that have been shown to play an important role in merger cases, are also important for the decisions on anti-trust cases.
The paper is structured in six sections. Section 2, after this introduction, provides background on the EU’s anti-trust policy. Section 3 develops and explains the methodology in detail. Section 4 discusses the variables which could either affect selection of the cases that the Commission decides to pursue or the existence and final detection of an infringement of Articles 81 and 82. The results are presented in Section 5 and Section 6 concludes.
IESE Business School-University of Navarra - 3
2. European Competition Law and the Commission’s Decision Process. Description of the Data
2.1. European Competition Law
In order to apply the anti-trust regulation, the European Commission counts on Articles 81 and 82 of the Treaty of the European Union (henceforth, EU Treaty), which prohibit restrictive agreements between undertakings, concerted practices to restrict or distort competition in the common market and abuses committed by undertakings holding a dominant position.
Article 81 deals with cartels and tacit collusion (explicit and non-explicit agreements between firms which have as an objective the restriction of competition, by means of delineation of markets, agreements not to reduce prices, etc.). It also deals with agreements between firms with the purpose of undertaking joint activities such as R&D, sharing of production facilities, joint ventures, etc. Hence, this article refers both to horizontal and vertical agreements and it includes agreements such as price fixing, market sharing, agreements that limit production, etc. It is commonly accepted in the economics literature that horizontal agreements are generally detrimental for social welfare, while that does not necessarily have to be the case for vertical agreements as these often contribute to enhanced efficiency. In order to take into account the fact that some agreements may be welfare-enhancing, the Commission has introduced some block exemptions for Article 81. These exemptions describe the conditions that certain agreements must satisfy in order for them to be allowed under Article 81. Current block exemptions refer to activities such as technology transfers or franchising agreements and some of them relate to particular sectors (transport). Exemptions are only given for a limited amount of time.
Article 82 prohibits abusive behavior. It includes practices such as price discrimination, tying and bundling, predation, exclusive dealership, exclusive territories or resale price maintenance.1 Introduction of many of the practices contemplated under this article can be justified on efficiency grounds, but all of them can also be used by dominant players to reduce competition in the market place, particularly in vertical or related markets. There are no exemptions for cases under Article 82.
Until recently, the procedural rules2 implementing Articles 81 and 82 of the EU Treaty provided for three ways of initiating action. Firstly, natural or legal persons who claim a legitimate interest may ask the Commission to take action against an agreement or a practice (complaints). Secondly, the Commission may take action on its own initiative (ex-officio procedure). Finally, agreements or practices could be notified to the Commission by at least one of the parties concerned (notification). This notification system has been discontinued.3
1 Note that other practices, for example price squeezes, can be understood as a combination (price discrimination and predation) of those included above.
2 Council Regulation N° 17 of 6 February 1962, OJ 13, 21.2.1962, p. 207.
3 The Council adopted a new Regulation implementing Articles 81 and 82 of the EC Treaty (Council Regulation (EC) No 1/2003 of 16 December 2002). This regulation replaces Regulation 17/62 and came into force on 1 May 2004. For the purpose of the present document, the main change to the procedural rules is that the new regime ends the notification system.
4 - IESE Business School-University of Navarra
Once a case has been evaluated, the Commission can reach four main conclusions from more to less serious: there can be an infringement of the law, the Commission can reject a complaint, it can issue a negative clearance (which grants permanent protection), or it can conclude that an exemption applies to that particular case (exemptions are only temporary).
2.2. The Commission’s Decision Process and Data
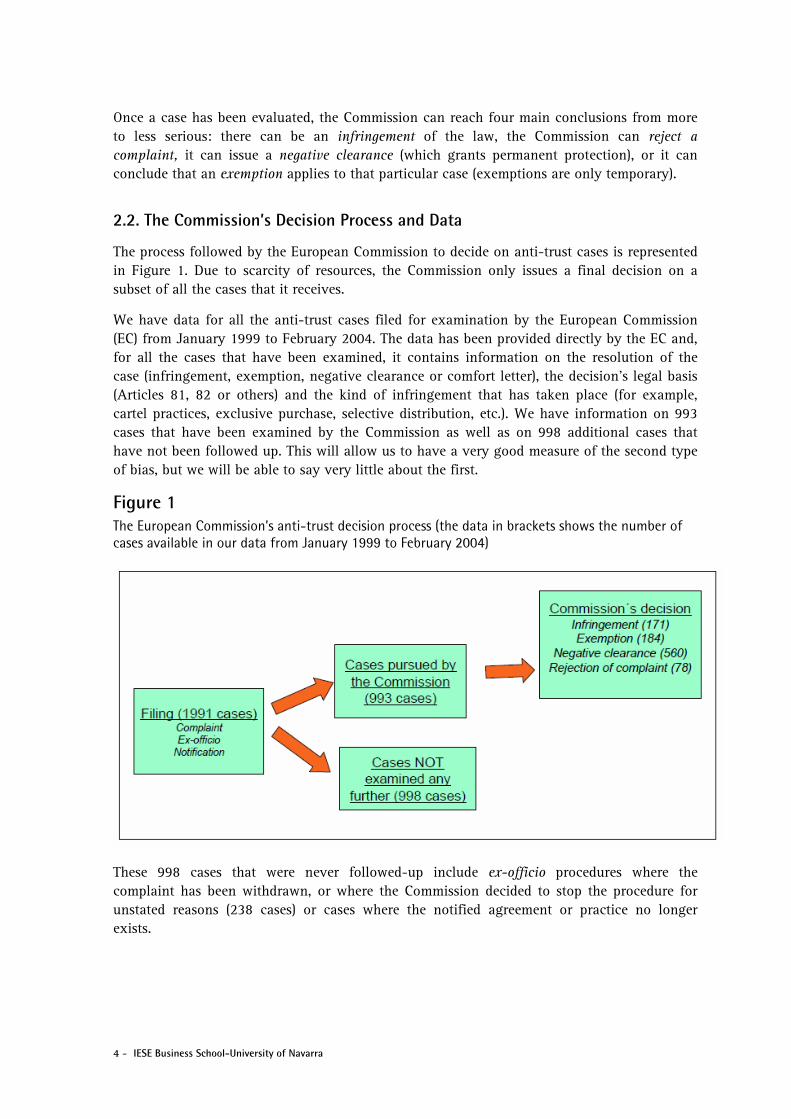
The process followed by the European Commission to decide on anti-trust cases is represented in Figure 1. Due to scarcity of resources, the Commission only issues a final decision on a subset of all the cases that it receives.
We have data for all the anti-trust cases filed for examination by the European Commission (EC) from January 1999 to February 2004. The data has been provided directly by the EC and, for all the cases that have been examined, it contains information on the resolution of the case (infringement, exemption, negative clearance or comfort letter), the decision’s legal basis (Articles 81, 82 or others) and the kind of infringement that has taken place (for example, cartel practices, exclusive purchase, selective distribution, etc.). We have information on 993 cases that have been examined by the Commission as well as on 998 additional cases that have not been followed up. This will allow us to have a very good measure of the second type of bias, but we will be able to say very little about the first.
Figure 1 The European Commission’s anti-trust decision process (the data in brackets shows the number of cases available in our data from January 1999 to February 2004)
These 998 cases that were never followed-up include ex-officio procedures where the complaint has been withdrawn, or where the Commission decided to stop the procedure for unstated reasons (238 cases) or cases where the notified agreement or practice no longer exists.
IESE Business School-University of Navarra - 5
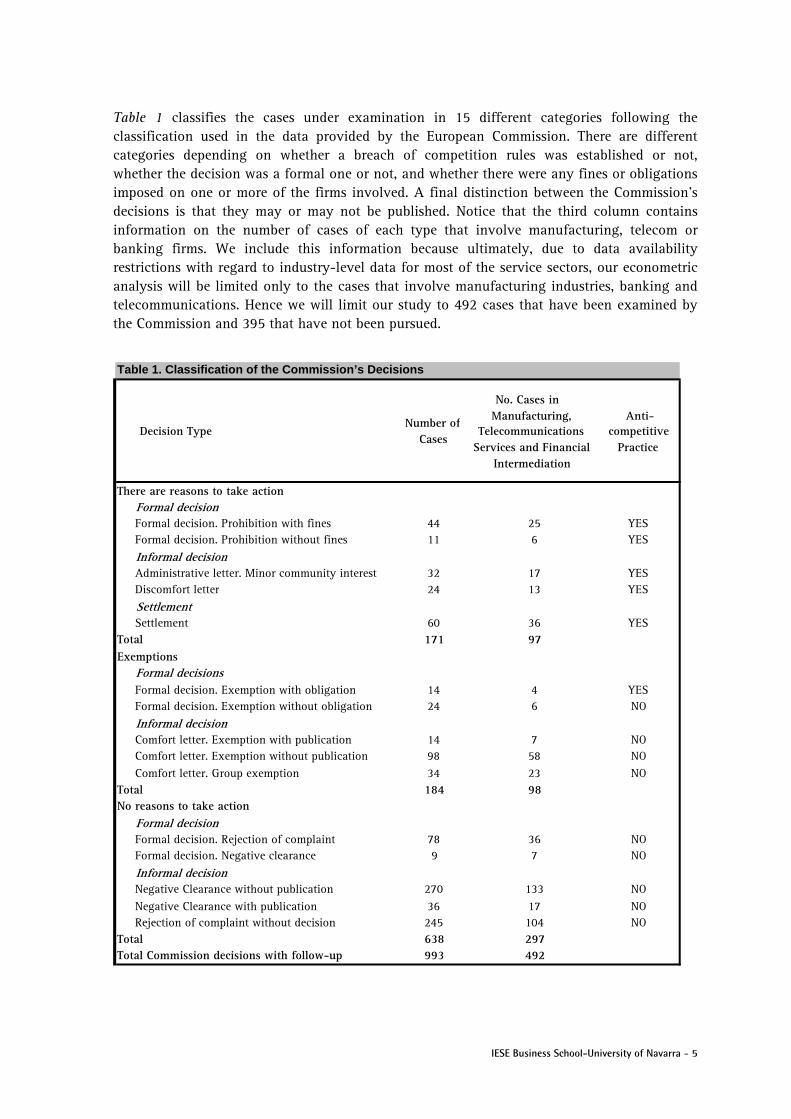
Table 1 classifies the cases under examination in 15 different categories following the classification used in the data provided by the European Commission. There are different categories depending on whether a breach of competition rules was established or not, whether the decision was a formal one or not, and whether there were any fines or obligations imposed on one or more of the firms involved. A final distinction between the Commission’s decisions is that they may or may not be published. Notice that the third column contains information on the number of cases of each type that involve manufacturing, telecom or banking firms. We include this information because ultimately, due to data availability restrictions with regard to industry-level data for most of the service sectors, our econometric analysis will be limited only to the cases that involve manufacturing industries, banking and telecommunications. Hence we will limit our study to 492 cases that have been examined by the Commission and 395 that have not been pursued.
Table 1. Classification of the Commission’s Decisions
Decision Type Number of Cases
No. Cases in Manufacturing,
Telecommunications Services and Financial
Intermediation
Anti- competitive
Practice
There are reasons to take action Formal decision Formal decision. Prohibition with fines 44 25 YES Formal decision. Prohibition without fines 11 6 YES Informal decision Administrative letter. Minor community interest 32 17 YES Discomfort letter 24 13 YES Settlement Settlement 60 36 YESTotal 171 97 Exemptions Formal decisions Formal decision. Exemption with obligation 14 4 YES Formal decision. Exemption without obligation 24 6 NO Informal decision Comfort letter. Exemption with publication 14 7 NO Comfort letter. Exemption without publication 98 58 NO Comfort letter. Group exemption 34 23 NO Total 184 98 No reasons to take action Formal decision Formal decision. Rejection of complaint 78 36 NO Formal decision. Negative clearance 9 7 NO Informal decision Negative Clearance without publication 270 133 NO Negative Clearance with publication 36 17 NO Rejection of complaint without decision 245 104 NO Total 638 297 Total Commission decisions with follow-up 993 492
6 - IESE Business School-University of Navarra
On the basis of the facts presented, the Commission has to decide whether a certain practice breaches competition rules or not. This information is captured in the form of a YES/NO dummy in the last column of Box 1 and it corresponds to our dependent variable. If the Commission comes to the conclusion that there are grounds to take action under Articles 81 or 82, it can then issue a formal decision or an informal one. Alternatively, the parties involved may decide to settle. In a formal decision, the Commission will prohibit the practice and may impose monetary penalties (fines) for the violation of the competition rules. The Commission issues informal decisions for actions that breach Articles 81 and/or 82 by means of an administrative letter or a discomfort letter (issued as an informal warning by the Commission). When the Commission decides that there are reasons to take action, this corresponds to a finding of anti-competitive behavior and the dependent variable of the regression analysis will take the value of 1.
Alternatively, after examining the facts, the Commission may decide that there is no reason to take action. This can be due to two possibilities: because the practice under examination does not restrict competition or because it falls under an exemption contemplated under the Block Exemption Regulation (BER) or under Article 81(3) of the EC Treaty. This article allows exemption from the prohibition established in Article 81(1) for some agreements if they create enough benefits to outweigh their anti-competitive effects. The BER provides conditions under which certain types of agreements are exempted from the prohibition in Article 81(1). Examples of block exemptions include car distribution agreements and technology transfer agreements.
The BER also provides automatic exemption from Article 81(1) to vertical agreements that involve companies with a market share less than 30%.
If the Commission concludes that there is no reason to take action because no anti-competitive practice has taken place, it can either reject the complaint or issue a negative clearance, either as a formal decision or informally. If it concludes that the practice under examination is subject to an exemption, the Commission can also communicate it formally or informally, using a comfort letter (administrative letters sent to the parties involved, confirming informally that the Commission sees no grounds for action).
Note that we codify the cases where an exemption has been applied as “NO”. Whenever an exemption is allowed, we assume, as we have been doing all along, that the Commission correctly ascertains that the practice under investigation does not pose a threat to competition, which is precisely why the exemption has been granted, i.e. because any possible competitive concern is outweighed by other efficiency gains. The only exception to this rule4 is the case of formal exemptions with obligations, since in that case it is assumed that the imposition of obligations indicates a breach of competition policy rules.
4 We were advised by Commission officials to classify this case as “YES”. Moreover, using a different rule for this group of decisions would not significantly change the results since it concerns a very limited number of cases.
IESE Business School-University of Navarra - 7
3. Methodology
3.1. Econometric Model and Specification
In this paper, we aim to determine how industry i (Xi) and case j (Cj) specific characteristics affect the Commission’s decisions on anti-trust and, in particular, whether these decisions are correlated with certain industry characteristics that are predicted by economic theory to affect anti-competitive behavior.
To do so, we follow two steps. First we look at whether there is any type of selection bias across sectors or types of cases that affects the decision to examine a case for a final decision. If we find a bias, we will analyze whether it is consistent with economic theory. Second, we will look at the final set of decisions. Our data will allow us to correct for any selection bias in our conclusions regarding the type of anti-trust decisions made by the Commission. To our knowledge, this type of correction has not been possible in any previous paper due to lack of data.
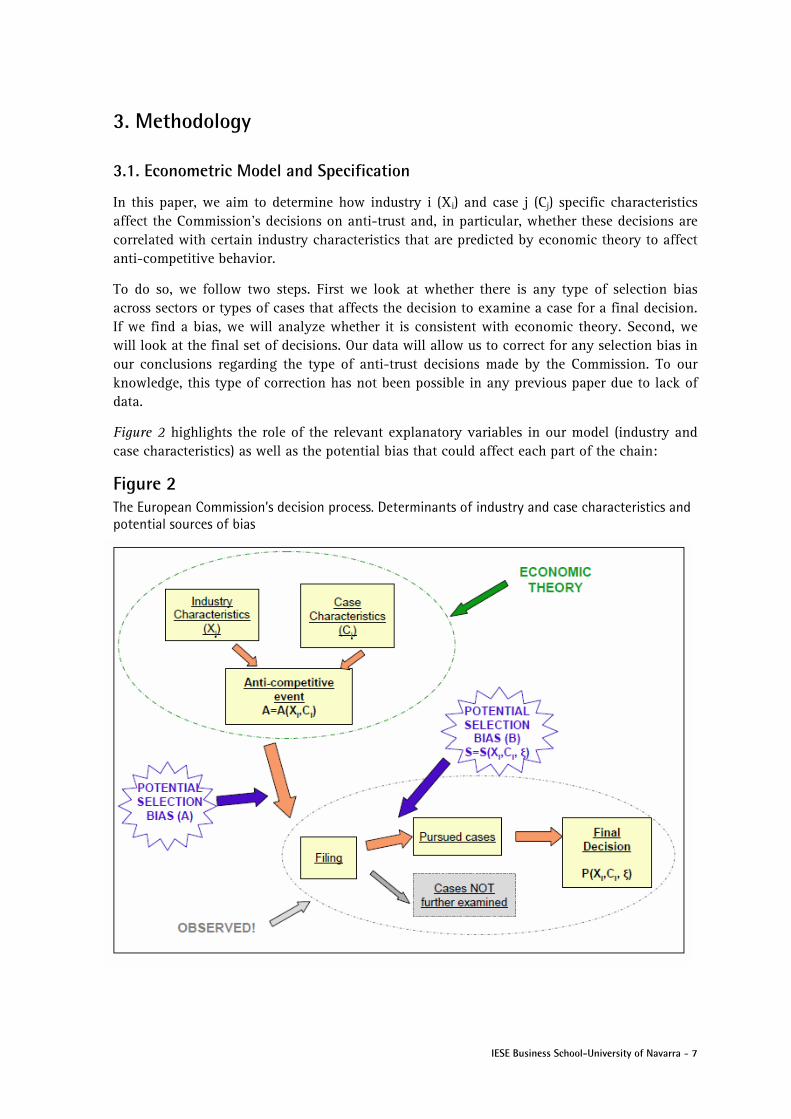
Figure 2 highlights the role of the relevant explanatory variables in our model (industry and case characteristics) as well as the potential bias that could affect each part of the chain:
Figure 2 The European Commission’s decision process. Determinants of industry and case characteristics and potential sources of bias
8 - IESE Business School-University of Navarra
For each potential anti-trust practice (such as collusion, predatory pricing, tying, etc.), there is an extensive theoretical literature in industrial organization indicating which are the industry characteristics X1, X2,…, Xn that make its occurrence more likely. Examples of such industry features are the industry’s concentration, the existence of entry barriers, market transparency, demand growth, etc.
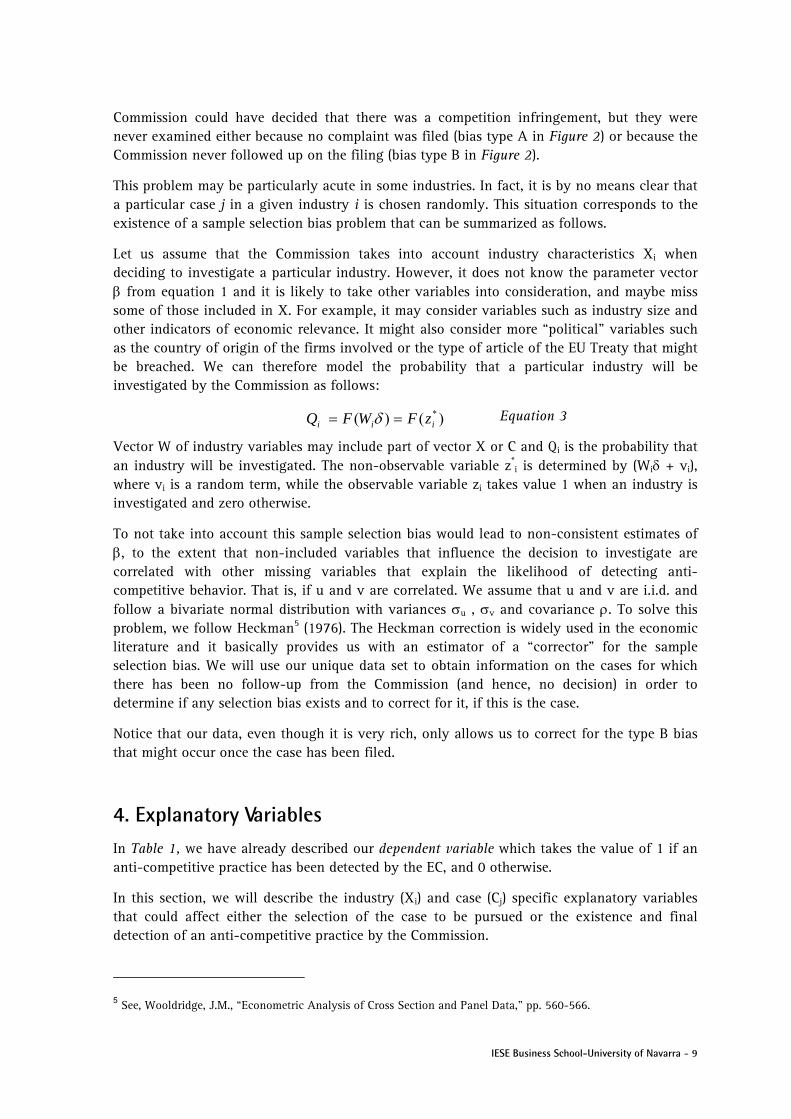
We use the theoretical predictions provided by the literature to specify and estimate a limited dependent variable model, where the probability Pij of detecting anti-competitive practices in industry i and case j is modeled as a function of a set of industry i characteristics Xi and case variables Cj such as the legal basis used or the type of anti-competitive practice that might have taken place:
Equation 1
F is the cumulative probability function, Xi are industry variables that determine the likelihood of an infringement, Cj are case-specific variables and , and are parameters.
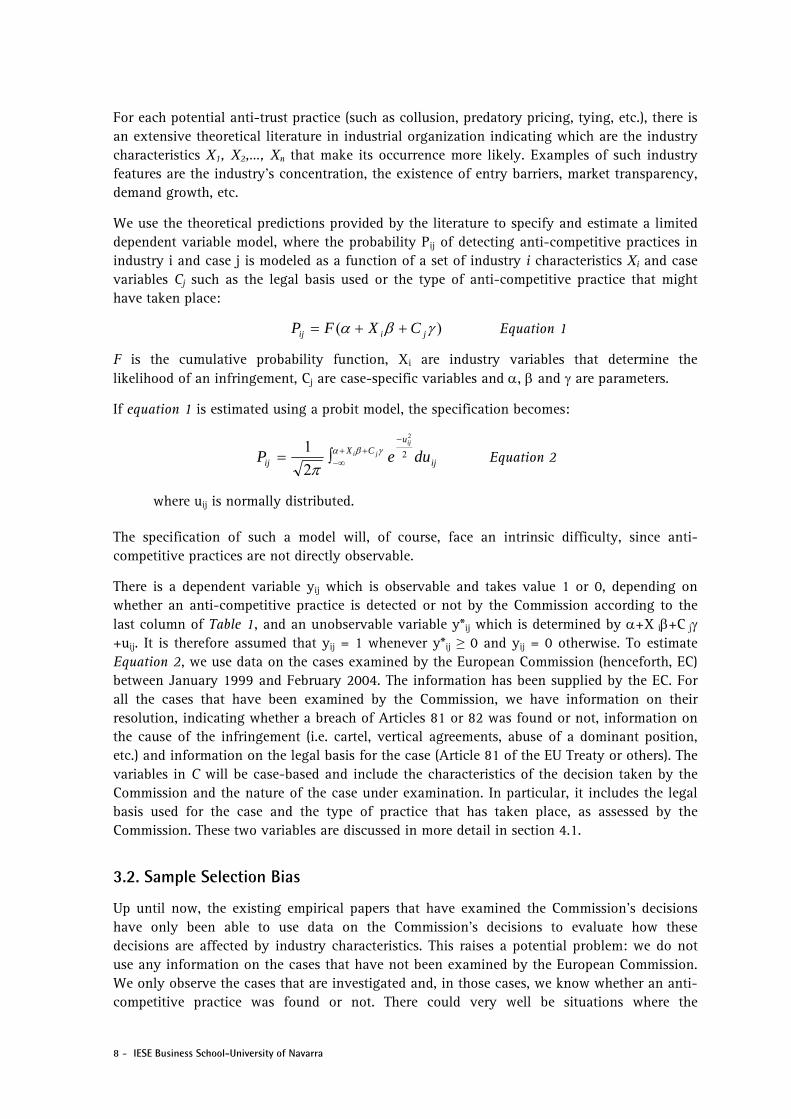
If equation 1 is estimated using a probit model, the specification becomes:
ij
uCX
ij duePij
ji 2
2
2
1
Equation 2
where uij is normally distributed.
The specification of such a model will, of course, face an intrinsic difficulty, since anti-competitive practices are not directly observable.
There is a dependent variable yij which is observable and takes value 1 or 0, depending on whether an anti-competitive practice is detected or not by the Commission according to the last column of Table 1, and an unobservable variable y*ij which is determined by +X i+C j +uij. It is therefore assumed that yij = 1 whenever y*ij ≥ 0 and yij = 0 otherwise. To estimate Equation 2, we use data on the cases examined by the European Commission (henceforth, EC) between January 1999 and February 2004. The information has been supplied by the EC. For all the cases that have been examined by the Commission, we have information on their resolution, indicating whether a breach of Articles 81 or 82 was found or not, information on the cause of the infringement (i.e. cartel, vertical agreements, abuse of a dominant position, etc.) and information on the legal basis for the case (Article 81 of the EU Treaty or others). The variables in C will be case-based and include the characteristics of the decision taken by the Commission and the nature of the case under examination. In particular, it includes the legal basis used for the case and the type of practice that has taken place, as assessed by the Commission. These two variables are discussed in more detail in section 4.1.
3.2. Sample Selection Bias
Up until now, the existing empirical papers that have examined the Commission’s decisions have only been able to use data on the Commission’s decisions to evaluate how these decisions are affected by industry characteristics. This raises a potential problem: we do not use any information on the cases that have not been examined by the European Commission. We only observe the cases that are investigated and, in those cases, we know whether an anti-competitive practice was found or not. There could very well be situations where the
)( jiij CXFP
IESE Business School-University of Navarra - 9
Commission could have decided that there was a competition infringement, but they were never examined either because no complaint was filed (bias type A in Figure 2) or because the Commission never followed up on the filing (bias type B in Figure 2).
This problem may be particularly acute in some industries. In fact, it is by no means clear that a particular case j in a given industry i is chosen randomly. This situation corresponds to the existence of a sample selection bias problem that can be summarized as follows.
Let us assume that the Commission takes into account industry characteristics Xi when deciding to investigate a particular industry. However, it does not know the parameter vector from equation 1 and it is likely to take other variables into consideration, and maybe miss some of those included in X. For example, it may consider variables such as industry size and other indicators of economic relevance. It might also consider more “political” variables such as the country of origin of the firms involved or the type of article of the EU Treaty that might be breached. We can therefore model the probability that a particular industry will be investigated by the Commission as follows:
Equation 3
Vector W of industry variables may include part of vector X or C and Qi is the probability that an industry will be investigated. The non-observable variable z*
i is determined by (Wi + vi), where vi is a random term, while the observable variable zi takes value 1 when an industry is investigated and zero otherwise.
To not take into account this sample selection bias would lead to non-consistent estimates of , to the extent that non-included variables that influence the decision to investigate are correlated with other missing variables that explain the likelihood of detecting anti-competitive behavior. That is, if u and v are correlated. We assume that u and v are i.i.d. and follow a bivariate normal distribution with variances u , v and covariance . To solve this problem, we follow Heckman5 (1976). The Heckman correction is widely used in the economic literature and it basically provides us with an estimator of a “corrector” for the sample selection bias. We will use our unique data set to obtain information on the cases for which there has been no follow-up from the Commission (and hence, no decision) in order to determine if any selection bias exists and to correct for it, if this is the case.
Notice that our data, even though it is very rich, only allows us to correct for the type B bias that might occur once the case has been filed.
4. Explanatory Variables In Table 1, we have already described our dependent variable which takes the value of 1 if an anti-competitive practice has been detected by the EC, and 0 otherwise.
In this section, we will describe the industry (Xi) and case (Cj) specific explanatory variables that could affect either the selection of the case to be pursued or the existence and final detection of an anti-competitive practice by the Commission.
5 See, Wooldridge, J.M., “Econometric Analysis of Cross Section and Panel Data,” pp. 560-566.
)()( *iii zFWFQ
10 - IESE Business School-University of Navarra
4.1. Variables Related to Anti-competitive Behavior
As indicated in the methodology, the selection of the industry and case variables is based on the considerable body of industrial organization literature available in this area. For each potential anti-trust problem we will turn to the literature, both theoretical and empirical, to determine the industry and case-level conditions under which such violations are more likely. We will then use suitable quantitative proxies for those conditions as our explanatory variables.
4.1.1. Case-specific variables
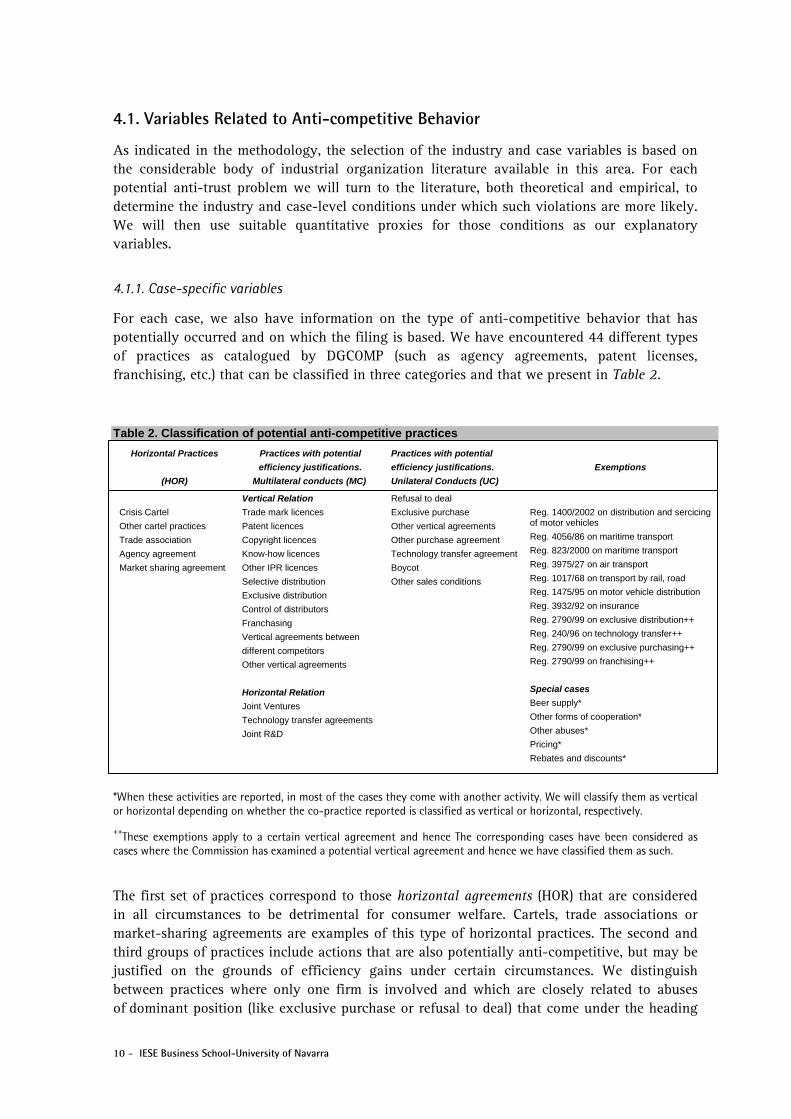
For each case, we also have information on the type of anti-competitive behavior that has potentially occurred and on which the filing is based. We have encountered 44 different types of practices as catalogued by DGCOMP (such as agency agreements, patent licenses, franchising, etc.) that can be classified in three categories and that we present in Table 2.
Table 2. Classification of potential anti-competitive practices
*When these activities are reported, in most of the cases they come with another activity. We will classify them as vertical or horizontal depending on whether the co-practice reported is classified as vertical or horizontal, respectively.
++These exemptions apply to a certain vertical agreement and hence The corresponding cases have been considered as
cases where the Commission has examined a potential vertical agreement and hence we have classified them as such.
The first set of practices correspond to those horizontal agreements (HOR) that are considered in all circumstances to be detrimental for consumer welfare. Cartels, trade associations or market-sharing agreements are examples of this type of horizontal practices. The second and third groups of practices include actions that are also potentially anti-competitive, but may be justified on the grounds of efficiency gains under certain circumstances. We distinguish between practices where only one firm is involved and which are closely related to abuses of dominant position (like exclusive purchase or refusal to deal) that come under the heading
Horizontal Practices
(HOR)
Practices with potential
efficiency justifications.
Multilateral conducts (MC)
Practices with potential
efficiency justifications.
Unilateral Conducts (UC)
Exemptions
Crisis Cartel
Other cartel practices
Trade association
Agency agreement
Market sharing agreement
Vertical Relation
Trade mark licences
Patent licences
Copyright licences
Know-how licences
Other IPR licences
Selective distribution
Exclusive distribution
Control of distributors
Franchasing
Vertical agreements between
different competitors
Other vertical agreements
Horizontal Relation
Joint Ventures
Technology transfer agreements
Joint R&D
Refusal to deal
Exclusive purchase
Other vertical agreements
Other purchase agreement
Technology transfer agreement
Boycot
Other sales conditions
Reg. 1400/2002 on distribution and sercicing of motor vehicles
Reg. 4056/86 on maritime transport
Reg. 823/2000 on maritime transport
Reg. 3975/27 on air transport
Reg. 1017/68 on transport by rail, road
Reg. 1475/95 on motor vehicle distribution
Reg. 3932/92 on insurance
Reg. 2790/99 on exclusive distribution++
Reg. 240/96 on technology transfer++
Reg. 2790/99 on exclusive purchasing++
Reg. 2790/99 on franchising++
Special cases
Beer supply*
Other forms of cooperation*
Other abuses*
Pricing*
Rebates and discounts*
IESE Business School-University of Navarra - 11
of unilateral conduct (UC), and practices with potential efficiency justifications involving several firms (such as exclusive distribution, franchising or joint ventures), which we denominate multilateral conducts (MC). Most of the practices with efficiency justification can be prosecuted under both Article 81 and Article 82.
Table 2 presents a complete list of the practices encountered. Notice that with this classification a practice belongs to only one of three mutually exclusive categories: a practice is either horizontal without an efficiency justification (HOR), vertical or horizontal with a potential efficiency justification (MC), or a unilateral abuse of a dominant position (UC).
Considering these broad general categories makes sense in terms of the analysis of the relevant industry determinants since most of the variables considered important by the economic literature do not vary across the 44 different practices and they are common for each of these three main categories. Moreover, there is also an additional advantage: in some instances, more than one practice is reported for the same case. 24% of the cases have been reported with more than one anti-competitive practice being considered by the Commission and only 4.9% have been reported with more than two anti-competitive practices. In particular, there are five practices, labeled “pricing,” “other abuses,” “other forms of cooperation,” “beer supply” and “rebates and discounts”, where the coding could correspond to either a horizontal practice with no efficiency justification or a practice that could be efficiency enhancing. Since it is impossible to determine to which of them these cases refer, we will use as a reference the other practices reported for the same case and we will classify the five previous practices depending on the category of the co-practices for the case in question.
For the rest of the situations where more than one practice is reported, most of them can be classified within the same general category. Only ten of the cases report practices that could be classified in two different groups6.
Finally, the last column of Table 2 includes the existing types of block exemptions. As previously discussed, exemptions are not considered as a third type of practice. Rather, this heading captures cases where the benefits of a practice outweigh its potential anti-competitive effects. We have also included them in Table 2 because in some cases a certain practice is only classified according to the exemption that applied to it. We can use the type of exemption to approximate the kind of practice that the Commission was considering. This would be the case of exemptions on exclusive distribution, technology transfer, exclusive purchasing or franchising.
In our empirical specification, to determine the elements that affect the Commission’s final decision, we will include the type of practice that has taken place as control factor.
Type of practice (MC and UC)
We include dummy variables that take into account the type of practice being considered in each case. In particular, we consider the three mutually exclusive categories that have been defined in the previous section. We distinguish between horizontal agreements with no efficiency justification, vertical and horizontal agreements with efficiency justification and
6 We have run our regressions with and without these ten cases and no major differences have been encountered.
12 - IESE Business School-University of Navarra
abuses of dominant position. We will include a binary variable (MC) that equals one if the practice is a vertical restraint or a horizontal agreement with efficiency justification and zero otherwise. Similarly, another binary variable (UC) takes the value 1 whenever a practice falls under the heading of abuse of dominant position. Horizontal practices with no efficiency justification will be the excluded category.
As we will see when discussing the main industry characteristics to be considered, the literature on industrial organization provides a set of relevant industry explanatory variables for determining the existence of anti-competitive practices. These relevant factors do not differ that much across different types of anti-competitive behaviors. However, these same explanatory variables can have a different impact depending on the kind of practice we are considering. For instance, in general, one would expect that practices where efficiency considerations are important would be less likely (given the industry’s characteristics) to lead to a finding of anti-competitive practice. The inclusion of MC and UC dummies will allow us to take this into account. In particular, we expect both dummies to have a negative effect on the probability of an anti-competitive practice taking place. Moreover, in some cases, the industry-level determinants have an opposite effect, when we are considering practices that could also have an efficiency-enhancing justification, from when we are considering horizontal agreements. To capture this, these binary variables will be interacted with some of the explanatory factors.
With the inclusion of these two dummies, we establish horizontal practices (HOR) as our benchmark for comparison on the Commission’s decisions.
Italy Dummy (IT). There may be several reasons why the Commission might deviate from the prescription of economic theory in its decisions, such as the existence of “political” variables. Following the previous literature (see, for instance, Bergman et al., 2003) and because our period of analysis includes the Italian leadership, we have included a dummy equal to one if one of the firms involved in the case had Italian headquarters. If the Commission follows economic theory principles when evaluating possible anti-competitive behaviors, IT should not be statistically different from zero.
4.1.2. Industry-specific variables
Following the prescriptions of economic theory regarding whether industry characteristics have an effect on anti-competitive behavior, we include the following industry-level explanatory variables in our econometric analysis: concentration, asymmetry of firms, entry barriers, product differentiation, demand growth and trade exposure. A summary of the data used is presented in Table A.1 in the Appendix.
Concentration (CONC): We expect concentration in the market to positively affect the probability that an industry presents anti-competitive practices or agreements. With a higher degree of firm concentration in the market, it is easier for them to collude or for one of them to abuse its market power. Concentration is measured as the output of the industry’s five leading firms as a share of the total EU output.
Asymmetry between firms (ASYM): The more asymmetry there is between firms, the less likelihood there is that they will collude. The more different the firms are, the more difficult it might be for them to agree to a common pricing policy. Moreover, given a collusive price, the incentives to deviate are much higher for the low-cost ones (or for those that offer a higher
IESE Business School-University of Navarra - 13
quality product). Finally, when firms are not very similar, it becomes very hard for them to identify any deviation from the collusive behavior and hence, the probability of being caught if a firm deviates from the agreement is lower. This reduces the likelihood of cooperative agreements. It must be noted, however, that when there is substantial asymmetry, it may become easier for the leading firm or firms to exploit their dominant position. Therefore, in this case, although the explanatory variable (ASYM) is important and the same for all practices, the sign is exactly the opposite for practices that qualify as abuses of dominant position. In order to take this into account in the econometric model, we will interact this variable with a dummy variable equal to one if the practice is a unilateral conduct of abuse of dominant position (UC, see below). Hence, we expect ASYM to have a negative sign and the interaction of ASYM*UC to be positive.
We do not have a direct measure of firm asymmetry. However, Eurostat’s Structural Business Statistics7 contains information on the number of firms in a certain size bracket8 as well as on the total value added of the firms of a certain size. In order to approximate asymmetry between firms in one industry, we will compute the average size of a firm in each of the brackets (average value added per firm), as well as the average size of the industry and we will use the standard deviation as a measure of asymmetry. The larger the standard deviation, the higher the asymmetry. Since the average size differs greatly across industries, the standard deviation varies considerably across them simply because of the size effect. In order to take this into account, we use a normalized measure of asymmetry across NACE3 with mean 0 and variance 1.
Entry Barriers (CAP): The harder it is for new firms to enter the market, the easier it is to sustain anti-competitive practices. We use a measure of capital intensity as a proxy for entry barriers. If the Commission’s decisions follow the predictions of economic theory, CAP should have a positive sign.
There are several data sources that provide information on the capital intensity of industries at the 3 digit Nace level. The data analysis uses the following: European Commission (1994) and the WIFO taxonomy of Peneder (1999). Both data sets have been used extensively in the industrial organization literature and by the European Commission (see the EC Competitiveness Reports 2000 and 2001).
Product Differentiation (RD and ADV): The more differentiated the products in an industry, the less likely it is that anti-competitive behavior will take place since companies focus their competition on characteristics other than price and the diminished price rivalry can lead to a reduced need to soften competition by coordination between companies. Nevertheless, it is very difficult to measure product differentiation. These general statements apply to a world where products are “exogenously” differentiated, and in that case, one would expect a negative relationship between the likelihood of an anti-competitive practice and measures of product differentiation.
A broader model for product differentiation, however, should take into account the fact that differentiation is itself a source of market power, and therefore it is developed endogenously by companies, through investment in R&D and advertising assets (see Sutton, 1991). R&D
7 The dataset used in this paper corresponds to 2001.
8 We have 11 different size brackets.
14 - IESE Business School-University of Navarra
investment often leads to new product introductions, and advertising to the differentiation of existing products or services. Both investments in intangibles involve different degrees of sunk costs and can become important entry barriers, thus leading potentially to the observance of less competitive behavior. As Sutton (1991) has shown, both R&D and advertising competition can lead – through what is known as endogenous sunk cost competition- to concentration of a given industry and it is therefore not surprising that in the past both R&D and advertising spending have also been considered good proxies for entry barriers.
In practice, this means that we will introduce both R&D and advertising intensity as independent regressors. However, we will also interact them with the measure of industry concentration. Given a particular level of concentration, the higher the level of R&D (or advertising intensity) the less impact concentration will have on the probability of anti-competitive practice, since concentration is the result of strong competition in sunk advertising or R&D spending.9
Demand Growth (DEM): we expect demand growth to be positively related to the probability of anti-competitive behavior (Ivaldi et al., 2003). This is so because, for a fixed number of players in a growing market, the profits from deviating today are small compared to future profits, when the market is much bigger and, therefore, when the potential profits from colluding could be much larger.10 The data used comes from the Structural Business Statistics (SBS) produced by Eurostat. The period considered is 1999-2001.
Trade exposure (TRADE): In general, we would expect that industries where imports represent an important part of total domestic consumption to be industries where the likelihood of anti-competitive behavior is lower. To analyze this issue, we construct a variable TRADE that measures the weight of extra-EU imports on EU-wide apparent domestic consumption (that is, production minus exports plus imports). This variable has been constructed with data from Unido (production data) and Eurostat (trade). The figures correspond to 2000.
4.2. Variables for the Sample Selection Equation
One of the main advantages of our data set is that it allows us access not only to the cases where a public decision has been reached, but also to the cases that were never followed up by the Commission. This allows us to test whether there is any type of bias in the Commission’s decisions not only for the cases that it pursues but also for the cases that it decides not to take any further. This is, to our knowledge, the first time that such a selection bias has been empirically studied for the Commission’s anti-trust decisions.
In order to determine which variables can be relevant for the sample selection equation, we have had conversations with the relevant Commission officials. We were told that in this first stage, the decisions are made based more on general sector and case characteristics than on the specificity of every firm involved. Also, apparently, most of the decisions to investigate are
9 The interaction did not come out as statistically significant for the case of advertising. As discussed later in the results, this may indicate that this variable captures mostly product differentiation and not entry barriers.
10 Notice, however, that this conclusion from the literature is subject to the assumption of a fixed number of players. It could very well be the case that entry (and therefore the likely breakdown of collusion) is easier in growing markets. In order to control for this, it is important to consider also entry barriers in our econometric specification since in a market with low barriers, demand growth might encourage entry and obstruct collusion.
IESE Business School-University of Navarra - 15
motivated by leniency applications (30%) or complaints (60%), and the ex officio investigations represent only 10%. Moreover, only about 10% of complaints are in fact investigated while most of the leniency cases are. So the right question to ask in order to estimate whether a sample selection bias occurs is what determines leniency applications, and what determines both complaints and their acceptance. As for leniency applications, the leniency regime is in place since 1996, and was strengthened in 2002, which substantially increased the number of applications. Our data set includes the period from January 1999 to February 2004 and therefore probably includes a substantial number of cases investigated due to leniency applications. However, the industry-level determinants of a leniency application are bound to be very similar to the industry-level determinants of the existence of a cartel. It is very unlikely therefore that we will find a new and different regressor through the leniency route which can be used in the sample selection equation, given that the main determinants of a cartel are already included as explanatory variables in Equation 1.
As for the determinants of complaints, in general we are likely to observe complaints precisely in industries where there are industry conditions that facilitate infringements. The key point is, therefore: when will the Commission accept a complaint? First of all, many complaints are rejected because they are poorly drafted. Second, they may be rejected if they do not have “a Community interest.” What this means is that the size of the industry in question, or the geographical scope, implies that the infringement – if it exists – is rather small in magnitude or is geographically limited, and could be dealt with by national courts. These determinants are well captured by the variables industry size (SIZE) and importance of intra-EU trade in the sector (INTRA). The size of the industry is measured as turnover (source: SBS from Eurostat, year 2001), and the importance of intra-EU trade is measured as intra-EU imports over total EU apparent consumption (same source and year as TRADE).
Another important dimension has a sectorial nature. Other things being equal, the Commission may react more favorably to complaints coming from end users than from intermediate consumers. In practice, this may imply that consumer-oriented industries (i.e., those with a larger role for advertising) may be subject to more scrutiny. In order to capture this consumer good effect, we will include an advertising variable (ADV).
The nature of the infringement is another criterion for the decision to consider the complaint, and cartel behavior in particular is almost always prosecuted. To capture this possibility, we will include a case-based variable to capture the cartel effect (the variable ART defined below). Finally, when accepting a complaint the Commission also considers broad information about the market, but this is no different from what is done in the ex officio procedure.
Legal Basis (ART): This variable is case-specific. For 885 of the 993 cases, the information provided by the EC also includes the legal basis used. This could be Article 81, 82 or other articles in the EC Treaty, or a combination of more than one article. In 68% of the cases, Article 81 was the only one considered while in 9% of them, the legal basis included both Articles 81 and 82. On the other hand, only 10% of the cases include Article 81 as the only legal basis considered, but 28% of the cases included Article 82 in their legal basis.
It is important to include this characteristic as an explanatory factor of the decision to investigate because an investigation under a certain article implies that the Commission already assumes that certain characteristics exist that may have lead to a certain problem. We have included a dummy which takes the value 1 if Article 81 has been applied, and 0
16 - IESE Business School-University of Navarra
otherwise, because this captures the idea that the Commission is more likely to investigate cases that may potentially lead to the prosecution of cartel-type behavior.
Finally, there may be several reasons why the Commission might deviate from the prescription of the economic theory on its decisions, such as the existence of “political” variables. To take this into account, we will consider the Italy Dummy (IT) previously discussed as well as a dummy that is equal to 1 if at least one of the firms involved has its headquarters in either Germany or France (FRGE), to take into account the possibility that a case that affects a firm whose headquarters are in one of the two largest European countries might be looked at differently for political reasons.
In sum, after examining in detail the Commission decision to investigate, we conclude that the sample selection equation should include not only variables capturing size (SIZE) and intra-EU trade (INTRA), but also an advertising variable capturing the consumer good effect (ADV), and a case-based variable to capture the cartel effect (ART). Finally, we will also include the country dummies (IT, FRGE) to control for other political variables.
4.3. The Empirical Model
Pij = F ( + MCij + UCij + CONCj + ASYMj + (ASYMj*UCij) + CAPj +
+ RDj + (RDj*CONCj) + ADVj + DEMj + TRADEj+ITij)
The above specification reflects the fact that the relevant industry-level explanatory variables suggested by the industrial organization literature are the same for all anti-competitive practices. However, it also allows us to control for the fact that these characteristics can have different effects in different types of practices. In this respect, the positive signs that correspond to concentration, capital intensity and R&D intensity conform with the explanations provided above with regards to their inclusion in the regression. And the same goes for the negative sign on demand growth and trade. We also include the interaction of CONC and RD. The interpretation of this last parameter is as follows. + RD indicates how the probability of anti-competitive practice changes with an increase in CONC and + CONC indicates how the probability of anti-competitive practice changes with an increase in RD intensity. We expect and to be positive, but the parameter to be negative.
This implies that the effect of increased concentration on the probability of anti-competitive behavior is smaller in high R&D intensive industries, because part of that concentration reflects endogenous sunk cost competition. Similarly, the anti-competitive effect of increased R&D intensity (through the creation of entry barriers) should be smaller for concentrated industries, for the same reason.
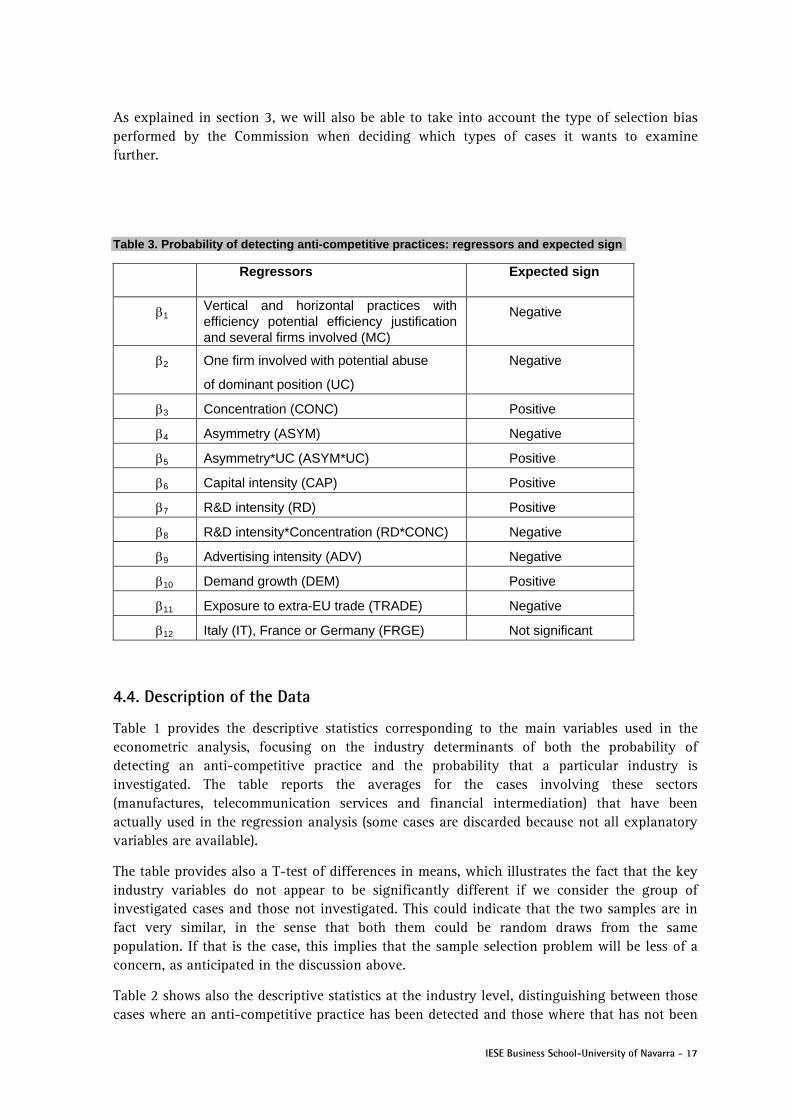
We also include practice-specific parameters. As explained previously, we expect the parameters for both MC and UC to be negative since, given a set of industry determinants, the likelihood of anti-competitive practices is lower whenever efficiency considerations are taken into account. These practice specific parameters also allow us to control for the fact that some of the industry-level explanatory variables can have different effects depending on the anti-competitive practice that we are analyzing. Consider the effect of asymmetry. In general, it is negative. However, it should be positive whenever we consider unilateral conducts of abuse of dominant positions (UC). This implies that even if �� is negative, we expect ( + to be positive. Table 3 summarizes the expected signs of each of the parameters.
IESE Business School-University of Navarra - 17
As explained in section 3, we will also be able to take into account the type of selection bias performed by the Commission when deciding which types of cases it wants to examine further.
Table 3. Probability of detecting anti-competitive practices: regressors and expected sign
Regressors Expected sign
1 Vertical and horizontal practices with efficiency potential efficiency justification and several firms involved (MC)
Negative
2 One firm involved with potential abuse
of dominant position (UC)
Negative
3 Concentration (CONC) Positive
4 Asymmetry (ASYM) Negative
5 Asymmetry*UC (ASYM*UC) Positive
6 Capital intensity (CAP) Positive
7 R&D intensity (RD) Positive
8 R&D intensity*Concentration (RD*CONC) Negative
9 Advertising intensity (ADV) Negative
10 Demand growth (DEM) Positive
11 Exposure to extra-EU trade (TRADE) Negative
12 Italy (IT), France or Germany (FRGE) Not significant
4.4. Description of the Data
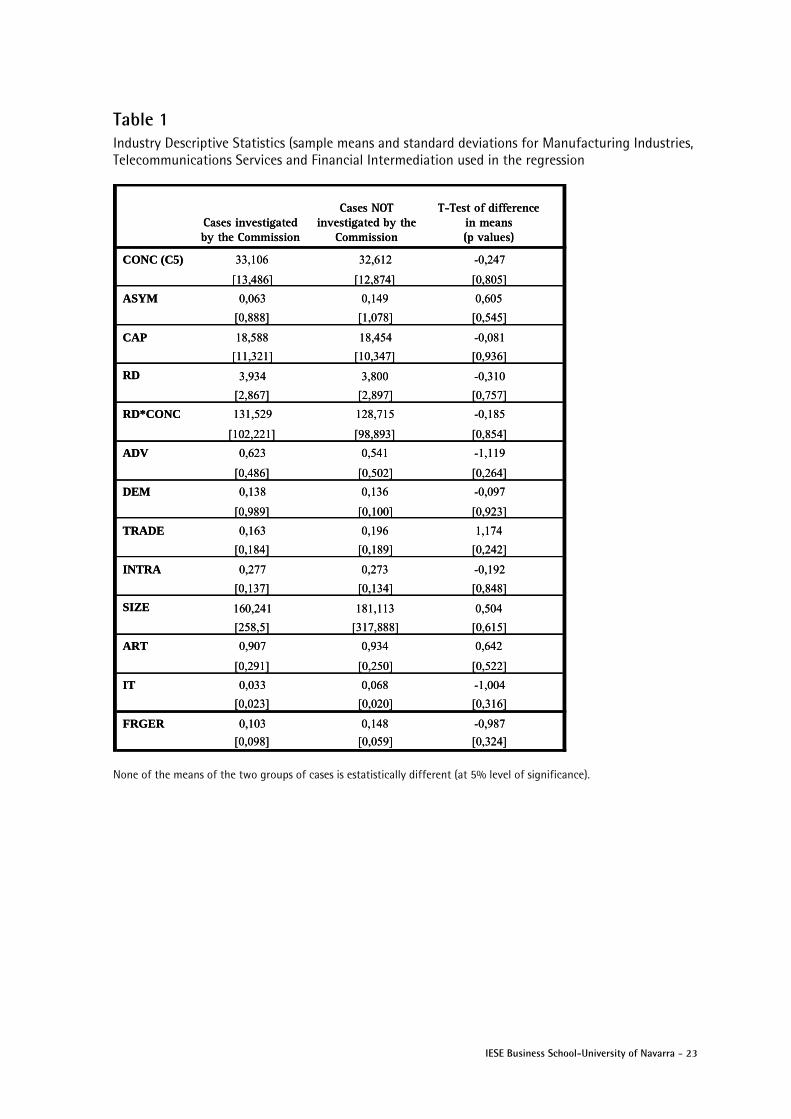
Table 1 provides the descriptive statistics corresponding to the main variables used in the econometric analysis, focusing on the industry determinants of both the probability of detecting an anti-competitive practice and the probability that a particular industry is investigated. The table reports the averages for the cases involving these sectors (manufactures, telecommunication services and financial intermediation) that have been actually used in the regression analysis (some cases are discarded because not all explanatory variables are available).
The table provides also a T-test of differences in means, which illustrates the fact that the key industry variables do not appear to be significantly different if we consider the group of investigated cases and those not investigated. This could indicate that the two samples are in fact very similar, in the sense that both them could be random draws from the same population. If that is the case, this implies that the sample selection problem will be less of a concern, as anticipated in the discussion above.
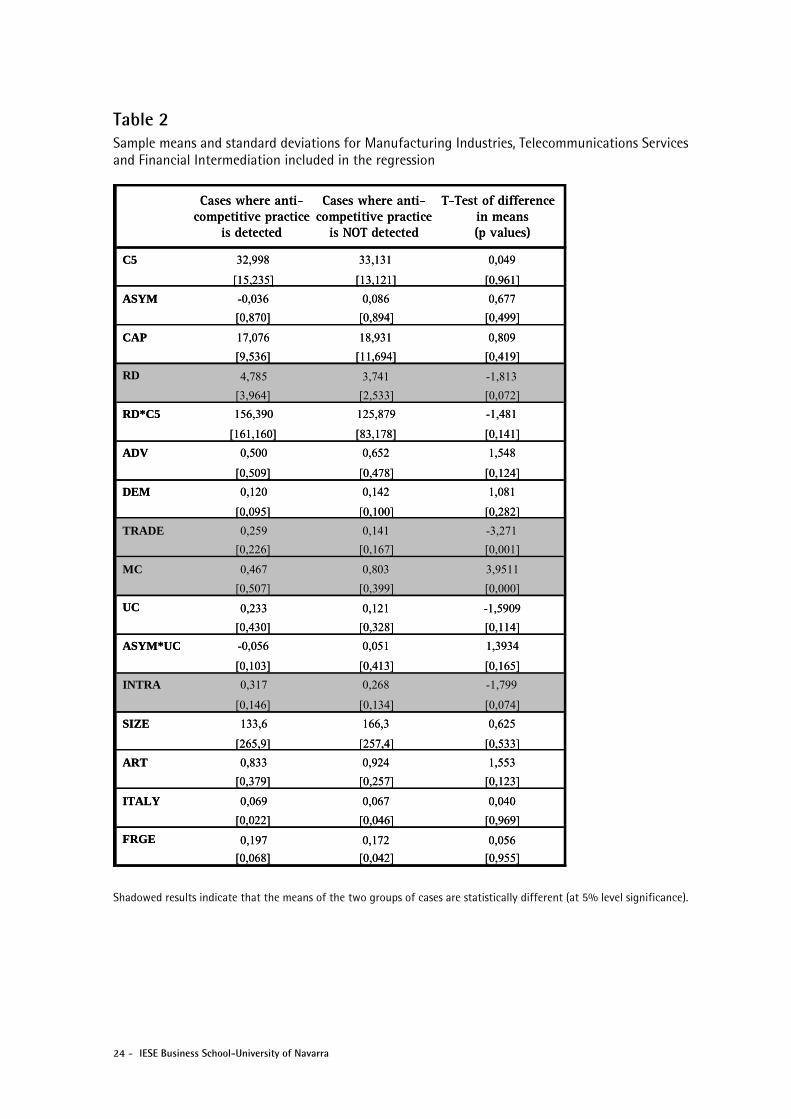
Table 2 shows also the descriptive statistics at the industry level, distinguishing between those cases where an anti-competitive practice has been detected and those where that has not been
18 - IESE Business School-University of Navarra
the case. As before, the information is provided for all cases involving the manufacturing industry and the telecommunications services and financial intermediation sectors that have been used in the regression analysis due to data availability. Here, the data already presents some significant differences between those cases where the Commission found an anti-competitive behavior and those where it did not.
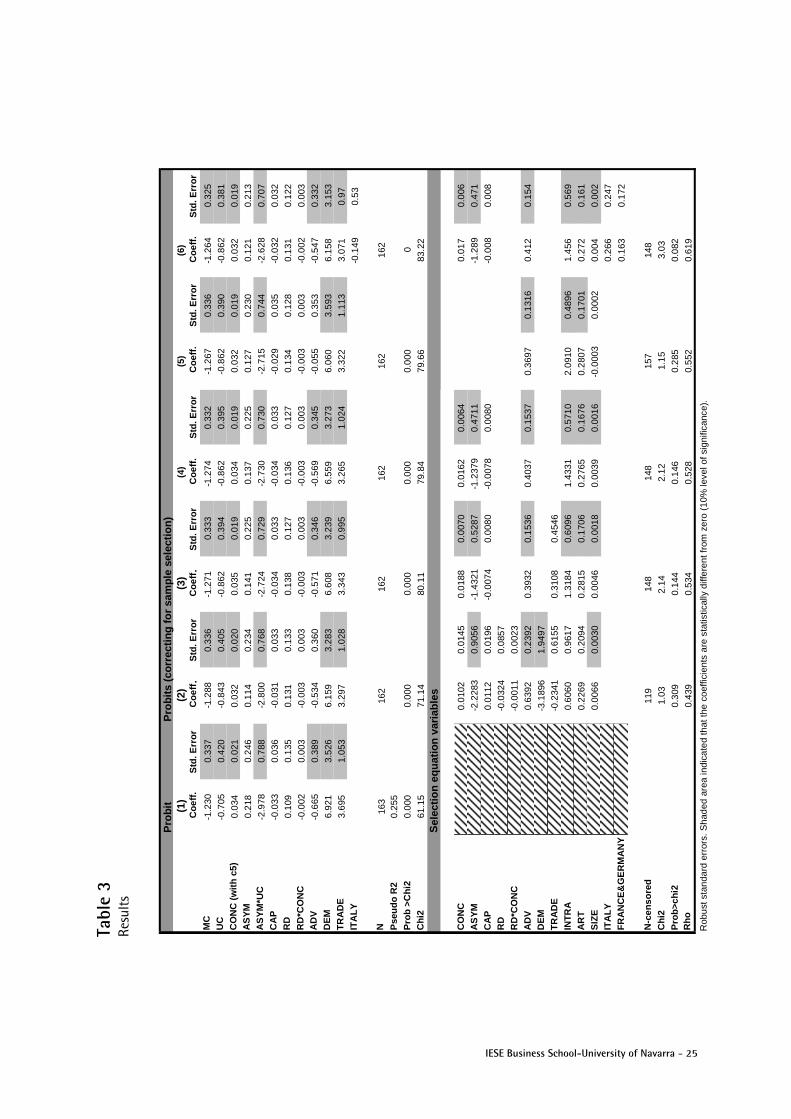
5. Results Table 3 presents the results of the analysis, with estimation of both the main model alone (specification 1) and of the main model plus the sample selection equation (specifications from 2 to 6). All regressions have been estimated using standard errors corrected for potential heteroscedasticity problems, given the cross-sectional nature of the database. Several alternative specifications for both the main equation and the selection have been tested and the parameters have been found to be very stable across the different specifications. The results of Table 3 confirm that the model’s overall fit is quite good: most of the parameters are statistically significant and have the expected sign.
5.1. Selection of Filed Cases to Examine
The results of the selection equations confirm that the cases chosen to be pursued further by the Commission are not random. As expected from Section 4.2 of this paper, the Commission is more likely to evaluate a case if it affects a large industry (SIZE). It also appears to be more inclined to examine it if it might directly affect the welfare of the final consumer (captured by ADV) or if there is some concern about a cartel (ART). In this sense, this type of bias goes towards the cases in which, according to the predictions of economic theory, it is more likely that an infringement is taking place or in which the potential infringement could have a more negative effect on consumer welfare.
Given that the time and resources of the DGComp are limited, this type of bias could be considered an “efficient” one, since more of these resources are being devoted where they might be needed most. However, the existence of such a selection bias also implies that, if we do not take it into account, we would be overestimating the probability of the Commission concluding that an infringement in anti-trust has taken place.
It is also interesting to notice that the Italy dummy is not significant, indicating that potential political reasons for a bias are not relevant here. The France or Germany dummy is not significant either.
5.2. Relevance of Economic Criteria for the Commission’s Decisions:
The results of the equations in Table 3 indicate that criteria that have been shown to be important by economic theory for anti-trust decisions are take into account by the Commission.
As expected, the coefficients for both MC and UC are negative, indicating that for a given set of industry determinants, when we take efficiency considerations into account, there is a lower likelihood of anti-competitive practices. Moreover, the MC coefficient is significantly more negative than the UC coefficient. This allows us to establish a clear ranking across the three
IESE Business School-University of Navarra - 19
types of practices regarding their likelihood of leading to a negative decision by the Commission: all other things being equal, the most likely practices to lead to a decision of anti-competitive behavior are the horizontal ones without an efficiency justification, followed by those that could imply a multilateral abuse of dominant position and, finally, those that could have a potential efficiency justification and that involve more than one firm.
Our results also confirm the fact that anti-competitive practices are more likely to take place in more concentrated industries (CONC). The coefficient for ADV is negative, indicating that where there is more product differentiation, there is a lower incentive to undertake restrictive practices. Also, as expected, demand growth (DEM) increases the likelihood of an anti-competitive behavior in the industry.
There are, however, two regressors that do not present the expected sign: the one corresponding to trade exposure and ASYM*ADP. Regarding the coefficient for TRADE, it is apparent that the selected variable is probably a very crude measure of the competitive pressure exerted by foreign competition,11 and therefore it is probably capturing other omitted variables.
As indicated in section 4.1, we expected the ASYM*UC coefficient to be positive. In fact, if we only consider the manufacturing industries, this is exactly the case (see results in Appendix B). However, when we include telecommunication services (NACE 642) and financial intermediation (NACE 651 and 652), the coefficient’s sign becomes negative indicating that, given a certain level of asymmetry, an abuse of dominant position is more easily tolerated in these industries since it may be naturally explained by the industries’ economics and history. For instance, in telecommunication services, the cost structure of some of its players and the regulatory tradition explain that certain firms play a dominant role in the market. A similar situation arises with the financial intermediation industry, where historical reasons have allowed some of the firms to have a leading role in their domestic market.
The Italy dummy is not significant, which confirms the fact that the Commission follows mostly economic criteria when deciding on anti-trust behavior.
Interpretation of the results
Since we have estimated a probit model, the parameters of Table 3 cannot be readily interpreted in terms of the magnitude of the effect of changes in the explanatory variables on the probability of detecting anti-competitive behavior. In this model, the change in the probability caused by a change in any of the coefficients will depend on where we start. As a starting point, in Table 4 we evaluate each independent variable on the dependent variable at the mean of the data and report what would be the new sample mean of the dependent variable (the estimated probability) if there was a change of one standard deviation for each of the explanatory variables.
As expected, the model predicts that the probability of detecting an anti-competitive behavior by the Commission is higher when we are considering cases with a potential horizontal practice without efficiency justification, followed by those where there is unilateral conduct
11 It does not include, for example, the role of non-EU firms based in the EU and, therefore, the role of intra-firm trade.
20 - IESE Business School-University of Navarra
and, finally, those where an efficiency justification exists and several firms are involved. In fact, the Commission is 7 times more likely to decide against a horizontal practice than against one with a potential efficiency justification. With regard to horizontal practices, Table 4 shows clearly that the strongest quantitative impact on the likelihood of detecting anti-competitive behavior comes from changes in the extra-EU trade and concentration variables. It is interesting to note also that the impact of the advertising and CAP variables, which work in the opposite direction, is also very important (however the interpretation of the magnitude also has to take into account the coefficient’s statistical significance and the coefficient for CAP is not significantly different from zero in Table 3, so the parameter is less reliable). This highlights the fact that it is important to assess market structure variables taking into consideration also the nature of competition in each industry, and making sure that the effect of product differentiation and competition through new product development, as factors which soften the tendency towards anti-competitive practices, is properly recognized.
If we consider unilateral and multilateral practices with potential efficiency justifications, the most important independent variables are more or less the same, but it is worth indicating that in most cases, changes in the independent variable appear to have a relatively stronger effect on the estimated probability than in the benchmark case.
6. Conclusions This paper has focused on understanding the importance of industry and case-specific characteristics for the decision process followed by the European Commission when evaluating potential anti-trust practices.
First, the availability of a unique data set has allowed us to shed some light on the characteristics that the DGComp takes into account when selecting the cases it will pursue until a final decision is reached. Our results show that this selection is not random and that the Commission, which has limited resources, focuses more on the cases where, according to the predictions of economic theory, an infringement is more likely to take place or where such an infringement could have a more negative effect on consumer surplus. In this sense, its case selection corresponds to an efficient use of resources and it goes in the desirable direction. However, the existence of such a non-random selection of cases implies that, if we only look at the public data (as the existing empirical papers have done so far), we are overestimating the probability of the European Commission deciding that an anti-trust infringement has taken place.
Second, we also explore whether the economic criteria that the literature has predicted to be important for anti-competitive behaviors, are correlated with the Commission’s decisions. Our results suggest that, by and large, this seems to be the case and that political variables do not seem to play a significant role. As expected, the Commission is more inclined to judge against the cases that involve a horizontal practice than those that imply a potential unilateral abuse of dominant position or a multilateral practice that could have efficiency justifications. Moreover, as we would expect from the economics literature, it is more likely to decide against a practice that involves a highly concentrated industry or an industry with high demand growth. However, it is less likely to decide against a sector with lots of advertising.
Our results also confirm that the Commission is more likely to tolerate a potential abuse of dominant position given a certain asymmetry level, in sectors such as financial intermediation
IESE Business School-University of Navarra - 21
and telecommunication services, where such asymmetry may be easily explained by these industries’ economics and regulatory history.
There are, inevitably, some caveats in our analysis. Two points, in particular, are of our concern and both are related to data availability. The first involves our definition of the product market. In this analysis, we have considered as relevant market that corresponding to the industry as defined by its NACE 3-digit code. This definition is needed if we want to measure most of our variables, particularly concentration and trade. Unfortunately, due to data constraints, we have not been able to use alternative product market definitions.
A second possible criticism of this study is that we have not covered all services due to data availability. Nevertheless, the model’s good performance for all the sectors considered provides some confidence regarding the ability to apply the methodology for a broader range of industries, even if the information available at the sector level is more limited.
Finally, it would be extremely interesting to undertake a similar study including firm-specific information on top-of-industry characteristics. This would allow us to take into account the effect of actual competitive interaction between companies in the marketplace on anti-trust infringements.
22 - IESE Business School-University of Navarra
References Ahn, C. (2002), “Competition, innovation and productivity growth: a review of theory and
evidence,” OECD Document Number ECO/WKP(2002)3.
Bergman, M. A. et al. (2003), “An Econometric Analysis of the European Commission’s Merger Decisions, mimeo.
Carree, M. et al. (2008), “European anti-trust policy 1957-2004: an analysis of Commission Decisions,” forthcoming Review of Industrial Organization.
Coate, M.B. and F.S. McChesney (1992), “Empirical Evidence on FTC Enforcement of the Merger Guidelines,” Economic Inquiry, 30, pp. 277-293.
Davies, S. et al. (1999), “Monopoly in the UK: What Determines Whether the MMC Finds Against the Investigated Firms,”, The Journal of Industrial Economics, 47 (3).
Davies, S. and B. Lyons (1996), “European Industrial Organization,” Edward Elgar.
European Commission (1994), “The economic interpenetration between the European Union and Eastern Europe,” European Economy, Reports and Studies nº 6.
European Commission (2000), “Competitiveness Report 1999,” Brussels.
European Commission (2001), “Competitiveness Report 2000,” Brussels.
Gual, J. (2004), “The integration of EU banking markets,” in “Building a dynamic Europe” (ed. J. Gual), Cambridge University Press, Cambridge, 2004.
Hay, G. and Kelley, D. (1974), “An Empirical Survey of Price Fixing Conspiracies,” Journal of Law and Economics, 17, pp. 13-38.
Ivaldi, M et al. (2003), “The Economics of Tacit Collusion,” Final Report for DG Competition, European Commission.
Khemani, R. S. and D.M. Shapiro (1993), “An Empirical Analysis of Canadian Merger Policy,” The Journal of Industrial Economics, 41, pp. 161-177.
Nickell (1996), “Competition and corporate performance,” Journal of Political Economy, 104, pp. 724-746.
Peneder, M. (1999), “Intangible Investment and Human Resources, The new WIFO taxonomy of manufacturing industries,” WIFO Working Papers #114, May.
Sutton, J. (1991), “Sunk Costs and Market Structure,” MIT Press, Boston, MA.
Symeonidis, G. (2003), “In Which Industries is Collusion More Likely? Evidence from the UK,” Journal of Industrial Economics, March.
Weir, C. (1993), “Merger Policy and Competition: an Analysis of the Monopolies and Mergers Commission’s Decisions,” Applied Economics, 25, pp. 57-66.
Wooldridge, J.M. (2002), “Econometric Analysis of Cross Section and Panel Data,” MIT Press, Cambridge.
IESE Business School-University of Navarra - 23
Table 1 Industry Descriptive Statistics (sample means and standard deviations for Manufacturing Industries, Telecommunications Services and Financial Intermediation used in the regression
None of the means of the two groups of cases is estatistically different (at 5% level of significance).
CONC (C5) 33,106 32,612 -0,247
[13,486] [12,874] [0,805]
ASYM 0,063 0,149 0,605
[0,888] [1,078] [0,545]
CAP 18,588 18,454 -0,081
[11,321] [10,347] [0,936]
RD 3,934 3,800 -0,310
[2,867] [2,897] [0,757]
RD*CONC 131,529 128,715 -0,185
[102,221] [98,893] [0,854]
ADV 0,623 0,541 -1,119
[0,486] [0,502] [0,264]
DEM 0,138 0,136 -0,097
[0,989] [0,100] [0,923]
TRADE 0,163 0,196 1,174
[0,184] [0,189] [0,242]
INTRA 0,277 0,273 -0,192
[0,137] [0,134] [0,848]
SIZE 160,241 181,113 0,504
[258,5] [317,888] [0,615]
ART 0,907 0,934 0,642
[0,291] [0,250] [0,522]
IT 0,033 0,068 -1,004
[0,023] [0,020] [0,316]
FRGER 0,103 0,148 -0,987
[0,098] [0,059] [0,324]
Cases NOT T-Test of differenceCases investigated investigated by the in meansby the Commission Commission (p values)
24 - IESE Business School-University of Navarra
Table 2 Sample means and standard deviations for Manufacturing Industries, Telecommunications Services and Financial Intermediation included in the regression
Shadowed results indicate that the means of the two groups of cases are statistically different (at 5% level significance).
C5 32,998 33,131 0,049
[15,235] [13,121] [0,961]
ASYM -0,036 0,086 0,677
[0,870] [0,894] [0,499]
CAP 17,076 18,931 0,809
[9,536] [11,694] [0,419]
RD 4,785 3,741 -1,813
[3,964] [2,533] [0,072]
RD*C5 156,390 125,879 -1,481
[161,160] [83,178] [0,141]
ADV 0,500 0,652 1,548
[0,509] [0,478] [0,124]
DEM 0,120 0,142 1,081
[0,095] [0,100] [0,282]
TRADE 0,259 0,141 -3,271
[0,226] [0,167] [0,001]
MC 0,467 0,803 3,9511
[0,507] [0,399] [0,000]
UC 0,233 0,121 -1,5909
[0,430] [0,328] [0,114]
ASYM*UC -0,056 0,051 1,3934
[0,103] [0,413] [0,165]
INTRA 0,317 0,268 -1,799
[0,146] [0,134] [0,074]
SIZE 133,6 166,3 0,625
[265,9] [257,4] [0,533]
ART 0,833 0,924 1,553
[0,379] [0,257] [0,123]
ITALY 0,069 0,067 0,040
[0,022] [0,046] [0,969]
FRGE 0,197 0,172 0,056
[0,068] [0,042] [0,955]
Cases where anti- Cases where anti- T-Test of differencecompetitive practice competitive practice in means
is detected is NOT detected (p values)
IESE Business School-University of Navarra - 25
Tabl
e 3
Res
ult
s
P
rob
it
Pro
bit
s (c
orr
ecti
ng
fo
r sa
mp
le s
elec
tio
n)
(1)
(2)
(3)
(4)
(5)
(6)
Co
eff
. S
td. E
rro
r C
oe
ff .
Std
. Err
or
Co
eff.
Std
. Err
or
Co
eff
.S
td. E
rro
r C
oe
ff.
Std
. Err
or
Co
eff
. S
td. E
rro
r M
C
- 1.2
30
0.3
37
-1.2
88
0.3
36
-1.2
71
0.3
33
-1.2
74
0.3
32
- 1.2
67
0.3
36
-1.2
64
0.3
25
UC
- 0.7
05
0.4
20
-0.8
43
0.4
05
-0.8
620.
394
-0.8
620.
395
- 0.8
62
0.3
90
-0.8
620.
381
CO
NC
(w
ith
c5
) 0.
034
0.
021
0.
032
0.
020
0.
035
0.
019
0.
034
0.
019
0.
032
0.
019
0.
032
0.
019
A
SY
M
0.2
18
0.2
46
0.1
14
0.2
34
0.1
41
0.2
25
0.1
37
0.2
25
0.1
27
0.2
30
0.1
21
0.2
13
AS
YM
*UC
- 2.9
78
0.7
88
-2.8
00
0.7
68
-2.7
24
0.7
29
-2.7
30
0.7
30
- 2.7
15
0.7
44
-2.6
28
0.7
07
CA
P
- 0.0
33
0.0
36
-0.0
31
0.0
33
-0.0
34
0.0
33
-0.0
34
0.0
33
- 0.0
29
0.0
35
-0.0
32
0.0
32
RD
0.1
09
0.1
35
0.1
31
0.1
33
0.1
38
0.1
27
0.1
36
0.1
27
0.1
34
0.1
28
0.1
31
0.1
22
RD
*CO
NC
- 0.0
02
0.0
03
-0.0
03
0.0
03
-0.0
03
0.0
03
-0.0
03
0.0
03
- 0.0
03
0.0
03
-0.0
02
0.0
03
AD
V
- 0.6
65
0.3
89
-0.5
34
0.3
60
-0.5
71
0.3
46
-0.5
69
0.3
45
- 0.0
55
0.3
53
-0.5
47
0.3
32
DE
M
6.9
21
3.5
26
6.1
59
3.2
83
6.6
08
3.2
39
6.5
59
3.2
73
6.0
60
3.5
93
6.1
58
3.1
53
TR
AD
E
3.6
95
1.0
53
3.2
97
1.0
28
3.3
430.
995
3.2
651.
024
3.3
22
1.1
13
3.0
710.
97
ITA
LY
-0.1
49
0.5
3
N
163
16
2
162
162
162
16
2 P
seu
do
R2
0.2
55
Pro
b >
Ch
i2
0.0
00
0.0
00
0.0
00
0.0
00
0.0
00
0 C
hi2
61.1
5
71.1
4
80.1
1 79
.84
79.6
6
83.2
2 S el
ecti
on
eq
uat
ion
var
iab
les
CO
NC
0.0
102
0.0
145
0.
018
8 0.
007
0 0.
016
2 0.
006
4 0.
017
0.
006
A
SY
M
-2.2
283
0.
905
6
-1.4
321
0.5
287
-1.2
379
0.4
711
-1.2
890.
471
CA
P
0.0
112
0.0
196
-0
.007
4 0.
008
0 -0
.007
8
0.0
080
-0.0
08
0.0
08
RD
-0.0
324
0.
08 5
7
RD
*CO
NC
-0.0
011
0.
002
3
AD
V
0.6
392
0.2
392
0.
393
2 0.
153
6 0.
403
7 0.
153
7 0.
369
7
0.1
316
0.
412
0.
154
D
EM
-3.1
896
1.
949
7
TR
AD
E
-0.2
341
0.
615
5
0.3
108
0.4
546
INT
RA
0.6
060
0.9
617
1.
318
4 0.
609
6 1.
433
1 0.
571
0 2.
091
0
0.4
896
1.
456
0.
569
A
RT
0.2
269
0.2
094
0.
281
5 0.
170
6 0.
276
5 0.
167
6 0.
280
7
0.1
701
0.
272
0.
161
S
IZE
0.0
066
0.0
030
0.
004
6 0.
001
8 0.
003
9 0.
001
6 - 0.
000
3
0.0
002
0.
004
0.
002
IT
AL
Y
0.2
660.
247
FR
AN
CE
&G
ER
MA
NY
0.1
63
0.1
72
N - ce
ns
ore
d
119
14
8 14
8 15
7
148
Ch
i2
1.0
3
2.1
4 2.
12
1.1
5
3.0
3 P
rob
>c
hi2
0.3
09
0.1
44
0.1
46
0.2
85
0.0
82
Rh
o
0.4
39
0.5
34
0.5
28
0.5
52
0.6
19
Rob
ust
sta
nda
rd e
rror
s. S
had
ed a
rea
indi
cate
d th
at t
he c
oef
ficie
nts
are
sta
tistic
ally
diff
ere
nt f
rom
ze
ro (
10%
leve
l of s
igni
fican
ce).
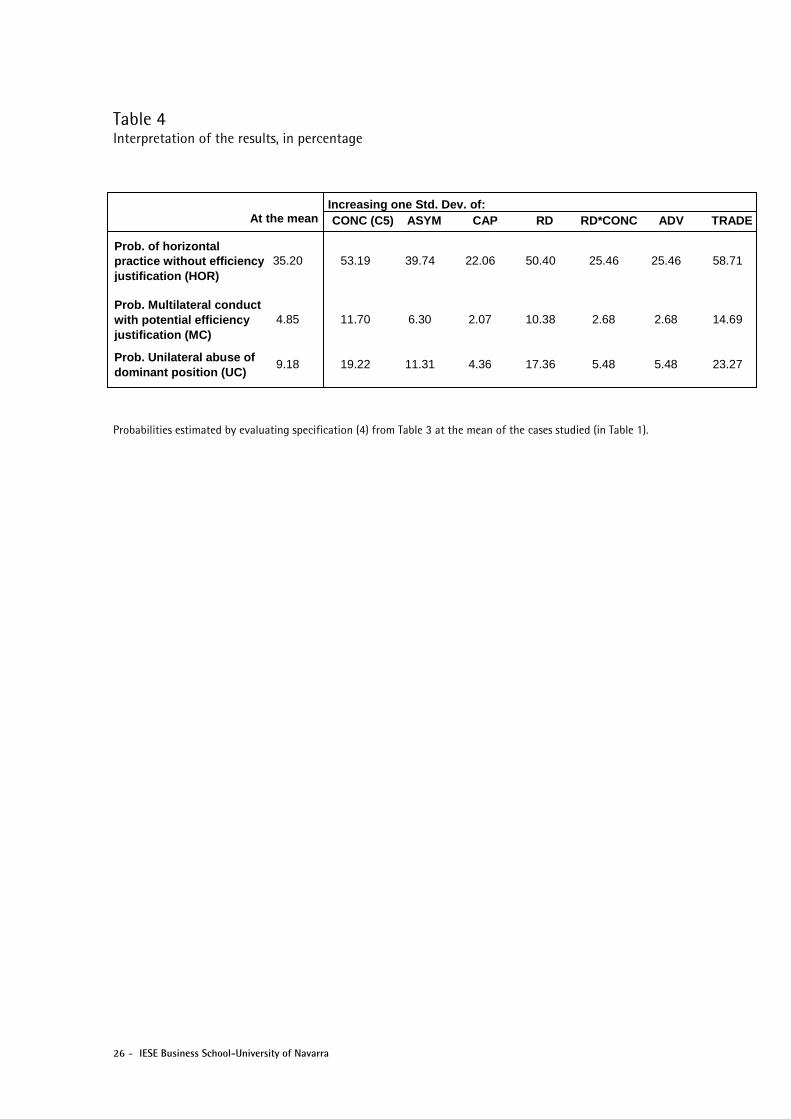
26 - IESE Business School-University of Navarra
Table 4 Interpretation of the results, in percentage
Probabilities estimated by evaluating specification (4) from Table 3 at the mean of the cases studied (in Table 1).
Increasing one Std. Dev. of:At the mean CONC (C5) ASYM CAP RD RD*CONC ADV TRADE
Prob. of horizontal practice without efficiency justification (HOR)
35.20 53.19 39.74 22.06 50.40 25.46 25.46 58.71
Prob. Multilateral conduct with potential efficiency justification (MC)
4.85 11.70 6.30 2.07 10.38 2.68 2.68 14.69
Prob. Unilateral abuse of dominant position (UC)
9.18 19.22 11.31 4.36 17.36 5.48 5.48 23.27
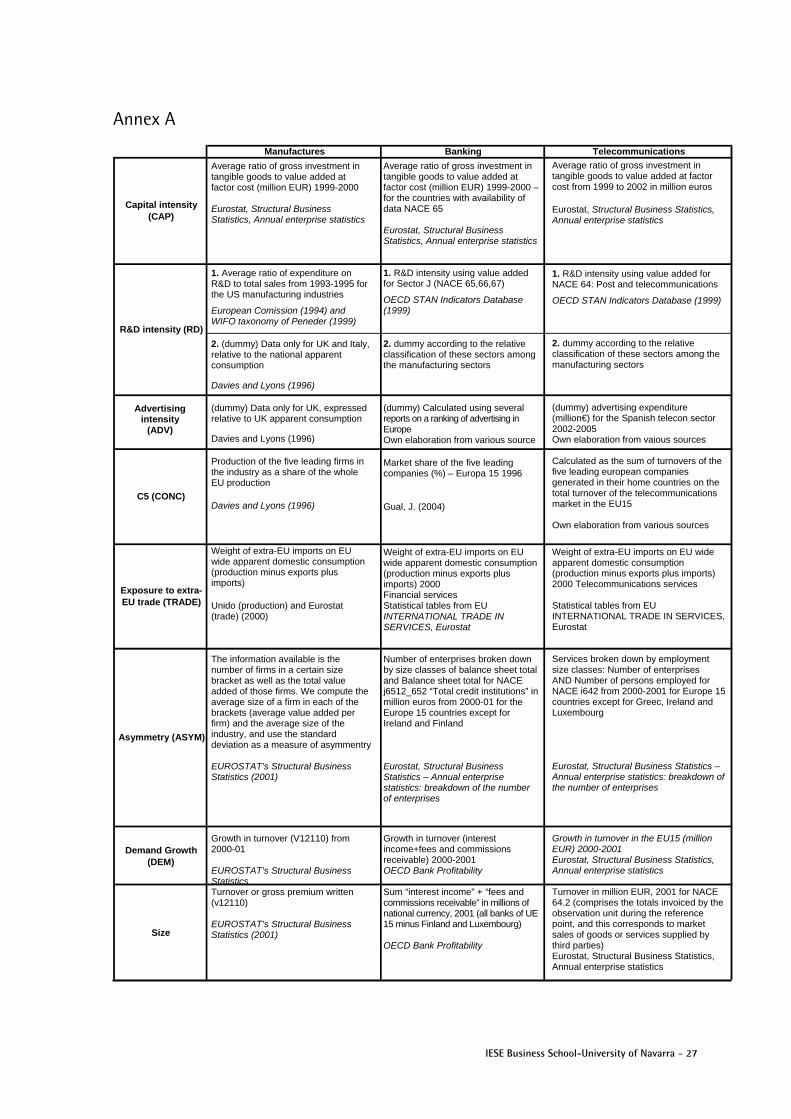
IESE Business School-University of Navarra - 27
Annex A
Manufactures Banking Telecommunications
Exposure to extra- EU trade (TRADE)
Asymmetry (ASYM)
Demand Growth (DEM)
Size
Capital intensity (CAP)
R&D intensity (RD)
Advertising intensity
(ADV)
C5 (CONC)
Average ratio of gross investment in tangible goods to value added at factor cost from 1999 to 2002 in million euros
Eurostat, Structural Business Statistics, Annual enterprise statistics 1. R&D intensity using value added for NACE 64: Post and telecommunications
OECD STAN Indicators Database (1999) 2. dummy according to the relative classification of these sectors among the manufacturing sectors (dummy) advertising expenditure (million€) for the Spanish telecon sector 2002-2005 Own elaboration from vaious sources Calculated as the sum of turnovers of the five leading european companies generated in their home countries on the total turnover of the telecommunications market in the EU15 Own elaboration from various sources
Weight of extra-EU imports on EU wide apparent domestic consumption (production minus exports plus imports) 2000 Telecommunications services Statistical tables from EU INTERNATIONAL TRADE IN SERVICES, Eurostat Services broken down by employment size classes: Number of enterprises AND Number of persons employed for NACE i642 from 2000-2001 for Europe 15 countries except for Greec, Ireland and Luxembourg Eurostat, Structural Business Statistics – Annual enterprise statistics: breakdown of the number of enterprises Growth in turnover in the EU15 (million EUR) 2000-2001 Eurostat, Structural Business Statistics, Annual enterprise statistics Turnover in million EUR, 2001 for NACE 64.2 (comprises the totals invoiced by the observation unit during the reference point, and this corresponds to market sales of goods or services supplied by third parties) Eurostat, Structural Business Statistics, Annual enterprise statistics
Average ratio of gross investment in tangible goods to value added at factor cost (million EUR) 1999-2000 Eurostat, Structural Business Statistics, Annual enterprise statistics 1. Average ratio of expenditure on R&D to total sales from 1993-1995 for the US manufacturing industries
European Comission (1994) and WIFO taxonomy of Peneder (1999)
2. (dummy) Data only for UK and Italy, relative to the national apparent consumption
Davies and Lyons (1996)
(dummy) Data only for UK, expressed relative to UK apparent consumption
Davies and Lyons (1996)
Production of the five leading firms in the industry as a share of the whole EU production
Davies and Lyons (1996)
Weight of extra-EU imports on EU wide apparent domestic consumption (production minus exports plus imports)
Unido (production) and Eurostat (trade) (2000) The information available is the number of firms in a certain size bracket as well as the total value added of those firms. We compute the average size of a firm in each of the brackets (average value added per firm) and the average size of the industry, and use the standard deviation as a measure of asymmentry EUROSTAT’s Structural Business Statistics (2001)
Growth in turnover (V12110) from 2000-01 EUROSTAT’s Structural Business Statistics Turnover or gross premium written (v12110) EUROSTAT’s Structural Business Statistics (2001)
Average ratio of gross investment in tangible goods to value added at factor cost (million EUR) 1999-2000 –for the countries with availability of data NACE 65 Eurostat, Structural Business Statistics, Annual enterprise statistics 1. R&D intensity using value added for Sector J (NACE 65,66,67)
OECD STAN Indicators Database (1999)
2. dummy according to the relative classification of these sectors among the manufacturing sectors
(dummy) Calculated using several reports on a ranking of advertising in Europe Own elaboration from various source
Market share of the five leading companies (%) – Europa 15 1996
Gual, J. (2004)
Weight of extra-EU imports on EU wide apparent domestic consumption (production minus exports plus imports) 2000 Financial services Statistical tables from EU INTERNATIONAL TRADE IN SERVICES, Eurostat Number of enterprises broken down by size classes of balance sheet total and Balance sheet total for NACE j6512_652 “Total credit institutions” in million euros from 2000-01 for the Europe 15 countries except for Ireland and Finland Eurostat, Structural Business Statistics – Annual enterprise statistics: breakdown of the number of enterprises
Growth in turnover (interest income+fees and commissions receivable) 2000-2001 OECD Bank Profitability Sum “interest income” + “fees and commissions receivable” in millions of national currency, 2001 (all banks of UE 15 minus Finland and Luxembourg) OECD Bank Profitability
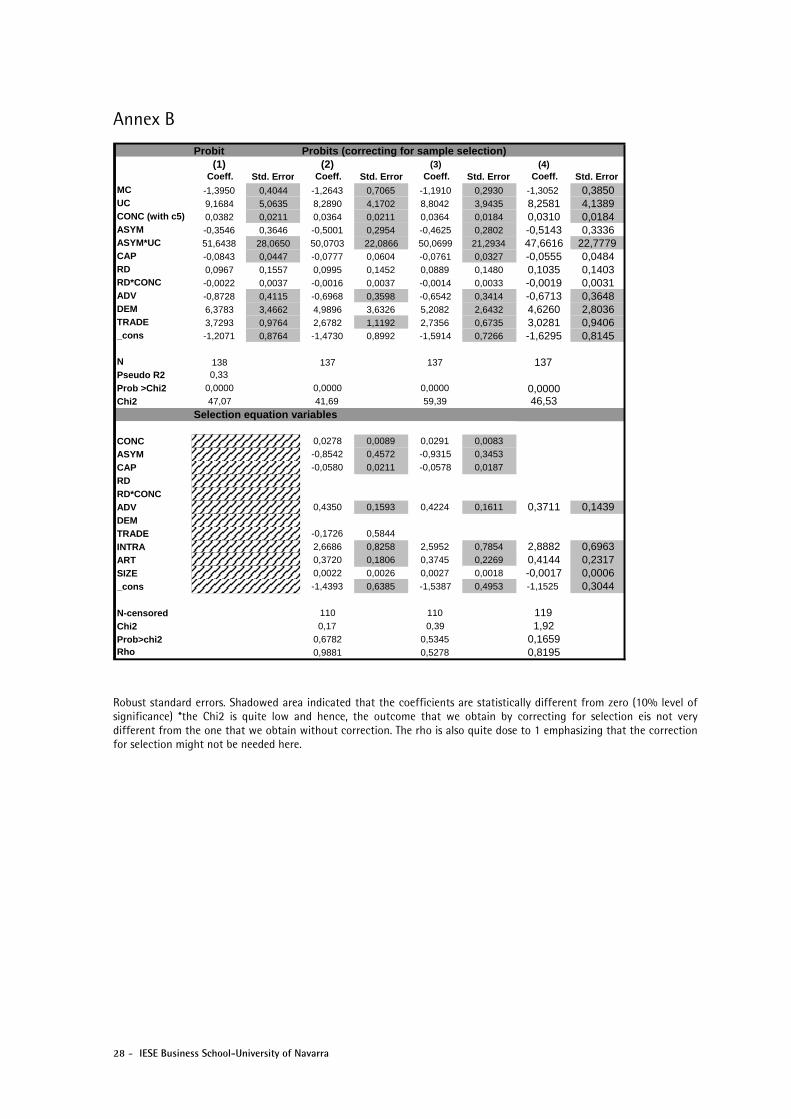
28 - IESE Business School-University of Navarra
Annex B
Robust standard errors. Shadowed area indicated that the coefficients are statistically different from zero (10% level of significance) *the Chi2 is quite low and hence, the outcome that we obtain by correcting for selection eis not very different from the one that we obtain without correction. The rho is also quite dose to 1 emphasizing that the correction for selection might not be needed here.
Probit Probits (correcting for sample selection) (1) (2) (3) (4)
Coeff. Std. Error Coeff. Std. Error Coeff. Std. Error Coeff. Std. Error MC -1,3950 0,4044 -1,2643 0,7065 -1,1910 0,2930 -1,3052 0,3850 UC 9,1684 5,0635 8,2890 4,1702 8,8042 3,9435 8,2581 4,1389 CONC (with c5) 0,0382 0,0211 0,0364 0,0211 0,0364 0,0184 0,0310 0,0184 ASYM -0,3546 0,3646 -0,5001 0,2954 -0,4625 0,2802 -0,5143 0,3336 ASYM*UC 51,6438 28,0650 50,0703 22,0866 50,0699 21,2934 47,6616 22,7779 CAP -0,0843 0,0447 -0,0777 0,0604 -0,0761 0,0327 -0,0555 0,0484 RD 0,0967 0,1557 0,0995 0,1452 0,0889 0,1480 0,1035 0,1403 RD*CONC -0,0022 0,0037 -0,0016 0,0037 -0,0014 0,0033 -0,0019 0,0031 ADV -0,8728 0,4115 -0,6968 0,3598 -0,6542 0,3414 -0,6713 0,3648 DEM 6,3783 3,4662 4,9896 3,6326 5,2082 2,6432 4,6260 2,8036 TRADE 3,7293 0,9764 2,6782 1,1192 2,7356 0,6735 3,0281 0,9406 _cons -1,2071 0,8764 -1,4730 0,8992 -1,5914 0,7266 -1,6295 0,8145
N 138 137 137 137Pseudo R2 0,33 Prob >Chi2 0,0000 0,0000 0,0000 0,0000 Chi2 47,07 41,69 59,39 46,53
Selection equation variables
CONC 0,0278 0,0089 0,0291 0,0083
ASYM -0,8542 0,4572 -0,9315 0,3453
CAP -0,0580 0,0211 -0,0578 0,0187
RD RD*CONC ADV 0,4350 0,1593 0,4224 0,1611 0,3711 0,1439 DEM
TRADE -0,1726 0,5844
INTRA 2,6686 0,8258 2,5952 0,7854 2,8882 0,6963 ART 0,3720 0,1806 0,3745 0,2269 0,4144 0,2317 SIZE 0,0022 0,0026 0,0027 0,0018 -0,0017 0,0006 _cons -1,4393 0,6385 -1,5387 0,4953 -1,1525 0,3044
N-censored 110 110 119Chi2 0,17 0,39 1,92 Prob>chi2 0,6782 0,5345 0,1659 Rho 0,9881 0,5278 0,8195