european economic forecast spring 2017 · statistical annex 147 general government 34. total...
TRANSCRIPT

Statistical Annex European Economic Forecast – Spring 2017
Contents
146
Output : GDP and its components 1. Gross domestic product 148 2. Profiles (q-o-q) of quarterly GDP 148 3. Profiles (y-o-y) of quarterly GDP 149 4. GDP per capita 149 5. Final domestic demand 150 6. Final demand 150 7. Private consumption expenditure 151 8. Government consumption expenditure 151 9. Total investment 152 10. Investment in construction 152 11. Investment in equipment 153 12. Public investment 153 13. Potential GDP 154 14. Output gap relative to potential GDP 154
Prices 15. Deflator of GDP 155 16. Deflator of private consumption 155 17. Harmonised consumer prices index 156 18. Harmonised consumer prices quarterly profiles 156 19. Deflator of exports of goods 157 20. Deflator of imports of goods 157 21. Terms of trade of goods 158
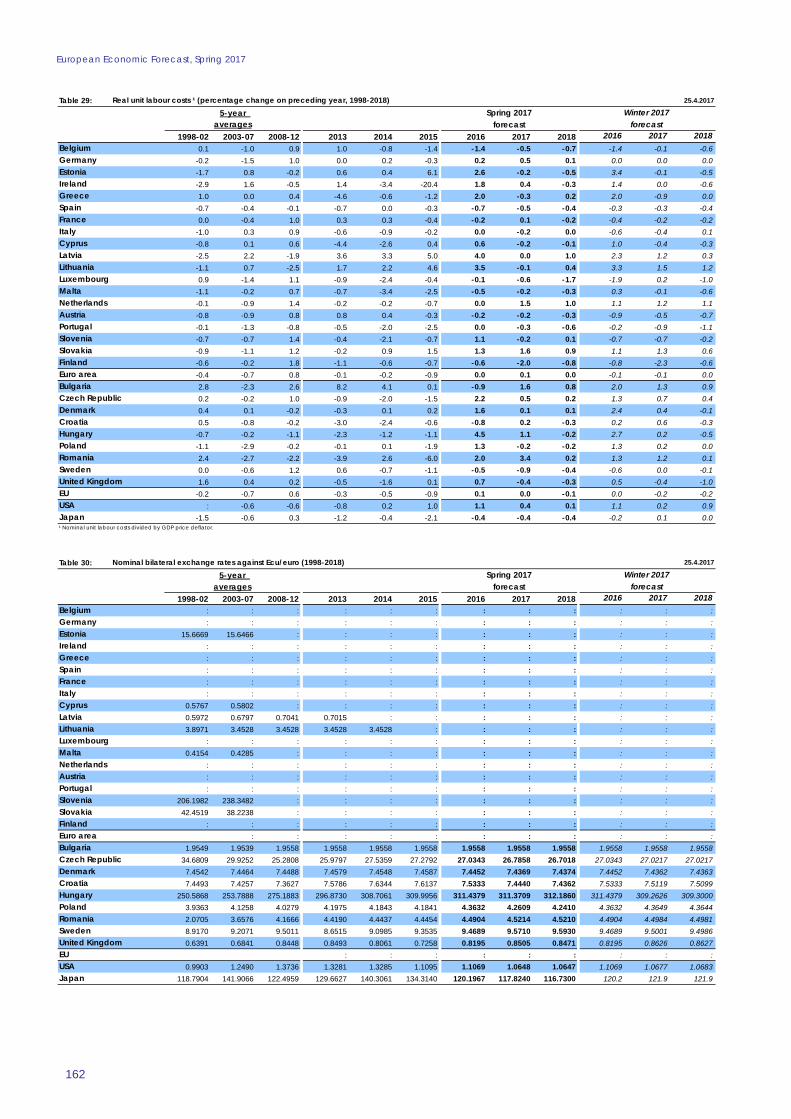
Wages, population and labour market 22. Total population 158 23. Total employment 159 24. Unemployment rate 159 25. Compensation of employees per head 160 26. Real compensation of employees per head 160 27. Labour productivity 161 28. Unit labour costs, whole economy 161 29. Real unit labour costs 162
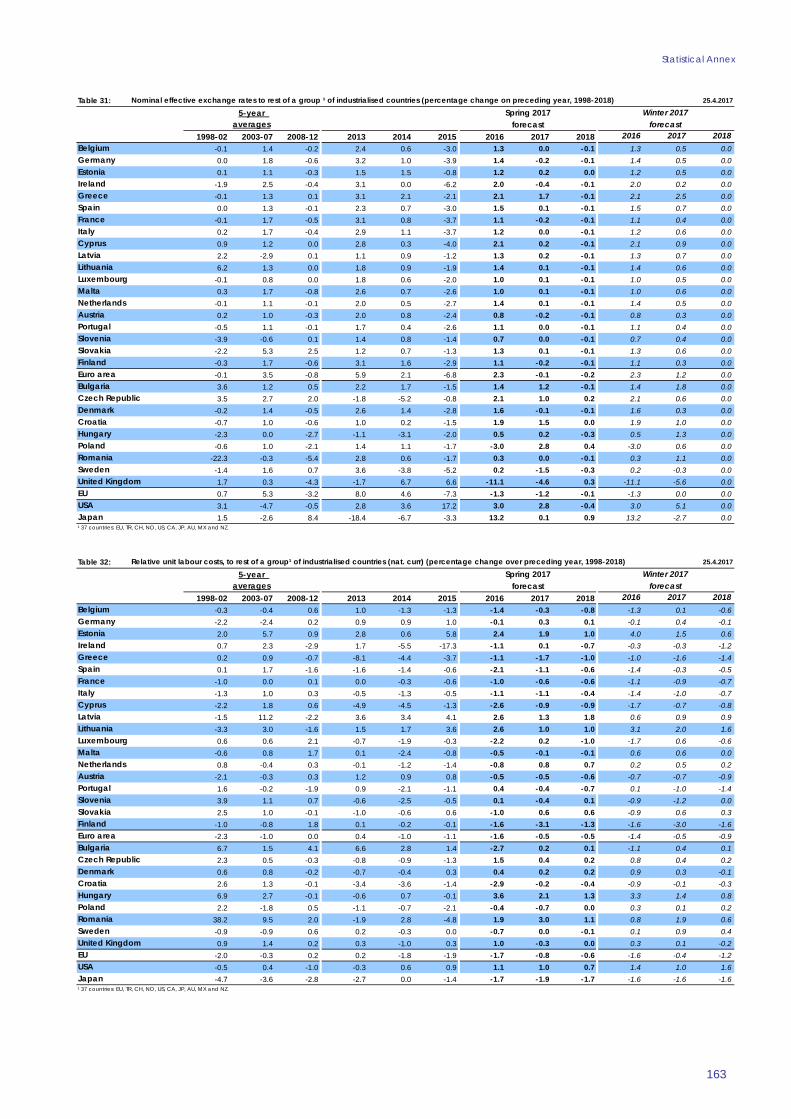
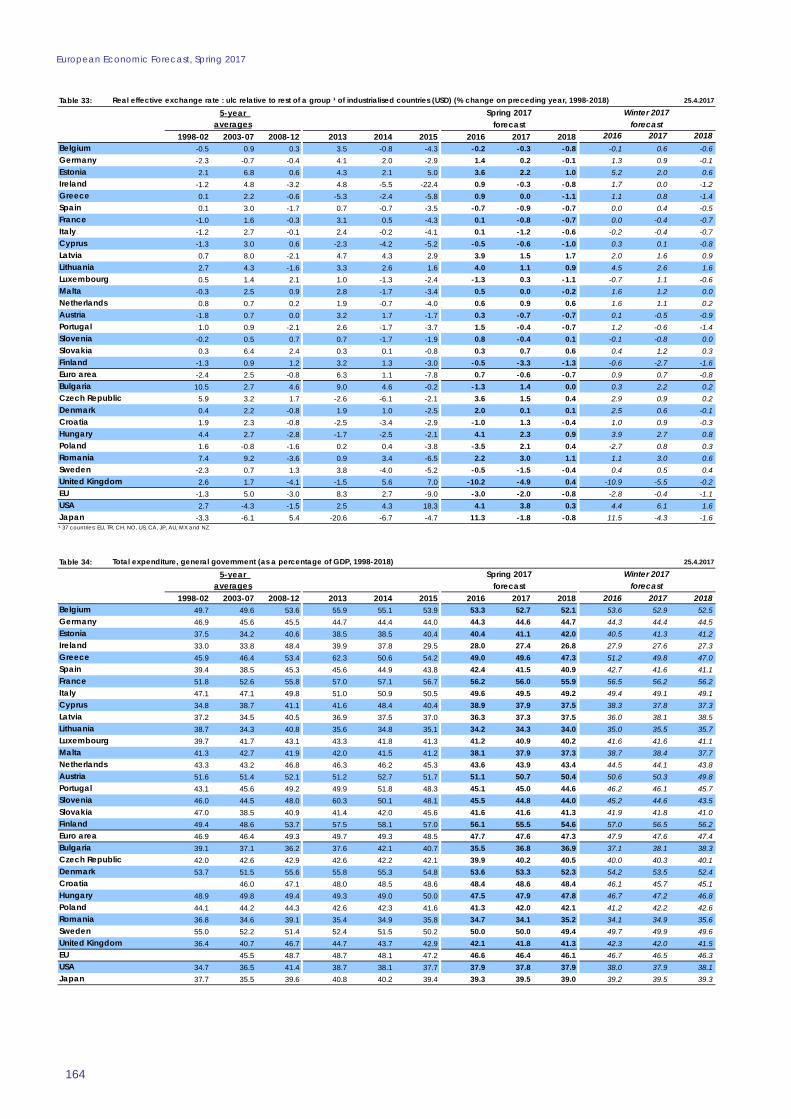
Exchange rates 30. Nominal bilateral exchange rates 162 31. Nominal effective exchange rates 163 32. Relative unit labour costs 163 33. Real effective exchange rates 164
Statistical Annex
147
General Government 34. Total expenditure 164 35. Total revenue 165 36. Net lending (+) or net borrowing (-) 165 37. Interest expenditure 166 38. Primary balance 166 39. Cyclically-adjusted net lending (+) or net borrowing (-) 167 40. Cyclically-adjusted primary balance 167 41. Structural budget balance 168 42. Gross debt 168
Saving 43. Gross national saving 169 44. Gross saving of the private sector 169 45. Saving rate of households 170 46. Gross saving of general government 170
Trade and international payments 47. Exports of goods and services 171 48. Imports of goods and services 171 49. Merchandise trade balance (% of GDP) 172 50. Current-account balance (% of GDP) 172 51. Net lending (+) or net borrowing (-) 173 52. Current-account balance (bn EUR) 173 53. Export markets (goods and services) 174 54. Export performance (goods and services) 174
World economy 55. World GDP 175 56. World exports of goods and services 176 57. Export shares (goods) in EU trade 176 58. World imports of goods and services 177 59. Import shares (goods) in EU trade 177 60. World merchandise trade balances (bn USD) 178 61. World current-account balances (bn USD) 178 62. Primary commodity prices 178
European Economic Forecast, Spring 2017
148
Table 1: 25.4.2017
5-year
1998-02 2003-07 2008-12 2013 2014 2015 2016 2017 2018 2016 2017 20182.3 2.5 0.6 -0.1 1.7 1.5 1.2 1.5 1.7 1.2 1.4 1.61.7 1.6 0.7 0.5 1.6 1.7 1.9 1.6 1.9 1.9 1.6 1.85.2 8.2 -1.5 1.4 2.8 1.4 1.6 2.3 2.8 1.1 2.2 2.68.1 5.2 -1.6 1.1 8.5 26.3 5.2 4.0 3.6 4.3 3.4 3.33.8 4.1 -5.4 -3.2 0.4 -0.2 0.0 2.1 2.5 0.3 2.7 3.14.2 3.6 -1.3 -1.7 1.4 3.2 3.2 2.8 2.4 3.2 2.3 2.12.8 2.0 0.3 0.6 0.6 1.3 1.2 1.4 1.7 1.2 1.4 1.71.8 1.2 -1.5 -1.7 0.1 0.8 0.9 0.9 1.1 0.9 0.9 1.14.6 4.0 0.1 -6.0 -1.5 1.7 2.8 2.5 2.3 2.8 2.5 2.35.6 9.9 -2.5 2.6 2.1 2.7 2.0 3.2 3.5 1.6 2.8 3.0
Lithuania 4.6 8.6 -0.4 3.5 3.5 1.8 2.3 2.9 3.1 2.2 2.9 2.85.8 4.4 0.2 4.0 5.6 4.0 4.2 4.3 4.4 3.8 4.0 3.93.5 2.5 1.7 4.5 8.3 7.4 5.0 4.6 4.4 4.0 3.7 3.73.2 2.3 0.0 -0.2 1.4 2.0 2.2 2.1 1.8 2.1 2.0 1.82.7 2.5 0.6 0.1 0.6 1.0 1.5 1.7 1.7 1.5 1.6 1.63.0 1.1 -1.4 -1.1 0.9 1.6 1.4 1.8 1.6 1.3 1.6 1.53.9 4.7 -1.1 -1.1 3.1 2.3 2.5 3.3 3.1 2.5 3.0 3.02.6 7.3 1.9 1.5 2.6 3.8 3.3 3.0 3.6 3.3 2.9 3.63.9 3.6 -0.8 -0.8 -0.6 0.3 1.4 1.3 1.7 1.5 1.2 1.52.6 2.2 -0.3 -0.3 1.2 2.0 1.8 1.7 1.8 1.7 1.6 1.82.2 6.6 1.1 0.9 1.3 3.6 3.4 2.9 2.8 3.3 2.9 2.82.0 5.5 0.2 -0.5 2.7 4.5 2.4 2.6 2.7 2.4 2.6 2.72.0 2.0 -0.4 0.9 1.7 1.6 1.3 1.7 1.8 1.0 1.5 1.82.7 4.7 -2.0 -1.1 -0.5 1.6 2.9 2.9 2.6 2.8 3.1 2.54.0 3.5 -1.0 2.1 4.0 3.1 2.0 3.6 3.5 1.9 3.5 3.23.4 5.1 3.5 1.4 3.3 3.8 2.7 3.5 3.2 2.8 3.2 3.12.1 6.6 0.3 3.5 3.1 3.9 4.8 4.3 3.7 4.9 4.4 3.73.4 3.5 0.5 1.2 2.6 4.1 3.3 2.6 2.2 3.3 2.4 2.13.1 2.8 -0.1 1.9 3.1 2.2 1.8 1.8 1.3 2.0 1.5 1.22.7 2.5 -0.1 0.2 1.6 2.2 1.9 1.9 1.9 1.9 1.8 1.83.2 2.9 0.6 1.7 2.4 2.6 1.6 2.2 2.3 1.6 2.3 2.20.4 1.7 -0.2 2.0 0.3 1.2 1.0 1.2 0.6 0.9 1.0 0.5
Slovenia
Malta
Spring 2017
USA
Latvia
Croatia
Estonia
Bulgaria
Netherlands
Japan
Sweden
France
Hungary
Winter 2017
Italy
Poland
Greece
Czech Republic
Slovakia
Austria
Euro area
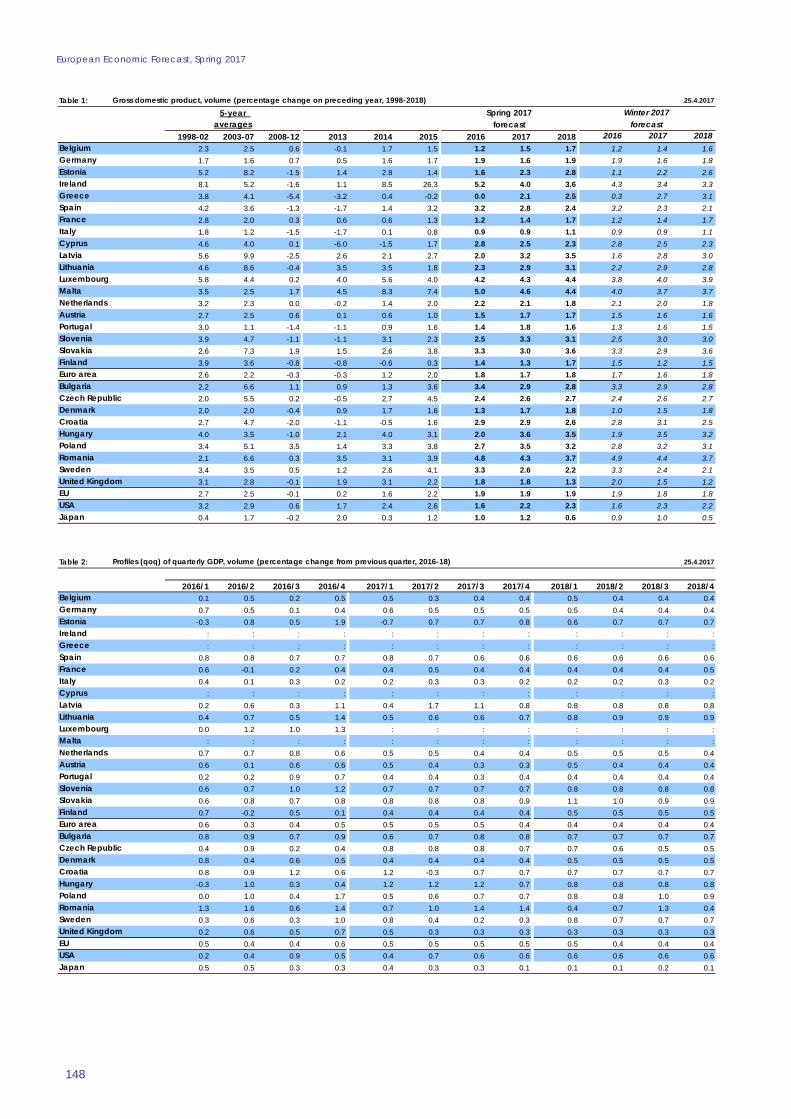
Gross domestic product, volume (percentage change on preceding year, 1998-2018)
Finland
Portugal
Luxembourg
EU
averages
Cyprus
forecast
Romania
Spain
Denmark
Germany
Ireland
Belgium
forecast
United Kingdom
Table 2: 25.4.2017
2016/1 2016/2 2016/3 2016/4 2017/1 2017/2 2017/3 2017/4 2018/1 2018/2 2018/3 2018/40.1 0.5 0.2 0.5 0.5 0.3 0.4 0.4 0.5 0.4 0.4 0.40.7 0.5 0.1 0.4 0.6 0.5 0.5 0.5 0.5 0.4 0.4 0.4
-0.3 0.8 0.5 1.9 -0.7 0.7 0.7 0.8 0.6 0.7 0.7 0.7: : : : : : : : : : : :: : : : : : : : : : : :
0.8 0.8 0.7 0.7 0.8 0.7 0.6 0.6 0.6 0.6 0.6 0.60.6 -0.1 0.2 0.4 0.4 0.5 0.4 0.4 0.4 0.4 0.4 0.50.4 0.1 0.3 0.2 0.2 0.3 0.3 0.2 0.2 0.2 0.3 0.2
: : : : : : : : : : : :0.2 0.6 0.3 1.1 0.4 1.7 1.1 0.8 0.8 0.8 0.8 0.8
Lithuania 0.4 0.7 0.5 1.4 0.5 0.6 0.6 0.7 0.8 0.9 0.9 0.90.0 1.2 1.0 1.3 : : : : : : : :
: : : : : : : : : : : :0.7 0.7 0.8 0.6 0.5 0.5 0.4 0.4 0.5 0.5 0.5 0.40.6 0.1 0.6 0.6 0.5 0.4 0.3 0.3 0.5 0.4 0.4 0.40.2 0.2 0.9 0.7 0.4 0.4 0.3 0.4 0.4 0.4 0.4 0.40.6 0.7 1.0 1.2 0.7 0.7 0.7 0.7 0.8 0.8 0.8 0.80.6 0.8 0.7 0.8 0.8 0.8 0.8 0.9 1.1 1.0 0.9 0.90.7 -0.2 0.5 0.1 0.4 0.4 0.4 0.4 0.5 0.5 0.5 0.50.6 0.3 0.4 0.5 0.5 0.5 0.5 0.4 0.4 0.4 0.4 0.40.8 0.9 0.7 0.9 0.6 0.7 0.8 0.8 0.7 0.7 0.7 0.70.4 0.9 0.2 0.4 0.8 0.8 0.8 0.7 0.7 0.6 0.5 0.50.8 0.4 0.6 0.5 0.4 0.4 0.4 0.4 0.5 0.5 0.5 0.50.8 0.9 1.2 0.6 1.2 -0.3 0.7 0.7 0.7 0.7 0.7 0.7
-0.3 1.0 0.3 0.4 1.2 1.2 1.2 0.7 0.8 0.8 0.8 0.80.0 1.0 0.4 1.7 0.5 0.6 0.7 0.7 0.8 0.8 1.0 0.91.3 1.6 0.6 1.4 0.7 1.0 1.4 1.4 0.4 0.7 1.3 0.40.3 0.6 0.3 1.0 0.8 0.4 0.2 0.3 0.8 0.7 0.7 0.70.2 0.6 0.5 0.7 0.5 0.3 0.3 0.3 0.3 0.3 0.3 0.30.5 0.4 0.4 0.6 0.5 0.5 0.5 0.5 0.5 0.4 0.4 0.40.2 0.4 0.9 0.5 0.4 0.7 0.6 0.6 0.6 0.6 0.6 0.60.5 0.5 0.3 0.3 0.4 0.3 0.3 0.1 0.1 0.1 0.2 0.1
Profiles (qoq) of quarterly GDP, volume (percentage change from previous quarter, 2016-18)
United Kingdom
Euro area
Germany
Hungary
Portugal
France
Greece
Denmark
Finland
Latvia
Belgium
Sweden
Croatia
Estonia
EU
Bulgaria
Luxembourg
Italy
Poland
Slovenia
Malta
Ireland
Czech Republic
Cyprus
Romania
Slovakia
NetherlandsAustria
Spain
USAJapan
Statistical Annex
149
Table 3: 25.4.2017
2016/1 2016/2 2016/3 2016/4 2017/1 2017/2 2017/3 2017/4 2018/1 2018/2 2018/3 2018/41.3 1.2 1.3 1.2 1.6 1.4 1.6 1.5 1.6 1.7 1.7 1.71.8 1.8 1.7 1.8 1.6 1.7 2.1 2.3 2.1 2.0 1.8 1.61.5 0.9 1.8 2.8 2.4 2.4 2.7 1.6 2.9 2.9 2.9 2.8
: : : : : : : : : : : :: : : : : : : : : : : :
3.4 3.4 3.2 3.0 3.0 2.8 2.7 2.6 2.4 2.3 2.3 2.41.2 1.1 0.9 1.1 0.9 1.5 1.8 1.8 1.8 1.7 1.6 1.71.1 0.8 1.0 1.0 0.8 1.0 1.1 1.2 1.1 1.0 0.9 0.9
: : : : : : : : : : : :1.5 1.0 0.5 2.2 2.4 3.5 4.3 4.0 4.4 3.5 3.2 3.2
Lithuania 1.9 2.0 1.8 3.0 3.1 3.0 3.1 2.4 2.7 3.0 3.2 3.53.3 4.5 5.4 3.6 : : : : : : : :
: : : : : : : : : : : :1.2 1.9 2.5 2.9 2.7 2.5 2.1 1.9 1.9 1.8 1.9 1.91.4 1.2 1.6 1.8 1.7 2.1 1.7 1.4 1.5 1.6 1.7 1.91.0 0.9 1.7 2.0 2.2 2.3 1.7 1.4 1.4 1.5 1.6 1.72.0 2.1 2.9 3.6 3.7 3.6 3.3 2.8 2.9 3.0 3.2 3.33.6 3.5 3.1 2.9 3.1 3.1 3.2 3.3 3.6 3.8 3.9 3.91.9 0.8 1.7 1.2 0.9 1.4 1.3 1.6 1.6 1.7 1.8 1.91.7 1.6 1.8 1.8 1.6 1.8 1.9 1.9 1.9 1.8 1.7 1.73.4 3.6 3.4 3.4 3.2 3.0 3.0 2.9 3.0 3.0 3.0 2.93.0 2.6 1.8 1.9 2.3 2.3 2.9 3.1 3.1 2.8 2.5 2.30.8 0.6 1.5 2.3 1.9 1.8 1.6 1.5 1.6 1.7 1.9 2.02.3 2.1 2.7 3.5 3.9 2.8 2.3 2.4 1.9 2.9 2.9 2.91.3 2.3 2.0 1.5 3.0 3.2 4.1 4.4 4.0 3.6 3.3 3.32.8 3.2 2.3 3.1 3.5 3.1 3.4 2.5 2.8 3.1 3.4 3.54.1 5.8 4.4 4.9 4.3 3.6 4.5 4.6 4.3 4.0 3.9 2.94.0 3.5 2.5 2.3 2.8 2.6 2.5 1.7 1.7 2.0 2.5 3.01.6 1.7 2.0 1.9 2.3 2.1 1.9 1.6 1.3 1.3 1.3 1.21.8 1.8 1.9 1.9 1.9 1.9 2.0 1.9 1.9 1.8 1.8 1.81.6 1.3 1.7 2.0 2.1 2.4 2.1 2.2 2.4 2.3 2.3 2.30.4 0.9 1.1 1.6 1.5 1.2 1.2 1.0 0.8 0.6 0.6 0.5
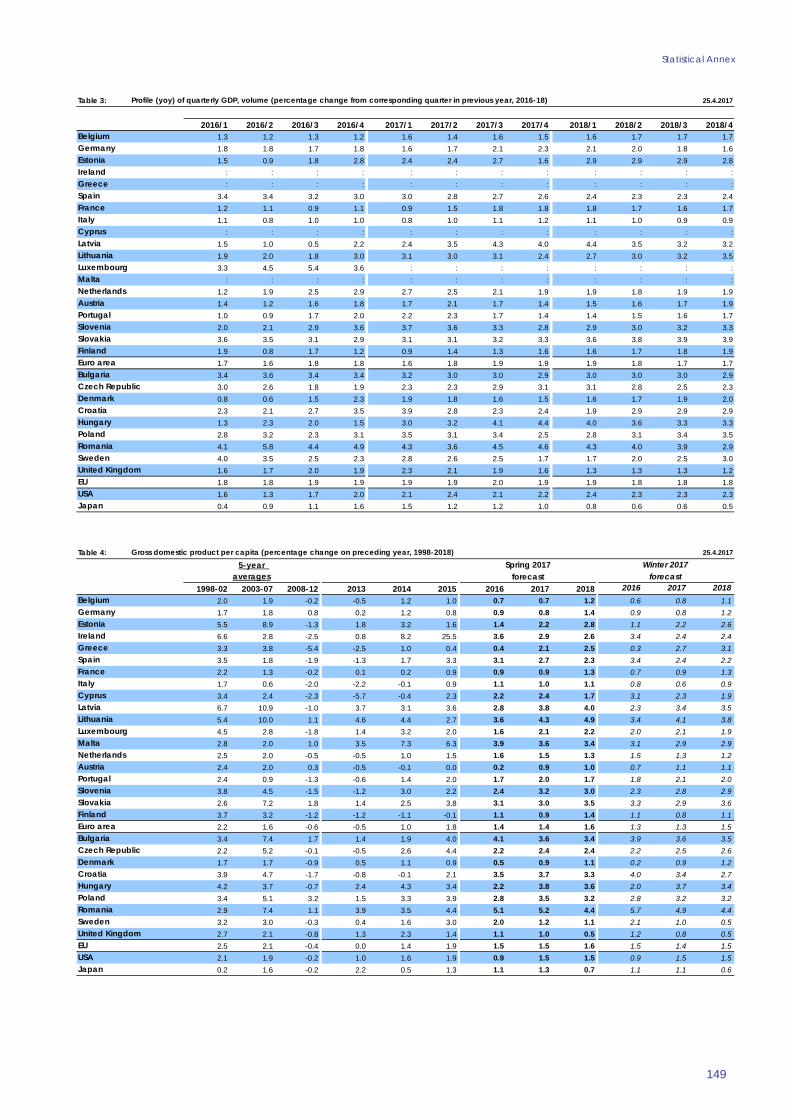
Profile (yoy) of quarterly GDP, volume (percentage change from corresponding quarter in previous year, 2016-18)
United Kingdom
Euro area
Germany
Hungary
Portugal
France
Greece
Denmark
Finland
Latvia
Belgium
Sweden
Croatia
Estonia
EU
Bulgaria
Luxembourg
Italy
Poland
Slovenia
Malta
Ireland
Czech Republic
Cyprus
Romania
Slovakia
NetherlandsAustria
Spain
USAJapan
Table 4: 25.4.2017
5-year
1998-02 2003-07 2008-12 2013 2014 2015 2016 2017 2018 2016 2017 20182.0 1.9 -0.2 -0.5 1.2 1.0 0.7 0.7 1.2 0.6 0.8 1.11.7 1.8 0.8 0.2 1.2 0.8 0.9 0.8 1.4 0.9 0.8 1.25.5 8.9 -1.3 1.8 3.2 1.6 1.4 2.2 2.8 1.1 2.2 2.66.6 2.8 -2.5 0.8 8.2 25.5 3.6 2.9 2.6 3.4 2.4 2.43.3 3.8 -5.4 -2.5 1.0 0.4 0.4 2.1 2.5 0.3 2.7 3.13.5 1.8 -1.9 -1.3 1.7 3.3 3.1 2.7 2.3 3.4 2.4 2.22.2 1.3 -0.2 0.1 0.2 0.9 0.9 0.9 1.3 0.7 0.9 1.31.7 0.6 -2.0 -2.2 -0.1 0.9 1.1 1.0 1.1 0.8 0.6 0.93.4 2.4 -2.3 -5.7 -0.4 2.3 2.2 2.4 1.7 3.1 2.3 1.96.7 10.9 -1.0 3.7 3.1 3.6 2.8 3.8 4.0 2.3 3.4 3.5
Lithuania 5.4 10.0 1.1 4.6 4.4 2.7 3.6 4.3 4.9 3.4 4.1 3.84.5 2.8 -1.8 1.4 3.2 2.0 1.6 2.1 2.2 2.0 2.1 1.92.8 2.0 1.0 3.5 7.3 6.3 3.9 3.6 3.4 3.1 2.9 2.92.5 2.0 -0.5 -0.5 1.0 1.5 1.6 1.5 1.3 1.5 1.3 1.22.4 2.0 0.3 -0.5 -0.1 0.0 0.2 0.9 1.0 0.7 1.1 1.12.4 0.9 -1.3 -0.6 1.4 2.0 1.7 2.0 1.7 1.8 2.1 2.03.8 4.5 -1.5 -1.2 3.0 2.2 2.4 3.2 3.0 2.3 2.8 2.92.6 7.2 1.8 1.4 2.5 3.8 3.1 3.0 3.5 3.3 2.9 3.63.7 3.2 -1.2 -1.2 -1.1 -0.1 1.1 0.9 1.4 1.1 0.8 1.12.2 1.6 -0.6 -0.5 1.0 1.8 1.4 1.4 1.6 1.3 1.3 1.53.4 7.4 1.7 1.4 1.9 4.0 4.1 3.6 3.4 3.9 3.6 3.52.2 5.2 -0.1 -0.5 2.6 4.4 2.2 2.4 2.4 2.2 2.5 2.61.7 1.7 -0.9 0.5 1.1 0.9 0.5 0.9 1.1 0.2 0.9 1.23.9 4.7 -1.7 -0.8 -0.1 2.1 3.5 3.7 3.3 4.0 3.4 2.74.2 3.7 -0.7 2.4 4.3 3.4 2.2 3.8 3.6 2.0 3.7 3.43.4 5.1 3.2 1.5 3.3 3.9 2.8 3.5 3.2 2.8 3.2 3.22.9 7.4 1.1 3.9 3.5 4.4 5.1 5.2 4.4 5.7 4.9 4.43.2 3.0 -0.3 0.4 1.6 3.0 2.0 1.2 1.1 2.1 1.0 0.52.7 2.1 -0.8 1.3 2.3 1.4 1.1 1.0 0.5 1.2 0.8 0.52.5 2.1 -0.4 0.0 1.4 1.9 1.5 1.5 1.6 1.5 1.4 1.52.1 1.9 -0.2 1.0 1.6 1.9 0.9 1.5 1.5 0.9 1.5 1.50.2 1.6 -0.2 2.2 0.5 1.3 1.1 1.3 0.7 1.1 1.1 0.6
Slovenia
Malta
Spring 2017
USA
Latvia
Croatia
Estonia
Bulgaria
Netherlands
Japan
Sweden
France
Hungary
Winter 2017
Italy
Poland
Greece
Czech Republic
Slovakia
Austria
Euro area
Gross domestic product per capita (percentage change on preceding year, 1998-2018)
Finland
Portugal
Luxembourg
EU
averages
Cyprus
forecast
Romania
Spain
Denmark
Germany
Ireland
Belgium
forecast
United Kingdom
European Economic Forecast, Spring 2017
150
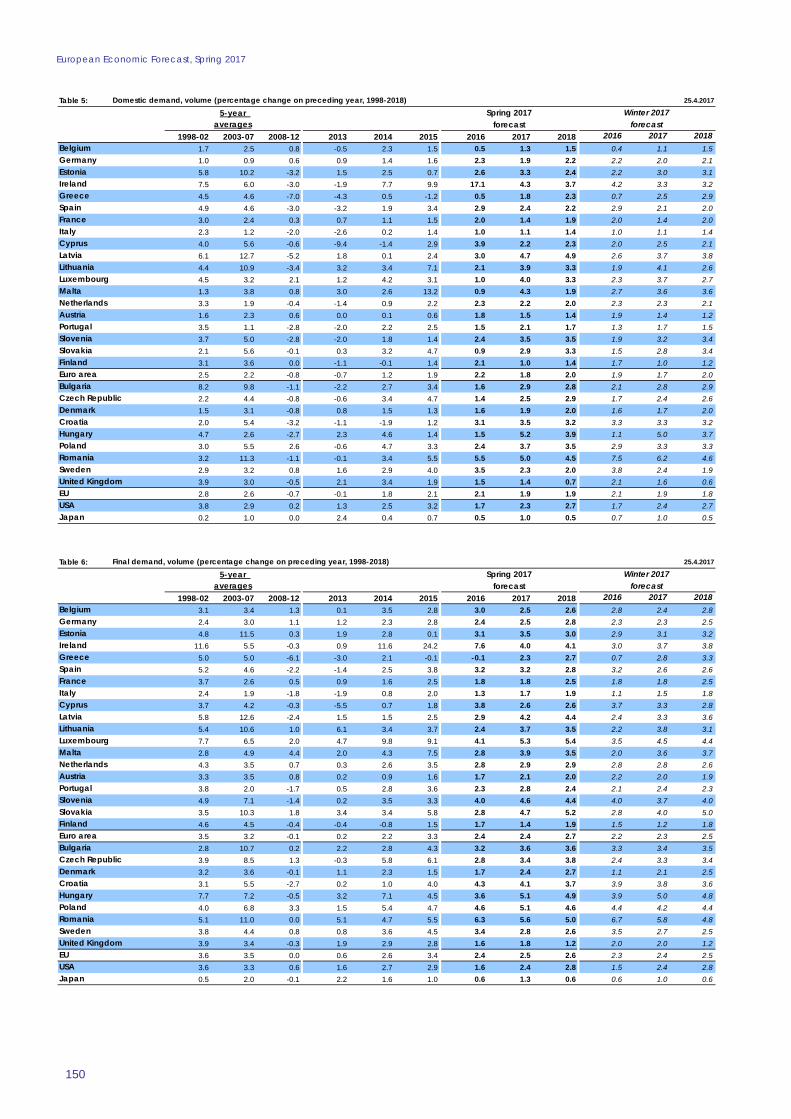
Table 5: 25.4.2017
5-year
1998-02 2003-07 2008-12 2013 2014 2015 2016 2017 2018 2016 2017 20181.7 2.5 0.8 -0.5 2.3 1.5 0.5 1.3 1.5 0.4 1.1 1.51.0 0.9 0.6 0.9 1.4 1.6 2.3 1.9 2.2 2.2 2.0 2.15.8 10.2 -3.2 1.5 2.5 0.7 2.6 3.3 2.4 2.2 3.0 3.17.5 6.0 -3.0 -1.9 7.7 9.9 17.1 4.3 3.7 4.2 3.3 3.24.5 4.6 -7.0 -4.3 0.5 -1.2 0.5 1.8 2.3 0.7 2.5 2.94.9 4.6 -3.0 -3.2 1.9 3.4 2.9 2.4 2.2 2.9 2.1 2.03.0 2.4 0.3 0.7 1.1 1.5 2.0 1.4 1.9 2.0 1.4 2.02.3 1.2 -2.0 -2.6 0.2 1.4 1.0 1.1 1.4 1.0 1.1 1.44.0 5.6 -0.6 -9.4 -1.4 2.9 3.9 2.2 2.3 2.0 2.5 2.16.1 12.7 -5.2 1.8 0.1 2.4 3.0 4.7 4.9 2.6 3.7 3.8
Lithuania 4.4 10.9 -3.4 3.2 3.4 7.1 2.1 3.9 3.3 1.9 4.1 2.64.5 3.2 2.1 1.2 4.2 3.1 1.0 4.0 3.3 2.3 3.7 2.71.3 3.8 0.8 3.0 2.6 13.2 0.9 4.3 1.9 2.7 3.6 3.63.3 1.9 -0.4 -1.4 0.9 2.2 2.3 2.2 2.0 2.3 2.3 2.11.6 2.3 0.6 0.0 0.1 0.6 1.8 1.5 1.4 1.9 1.4 1.23.5 1.1 -2.8 -2.0 2.2 2.5 1.5 2.1 1.7 1.3 1.7 1.53.7 5.0 -2.8 -2.0 1.8 1.4 2.4 3.5 3.5 1.9 3.2 3.42.1 5.6 -0.1 0.3 3.2 4.7 0.9 2.9 3.3 1.5 2.8 3.43.1 3.6 0.0 -1.1 -0.1 1.4 2.1 1.0 1.4 1.7 1.0 1.22.5 2.2 -0.8 -0.7 1.2 1.9 2.2 1.8 2.0 1.9 1.7 2.08.2 9.8 -1.1 -2.2 2.7 3.4 1.6 2.9 2.8 2.1 2.8 2.92.2 4.4 -0.8 -0.6 3.4 4.7 1.4 2.5 2.9 1.7 2.4 2.61.5 3.1 -0.8 0.8 1.5 1.3 1.6 1.9 2.0 1.6 1.7 2.02.0 5.4 -3.2 -1.1 -1.9 1.2 3.1 3.5 3.2 3.3 3.3 3.24.7 2.6 -2.7 2.3 4.6 1.4 1.5 5.2 3.9 1.1 5.0 3.73.0 5.5 2.6 -0.6 4.7 3.3 2.4 3.7 3.5 2.9 3.3 3.33.2 11.3 -1.1 -0.1 3.4 5.5 5.5 5.0 4.5 7.5 6.2 4.62.9 3.2 0.8 1.6 2.9 4.0 3.5 2.3 2.0 3.8 2.4 1.93.9 3.0 -0.5 2.1 3.4 1.9 1.5 1.4 0.7 2.1 1.6 0.62.8 2.6 -0.7 -0.1 1.8 2.1 2.1 1.9 1.9 2.1 1.9 1.83.8 2.9 0.2 1.3 2.5 3.2 1.7 2.3 2.7 1.7 2.4 2.70.2 1.0 0.0 2.4 0.4 0.7 0.5 1.0 0.5 0.7 1.0 0.5
Slovenia
Malta
Spring 2017
USA
Latvia
Croatia
Estonia
Bulgaria
Netherlands
Japan
Sweden
France
Hungary
Winter 2017
Italy
Poland
Greece
Czech Republic
Slovakia
Austria
Euro area
Domestic demand, volume (percentage change on preceding year, 1998-2018)
Finland
Portugal
Luxembourg
EU
averages
Cyprus
forecast
Romania
Spain
Denmark
Germany
Ireland
Belgium
forecast
United Kingdom
Table 6: 25.4.2017
5-year
1998-02 2003-07 2008-12 2013 2014 2015 2016 2017 2018 2016 2017 20183.1 3.4 1.3 0.1 3.5 2.8 3.0 2.5 2.6 2.8 2.4 2.82.4 3.0 1.1 1.2 2.3 2.8 2.4 2.5 2.8 2.3 2.3 2.54.8 11.5 0.3 1.9 2.8 0.1 3.1 3.5 3.0 2.9 3.1 3.2
11.6 5.5 -0.3 0.9 11.6 24.2 7.6 4.0 4.1 3.0 3.7 3.85.0 5.0 -6.1 -3.0 2.1 -0.1 -0.1 2.3 2.7 0.7 2.8 3.35.2 4.6 -2.2 -1.4 2.5 3.8 3.2 3.2 2.8 3.2 2.6 2.63.7 2.6 0.5 0.9 1.6 2.5 1.8 1.8 2.5 1.8 1.8 2.52.4 1.9 -1.8 -1.9 0.8 2.0 1.3 1.7 1.9 1.1 1.5 1.83.7 4.2 -0.3 -5.5 0.7 1.8 3.8 2.6 2.6 3.7 3.3 2.85.8 12.6 -2.4 1.5 1.5 2.5 2.9 4.2 4.4 2.4 3.3 3.6
Lithuania 5.4 10.6 1.0 6.1 3.4 3.7 2.4 3.7 3.5 2.2 3.8 3.17.7 6.5 2.0 4.7 9.8 9.1 4.1 5.3 5.4 3.5 4.5 4.42.8 4.9 4.4 2.0 4.3 7.5 2.8 3.9 3.5 2.0 3.6 3.74.3 3.5 0.7 0.3 2.6 3.5 2.8 2.9 2.9 2.8 2.8 2.63.3 3.5 0.8 0.2 0.9 1.6 1.7 2.1 2.0 2.2 2.0 1.93.8 2.0 -1.7 0.5 2.8 3.6 2.3 2.8 2.4 2.1 2.4 2.34.9 7.1 -1.4 0.2 3.5 3.3 4.0 4.6 4.4 4.0 3.7 4.03.5 10.3 1.8 3.4 3.4 5.8 2.8 4.7 5.2 2.8 4.0 5.04.6 4.5 -0.4 -0.4 -0.8 1.5 1.7 1.4 1.9 1.5 1.2 1.83.5 3.2 -0.1 0.2 2.2 3.3 2.4 2.4 2.7 2.2 2.3 2.52.8 10.7 0.2 2.2 2.8 4.3 3.2 3.6 3.6 3.3 3.4 3.53.9 8.5 1.3 -0.3 5.8 6.1 2.8 3.4 3.8 2.4 3.3 3.43.2 3.6 -0.1 1.1 2.3 1.5 1.7 2.4 2.7 1.1 2.1 2.53.1 5.5 -2.7 0.2 1.0 4.0 4.3 4.1 3.7 3.9 3.8 3.67.7 7.2 -0.5 3.2 7.1 4.5 3.6 5.1 4.9 3.9 5.0 4.84.0 6.8 3.3 1.5 5.4 4.7 4.6 5.1 4.6 4.4 4.2 4.45.1 11.0 0.0 5.1 4.7 5.5 6.3 5.6 5.0 6.7 5.8 4.83.8 4.4 0.8 0.8 3.6 4.5 3.4 2.8 2.6 3.5 2.7 2.53.9 3.4 -0.3 1.9 2.9 2.8 1.6 1.8 1.2 2.0 2.0 1.23.6 3.5 0.0 0.6 2.6 3.4 2.4 2.5 2.6 2.3 2.4 2.53.6 3.3 0.6 1.6 2.7 2.9 1.6 2.4 2.8 1.5 2.4 2.80.5 2.0 -0.1 2.2 1.6 1.0 0.6 1.3 0.6 0.6 1.0 0.6
Slovenia
Malta
Spring 2017
USA
Latvia
Croatia
Estonia
Bulgaria
Netherlands
Japan
Sweden
France
Hungary
Winter 2017
Italy
Poland
Greece
Czech Republic
Slovakia
Austria
Euro area
Final demand, volume (percentage change on preceding year, 1998-2018)
Finland
Portugal
Luxembourg
EU
averages
Cyprus
forecast
Romania
Spain
Denmark
Germany
Ireland
Belgium
forecast
United Kingdom
Statistical Annex
151
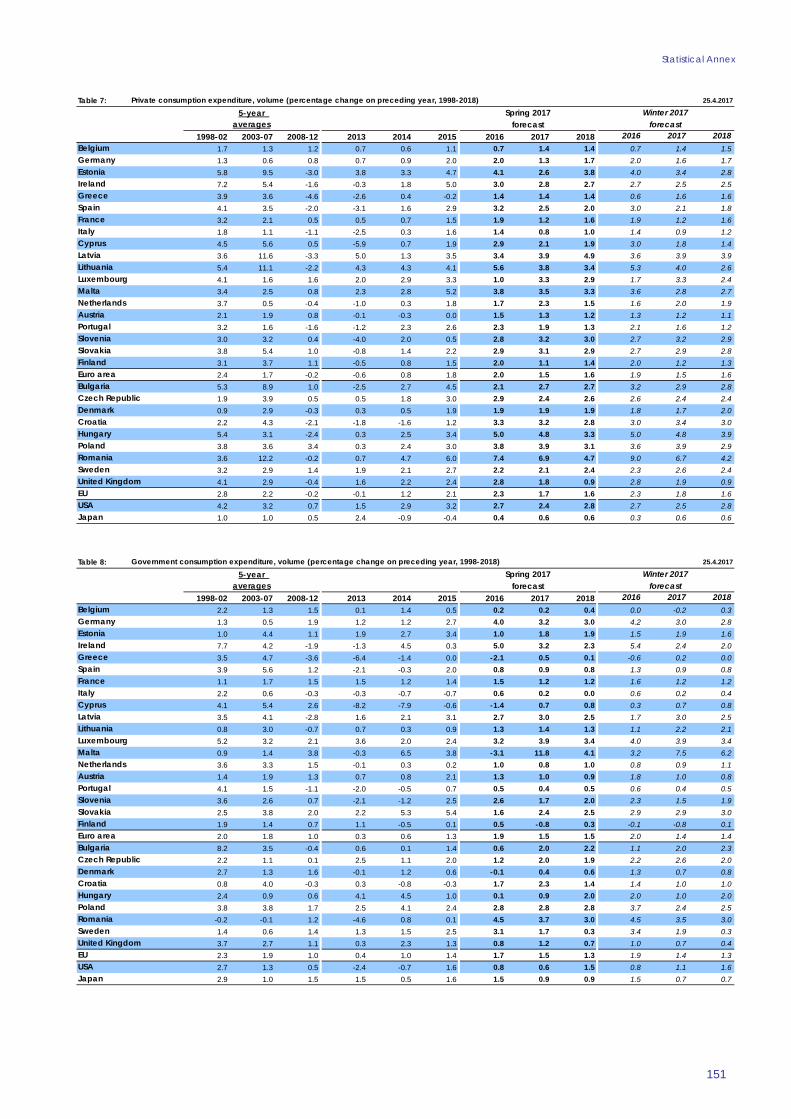
Table 7: 25.4.2017
5-year
1998-02 2003-07 2008-12 2013 2014 2015 2016 2017 2018 2016 2017 20181.7 1.3 1.2 0.7 0.6 1.1 0.7 1.4 1.4 0.7 1.4 1.51.3 0.6 0.8 0.7 0.9 2.0 2.0 1.3 1.7 2.0 1.6 1.75.8 9.5 -3.0 3.8 3.3 4.7 4.1 2.6 3.8 4.0 3.4 2.87.2 5.4 -1.6 -0.3 1.8 5.0 3.0 2.8 2.7 2.7 2.5 2.53.9 3.6 -4.6 -2.6 0.4 -0.2 1.4 1.4 1.4 0.6 1.6 1.64.1 3.5 -2.0 -3.1 1.6 2.9 3.2 2.5 2.0 3.0 2.1 1.83.2 2.1 0.5 0.5 0.7 1.5 1.9 1.2 1.6 1.9 1.2 1.61.8 1.1 -1.1 -2.5 0.3 1.6 1.4 0.8 1.0 1.4 0.9 1.24.5 5.6 0.5 -5.9 0.7 1.9 2.9 2.1 1.9 3.0 1.8 1.43.6 11.6 -3.3 5.0 1.3 3.5 3.4 3.9 4.9 3.6 3.9 3.9
Lithuania 5.4 11.1 -2.2 4.3 4.3 4.1 5.6 3.8 3.4 5.3 4.0 2.64.1 1.6 1.6 2.0 2.9 3.3 1.0 3.3 2.9 1.7 3.3 2.43.4 2.5 0.8 2.3 2.8 5.2 3.8 3.5 3.3 3.6 2.8 2.73.7 0.5 -0.4 -1.0 0.3 1.8 1.7 2.3 1.5 1.6 2.0 1.92.1 1.9 0.8 -0.1 -0.3 0.0 1.5 1.3 1.2 1.3 1.2 1.13.2 1.6 -1.6 -1.2 2.3 2.6 2.3 1.9 1.3 2.1 1.6 1.23.0 3.2 0.4 -4.0 2.0 0.5 2.8 3.2 3.0 2.7 3.2 2.93.8 5.4 1.0 -0.8 1.4 2.2 2.9 3.1 2.9 2.7 2.9 2.83.1 3.7 1.1 -0.5 0.8 1.5 2.0 1.1 1.4 2.0 1.2 1.32.4 1.7 -0.2 -0.6 0.8 1.8 2.0 1.5 1.6 1.9 1.5 1.65.3 8.9 1.0 -2.5 2.7 4.5 2.1 2.7 2.7 3.2 2.9 2.81.9 3.9 0.5 0.5 1.8 3.0 2.9 2.4 2.6 2.6 2.4 2.40.9 2.9 -0.3 0.3 0.5 1.9 1.9 1.9 1.9 1.8 1.7 2.02.2 4.3 -2.1 -1.8 -1.6 1.2 3.3 3.2 2.8 3.0 3.4 3.05.4 3.1 -2.4 0.3 2.5 3.4 5.0 4.8 3.3 5.0 4.8 3.93.8 3.6 3.4 0.3 2.4 3.0 3.8 3.9 3.1 3.6 3.9 2.93.6 12.2 -0.2 0.7 4.7 6.0 7.4 6.9 4.7 9.0 6.7 4.23.2 2.9 1.4 1.9 2.1 2.7 2.2 2.1 2.4 2.3 2.6 2.44.1 2.9 -0.4 1.6 2.2 2.4 2.8 1.8 0.9 2.8 1.9 0.92.8 2.2 -0.2 -0.1 1.2 2.1 2.3 1.7 1.6 2.3 1.8 1.64.2 3.2 0.7 1.5 2.9 3.2 2.7 2.4 2.8 2.7 2.5 2.81.0 1.0 0.5 2.4 -0.9 -0.4 0.4 0.6 0.6 0.3 0.6 0.6
Slovenia
Malta
Spring 2017
USA
Latvia
Croatia
Estonia
Bulgaria
Netherlands
Japan
Sweden
France
Hungary
Winter 2017
Italy
Poland
Greece
Czech Republic
Slovakia
Austria
Euro area
Private consumption expenditure, volume (percentage change on preceding year, 1998-2018)
Finland
Portugal
Luxembourg
EU
averages
Cyprus
forecast
Romania
Spain
Denmark
Germany
Ireland
Belgium
forecast
United Kingdom
Table 8: 25.4.2017
5-year
1998-02 2003-07 2008-12 2013 2014 2015 2016 2017 2018 2016 2017 20182.2 1.3 1.5 0.1 1.4 0.5 0.2 0.2 0.4 0.0 -0.2 0.31.3 0.5 1.9 1.2 1.2 2.7 4.0 3.2 3.0 4.2 3.0 2.81.0 4.4 1.1 1.9 2.7 3.4 1.0 1.8 1.9 1.5 1.9 1.67.7 4.2 -1.9 -1.3 4.5 0.3 5.0 3.2 2.3 5.4 2.4 2.03.5 4.7 -3.6 -6.4 -1.4 0.0 -2.1 0.5 0.1 -0.6 0.2 0.03.9 5.6 1.2 -2.1 -0.3 2.0 0.8 0.9 0.8 1.3 0.9 0.81.1 1.7 1.5 1.5 1.2 1.4 1.5 1.2 1.2 1.6 1.2 1.22.2 0.6 -0.3 -0.3 -0.7 -0.7 0.6 0.2 0.0 0.6 0.2 0.44.1 5.4 2.6 -8.2 -7.9 -0.6 -1.4 0.7 0.8 0.3 0.7 0.83.5 4.1 -2.8 1.6 2.1 3.1 2.7 3.0 2.5 1.7 3.0 2.5
Lithuania 0.8 3.0 -0.7 0.7 0.3 0.9 1.3 1.4 1.3 1.1 2.2 2.15.2 3.2 2.1 3.6 2.0 2.4 3.2 3.9 3.4 4.0 3.9 3.40.9 1.4 3.8 -0.3 6.5 3.8 -3.1 11.8 4.1 3.2 7.5 6.23.6 3.3 1.5 -0.1 0.3 0.2 1.0 0.8 1.0 0.8 0.9 1.11.4 1.9 1.3 0.7 0.8 2.1 1.3 1.0 0.9 1.8 1.0 0.84.1 1.5 -1.1 -2.0 -0.5 0.7 0.5 0.4 0.5 0.6 0.4 0.53.6 2.6 0.7 -2.1 -1.2 2.5 2.6 1.7 2.0 2.3 1.5 1.92.5 3.8 2.0 2.2 5.3 5.4 1.6 2.4 2.5 2.9 2.9 3.01.9 1.4 0.7 1.1 -0.5 0.1 0.5 -0.8 0.3 -0.1 -0.8 0.12.0 1.8 1.0 0.3 0.6 1.3 1.9 1.5 1.5 2.0 1.4 1.48.2 3.5 -0.4 0.6 0.1 1.4 0.6 2.0 2.2 1.1 2.0 2.32.2 1.1 0.1 2.5 1.1 2.0 1.2 2.0 1.9 2.2 2.6 2.02.7 1.3 1.6 -0.1 1.2 0.6 -0.1 0.4 0.6 1.3 0.7 0.80.8 4.0 -0.3 0.3 -0.8 -0.3 1.7 2.3 1.4 1.4 1.0 1.02.4 0.9 0.6 4.1 4.5 1.0 0.1 0.9 2.0 2.0 1.0 2.03.8 3.8 1.7 2.5 4.1 2.4 2.8 2.8 2.8 3.7 2.4 2.5
-0.2 -0.1 1.2 -4.6 0.8 0.1 4.5 3.7 3.0 4.5 3.5 3.01.4 0.6 1.4 1.3 1.5 2.5 3.1 1.7 0.3 3.4 1.9 0.33.7 2.7 1.1 0.3 2.3 1.3 0.8 1.2 0.7 1.0 0.7 0.42.3 1.9 1.0 0.4 1.0 1.4 1.7 1.5 1.3 1.9 1.4 1.32.7 1.3 0.5 -2.4 -0.7 1.6 0.8 0.6 1.5 0.8 1.1 1.62.9 1.0 1.5 1.5 0.5 1.6 1.5 0.9 0.9 1.5 0.7 0.7
Slovenia
Malta
Spring 2017
USA
Latvia
Croatia
Estonia
Bulgaria
Netherlands
Japan
Sweden
France
Hungary
Winter 2017
Italy
Poland
Greece
Czech Republic
Slovakia
Austria
Euro area
Government consumption expenditure, volume (percentage change on preceding year, 1998-2018)
Finland
Portugal
Luxembourg
EU
averages
Cyprus
forecast
Romania
Spain
Denmark
Germany
Ireland
Belgium
forecast
United Kingdom
European Economic Forecast, Spring 2017
152
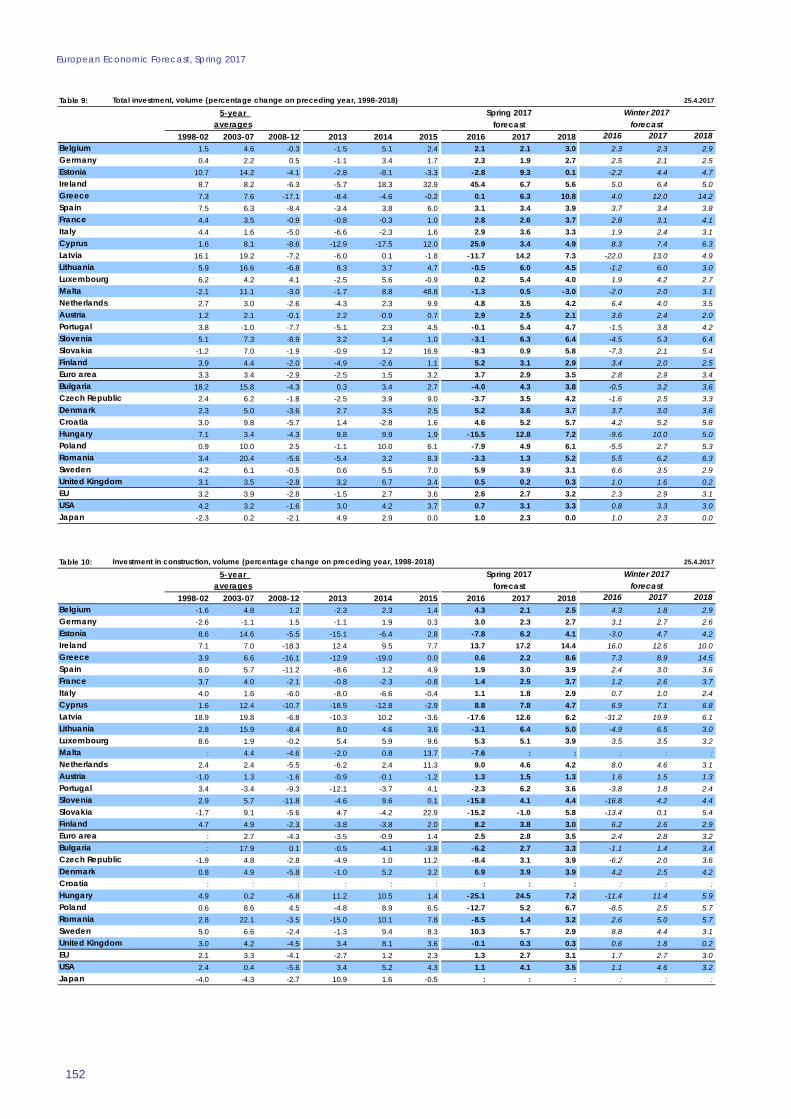
Table 9: 25.4.2017
5-year
1998-02 2003-07 2008-12 2013 2014 2015 2016 2017 2018 2016 2017 20181.5 4.6 -0.3 -1.5 5.1 2.4 2.1 2.1 3.0 2.3 2.3 2.90.4 2.2 0.5 -1.1 3.4 1.7 2.3 1.9 2.7 2.5 2.1 2.5
10.7 14.2 -4.1 -2.8 -8.1 -3.3 -2.8 9.3 0.1 -2.2 4.4 4.78.7 8.2 -6.3 -5.7 18.3 32.9 45.4 6.7 5.6 5.0 6.4 5.07.3 7.6 -17.1 -8.4 -4.6 -0.2 0.1 6.3 10.8 4.0 12.0 14.27.5 6.3 -8.4 -3.4 3.8 6.0 3.1 3.4 3.9 3.7 3.4 3.84.4 3.5 -0.9 -0.8 -0.3 1.0 2.8 2.6 3.7 2.8 3.1 4.14.4 1.6 -5.0 -6.6 -2.3 1.6 2.9 3.6 3.3 1.9 2.4 3.11.6 8.1 -8.6 -12.9 -17.5 12.0 25.9 3.4 4.9 8.3 7.4 6.3
16.1 19.2 -7.2 -6.0 0.1 -1.8 -11.7 14.2 7.3 -22.0 13.0 4.9Lithuania 5.9 16.6 -6.8 8.3 3.7 4.7 -0.5 6.0 4.5 -1.2 6.0 3.0
6.2 4.2 4.1 -2.5 5.6 -0.9 0.2 5.4 4.0 1.9 4.2 2.7-2.1 11.1 -3.0 -1.7 8.8 48.8 -1.3 0.5 -3.0 -2.0 2.0 3.12.7 3.0 -2.6 -4.3 2.3 9.9 4.8 3.5 4.2 6.4 4.0 3.51.2 2.1 -0.1 2.2 -0.9 0.7 2.9 2.5 2.1 3.6 2.4 2.03.8 -1.0 -7.7 -5.1 2.3 4.5 -0.1 5.4 4.7 -1.5 3.8 4.25.1 7.3 -8.9 3.2 1.4 1.0 -3.1 6.3 6.4 -4.5 5.3 6.4
-1.2 7.0 -1.9 -0.9 1.2 16.9 -9.3 0.9 5.8 -7.3 2.1 5.43.9 4.4 -2.0 -4.9 -2.6 1.1 5.2 3.1 2.9 3.4 2.0 2.53.3 3.4 -2.9 -2.5 1.5 3.2 3.7 2.9 3.5 2.8 2.9 3.4
18.2 15.8 -4.3 0.3 3.4 2.7 -4.0 4.3 3.8 -0.5 3.2 3.62.4 6.2 -1.8 -2.5 3.9 9.0 -3.7 3.5 4.2 -1.6 2.5 3.32.3 5.0 -3.6 2.7 3.5 2.5 5.2 3.6 3.7 3.7 3.0 3.63.0 9.8 -5.7 1.4 -2.8 1.6 4.6 5.2 5.7 4.2 5.2 5.87.1 3.4 -4.3 9.8 9.9 1.9 -15.5 12.8 7.2 -9.6 10.0 5.00.9 10.0 2.5 -1.1 10.0 6.1 -7.9 4.9 6.1 -5.5 2.7 5.33.4 20.4 -5.6 -5.4 3.2 8.3 -3.3 1.3 5.2 5.5 6.2 6.34.2 6.1 -0.5 0.6 5.5 7.0 5.9 3.9 3.1 6.6 3.5 2.93.1 3.5 -2.8 3.2 6.7 3.4 0.5 0.2 0.3 1.0 1.6 0.23.2 3.9 -2.8 -1.5 2.7 3.6 2.6 2.7 3.2 2.3 2.9 3.14.2 3.2 -1.6 3.0 4.2 3.7 0.7 3.1 3.3 0.8 3.3 3.0
-2.3 0.2 -2.1 4.9 2.9 0.0 1.0 2.3 0.0 1.0 2.3 0.0
Slovenia
Malta
Spring 2017
USA
Latvia
Croatia
Estonia
Bulgaria
Netherlands
Japan
Sweden
France
Hungary
Winter 2017
Italy
Poland
Greece
Czech Republic
Slovakia
Austria
Euro area
Total investment, volume (percentage change on preceding year, 1998-2018)
Finland
Portugal
Luxembourg
EU
averages
Cyprus
forecast
Romania
Spain
Denmark
Germany
Ireland
Belgium
forecast
United Kingdom
Table 10: 25.4.2017
5-year
1998-02 2003-07 2008-12 2013 2014 2015 2016 2017 2018 2016 2017 2018-1.6 4.8 1.2 -2.3 2.3 1.4 4.3 2.1 2.5 4.3 1.8 2.9-2.6 -1.1 1.5 -1.1 1.9 0.3 3.0 2.3 2.7 3.1 2.7 2.68.6 14.6 -5.5 -15.1 -6.4 2.8 -7.8 6.2 4.1 -3.0 4.7 4.27.1 7.0 -18.3 12.4 9.5 7.7 13.7 17.2 14.4 16.0 12.6 10.03.9 6.6 -16.1 -12.9 -19.0 0.0 0.6 2.2 8.6 7.3 8.9 14.58.0 5.7 -11.2 -8.6 1.2 4.9 1.9 3.0 3.9 2.4 3.0 3.63.7 4.0 -2.1 -0.8 -2.3 -0.8 1.4 2.5 3.7 1.2 2.6 3.74.0 1.6 -6.0 -8.0 -6.6 -0.4 1.1 1.8 2.9 0.7 1.0 2.41.6 12.4 -10.7 -18.5 -12.8 -2.9 8.8 7.8 4.7 6.9 7.1 6.8
18.9 19.8 -6.8 -10.3 10.2 -3.6 -17.6 12.6 6.2 -31.2 19.9 6.1Lithuania 2.8 15.9 -8.4 8.0 4.6 3.6 -3.1 6.4 5.0 -4.9 6.5 3.0
8.6 1.9 -0.2 5.4 5.9 9.6 5.3 5.1 3.9 3.5 3.5 3.2: 4.4 -4.6 -2.0 0.8 13.7 -7.6 : : : : :
2.4 2.4 -5.5 -6.2 2.4 11.3 9.0 4.6 4.2 8.0 4.6 3.1-1.0 1.3 -1.6 -0.9 -0.1 -1.2 1.3 1.5 1.3 1.6 1.5 1.33.4 -3.4 -9.3 -12.1 -3.7 4.1 -2.3 6.2 3.6 -3.8 1.8 2.42.9 5.7 -11.8 -4.6 9.6 0.1 -15.8 4.1 4.4 -16.8 4.2 4.4
-1.7 9.1 -5.6 4.7 -4.2 22.9 -15.2 -1.0 5.8 -13.4 0.1 5.44.7 4.9 -2.3 -3.8 -3.8 2.0 8.2 3.8 3.0 6.2 2.6 2.9
: 2.7 -4.3 -3.5 -0.9 1.4 2.5 2.8 3.5 2.4 2.8 3.2: 17.9 0.1 -0.5 -4.1 -3.8 -6.2 2.7 3.3 -1.1 1.4 3.4
-1.9 4.8 -2.8 -4.9 1.0 11.2 -8.4 3.1 3.9 -6.2 2.0 3.60.8 4.9 -5.8 -1.0 5.2 3.2 6.9 3.9 3.9 4.2 2.5 4.2
: : : : : : : : : : : :4.9 0.2 -6.8 11.2 10.5 1.4 -25.1 24.5 7.2 -11.4 11.4 5.90.6 8.6 4.5 -4.8 8.9 6.5 -12.7 5.2 6.7 -8.5 2.5 5.72.8 22.1 -3.5 -15.0 10.1 7.8 -8.5 1.4 3.2 2.6 5.0 5.75.0 6.6 -2.4 -1.3 9.4 8.3 10.3 5.7 2.9 8.8 4.4 3.13.0 4.2 -4.5 3.4 8.1 3.6 -0.1 0.3 0.3 0.6 1.8 0.22.1 3.3 -4.1 -2.7 1.2 2.3 1.3 2.7 3.1 1.7 2.7 3.02.4 0.4 -5.6 3.4 5.2 4.3 1.1 4.1 3.5 1.1 4.6 3.2
-4.0 -4.3 -2.7 10.9 1.6 -0.5 : : : : : :
Slovenia
Malta
Spring 2017
USA
Latvia
Croatia
Estonia
Bulgaria
Netherlands
Japan
Sweden
France
Hungary
Winter 2017
Italy
Poland
Greece
Czech Republic
Slovakia
Austria
Euro area
Investment in construction, volume (percentage change on preceding year, 1998-2018)
Finland
Portugal
Luxembourg
EU
averages
Cyprus
forecast
Romania
Spain
Denmark
Germany
Ireland
Belgium
forecast
United Kingdom
Statistical Annex
153
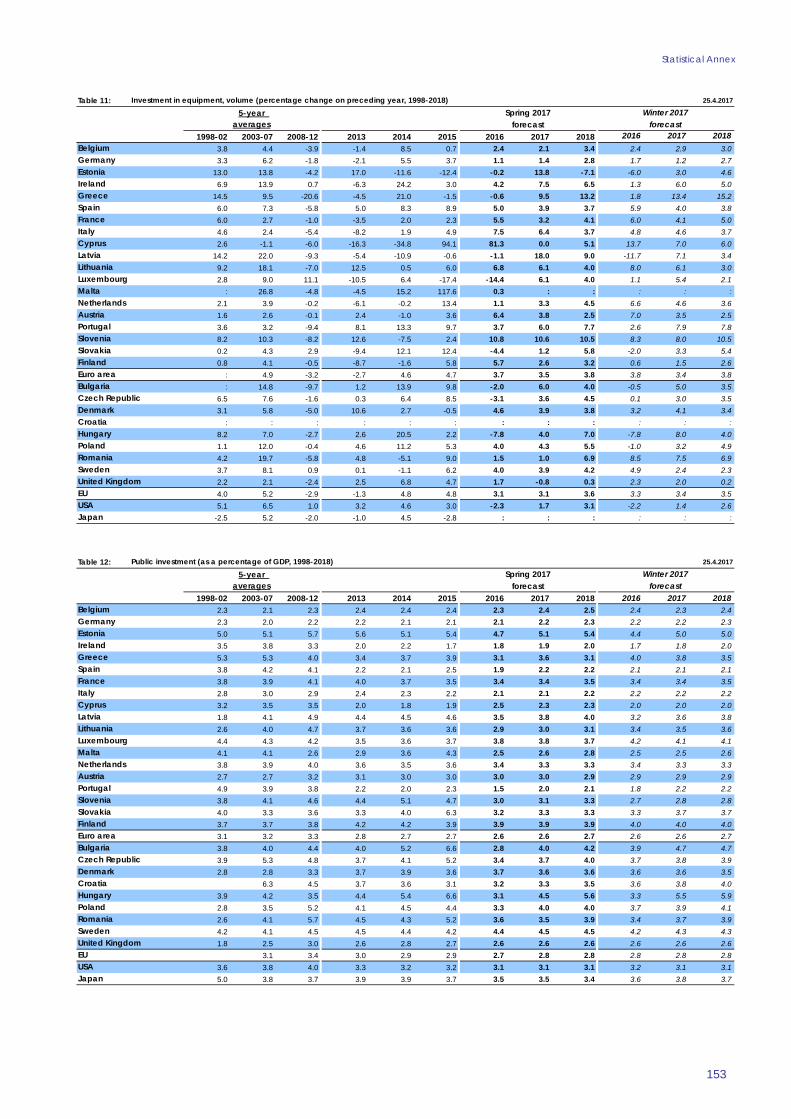
Table 11: 25.4.2017
5-year
1998-02 2003-07 2008-12 2013 2014 2015 2016 2017 2018 2016 2017 20183.8 4.4 -3.9 -1.4 8.5 0.7 2.4 2.1 3.4 2.4 2.9 3.03.3 6.2 -1.8 -2.1 5.5 3.7 1.1 1.4 2.8 1.7 1.2 2.7
13.0 13.8 -4.2 17.0 -11.6 -12.4 -0.2 13.8 -7.1 -6.0 3.0 4.66.9 13.9 0.7 -6.3 24.2 3.0 4.2 7.5 6.5 1.3 6.0 5.0
14.5 9.5 -20.6 -4.5 21.0 -1.5 -0.6 9.5 13.2 1.8 13.4 15.26.0 7.3 -5.8 5.0 8.3 8.9 5.0 3.9 3.7 5.9 4.0 3.86.0 2.7 -1.0 -3.5 2.0 2.3 5.5 3.2 4.1 6.0 4.1 5.04.6 2.4 -5.4 -8.2 1.9 4.9 7.5 6.4 3.7 4.8 4.6 3.72.6 -1.1 -6.0 -16.3 -34.8 94.1 81.3 0.0 5.1 13.7 7.0 6.0
14.2 22.0 -9.3 -5.4 -10.9 -0.6 -1.1 18.0 9.0 -11.7 7.1 3.4Lithuania 9.2 18.1 -7.0 12.5 0.5 6.0 6.8 6.1 4.0 8.0 6.1 3.0
2.8 9.0 11.1 -10.5 6.4 -17.4 -14.4 6.1 4.0 1.1 5.4 2.1: 26.8 -4.8 -4.5 15.2 117.6 0.3 : : : : :
2.1 3.9 -0.2 -6.1 -0.2 13.4 1.1 3.3 4.5 6.6 4.6 3.61.6 2.6 -0.1 2.4 -1.0 3.6 6.4 3.8 2.5 7.0 3.5 2.53.6 3.2 -9.4 8.1 13.3 9.7 3.7 6.0 7.7 2.6 7.9 7.88.2 10.3 -8.2 12.6 -7.5 2.4 10.8 10.6 10.5 8.3 8.0 10.50.2 4.3 2.9 -9.4 12.1 12.4 -4.4 1.2 5.8 -2.0 3.3 5.40.8 4.1 -0.5 -8.7 -1.6 5.8 5.7 2.6 3.2 0.6 1.5 2.6
: 4.9 -3.2 -2.7 4.6 4.7 3.7 3.5 3.8 3.8 3.4 3.8: 14.8 -9.7 1.2 13.9 9.8 -2.0 6.0 4.0 -0.5 5.0 3.5
6.5 7.6 -1.6 0.3 6.4 8.5 -3.1 3.6 4.5 0.1 3.0 3.53.1 5.8 -5.0 10.6 2.7 -0.5 4.6 3.9 3.8 3.2 4.1 3.4
: : : : : : : : : : : :8.2 7.0 -2.7 2.6 20.5 2.2 -7.8 4.0 7.0 -7.8 8.0 4.01.1 12.0 -0.4 4.6 11.2 5.3 4.0 4.3 5.5 -1.0 3.2 4.94.2 19.7 -5.8 4.8 -5.1 9.0 1.5 1.0 6.9 8.5 7.5 6.93.7 8.1 0.9 0.1 -1.1 6.2 4.0 3.9 4.2 4.9 2.4 2.32.2 2.1 -2.4 2.5 6.8 4.7 1.7 -0.8 0.3 2.3 2.0 0.24.0 5.2 -2.9 -1.3 4.8 4.8 3.1 3.1 3.6 3.3 3.4 3.55.1 6.5 1.0 3.2 4.6 3.0 -2.3 1.7 3.1 -2.2 1.4 2.6
-2.5 5.2 -2.0 -1.0 4.5 -2.8 : : : : : :
Slovenia
Malta
Spring 2017
USA
Latvia
Croatia
Estonia
Bulgaria
Netherlands
Japan
Sweden
France
Hungary
Winter 2017
Italy
Poland
Greece
Czech Republic
Slovakia
Austria
Euro area
Investment in equipment, volume (percentage change on preceding year, 1998-2018)
Finland
Portugal
Luxembourg
EU
averages
Cyprus
forecast
Romania
Spain
Denmark
Germany
Ireland
Belgium
forecast
United Kingdom
Table 12: 25.4.2017
5-year
1998-02 2003-07 2008-12 2013 2014 2015 2016 2017 2018 2016 2017 20182.3 2.1 2.3 2.4 2.4 2.4 2.3 2.4 2.5 2.4 2.3 2.42.3 2.0 2.2 2.2 2.1 2.1 2.1 2.2 2.3 2.2 2.2 2.35.0 5.1 5.7 5.6 5.1 5.4 4.7 5.1 5.4 4.4 5.0 5.03.5 3.8 3.3 2.0 2.2 1.7 1.8 1.9 2.0 1.7 1.8 2.05.3 5.3 4.0 3.4 3.7 3.9 3.1 3.6 3.1 4.0 3.8 3.53.8 4.2 4.1 2.2 2.1 2.5 1.9 2.2 2.2 2.1 2.1 2.13.8 3.9 4.1 4.0 3.7 3.5 3.4 3.4 3.5 3.4 3.4 3.52.8 3.0 2.9 2.4 2.3 2.2 2.1 2.1 2.2 2.2 2.2 2.23.2 3.5 3.5 2.0 1.8 1.9 2.5 2.3 2.3 2.0 2.0 2.01.8 4.1 4.9 4.4 4.5 4.6 3.5 3.8 4.0 3.2 3.6 3.8
Lithuania 2.6 4.0 4.7 3.7 3.6 3.6 2.9 3.0 3.1 3.4 3.5 3.64.4 4.3 4.2 3.5 3.6 3.7 3.8 3.8 3.7 4.2 4.1 4.14.1 4.1 2.6 2.9 3.6 4.3 2.5 2.6 2.8 2.5 2.5 2.63.8 3.9 4.0 3.6 3.5 3.6 3.4 3.3 3.3 3.4 3.3 3.32.7 2.7 3.2 3.1 3.0 3.0 3.0 3.0 2.9 2.9 2.9 2.94.9 3.9 3.8 2.2 2.0 2.3 1.5 2.0 2.1 1.8 2.2 2.23.8 4.1 4.6 4.4 5.1 4.7 3.0 3.1 3.3 2.7 2.8 2.84.0 3.3 3.6 3.3 4.0 6.3 3.2 3.3 3.3 3.3 3.7 3.73.7 3.7 3.8 4.2 4.2 3.9 3.9 3.9 3.9 4.0 4.0 4.03.1 3.2 3.3 2.8 2.7 2.7 2.6 2.6 2.7 2.6 2.6 2.73.8 4.0 4.4 4.0 5.2 6.6 2.8 4.0 4.2 3.9 4.7 4.73.9 5.3 4.8 3.7 4.1 5.2 3.4 3.7 4.0 3.7 3.8 3.92.8 2.8 3.3 3.7 3.9 3.6 3.7 3.6 3.6 3.6 3.6 3.5
6.3 4.5 3.7 3.6 3.1 3.2 3.3 3.5 3.6 3.8 4.03.9 4.2 3.5 4.4 5.4 6.6 3.1 4.5 5.6 3.3 5.5 5.92.8 3.5 5.2 4.1 4.5 4.4 3.3 4.0 4.0 3.7 3.9 4.12.6 4.1 5.7 4.5 4.3 5.2 3.6 3.5 3.9 3.4 3.7 3.94.2 4.1 4.5 4.5 4.4 4.2 4.4 4.5 4.5 4.2 4.3 4.31.8 2.5 3.0 2.6 2.8 2.7 2.6 2.6 2.6 2.6 2.6 2.6
3.1 3.4 3.0 2.9 2.9 2.7 2.8 2.8 2.8 2.8 2.83.6 3.8 4.0 3.3 3.2 3.2 3.1 3.1 3.1 3.2 3.1 3.15.0 3.8 3.7 3.9 3.9 3.7 3.5 3.5 3.4 3.6 3.8 3.7
Slovenia
Malta
Spring 2017
USA
Latvia
Croatia
Estonia
Bulgaria
Netherlands
Japan
Sweden
France
Hungary
Winter 2017
Italy
Poland
Greece
Czech Republic
Slovakia
Austria
Euro area
Public investment (as a percentage of GDP, 1998-2018)
Finland
Portugal
Luxembourg
EU
averages
Cyprus
forecast
Romania
Spain
Denmark
Germany
Ireland
Belgium
forecast
United Kingdom
European Economic Forecast, Spring 2017
154
Table 13: 25.4.2017
5-year
1998-02 2003-07 2008-12 2013 2014 2015 2016 2017 2018 2016 2017 20182.4 1.9 1.3 0.8 0.9 1.1 1.3 1.3 1.3 1.3 1.4 1.31.5 1.3 1.0 1.4 1.4 1.5 1.8 1.7 1.5 1.9 1.7 1.64.5 5.7 0.8 1.9 2.2 2.4 2.3 2.5 2.3 2.2 2.4 2.48.1 4.5 0.1 1.7 3.3 24.7 5.0 4.7 4.6 3.5 4.0 3.93.9 3.1 -1.2 -2.7 -2.1 -1.7 -1.4 -0.4 -0.1 -1.0 -0.5 -0.23.2 3.6 0.9 -0.7 -0.2 0.2 0.4 0.8 0.9 0.5 0.6 0.82.0 1.7 1.1 0.9 1.0 1.0 1.1 1.2 1.2 1.1 1.2 1.31.6 1.0 -0.4 -0.4 -0.3 -0.2 -0.3 0.0 0.3 -0.3 0.1 0.3
3.3 1.7 -1.9 -2.4 -1.5 0.3 0.8 1.1 -0.1 0.4 0.75.8 7.6 -0.2 0.8 1.5 2.1 1.4 3.0 3.7 1.2 2.6 3.2
Lithuania 6.1 6.1 1.7 1.9 2.1 2.2 2.1 2.4 2.7 1.9 2.3 2.54.8 3.9 2.5 2.8 3.4 3.4 3.0 3.7 3.7 3.0 3.3 3.43.1 2.5 2.5 3.7 4.6 6.4 6.1 5.6 4.8 5.4 5.0 4.73.2 1.8 0.9 0.3 0.7 1.0 1.3 1.3 1.4 1.3 1.3 1.42.5 2.1 1.0 0.9 0.8 1.0 1.4 1.4 1.4 1.3 1.3 1.43.0 1.0 -0.2 -1.0 -0.4 0.0 0.4 0.8 1.0 0.4 0.7 0.9
3.5 1.1 -0.1 0.6 0.8 1.0 1.6 1.9 1.0 1.3 1.64.0 5.2 3.7 2.2 2.0 2.7 2.4 2.5 2.9 2.5 2.7 3.14.0 2.6 0.4 -0.1 0.0 0.2 0.4 0.9 0.8 0.4 0.8 0.8
1.8 0.7 0.5 0.7 1.2 1.1 1.2 1.2 1.1 1.2 1.22.8 5.9 1.8 1.2 2.1 2.8 2.9 2.7 2.8 2.8 2.8 2.81.8 4.3 1.7 0.9 1.7 2.3 2.2 2.4 2.3 2.3 2.3 2.42.0 1.4 1.0 0.8 0.9 1.2 1.2 1.7 1.7 1.2 1.5 1.6
3.3 -0.2 -0.3 0.2 0.3 1.1 0.5 1.2 1.3 0.7 1.03.5 3.0 0.3 1.1 1.9 2.1 1.9 2.3 2.4 2.0 2.3 2.44.9 3.6 4.0 3.0 3.0 3.0 2.7 2.9 3.0 2.7 2.8 2.91.9 5.4 2.5 1.7 2.1 2.8 3.5 3.5 3.6 3.6 3.8 3.93.2 2.6 1.5 1.7 2.1 2.5 2.7 2.8 2.5 2.6 2.5 2.63.1 2.4 1.0 1.1 1.3 1.5 1.5 1.6 1.5 1.6 1.6 1.6
2.1 0.9 0.7 0.9 1.4 1.3 1.4 1.4 1.3 1.4 1.43.4 2.3 1.1 1.6 1.9 2.1 2.1 2.1 2.2 2.1 2.1 2.1
: : : : : : : : :
Slovenia
Malta
Spring 2017
USA
Latvia
Croatia
Estonia
Bulgaria
Netherlands
Japan
Sweden
France
Hungary
Winter 2017
Italy
Poland
Greece
Czech Republic
Slovakia
Austria
Euro area
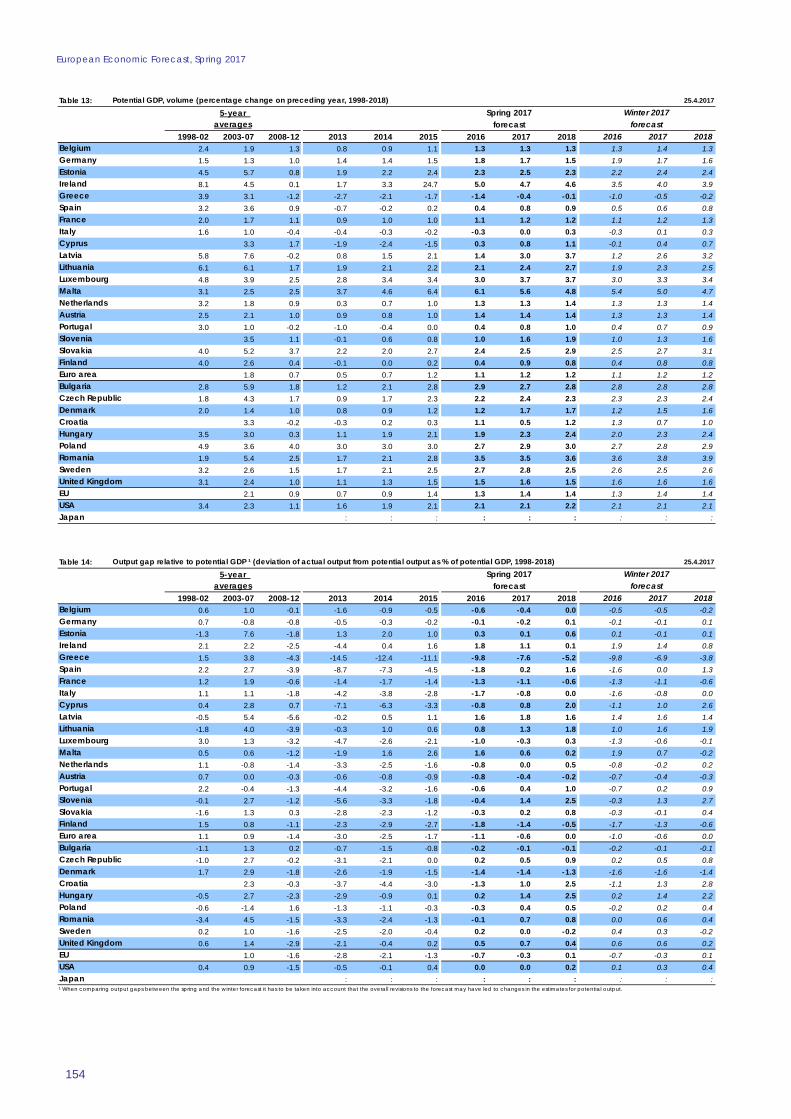
Potential GDP, volume (percentage change on preceding year, 1998-2018)
Finland
Portugal
Luxembourg
EU
averages
Cyprus
forecast
Romania
Spain
Denmark
Germany
Ireland
Belgium
forecast
United Kingdom
Table 14: 25.4.2017
5-year
1998-02 2003-07 2008-12 2013 2014 2015 2016 2017 2018 2016 2017 20180.6 1.0 -0.1 -1.6 -0.9 -0.5 -0.6 -0.4 0.0 -0.5 -0.5 -0.20.7 -0.8 -0.8 -0.5 -0.3 -0.2 -0.1 -0.2 0.1 -0.1 -0.1 0.1
-1.3 7.6 -1.8 1.3 2.0 1.0 0.3 0.1 0.6 0.1 -0.1 0.12.1 2.2 -2.5 -4.4 0.4 1.6 1.8 1.1 0.1 1.9 1.4 0.81.5 3.8 -4.3 -14.5 -12.4 -11.1 -9.8 -7.6 -5.2 -9.8 -6.9 -3.82.2 2.7 -3.9 -8.7 -7.3 -4.5 -1.8 0.2 1.6 -1.6 0.0 1.31.2 1.9 -0.6 -1.4 -1.7 -1.4 -1.3 -1.1 -0.6 -1.3 -1.1 -0.61.1 1.1 -1.8 -4.2 -3.8 -2.8 -1.7 -0.8 0.0 -1.6 -0.8 0.00.4 2.8 0.7 -7.1 -6.3 -3.3 -0.8 0.8 2.0 -1.1 1.0 2.6
-0.5 5.4 -5.6 -0.2 0.5 1.1 1.6 1.8 1.6 1.4 1.6 1.4Lithuania -1.8 4.0 -3.9 -0.3 1.0 0.6 0.8 1.3 1.8 1.0 1.6 1.9
3.0 1.3 -3.2 -4.7 -2.6 -2.1 -1.0 -0.3 0.3 -1.3 -0.6 -0.10.5 0.6 -1.2 -1.9 1.6 2.6 1.6 0.6 0.2 1.9 0.7 -0.21.1 -0.8 -1.4 -3.3 -2.5 -1.6 -0.8 0.0 0.5 -0.8 -0.2 0.20.7 0.0 -0.3 -0.6 -0.8 -0.9 -0.8 -0.4 -0.2 -0.7 -0.4 -0.32.2 -0.4 -1.3 -4.4 -3.2 -1.6 -0.6 0.4 1.0 -0.7 0.2 0.9
-0.1 2.7 -1.2 -5.6 -3.3 -1.8 -0.4 1.4 2.5 -0.3 1.3 2.7-1.6 1.3 0.3 -2.8 -2.3 -1.2 -0.3 0.2 0.8 -0.3 -0.1 0.41.5 0.8 -1.1 -2.3 -2.9 -2.7 -1.8 -1.4 -0.5 -1.7 -1.3 -0.61.1 0.9 -1.4 -3.0 -2.5 -1.7 -1.1 -0.6 0.0 -1.0 -0.6 0.0
-1.1 1.3 0.2 -0.7 -1.5 -0.8 -0.2 -0.1 -0.1 -0.2 -0.1 -0.1-1.0 2.7 -0.2 -3.1 -2.1 0.0 0.2 0.5 0.9 0.2 0.5 0.81.7 2.9 -1.8 -2.6 -1.9 -1.5 -1.4 -1.4 -1.3 -1.6 -1.6 -1.4
2.3 -0.3 -3.7 -4.4 -3.0 -1.3 1.0 2.5 -1.1 1.3 2.8-0.5 2.7 -2.3 -2.9 -0.9 0.1 0.2 1.4 2.5 0.2 1.4 2.2-0.6 -1.4 1.6 -1.3 -1.1 -0.3 -0.3 0.4 0.5 -0.2 0.2 0.4-3.4 4.5 -1.5 -3.3 -2.4 -1.3 -0.1 0.7 0.8 0.0 0.6 0.40.2 1.0 -1.6 -2.5 -2.0 -0.4 0.2 0.0 -0.2 0.4 0.3 -0.20.6 1.4 -2.9 -2.1 -0.4 0.2 0.5 0.7 0.4 0.6 0.6 0.2
1.0 -1.6 -2.8 -2.1 -1.3 -0.7 -0.3 0.1 -0.7 -0.3 0.10.4 0.9 -1.5 -0.5 -0.1 0.4 0.0 0.0 0.2 0.1 0.3 0.4
: : : : : : : : :
Slovenia
Malta
Spring 2017
USA
Latvia
Croatia
Estonia
Bulgaria
Netherlands
Japan
Sweden
France
Hungary
Winter 2017
¹ When comparing output gaps between the spring and the winter forecast it has to be taken into account that the overall revisions to the forecast may have led to changes in the estimates for potential output.
Italy
Poland
Greece
Czech Republic
Slovakia
Austria
Euro area
Output gap relative to potential GDP ¹ (deviation of actual output from potential output as % of potential GDP, 1998-2018)
Finland
Portugal
Luxembourg
EU
averages
Cyprus
forecast
Romania
Spain
Denmark
Germany
Ireland
Belgium
forecast
United Kingdom
Statistical Annex
155
Table 15: 25.4.2017
5-year
1998-02 2003-07 2008-12 2013 2014 2015 2016 2017 2018 2016 2017 20181.6 2.1 1.8 1.2 0.7 0.9 1.6 1.8 1.6 1.6 1.7 1.80.6 1.0 1.2 2.0 1.8 2.0 1.4 1.4 1.6 1.4 1.8 1.66.1 7.1 3.6 3.9 1.7 1.0 1.7 3.6 3.3 2.4 3.1 3.05.8 2.4 -0.7 1.4 -1.2 4.9 -1.2 1.2 1.3 -0.3 1.2 1.23.4 3.1 1.6 -2.4 -1.8 -1.0 0.1 1.2 1.2 0.0 1.3 1.23.3 3.9 0.5 0.4 -0.3 0.5 0.3 1.1 1.4 0.4 1.4 1.61.4 2.0 1.1 0.8 0.5 0.6 0.8 0.9 1.3 0.8 0.9 1.22.5 2.4 1.5 1.2 1.0 0.7 0.8 0.8 1.2 0.9 0.9 1.12.6 3.9 2.1 -1.0 -1.5 -1.3 -1.3 0.8 0.9 -1.0 1.0 1.23.5 11.0 2.0 1.5 1.6 0.4 0.7 3.1 2.7 0.6 1.5 2.6
Lithuania 0.7 4.8 3.3 1.4 1.0 0.2 1.2 2.9 2.5 1.7 2.1 2.31.6 3.7 3.2 1.5 1.6 0.7 -0.6 2.4 2.3 1.6 1.8 2.22.3 2.4 2.8 2.0 2.0 2.4 1.6 1.6 1.8 1.7 2.1 2.43.0 2.0 1.1 1.4 0.1 0.1 0.8 0.9 1.2 0.5 0.8 0.81.0 2.0 1.7 1.6 1.8 1.9 1.3 1.4 1.5 1.7 1.4 1.63.7 3.1 0.6 2.3 0.8 2.1 1.6 1.4 1.4 1.5 1.4 1.47.1 3.4 1.6 0.9 0.8 1.0 0.6 1.5 1.8 1.4 1.0 1.96.1 3.5 1.0 0.5 -0.2 -0.2 -0.4 0.8 1.5 -0.2 0.9 1.52.0 1.1 2.2 2.6 1.7 1.7 0.8 0.5 1.2 0.9 1.0 0.91.8 2.1 1.2 1.2 0.9 1.1 0.9 1.1 1.4 1.0 1.3 1.4
10.0 6.4 4.1 -0.7 0.5 2.2 1.1 1.0 1.5 -0.4 1.0 1.44.4 1.9 0.9 1.4 2.5 1.0 1.1 1.6 1.7 1.1 1.2 1.62.2 2.2 2.2 0.9 0.8 0.9 0.4 1.6 1.7 0.0 1.4 1.84.8 3.9 2.5 0.8 0.0 0.1 -0.1 1.4 1.6 0.7 0.9 1.8
10.2 4.3 3.4 2.9 3.4 1.7 1.0 2.9 3.3 2.3 2.8 3.25.6 2.7 3.0 0.3 0.5 0.8 0.2 1.4 2.0 0.7 1.6 2.1
39.9 14.8 7.0 3.4 1.7 2.4 2.2 1.5 2.8 1.7 2.3 2.51.5 1.5 1.8 1.1 1.8 2.0 1.4 2.3 2.0 2.4 2.3 2.21.4 2.6 1.9 1.9 1.6 0.6 1.7 1.6 1.9 1.1 1.9 2.62.0 2.3 1.5 1.3 1.0 1.1 1.0 1.3 1.6 1.0 1.5 1.61.7 2.7 1.6 1.6 1.8 1.1 1.3 1.9 2.2 1.3 2.0 2.4
-1.1 -1.1 -1.2 -0.3 1.7 2.0 0.3 0.2 0.4 0.2 -0.1 0.5
Slovenia
Malta
Spring 2017
USA
Latvia
Croatia
Estonia
Bulgaria
Netherlands
Japan
Sweden
France
Hungary
Winter 2017
Italy
Poland
Greece
Czech Republic
Slovakia
Austria
Euro area
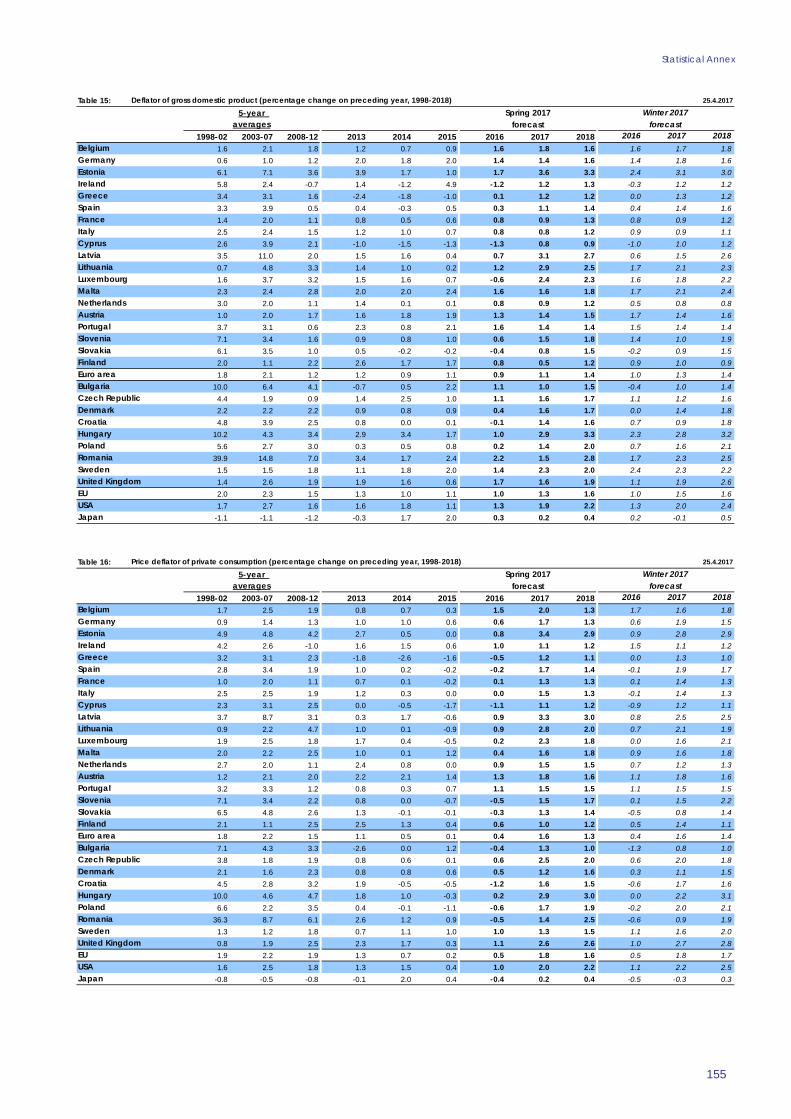
Deflator of gross domestic product (percentage change on preceding year, 1998-2018)
Finland
Portugal
Luxembourg
EU
averages
Cyprus
forecast
Romania
Spain
Denmark
Germany
Ireland
Belgium
forecast
United Kingdom
Table 16: 25.4.2017
5-year
1998-02 2003-07 2008-12 2013 2014 2015 2016 2017 2018 2016 2017 20181.7 2.5 1.9 0.8 0.7 0.3 1.5 2.0 1.3 1.7 1.6 1.80.9 1.4 1.3 1.0 1.0 0.6 0.6 1.7 1.3 0.6 1.9 1.54.9 4.8 4.2 2.7 0.5 0.0 0.8 3.4 2.9 0.9 2.8 2.94.2 2.6 -1.0 1.6 1.5 0.6 1.0 1.1 1.2 1.5 1.1 1.23.2 3.1 2.3 -1.8 -2.6 -1.6 -0.5 1.2 1.1 0.0 1.3 1.02.8 3.4 1.9 1.0 0.2 -0.2 -0.2 1.7 1.4 -0.1 1.9 1.71.0 2.0 1.1 0.7 0.1 -0.2 0.1 1.3 1.3 0.1 1.4 1.32.5 2.5 1.9 1.2 0.3 0.0 0.0 1.5 1.3 -0.1 1.4 1.32.3 3.1 2.5 0.0 -0.5 -1.7 -1.1 1.1 1.2 -0.9 1.2 1.13.7 8.7 3.1 0.3 1.7 -0.6 0.9 3.3 3.0 0.8 2.5 2.5
Lithuania 0.9 2.2 4.7 1.0 0.1 -0.9 0.9 2.8 2.0 0.7 2.1 1.91.9 2.5 1.8 1.7 0.4 -0.5 0.2 2.3 1.8 0.0 1.6 2.12.0 2.2 2.5 1.0 0.1 1.2 0.4 1.6 1.8 0.9 1.6 1.82.7 2.0 1.1 2.4 0.8 0.0 0.9 1.5 1.5 0.7 1.2 1.31.2 2.1 2.0 2.2 2.1 1.4 1.3 1.8 1.6 1.1 1.8 1.63.2 3.3 1.2 0.8 0.3 0.7 1.1 1.5 1.5 1.1 1.5 1.57.1 3.4 2.2 0.8 0.0 -0.7 -0.5 1.5 1.7 0.1 1.5 2.26.5 4.8 2.6 1.3 -0.1 -0.1 -0.3 1.3 1.4 -0.5 0.8 1.42.1 1.1 2.5 2.5 1.3 0.4 0.6 1.0 1.2 0.5 1.4 1.11.8 2.2 1.5 1.1 0.5 0.1 0.4 1.6 1.3 0.4 1.6 1.47.1 4.3 3.3 -2.6 0.0 1.2 -0.4 1.3 1.0 -1.3 0.8 1.03.8 1.8 1.9 0.8 0.6 0.1 0.6 2.5 2.0 0.6 2.0 1.82.1 1.6 2.3 0.8 0.8 0.6 0.5 1.2 1.6 0.3 1.1 1.54.5 2.8 3.2 1.9 -0.5 -0.5 -1.2 1.6 1.5 -0.6 1.7 1.6
10.0 4.6 4.7 1.8 1.0 -0.3 0.2 2.9 3.0 0.0 2.2 3.16.6 2.2 3.5 0.4 -0.1 -1.1 -0.6 1.7 1.9 -0.2 2.0 2.1
36.3 8.7 6.1 2.6 1.2 0.9 -0.5 1.4 2.5 -0.6 0.9 1.91.3 1.2 1.8 0.7 1.1 1.0 1.0 1.3 1.5 1.1 1.6 2.00.8 1.9 2.5 2.3 1.7 0.3 1.1 2.6 2.6 1.0 2.7 2.81.9 2.2 1.9 1.3 0.7 0.2 0.5 1.8 1.6 0.5 1.8 1.71.6 2.5 1.8 1.3 1.5 0.4 1.0 2.0 2.2 1.1 2.2 2.5
-0.8 -0.5 -0.8 -0.1 2.0 0.4 -0.4 0.2 0.4 -0.5 -0.3 0.3
Slovenia
Malta
Spring 2017
USA
Latvia
Croatia
Estonia
Bulgaria
Netherlands
Japan
Sweden
France
Hungary
Winter 2017
Italy
Poland
Greece
Czech Republic
Slovakia
Austria
Euro area
Price deflator of private consumption (percentage change on preceding year, 1998-2018)
Finland
Portugal
Luxembourg
EU
averages
Cyprus
forecast
Romania
Spain
Denmark
Germany
Ireland
Belgium
forecast
United Kingdom
European Economic Forecast, Spring 2017
156
Table 17: 25.4.2017
5-year
1998-02 2003-07 2008-12 2013 2014 2015 2016 2017 2018 2016 2017 20181.7 2.0 2.6 1.2 0.5 0.6 1.8 2.3 1.5 1.8 2.0 1.81.2 1.8 1.7 1.6 0.8 0.1 0.4 1.7 1.4 0.4 1.9 1.55.0 3.9 4.6 3.2 0.5 0.1 0.8 3.3 2.9 0.8 2.8 2.83.7 2.8 0.6 0.5 0.3 0.0 -0.2 0.6 1.2 -0.2 0.9 1.03.4 3.3 2.9 -0.9 -1.4 -1.1 0.0 1.2 1.1 0.0 1.3 1.02.8 3.2 2.3 1.5 -0.2 -0.6 -0.3 2.0 1.4 -0.3 1.9 1.71.4 2.0 1.9 1.0 0.6 0.1 0.3 1.4 1.3 0.3 1.5 1.32.2 2.3 2.4 1.2 0.2 0.1 -0.1 1.5 1.3 -0.1 1.4 1.32.6 2.5 2.7 0.4 -0.3 -1.5 -1.2 1.2 1.1 -1.2 1.2 1.12.7 6.5 4.8 0.0 0.7 0.2 0.1 2.2 2.0 0.1 1.9 2.0
Lithuania 2.0 2.5 4.7 1.2 0.2 -0.7 0.7 2.8 2.0 0.7 2.1 1.92.0 3.0 2.7 1.7 0.7 0.1 0.0 2.4 1.8 0.0 2.0 2.12.8 2.1 2.9 1.0 0.8 1.2 0.9 1.6 1.8 0.9 1.6 1.83.0 1.7 1.9 2.6 0.3 0.2 0.1 1.6 1.3 0.1 1.4 1.41.5 1.9 2.3 2.1 1.5 0.8 1.0 1.8 1.6 1.0 1.8 1.63.1 2.7 1.9 0.4 -0.2 0.5 0.6 1.4 1.5 0.6 1.3 1.47.8 3.6 2.7 1.9 0.4 -0.8 -0.2 1.5 1.8 -0.2 1.1 2.38.0 5.0 2.7 1.5 -0.1 -0.3 -0.5 1.4 1.6 -0.5 0.9 1.42.1 1.0 2.7 2.2 1.2 -0.2 0.4 1.0 1.2 0.4 1.5 1.21.9 2.2 2.1 1.3 0.4 0.0 0.2 1.6 1.3 0.2 1.7 1.48.9 5.9 4.6 0.4 -1.6 -1.1 -1.3 1.3 1.5 -1.3 0.8 1.24.3 1.8 2.8 1.4 0.4 0.3 0.6 2.5 2.0 0.6 2.0 1.82.2 1.6 2.4 0.5 0.4 0.2 0.0 1.4 1.7 0.0 1.4 1.6
2.7 2.9 2.3 0.2 -0.3 -0.6 1.6 1.5 -0.6 1.7 1.69.7 5.4 4.9 1.7 0.0 0.1 0.4 2.9 3.2 0.4 2.2 3.17.3 2.1 3.7 0.8 0.1 -0.7 -0.2 1.8 2.1 -0.2 2.0 2.1
41.5 9.5 5.8 3.2 1.4 -0.4 -1.1 1.1 3.0 -1.1 1.6 2.91.5 1.5 1.9 0.4 0.2 0.7 1.1 1.4 1.4 1.1 1.7 1.81.2 1.9 3.3 2.6 1.5 0.0 0.7 2.6 2.6 0.7 2.5 2.63.4 2.3 2.5 1.5 0.5 0.0 0.3 1.8 1.7 0.3 1.8 1.7
2.9 2.1 1.5 1.6 0.1 1.3 2.2 2.3 1.3 2.4 2.5-0.4 0.0 -0.2 0.3 2.8 0.8 -0.1 0.4 1.0 -0.1 0.4 0.6
Slovenia
Malta
Spring 2017
USA
Latvia
Croatia
Estonia
Bulgaria
Netherlands
Japan
Sweden
France
Hungary
Winter 2017
Italy
Poland
Greece
Czech Republic
Slovakia
Austria
Euro area
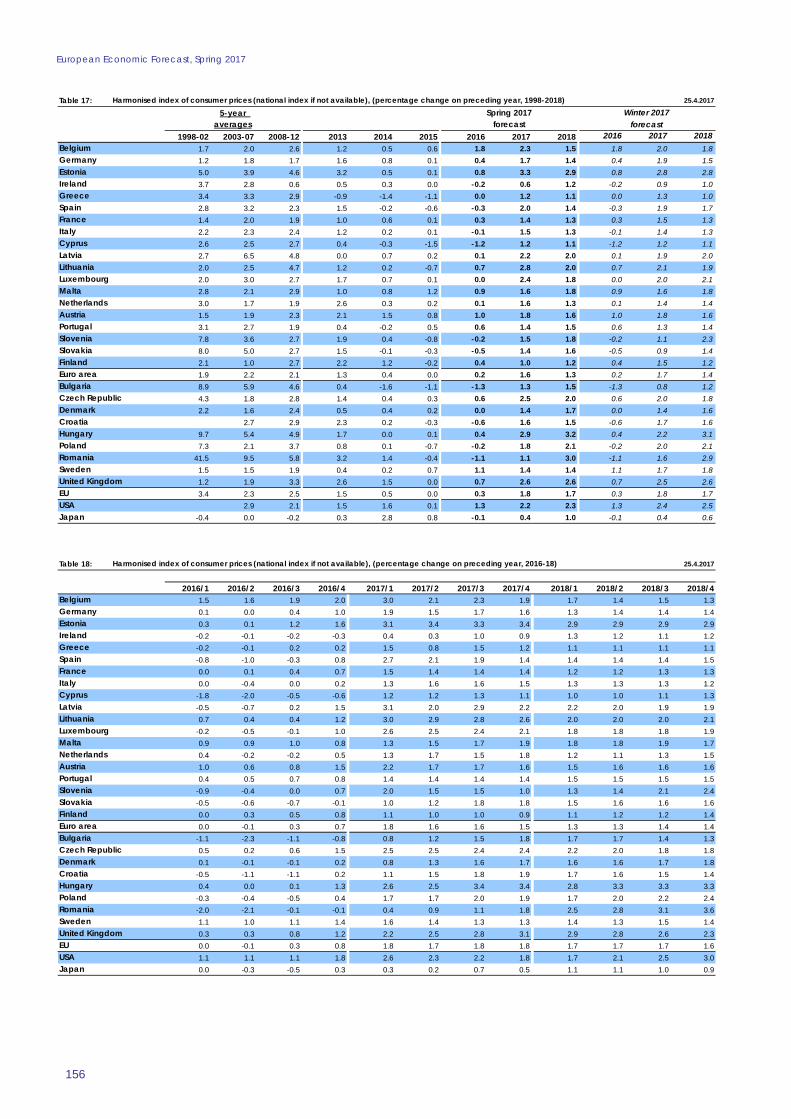
Harmonised index of consumer prices (national index if not available), (percentage change on preceding year, 1998-2018)
Finland
Portugal
Luxembourg
EU
averages
Cyprus
forecast
Romania
Spain
Denmark
Germany
Ireland
Belgium
forecast
United Kingdom
Table 18: 25.4.2017
2016/1 2016/2 2016/3 2016/4 2017/1 2017/2 2017/3 2017/4 2018/1 2018/2 2018/3 2018/41.5 1.6 1.9 2.0 3.0 2.1 2.3 1.9 1.7 1.4 1.5 1.30.1 0.0 0.4 1.0 1.9 1.5 1.7 1.6 1.3 1.4 1.4 1.40.3 0.1 1.2 1.6 3.1 3.4 3.3 3.4 2.9 2.9 2.9 2.9
-0.2 -0.1 -0.2 -0.3 0.4 0.3 1.0 0.9 1.3 1.2 1.1 1.2-0.2 -0.1 0.2 0.2 1.5 0.8 1.5 1.2 1.1 1.1 1.1 1.1-0.8 -1.0 -0.3 0.8 2.7 2.1 1.9 1.4 1.4 1.4 1.4 1.50.0 0.1 0.4 0.7 1.5 1.4 1.4 1.4 1.2 1.2 1.3 1.30.0 -0.4 0.0 0.2 1.3 1.6 1.6 1.5 1.3 1.3 1.3 1.2
-1.8 -2.0 -0.5 -0.6 1.2 1.2 1.3 1.1 1.0 1.0 1.1 1.3-0.5 -0.7 0.2 1.5 3.1 2.0 2.9 2.2 2.2 2.0 1.9 1.9
Lithuania 0.7 0.4 0.4 1.2 3.0 2.9 2.8 2.6 2.0 2.0 2.0 2.1-0.2 -0.5 -0.1 1.0 2.6 2.5 2.4 2.1 1.8 1.8 1.8 1.90.9 0.9 1.0 0.8 1.3 1.5 1.7 1.9 1.8 1.8 1.9 1.70.4 -0.2 -0.2 0.5 1.3 1.7 1.5 1.8 1.2 1.1 1.3 1.51.0 0.6 0.8 1.5 2.2 1.7 1.7 1.6 1.5 1.6 1.6 1.60.4 0.5 0.7 0.8 1.4 1.4 1.4 1.4 1.5 1.5 1.5 1.5
-0.9 -0.4 0.0 0.7 2.0 1.5 1.5 1.0 1.3 1.4 2.1 2.4-0.5 -0.6 -0.7 -0.1 1.0 1.2 1.8 1.8 1.5 1.6 1.6 1.60.0 0.3 0.5 0.8 1.1 1.0 1.0 0.9 1.1 1.2 1.2 1.40.0 -0.1 0.3 0.7 1.8 1.6 1.6 1.5 1.3 1.3 1.4 1.4
-1.1 -2.3 -1.1 -0.8 0.8 1.2 1.5 1.8 1.7 1.7 1.4 1.30.5 0.2 0.6 1.5 2.5 2.5 2.4 2.4 2.2 2.0 1.8 1.80.1 -0.1 -0.1 0.2 0.8 1.3 1.6 1.7 1.6 1.6 1.7 1.8
-0.5 -1.1 -1.1 0.2 1.1 1.5 1.8 1.9 1.7 1.6 1.5 1.40.4 0.0 0.1 1.3 2.6 2.5 3.4 3.4 2.8 3.3 3.3 3.3
-0.3 -0.4 -0.5 0.4 1.7 1.7 2.0 1.9 1.7 2.0 2.2 2.4-2.0 -2.1 -0.1 -0.1 0.4 0.9 1.1 1.8 2.5 2.8 3.1 3.61.1 1.0 1.1 1.4 1.6 1.4 1.3 1.3 1.4 1.3 1.5 1.40.3 0.3 0.8 1.2 2.2 2.5 2.8 3.1 2.9 2.8 2.6 2.30.0 -0.1 0.3 0.8 1.8 1.7 1.8 1.8 1.7 1.7 1.7 1.61.1 1.1 1.1 1.8 2.6 2.3 2.2 1.8 1.7 2.1 2.5 3.00.0 -0.3 -0.5 0.3 0.3 0.2 0.7 0.5 1.1 1.1 1.0 0.9
Harmonised index of consumer prices (national index if not available), (percentage change on preceding year, 2016-18)
United Kingdom
Euro area
Germany
Hungary
Portugal
France
Greece
Denmark
Finland
Latvia
Belgium
Sweden
Croatia
Estonia
EU
Bulgaria
Luxembourg
Italy
Poland
Slovenia
Malta
Ireland
Czech Republic
Cyprus
Romania
Slovakia
NetherlandsAustria
Spain
USAJapan
Statistical Annex
157
Table 19: 25.4.2017
5-year
1998-02 2003-07 2008-12 2013 2014 2015 2016 2017 2018 2016 2017 20180.7 1.8 1.5 -0.6 -1.4 -3.3 -2.4 2.9 1.4 -3.2 2.8 1.40.1 0.2 1.1 -0.7 -0.5 0.8 -1.0 2.3 1.1 -1.0 1.7 1.62.5 3.2 2.6 -0.1 -1.7 -1.8 -0.1 4.3 1.7 -1.2 4.5 2.01.1 -1.0 0.5 -2.8 -0.2 9.9 -3.6 1.2 1.2 -2.0 0.5 0.83.1 2.1 4.1 -1.9 -3.1 -11.5 -5.0 6.8 1.3 -7.8 6.9 1.51.2 2.1 1.8 -1.2 -2.2 0.5 -1.6 2.0 1.2 -1.9 1.4 1.2
-0.9 0.8 1.1 -0.5 -1.2 -0.6 -1.5 2.7 0.1 -1.8 1.4 0.01.9 1.4 1.8 -0.6 -0.3 -0.5 -1.1 3.2 1.3 -1.0 2.4 1.11.5 3.5 1.8 2.1 1.3 0.8 -0.9 2.4 1.1 -0.9 4.5 1.10.1 11.0 4.3 1.8 -1.4 0.2 -2.5 5.0 1.5 -1.9 2.3 2.0
Lithuania -1.1 5.3 4.6 -1.9 -3.2 -5.3 -3.0 6.0 2.0 -8.0 5.0 2.0-0.2 4.0 2.9 -1.9 -0.1 -2.4 0.3 3.9 1.1 -2.0 1.9 1.63.0 1.3 1.8 -3.9 -2.6 1.7 -1.0 6.5 1.5 0.2 4.9 1.5
-0.3 1.6 2.2 -1.4 -2.6 -3.9 -3.3 3.8 2.0 -4.8 2.0 2.00.3 1.4 1.3 -0.9 -0.9 -1.0 -1.2 1.2 1.0 -0.8 0.8 1.11.1 1.3 1.6 -1.6 -1.9 -2.1 -3.2 2.6 1.4 -3.3 2.8 1.75.2 2.4 1.2 -1.2 -0.4 -0.6 -1.9 3.0 1.2 -2.9 1.3 1.13.1 1.6 0.6 -2.2 -3.6 -1.3 -1.7 1.1 1.3 -0.5 0.8 1.0
-2.0 0.2 -0.1 -1.8 -0.9 -1.8 -3.1 5.3 1.5 -3.0 3.1 1.80.3 0.9 1.4 -0.9 -1.2 -0.3 -1.8 2.7 1.2 -2.0 1.8 1.34.5 12.0 3.8 -3.6 -2.2 -2.3 -3.5 1.5 2.0 -2.5 1.5 2.00.1 -0.2 -0.4 1.6 3.8 -1.5 -4.5 2.2 1.0 -3.5 2.0 1.40.9 2.2 2.5 -0.5 0.1 1.5 -0.2 3.2 1.2 0.0 1.6 2.35.2 3.4 3.1 -2.0 -1.7 -2.3 -3.1 2.9 2.9 -2.5 1.4 1.84.6 -0.2 2.2 -0.1 1.0 -0.3 -0.8 2.0 1.8 -0.9 0.3 0.45.2 3.4 4.6 0.5 0.0 1.6 -0.3 1.6 1.9 -0.5 1.5 1.9
33.2 6.6 8.5 -5.8 -1.1 0.4 -0.9 4.1 2.9 0.1 4.0 2.8-0.4 0.8 0.2 -3.2 2.1 1.2 -1.9 4.7 1.5 0.5 3.6 1.5-1.7 1.0 5.0 1.2 -4.7 -8.4 5.8 4.0 2.9 3.0 3.6 2.70.3 1.0 1.9 -0.7 -1.1 -0.9 -1.1 2.8 1.4 -1.4 2.0 1.5
-0.8 3.2 2.1 -0.7 -0.9 -6.8 -3.5 1.4 0.6 -3.5 1.6 0.7-2.6 0.2 -4.4 10.4 2.8 0.7 -8.9 6.5 1.0 -9.5 1.8 1.8
Slovenia
Malta
Spring 2017
USA
Latvia
Croatia
Estonia
Bulgaria
Netherlands
Japan
Sweden
France
Hungary
Winter 2017
Italy
Poland
Greece
Czech Republic
Slovakia
Austria
Euro area
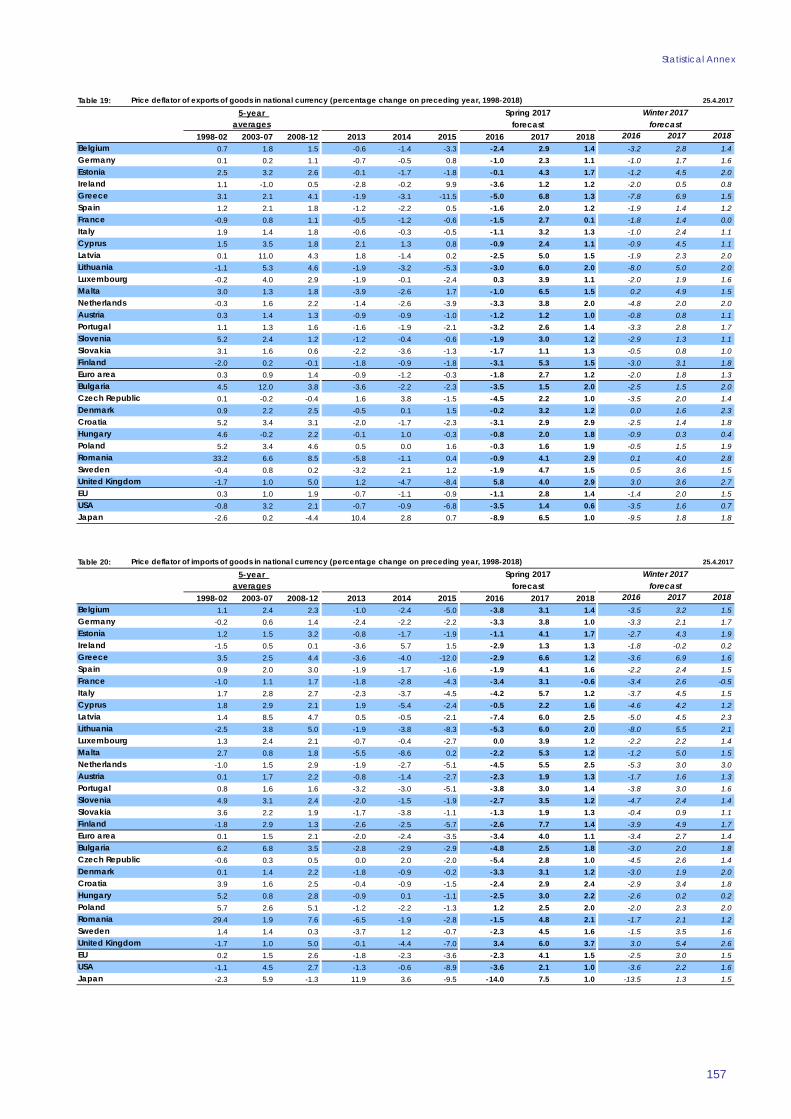
Price deflator of exports of goods in national currency (percentage change on preceding year, 1998-2018)
Finland
Portugal
Luxembourg
EU
averages
Cyprus
forecast
Romania
Spain
Denmark
Germany
Ireland
Belgium
forecast
United Kingdom
Table 20: 25.4.2017
5-year
1998-02 2003-07 2008-12 2013 2014 2015 2016 2017 2018 2016 2017 20181.1 2.4 2.3 -1.0 -2.4 -5.0 -3.8 3.1 1.4 -3.5 3.2 1.5
-0.2 0.6 1.4 -2.4 -2.2 -2.2 -3.3 3.8 1.0 -3.3 2.1 1.71.2 1.5 3.2 -0.8 -1.7 -1.9 -1.1 4.1 1.7 -2.7 4.3 1.9
-1.5 0.5 0.1 -3.6 5.7 1.5 -2.9 1.3 1.3 -1.8 -0.2 0.23.5 2.5 4.4 -3.6 -4.0 -12.0 -2.9 6.6 1.2 -3.6 6.9 1.60.9 2.0 3.0 -1.9 -1.7 -1.6 -1.9 4.1 1.6 -2.2 2.4 1.5
-1.0 1.1 1.7 -1.8 -2.8 -4.3 -3.4 3.1 -0.6 -3.4 2.6 -0.51.7 2.8 2.7 -2.3 -3.7 -4.5 -4.2 5.7 1.2 -3.7 4.5 1.51.8 2.9 2.1 1.9 -5.4 -2.4 -0.5 2.2 1.6 -4.6 4.2 1.21.4 8.5 4.7 0.5 -0.5 -2.1 -7.4 6.0 2.5 -5.0 4.5 2.3
Lithuania -2.5 3.8 5.0 -1.9 -3.8 -8.3 -5.3 6.0 2.0 -8.0 5.5 2.11.3 2.4 2.1 -0.7 -0.4 -2.7 0.0 3.9 1.2 -2.2 2.2 1.42.7 0.8 1.8 -5.5 -8.6 0.2 -2.2 5.3 1.2 -1.2 5.0 1.5
-1.0 1.5 2.9 -1.9 -2.7 -5.1 -4.5 5.5 2.5 -5.3 3.0 3.00.1 1.7 2.2 -0.8 -1.4 -2.7 -2.3 1.9 1.3 -1.7 1.6 1.30.8 1.6 1.6 -3.2 -3.0 -5.1 -3.8 3.0 1.4 -3.8 3.0 1.64.9 3.1 2.4 -2.0 -1.5 -1.9 -2.7 3.5 1.2 -4.7 2.4 1.43.6 2.2 1.9 -1.7 -3.8 -1.1 -1.3 1.9 1.3 -0.4 0.9 1.1
-1.8 2.9 1.3 -2.6 -2.5 -5.7 -2.6 7.7 1.4 -3.9 4.9 1.70.1 1.5 2.1 -2.0 -2.4 -3.5 -3.4 4.0 1.1 -3.4 2.7 1.46.2 6.8 3.5 -2.8 -2.9 -2.9 -4.8 2.5 1.8 -3.0 2.0 1.8
-0.6 0.3 0.5 0.0 2.0 -2.0 -5.4 2.8 1.0 -4.5 2.6 1.40.1 1.4 2.2 -1.8 -0.9 -0.2 -3.3 3.1 1.2 -3.0 1.9 2.03.9 1.6 2.5 -0.4 -0.9 -1.5 -2.4 2.9 2.4 -2.9 3.4 1.85.2 0.8 2.8 -0.9 0.1 -1.1 -2.5 3.0 2.2 -2.6 0.2 0.25.7 2.6 5.1 -1.2 -2.2 -1.3 1.2 2.5 2.0 -2.0 2.3 2.0
29.4 1.9 7.6 -6.5 -1.9 -2.8 -1.5 4.8 2.1 -1.7 2.1 1.21.4 1.4 0.3 -3.7 1.2 -0.7 -2.3 4.5 1.6 -1.5 3.5 1.6
-1.7 1.0 5.0 -0.1 -4.4 -7.0 3.4 6.0 3.7 3.0 5.4 2.60.2 1.5 2.6 -1.8 -2.3 -3.6 -2.3 4.1 1.5 -2.5 3.0 1.5
-1.1 4.5 2.7 -1.3 -0.6 -8.9 -3.6 2.1 1.0 -3.6 2.2 1.6-2.3 5.9 -1.3 11.9 3.6 -9.5 -14.0 7.5 1.0 -13.5 1.3 1.5
Slovenia
Malta
Spring 2017
USA
Latvia
Croatia
Estonia
Bulgaria
Netherlands
Japan
Sweden
France
Hungary
Winter 2017
Italy
Poland
Greece
Czech Republic
Slovakia
Austria
Euro area
Price deflator of imports of goods in national currency (percentage change on preceding year, 1998-2018)
Finland
Portugal
Luxembourg
EU
averages
Cyprus
forecast
Romania
Spain
Denmark
Germany
Ireland
Belgium
forecast
United Kingdom
European Economic Forecast, Spring 2017
158
Table 21: 25.4.2017
5-year
1998-02 2003-07 2008-12 2013 2014 2015 2016 2017 2018 2016 2017 2018-0.5 -0.6 -0.8 0.4 1.0 1.8 1.4 -0.2 0.0 0.3 -0.3 -0.10.3 -0.4 -0.3 1.8 1.7 3.1 2.3 -1.4 0.1 2.4 -0.5 0.01.2 1.6 -0.6 0.8 0.0 0.1 1.1 0.2 0.0 1.5 0.2 0.12.7 -1.6 0.4 0.9 -5.6 8.3 -0.8 -0.1 -0.1 -0.2 0.7 0.6
-0.4 -0.3 -0.3 1.7 0.9 0.6 -2.2 0.2 0.1 -4.4 0.0 -0.10.3 0.1 -1.2 0.6 -0.5 2.0 0.3 -2.0 -0.4 0.3 -1.0 -0.30.0 -0.3 -0.6 1.3 1.6 3.8 1.9 -0.4 0.7 1.7 -1.2 0.50.2 -1.4 -0.9 1.8 3.5 4.1 3.2 -2.4 0.1 2.8 -2.1 -0.4
-0.3 0.6 -0.2 0.2 7.1 3.2 -0.4 0.2 -0.5 3.9 0.3 -0.1-1.3 2.3 -0.4 1.3 -0.9 2.4 5.3 -0.9 -1.0 3.3 -2.1 -0.3
Lithuania 1.5 1.4 -0.4 0.0 0.6 3.2 2.4 0.0 0.0 0.0 -0.5 -0.1-1.4 1.6 0.8 -1.3 0.3 0.3 0.3 0.0 -0.1 0.2 -0.3 0.20.2 0.5 0.0 1.7 6.6 1.4 1.2 1.1 0.3 1.4 -0.1 0.00.8 0.1 -0.6 0.5 0.1 1.3 1.3 -1.6 -0.5 0.5 -1.0 -1.00.2 -0.3 -0.8 -0.1 0.5 1.8 1.1 -0.7 -0.3 0.9 -0.8 -0.20.3 -0.3 -0.1 1.7 1.2 3.2 0.6 -0.3 0.0 0.5 -0.2 0.10.2 -0.7 -1.1 0.8 1.1 1.3 0.8 -0.5 0.0 1.9 -1.1 -0.3
-0.5 -0.6 -1.3 -0.5 0.2 -0.2 -0.3 -0.8 0.0 -0.1 -0.1 -0.1-0.2 -2.6 -1.3 0.8 1.7 4.1 -0.5 -2.2 0.1 0.9 -1.7 0.10.2 -0.6 -0.7 1.2 1.2 3.2 1.6 -1.3 0.1 1.5 -0.9 -0.1
-1.7 4.9 0.3 -0.8 0.7 0.6 1.4 -1.0 0.2 0.5 -0.5 0.20.7 -0.5 -0.9 1.5 1.8 0.5 0.9 -0.6 0.0 1.0 -0.6 0.00.8 0.8 0.4 1.4 1.0 1.7 3.2 0.1 0.0 3.1 -0.3 0.31.2 1.8 0.6 -1.6 -0.9 -0.8 -0.7 0.0 0.5 0.4 -1.9 0.0
-0.6 -1.0 -0.6 0.8 1.0 0.8 1.8 -1.0 -0.4 1.7 0.1 0.2-0.5 0.8 -0.4 1.7 2.2 2.9 -1.4 -0.9 -0.1 1.5 -0.8 -0.12.9 4.6 0.8 0.8 0.8 3.2 0.5 -0.7 0.8 1.9 1.8 1.6
-1.7 -0.6 -0.1 0.5 0.9 1.9 0.4 0.2 -0.1 2.1 0.1 -0.10.0 0.0 0.0 1.4 -0.4 -1.5 2.3 -1.9 -0.8 0.0 -1.7 0.10.0 -0.4 -0.6 1.3 1.0 2.3 1.8 -1.1 -0.1 1.6 -0.7 -0.10.3 -1.2 -0.6 0.7 -0.2 2.3 0.1 -0.6 -0.4 0.1 -0.7 -0.9
-0.3 -5.4 -3.2 -1.4 -0.7 11.2 5.9 -0.9 0.0 4.6 0.5 0.3
Slovenia
Malta
Spring 2017
USA
Latvia
Croatia
Estonia
Bulgaria
Netherlands
Japan
Sweden
France
Hungary
Winter 2017
Italy
Poland
Greece
Czech Republic
Slovakia
Austria
Euro area
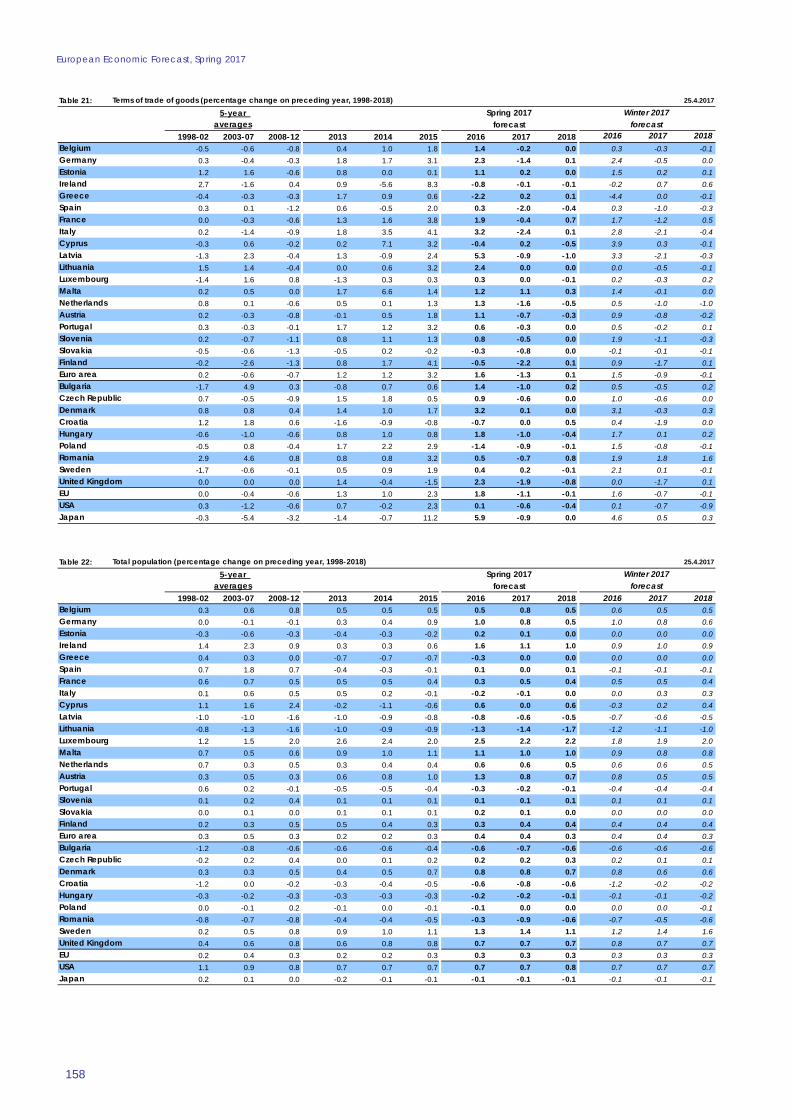
Terms of trade of goods (percentage change on preceding year, 1998-2018)
Finland
Portugal
Luxembourg
EU
averages
Cyprus
forecast
Romania
Spain
Denmark
Germany
Ireland
Belgium
forecast
United Kingdom
Table 22: 25.4.2017
5-year
1998-02 2003-07 2008-12 2013 2014 2015 2016 2017 2018 2016 2017 20180.3 0.6 0.8 0.5 0.5 0.5 0.5 0.8 0.5 0.6 0.5 0.50.0 -0.1 -0.1 0.3 0.4 0.9 1.0 0.8 0.5 1.0 0.8 0.6
-0.3 -0.6 -0.3 -0.4 -0.3 -0.2 0.2 0.1 0.0 0.0 0.0 0.01.4 2.3 0.9 0.3 0.3 0.6 1.6 1.1 1.0 0.9 1.0 0.90.4 0.3 0.0 -0.7 -0.7 -0.7 -0.3 0.0 0.0 0.0 0.0 0.00.7 1.8 0.7 -0.4 -0.3 -0.1 0.1 0.0 0.1 -0.1 -0.1 -0.10.6 0.7 0.5 0.5 0.5 0.4 0.3 0.5 0.4 0.5 0.5 0.40.1 0.6 0.5 0.5 0.2 -0.1 -0.2 -0.1 0.0 0.0 0.3 0.31.1 1.6 2.4 -0.2 -1.1 -0.6 0.6 0.0 0.6 -0.3 0.2 0.4
-1.0 -1.0 -1.6 -1.0 -0.9 -0.8 -0.8 -0.6 -0.5 -0.7 -0.6 -0.5Lithuania -0.8 -1.3 -1.6 -1.0 -0.9 -0.9 -1.3 -1.4 -1.7 -1.2 -1.1 -1.0
1.2 1.5 2.0 2.6 2.4 2.0 2.5 2.2 2.2 1.8 1.9 2.00.7 0.5 0.6 0.9 1.0 1.1 1.1 1.0 1.0 0.9 0.8 0.80.7 0.3 0.5 0.3 0.4 0.4 0.6 0.6 0.5 0.6 0.6 0.50.3 0.5 0.3 0.6 0.8 1.0 1.3 0.8 0.7 0.8 0.5 0.50.6 0.2 -0.1 -0.5 -0.5 -0.4 -0.3 -0.2 -0.1 -0.4 -0.4 -0.40.1 0.2 0.4 0.1 0.1 0.1 0.1 0.1 0.1 0.1 0.1 0.10.0 0.1 0.0 0.1 0.1 0.1 0.2 0.1 0.0 0.0 0.0 0.00.2 0.3 0.5 0.5 0.4 0.3 0.3 0.4 0.4 0.4 0.4 0.40.3 0.5 0.3 0.2 0.2 0.3 0.4 0.4 0.3 0.4 0.4 0.3
-1.2 -0.8 -0.6 -0.6 -0.6 -0.4 -0.6 -0.7 -0.6 -0.6 -0.6 -0.6-0.2 0.2 0.4 0.0 0.1 0.2 0.2 0.2 0.3 0.2 0.1 0.10.3 0.3 0.5 0.4 0.5 0.7 0.8 0.8 0.7 0.8 0.6 0.6
-1.2 0.0 -0.2 -0.3 -0.4 -0.5 -0.6 -0.8 -0.6 -1.2 -0.2 -0.2-0.3 -0.2 -0.3 -0.3 -0.3 -0.3 -0.2 -0.2 -0.1 -0.1 -0.1 -0.20.0 -0.1 0.2 -0.1 0.0 -0.1 -0.1 0.0 0.0 0.0 0.0 -0.1
-0.8 -0.7 -0.8 -0.4 -0.4 -0.5 -0.3 -0.9 -0.6 -0.7 -0.5 -0.60.2 0.5 0.8 0.9 1.0 1.1 1.3 1.4 1.1 1.2 1.4 1.60.4 0.6 0.8 0.6 0.8 0.8 0.7 0.7 0.7 0.8 0.7 0.70.2 0.4 0.3 0.2 0.2 0.3 0.3 0.3 0.3 0.3 0.3 0.31.1 0.9 0.8 0.7 0.7 0.7 0.7 0.7 0.8 0.7 0.7 0.70.2 0.1 0.0 -0.2 -0.1 -0.1 -0.1 -0.1 -0.1 -0.1 -0.1 -0.1
Slovenia
Malta
Spring 2017
USA
Latvia
Croatia
Estonia
Bulgaria
Netherlands
Japan
Sweden
France
Hungary
Winter 2017
Italy
Poland
Greece
Czech Republic
Slovakia
Austria
Euro area
Total population (percentage change on preceding year, 1998-2018)
Finland
Portugal
Luxembourg
EU
averages
Cyprus
forecast
Romania
Spain
Denmark
Germany
Ireland
Belgium
forecast
United Kingdom
Statistical Annex
159
Table 23: 25.4.2017
5-year
1998-02 2003-07 2008-12 2013 2014 2015 2016 2017 2018 2016 2017 20181.3 1.0 0.8 -0.3 0.4 0.9 1.3 0.9 0.9 1.3 0.9 0.90.9 0.4 0.8 0.6 0.8 0.9 1.2 1.0 1.0 1.0 0.8 0.7
-1.0 1.8 -1.4 1.2 0.8 2.9 0.3 0.3 0.2 0.8 0.1 0.24.8 3.8 -2.7 2.5 1.7 2.5 2.7 2.6 2.1 2.5 2.1 1.81.5 1.6 -3.0 -2.6 0.0 0.5 1.3 1.4 1.7 2.2 2.1 2.23.9 3.2 -3.2 -3.4 1.1 3.0 2.9 2.3 2.1 2.9 2.0 1.71.8 0.7 -0.1 0.1 0.2 0.4 0.5 0.8 1.0 0.8 0.6 0.91.1 0.8 -1.0 -2.4 0.2 1.0 1.4 0.7 0.8 1.2 0.7 0.81.9 3.5 0.2 -5.9 -1.8 1.9 2.7 2.3 1.9 2.7 2.2 1.8
-0.5 2.3 -3.8 2.3 -1.4 1.3 -0.1 0.3 0.5 -0.2 0.3 0.5Lithuania -1.5 0.7 -2.4 1.3 2.0 1.3 2.0 0.6 0.5 1.8 0.5 0.1
4.6 3.0 2.6 1.8 2.6 2.6 3.0 3.1 3.1 3.0 2.9 2.70.3 1.0 2.0 3.7 5.1 3.8 3.7 3.0 2.8 3.0 2.8 2.61.6 0.7 0.0 -1.2 -0.3 1.0 1.7 1.7 1.3 1.4 1.4 1.30.8 1.2 1.0 0.3 0.9 0.6 1.3 1.0 0.9 0.9 0.8 0.71.7 -0.3 -2.0 -2.9 1.4 1.4 1.6 1.4 0.9 1.3 0.8 0.61.0 0.9 -0.8 -1.1 0.4 1.1 2.0 1.9 1.6 1.2 1.1 1.1
-0.9 1.3 0.3 -0.8 1.4 2.0 2.4 1.4 1.3 2.6 1.4 1.61.8 1.2 0.3 -0.7 -0.5 -0.3 0.6 0.5 0.7 0.4 0.5 0.61.5 1.0 -0.6 -0.8 0.6 1.1 1.4 1.2 1.1 1.3 1.0 1.0
-1.7 3.0 -1.6 -0.4 0.4 0.4 0.5 0.6 0.6 1.1 0.5 0.2-0.9 0.9 -0.1 0.3 0.6 1.4 1.8 0.3 0.0 1.4 0.1 0.10.8 0.9 -1.0 0.0 1.0 1.3 1.7 1.1 0.9 1.5 1.0 0.91.9 2.3 -1.6 -2.7 2.7 1.5 0.7 1.9 1.5 1.9 2.1 1.61.0 -0.1 -1.1 1.1 4.8 2.3 2.2 0.6 0.3 1.9 0.5 0.3
-1.9 2.0 0.4 -0.1 1.7 1.5 0.6 0.4 0.0 0.9 0.3 0.0-3.2 -0.4 -1.6 -0.9 0.8 -0.9 -0.9 0.1 0.4 -0.4 0.3 0.41.7 0.6 0.5 1.0 1.4 1.5 1.7 1.5 1.2 1.9 1.4 1.21.0 1.0 0.2 1.2 2.4 1.8 1.4 0.6 0.4 1.3 0.5 0.30.8 1.0 -0.4 -0.4 1.0 1.2 1.3 0.9 0.9 1.3 0.8 0.81.0 1.3 -0.5 1.0 1.6 1.7 1.7 1.1 0.7 1.7 1.0 0.7
-0.9 0.5 -0.5 0.6 0.6 0.4 0.8 0.3 0.2 0.8 0.3 0.2
Slovenia
Malta
Spring 2017
USA
Latvia
Croatia
Estonia
Bulgaria
Netherlands
Japan
Sweden
France
Hungary
Winter 2017
Italy
Poland
Greece
Czech Republic
Slovakia
Austria
Euro area
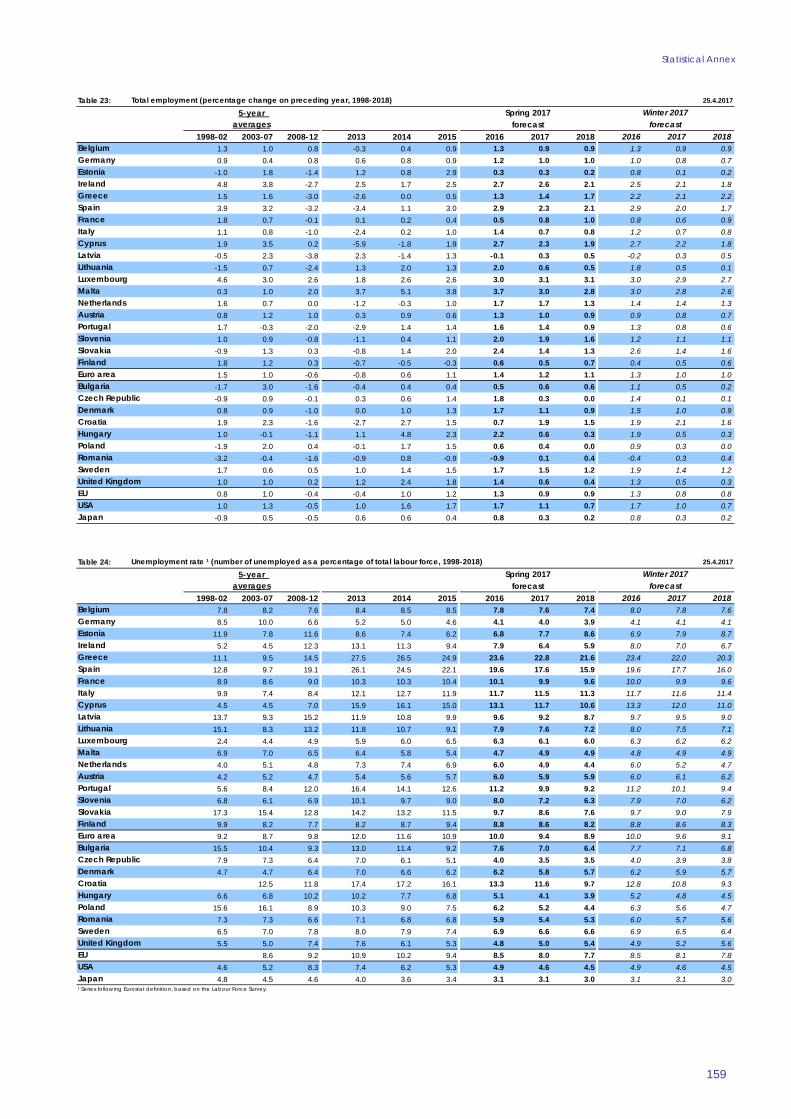
Total employment (percentage change on preceding year, 1998-2018)
Finland
Portugal
Luxembourg
EU
averages
Cyprus
forecast
Romania
Spain
Denmark
Germany
Ireland
Belgium
forecast
United Kingdom
Table 24: 25.4.2017
5-year
1998-02 2003-07 2008-12 2013 2014 2015 2016 2017 2018 2016 2017 20187.8 8.2 7.6 8.4 8.5 8.5 7.8 7.6 7.4 8.0 7.8 7.68.5 10.0 6.6 5.2 5.0 4.6 4.1 4.0 3.9 4.1 4.1 4.1
11.9 7.8 11.6 8.6 7.4 6.2 6.8 7.7 8.6 6.9 7.9 8.75.2 4.5 12.3 13.1 11.3 9.4 7.9 6.4 5.9 8.0 7.0 6.7
11.1 9.5 14.5 27.5 26.5 24.9 23.6 22.8 21.6 23.4 22.0 20.312.8 9.7 19.1 26.1 24.5 22.1 19.6 17.6 15.9 19.6 17.7 16.08.9 8.6 9.0 10.3 10.3 10.4 10.1 9.9 9.6 10.0 9.9 9.69.9 7.4 8.4 12.1 12.7 11.9 11.7 11.5 11.3 11.7 11.6 11.44.5 4.5 7.0 15.9 16.1 15.0 13.1 11.7 10.6 13.3 12.0 11.0
13.7 9.3 15.2 11.9 10.8 9.9 9.6 9.2 8.7 9.7 9.5 9.0Lithuania 15.1 8.3 13.2 11.8 10.7 9.1 7.9 7.6 7.2 8.0 7.5 7.1
2.4 4.4 4.9 5.9 6.0 6.5 6.3 6.1 6.0 6.3 6.2 6.26.9 7.0 6.5 6.4 5.8 5.4 4.7 4.9 4.9 4.8 4.9 4.94.0 5.1 4.8 7.3 7.4 6.9 6.0 4.9 4.4 6.0 5.2 4.74.2 5.2 4.7 5.4 5.6 5.7 6.0 5.9 5.9 6.0 6.1 6.25.6 8.4 12.0 16.4 14.1 12.6 11.2 9.9 9.2 11.2 10.1 9.46.8 6.1 6.9 10.1 9.7 9.0 8.0 7.2 6.3 7.9 7.0 6.2
17.3 15.4 12.8 14.2 13.2 11.5 9.7 8.6 7.6 9.7 9.0 7.99.9 8.2 7.7 8.2 8.7 9.4 8.8 8.6 8.2 8.8 8.6 8.39.2 8.7 9.8 12.0 11.6 10.9 10.0 9.4 8.9 10.0 9.6 9.1
15.5 10.4 9.3 13.0 11.4 9.2 7.6 7.0 6.4 7.7 7.1 6.87.9 7.3 6.4 7.0 6.1 5.1 4.0 3.5 3.5 4.0 3.9 3.84.7 4.7 6.4 7.0 6.6 6.2 6.2 5.8 5.7 6.2 5.9 5.7
12.5 11.8 17.4 17.2 16.1 13.3 11.6 9.7 12.8 10.8 9.36.6 6.8 10.2 10.2 7.7 6.8 5.1 4.1 3.9 5.2 4.8 4.5
15.6 16.1 8.9 10.3 9.0 7.5 6.2 5.2 4.4 6.3 5.6 4.77.3 7.3 6.6 7.1 6.8 6.8 5.9 5.4 5.3 6.0 5.7 5.66.5 7.0 7.8 8.0 7.9 7.4 6.9 6.6 6.6 6.9 6.5 6.45.5 5.0 7.4 7.6 6.1 5.3 4.8 5.0 5.4 4.9 5.2 5.6
8.6 9.2 10.9 10.2 9.4 8.5 8.0 7.7 8.5 8.1 7.84.6 5.2 8.3 7.4 6.2 5.3 4.9 4.6 4.5 4.9 4.6 4.54.8 4.5 4.6 4.0 3.6 3.4 3.1 3.1 3.0 3.1 3.1 3.0
Slovenia
Malta
Spring 2017
USA
Latvia
Croatia
Estonia
Bulgaria
Netherlands
Japan
Sweden
France
Hungary
Winter 2017
¹ Series following Eurostat definition, based on the Labour Force Survey.
Italy
Poland
Greece
Czech Republic
Slovakia
Austria
Euro area
Unemployment rate ¹ (number of unemployed as a percentage of total labour force, 1998-2018)
Finland
Portugal
Luxembourg
EU
averages
Cyprus
forecast
Romania
Spain
Denmark
Germany
Ireland
Belgium
forecast
United Kingdom
European Economic Forecast, Spring 2017
160
Table 25: 25.4.2017
5-year
1998-02 2003-07 2008-12 2013 2014 2015 2016 2017 2018 2016 2017 20182.9 2.5 2.5 2.5 1.0 0.0 0.1 2.0 1.7 0.1 2.0 1.91.3 0.8 2.1 1.8 2.8 2.4 2.3 2.5 2.6 2.3 2.7 2.8
10.8 14.7 3.4 4.6 4.2 5.7 5.7 5.5 5.6 6.2 5.1 5.06.0 5.4 0.0 1.4 1.8 2.8 2.9 3.0 2.5 2.9 2.5 2.16.8 5.6 -0.5 -7.5 -2.1 -2.9 0.8 1.5 2.1 0.2 1.0 2.02.8 3.8 2.5 1.4 0.0 0.4 0.0 1.0 1.3 0.5 1.4 1.62.3 3.0 2.5 1.6 1.2 1.1 1.3 1.5 1.8 0.9 1.5 1.92.1 3.2 2.0 1.3 0.0 0.2 0.3 0.9 1.6 0.0 0.8 1.54.4 4.5 2.6 -5.4 -3.8 -1.1 -0.6 0.7 1.1 0.1 0.9 1.57.1 21.9 1.5 5.5 8.6 6.9 6.9 6.0 6.8 4.8 5.3 5.5
Lithuania 5.8 13.9 2.8 5.4 4.7 5.3 5.0 5.1 5.6 5.5 6.1 6.33.6 3.5 2.0 2.7 2.1 1.7 0.4 3.0 1.9 0.4 3.1 2.44.4 3.7 3.2 2.0 1.5 3.3 2.4 3.0 3.1 3.0 2.9 2.84.4 2.7 2.4 2.2 1.6 0.4 1.3 2.8 2.8 2.3 2.6 2.42.1 2.4 2.1 2.1 1.9 1.9 1.3 1.9 1.9 1.4 1.6 1.74.9 3.3 0.4 3.6 -1.8 -0.3 1.4 1.5 1.5 1.4 1.2 1.29.4 6.6 2.7 0.5 1.3 1.4 2.2 2.7 3.4 2.0 2.2 3.68.8 8.4 3.8 2.6 1.8 3.1 1.8 4.0 4.7 1.5 3.8 4.23.5 3.2 3.0 1.3 1.0 1.6 1.0 -0.8 1.5 1.2 -0.8 1.22.4 2.5 2.3 1.6 1.3 1.1 1.3 1.8 2.1 1.2 1.8 2.1
17.5 7.7 9.8 8.8 5.6 5.6 3.1 4.9 4.5 3.8 4.8 5.17.7 6.3 2.3 -0.3 2.6 2.6 3.9 4.6 4.6 3.5 4.5 4.63.8 3.5 2.6 1.6 1.5 1.5 1.6 2.3 2.7 1.9 2.2 2.76.2 5.6 2.0 -0.6 -5.4 -0.3 1.2 2.5 2.5 1.7 2.4 2.5
12.7 7.9 2.3 1.6 1.3 1.5 5.3 7.1 6.3 5.0 6.1 5.610.1 2.8 5.9 1.7 2.2 1.1 3.6 4.3 5.1 3.9 4.7 5.351.3 19.5 6.7 3.8 6.7 0.9 10.3 9.5 6.5 8.4 7.8 6.0
3.2 3.9 3.0 1.9 2.2 3.5 2.5 2.5 2.6 3.1 3.3 3.15.1 4.9 1.8 2.1 0.7 1.1 2.8 2.4 2.4 2.3 2.4 2.43.7 3.0 2.3 1.7 1.2 1.2 1.7 2.2 2.4 1.7 2.2 2.4
: 3.7 2.1 1.5 2.8 3.0 2.3 3.5 4.0 2.3 3.6 4.9-1.2 -0.4 -0.6 -0.1 1.1 0.7 0.1 0.7 0.5 0.1 0.7 0.8
Slovenia
Malta
Spring 2017
USA
Latvia
Croatia
Estonia
Bulgaria
Netherlands
Japan
Sweden
France
Hungary
Winter 2017
Italy
Poland
Greece
Czech Republic
Slovakia
Austria
Euro area
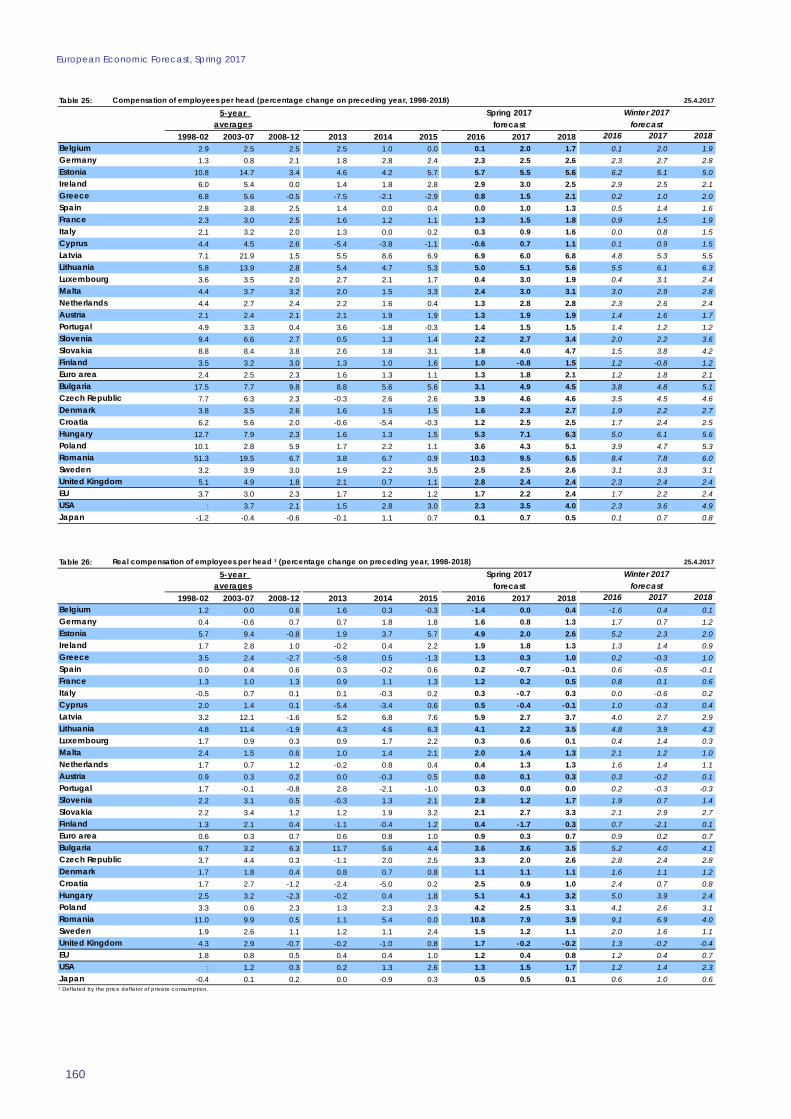
Compensation of employees per head (percentage change on preceding year, 1998-2018)
Finland
Portugal
Luxembourg
EU
averages
Cyprus
forecast
Romania
Spain
Denmark
Germany
Ireland
Belgium
forecast
United Kingdom
Table 26: 25.4.2017
5-year
1998-02 2003-07 2008-12 2013 2014 2015 2016 2017 2018 2016 2017 20181.2 0.0 0.6 1.6 0.3 -0.3 -1.4 0.0 0.4 -1.6 0.4 0.10.4 -0.6 0.7 0.7 1.8 1.8 1.6 0.8 1.3 1.7 0.7 1.25.7 9.4 -0.8 1.9 3.7 5.7 4.9 2.0 2.6 5.2 2.3 2.01.7 2.8 1.0 -0.2 0.4 2.2 1.9 1.8 1.3 1.3 1.4 0.93.5 2.4 -2.7 -5.8 0.5 -1.3 1.3 0.3 1.0 0.2 -0.3 1.00.0 0.4 0.6 0.3 -0.2 0.6 0.2 -0.7 -0.1 0.6 -0.5 -0.11.3 1.0 1.3 0.9 1.1 1.3 1.2 0.2 0.5 0.8 0.1 0.6
-0.5 0.7 0.1 0.1 -0.3 0.2 0.3 -0.7 0.3 0.0 -0.6 0.22.0 1.4 0.1 -5.4 -3.4 0.6 0.5 -0.4 -0.1 1.0 -0.3 0.43.2 12.1 -1.6 5.2 6.8 7.6 5.9 2.7 3.7 4.0 2.7 2.9
Lithuania 4.8 11.4 -1.9 4.3 4.6 6.3 4.1 2.2 3.5 4.8 3.9 4.31.7 0.9 0.3 0.9 1.7 2.2 0.3 0.6 0.1 0.4 1.4 0.32.4 1.5 0.6 1.0 1.4 2.1 2.0 1.4 1.3 2.1 1.2 1.01.7 0.7 1.2 -0.2 0.8 0.4 0.4 1.3 1.3 1.6 1.4 1.10.9 0.3 0.2 0.0 -0.3 0.5 0.0 0.1 0.3 0.3 -0.2 0.11.7 -0.1 -0.8 2.8 -2.1 -1.0 0.3 0.0 0.0 0.2 -0.3 -0.32.2 3.1 0.5 -0.3 1.3 2.1 2.8 1.2 1.7 1.9 0.7 1.42.2 3.4 1.2 1.2 1.9 3.2 2.1 2.7 3.3 2.1 2.9 2.71.3 2.1 0.4 -1.1 -0.4 1.2 0.4 -1.7 0.3 0.7 -2.1 0.10.6 0.3 0.7 0.6 0.8 1.0 0.9 0.3 0.7 0.9 0.2 0.79.7 3.2 6.3 11.7 5.6 4.4 3.6 3.6 3.5 5.2 4.0 4.13.7 4.4 0.3 -1.1 2.0 2.5 3.3 2.0 2.6 2.8 2.4 2.81.7 1.8 0.4 0.8 0.7 0.8 1.1 1.1 1.1 1.6 1.1 1.21.7 2.7 -1.2 -2.4 -5.0 0.2 2.5 0.9 1.0 2.4 0.7 0.82.5 3.2 -2.3 -0.2 0.4 1.8 5.1 4.1 3.2 5.0 3.9 2.43.3 0.6 2.3 1.3 2.3 2.3 4.2 2.5 3.1 4.1 2.6 3.1
11.0 9.9 0.5 1.1 5.4 0.0 10.8 7.9 3.9 9.1 6.9 4.01.9 2.6 1.1 1.2 1.1 2.4 1.5 1.2 1.1 2.0 1.6 1.14.3 2.9 -0.7 -0.2 -1.0 0.8 1.7 -0.2 -0.2 1.3 -0.2 -0.41.8 0.8 0.5 0.4 0.4 1.0 1.2 0.4 0.8 1.2 0.4 0.7
: 1.2 0.3 0.2 1.3 2.6 1.3 1.5 1.7 1.2 1.4 2.3-0.4 0.1 0.2 0.0 -0.9 0.3 0.5 0.5 0.1 0.6 1.0 0.6
Slovenia
Malta
Spring 2017
USA
Latvia
Croatia
Estonia
Bulgaria
Netherlands
Japan
Sweden
France
Hungary
Winter 2017
¹ Deflated by the price deflator of private consumption.
Italy
Poland
Greece
Czech Republic
Slovakia
Austria
Euro area
Real compensation of employees per head ¹ (percentage change on preceding year, 1998-2018)
Finland
Portugal
Luxembourg
EU
averages
Cyprus
forecast
Romania
Spain
Denmark
Germany
Ireland
Belgium
forecast
United Kingdom
Statistical Annex
161
Table 27: 25.4.2017
5-year
1998-02 2003-07 2008-12 2013 2014 2015 2016 2017 2018 2016 2017 20181.1 1.4 -0.2 0.3 1.2 0.6 -0.1 0.6 0.8 -0.1 0.5 0.70.8 1.3 -0.2 -0.1 0.8 0.8 0.6 0.6 0.9 0.9 0.8 1.16.2 6.3 0.1 0.2 2.0 -1.4 1.3 2.0 2.7 0.3 2.1 2.43.2 1.3 1.2 -1.4 6.7 23.2 2.4 1.3 1.5 1.7 1.3 1.52.3 2.4 -2.4 -0.6 0.3 -0.7 -1.3 0.7 0.7 -1.9 0.6 0.90.2 0.4 2.0 1.8 0.3 0.2 0.4 0.5 0.3 0.3 0.3 0.40.9 1.3 0.4 0.5 0.4 0.9 0.7 0.6 0.7 0.4 0.8 0.80.6 0.5 -0.4 0.7 -0.1 -0.2 -0.5 0.2 0.3 -0.3 0.3 0.32.6 0.5 -0.1 0.0 0.2 -0.2 0.1 0.1 0.3 0.1 0.3 0.56.2 7.4 1.5 0.3 3.5 1.4 2.0 2.8 3.0 1.9 2.5 2.5
Lithuania 6.3 7.9 2.1 2.1 1.5 0.5 0.3 2.2 2.6 0.4 2.4 2.61.1 1.3 -2.3 2.1 3.0 1.4 1.1 1.2 1.3 0.8 1.0 1.23.2 1.5 -0.3 0.8 3.0 3.5 1.3 1.6 1.6 1.0 0.9 1.11.5 1.6 0.0 1.0 1.7 1.0 0.5 0.4 0.5 0.6 0.6 0.51.9 1.3 -0.3 -0.2 -0.3 0.3 0.1 0.7 0.8 0.6 0.8 0.91.3 1.5 0.6 1.8 -0.5 0.2 -0.2 0.4 0.7 0.1 0.8 0.92.8 3.8 -0.3 0.0 2.7 1.2 0.5 1.4 1.5 1.2 1.9 1.93.5 5.9 1.6 2.3 1.1 1.8 0.9 1.6 2.3 0.7 1.5 2.02.1 2.3 -1.0 0.0 -0.2 0.6 0.8 0.8 1.1 1.1 0.6 0.91.0 1.1 0.3 0.5 0.6 0.9 0.3 0.6 0.7 0.4 0.7 0.83.9 3.5 2.7 1.3 1.0 3.3 2.9 2.3 2.2 2.2 2.5 2.72.9 4.6 0.3 -0.8 2.2 3.1 0.6 2.4 2.7 1.0 2.5 2.61.2 1.1 0.6 1.0 0.7 0.3 -0.4 0.6 0.9 -0.5 0.4 0.90.8 2.4 -0.3 1.7 -3.1 0.1 2.2 0.9 1.1 0.9 1.0 0.92.9 3.6 0.1 1.0 -0.7 0.9 -0.2 3.0 3.1 0.0 3.0 2.95.4 3.1 3.0 1.5 1.5 2.3 2.1 3.1 3.2 1.8 2.8 3.25.6 7.1 2.0 4.4 2.3 4.9 5.8 4.2 3.3 5.3 4.1 3.31.7 2.9 0.0 0.3 1.2 2.5 1.6 1.1 1.0 1.3 1.0 0.92.0 1.8 -0.3 0.7 0.7 0.4 0.4 1.2 0.8 0.8 1.0 0.91.8 1.4 0.3 0.6 0.6 1.0 0.6 0.9 1.0 0.6 0.9 1.02.1 1.5 1.1 0.7 0.8 0.9 -0.1 1.2 1.6 -0.1 1.3 1.51.3 1.2 0.3 1.4 -0.3 0.9 0.2 0.9 0.4 0.1 0.7 0.3
Slovenia
Malta
Spring 2017
USA
Latvia
Croatia
Estonia
Bulgaria
Netherlands
Japan
Sweden
France
Hungary
Winter 2017
Italy
Poland
Greece
Czech Republic
Slovakia
Austria
Euro area
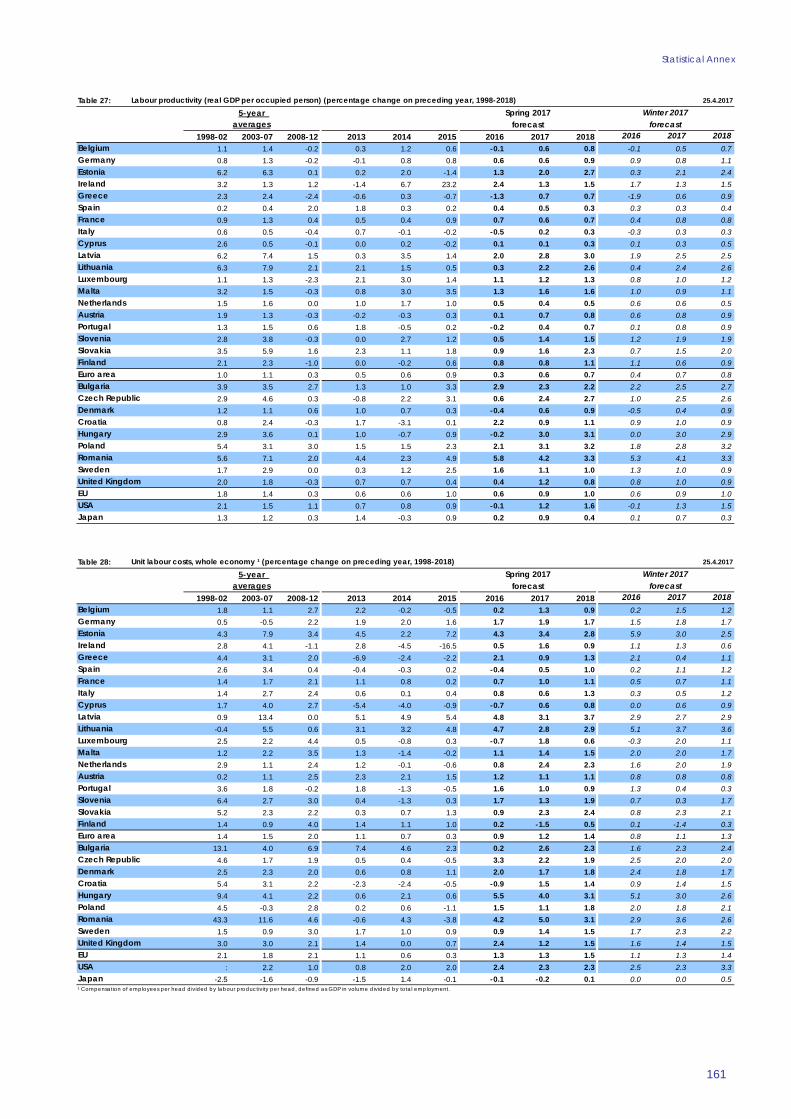
Labour productivity (real GDP per occupied person) (percentage change on preceding year, 1998-2018)
Finland
Portugal
Luxembourg
EU
averages
Cyprus
forecast
Romania
Spain
Denmark
Germany
Ireland
Belgium
forecast
United Kingdom
Table 28: 25.4.2017
5-year
1998-02 2003-07 2008-12 2013 2014 2015 2016 2017 2018 2016 2017 20181.8 1.1 2.7 2.2 -0.2 -0.5 0.2 1.3 0.9 0.2 1.5 1.20.5 -0.5 2.2 1.9 2.0 1.6 1.7 1.9 1.7 1.5 1.8 1.74.3 7.9 3.4 4.5 2.2 7.2 4.3 3.4 2.8 5.9 3.0 2.52.8 4.1 -1.1 2.8 -4.5 -16.5 0.5 1.6 0.9 1.1 1.3 0.64.4 3.1 2.0 -6.9 -2.4 -2.2 2.1 0.9 1.3 2.1 0.4 1.12.6 3.4 0.4 -0.4 -0.3 0.2 -0.4 0.5 1.0 0.2 1.1 1.21.4 1.7 2.1 1.1 0.8 0.2 0.7 1.0 1.1 0.5 0.7 1.11.4 2.7 2.4 0.6 0.1 0.4 0.8 0.6 1.3 0.3 0.5 1.21.7 4.0 2.7 -5.4 -4.0 -0.9 -0.7 0.6 0.8 0.0 0.6 0.90.9 13.4 0.0 5.1 4.9 5.4 4.8 3.1 3.7 2.9 2.7 2.9
Lithuania -0.4 5.5 0.6 3.1 3.2 4.8 4.7 2.8 2.9 5.1 3.7 3.62.5 2.2 4.4 0.5 -0.8 0.3 -0.7 1.8 0.6 -0.3 2.0 1.11.2 2.2 3.5 1.3 -1.4 -0.2 1.1 1.4 1.5 2.0 2.0 1.72.9 1.1 2.4 1.2 -0.1 -0.6 0.8 2.4 2.3 1.6 2.0 1.90.2 1.1 2.5 2.3 2.1 1.5 1.2 1.1 1.1 0.8 0.8 0.83.6 1.8 -0.2 1.8 -1.3 -0.5 1.6 1.0 0.9 1.3 0.4 0.36.4 2.7 3.0 0.4 -1.3 0.3 1.7 1.3 1.9 0.7 0.3 1.75.2 2.3 2.2 0.3 0.7 1.3 0.9 2.3 2.4 0.8 2.3 2.11.4 0.9 4.0 1.4 1.1 1.0 0.2 -1.5 0.5 0.1 -1.4 0.31.4 1.5 2.0 1.1 0.7 0.3 0.9 1.2 1.4 0.8 1.1 1.3
13.1 4.0 6.9 7.4 4.6 2.3 0.2 2.6 2.3 1.6 2.3 2.44.6 1.7 1.9 0.5 0.4 -0.5 3.3 2.2 1.9 2.5 2.0 2.02.5 2.3 2.0 0.6 0.8 1.1 2.0 1.7 1.8 2.4 1.8 1.75.4 3.1 2.2 -2.3 -2.4 -0.5 -0.9 1.5 1.4 0.9 1.4 1.59.4 4.1 2.2 0.6 2.1 0.6 5.5 4.0 3.1 5.1 3.0 2.64.5 -0.3 2.8 0.2 0.6 -1.1 1.5 1.1 1.8 2.0 1.8 2.1
43.3 11.6 4.6 -0.6 4.3 -3.8 4.2 5.0 3.1 2.9 3.6 2.61.5 0.9 3.0 1.7 1.0 0.9 0.9 1.4 1.5 1.7 2.3 2.23.0 3.0 2.1 1.4 0.0 0.7 2.4 1.2 1.5 1.6 1.4 1.52.1 1.8 2.1 1.1 0.6 0.3 1.3 1.3 1.5 1.1 1.3 1.4
: 2.2 1.0 0.8 2.0 2.0 2.4 2.3 2.3 2.5 2.3 3.3-2.5 -1.6 -0.9 -1.5 1.4 -0.1 -0.1 -0.2 0.1 0.0 0.0 0.5
Slovenia
Malta
Spring 2017
USA
Latvia
Croatia
Estonia
Bulgaria
Netherlands
Japan
Sweden
France
Hungary
Winter 2017
¹ Compensation of employees per head divided by labour productivity per head, defined as GDP in volume divided by total employment.
Italy
Poland
Greece
Czech Republic
Slovakia
Austria
Euro area
Unit labour costs, whole economy ¹ (percentage change on preceding year, 1998-2018)
Finland
Portugal
Luxembourg
EU
averages
Cyprus
forecast
Romania
Spain
Denmark
Germany
Ireland
Belgium
forecast
United Kingdom
European Economic Forecast, Spring 2017
162
Table 29: 25.4.2017
5-year
1998-02 2003-07 2008-12 2013 2014 2015 2016 2017 2018 2016 2017 20180.1 -1.0 0.9 1.0 -0.8 -1.4 -1.4 -0.5 -0.7 -1.4 -0.1 -0.6
-0.2 -1.5 1.0 0.0 0.2 -0.3 0.2 0.5 0.1 0.0 0.0 0.0-1.7 0.8 -0.2 0.6 0.4 6.1 2.6 -0.2 -0.5 3.4 -0.1 -0.5-2.9 1.6 -0.5 1.4 -3.4 -20.4 1.8 0.4 -0.3 1.4 0.0 -0.61.0 0.0 0.4 -4.6 -0.6 -1.2 2.0 -0.3 0.2 2.0 -0.9 0.0
-0.7 -0.4 -0.1 -0.7 0.0 -0.3 -0.7 -0.5 -0.4 -0.3 -0.3 -0.40.0 -0.4 1.0 0.3 0.3 -0.4 -0.2 0.1 -0.2 -0.4 -0.2 -0.2
-1.0 0.3 0.9 -0.6 -0.9 -0.2 0.0 -0.2 0.0 -0.6 -0.4 0.1-0.8 0.1 0.6 -4.4 -2.6 0.4 0.6 -0.2 -0.1 1.0 -0.4 -0.3-2.5 2.2 -1.9 3.6 3.3 5.0 4.0 0.0 1.0 2.3 1.2 0.3
Lithuania -1.1 0.7 -2.5 1.7 2.2 4.6 3.5 -0.1 0.4 3.3 1.5 1.20.9 -1.4 1.1 -0.9 -2.4 -0.4 -0.1 -0.6 -1.7 -1.9 0.2 -1.0
-1.1 -0.2 0.7 -0.7 -3.4 -2.5 -0.5 -0.2 -0.3 0.3 -0.1 -0.6-0.1 -0.9 1.4 -0.2 -0.2 -0.7 0.0 1.5 1.0 1.1 1.2 1.1-0.8 -0.9 0.8 0.8 0.4 -0.3 -0.2 -0.2 -0.3 -0.9 -0.5 -0.7-0.1 -1.3 -0.8 -0.5 -2.0 -2.5 0.0 -0.3 -0.6 -0.2 -0.9 -1.1-0.7 -0.7 1.4 -0.4 -2.1 -0.7 1.1 -0.2 0.1 -0.7 -0.7 -0.2-0.9 -1.1 1.2 -0.2 0.9 1.5 1.3 1.6 0.9 1.1 1.3 0.6-0.6 -0.2 1.8 -1.1 -0.6 -0.7 -0.6 -2.0 -0.8 -0.8 -2.3 -0.6-0.4 -0.7 0.8 -0.1 -0.2 -0.9 0.0 0.1 0.0 -0.1 -0.1 0.02.8 -2.3 2.6 8.2 4.1 0.1 -0.9 1.6 0.8 2.0 1.3 0.90.2 -0.2 1.0 -0.9 -2.0 -1.5 2.2 0.5 0.2 1.3 0.7 0.40.4 0.1 -0.2 -0.3 0.1 0.2 1.6 0.1 0.1 2.4 0.4 -0.10.5 -0.8 -0.2 -3.0 -2.4 -0.6 -0.8 0.2 -0.3 0.2 0.6 -0.3
-0.7 -0.2 -1.1 -2.3 -1.2 -1.1 4.5 1.1 -0.2 2.7 0.2 -0.5-1.1 -2.9 -0.2 -0.1 0.1 -1.9 1.3 -0.2 -0.2 1.3 0.2 0.02.4 -2.7 -2.2 -3.9 2.6 -6.0 2.0 3.4 0.2 1.3 1.2 0.10.0 -0.6 1.2 0.6 -0.7 -1.1 -0.5 -0.9 -0.4 -0.6 0.0 -0.11.6 0.4 0.2 -0.5 -1.6 0.1 0.7 -0.4 -0.3 0.5 -0.4 -1.0
-0.2 -0.7 0.6 -0.3 -0.5 -0.9 0.1 0.0 -0.1 0.0 -0.2 -0.2: -0.6 -0.6 -0.8 0.2 1.0 1.1 0.4 0.1 1.1 0.2 0.9
-1.5 -0.6 0.3 -1.2 -0.4 -2.1 -0.4 -0.4 -0.4 -0.2 0.1 0.0
Slovenia
Malta
Spring 2017
USA
Latvia
Croatia
Estonia
Bulgaria
Netherlands
Japan
Sweden
France
Hungary
Winter 2017
¹ Nominal unit labour costs divided by GDP price deflator.
Italy
Poland
Greece
Czech Republic
Slovakia
Austria
Euro area
Real unit labour costs ¹ (percentage change on preceding year, 1998-2018)
Finland
Portugal
Luxembourg
EU
averages
Cyprus
forecast
Romania
Spain
Denmark
Germany
Ireland
Belgium
forecast
United Kingdom
Table 30:5-year
1998-02 2003-07 2008-12 2013 2014 2015 2016 2017 2018 2016 2017 2018: : : : : : : : : : : :: : : : : : : : : : : :
15.6669 15.6466 : : : : : : : : : :: : : : : : : : : : : :: : : : : : : : : : : :: : : : : : : : : : : :: : : : : : : : : : : :: : : : : : : : : : : :
0.5767 0.5802 : : : : : : : : : :0.5972 0.6797 0.7041 0.7015 : : : : : : : :
Lithuania 3.8971 3.4528 3.4528 3.4528 3.4528 : : : : : : :: : : : : : : : : : : :
0.4154 0.4285 : : : : : : : : : :: : : : : : : : : : : :: : : : : : : : : : : :: : : : : : : : : : : :
206.1982 238.3482 : : : : : : : : : :42.4519 38.2238 : : : : : : : : : :
: : : : : : : : : : : :: : : : : : : : : : :
1.9549 1.9539 1.9558 1.9558 1.9558 1.9558 1.9558 1.9558 1.9558 1.9558 1.9558 1.955834.6809 29.9252 25.2808 25.9797 27.5359 27.2792 27.0343 26.7858 26.7018 27.0343 27.0217 27.02177.4542 7.4464 7.4488 7.4579 7.4548 7.4587 7.4452 7.4369 7.4374 7.4452 7.4362 7.43637.4493 7.4257 7.3627 7.5786 7.6344 7.6137 7.5333 7.4440 7.4362 7.5333 7.5119 7.5099
250.5868 253.7888 275.1883 296.8730 308.7061 309.9956 311.4379 311.3709 312.1860 311.4379 309.2626 309.30003.9363 4.1258 4.0279 4.1975 4.1843 4.1841 4.3632 4.2609 4.2410 4.3632 4.3649 4.36442.0705 3.6576 4.1666 4.4190 4.4437 4.4454 4.4904 4.5214 4.5210 4.4904 4.4984 4.49818.9170 9.2071 9.5011 8.6515 9.0985 9.3535 9.4689 9.5710 9.5930 9.4689 9.5001 9.49860.6391 0.6841 0.8448 0.8493 0.8061 0.7258 0.8195 0.8505 0.8471 0.8195 0.8626 0.8627
: : : : : : : : :0.9903 1.2490 1.3736 1.3281 1.3285 1.1095 1.1069 1.0648 1.0647 1.1069 1.0677 1.0683
118.7904 141.9066 122.4959 129.6627 140.3061 134.3140 120.1967 117.8240 116.7300 120.2 121.9 121.9
France
Japan
United Kingdom
Hungary
Portugal
Luxembourg
Romania
Denmark
Netherlands
USA
Czech Republic
EU
Bulgaria
Italy
Poland
Slovenia
Sweden
Finland
Latvia
Croatia
Austria
Euro area
25.4.2017
Slovakia
Cyprus
forecastSpring 2017
Nominal bilateral exchange rates against Ecu/euro (1998-2018)
Malta
Ireland
Winter 2017
Belgium
averages forecast
Germany
Greece
Estonia
Spain
Statistical Annex
163
Table 31: 25.4.2017
5-year
1998-02 2003-07 2008-12 2013 2014 2015 2016 2017 2018 2016 2017 2018-0.1 1.4 -0.2 2.4 0.6 -3.0 1.3 0.0 -0.1 1.3 0.5 0.00.0 1.8 -0.6 3.2 1.0 -3.9 1.4 -0.2 -0.1 1.4 0.5 0.00.1 1.1 -0.3 1.5 1.5 -0.8 1.2 0.2 0.0 1.2 0.5 0.0
-1.9 2.5 -0.4 3.1 0.0 -6.2 2.0 -0.4 -0.1 2.0 0.2 0.0-0.1 1.3 0.1 3.1 2.1 -2.1 2.1 1.7 -0.1 2.1 2.5 0.00.0 1.3 -0.1 2.3 0.7 -3.0 1.5 0.1 -0.1 1.5 0.7 0.0
-0.1 1.7 -0.5 3.1 0.8 -3.7 1.1 -0.2 -0.1 1.1 0.4 0.00.2 1.7 -0.4 2.9 1.1 -3.7 1.2 0.0 -0.1 1.2 0.6 0.00.9 1.2 0.0 2.8 0.3 -4.0 2.1 0.2 -0.1 2.1 0.9 0.02.2 -2.9 0.1 1.1 0.9 -1.2 1.3 0.2 -0.1 1.3 0.7 0.0
Lithuania 6.2 1.3 0.0 1.8 0.9 -1.9 1.4 0.1 -0.1 1.4 0.6 0.0-0.1 0.8 0.0 1.8 0.6 -2.0 1.0 0.1 -0.1 1.0 0.5 0.00.3 1.7 -0.8 2.6 0.7 -2.6 1.0 0.1 -0.1 1.0 0.6 0.0
-0.1 1.1 -0.1 2.0 0.5 -2.7 1.4 0.1 -0.1 1.4 0.5 0.00.2 1.0 -0.3 2.0 0.8 -2.4 0.8 -0.2 -0.1 0.8 0.3 0.0
-0.5 1.1 -0.1 1.7 0.4 -2.6 1.1 0.0 -0.1 1.1 0.4 0.0-3.9 -0.6 0.1 1.4 0.8 -1.4 0.7 0.0 -0.1 0.7 0.4 0.0-2.2 5.3 2.5 1.2 0.7 -1.3 1.3 0.1 -0.1 1.3 0.6 0.0-0.3 1.7 -0.6 3.1 1.6 -2.9 1.1 -0.2 -0.1 1.1 0.3 0.0-0.1 3.5 -0.8 5.9 2.1 -6.8 2.3 -0.1 -0.2 2.3 1.2 0.03.6 1.2 0.5 2.2 1.7 -1.5 1.4 1.2 -0.1 1.4 1.8 0.03.5 2.7 2.0 -1.8 -5.2 -0.8 2.1 1.0 0.2 2.1 0.6 0.0
-0.2 1.4 -0.5 2.6 1.4 -2.8 1.6 -0.1 -0.1 1.6 0.3 0.0-0.7 1.0 -0.6 1.0 0.2 -1.5 1.9 1.5 0.0 1.9 1.0 0.0-2.3 0.0 -2.7 -1.1 -3.1 -2.0 0.5 0.2 -0.3 0.5 1.3 0.0-0.6 1.0 -2.1 1.4 1.1 -1.7 -3.0 2.8 0.4 -3.0 0.6 0.0
-22.3 -0.3 -5.4 2.8 0.6 -1.7 0.3 0.0 -0.1 0.3 1.1 0.0-1.4 1.6 0.7 3.6 -3.8 -5.2 0.2 -1.5 -0.3 0.2 -0.3 0.01.7 0.3 -4.3 -1.7 6.7 6.6 -11.1 -4.6 0.3 -11.1 -5.6 0.00.7 5.3 -3.2 8.0 4.6 -7.3 -1.3 -1.2 -0.1 -1.3 0.0 0.03.1 -4.7 -0.5 2.8 3.6 17.2 3.0 2.8 -0.4 3.0 5.1 0.01.5 -2.6 8.4 -18.4 -6.7 -3.3 13.2 0.1 0.9 13.2 -2.7 0.0
Slovenia
Malta
Spring 2017
USA
Latvia
Croatia
Estonia
Bulgaria
Netherlands
Japan
Sweden
France
Hungary
Winter 2017
¹ 37 countries: EU, TR, CH, NO, US, CA, JP, AU, MX and NZ.
Italy
Poland
Greece
Czech Republic
Slovakia
Austria
Euro area
Nominal effective exchange rates to rest of a group ¹ of industrialised countries (percentage change on preceding year, 1998-2018)
Finland
Portugal
Luxembourg
EU
averages
Cyprus
forecast
Romania
Spain
Denmark
Germany
Ireland
Belgium
forecast
United Kingdom
Table 32: 25.4.2017
5-year
1998-02 2003-07 2008-12 2013 2014 2015 2016 2017 2018 2016 2017 2018-0.3 -0.4 0.6 1.0 -1.3 -1.3 -1.4 -0.3 -0.8 -1.3 0.1 -0.6-2.2 -2.4 0.2 0.9 0.9 1.0 -0.1 0.3 0.1 -0.1 0.4 -0.12.0 5.7 0.9 2.8 0.6 5.8 2.4 1.9 1.0 4.0 1.5 0.60.7 2.3 -2.9 1.7 -5.5 -17.3 -1.1 0.1 -0.7 -0.3 -0.3 -1.20.2 0.9 -0.7 -8.1 -4.4 -3.7 -1.1 -1.7 -1.0 -1.0 -1.6 -1.40.1 1.7 -1.6 -1.6 -1.4 -0.6 -2.1 -1.1 -0.6 -1.4 -0.3 -0.5
-1.0 0.0 0.1 0.0 -0.3 -0.6 -1.0 -0.6 -0.6 -1.1 -0.9 -0.7-1.3 1.0 0.3 -0.5 -1.3 -0.5 -1.1 -1.1 -0.4 -1.4 -1.0 -0.7-2.2 1.8 0.6 -4.9 -4.5 -1.3 -2.6 -0.9 -0.9 -1.7 -0.7 -0.8-1.5 11.2 -2.2 3.6 3.4 4.1 2.6 1.3 1.8 0.6 0.9 0.9
Lithuania -3.3 3.0 -1.6 1.5 1.7 3.6 2.6 1.0 1.0 3.1 2.0 1.60.6 0.6 2.1 -0.7 -1.9 -0.3 -2.2 0.2 -1.0 -1.7 0.6 -0.6
-0.6 0.8 1.7 0.1 -2.4 -0.8 -0.5 -0.1 -0.1 0.6 0.6 0.00.8 -0.4 0.3 -0.1 -1.2 -1.4 -0.8 0.8 0.7 0.2 0.5 0.2
-2.1 -0.3 0.3 1.2 0.9 0.8 -0.5 -0.5 -0.6 -0.7 -0.7 -0.91.6 -0.2 -1.9 0.9 -2.1 -1.1 0.4 -0.4 -0.7 0.1 -1.0 -1.43.9 1.1 0.7 -0.6 -2.5 -0.5 0.1 -0.4 0.1 -0.9 -1.2 0.02.5 1.0 -0.1 -1.0 -0.6 0.6 -1.0 0.6 0.6 -0.9 0.6 0.3
-1.0 -0.8 1.8 0.1 -0.2 -0.1 -1.6 -3.1 -1.3 -1.6 -3.0 -1.6-2.3 -1.0 0.0 0.4 -1.0 -1.1 -1.6 -0.5 -0.5 -1.4 -0.5 -0.96.7 1.5 4.1 6.6 2.8 1.4 -2.7 0.2 0.1 -1.1 0.4 0.12.3 0.5 -0.3 -0.8 -0.9 -1.3 1.5 0.4 0.2 0.8 0.4 0.20.6 0.8 -0.2 -0.7 -0.4 0.3 0.4 0.2 0.2 0.9 0.3 -0.12.6 1.3 -0.1 -3.4 -3.6 -1.4 -2.9 -0.2 -0.4 -0.9 -0.1 -0.36.9 2.7 -0.1 -0.6 0.7 -0.1 3.6 2.1 1.3 3.3 1.4 0.82.2 -1.8 0.5 -1.1 -0.7 -2.1 -0.4 -0.7 0.0 0.3 0.1 0.2
38.2 9.5 2.0 -1.9 2.8 -4.8 1.9 3.0 1.1 0.8 1.9 0.6-0.9 -0.9 0.6 0.2 -0.3 0.0 -0.7 0.0 -0.1 0.1 0.9 0.40.9 1.4 0.2 0.3 -1.0 0.3 1.0 -0.3 0.0 0.3 0.1 -0.2
-2.0 -0.3 0.2 0.2 -1.8 -1.9 -1.7 -0.8 -0.6 -1.6 -0.4 -1.2-0.5 0.4 -1.0 -0.3 0.6 0.9 1.1 1.0 0.7 1.4 1.0 1.6-4.7 -3.6 -2.8 -2.7 0.0 -1.4 -1.7 -1.9 -1.7 -1.6 -1.6 -1.6
Slovenia
Malta
Spring 2017
USA
Latvia
Croatia
Estonia
Bulgaria
Netherlands
Japan
Sweden
France
Hungary
Winter 2017
¹ 37 countries: EU, TR, CH, NO, US, CA, JP, AU, MX and NZ.
Italy
Poland
Greece
Czech Republic
Slovakia
Austria
Euro area
Relative unit labour costs, to rest of a group¹ of industrialised countries (nat. curr) (percentage change over preceding year, 1998-2018)
Finland
Portugal
Luxembourg
EU
averages
Cyprus
forecast
Romania
Spain
Denmark
Germany
Ireland
Belgium
forecast
United Kingdom
European Economic Forecast, Spring 2017
164
Table 33: 25.4.2017
5-year
1998-02 2003-07 2008-12 2013 2014 2015 2016 2017 2018 2016 2017 2018-0.5 0.9 0.3 3.5 -0.8 -4.3 -0.2 -0.3 -0.8 -0.1 0.6 -0.6-2.3 -0.7 -0.4 4.1 2.0 -2.9 1.4 0.2 -0.1 1.3 0.9 -0.12.1 6.8 0.6 4.3 2.1 5.0 3.6 2.2 1.0 5.2 2.0 0.6
-1.2 4.8 -3.2 4.8 -5.5 -22.4 0.9 -0.3 -0.8 1.7 0.0 -1.20.1 2.2 -0.6 -5.3 -2.4 -5.8 0.9 0.0 -1.1 1.1 0.8 -1.40.1 3.0 -1.7 0.7 -0.7 -3.5 -0.7 -0.9 -0.7 0.0 0.4 -0.5
-1.0 1.6 -0.3 3.1 0.5 -4.3 0.1 -0.8 -0.7 0.0 -0.4 -0.7-1.2 2.7 -0.1 2.4 -0.2 -4.1 0.1 -1.2 -0.6 -0.2 -0.4 -0.7-1.3 3.0 0.6 -2.3 -4.2 -5.2 -0.5 -0.6 -1.0 0.3 0.1 -0.80.7 8.0 -2.1 4.7 4.3 2.9 3.9 1.5 1.7 2.0 1.6 0.9
Lithuania 2.7 4.3 -1.6 3.3 2.6 1.6 4.0 1.1 0.9 4.5 2.6 1.60.5 1.4 2.1 1.0 -1.3 -2.4 -1.3 0.3 -1.1 -0.7 1.1 -0.6
-0.3 2.5 0.9 2.8 -1.7 -3.4 0.5 0.0 -0.2 1.6 1.2 0.00.8 0.7 0.2 1.9 -0.7 -4.0 0.6 0.9 0.6 1.6 1.1 0.2
-1.8 0.7 0.0 3.2 1.7 -1.7 0.3 -0.7 -0.7 0.1 -0.5 -0.91.0 0.9 -2.1 2.6 -1.7 -3.7 1.5 -0.4 -0.7 1.2 -0.6 -1.4
-0.2 0.5 0.7 0.7 -1.7 -1.9 0.8 -0.4 0.1 -0.1 -0.8 0.00.3 6.4 2.4 0.3 0.1 -0.8 0.3 0.7 0.6 0.4 1.2 0.3
-1.3 0.9 1.2 3.2 1.3 -3.0 -0.5 -3.3 -1.3 -0.6 -2.7 -1.6-2.4 2.5 -0.8 6.3 1.1 -7.8 0.7 -0.6 -0.7 0.9 0.7 -0.810.5 2.7 4.6 9.0 4.6 -0.2 -1.3 1.4 0.0 0.3 2.2 0.2
5.9 3.2 1.7 -2.6 -6.1 -2.1 3.6 1.5 0.4 2.9 0.9 0.20.4 2.2 -0.8 1.9 1.0 -2.5 2.0 0.1 0.1 2.5 0.6 -0.11.9 2.3 -0.8 -2.5 -3.4 -2.9 -1.0 1.3 -0.4 1.0 0.9 -0.34.4 2.7 -2.8 -1.7 -2.5 -2.1 4.1 2.3 0.9 3.9 2.7 0.81.6 -0.8 -1.6 0.2 0.4 -3.8 -3.5 2.1 0.4 -2.7 0.8 0.37.4 9.2 -3.6 0.9 3.4 -6.5 2.2 3.0 1.1 1.1 3.0 0.6
-2.3 0.7 1.3 3.8 -4.0 -5.2 -0.5 -1.5 -0.4 0.4 0.5 0.42.6 1.7 -4.1 -1.5 5.6 7.0 -10.2 -4.9 0.4 -10.9 -5.5 -0.2
-1.3 5.0 -3.0 8.3 2.7 -9.0 -3.0 -2.0 -0.8 -2.8 -0.4 -1.12.7 -4.3 -1.5 2.5 4.3 18.3 4.1 3.8 0.3 4.4 6.1 1.6
-3.3 -6.1 5.4 -20.6 -6.7 -4.7 11.3 -1.8 -0.8 11.5 -4.3 -1.6
Slovenia
Malta
Spring 2017
USA
Latvia
Croatia
Estonia
Bulgaria
Netherlands
Japan
Sweden
France
Hungary
Winter 2017
¹ 37 countries: EU, TR, CH, NO, US, CA, JP, AU, MX and NZ.
Italy
Poland
Greece
Czech Republic
Slovakia
Austria
Euro area
Real effective exchange rate : ulc relative to rest of a group ¹ of industrialised countries (USD) (% change on preceding year, 1998-2018)
Finland
Portugal
Luxembourg
EU
averages
Cyprus
forecast
Romania
Spain
Denmark
Germany
Ireland
Belgium
forecast
United Kingdom
Table 34: 25.4.2017
5-year
1998-02 2003-07 2008-12 2013 2014 2015 2016 2017 2018 2016 2017 201849.7 49.6 53.6 55.9 55.1 53.9 53.3 52.7 52.1 53.6 52.9 52.546.9 45.6 45.5 44.7 44.4 44.0 44.3 44.6 44.7 44.3 44.4 44.537.5 34.2 40.6 38.5 38.5 40.4 40.4 41.1 42.0 40.5 41.3 41.233.0 33.8 48.4 39.9 37.8 29.5 28.0 27.4 26.8 27.9 27.6 27.345.9 46.4 53.4 62.3 50.6 54.2 49.0 49.6 47.3 51.2 49.8 47.039.4 38.5 45.3 45.6 44.9 43.8 42.4 41.5 40.9 42.7 41.6 41.151.8 52.6 55.8 57.0 57.1 56.7 56.2 56.0 55.9 56.5 56.2 56.247.1 47.1 49.8 51.0 50.9 50.5 49.6 49.5 49.2 49.4 49.1 49.134.8 38.7 41.1 41.6 48.4 40.4 38.9 37.9 37.5 38.3 37.8 37.337.2 34.5 40.5 36.9 37.5 37.0 36.3 37.3 37.5 36.0 38.1 38.5
Lithuania 38.7 34.3 40.8 35.6 34.8 35.1 34.2 34.3 34.0 35.0 35.5 35.739.7 41.7 43.1 43.3 41.8 41.3 41.2 40.9 40.2 41.6 41.6 41.141.3 42.7 41.9 42.0 41.5 41.2 38.1 37.9 37.3 38.7 38.4 37.743.3 43.2 46.8 46.3 46.2 45.3 43.6 43.9 43.4 44.5 44.1 43.851.6 51.4 52.1 51.2 52.7 51.7 51.1 50.7 50.4 50.6 50.3 49.843.1 45.6 49.2 49.9 51.8 48.3 45.1 45.0 44.6 46.2 46.1 45.746.0 44.5 48.0 60.3 50.1 48.1 45.5 44.8 44.0 45.2 44.6 43.547.0 38.5 40.9 41.4 42.0 45.6 41.6 41.6 41.3 41.9 41.8 41.049.4 48.6 53.7 57.5 58.1 57.0 56.1 55.5 54.6 57.0 56.5 56.246.9 46.4 49.3 49.7 49.3 48.5 47.7 47.6 47.3 47.9 47.6 47.439.1 37.1 36.2 37.6 42.1 40.7 35.5 36.8 36.9 37.1 38.1 38.342.0 42.6 42.9 42.6 42.2 42.1 39.9 40.2 40.5 40.0 40.3 40.153.7 51.5 55.6 55.8 55.3 54.8 53.6 53.3 52.3 54.2 53.5 52.4
46.0 47.1 48.0 48.5 48.6 48.4 48.6 48.4 46.1 45.7 45.148.9 49.8 49.4 49.3 49.0 50.0 47.5 47.9 47.8 46.7 47.2 46.844.1 44.2 44.3 42.6 42.3 41.6 41.3 42.0 42.1 41.2 42.2 42.636.8 34.6 39.1 35.4 34.9 35.8 34.7 34.1 35.2 34.1 34.9 35.655.0 52.2 51.4 52.4 51.5 50.2 50.0 50.0 49.4 49.7 49.9 49.636.4 40.7 46.7 44.7 43.7 42.9 42.1 41.8 41.3 42.3 42.0 41.5
45.5 48.7 48.7 48.1 47.2 46.6 46.4 46.1 46.7 46.5 46.334.7 36.5 41.4 38.7 38.1 37.7 37.9 37.8 37.9 38.0 37.9 38.137.7 35.5 39.6 40.8 40.2 39.4 39.3 39.5 39.0 39.2 39.5 39.3
Slovenia
Malta
Spring 2017
USA
Latvia
Croatia
Estonia
Bulgaria
Netherlands
Japan
Sweden
France
Hungary
Winter 2017
Italy
Poland
Greece
Czech Republic
Slovakia
Austria
Euro area
Total expenditure, general government (as a percentage of GDP, 1998-2018)
Finland
Portugal
Luxembourg
EU
averages
Cyprus
forecast
Romania
Spain
Denmark
Germany
Ireland
Belgium
forecast
United Kingdom
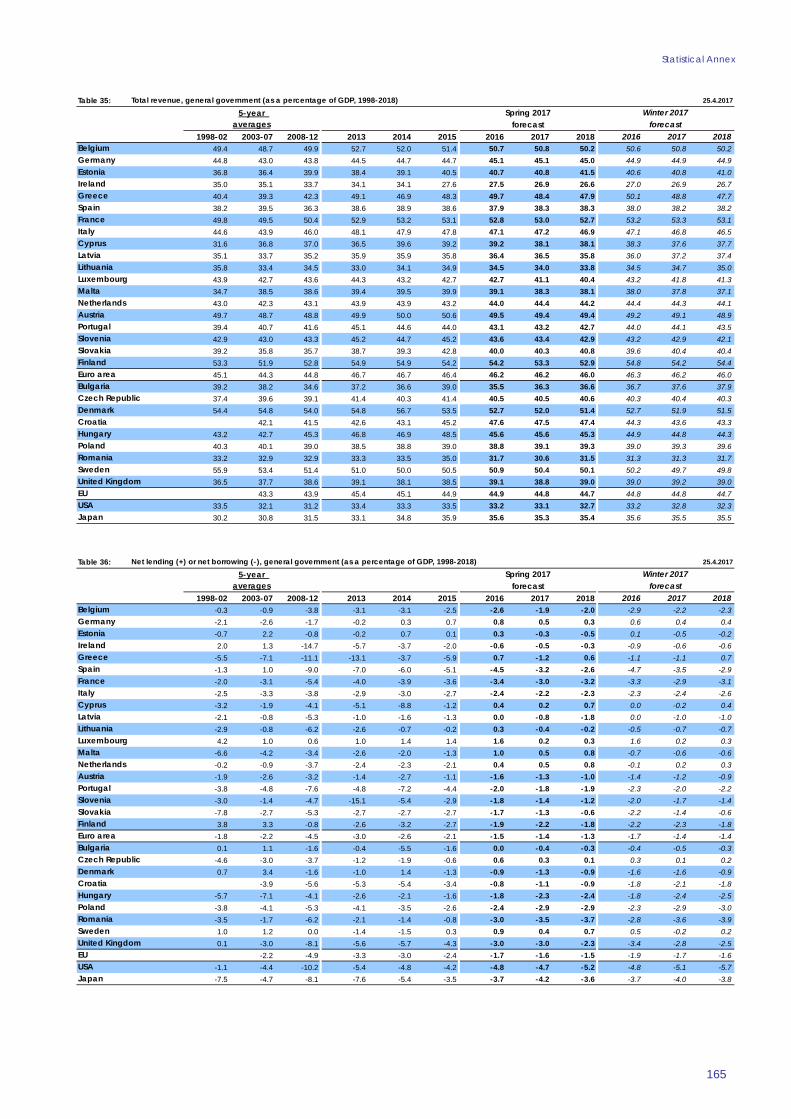
Statistical Annex
165
Table 35: 25.4.2017
5-year
1998-02 2003-07 2008-12 2013 2014 2015 2016 2017 2018 2016 2017 201849.4 48.7 49.9 52.7 52.0 51.4 50.7 50.8 50.2 50.6 50.8 50.244.8 43.0 43.8 44.5 44.7 44.7 45.1 45.1 45.0 44.9 44.9 44.936.8 36.4 39.9 38.4 39.1 40.5 40.7 40.8 41.5 40.6 40.8 41.035.0 35.1 33.7 34.1 34.1 27.6 27.5 26.9 26.6 27.0 26.9 26.740.4 39.3 42.3 49.1 46.9 48.3 49.7 48.4 47.9 50.1 48.8 47.738.2 39.5 36.3 38.6 38.9 38.6 37.9 38.3 38.3 38.0 38.2 38.249.8 49.5 50.4 52.9 53.2 53.1 52.8 53.0 52.7 53.2 53.3 53.144.6 43.9 46.0 48.1 47.9 47.8 47.1 47.2 46.9 47.1 46.8 46.531.6 36.8 37.0 36.5 39.6 39.2 39.2 38.1 38.1 38.3 37.6 37.735.1 33.7 35.2 35.9 35.9 35.8 36.4 36.5 35.8 36.0 37.2 37.4
Lithuania 35.8 33.4 34.5 33.0 34.1 34.9 34.5 34.0 33.8 34.5 34.7 35.043.9 42.7 43.6 44.3 43.2 42.7 42.7 41.1 40.4 43.2 41.8 41.334.7 38.5 38.6 39.4 39.5 39.9 39.1 38.3 38.1 38.0 37.8 37.143.0 42.3 43.1 43.9 43.9 43.2 44.0 44.4 44.2 44.4 44.3 44.149.7 48.7 48.8 49.9 50.0 50.6 49.5 49.4 49.4 49.2 49.1 48.939.4 40.7 41.6 45.1 44.6 44.0 43.1 43.2 42.7 44.0 44.1 43.542.9 43.0 43.3 45.2 44.7 45.2 43.6 43.4 42.9 43.2 42.9 42.139.2 35.8 35.7 38.7 39.3 42.8 40.0 40.3 40.8 39.6 40.4 40.453.3 51.9 52.8 54.9 54.9 54.2 54.2 53.3 52.9 54.8 54.2 54.445.1 44.3 44.8 46.7 46.7 46.4 46.2 46.2 46.0 46.3 46.2 46.039.2 38.2 34.6 37.2 36.6 39.0 35.5 36.3 36.6 36.7 37.6 37.937.4 39.6 39.1 41.4 40.3 41.4 40.5 40.5 40.6 40.3 40.4 40.354.4 54.8 54.0 54.8 56.7 53.5 52.7 52.0 51.4 52.7 51.9 51.5
42.1 41.5 42.6 43.1 45.2 47.6 47.5 47.4 44.3 43.6 43.343.2 42.7 45.3 46.8 46.9 48.5 45.6 45.6 45.3 44.9 44.8 44.340.3 40.1 39.0 38.5 38.8 39.0 38.8 39.1 39.3 39.0 39.3 39.633.2 32.9 32.9 33.3 33.5 35.0 31.7 30.6 31.5 31.3 31.3 31.755.9 53.4 51.4 51.0 50.0 50.5 50.9 50.4 50.1 50.2 49.7 49.836.5 37.7 38.6 39.1 38.1 38.5 39.1 38.8 39.0 39.0 39.2 39.0
43.3 43.9 45.4 45.1 44.9 44.9 44.8 44.7 44.8 44.8 44.733.5 32.1 31.2 33.4 33.3 33.5 33.2 33.1 32.7 33.2 32.8 32.330.2 30.8 31.5 33.1 34.8 35.9 35.6 35.3 35.4 35.6 35.5 35.5
Slovenia
Malta
Spring 2017
USA
Latvia
Croatia
Estonia
Bulgaria
Netherlands
Japan
Sweden
France
Hungary
Winter 2017
Italy
Poland
Greece
Czech Republic
Slovakia
Austria
Euro area
Total revenue, general government (as a percentage of GDP, 1998-2018)
Finland
Portugal
Luxembourg
EU
averages
Cyprus
forecast
Romania
Spain
Denmark
Germany
Ireland
Belgium
forecast
United Kingdom
Table 36: 25.4.2017
5-year
1998-02 2003-07 2008-12 2013 2014 2015 2016 2017 2018 2016 2017 2018-0.3 -0.9 -3.8 -3.1 -3.1 -2.5 -2.6 -1.9 -2.0 -2.9 -2.2 -2.3-2.1 -2.6 -1.7 -0.2 0.3 0.7 0.8 0.5 0.3 0.6 0.4 0.4-0.7 2.2 -0.8 -0.2 0.7 0.1 0.3 -0.3 -0.5 0.1 -0.5 -0.22.0 1.3 -14.7 -5.7 -3.7 -2.0 -0.6 -0.5 -0.3 -0.9 -0.6 -0.6
-5.5 -7.1 -11.1 -13.1 -3.7 -5.9 0.7 -1.2 0.6 -1.1 -1.1 0.7-1.3 1.0 -9.0 -7.0 -6.0 -5.1 -4.5 -3.2 -2.6 -4.7 -3.5 -2.9-2.0 -3.1 -5.4 -4.0 -3.9 -3.6 -3.4 -3.0 -3.2 -3.3 -2.9 -3.1-2.5 -3.3 -3.8 -2.9 -3.0 -2.7 -2.4 -2.2 -2.3 -2.3 -2.4 -2.6-3.2 -1.9 -4.1 -5.1 -8.8 -1.2 0.4 0.2 0.7 0.0 -0.2 0.4-2.1 -0.8 -5.3 -1.0 -1.6 -1.3 0.0 -0.8 -1.8 0.0 -1.0 -1.0
Lithuania -2.9 -0.8 -6.2 -2.6 -0.7 -0.2 0.3 -0.4 -0.2 -0.5 -0.7 -0.74.2 1.0 0.6 1.0 1.4 1.4 1.6 0.2 0.3 1.6 0.2 0.3
-6.6 -4.2 -3.4 -2.6 -2.0 -1.3 1.0 0.5 0.8 -0.7 -0.6 -0.6-0.2 -0.9 -3.7 -2.4 -2.3 -2.1 0.4 0.5 0.8 -0.1 0.2 0.3-1.9 -2.6 -3.2 -1.4 -2.7 -1.1 -1.6 -1.3 -1.0 -1.4 -1.2 -0.9-3.8 -4.8 -7.6 -4.8 -7.2 -4.4 -2.0 -1.8 -1.9 -2.3 -2.0 -2.2-3.0 -1.4 -4.7 -15.1 -5.4 -2.9 -1.8 -1.4 -1.2 -2.0 -1.7 -1.4-7.8 -2.7 -5.3 -2.7 -2.7 -2.7 -1.7 -1.3 -0.6 -2.2 -1.4 -0.63.8 3.3 -0.8 -2.6 -3.2 -2.7 -1.9 -2.2 -1.8 -2.2 -2.3 -1.8
-1.8 -2.2 -4.5 -3.0 -2.6 -2.1 -1.5 -1.4 -1.3 -1.7 -1.4 -1.40.1 1.1 -1.6 -0.4 -5.5 -1.6 0.0 -0.4 -0.3 -0.4 -0.5 -0.3
-4.6 -3.0 -3.7 -1.2 -1.9 -0.6 0.6 0.3 0.1 0.3 0.1 0.20.7 3.4 -1.6 -1.0 1.4 -1.3 -0.9 -1.3 -0.9 -1.6 -1.6 -0.9
-3.9 -5.6 -5.3 -5.4 -3.4 -0.8 -1.1 -0.9 -1.8 -2.1 -1.8-5.7 -7.1 -4.1 -2.6 -2.1 -1.6 -1.8 -2.3 -2.4 -1.8 -2.4 -2.5-3.8 -4.1 -5.3 -4.1 -3.5 -2.6 -2.4 -2.9 -2.9 -2.3 -2.9 -3.0-3.5 -1.7 -6.2 -2.1 -1.4 -0.8 -3.0 -3.5 -3.7 -2.8 -3.6 -3.91.0 1.2 0.0 -1.4 -1.5 0.3 0.9 0.4 0.7 0.5 -0.2 0.20.1 -3.0 -8.1 -5.6 -5.7 -4.3 -3.0 -3.0 -2.3 -3.4 -2.8 -2.5
-2.2 -4.9 -3.3 -3.0 -2.4 -1.7 -1.6 -1.5 -1.9 -1.7 -1.6-1.1 -4.4 -10.2 -5.4 -4.8 -4.2 -4.8 -4.7 -5.2 -4.8 -5.1 -5.7-7.5 -4.7 -8.1 -7.6 -5.4 -3.5 -3.7 -4.2 -3.6 -3.7 -4.0 -3.8
Slovenia
Malta
Spring 2017
USA
Latvia
Croatia
Estonia
Bulgaria
Netherlands
Japan
Sweden
France
Hungary
Winter 2017
Italy
Poland
Greece
Czech Republic
Slovakia
Austria
Euro area
Net lending (+) or net borrowing (-), general government (as a percentage of GDP, 1998-2018)
Finland
Portugal
Luxembourg
EU
averages
Cyprus
forecast
Romania
Spain
Denmark
Germany
Ireland
Belgium
forecast
United Kingdom
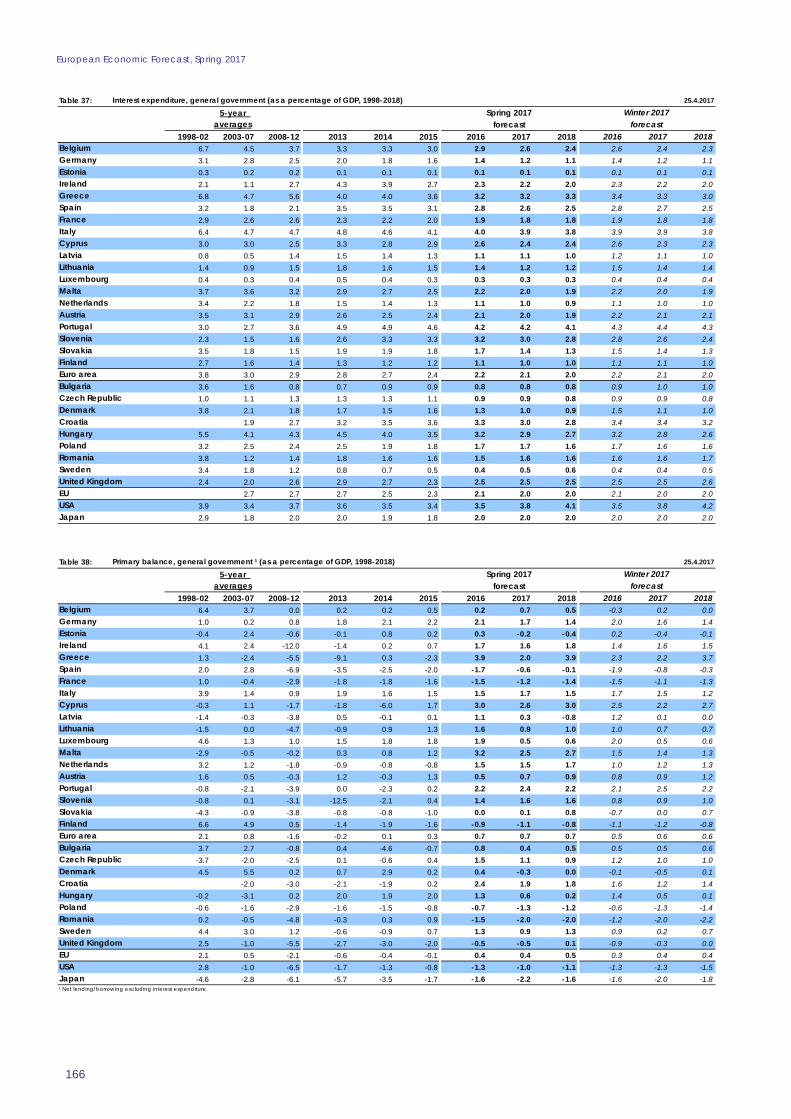
European Economic Forecast, Spring 2017
166
Table 37: 25.4.2017
5-year
1998-02 2003-07 2008-12 2013 2014 2015 2016 2017 2018 2016 2017 20186.7 4.5 3.7 3.3 3.3 3.0 2.9 2.6 2.4 2.6 2.4 2.33.1 2.8 2.5 2.0 1.8 1.6 1.4 1.2 1.1 1.4 1.2 1.10.3 0.2 0.2 0.1 0.1 0.1 0.1 0.1 0.1 0.1 0.1 0.12.1 1.1 2.7 4.3 3.9 2.7 2.3 2.2 2.0 2.3 2.2 2.06.8 4.7 5.6 4.0 4.0 3.6 3.2 3.2 3.3 3.4 3.3 3.03.2 1.8 2.1 3.5 3.5 3.1 2.8 2.6 2.5 2.8 2.7 2.52.9 2.6 2.6 2.3 2.2 2.0 1.9 1.8 1.8 1.9 1.8 1.86.4 4.7 4.7 4.8 4.6 4.1 4.0 3.9 3.8 3.9 3.9 3.83.0 3.0 2.5 3.3 2.8 2.9 2.6 2.4 2.4 2.6 2.3 2.30.8 0.5 1.4 1.5 1.4 1.3 1.1 1.1 1.0 1.2 1.1 1.0
Lithuania 1.4 0.9 1.5 1.8 1.6 1.5 1.4 1.2 1.2 1.5 1.4 1.40.4 0.3 0.4 0.5 0.4 0.3 0.3 0.3 0.3 0.4 0.4 0.43.7 3.6 3.2 2.9 2.7 2.5 2.2 2.0 1.9 2.2 2.0 1.93.4 2.2 1.8 1.5 1.4 1.3 1.1 1.0 0.9 1.1 1.0 1.03.5 3.1 2.9 2.6 2.5 2.4 2.1 2.0 1.9 2.2 2.1 2.13.0 2.7 3.6 4.9 4.9 4.6 4.2 4.2 4.1 4.3 4.4 4.32.3 1.5 1.6 2.6 3.3 3.3 3.2 3.0 2.8 2.8 2.6 2.43.5 1.8 1.5 1.9 1.9 1.8 1.7 1.4 1.3 1.5 1.4 1.32.7 1.6 1.4 1.3 1.2 1.2 1.1 1.0 1.0 1.1 1.1 1.03.8 3.0 2.9 2.8 2.7 2.4 2.2 2.1 2.0 2.2 2.1 2.03.6 1.6 0.8 0.7 0.9 0.9 0.8 0.8 0.8 0.9 1.0 1.01.0 1.1 1.3 1.3 1.3 1.1 0.9 0.9 0.8 0.9 0.9 0.83.8 2.1 1.8 1.7 1.5 1.6 1.3 1.0 0.9 1.5 1.1 1.0
1.9 2.7 3.2 3.5 3.6 3.3 3.0 2.8 3.4 3.4 3.25.5 4.1 4.3 4.5 4.0 3.5 3.2 2.9 2.7 3.2 2.8 2.63.2 2.5 2.4 2.5 1.9 1.8 1.7 1.7 1.6 1.7 1.6 1.63.8 1.2 1.4 1.8 1.6 1.6 1.5 1.6 1.6 1.6 1.6 1.73.4 1.8 1.2 0.8 0.7 0.5 0.4 0.5 0.6 0.4 0.4 0.52.4 2.0 2.6 2.9 2.7 2.3 2.5 2.5 2.5 2.5 2.5 2.6
2.7 2.7 2.7 2.5 2.3 2.1 2.0 2.0 2.1 2.0 2.03.9 3.4 3.7 3.6 3.5 3.4 3.5 3.8 4.1 3.5 3.8 4.22.9 1.8 2.0 2.0 1.9 1.8 2.0 2.0 2.0 2.0 2.0 2.0
Slovenia
Malta
Spring 2017
USA
Latvia
Croatia
Estonia
Bulgaria
Netherlands
Japan
Sweden
France
Hungary
Winter 2017
Italy
Poland
Greece
Czech Republic
Slovakia
Austria
Euro area
Interest expenditure, general government (as a percentage of GDP, 1998-2018)
Finland
Portugal
Luxembourg
EU
averages
Cyprus
forecast
Romania
Spain
Denmark
Germany
Ireland
Belgium
forecast
United Kingdom
Table 38: 25.4.2017
5-year
1998-02 2003-07 2008-12 2013 2014 2015 2016 2017 2018 2016 2017 20186.4 3.7 0.0 0.2 0.2 0.5 0.2 0.7 0.5 -0.3 0.2 0.01.0 0.2 0.8 1.8 2.1 2.2 2.1 1.7 1.4 2.0 1.6 1.4
-0.4 2.4 -0.6 -0.1 0.8 0.2 0.3 -0.2 -0.4 0.2 -0.4 -0.14.1 2.4 -12.0 -1.4 0.2 0.7 1.7 1.6 1.8 1.4 1.6 1.51.3 -2.4 -5.5 -9.1 0.3 -2.3 3.9 2.0 3.9 2.3 2.2 3.72.0 2.8 -6.9 -3.5 -2.5 -2.0 -1.7 -0.6 -0.1 -1.9 -0.8 -0.31.0 -0.4 -2.9 -1.8 -1.8 -1.6 -1.5 -1.2 -1.4 -1.5 -1.1 -1.33.9 1.4 0.9 1.9 1.6 1.5 1.5 1.7 1.5 1.7 1.5 1.2
-0.3 1.1 -1.7 -1.8 -6.0 1.7 3.0 2.6 3.0 2.5 2.2 2.7-1.4 -0.3 -3.8 0.5 -0.1 0.1 1.1 0.3 -0.8 1.2 0.1 0.0
Lithuania -1.5 0.0 -4.7 -0.9 0.9 1.3 1.6 0.9 1.0 1.0 0.7 0.74.6 1.3 1.0 1.5 1.8 1.8 1.9 0.5 0.6 2.0 0.5 0.6
-2.9 -0.5 -0.2 0.3 0.8 1.2 3.2 2.5 2.7 1.5 1.4 1.33.2 1.2 -1.8 -0.9 -0.8 -0.8 1.5 1.5 1.7 1.0 1.2 1.31.6 0.5 -0.3 1.2 -0.3 1.3 0.5 0.7 0.9 0.8 0.9 1.2
-0.8 -2.1 -3.9 0.0 -2.3 0.2 2.2 2.4 2.2 2.1 2.5 2.2-0.8 0.1 -3.1 -12.5 -2.1 0.4 1.4 1.6 1.6 0.8 0.9 1.0-4.3 -0.9 -3.8 -0.8 -0.8 -1.0 0.0 0.1 0.8 -0.7 0.0 0.76.6 4.9 0.5 -1.4 -1.9 -1.6 -0.9 -1.1 -0.8 -1.1 -1.2 -0.82.1 0.8 -1.6 -0.2 0.1 0.3 0.7 0.7 0.7 0.5 0.6 0.63.7 2.7 -0.8 0.4 -4.6 -0.7 0.8 0.4 0.5 0.5 0.5 0.6
-3.7 -2.0 -2.5 0.1 -0.6 0.4 1.5 1.1 0.9 1.2 1.0 1.04.5 5.5 0.2 0.7 2.9 0.2 0.4 -0.3 0.0 -0.1 -0.5 0.1
-2.0 -3.0 -2.1 -1.9 0.2 2.4 1.9 1.8 1.6 1.2 1.4-0.2 -3.1 0.2 2.0 1.9 2.0 1.3 0.6 0.2 1.4 0.5 0.1-0.6 -1.6 -2.9 -1.6 -1.5 -0.8 -0.7 -1.3 -1.2 -0.6 -1.3 -1.40.2 -0.5 -4.8 -0.3 0.3 0.9 -1.5 -2.0 -2.0 -1.2 -2.0 -2.24.4 3.0 1.2 -0.6 -0.9 0.7 1.3 0.9 1.3 0.9 0.2 0.72.5 -1.0 -5.5 -2.7 -3.0 -2.0 -0.5 -0.5 0.1 -0.9 -0.3 0.02.1 0.5 -2.1 -0.6 -0.4 -0.1 0.4 0.4 0.5 0.3 0.4 0.42.8 -1.0 -6.5 -1.7 -1.3 -0.8 -1.3 -1.0 -1.1 -1.3 -1.3 -1.5
-4.6 -2.8 -6.1 -5.7 -3.5 -1.7 -1.6 -2.2 -1.6 -1.6 -2.0 -1.8
Slovenia
Malta
Spring 2017
USA
Latvia
Croatia
Estonia
Bulgaria
Netherlands
Japan
Sweden
France
Hungary
Winter 2017
¹ Net lending/borrowing excluding interest expenditure.
Italy
Poland
Greece
Czech Republic
Slovakia
Austria
Euro area
Primary balance, general government ¹ (as a percentage of GDP, 1998-2018)
Finland
Portugal
Luxembourg
EU
averages
Cyprus
forecast
Romania
Spain
Denmark
Germany
Ireland
Belgium
forecast
United Kingdom
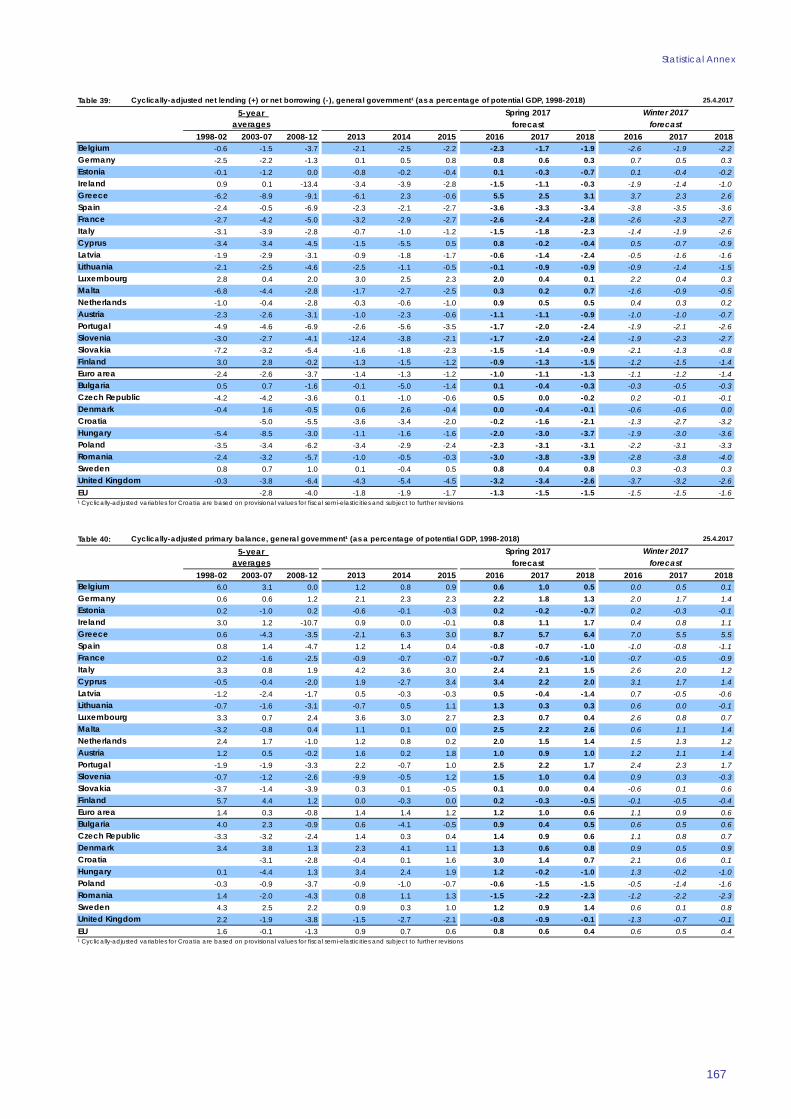
Statistical Annex
167
Table 39:5-year
1998-02 2003-07 2008-12 2013 2014 2015 2016 2017 2018 2016 2017 2018-0.6 -1.5 -3.7 -2.1 -2.5 -2.2 -2.3 -1.7 -1.9 -2.6 -1.9 -2.2-2.5 -2.2 -1.3 0.1 0.5 0.8 0.8 0.6 0.3 0.7 0.5 0.3-0.1 -1.2 0.0 -0.8 -0.2 -0.4 0.1 -0.3 -0.7 0.1 -0.4 -0.20.9 0.1 -13.4 -3.4 -3.9 -2.8 -1.5 -1.1 -0.3 -1.9 -1.4 -1.0
-6.2 -8.9 -9.1 -6.1 2.3 -0.6 5.5 2.5 3.1 3.7 2.3 2.6-2.4 -0.5 -6.9 -2.3 -2.1 -2.7 -3.6 -3.3 -3.4 -3.8 -3.5 -3.6-2.7 -4.2 -5.0 -3.2 -2.9 -2.7 -2.6 -2.4 -2.8 -2.6 -2.3 -2.7-3.1 -3.9 -2.8 -0.7 -1.0 -1.2 -1.5 -1.8 -2.3 -1.4 -1.9 -2.6-3.4 -3.4 -4.5 -1.5 -5.5 0.5 0.8 -0.2 -0.4 0.5 -0.7 -0.9-1.9 -2.9 -3.1 -0.9 -1.8 -1.7 -0.6 -1.4 -2.4 -0.5 -1.6 -1.6
Lithuania -2.1 -2.5 -4.6 -2.5 -1.1 -0.5 -0.1 -0.9 -0.9 -0.9 -1.4 -1.52.8 0.4 2.0 3.0 2.5 2.3 2.0 0.4 0.1 2.2 0.4 0.3
-6.8 -4.4 -2.8 -1.7 -2.7 -2.5 0.3 0.2 0.7 -1.6 -0.9 -0.5-1.0 -0.4 -2.8 -0.3 -0.6 -1.0 0.9 0.5 0.5 0.4 0.3 0.2-2.3 -2.6 -3.1 -1.0 -2.3 -0.6 -1.1 -1.1 -0.9 -1.0 -1.0 -0.7-4.9 -4.6 -6.9 : -2.6 -5.6 -3.5 -1.7 -2.0 -2.4 -1.9 -2.1 -2.6-3.0 -2.7 -4.1 -12.4 -3.8 -2.1 -1.7 -2.0 -2.4 -1.9 -2.3 -2.7-7.2 -3.2 -5.4 -1.6 -1.8 -2.3 -1.5 -1.4 -0.9 -2.1 -1.3 -0.83.0 2.8 -0.2 -1.3 -1.5 -1.2 -0.9 -1.3 -1.5 -1.2 -1.5 -1.4
-2.4 -2.6 -3.7 -1.4 -1.3 -1.2 -1.0 -1.1 -1.3 -1.1 -1.2 -1.40.5 0.7 -1.6 -0.1 -5.0 -1.4 0.1 -0.4 -0.3 -0.3 -0.5 -0.3
-4.2 -4.2 -3.6 0.1 -1.0 -0.6 0.5 0.0 -0.2 0.2 -0.1 -0.1-0.4 1.6 -0.5 0.6 2.6 -0.4 0.0 -0.4 -0.1 -0.6 -0.6 0.0
-5.0 -5.5 -3.6 -3.4 -2.0 -0.2 -1.6 -2.1 -1.3 -2.7 -3.2-5.4 -8.5 -3.0 -1.1 -1.6 -1.6 -2.0 -3.0 -3.7 -1.9 -3.0 -3.6-3.5 -3.4 -6.2 -3.4 -2.9 -2.4 -2.3 -3.1 -3.1 -2.2 -3.1 -3.3-2.4 -3.2 -5.7 -1.0 -0.5 -0.3 -3.0 -3.8 -3.9 -2.8 -3.8 -4.00.8 0.7 1.0 0.1 -0.4 0.5 0.8 0.4 0.8 0.3 -0.3 0.3
-0.3 -3.8 -6.4 -4.3 -5.4 -4.5 -3.2 -3.4 -2.6 -3.7 -3.2 -2.6-2.8 -4.0 -1.8 -1.9 -1.7 -1.3 -1.5 -1.5 -1.5 -1.5 -1.6
25.4.2017Cyclically-adjusted net lending (+) or net borrowing (-), general government¹ (as a percentage of potential GDP, 1998-2018)
Sweden
Finland
Latvia
Belgium
Spring 2017
Romania
Denmark
Netherlands
Greece
Winter 2017averages
Croatia
Austria
Spain
forecast
Germany
Euro area
EstoniaIreland
forecast
France
Hungary
Portugal
Luxembourg
EU
Bulgaria
Italy
Poland
Slovenia
Malta
Czech Republic
Slovakia
Cyprus
¹ Cyclically-adjusted variables for Croatia are based on provisional values for fiscal semi-elasticities and subject to further revisions
United Kingdom
Table 40:5-year
1998-02 2003-07 2008-12 2013 2014 2015 2016 2017 2018 2016 2017 20186.0 3.1 0.0 1.2 0.8 0.9 0.6 1.0 0.5 0.0 0.5 0.10.6 0.6 1.2 2.1 2.3 2.3 2.2 1.8 1.3 2.0 1.7 1.40.2 -1.0 0.2 -0.6 -0.1 -0.3 0.2 -0.2 -0.7 0.2 -0.3 -0.13.0 1.2 -10.7 0.9 0.0 -0.1 0.8 1.1 1.7 0.4 0.8 1.10.6 -4.3 -3.5 -2.1 6.3 3.0 8.7 5.7 6.4 7.0 5.5 5.50.8 1.4 -4.7 1.2 1.4 0.4 -0.8 -0.7 -1.0 -1.0 -0.8 -1.10.2 -1.6 -2.5 -0.9 -0.7 -0.7 -0.7 -0.6 -1.0 -0.7 -0.5 -0.93.3 0.8 1.9 4.2 3.6 3.0 2.4 2.1 1.5 2.6 2.0 1.2
-0.5 -0.4 -2.0 1.9 -2.7 3.4 3.4 2.2 2.0 3.1 1.7 1.4-1.2 -2.4 -1.7 0.5 -0.3 -0.3 0.5 -0.4 -1.4 0.7 -0.5 -0.6
Lithuania -0.7 -1.6 -3.1 -0.7 0.5 1.1 1.3 0.3 0.3 0.6 0.0 -0.13.3 0.7 2.4 3.6 3.0 2.7 2.3 0.7 0.4 2.6 0.8 0.7
-3.2 -0.8 0.4 1.1 0.1 0.0 2.5 2.2 2.6 0.6 1.1 1.42.4 1.7 -1.0 1.2 0.8 0.2 2.0 1.5 1.4 1.5 1.3 1.21.2 0.5 -0.2 1.6 0.2 1.8 1.0 0.9 1.0 1.2 1.1 1.4
-1.9 -1.9 -3.3 : 2.2 -0.7 1.0 2.5 2.2 1.7 2.4 2.3 1.7-0.7 -1.2 -2.6 -9.9 -0.5 1.2 1.5 1.0 0.4 0.9 0.3 -0.3-3.7 -1.4 -3.9 0.3 0.1 -0.5 0.1 0.0 0.4 -0.6 0.1 0.65.7 4.4 1.2 0.0 -0.3 0.0 0.2 -0.3 -0.5 -0.1 -0.5 -0.41.4 0.3 -0.8 1.4 1.4 1.2 1.2 1.0 0.6 1.1 0.9 0.64.0 2.3 -0.9 0.6 -4.1 -0.5 0.9 0.4 0.5 0.6 0.5 0.6
-3.3 -3.2 -2.4 1.4 0.3 0.4 1.4 0.9 0.6 1.1 0.8 0.73.4 3.8 1.3 2.3 4.1 1.1 1.3 0.6 0.8 0.9 0.5 0.9
-3.1 -2.8 -0.4 0.1 1.6 3.0 1.4 0.7 2.1 0.6 0.10.1 -4.4 1.3 3.4 2.4 1.9 1.2 -0.2 -1.0 1.3 -0.2 -1.0
-0.3 -0.9 -3.7 -0.9 -1.0 -0.7 -0.6 -1.5 -1.5 -0.5 -1.4 -1.61.4 -2.0 -4.3 0.8 1.1 1.3 -1.5 -2.2 -2.3 -1.2 -2.2 -2.34.3 2.5 2.2 0.9 0.3 1.0 1.2 0.9 1.4 0.6 0.1 0.82.2 -1.9 -3.8 -1.5 -2.7 -2.1 -0.8 -0.9 -0.1 -1.3 -0.7 -0.11.6 -0.1 -1.3 0.9 0.7 0.6 0.8 0.6 0.4 0.6 0.5 0.4
25.4.2017Cyclically-adjusted primary balance, general government¹ (as a percentage of potential GDP, 1998-2018)
Sweden
Finland
Latvia
Belgium
Spring 2017
Romania
Denmark
Netherlands
Greece
Winter 2017averages
Croatia
Austria
Spain
forecast
Germany
Euro area
EstoniaIreland
forecast
France
Hungary
Portugal
Luxembourg
EU
Bulgaria
Italy
Poland
Slovenia
Malta
Czech Republic
Slovakia
Cyprus
¹ Cyclically-adjusted variables for Croatia are based on provisional values for fiscal semi-elasticities and subject to further revisions
United Kingdom
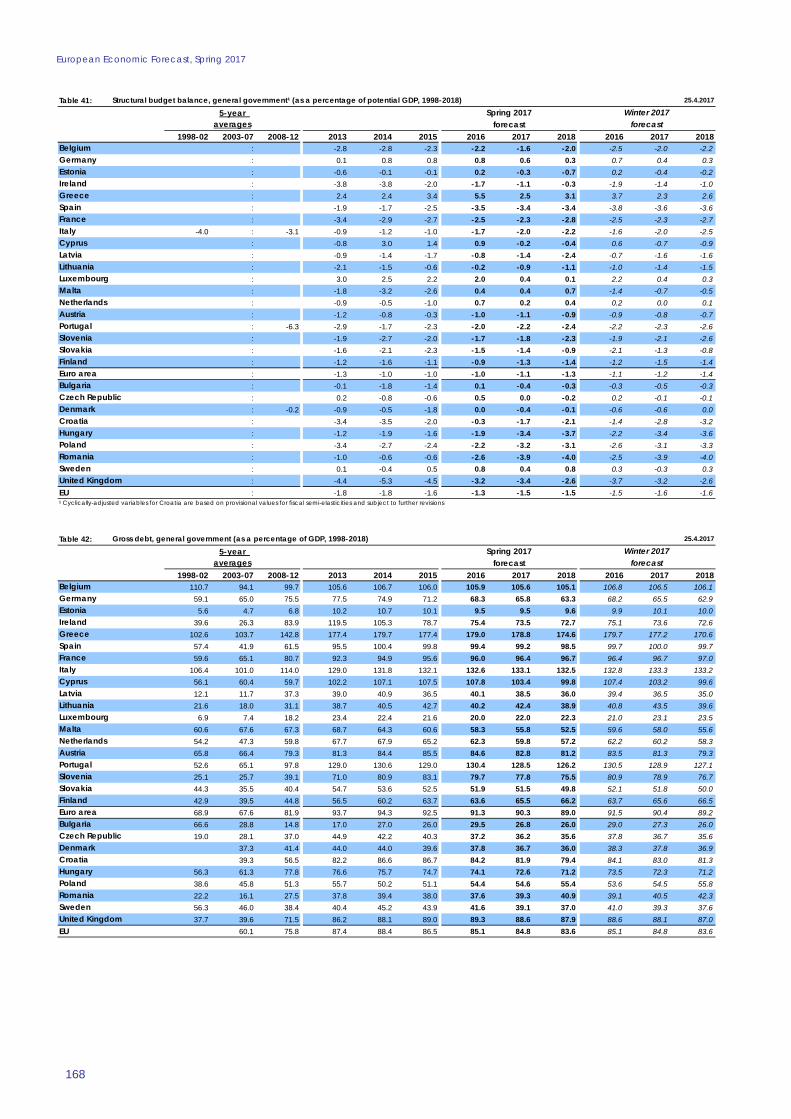
European Economic Forecast, Spring 2017
168
Table 41:5-year
1998-02 2003-07 2008-12 2013 2014 2015 2016 2017 2018 2016 2017 2018: -2.8 -2.8 -2.3 -2.2 -1.6 -2.0 -2.5 -2.0 -2.2: 0.1 0.8 0.8 0.8 0.6 0.3 0.7 0.4 0.3: -0.6 -0.1 -0.1 0.2 -0.3 -0.7 0.2 -0.4 -0.2: -3.8 -3.8 -2.0 -1.7 -1.1 -0.3 -1.9 -1.4 -1.0: 2.4 2.4 3.4 5.5 2.5 3.1 3.7 2.3 2.6: -1.9 -1.7 -2.5 -3.5 -3.4 -3.4 -3.8 -3.6 -3.6: -3.4 -2.9 -2.7 -2.5 -2.3 -2.8 -2.5 -2.3 -2.7
-4.0 : -3.1 -0.9 -1.2 -1.0 -1.7 -2.0 -2.2 -1.6 -2.0 -2.5: -0.8 3.0 1.4 0.9 -0.2 -0.4 0.6 -0.7 -0.9: -0.9 -1.4 -1.7 -0.8 -1.4 -2.4 -0.7 -1.6 -1.6
Lithuania : -2.1 -1.5 -0.6 -0.2 -0.9 -1.1 -1.0 -1.4 -1.5: 3.0 2.5 2.2 2.0 0.4 0.1 2.2 0.4 0.3: -1.8 -3.2 -2.6 0.4 0.4 0.7 -1.4 -0.7 -0.5: -0.9 -0.5 -1.0 0.7 0.2 0.4 0.2 0.0 0.1: -1.2 -0.8 -0.3 -1.0 -1.1 -0.9 -0.9 -0.8 -0.7: -6.3 : -2.9 -1.7 -2.3 -2.0 -2.2 -2.4 -2.2 -2.3 -2.6: -1.9 -2.7 -2.0 -1.7 -1.8 -2.3 -1.9 -2.1 -2.6: -1.6 -2.1 -2.3 -1.5 -1.4 -0.9 -2.1 -1.3 -0.8: -1.2 -1.6 -1.1 -0.9 -1.3 -1.4 -1.2 -1.5 -1.4: -1.3 -1.0 -1.0 -1.0 -1.1 -1.3 -1.1 -1.2 -1.4: -0.1 -1.8 -1.4 0.1 -0.4 -0.3 -0.3 -0.5 -0.3: 0.2 -0.8 -0.6 0.5 0.0 -0.2 0.2 -0.1 -0.1: -0.2 -0.9 -0.5 -1.8 0.0 -0.4 -0.1 -0.6 -0.6 0.0: -3.4 -3.5 -2.0 -0.3 -1.7 -2.1 -1.4 -2.8 -3.2: -1.2 -1.9 -1.6 -1.9 -3.4 -3.7 -2.2 -3.4 -3.6: -3.4 -2.7 -2.4 -2.2 -3.2 -3.1 -2.6 -3.1 -3.3: -1.0 -0.6 -0.6 -2.6 -3.9 -4.0 -2.5 -3.9 -4.0: 0.1 -0.4 0.5 0.8 0.4 0.8 0.3 -0.3 0.3: -4.4 -5.3 -4.5 -3.2 -3.4 -2.6 -3.7 -3.2 -2.6: -1.8 -1.8 -1.6 -1.3 -1.5 -1.5 -1.5 -1.6 -1.6
25.4.2017Structural budget balance, general government¹ (as a percentage of potential GDP, 1998-2018)
Sweden
Finland
Latvia
Belgium
Spring 2017
Romania
Denmark
Netherlands
Greece
Winter 2017averages
Croatia
Austria
Spain
forecast
Germany
Euro area
EstoniaIreland
forecast
France
Hungary
Portugal
Luxembourg
EU
Bulgaria
Italy
Poland
Slovenia
Malta
Czech Republic
Slovakia
Cyprus
¹ Cyclically-adjusted variables for Croatia are based on provisional values for fiscal semi-elasticities and subject to further revisions
United Kingdom
Table 42:5-year
1998-02 2003-07 2008-12 2013 2014 2015 2016 2017 2018 2016 2017 2018110.7 94.1 99.7 105.6 106.7 106.0 105.9 105.6 105.1 106.8 106.5 106.159.1 65.0 75.5 77.5 74.9 71.2 68.3 65.8 63.3 68.2 65.5 62.95.6 4.7 6.8 10.2 10.7 10.1 9.5 9.5 9.6 9.9 10.1 10.0
39.6 26.3 83.9 119.5 105.3 78.7 75.4 73.5 72.7 75.1 73.6 72.6102.6 103.7 142.8 177.4 179.7 177.4 179.0 178.8 174.6 179.7 177.2 170.657.4 41.9 61.5 95.5 100.4 99.8 99.4 99.2 98.5 99.7 100.0 99.759.6 65.1 80.7 92.3 94.9 95.6 96.0 96.4 96.7 96.4 96.7 97.0
106.4 101.0 114.0 129.0 131.8 132.1 132.6 133.1 132.5 132.8 133.3 133.256.1 60.4 59.7 102.2 107.1 107.5 107.8 103.4 99.8 107.4 103.2 99.612.1 11.7 37.3 39.0 40.9 36.5 40.1 38.5 36.0 39.4 36.5 35.0
Lithuania 21.6 18.0 31.1 38.7 40.5 42.7 40.2 42.4 38.9 40.8 43.5 39.66.9 7.4 18.2 23.4 22.4 21.6 20.0 22.0 22.3 21.0 23.1 23.5
60.6 67.6 67.3 68.7 64.3 60.6 58.3 55.8 52.5 59.6 58.0 55.654.2 47.3 59.8 67.7 67.9 65.2 62.3 59.8 57.2 62.2 60.2 58.365.8 66.4 79.3 81.3 84.4 85.5 84.6 82.8 81.2 83.5 81.3 79.352.6 65.1 97.8 : 129.0 130.6 129.0 130.4 128.5 126.2 130.5 128.9 127.125.1 25.7 39.1 71.0 80.9 83.1 79.7 77.8 75.5 80.9 78.9 76.744.3 35.5 40.4 54.7 53.6 52.5 51.9 51.5 49.8 52.1 51.8 50.042.9 39.5 44.8 56.5 60.2 63.7 63.6 65.5 66.2 63.7 65.6 66.568.9 67.6 81.9 93.7 94.3 92.5 91.3 90.3 89.0 91.5 90.4 89.266.6 28.8 14.8 17.0 27.0 26.0 29.5 26.8 26.0 29.0 27.3 26.019.0 28.1 37.0 44.9 42.2 40.3 37.2 36.2 35.6 37.8 36.7 35.6
37.3 41.4 44.0 44.0 39.6 37.8 36.7 36.0 38.3 37.8 36.939.3 56.5 82.2 86.6 86.7 84.2 81.9 79.4 84.1 83.0 81.3
56.3 61.3 77.8 76.6 75.7 74.7 74.1 72.6 71.2 73.5 72.3 71.238.6 45.8 51.3 55.7 50.2 51.1 54.4 54.6 55.4 53.6 54.5 55.822.2 16.1 27.5 37.8 39.4 38.0 37.6 39.3 40.9 39.1 40.5 42.356.3 46.0 38.4 40.4 45.2 43.9 41.6 39.1 37.0 41.0 39.3 37.637.7 39.6 71.5 86.2 88.1 89.0 89.3 88.6 87.9 88.6 88.1 87.0
60.1 75.8 87.4 88.4 86.5 85.1 84.8 83.6 85.1 84.8 83.6
25.4.2017Gross debt, general government (as a percentage of GDP, 1998-2018)
Sweden
Finland
Latvia
Belgium
Spring 2017
Romania
Denmark
Netherlands
Greece
Winter 2017averages
Croatia
Austria
Spain
forecast
Germany
Euro area
EstoniaIreland
forecast
France
Hungary
Portugal
Luxembourg
EU
Bulgaria
Italy
Poland
Slovenia
Malta
Czech Republic
Slovakia
Cyprus
United Kingdom
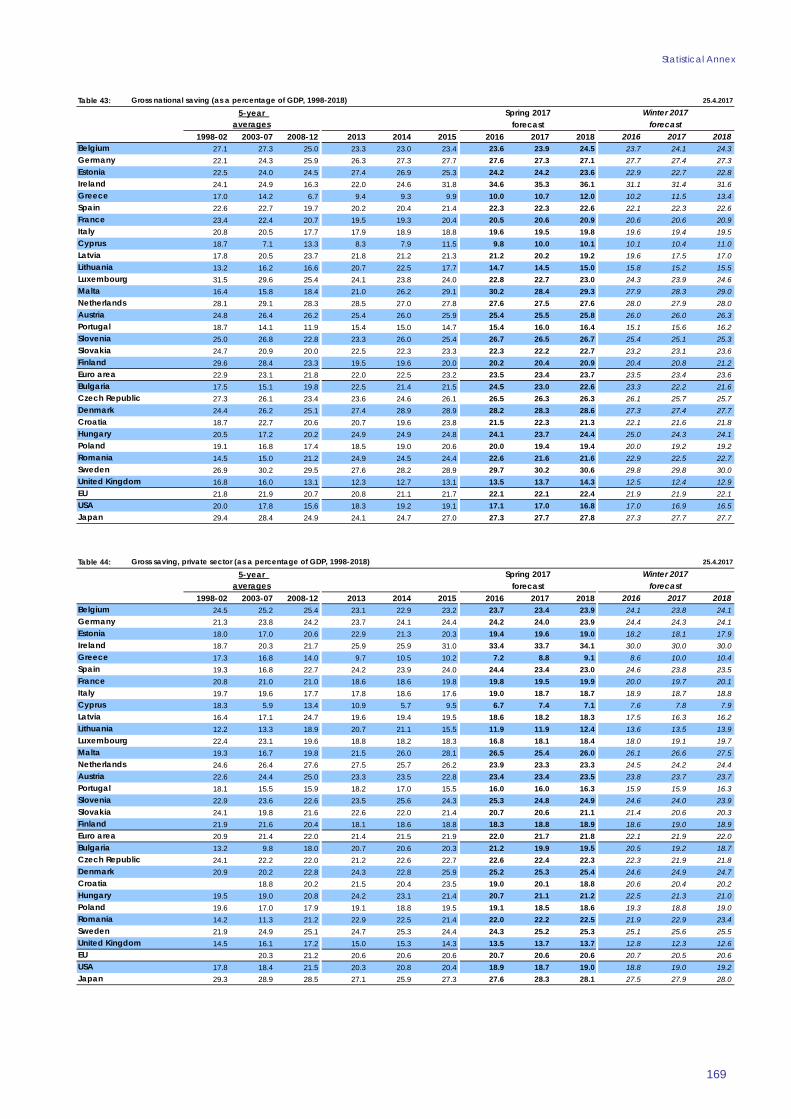
Statistical Annex
169
Table 43: 25.4.2017
5-year
1998-02 2003-07 2008-12 2013 2014 2015 2016 2017 2018 2016 2017 201827.1 27.3 25.0 23.3 23.0 23.4 23.6 23.9 24.5 23.7 24.1 24.322.1 24.3 25.9 26.3 27.3 27.7 27.6 27.3 27.1 27.7 27.4 27.322.5 24.0 24.5 27.4 26.9 25.3 24.2 24.2 23.6 22.9 22.7 22.824.1 24.9 16.3 22.0 24.6 31.8 34.6 35.3 36.1 31.1 31.4 31.617.0 14.2 6.7 9.4 9.3 9.9 10.0 10.7 12.0 10.2 11.5 13.422.6 22.7 19.7 20.2 20.4 21.4 22.3 22.3 22.6 22.1 22.3 22.623.4 22.4 20.7 19.5 19.3 20.4 20.5 20.6 20.9 20.6 20.6 20.920.8 20.5 17.7 17.9 18.9 18.8 19.6 19.5 19.8 19.6 19.4 19.518.7 7.1 13.3 8.3 7.9 11.5 9.8 10.0 10.1 10.1 10.4 11.017.8 20.5 23.7 21.8 21.2 21.3 21.2 20.2 19.2 19.6 17.5 17.0
Lithuania 13.2 16.2 16.6 20.7 22.5 17.7 14.7 14.5 15.0 15.8 15.2 15.531.5 29.6 25.4 24.1 23.8 24.0 22.8 22.7 23.0 24.3 23.9 24.616.4 15.8 18.4 21.0 26.2 29.1 30.2 28.4 29.3 27.9 28.3 29.028.1 29.1 28.3 28.5 27.0 27.8 27.6 27.5 27.6 28.0 27.9 28.024.8 26.4 26.2 25.4 26.0 25.9 25.4 25.5 25.8 26.0 26.0 26.318.7 14.1 11.9 15.4 15.0 14.7 15.4 16.0 16.4 15.1 15.6 16.225.0 26.8 22.8 23.3 26.0 25.4 26.7 26.5 26.7 25.4 25.1 25.324.7 20.9 20.0 22.5 22.3 23.3 22.3 22.2 22.7 23.2 23.1 23.629.6 28.4 23.3 19.5 19.6 20.0 20.2 20.4 20.9 20.4 20.8 21.222.9 23.1 21.8 22.0 22.5 23.2 23.5 23.4 23.7 23.5 23.4 23.617.5 15.1 19.8 22.5 21.4 21.5 24.5 23.0 22.6 23.3 22.2 21.627.3 26.1 23.4 23.6 24.6 26.1 26.5 26.3 26.3 26.1 25.7 25.724.4 26.2 25.1 27.4 28.9 28.9 28.2 28.3 28.6 27.3 27.4 27.718.7 22.7 20.6 20.7 19.6 23.8 21.5 22.3 21.3 22.1 21.6 21.820.5 17.2 20.2 24.9 24.9 24.8 24.1 23.7 24.4 25.0 24.3 24.119.1 16.8 17.4 18.5 19.0 20.6 20.0 19.4 19.4 20.0 19.2 19.214.5 15.0 21.2 24.9 24.5 24.4 22.6 21.6 21.6 22.9 22.5 22.726.9 30.2 29.5 27.6 28.2 28.9 29.7 30.2 30.6 29.8 29.8 30.016.8 16.0 13.1 12.3 12.7 13.1 13.5 13.7 14.3 12.5 12.4 12.921.8 21.9 20.7 20.8 21.1 21.7 22.1 22.1 22.4 21.9 21.9 22.120.0 17.8 15.6 18.3 19.2 19.1 17.1 17.0 16.8 17.0 16.9 16.529.4 28.4 24.9 24.1 24.7 27.0 27.3 27.7 27.8 27.3 27.7 27.7
Slovenia
Malta
Spring 2017
USA
Latvia
Croatia
Estonia
Bulgaria
Netherlands
Japan
Sweden
France
Hungary
Winter 2017
Italy
Poland
Greece
Czech Republic
Slovakia
Austria
Euro area
Gross national saving (as a percentage of GDP, 1998-2018)
Finland
Portugal
Luxembourg
EU
averages
Cyprus
forecast
Romania
Spain
Denmark
Germany
Ireland
Belgium
forecast
United Kingdom
Table 44: 25.4.2017
5-year
1998-02 2003-07 2008-12 2013 2014 2015 2016 2017 2018 2016 2017 201824.5 25.2 25.4 23.1 22.9 23.2 23.7 23.4 23.9 24.1 23.8 24.121.3 23.8 24.2 23.7 24.1 24.4 24.2 24.0 23.9 24.4 24.3 24.118.0 17.0 20.6 22.9 21.3 20.3 19.4 19.6 19.0 18.2 18.1 17.918.7 20.3 21.7 25.9 25.9 31.0 33.4 33.7 34.1 30.0 30.0 30.017.3 16.8 14.0 9.7 10.5 10.2 7.2 8.8 9.1 8.6 10.0 10.419.3 16.8 22.7 24.2 23.9 24.0 24.4 23.4 23.0 24.6 23.8 23.520.8 21.0 21.0 18.6 18.6 19.8 19.8 19.5 19.9 20.0 19.7 20.119.7 19.6 17.7 17.8 18.6 17.6 19.0 18.7 18.7 18.9 18.7 18.818.3 5.9 13.4 10.9 5.7 9.5 6.7 7.4 7.1 7.6 7.8 7.916.4 17.1 24.7 19.6 19.4 19.5 18.6 18.2 18.3 17.5 16.3 16.2
Lithuania 12.2 13.3 18.9 20.7 21.1 15.5 11.9 11.9 12.4 13.6 13.5 13.922.4 23.1 19.6 18.8 18.2 18.3 16.8 18.1 18.4 18.0 19.1 19.719.3 16.7 19.8 21.5 26.0 28.1 26.5 25.4 26.0 26.1 26.6 27.524.6 26.4 27.6 27.5 25.7 26.2 23.9 23.3 23.3 24.5 24.2 24.422.6 24.4 25.0 23.3 23.5 22.8 23.4 23.4 23.5 23.8 23.7 23.718.1 15.5 15.9 18.2 17.0 15.5 16.0 16.0 16.3 15.9 15.9 16.322.9 23.6 22.6 23.5 25.6 24.3 25.3 24.8 24.9 24.6 24.0 23.924.1 19.8 21.6 22.6 22.0 21.4 20.7 20.6 21.1 21.4 20.6 20.321.9 21.6 20.4 18.1 18.6 18.8 18.3 18.8 18.9 18.6 19.0 18.920.9 21.4 22.0 21.4 21.5 21.9 22.0 21.7 21.8 22.1 21.9 22.013.2 9.8 18.0 20.7 20.6 20.3 21.2 19.9 19.5 20.5 19.2 18.724.1 22.2 22.0 21.2 22.6 22.7 22.6 22.4 22.3 22.3 21.9 21.820.9 20.2 22.8 24.3 22.8 25.9 25.2 25.3 25.4 24.6 24.9 24.7
18.8 20.2 21.5 20.4 23.5 19.0 20.1 18.8 20.6 20.4 20.219.5 19.0 20.8 24.2 23.1 21.4 20.7 21.1 21.2 22.5 21.3 21.019.6 17.0 17.9 19.1 18.8 19.5 19.1 18.5 18.6 19.3 18.8 19.014.2 11.3 21.2 22.9 22.5 21.4 22.0 22.2 22.5 21.9 22.9 23.421.9 24.9 25.1 24.7 25.3 24.4 24.3 25.2 25.3 25.1 25.6 25.514.5 16.1 17.2 15.0 15.3 14.3 13.5 13.7 13.7 12.8 12.3 12.6
20.3 21.2 20.6 20.6 20.6 20.7 20.6 20.6 20.7 20.5 20.617.8 18.4 21.5 20.3 20.8 20.4 18.9 18.7 19.0 18.8 19.0 19.229.3 28.9 28.5 27.1 25.9 27.3 27.6 28.3 28.1 27.5 27.9 28.0
Slovenia
Malta
Spring 2017
USA
Latvia
Croatia
Estonia
Bulgaria
Netherlands
Japan
Sweden
France
Hungary
Winter 2017
Italy
Poland
Greece
Czech Republic
Slovakia
Austria
Euro area
Gross saving, private sector (as a percentage of GDP, 1998-2018)
Finland
Portugal
Luxembourg
EU
averages
Cyprus
forecast
Romania
Spain
Denmark
Germany
Ireland
Belgium
forecast
United Kingdom
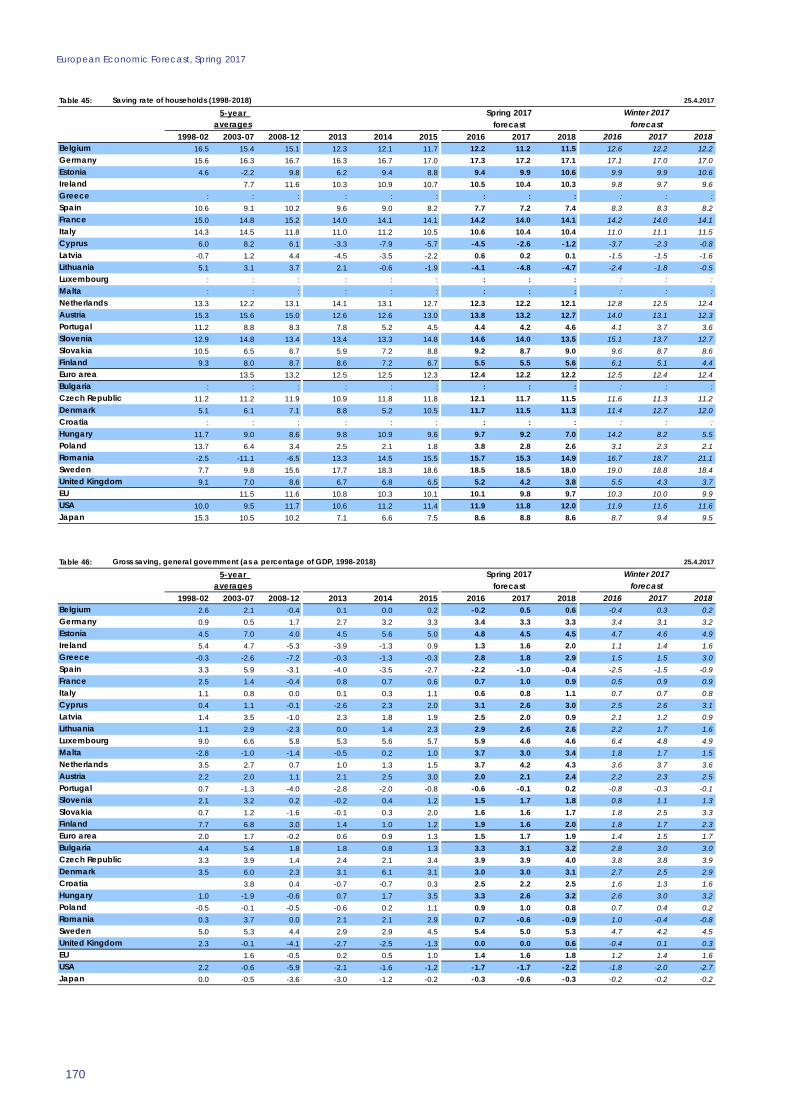
European Economic Forecast, Spring 2017
170
Table 45: 25.4.2017
5-year
1998-02 2003-07 2008-12 2013 2014 2015 2016 2017 2018 2016 2017 201816.5 15.4 15.1 12.3 12.1 11.7 12.2 11.2 11.5 12.6 12.2 12.215.6 16.3 16.7 16.3 16.7 17.0 17.3 17.2 17.1 17.1 17.0 17.0
4.6 -2.2 9.8 6.2 9.4 8.8 9.4 9.9 10.6 9.9 9.9 10.67.7 11.6 10.3 10.9 10.7 10.5 10.4 10.3 9.8 9.7 9.6
: : : : : : : : : : : :10.6 9.1 10.2 9.6 9.0 8.2 7.7 7.2 7.4 8.3 8.3 8.215.0 14.8 15.2 14.0 14.1 14.1 14.2 14.0 14.1 14.2 14.0 14.114.3 14.5 11.8 11.0 11.2 10.5 10.6 10.4 10.4 11.0 11.1 11.5
6.0 8.2 6.1 -3.3 -7.9 -5.7 -4.5 -2.6 -1.2 -3.7 -2.3 -0.8-0.7 1.2 4.4 -4.5 -3.5 -2.2 0.6 0.2 0.1 -1.5 -1.5 -1.6
Lithuania 5.1 3.1 3.7 2.1 -0.6 -1.9 -4.1 -4.8 -4.7 -2.4 -1.8 -0.5: : : : : : : : : : : :: : : : : : : : : : : :
13.3 12.2 13.1 14.1 13.1 12.7 12.3 12.2 12.1 12.8 12.5 12.415.3 15.6 15.0 12.6 12.6 13.0 13.8 13.2 12.7 14.0 13.1 12.311.2 8.8 8.3 7.8 5.2 4.5 4.4 4.2 4.6 4.1 3.7 3.612.9 14.8 13.4 13.4 13.3 14.8 14.6 14.0 13.5 15.1 13.7 12.710.5 6.5 6.7 5.9 7.2 8.8 9.2 8.7 9.0 9.6 8.7 8.6
9.3 8.0 8.7 8.6 7.2 6.7 5.5 5.5 5.6 6.1 5.1 4.413.5 13.2 12.5 12.5 12.3 12.4 12.2 12.2 12.5 12.4 12.4
: : : : : : : : : : : :11.2 11.2 11.9 10.9 11.8 11.8 12.1 11.7 11.5 11.6 11.3 11.2
5.1 6.1 7.1 8.8 5.2 10.5 11.7 11.5 11.3 11.4 12.7 12.0: : : : : : : : : : : :
11.7 9.0 8.6 9.8 10.9 9.6 9.7 9.2 7.0 14.2 8.2 5.513.7 6.4 3.4 2.5 2.1 1.8 3.8 2.8 2.6 3.1 2.3 2.1-2.5 -11.1 -6.5 13.3 14.5 15.5 15.7 15.3 14.9 16.7 18.7 21.17.7 9.8 15.6 17.7 18.3 18.6 18.5 18.5 18.0 19.0 18.8 18.49.1 7.0 8.6 6.7 6.8 6.5 5.2 4.2 3.8 5.5 4.3 3.7
11.5 11.6 10.8 10.3 10.1 10.1 9.8 9.7 10.3 10.0 9.910.0 9.5 11.7 10.6 11.2 11.4 11.9 11.8 12.0 11.9 11.6 11.615.3 10.5 10.2 7.1 6.6 7.5 8.6 8.8 8.6 8.7 9.4 9.5
Slovenia
Malta
Spring 2017
USA
Latvia
Croatia
Estonia
Bulgaria
Netherlands
Japan
Sweden
France
Hungary
Winter 2017
Italy
Poland
Greece
Czech Republic
Slovakia
Austria
Euro area
Saving rate of households (1998-2018)
Finland
Portugal
Luxembourg
EU
averages
Cyprus
forecast
Romania
Spain
Denmark
Germany
Ireland
Belgium
forecast
United Kingdom
Table 46: 25.4.2017
5-year
1998-02 2003-07 2008-12 2013 2014 2015 2016 2017 2018 2016 2017 20182.6 2.1 -0.4 0.1 0.0 0.2 -0.2 0.5 0.6 -0.4 0.3 0.20.9 0.5 1.7 2.7 3.2 3.3 3.4 3.3 3.3 3.4 3.1 3.24.5 7.0 4.0 4.5 5.6 5.0 4.8 4.5 4.5 4.7 4.6 4.95.4 4.7 -5.3 -3.9 -1.3 0.9 1.3 1.6 2.0 1.1 1.4 1.6
-0.3 -2.6 -7.2 -0.3 -1.3 -0.3 2.8 1.8 2.9 1.5 1.5 3.03.3 5.9 -3.1 -4.0 -3.5 -2.7 -2.2 -1.0 -0.4 -2.5 -1.5 -0.92.5 1.4 -0.4 0.8 0.7 0.6 0.7 1.0 0.9 0.5 0.9 0.91.1 0.8 0.0 0.1 0.3 1.1 0.6 0.8 1.1 0.7 0.7 0.80.4 1.1 -0.1 -2.6 2.3 2.0 3.1 2.6 3.0 2.5 2.6 3.11.4 3.5 -1.0 2.3 1.8 1.9 2.5 2.0 0.9 2.1 1.2 0.9
Lithuania 1.1 2.9 -2.3 0.0 1.4 2.3 2.9 2.6 2.6 2.2 1.7 1.69.0 6.6 5.8 5.3 5.6 5.7 5.9 4.6 4.6 6.4 4.8 4.9
-2.8 -1.0 -1.4 -0.5 0.2 1.0 3.7 3.0 3.4 1.8 1.7 1.53.5 2.7 0.7 1.0 1.3 1.5 3.7 4.2 4.3 3.6 3.7 3.62.2 2.0 1.1 2.1 2.5 3.0 2.0 2.1 2.4 2.2 2.3 2.50.7 -1.3 -4.0 -2.8 -2.0 -0.8 -0.6 -0.1 0.2 -0.8 -0.3 -0.12.1 3.2 0.2 -0.2 0.4 1.2 1.5 1.7 1.8 0.8 1.1 1.30.7 1.2 -1.6 -0.1 0.3 2.0 1.6 1.6 1.7 1.8 2.5 3.37.7 6.8 3.0 1.4 1.0 1.2 1.9 1.6 2.0 1.8 1.7 2.32.0 1.7 -0.2 0.6 0.9 1.3 1.5 1.7 1.9 1.4 1.5 1.74.4 5.4 1.8 1.8 0.8 1.3 3.3 3.1 3.2 2.8 3.0 3.03.3 3.9 1.4 2.4 2.1 3.4 3.9 3.9 4.0 3.8 3.8 3.93.5 6.0 2.3 3.1 6.1 3.1 3.0 3.0 3.1 2.7 2.5 2.9
3.8 0.4 -0.7 -0.7 0.3 2.5 2.2 2.5 1.6 1.3 1.61.0 -1.9 -0.6 0.7 1.7 3.5 3.3 2.6 3.2 2.6 3.0 3.2
-0.5 -0.1 -0.5 -0.6 0.2 1.1 0.9 1.0 0.8 0.7 0.4 0.20.3 3.7 0.0 2.1 2.1 2.9 0.7 -0.6 -0.9 1.0 -0.4 -0.85.0 5.3 4.4 2.9 2.9 4.5 5.4 5.0 5.3 4.7 4.2 4.52.3 -0.1 -4.1 -2.7 -2.5 -1.3 0.0 0.0 0.6 -0.4 0.1 0.3
1.6 -0.5 0.2 0.5 1.0 1.4 1.6 1.8 1.2 1.4 1.62.2 -0.6 -5.9 -2.1 -1.6 -1.2 -1.7 -1.7 -2.2 -1.8 -2.0 -2.70.0 -0.5 -3.6 -3.0 -1.2 -0.2 -0.3 -0.6 -0.3 -0.2 -0.2 -0.2
Slovenia
Malta
Spring 2017
USA
Latvia
Croatia
Estonia
Bulgaria
Netherlands
Japan
Sweden
France
Hungary
Winter 2017
Italy
Poland
Greece
Czech Republic
Slovakia
Austria
Euro area
Gross saving, general government (as a percentage of GDP, 1998-2018)
Finland
Portugal
Luxembourg
EU
averages
Cyprus
forecast
Romania
Spain
Denmark
Germany
Ireland
Belgium
forecast
United Kingdom
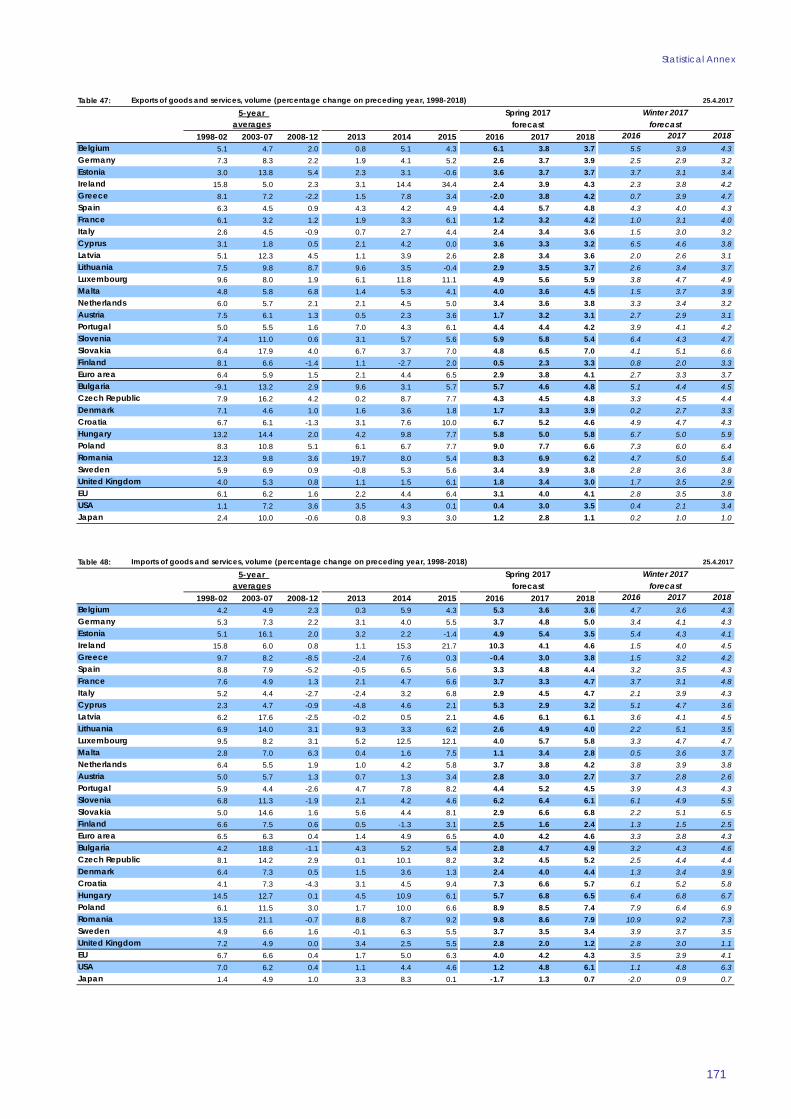
Statistical Annex
171
Table 47: 25.4.2017
5-year
1998-02 2003-07 2008-12 2013 2014 2015 2016 2017 2018 2016 2017 20185.1 4.7 2.0 0.8 5.1 4.3 6.1 3.8 3.7 5.5 3.9 4.37.3 8.3 2.2 1.9 4.1 5.2 2.6 3.7 3.9 2.5 2.9 3.23.0 13.8 5.4 2.3 3.1 -0.6 3.6 3.7 3.7 3.7 3.1 3.4
15.8 5.0 2.3 3.1 14.4 34.4 2.4 3.9 4.3 2.3 3.8 4.28.1 7.2 -2.2 1.5 7.8 3.4 -2.0 3.8 4.2 0.7 3.9 4.76.3 4.5 0.9 4.3 4.2 4.9 4.4 5.7 4.8 4.3 4.0 4.36.1 3.2 1.2 1.9 3.3 6.1 1.2 3.2 4.2 1.0 3.1 4.02.6 4.5 -0.9 0.7 2.7 4.4 2.4 3.4 3.6 1.5 3.0 3.23.1 1.8 0.5 2.1 4.2 0.0 3.6 3.3 3.2 6.5 4.6 3.85.1 12.3 4.5 1.1 3.9 2.6 2.8 3.4 3.6 2.0 2.6 3.1
Lithuania 7.5 9.8 8.7 9.6 3.5 -0.4 2.9 3.5 3.7 2.6 3.4 3.79.6 8.0 1.9 6.1 11.8 11.1 4.9 5.6 5.9 3.8 4.7 4.94.8 5.8 6.8 1.4 5.3 4.1 4.0 3.6 4.5 1.5 3.7 3.96.0 5.7 2.1 2.1 4.5 5.0 3.4 3.6 3.8 3.3 3.4 3.27.5 6.1 1.3 0.5 2.3 3.6 1.7 3.2 3.1 2.7 2.9 3.15.0 5.5 1.6 7.0 4.3 6.1 4.4 4.4 4.2 3.9 4.1 4.27.4 11.0 0.6 3.1 5.7 5.6 5.9 5.8 5.4 6.4 4.3 4.76.4 17.9 4.0 6.7 3.7 7.0 4.8 6.5 7.0 4.1 5.1 6.68.1 6.6 -1.4 1.1 -2.7 2.0 0.5 2.3 3.3 0.8 2.0 3.36.4 5.9 1.5 2.1 4.4 6.5 2.9 3.8 4.1 2.7 3.3 3.7
-9.1 13.2 2.9 9.6 3.1 5.7 5.7 4.6 4.8 5.1 4.4 4.57.9 16.2 4.2 0.2 8.7 7.7 4.3 4.5 4.8 3.3 4.5 4.47.1 4.6 1.0 1.6 3.6 1.8 1.7 3.3 3.9 0.2 2.7 3.36.7 6.1 -1.3 3.1 7.6 10.0 6.7 5.2 4.6 4.9 4.7 4.3
13.2 14.4 2.0 4.2 9.8 7.7 5.8 5.0 5.8 6.7 5.0 5.98.3 10.8 5.1 6.1 6.7 7.7 9.0 7.7 6.6 7.3 6.0 6.4
12.3 9.8 3.6 19.7 8.0 5.4 8.3 6.9 6.2 4.7 5.0 5.45.9 6.9 0.9 -0.8 5.3 5.6 3.4 3.9 3.8 2.8 3.6 3.84.0 5.3 0.8 1.1 1.5 6.1 1.8 3.4 3.0 1.7 3.5 2.96.1 6.2 1.6 2.2 4.4 6.4 3.1 4.0 4.1 2.8 3.5 3.81.1 7.2 3.6 3.5 4.3 0.1 0.4 3.0 3.5 0.4 2.1 3.42.4 10.0 -0.6 0.8 9.3 3.0 1.2 2.8 1.1 0.2 1.0 1.0
Slovenia
Malta
Spring 2017
USA
Latvia
Croatia
Estonia
Bulgaria
Netherlands
Japan
Sweden
France
Hungary
Winter 2017
Italy
Poland
Greece
Czech Republic
Slovakia
Austria
Euro area
Exports of goods and services, volume (percentage change on preceding year, 1998-2018)
Finland
Portugal
Luxembourg
EU
averages
Cyprus
forecast
Romania
Spain
Denmark
Germany
Ireland
Belgium
forecast
United Kingdom
Table 48: 25.4.2017
5-year
1998-02 2003-07 2008-12 2013 2014 2015 2016 2017 2018 2016 2017 20184.2 4.9 2.3 0.3 5.9 4.3 5.3 3.6 3.6 4.7 3.6 4.35.3 7.3 2.2 3.1 4.0 5.5 3.7 4.8 5.0 3.4 4.1 4.35.1 16.1 2.0 3.2 2.2 -1.4 4.9 5.4 3.5 5.4 4.3 4.1
15.8 6.0 0.8 1.1 15.3 21.7 10.3 4.1 4.6 1.5 4.0 4.59.7 8.2 -8.5 -2.4 7.6 0.3 -0.4 3.0 3.8 1.5 3.2 4.28.8 7.9 -5.2 -0.5 6.5 5.6 3.3 4.8 4.4 3.2 3.5 4.37.6 4.9 1.3 2.1 4.7 6.6 3.7 3.3 4.7 3.7 3.1 4.85.2 4.4 -2.7 -2.4 3.2 6.8 2.9 4.5 4.7 2.1 3.9 4.32.3 4.7 -0.9 -4.8 4.6 2.1 5.3 2.9 3.2 5.1 4.7 3.66.2 17.6 -2.5 -0.2 0.5 2.1 4.6 6.1 6.1 3.6 4.1 4.5
Lithuania 6.9 14.0 3.1 9.3 3.3 6.2 2.6 4.9 4.0 2.2 5.1 3.59.5 8.2 3.1 5.2 12.5 12.1 4.0 5.7 5.8 3.3 4.7 4.72.8 7.0 6.3 0.4 1.6 7.5 1.1 3.4 2.8 0.5 3.6 3.76.4 5.5 1.9 1.0 4.2 5.8 3.7 3.8 4.2 3.8 3.9 3.85.0 5.7 1.3 0.7 1.3 3.4 2.8 3.0 2.7 3.7 2.8 2.65.9 4.4 -2.6 4.7 7.8 8.2 4.4 5.2 4.5 3.9 4.3 4.36.8 11.3 -1.9 2.1 4.2 4.6 6.2 6.4 6.1 6.1 4.9 5.55.0 14.6 1.6 5.6 4.4 8.1 2.9 6.6 6.8 2.2 5.1 6.56.6 7.5 0.6 0.5 -1.3 3.1 2.5 1.6 2.4 1.3 1.5 2.56.5 6.3 0.4 1.4 4.9 6.5 4.0 4.2 4.6 3.3 3.8 4.34.2 18.8 -1.1 4.3 5.2 5.4 2.8 4.7 4.9 3.2 4.3 4.68.1 14.2 2.9 0.1 10.1 8.2 3.2 4.5 5.2 2.5 4.4 4.46.4 7.3 0.5 1.5 3.6 1.3 2.4 4.0 4.4 1.3 3.4 3.94.1 7.3 -4.3 3.1 4.5 9.4 7.3 6.6 5.7 6.1 5.2 5.8
14.5 12.7 0.1 4.5 10.9 6.1 5.7 6.8 6.5 6.4 6.8 6.76.1 11.5 3.0 1.7 10.0 6.6 8.9 8.5 7.4 7.9 6.4 6.9
13.5 21.1 -0.7 8.8 8.7 9.2 9.8 8.6 7.9 10.9 9.2 7.34.9 6.6 1.6 -0.1 6.3 5.5 3.7 3.5 3.4 3.9 3.7 3.57.2 4.9 0.0 3.4 2.5 5.5 2.8 2.0 1.2 2.8 3.0 1.16.7 6.6 0.4 1.7 5.0 6.3 4.0 4.2 4.3 3.5 3.9 4.17.0 6.2 0.4 1.1 4.4 4.6 1.2 4.8 6.1 1.1 4.8 6.31.4 4.9 1.0 3.3 8.3 0.1 -1.7 1.3 0.7 -2.0 0.9 0.7
Slovenia
Malta
Spring 2017
USA
Latvia
Croatia
Estonia
Bulgaria
Netherlands
Japan
Sweden
France
Hungary
Winter 2017
Italy
Poland
Greece
Czech Republic
Slovakia
Austria
Euro area
Imports of goods and services, volume (percentage change on preceding year, 1998-2018)
Finland
Portugal
Luxembourg
EU
averages
Cyprus
forecast
Romania
Spain
Denmark
Germany
Ireland
Belgium
forecast
United Kingdom
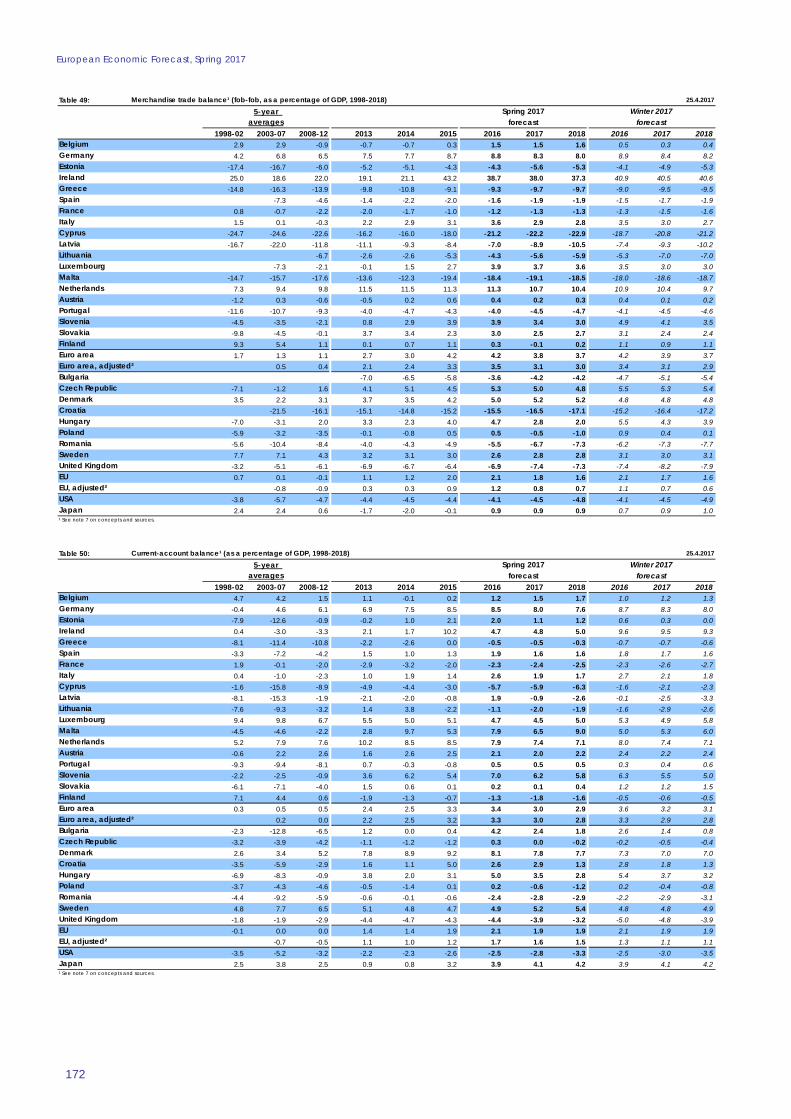
European Economic Forecast, Spring 2017
172
Table 49: 25.4.2017
5-year
1998-02 2003-07 2008-12 2013 2014 2015 2016 2017 2018 2016 2017 20182.9 2.9 -0.9 -0.7 -0.7 0.3 1.5 1.5 1.6 0.5 0.3 0.44.2 6.8 6.5 7.5 7.7 8.7 8.8 8.3 8.0 8.9 8.4 8.2
-17.4 -16.7 -6.0 -5.2 -5.1 -4.3 -4.3 -5.6 -5.3 -4.1 -4.9 -5.325.0 18.6 22.0 19.1 21.1 43.2 38.7 38.0 37.3 40.9 40.5 40.6
-14.8 -16.3 -13.9 -9.8 -10.8 -9.1 -9.3 -9.7 -9.7 -9.0 -9.5 -9.5-7.3 -4.6 -1.4 -2.2 -2.0 -1.6 -1.9 -1.9 -1.5 -1.7 -1.9
0.8 -0.7 -2.2 -2.0 -1.7 -1.0 -1.2 -1.3 -1.3 -1.3 -1.5 -1.61.5 0.1 -0.3 2.2 2.9 3.1 3.6 2.9 2.8 3.5 3.0 2.7
-24.7 -24.6 -22.6 -16.2 -16.0 -18.0 -21.2 -22.2 -22.9 -18.7 -20.8 -21.2-16.7 -22.0 -11.8 -11.1 -9.3 -8.4 -7.0 -8.9 -10.5 -7.4 -9.3 -10.2
Lithuania -6.7 -2.6 -2.6 -5.3 -4.3 -5.6 -5.9 -5.3 -7.0 -7.0-7.3 -2.1 -0.1 1.5 2.7 3.9 3.7 3.6 3.5 3.0 3.0
-14.7 -15.7 -17.6 -13.6 -12.3 -19.4 -18.4 -19.1 -18.5 -18.0 -18.6 -18.77.3 9.4 9.8 11.5 11.5 11.3 11.3 10.7 10.4 10.9 10.4 9.7
-1.2 0.3 -0.6 -0.5 0.2 0.6 0.4 0.2 0.3 0.4 0.1 0.2-11.6 -10.7 -9.3 -4.0 -4.7 -4.3 -4.0 -4.5 -4.7 -4.1 -4.5 -4.6
-4.5 -3.5 -2.1 0.8 2.9 3.9 3.9 3.4 3.0 4.9 4.1 3.5-9.8 -4.5 -0.1 3.7 3.4 2.3 3.0 2.5 2.7 3.1 2.4 2.49.3 5.4 1.1 0.1 0.7 1.1 0.3 -0.1 0.2 1.1 0.9 1.11.7 1.3 1.1 2.7 3.0 4.2 4.2 3.8 3.7 4.2 3.9 3.7
0.5 0.4 2.1 2.4 3.3 3.5 3.1 3.0 3.4 3.1 2.9-7.0 -6.5 -5.8 -3.6 -4.2 -4.2 -4.7 -5.1 -5.4
-7.1 -1.2 1.6 4.1 5.1 4.5 5.3 5.0 4.8 5.5 5.3 5.43.5 2.2 3.1 3.7 3.5 4.2 5.0 5.2 5.2 4.8 4.8 4.8
-21.5 -16.1 -15.1 -14.8 -15.2 -15.5 -16.5 -17.1 -15.2 -16.4 -17.2-7.0 -3.1 2.0 3.3 2.3 4.0 4.7 2.8 2.0 5.5 4.3 3.9-5.9 -3.2 -3.5 -0.1 -0.8 0.5 0.5 -0.5 -1.0 0.9 0.4 0.1-5.6 -10.4 -8.4 -4.0 -4.3 -4.9 -5.5 -6.7 -7.3 -6.2 -7.3 -7.77.7 7.1 4.3 3.2 3.1 3.0 2.6 2.8 2.8 3.1 3.0 3.1
-3.2 -5.1 -6.1 -6.9 -6.7 -6.4 -6.9 -7.4 -7.3 -7.4 -8.2 -7.90.7 0.1 -0.1 1.1 1.2 2.0 2.1 1.8 1.6 2.1 1.7 1.6
-0.8 -0.9 0.3 0.3 0.9 1.2 0.8 0.7 1.1 0.7 0.6-3.8 -5.7 -4.7 -4.4 -4.5 -4.4 -4.1 -4.5 -4.8 -4.1 -4.5 -4.92.4 2.4 0.6 -1.7 -2.0 -0.1 0.9 0.9 0.9 0.7 0.9 1.0
Slovenia
Japan
Malta
Spring 2017
EU
Latvia
Denmark
Estonia
Euro area, adjusted²
forecast
Austria
Sweden
Italy
Hungary
GreeceIreland
Bulgaria
Slovakia
Belgium
¹ See note 7 on concepts and sources.
Netherlands
EU, adjusted²
Romania
France
Merchandise trade balance¹ (fob-fob, as a percentage of GDP, 1998-2018)
Finland
Portugal
USA
Luxembourg
United Kingdom
averages
Cyprus
forecast
Poland
Spain
Czech Republic
Germany
Winter 2017
Croatia
Euro area
Table 50: 25.4.2017
5-year
1998-02 2003-07 2008-12 2013 2014 2015 2016 2017 2018 2016 2017 20184.7 4.2 1.5 1.1 -0.1 0.2 1.2 1.5 1.7 1.0 1.2 1.3
-0.4 4.6 6.1 6.9 7.5 8.5 8.5 8.0 7.6 8.7 8.3 8.0-7.9 -12.6 -0.9 -0.2 1.0 2.1 2.0 1.1 1.2 0.6 0.3 0.00.4 -3.0 -3.3 2.1 1.7 10.2 4.7 4.8 5.0 9.6 9.5 9.3
-8.1 -11.4 -10.8 -2.2 -2.6 0.0 -0.5 -0.5 -0.3 -0.7 -0.7 -0.6-3.3 -7.2 -4.2 1.5 1.0 1.3 1.9 1.6 1.6 1.8 1.7 1.61.9 -0.1 -2.0 -2.9 -3.2 -2.0 -2.3 -2.4 -2.5 -2.3 -2.6 -2.70.4 -1.0 -2.3 1.0 1.9 1.4 2.6 1.9 1.7 2.7 2.1 1.8
-1.6 -15.8 -8.9 -4.9 -4.4 -3.0 -5.7 -5.9 -6.3 -1.6 -2.1 -2.3-8.1 -15.3 -1.9 -2.1 -2.0 -0.8 1.9 -0.9 -2.6 -0.1 -2.5 -3.3
Lithuania -7.6 -9.3 -3.2 1.4 3.8 -2.2 -1.1 -2.0 -1.9 -1.6 -2.9 -2.69.4 9.8 6.7 5.5 5.0 5.1 4.7 4.5 5.0 5.3 4.9 5.8
-4.5 -4.6 -2.2 2.8 9.7 5.3 7.9 6.5 9.0 5.0 5.3 6.05.2 7.9 7.6 10.2 8.5 8.5 7.9 7.4 7.1 8.0 7.4 7.1
-0.6 2.2 2.6 1.6 2.6 2.5 2.1 2.0 2.2 2.4 2.2 2.4-9.3 -9.4 -8.1 0.7 -0.3 -0.8 0.5 0.5 0.5 0.3 0.4 0.6-2.2 -2.5 -0.9 3.6 6.2 5.4 7.0 6.2 5.8 6.3 5.5 5.0-6.1 -7.1 -4.0 1.5 0.6 0.1 0.2 0.1 0.4 1.2 1.2 1.57.1 4.4 0.6 -1.9 -1.3 -0.7 -1.3 -1.8 -1.6 -0.5 -0.6 -0.50.3 0.5 0.5 2.4 2.5 3.3 3.4 3.0 2.9 3.6 3.2 3.1
0.2 0.0 2.2 2.5 3.2 3.3 3.0 2.8 3.3 2.9 2.8-2.3 -12.8 -6.5 1.2 0.0 0.4 4.2 2.4 1.8 2.6 1.4 0.8-3.2 -3.9 -4.2 -1.1 -1.2 -1.2 0.3 0.0 -0.2 -0.2 -0.5 -0.42.6 3.4 5.2 7.8 8.9 9.2 8.1 7.8 7.7 7.3 7.0 7.0
-3.5 -5.9 -2.9 1.6 1.1 5.0 2.6 2.9 1.3 2.8 1.8 1.3-6.9 -8.3 -0.9 3.8 2.0 3.1 5.0 3.5 2.8 5.4 3.7 3.2-3.7 -4.3 -4.6 -0.5 -1.4 0.1 0.2 -0.6 -1.2 0.2 -0.4 -0.8-4.4 -9.2 -5.9 -0.6 -0.1 -0.6 -2.4 -2.8 -2.9 -2.2 -2.9 -3.14.8 7.7 6.5 5.1 4.8 4.7 4.9 5.2 5.4 4.8 4.8 4.9
-1.8 -1.9 -2.9 -4.4 -4.7 -4.3 -4.4 -3.9 -3.2 -5.0 -4.8 -3.9-0.1 0.0 0.0 1.4 1.4 1.9 2.1 1.9 1.9 2.1 1.9 1.9
-0.7 -0.5 1.1 1.0 1.2 1.7 1.6 1.5 1.3 1.1 1.1-3.5 -5.2 -3.2 -2.2 -2.3 -2.6 -2.5 -2.8 -3.3 -2.5 -3.0 -3.52.5 3.8 2.5 0.9 0.8 3.2 3.9 4.1 4.2 3.9 4.1 4.2
Slovenia
Japan
Malta
Spring 2017
EU
Latvia
Denmark
Estonia
Euro area, adjusted²
forecast
Austria
Sweden
Italy
Hungary
GreeceIreland
Bulgaria
Slovakia
Belgium
¹ See note 7 on concepts and sources.
Netherlands
EU, adjusted²
Romania
France
Current-account balance¹ (as a percentage of GDP, 1998-2018)
Finland
Portugal
USA
Luxembourg
United Kingdom
averages
Cyprus
forecast
Poland
Spain
Czech Republic
Germany
Winter 2017
Croatia
Euro area
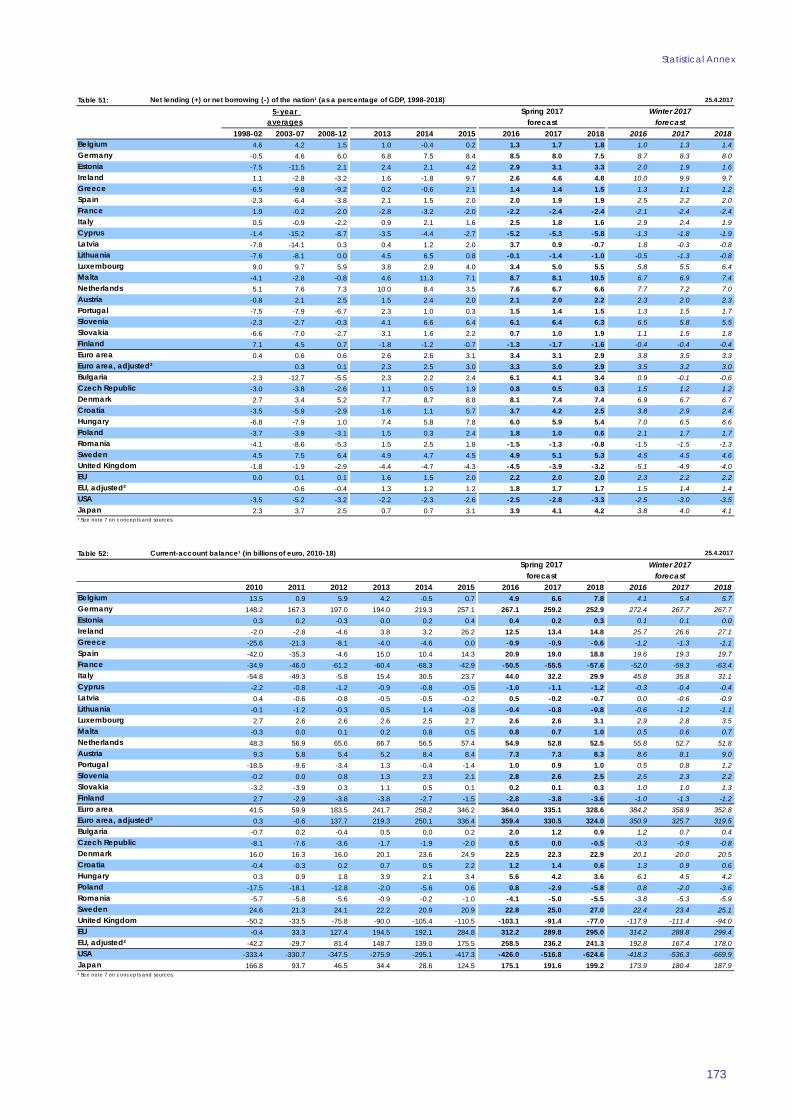
Statistical Annex
173
Table 51: 25.4.2017
5-year
1998-02 2003-07 2008-12 2013 2014 2015 2016 2017 2018 2016 2017 20184.6 4.2 1.5 1.0 -0.4 0.2 1.3 1.7 1.8 1.0 1.3 1.4
-0.5 4.6 6.0 6.8 7.5 8.4 8.5 8.0 7.5 8.7 8.3 8.0-7.5 -11.5 2.1 2.4 2.1 4.2 2.9 3.1 3.3 2.0 1.9 1.61.1 -2.8 -3.2 1.6 -1.8 9.7 2.6 4.6 4.8 10.0 9.9 9.7
-6.5 -9.8 -9.2 0.2 -0.6 2.1 1.4 1.4 1.5 1.3 1.1 1.2-2.3 -6.4 -3.8 2.1 1.5 2.0 2.0 1.9 1.9 2.5 2.2 2.01.9 -0.2 -2.0 -2.8 -3.2 -2.0 -2.2 -2.4 -2.4 -2.1 -2.4 -2.40.5 -0.9 -2.2 0.9 2.1 1.6 2.5 1.8 1.6 2.9 2.4 1.9
-1.4 -15.2 -8.7 -3.5 -4.4 -2.7 -5.2 -5.3 -5.8 -1.3 -1.8 -1.9-7.8 -14.1 0.3 0.4 1.2 2.0 3.7 0.9 -0.7 1.8 -0.3 -0.8
Lithuania -7.6 -8.1 0.0 4.5 6.5 0.8 -0.1 -1.4 -1.0 -0.5 -1.3 -0.89.0 9.7 5.9 3.8 2.9 4.0 3.4 5.0 5.5 5.8 5.5 6.4
-4.1 -2.8 -0.8 4.6 11.3 7.1 8.7 8.1 10.5 6.7 6.9 7.45.1 7.6 7.3 10.0 8.4 3.5 7.6 6.7 6.6 7.7 7.2 7.0
-0.8 2.1 2.5 1.5 2.4 2.0 2.1 2.0 2.2 2.3 2.0 2.3-7.5 -7.9 -6.7 2.3 1.0 0.3 1.5 1.4 1.5 1.3 1.5 1.7-2.3 -2.7 -0.3 4.1 6.6 6.4 6.1 6.4 6.3 6.5 5.8 5.5-6.6 -7.0 -2.7 3.1 1.6 2.2 0.7 1.0 1.9 1.1 1.5 1.87.1 4.5 0.7 -1.8 -1.2 -0.7 -1.3 -1.7 -1.6 -0.4 -0.4 -0.40.4 0.6 0.6 2.6 2.6 3.1 3.4 3.1 2.9 3.8 3.5 3.3
0.3 0.1 2.3 2.5 3.0 3.3 3.0 2.9 3.5 3.2 3.0-2.3 -12.7 -5.5 2.3 2.2 2.4 6.1 4.1 3.4 0.9 -0.1 -0.6-3.0 -3.8 -2.6 1.1 0.5 1.9 0.8 0.5 0.3 1.5 1.2 1.22.7 3.4 5.2 7.7 8.7 8.8 8.1 7.4 7.4 6.9 6.7 6.7
-3.5 -5.9 -2.9 1.6 1.1 5.7 3.7 4.2 2.5 3.8 2.9 2.4-6.8 -7.9 1.0 7.4 5.8 7.8 6.0 5.9 5.4 7.0 6.5 6.6-3.7 -3.9 -3.1 1.5 0.3 2.4 1.8 1.0 0.6 2.1 1.7 1.7-4.1 -8.6 -5.3 1.5 2.5 1.8 -1.5 -1.3 -0.8 -1.5 -1.5 -1.34.5 7.5 6.4 4.9 4.7 4.5 4.9 5.1 5.3 4.5 4.5 4.6
-1.8 -1.9 -2.9 -4.4 -4.7 -4.3 -4.5 -3.9 -3.2 -5.1 -4.9 -4.00.0 0.1 0.1 1.6 1.5 2.0 2.2 2.0 2.0 2.3 2.2 2.2
-0.6 -0.4 1.3 1.2 1.2 1.8 1.7 1.7 1.5 1.4 1.4-3.5 -5.2 -3.2 -2.2 -2.3 -2.6 -2.5 -2.8 -3.3 -2.5 -3.0 -3.52.3 3.7 2.5 0.7 0.7 3.1 3.9 4.1 4.2 3.8 4.0 4.1
Slovenia
Japan
Malta
Spring 2017
EU
Latvia
Denmark
Estonia
Euro area, adjusted²
forecast
Austria
Sweden
Italy
Hungary
GreeceIreland
Bulgaria
Slovakia
Belgium
¹ See note 7 on concepts and sources.
Netherlands
EU, adjusted²
Romania
France
Net lending (+) or net borrowing (-) of the nation¹ (as a percentage of GDP, 1998-2018)
Finland
Portugal
USA
Luxembourg
United Kingdom
averages
Cyprus
forecast
Poland
Spain
Czech Republic
Germany
Winter 2017
Croatia
Euro area
Table 52:
2010 2011 2012 2013 2014 2015 2016 2017 2018 2016 2017 201813.5 0.9 5.9 4.2 -0.5 0.7 4.9 6.6 7.8 4.1 5.4 5.7
148.2 167.3 197.0 194.0 219.3 257.1 267.1 259.2 252.9 272.4 267.7 267.70.3 0.2 -0.3 0.0 0.2 0.4 0.4 0.2 0.3 0.1 0.1 0.0
-2.0 -2.8 -4.6 3.8 3.2 26.2 12.5 13.4 14.8 25.7 26.6 27.1-25.6 -21.3 -8.1 -4.0 -4.6 0.0 -0.9 -0.9 -0.6 -1.2 -1.3 -1.1-42.0 -35.3 -4.6 15.0 10.4 14.3 20.9 19.0 18.8 19.6 19.3 19.7-34.9 -46.0 -61.2 -60.4 -68.3 -42.9 -50.5 -55.5 -57.6 -52.0 -59.3 -63.4-54.8 -49.3 -5.8 15.4 30.5 23.7 44.0 32.2 29.9 45.8 35.8 31.1
-2.2 -0.8 -1.2 -0.9 -0.8 -0.5 -1.0 -1.1 -1.2 -0.3 -0.4 -0.40.4 -0.6 -0.8 -0.5 -0.5 -0.2 0.5 -0.2 -0.7 0.0 -0.6 -0.9
Lithuania -0.1 -1.2 -0.3 0.5 1.4 -0.8 -0.4 -0.8 -0.8 -0.6 -1.2 -1.12.7 2.6 2.6 2.6 2.5 2.7 2.6 2.6 3.1 2.9 2.8 3.5
-0.3 0.0 0.1 0.2 0.8 0.5 0.8 0.7 1.0 0.5 0.6 0.748.3 56.9 65.6 66.7 56.5 57.4 54.9 52.8 52.5 55.8 52.7 51.8
9.3 5.8 5.4 5.2 8.4 8.4 7.3 7.3 8.3 8.6 8.1 9.0-18.5 -9.6 -3.4 1.3 -0.4 -1.4 1.0 0.9 1.0 0.5 0.8 1.2
-0.2 0.0 0.8 1.3 2.3 2.1 2.8 2.6 2.5 2.5 2.3 2.2-3.2 -3.9 0.3 1.1 0.5 0.1 0.2 0.1 0.3 1.0 1.0 1.32.7 -2.9 -3.8 -3.8 -2.7 -1.5 -2.8 -3.8 -3.6 -1.0 -1.3 -1.2
41.5 59.9 183.5 241.7 258.2 346.2 364.0 335.1 328.6 384.2 358.9 352.80.3 -0.6 137.7 219.3 250.1 336.4 359.4 330.5 324.0 350.9 325.7 319.5
-0.7 0.2 -0.4 0.5 0.0 0.2 2.0 1.2 0.9 1.2 0.7 0.4-8.1 -7.6 -3.6 -1.7 -1.9 -2.0 0.5 0.0 -0.5 -0.3 -0.9 -0.816.0 16.3 16.0 20.1 23.6 24.9 22.5 22.3 22.9 20.1 20.0 20.5-0.4 -0.3 0.2 0.7 0.5 2.2 1.2 1.4 0.6 1.3 0.9 0.60.3 0.9 1.8 3.9 2.1 3.4 5.6 4.2 3.6 6.1 4.5 4.2
-17.5 -18.1 -12.8 -2.0 -5.6 0.6 0.8 -2.9 -5.8 0.8 -2.0 -3.6-5.7 -5.8 -5.6 -0.9 -0.2 -1.0 -4.1 -5.0 -5.5 -3.8 -5.3 -5.924.6 21.3 24.1 22.2 20.9 20.9 22.8 25.0 27.0 22.4 23.4 25.1
-50.2 -33.5 -75.8 -90.0 -105.4 -110.5 -103.1 -91.4 -77.0 -117.9 -111.4 -94.0-0.4 33.3 127.4 194.5 192.1 284.8 312.2 289.8 295.0 314.2 288.8 299.4
-42.2 -29.7 81.4 148.7 139.0 175.5 258.5 236.2 241.3 192.8 167.4 178.0-333.4 -330.7 -347.5 -275.9 -295.1 -417.3 -426.0 -516.8 -624.6 -418.3 -536.3 -669.9166.8 93.7 46.5 34.4 28.6 124.5 175.1 191.6 199.2 173.9 180.4 187.9Japan
Slovenia
Malta
EUEU, adjusted²
Estonia
Euro area, adjusted²
forecast
Netherlands
Euro area
25.4.2017
Spring 2017
Belgium
Austria
¹ See note 7 on concepts and sources.
Sweden
Italy
Hungary
Greece
Finland
Portugal
USA
Luxembourg
Current-account balance¹ (in billions of euro, 2010-18)
Romania
France
Winter 2017
United Kingdom
Cyprus
Poland
Spain
Czech Republic
forecast
Germany
Croatia
Ireland
Bulgaria
Slovakia
Latvia
Denmark
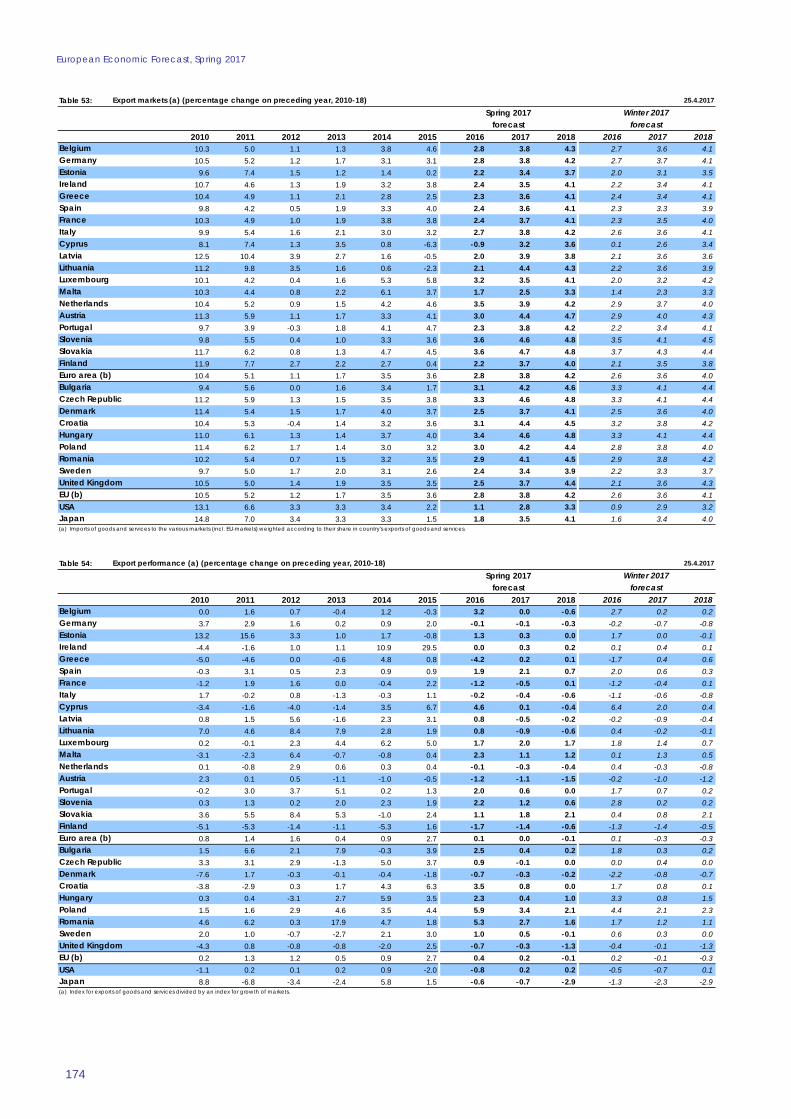
European Economic Forecast, Spring 2017
174
Table 53:
2010 2011 2012 2013 2014 2015 2016 2017 2018 2016 2017 201810.3 5.0 1.1 1.3 3.8 4.6 2.8 3.8 4.3 2.7 3.6 4.110.5 5.2 1.2 1.7 3.1 3.1 2.8 3.8 4.2 2.7 3.7 4.1
9.6 7.4 1.5 1.2 1.4 0.2 2.2 3.4 3.7 2.0 3.1 3.510.7 4.6 1.3 1.9 3.2 3.8 2.4 3.5 4.1 2.2 3.4 4.110.4 4.9 1.1 2.1 2.8 2.5 2.3 3.6 4.1 2.4 3.4 4.1
9.8 4.2 0.5 1.9 3.3 4.0 2.4 3.6 4.1 2.3 3.3 3.910.3 4.9 1.0 1.9 3.8 3.8 2.4 3.7 4.1 2.3 3.5 4.0
9.9 5.4 1.6 2.1 3.0 3.2 2.7 3.8 4.2 2.6 3.6 4.18.1 7.4 1.3 3.5 0.8 -6.3 -0.9 3.2 3.6 0.1 2.6 3.4
12.5 10.4 3.9 2.7 1.6 -0.5 2.0 3.9 3.8 2.1 3.6 3.6Lithuania 11.2 9.8 3.5 1.6 0.6 -2.3 2.1 4.4 4.3 2.2 3.6 3.9
10.1 4.2 0.4 1.6 5.3 5.8 3.2 3.5 4.1 2.0 3.2 4.210.3 4.4 0.8 2.2 6.1 3.7 1.7 2.5 3.3 1.4 2.3 3.310.4 5.2 0.9 1.5 4.2 4.6 3.5 3.9 4.2 2.9 3.7 4.011.3 5.9 1.1 1.7 3.3 4.1 3.0 4.4 4.7 2.9 4.0 4.3
9.7 3.9 -0.3 1.8 4.1 4.7 2.3 3.8 4.2 2.2 3.4 4.19.8 5.5 0.4 1.0 3.3 3.6 3.6 4.6 4.8 3.5 4.1 4.5
11.7 6.2 0.8 1.3 4.7 4.5 3.6 4.7 4.8 3.7 4.3 4.411.9 7.7 2.7 2.2 2.7 0.4 2.2 3.7 4.0 2.1 3.5 3.810.4 5.1 1.1 1.7 3.5 3.6 2.8 3.8 4.2 2.6 3.6 4.0
9.4 5.6 0.0 1.6 3.4 1.7 3.1 4.2 4.6 3.3 4.1 4.411.2 5.9 1.3 1.5 3.5 3.8 3.3 4.6 4.8 3.3 4.1 4.411.4 5.4 1.5 1.7 4.0 3.7 2.5 3.7 4.1 2.5 3.6 4.010.4 5.3 -0.4 1.4 3.2 3.6 3.1 4.4 4.5 3.2 3.8 4.211.0 6.1 1.3 1.4 3.7 4.0 3.4 4.6 4.8 3.3 4.1 4.411.4 6.2 1.7 1.4 3.0 3.2 3.0 4.2 4.4 2.8 3.8 4.010.2 5.4 0.7 1.5 3.2 3.5 2.9 4.1 4.5 2.9 3.8 4.2
9.7 5.0 1.7 2.0 3.1 2.6 2.4 3.4 3.9 2.2 3.3 3.710.5 5.0 1.4 1.9 3.5 3.5 2.5 3.7 4.4 2.1 3.6 4.310.5 5.2 1.2 1.7 3.5 3.6 2.8 3.8 4.2 2.6 3.6 4.113.1 6.6 3.3 3.3 3.4 2.2 1.1 2.8 3.3 0.9 2.9 3.214.8 7.0 3.4 3.3 3.3 1.5 1.8 3.5 4.1 1.6 3.4 4.0Japan
Sweden
France
Hungary
Czech Republic
Slovakia
EU (b)
(a) Imports of goods and services to the various markets (incl. EU-markets) weighted according to their share in country's exports of goods and services.
Denmark
Euro area (b)
Slovenia
Malta
USA
Latvia
Croatia
25.4.2017
United Kingdom
Italy
Poland
Export markets (a) (percentage change on preceding year, 2010-18)
Greece
Finland
Portugal
Luxembourg
Winter 2017
Cyprus
Romania
Estonia
Bulgaria
forecastforecast
Germany
Spring 2017
Belgium
AustriaNetherlands
Ireland
Spain
Table 54:
2010 2011 2012 2013 2014 2015 2016 2017 2018 2016 2017 20180.0 1.6 0.7 -0.4 1.2 -0.3 3.2 0.0 -0.6 2.7 0.2 0.23.7 2.9 1.6 0.2 0.9 2.0 -0.1 -0.1 -0.3 -0.2 -0.7 -0.8
13.2 15.6 3.3 1.0 1.7 -0.8 1.3 0.3 0.0 1.7 0.0 -0.1-4.4 -1.6 1.0 1.1 10.9 29.5 0.0 0.3 0.2 0.1 0.4 0.1-5.0 -4.6 0.0 -0.6 4.8 0.8 -4.2 0.2 0.1 -1.7 0.4 0.6-0.3 3.1 0.5 2.3 0.9 0.9 1.9 2.1 0.7 2.0 0.6 0.3-1.2 1.9 1.6 0.0 -0.4 2.2 -1.2 -0.5 0.1 -1.2 -0.4 0.11.7 -0.2 0.8 -1.3 -0.3 1.1 -0.2 -0.4 -0.6 -1.1 -0.6 -0.8
-3.4 -1.6 -4.0 -1.4 3.5 6.7 4.6 0.1 -0.4 6.4 2.0 0.40.8 1.5 5.6 -1.6 2.3 3.1 0.8 -0.5 -0.2 -0.2 -0.9 -0.4
Lithuania 7.0 4.6 8.4 7.9 2.8 1.9 0.8 -0.9 -0.6 0.4 -0.2 -0.10.2 -0.1 2.3 4.4 6.2 5.0 1.7 2.0 1.7 1.8 1.4 0.7
-3.1 -2.3 6.4 -0.7 -0.8 0.4 2.3 1.1 1.2 0.1 1.3 0.50.1 -0.8 2.9 0.6 0.3 0.4 -0.1 -0.3 -0.4 0.4 -0.3 -0.82.3 0.1 0.5 -1.1 -1.0 -0.5 -1.2 -1.1 -1.5 -0.2 -1.0 -1.2
-0.2 3.0 3.7 5.1 0.2 1.3 2.0 0.6 0.0 1.7 0.7 0.20.3 1.3 0.2 2.0 2.3 1.9 2.2 1.2 0.6 2.8 0.2 0.23.6 5.5 8.4 5.3 -1.0 2.4 1.1 1.8 2.1 0.4 0.8 2.1
-5.1 -5.3 -1.4 -1.1 -5.3 1.6 -1.7 -1.4 -0.6 -1.3 -1.4 -0.50.8 1.4 1.6 0.4 0.9 2.7 0.1 0.0 -0.1 0.1 -0.3 -0.31.5 6.6 2.1 7.9 -0.3 3.9 2.5 0.4 0.2 1.8 0.3 0.23.3 3.1 2.9 -1.3 5.0 3.7 0.9 -0.1 0.0 0.0 0.4 0.0
-7.6 1.7 -0.3 -0.1 -0.4 -1.8 -0.7 -0.3 -0.2 -2.2 -0.8 -0.7-3.8 -2.9 0.3 1.7 4.3 6.3 3.5 0.8 0.0 1.7 0.8 0.10.3 0.4 -3.1 2.7 5.9 3.5 2.3 0.4 1.0 3.3 0.8 1.51.5 1.6 2.9 4.6 3.5 4.4 5.9 3.4 2.1 4.4 2.1 2.34.6 6.2 0.3 17.9 4.7 1.8 5.3 2.7 1.6 1.7 1.2 1.12.0 1.0 -0.7 -2.7 2.1 3.0 1.0 0.5 -0.1 0.6 0.3 0.0
-4.3 0.8 -0.8 -0.8 -2.0 2.5 -0.7 -0.3 -1.3 -0.4 -0.1 -1.30.2 1.3 1.2 0.5 0.9 2.7 0.4 0.2 -0.1 0.2 -0.1 -0.3
-1.1 0.2 0.1 0.2 0.9 -2.0 -0.8 0.2 0.2 -0.5 -0.7 0.18.8 -6.8 -3.4 -2.4 5.8 1.5 -0.6 -0.7 -2.9 -1.3 -2.3 -2.9Japan
Sweden
France
Hungary
Czech Republic
Slovakia
EU (b)
(a) Index for exports of goods and services divided by an index for growth of markets.
Denmark
Euro area (b)
Slovenia
Malta
USA
Latvia
Croatia
25.4.2017
United Kingdom
Italy
Poland
Export performance (a) (percentage change on preceding year, 2010-18)
Greece
Finland
Portugal
Luxembourg
Winter 2017
Cyprus
Romania
Estonia
Bulgaria
forecastforecast
Germany
Spring 2017
Belgium
AustriaNetherlands
Ireland
Spain
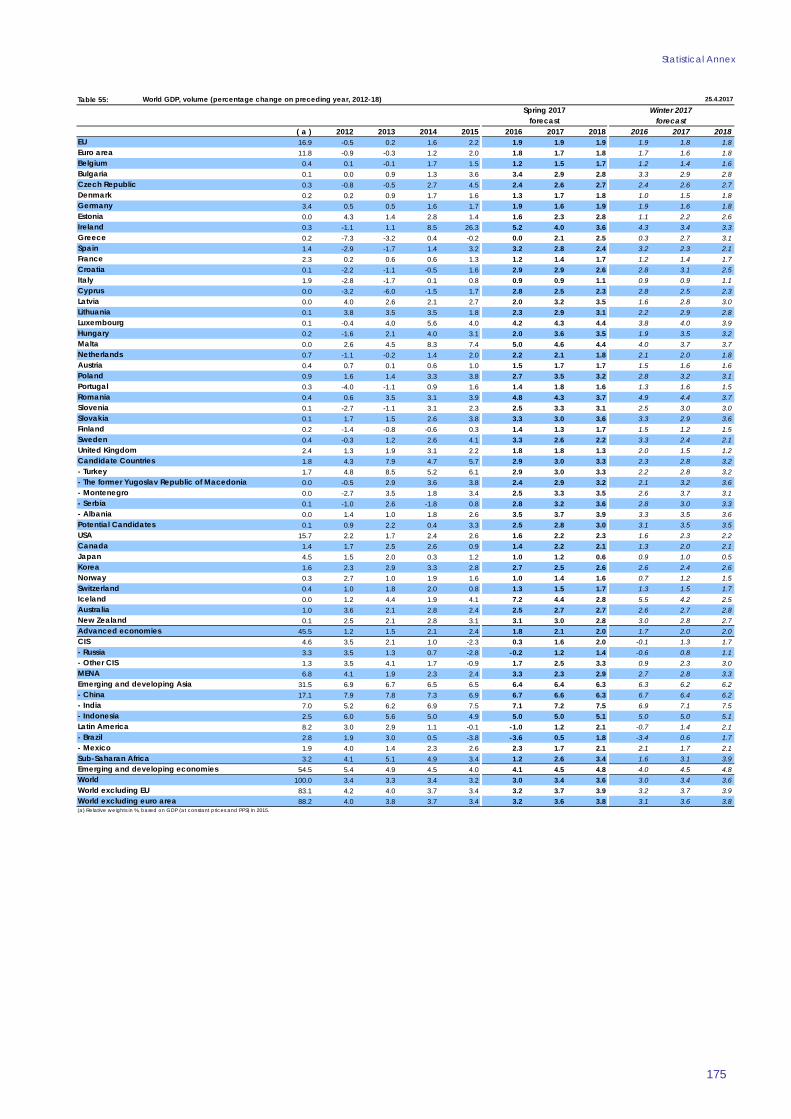
Statistical Annex
175
Table 55:
( a ) 2012 2013 2014 2015 2016 2017 2018 2016 2017 201816.9 -0.5 0.2 1.6 2.2 1.9 1.9 1.9 1.9 1.8 1.811.8 -0.9 -0.3 1.2 2.0 1.8 1.7 1.8 1.7 1.6 1.8
0.4 0.1 -0.1 1.7 1.5 1.2 1.5 1.7 1.2 1.4 1.60.1 0.0 0.9 1.3 3.6 3.4 2.9 2.8 3.3 2.9 2.80.3 -0.8 -0.5 2.7 4.5 2.4 2.6 2.7 2.4 2.6 2.70.2 0.2 0.9 1.7 1.6 1.3 1.7 1.8 1.0 1.5 1.83.4 0.5 0.5 1.6 1.7 1.9 1.6 1.9 1.9 1.6 1.80.0 4.3 1.4 2.8 1.4 1.6 2.3 2.8 1.1 2.2 2.60.3 -1.1 1.1 8.5 26.3 5.2 4.0 3.6 4.3 3.4 3.30.2 -7.3 -3.2 0.4 -0.2 0.0 2.1 2.5 0.3 2.7 3.11.4 -2.9 -1.7 1.4 3.2 3.2 2.8 2.4 3.2 2.3 2.12.3 0.2 0.6 0.6 1.3 1.2 1.4 1.7 1.2 1.4 1.70.1 -2.2 -1.1 -0.5 1.6 2.9 2.9 2.6 2.8 3.1 2.51.9 -2.8 -1.7 0.1 0.8 0.9 0.9 1.1 0.9 0.9 1.10.0 -3.2 -6.0 -1.5 1.7 2.8 2.5 2.3 2.8 2.5 2.30.0 4.0 2.6 2.1 2.7 2.0 3.2 3.5 1.6 2.8 3.00.1 3.8 3.5 3.5 1.8 2.3 2.9 3.1 2.2 2.9 2.80.1 -0.4 4.0 5.6 4.0 4.2 4.3 4.4 3.8 4.0 3.90.2 -1.6 2.1 4.0 3.1 2.0 3.6 3.5 1.9 3.5 3.20.0 2.6 4.5 8.3 7.4 5.0 4.6 4.4 4.0 3.7 3.70.7 -1.1 -0.2 1.4 2.0 2.2 2.1 1.8 2.1 2.0 1.80.4 0.7 0.1 0.6 1.0 1.5 1.7 1.7 1.5 1.6 1.60.9 1.6 1.4 3.3 3.8 2.7 3.5 3.2 2.8 3.2 3.10.3 -4.0 -1.1 0.9 1.6 1.4 1.8 1.6 1.3 1.6 1.50.4 0.6 3.5 3.1 3.9 4.8 4.3 3.7 4.9 4.4 3.70.1 -2.7 -1.1 3.1 2.3 2.5 3.3 3.1 2.5 3.0 3.00.1 1.7 1.5 2.6 3.8 3.3 3.0 3.6 3.3 2.9 3.60.2 -1.4 -0.8 -0.6 0.3 1.4 1.3 1.7 1.5 1.2 1.50.4 -0.3 1.2 2.6 4.1 3.3 2.6 2.2 3.3 2.4 2.12.4 1.3 1.9 3.1 2.2 1.8 1.8 1.3 2.0 1.5 1.21.8 4.3 7.9 4.7 5.7 2.9 3.0 3.3 2.3 2.8 3.21.7 4.8 8.5 5.2 6.1 2.9 3.0 3.3 2.2 2.8 3.20.0 -0.5 2.9 3.6 3.8 2.4 2.9 3.2 2.1 3.2 3.60.0 -2.7 3.5 1.8 3.4 2.5 3.3 3.5 2.6 3.7 3.10.1 -1.0 2.6 -1.8 0.8 2.8 3.2 3.6 2.8 3.0 3.30.0 1.4 1.0 1.8 2.6 3.5 3.7 3.9 3.3 3.5 3.60.1 0.9 2.2 0.4 3.3 2.5 2.8 3.0 3.1 3.5 3.5
15.7 2.2 1.7 2.4 2.6 1.6 2.2 2.3 1.6 2.3 2.21.4 1.7 2.5 2.6 0.9 1.4 2.2 2.1 1.3 2.0 2.14.5 1.5 2.0 0.3 1.2 1.0 1.2 0.6 0.9 1.0 0.51.6 2.3 2.9 3.3 2.8 2.7 2.5 2.6 2.6 2.4 2.60.3 2.7 1.0 1.9 1.6 1.0 1.4 1.6 0.7 1.2 1.50.4 1.0 1.8 2.0 0.8 1.3 1.5 1.7 1.3 1.5 1.70.0 1.2 4.4 1.9 4.1 7.2 4.4 2.8 5.5 4.2 2.51.0 3.6 2.1 2.8 2.4 2.5 2.7 2.7 2.6 2.7 2.80.1 2.5 2.1 2.8 3.1 3.1 3.0 2.8 3.0 2.8 2.7
45.5 1.2 1.5 2.1 2.4 1.8 2.1 2.0 1.7 2.0 2.04.6 3.5 2.1 1.0 -2.3 0.3 1.6 2.0 -0.1 1.3 1.73.3 3.5 1.3 0.7 -2.8 -0.2 1.2 1.4 -0.6 0.8 1.11.3 3.5 4.1 1.7 -0.9 1.7 2.5 3.3 0.9 2.3 3.06.8 4.1 1.9 2.3 2.4 3.3 2.3 2.9 2.7 2.8 3.3
31.5 6.9 6.7 6.5 6.5 6.4 6.4 6.3 6.3 6.2 6.217.1 7.9 7.8 7.3 6.9 6.7 6.6 6.3 6.7 6.4 6.2
7.0 5.2 6.2 6.9 7.5 7.1 7.2 7.5 6.9 7.1 7.52.5 6.0 5.6 5.0 4.9 5.0 5.0 5.1 5.0 5.0 5.18.2 3.0 2.9 1.1 -0.1 -1.0 1.2 2.1 -0.7 1.4 2.12.8 1.9 3.0 0.5 -3.8 -3.6 0.5 1.8 -3.4 0.6 1.71.9 4.0 1.4 2.3 2.6 2.3 1.7 2.1 2.1 1.7 2.13.2 4.1 5.1 4.9 3.4 1.2 2.6 3.4 1.6 3.1 3.9
54.5 5.4 4.9 4.5 4.0 4.1 4.5 4.8 4.0 4.5 4.8100.0 3.4 3.3 3.4 3.2 3.0 3.4 3.6 3.0 3.4 3.6
83.1 4.2 4.0 3.7 3.4 3.2 3.7 3.9 3.2 3.7 3.988.2 4.0 3.8 3.7 3.4 3.2 3.6 3.8 3.1 3.6 3.8
Sub-Saharan Africa
- Indonesia
USA
- Montenegro
World excluding euro area(a) Relative weights in %, based on GDP (at constant prices and PPS) in 2015.
World excluding EU
Emerging and developing economiesWorld
New Zealand
Switzerland
- Mexico
Latin America
- The former Yugoslav Republic of Macedonia
- Serbia
Lithuania
Croatia
Candidate Countries
Australia
- China
- Russia
- Turkey
MENA
World GDP, volume (percentage change on preceding year, 2012-18)
Spain
Finland
Germany
Romania
Bulgaria
Austria
Luxembourg
Latvia
Winter 2017
Belgium
Netherlands
Greece
France
25.4.2017
Spring 2017
EU
- Brazil
- Albania
Cyprus
- Other CIS
Sweden
Estonia
Advanced economies
Slovenia
Czech Republic
Japan
Hungary
Emerging and developing Asia
- India
United Kingdom
Ireland
CIS
Iceland
Slovakia
Portugal
Korea
Malta
Canada
Potential Candidates
Norway
Denmark
Poland
forecast
Euro area
forecast
Italy
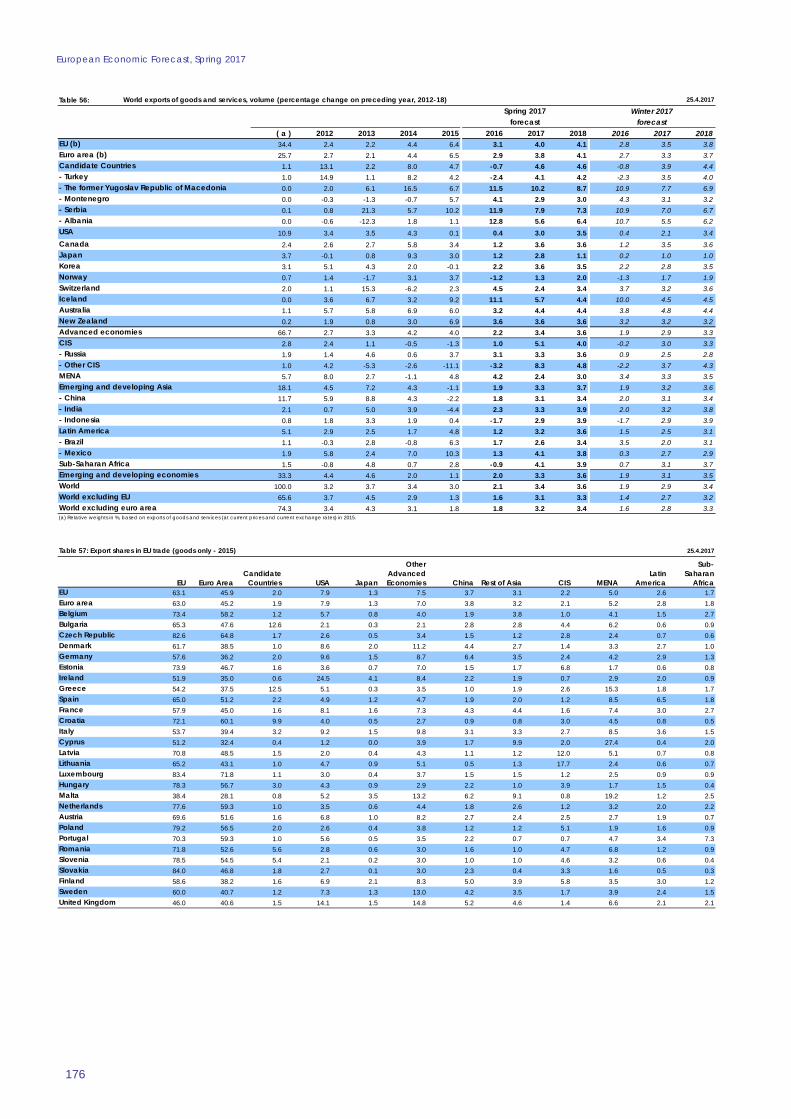
European Economic Forecast, Spring 2017
176
Table 56:
( a ) 2012 2013 2014 2015 2016 2017 2018 2016 2017 201834.4 2.4 2.2 4.4 6.4 3.1 4.0 4.1 2.8 3.5 3.825.7 2.7 2.1 4.4 6.5 2.9 3.8 4.1 2.7 3.3 3.7
1.1 13.1 2.2 8.0 4.7 -0.7 4.6 4.6 -0.8 3.9 4.41.0 14.9 1.1 8.2 4.2 -2.4 4.1 4.2 -2.3 3.5 4.00.0 2.0 6.1 16.5 6.7 11.5 10.2 8.7 10.9 7.7 6.90.0 -0.3 -1.3 -0.7 5.7 4.1 2.9 3.0 4.3 3.1 3.20.1 0.8 21.3 5.7 10.2 11.9 7.9 7.3 10.9 7.0 6.70.0 -0.6 -12.3 1.8 1.1 12.8 5.6 6.4 10.7 5.5 6.2
10.9 3.4 3.5 4.3 0.1 0.4 3.0 3.5 0.4 2.1 3.42.4 2.6 2.7 5.8 3.4 1.2 3.6 3.6 1.2 3.5 3.63.7 -0.1 0.8 9.3 3.0 1.2 2.8 1.1 0.2 1.0 1.03.1 5.1 4.3 2.0 -0.1 2.2 3.6 3.5 2.2 2.8 3.50.7 1.4 -1.7 3.1 3.7 -1.2 1.3 2.0 -1.3 1.7 1.92.0 1.1 15.3 -6.2 2.3 4.5 2.4 3.4 3.7 3.2 3.60.0 3.6 6.7 3.2 9.2 11.1 5.7 4.4 10.0 4.5 4.51.1 5.7 5.8 6.9 6.0 3.2 4.4 4.4 3.8 4.8 4.40.2 1.9 0.8 3.0 6.9 3.6 3.6 3.6 3.2 3.2 3.2
66.7 2.7 3.3 4.2 4.0 2.2 3.4 3.6 1.9 2.9 3.32.8 2.4 1.1 -0.5 -1.3 1.0 5.1 4.0 -0.2 3.0 3.31.9 1.4 4.6 0.6 3.7 3.1 3.3 3.6 0.9 2.5 2.81.0 4.2 -5.3 -2.6 -11.1 -3.2 8.3 4.8 -2.2 3.7 4.35.7 8.0 2.7 -1.1 4.8 4.2 2.4 3.0 3.4 3.3 3.5
18.1 4.5 7.2 4.3 -1.1 1.9 3.3 3.7 1.9 3.2 3.611.7 5.9 8.8 4.3 -2.2 1.8 3.1 3.4 2.0 3.1 3.4
2.1 0.7 5.0 3.9 -4.4 2.3 3.3 3.9 2.0 3.2 3.80.8 1.8 3.3 1.9 0.4 -1.7 2.9 3.9 -1.7 2.9 3.95.1 2.9 2.5 1.7 4.8 1.2 3.2 3.6 1.5 2.5 3.11.1 -0.3 2.8 -0.8 6.3 1.7 2.6 3.4 3.5 2.0 3.11.9 5.8 2.4 7.0 10.3 1.3 4.1 3.8 0.3 2.7 2.91.5 -0.8 4.8 0.7 2.8 -0.9 4.1 3.9 0.7 3.1 3.7
33.3 4.4 4.6 2.0 1.1 2.0 3.3 3.6 1.9 3.1 3.5100.0 3.2 3.7 3.4 3.0 2.1 3.4 3.6 1.9 2.9 3.465.6 3.7 4.5 2.9 1.3 1.6 3.1 3.3 1.4 2.7 3.274.3 3.4 4.3 3.1 1.8 1.8 3.2 3.4 1.6 2.8 3.3World excluding euro area
Norway
Canada
- China
- Other CIS
- Brazil
- India
MENA
Advanced economies
Iceland
World excluding EU
25.4.2017
Spring 2017
EU (b)
- Russia
World
World exports of goods and services, volume (percentage change on preceding year, 2012-18)
- The former Yugoslav Republic of Macedonia
Japan
- Serbia
- Turkey
Emerging and developing economies
Australia
Korea
forecast
Switzerland
Winter 2017
Sub-Saharan Africa
Candidate Countries
USA
Latin America
- Montenegro
forecast
Euro area (b)
(a) Relative weights in %, based on exports of goods and services (at current prices and current exchange rates) in 2015.
Emerging and developing Asia
- Mexico
- Albania
- Indonesia
New Zealand
CIS
25.4.2017
EU Euro AreaCandidate
Countries USA Japan
Other Advanced Economies China Rest of Asia CIS MENA
Latin America
Sub-Saharan
AfricaEU 63.1 45.9 2.0 7.9 1.3 7.5 3.7 3.1 2.2 5.0 2.6 1.7Euro area 63.0 45.2 1.9 7.9 1.3 7.0 3.8 3.2 2.1 5.2 2.8 1.8Belgium 73.4 58.2 1.2 5.7 0.8 4.0 1.9 3.8 1.0 4.1 1.5 2.7Bulgaria 65.3 47.6 12.6 2.1 0.3 2.1 2.8 2.8 4.4 6.2 0.6 0.9Czech Republic 82.6 64.8 1.7 2.6 0.5 3.4 1.5 1.2 2.8 2.4 0.7 0.6Denmark 61.7 38.5 1.0 8.6 2.0 11.2 4.4 2.7 1.4 3.3 2.7 1.0Germany 57.6 36.2 2.0 9.6 1.5 8.7 6.4 3.5 2.4 4.2 2.9 1.3Estonia 73.9 46.7 1.6 3.6 0.7 7.0 1.5 1.7 6.8 1.7 0.6 0.8Ireland 51.9 35.0 0.6 24.5 4.1 8.4 2.2 1.9 0.7 2.9 2.0 0.9Greece 54.2 37.5 12.5 5.1 0.3 3.5 1.0 1.9 2.6 15.3 1.8 1.7Spain 65.0 51.2 2.2 4.9 1.2 4.7 1.9 2.0 1.2 8.5 6.5 1.8France 57.9 45.0 1.6 8.1 1.6 7.3 4.3 4.4 1.6 7.4 3.0 2.7Croatia 72.1 60.1 9.9 4.0 0.5 2.7 0.9 0.8 3.0 4.5 0.8 0.5Italy 53.7 39.4 3.2 9.2 1.5 9.8 3.1 3.3 2.7 8.5 3.6 1.5Cyprus 51.2 32.4 0.4 1.2 0.0 3.9 1.7 9.9 2.0 27.4 0.4 2.0Latvia 70.8 48.5 1.5 2.0 0.4 4.3 1.1 1.2 12.0 5.1 0.7 0.8Lithuania 65.2 43.1 1.0 4.7 0.9 5.1 0.5 1.3 17.7 2.4 0.6 0.7Luxembourg 83.4 71.8 1.1 3.0 0.4 3.7 1.5 1.5 1.2 2.5 0.9 0.9Hungary 78.3 56.7 3.0 4.3 0.9 2.9 2.2 1.0 3.9 1.7 1.5 0.4Malta 38.4 28.1 0.8 5.2 3.5 13.2 6.2 9.1 0.8 19.2 1.2 2.5Netherlands 77.6 59.3 1.0 3.5 0.6 4.4 1.8 2.6 1.2 3.2 2.0 2.2Austria 69.6 51.6 1.6 6.8 1.0 8.2 2.7 2.4 2.5 2.7 1.9 0.7Poland 79.2 56.5 2.0 2.6 0.4 3.8 1.2 1.2 5.1 1.9 1.6 0.9Portugal 70.3 59.3 1.0 5.6 0.5 3.5 2.2 0.7 0.7 4.7 3.4 7.3Romania 71.8 52.6 5.6 2.8 0.6 3.0 1.6 1.0 4.7 6.8 1.2 0.9Slovenia 78.5 54.5 5.4 2.1 0.2 3.0 1.0 1.0 4.6 3.2 0.6 0.4Slovakia 84.0 46.8 1.8 2.7 0.1 3.0 2.3 0.4 3.3 1.6 0.5 0.3Finland 58.6 38.2 1.6 6.9 2.1 8.3 5.0 3.9 5.8 3.5 3.0 1.2Sweden 60.0 40.7 1.2 7.3 1.3 13.0 4.2 3.5 1.7 3.9 2.4 1.5United Kingdom 46.0 40.6 1.5 14.1 1.5 14.8 5.2 4.6 1.4 6.6 2.1 2.1
Table 57: Export shares in EU trade (goods only - 2015)
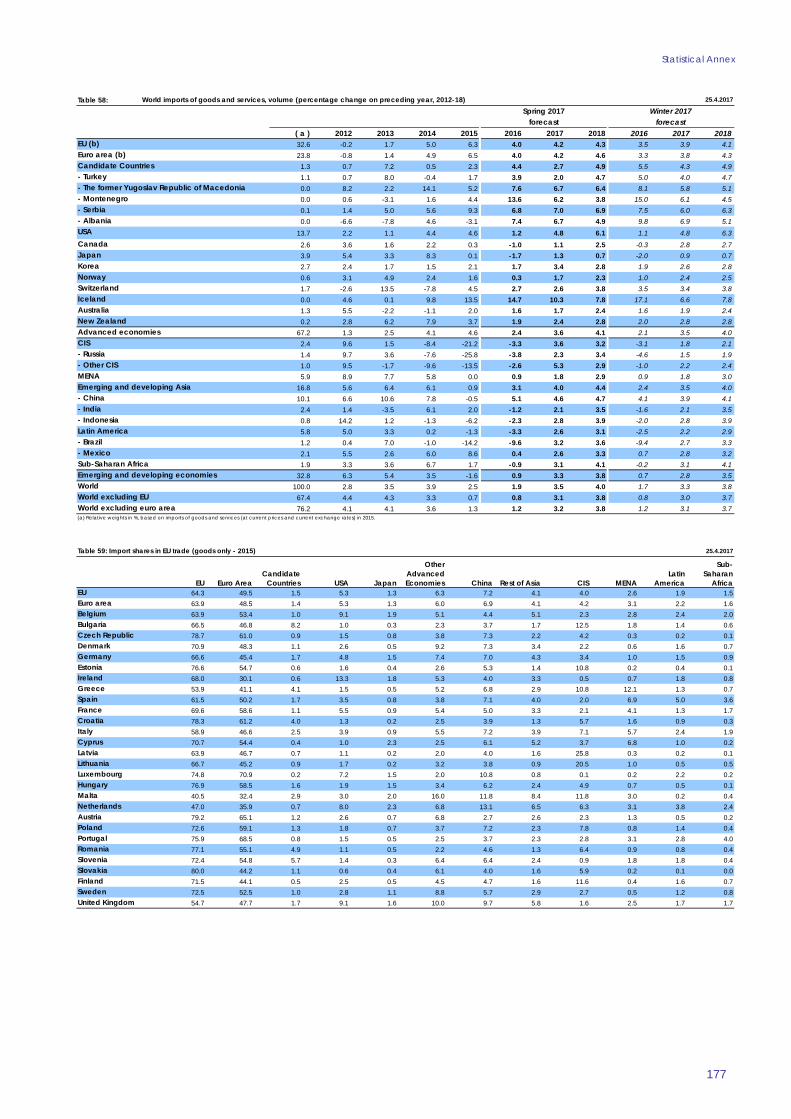
Statistical Annex
177
Table 58:
( a ) 2012 2013 2014 2015 2016 2017 2018 2016 2017 201832.6 -0.2 1.7 5.0 6.3 4.0 4.2 4.3 3.5 3.9 4.123.8 -0.8 1.4 4.9 6.5 4.0 4.2 4.6 3.3 3.8 4.31.3 0.7 7.2 0.5 2.3 4.4 2.7 4.9 5.5 4.3 4.91.1 0.7 8.0 -0.4 1.7 3.9 2.0 4.7 5.0 4.0 4.70.0 8.2 2.2 14.1 5.2 7.6 6.7 6.4 8.1 5.8 5.10.0 0.6 -3.1 1.6 4.4 13.6 6.2 3.8 15.0 6.1 4.50.1 1.4 5.0 5.6 9.3 6.8 7.0 6.9 7.5 6.0 6.30.0 -6.6 -7.8 4.6 -3.1 7.4 6.7 4.9 9.8 6.9 5.1
13.7 2.2 1.1 4.4 4.6 1.2 4.8 6.1 1.1 4.8 6.32.6 3.6 1.6 2.2 0.3 -1.0 1.1 2.5 -0.3 2.8 2.73.9 5.4 3.3 8.3 0.1 -1.7 1.3 0.7 -2.0 0.9 0.72.7 2.4 1.7 1.5 2.1 1.7 3.4 2.8 1.9 2.6 2.80.6 3.1 4.9 2.4 1.6 0.3 1.7 2.3 1.0 2.4 2.51.7 -2.6 13.5 -7.8 4.5 2.7 2.6 3.8 3.5 3.4 3.80.0 4.6 0.1 9.8 13.5 14.7 10.3 7.8 17.1 6.6 7.81.3 5.5 -2.2 -1.1 2.0 1.6 1.7 2.4 1.6 1.9 2.40.2 2.8 6.2 7.9 3.7 1.9 2.4 2.8 2.0 2.8 2.8
67.2 1.3 2.5 4.1 4.6 2.4 3.6 4.1 2.1 3.5 4.02.4 9.6 1.5 -8.4 -21.2 -3.3 3.6 3.2 -3.1 1.8 2.11.4 9.7 3.6 -7.6 -25.8 -3.8 2.3 3.4 -4.6 1.5 1.91.0 9.5 -1.7 -9.6 -13.5 -2.6 5.3 2.9 -1.0 2.2 2.45.9 8.9 7.7 5.8 0.0 0.9 1.8 2.9 0.9 1.8 3.0
16.8 5.6 6.4 6.1 0.9 3.1 4.0 4.4 2.4 3.5 4.010.1 6.6 10.6 7.8 -0.5 5.1 4.6 4.7 4.1 3.9 4.12.4 1.4 -3.5 6.1 2.0 -1.2 2.1 3.5 -1.6 2.1 3.50.8 14.2 1.2 -1.3 -6.2 -2.3 2.8 3.9 -2.0 2.8 3.95.8 5.0 3.3 0.2 -1.3 -3.3 2.6 3.1 -2.5 2.2 2.91.2 0.4 7.0 -1.0 -14.2 -9.6 3.2 3.6 -9.4 2.7 3.32.1 5.5 2.6 6.0 8.6 0.4 2.6 3.3 0.7 2.8 3.21.9 3.3 3.6 6.7 1.7 -0.9 3.1 4.1 -0.2 3.1 4.1
32.8 6.3 5.4 3.5 -1.6 0.9 3.3 3.8 0.7 2.8 3.5100.0 2.8 3.5 3.9 2.5 1.9 3.5 4.0 1.7 3.3 3.8
67.4 4.4 4.3 3.3 0.7 0.8 3.1 3.8 0.8 3.0 3.776.2 4.1 4.1 3.6 1.3 1.2 3.2 3.8 1.2 3.1 3.7
Candidate Countries
- Other CIS
- Brazil
- India
MENA
Advanced economies
Iceland
Emerging and developing Asia
- Indonesia
CIS- Russia
New Zealand
Norway
Australia
Latin America
USA
- Montenegro
Canada
- China
(a) Relative weights in %, based on imports of goods and services (at current prices and current exchange rates) in 2015.
- Mexico
Emerging and developing economiesWorld
World excluding euro areaWorld excluding EU
Sub-Saharan Africa
forecast
Euro area (b)
forecast
Switzerland
World imports of goods and services, volume (percentage change on preceding year, 2012-18)
- The former Yugoslav Republic of Macedonia
Japan
- Serbia
- Turkey
25.4.2017
Spring 2017
EU (b)
- Albania
Korea
Winter 2017
25.4.2017
EU Euro AreaCandidate
Countries USA Japan
Other Advanced Economies China Rest of Asia CIS MENA
Latin America
Sub-Saharan
AfricaEU 64.3 49.5 1.5 5.3 1.3 6.3 7.2 4.1 4.0 2.6 1.9 1.5Euro area 63.9 48.5 1.4 5.3 1.3 6.0 6.9 4.1 4.2 3.1 2.2 1.6Belgium 63.9 53.4 1.0 9.1 1.9 5.1 4.4 5.1 2.3 2.8 2.4 2.0Bulgaria 66.5 46.8 8.2 1.0 0.3 2.3 3.7 1.7 12.5 1.8 1.4 0.6Czech Republic 78.7 61.0 0.9 1.5 0.8 3.8 7.3 2.2 4.2 0.3 0.2 0.1Denmark 70.9 48.3 1.1 2.6 0.5 9.2 7.3 3.4 2.2 0.6 1.6 0.7Germany 66.6 45.4 1.7 4.8 1.5 7.4 7.0 4.3 3.4 1.0 1.5 0.9Estonia 76.6 54.7 0.6 1.6 0.4 2.6 5.3 1.4 10.8 0.2 0.4 0.1Ireland 68.0 30.1 0.6 13.3 1.8 5.3 4.0 3.3 0.5 0.7 1.8 0.8Greece 53.9 41.1 4.1 1.5 0.5 5.2 6.8 2.9 10.8 12.1 1.3 0.7Spain 61.5 50.2 1.7 3.5 0.8 3.8 7.1 4.0 2.0 6.9 5.0 3.6France 69.6 58.6 1.1 5.5 0.9 5.4 5.0 3.3 2.1 4.1 1.3 1.7Croatia 78.3 61.2 4.0 1.3 0.2 2.5 3.9 1.3 5.7 1.6 0.9 0.3Italy 58.9 46.6 2.5 3.9 0.9 5.5 7.2 3.9 7.1 5.7 2.4 1.9Cyprus 70.7 54.4 0.4 1.0 2.3 2.5 6.1 5.2 3.7 6.8 1.0 0.2Latvia 63.9 46.7 0.7 1.1 0.2 2.0 4.0 1.6 25.8 0.3 0.2 0.1Lithuania 66.7 45.2 0.9 1.7 0.2 3.2 3.8 0.9 20.5 1.0 0.5 0.5Luxembourg 74.8 70.9 0.2 7.2 1.5 2.0 10.8 0.8 0.1 0.2 2.2 0.2Hungary 76.9 58.5 1.6 1.9 1.5 3.4 6.2 2.4 4.9 0.7 0.5 0.1Malta 40.5 32.4 2.9 3.0 2.0 16.0 11.8 8.4 11.8 3.0 0.2 0.4Netherlands 47.0 35.9 0.7 8.0 2.3 6.8 13.1 6.5 6.3 3.1 3.8 2.4Austria 79.2 65.1 1.2 2.6 0.7 6.8 2.7 2.6 2.3 1.3 0.5 0.2Poland 72.6 59.1 1.3 1.8 0.7 3.7 7.2 2.3 7.8 0.8 1.4 0.4Portugal 75.9 68.5 0.8 1.5 0.5 2.5 3.7 2.3 2.8 3.1 2.8 4.0Romania 77.1 55.1 4.9 1.1 0.5 2.2 4.6 1.3 6.4 0.9 0.8 0.4Slovenia 72.4 54.8 5.7 1.4 0.3 6.4 6.4 2.4 0.9 1.8 1.8 0.4Slovakia 80.0 44.2 1.1 0.6 0.4 6.1 4.0 1.6 5.9 0.2 0.1 0.0Finland 71.5 44.1 0.5 2.5 0.5 4.5 4.7 1.6 11.6 0.4 1.6 0.7Sweden 72.5 52.5 1.0 2.8 1.1 8.8 5.7 2.9 2.7 0.5 1.2 0.8United Kingdom 54.7 47.7 1.7 9.1 1.6 10.0 9.7 5.8 1.6 2.5 1.7 1.7
Table 59: Import shares in EU trade (goods only - 2015)
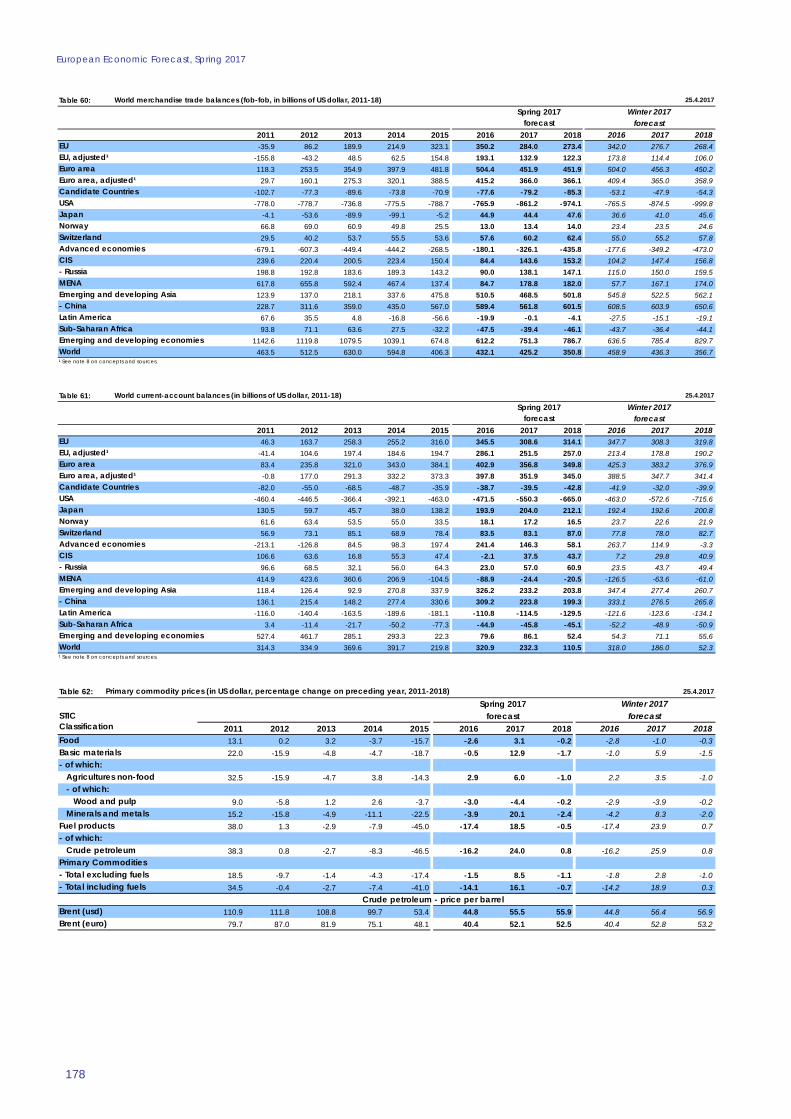
European Economic Forecast, Spring 2017
178
Table 60:
2011 2012 2013 2014 2015 2016 2017 2018 2016 2017 2018-35.9 86.2 189.9 214.9 323.1 350.2 284.0 273.4 342.0 276.7 268.4
-155.8 -43.2 48.5 62.5 154.8 193.1 132.9 122.3 173.8 114.4 106.0118.3 253.5 354.9 397.9 481.8 504.4 451.9 451.9 504.0 456.3 450.229.7 160.1 275.3 320.1 388.5 415.2 366.0 366.1 409.4 365.0 358.9
-102.7 -77.3 -89.6 -73.8 -70.9 -77.6 -79.2 -85.3 -53.1 -47.9 -54.3-778.0 -778.7 -736.8 -775.5 -788.7 -765.9 -861.2 -974.1 -765.5 -874.5 -999.8
-4.1 -53.6 -89.9 -99.1 -5.2 44.9 44.4 47.6 36.6 41.0 45.666.8 69.0 60.9 49.8 25.5 13.0 13.4 14.0 23.4 23.5 24.629.5 40.2 53.7 55.5 53.6 57.6 60.2 62.4 55.0 55.2 57.8
-679.1 -607.3 -449.4 -444.2 -268.5 -180.1 -326.1 -435.8 -177.6 -349.2 -473.0239.6 220.4 200.5 223.4 150.4 84.4 143.6 153.2 104.2 147.4 156.8198.8 192.8 183.6 189.3 143.2 90.0 138.1 147.1 115.0 150.0 159.5617.8 655.8 592.4 467.4 137.4 84.7 178.8 182.0 57.7 167.1 174.0123.9 137.0 218.1 337.6 475.8 510.5 468.5 501.8 545.8 522.5 562.1228.7 311.6 359.0 435.0 567.0 589.4 561.8 601.5 608.5 603.9 650.667.6 35.5 4.8 -16.8 -56.6 -19.9 -0.1 -4.1 -27.5 -15.1 -19.193.8 71.1 63.6 27.5 -32.2 -47.5 -39.4 -46.1 -43.7 -36.4 -44.1
1142.6 1119.8 1079.5 1039.1 674.8 612.2 751.3 786.7 636.5 785.4 829.7463.5 512.5 630.0 594.8 406.3 432.1 425.2 350.8 458.9 436.3 356.7
¹ See note 8 on concepts and sources.
CIS
Japan
Latin America
Winter 2017
Sub-Saharan Africa
MENAEmerging and developing Asia
Candidate Countries
World
Advanced economies
EU
Emerging and developing economies
- China
USA
EU, adjusted¹
25.4.2017
- Russia
Euro area
forecast
Norway
forecast
World merchandise trade balances (fob-fob, in billions of US dollar, 2011-18)
Euro area, adjusted¹
Switzerland
Spring 2017
Table 61:
2011 2012 2013 2014 2015 2016 2017 2018 2016 2017 201846.3 163.7 258.3 255.2 316.0 345.5 308.6 314.1 347.7 308.3 319.8
-41.4 104.6 197.4 184.6 194.7 286.1 251.5 257.0 213.4 178.8 190.283.4 235.8 321.0 343.0 384.1 402.9 356.8 349.8 425.3 383.2 376.9-0.8 177.0 291.3 332.2 373.3 397.8 351.9 345.0 388.5 347.7 341.4
-82.0 -55.0 -68.5 -48.7 -35.9 -38.7 -39.5 -42.8 -41.9 -32.0 -39.9-460.4 -446.5 -366.4 -392.1 -463.0 -471.5 -550.3 -665.0 -463.0 -572.6 -715.6130.5 59.7 45.7 38.0 138.2 193.9 204.0 212.1 192.4 192.6 200.861.6 63.4 53.5 55.0 33.5 18.1 17.2 16.5 23.7 22.6 21.956.9 73.1 85.1 68.9 78.4 83.5 83.1 87.0 77.8 78.0 82.7
-213.1 -126.8 84.5 98.3 197.4 241.4 146.3 58.1 263.7 114.9 -3.3106.6 63.6 16.8 55.3 47.4 -2.1 37.5 43.7 7.2 29.8 40.996.6 68.5 32.1 56.0 64.3 23.0 57.0 60.9 23.5 43.7 49.4
414.9 423.6 360.6 206.9 -104.5 -88.9 -24.4 -20.5 -126.5 -63.6 -61.0118.4 126.4 92.9 270.8 337.9 326.2 233.2 203.8 347.4 277.4 260.7136.1 215.4 148.2 277.4 330.6 309.2 223.8 199.3 333.1 276.5 265.8
-116.0 -140.4 -163.5 -189.6 -181.1 -110.8 -114.5 -129.5 -121.6 -123.6 -134.13.4 -11.4 -21.7 -50.2 -77.3 -44.9 -45.8 -45.1 -52.2 -48.9 -50.9
527.4 461.7 285.1 293.3 22.3 79.6 86.1 52.4 54.3 71.1 55.6314.3 334.9 369.6 391.7 219.8 320.9 232.3 110.5 318.0 186.0 52.3
¹ See note 8 on concepts and sources.
CIS
Japan
Latin America
Winter 2017
Sub-Saharan Africa
MENAEmerging and developing Asia
Candidate Countries
World
Advanced economies
EU
Emerging and developing economies
- China
USA
EU, adjusted¹
25.4.2017
- Russia
Euro area
forecast
Norway
forecast
World current-account balances (in billions of US dollar, 2011-18)
Euro area, adjusted¹
Switzerland
Spring 2017
Table 62: 25.4.2017
2011 2012 2013 2014 2015 2016 2017 2018 2016 2017 201813.1 0.2 3.2 -3.7 -15.7 -2.6 3.1 -0.2 -2.8 -1.0 -0.322.0 -15.9 -4.8 -4.7 -18.7 -0.5 12.9 -1.7 -1.0 5.9 -1.5
32.5 -15.9 -4.7 3.8 -14.3 2.9 6.0 -1.0 2.2 3.5 -1.0
9.0 -5.8 1.2 2.6 -3.7 -3.0 -4.4 -0.2 -2.9 -3.9 -0.215.2 -15.8 -4.9 -11.1 -22.5 -3.9 20.1 -2.4 -4.2 8.3 -2.038.0 1.3 -2.9 -7.9 -45.0 -17.4 18.5 -0.5 -17.4 23.9 0.7
38.3 0.8 -2.7 -8.3 -46.5 -16.2 24.0 0.8 -16.2 25.9 0.8
18.5 -9.7 -1.4 -4.3 -17.4 -1.5 8.5 -1.1 -1.8 2.8 -1.034.5 -0.4 -2.7 -7.4 -41.0 -14.1 16.1 -0.7 -14.2 18.9 0.3
110.9 111.8 108.8 99.7 53.4 44.8 55.5 55.9 44.8 56.4 56.979.7 87.0 81.9 75.1 48.1 40.4 52.1 52.5 40.4 52.8 53.2
Primary commodity prices (in US dollar, percentage change on preceding year, 2011-2018)
- Total including fuels
Crude petroleum
Agricultures non-food
Food
Spring 2017
Brent (euro)
Winter 2017
- of which:
STICClassification
Fuel products
forecast
Primary Commodities
Minerals and metals
- of which:
Brent (usd)
Wood and pulp
Basic materials
forecast
Crude petroleum - price per barrel
- Total excluding fuels
- of which: