european high yield & leveraged loan report, fourth … · association for financial markets in...
TRANSCRIPT

Association for Financial Markets in Europe www.afme.eu Prepared in partnership with
European High Yield & Leveraged Loan Report European Leveraged Finance Q4: 2017

Table of Contents
European High Yield & Leveraged Loan Report Page 2
Table of Contents Table of Contents .................................................................................................................................................................................................... 2 Highlights and Market Environment .......................................................................................................................... Error! Bookmark not defined.
Issuance Highlights ..................................................................................................................................................................................................................................................................... 4 Market and Economic Environment .................................................................................................................................................................................................................................... 4 Issuance: Leveraged Loans ...................................................................................................................................................................................................................................................... 4 Issuance: High Yield Bonds ...................................................................................................................................................................................................................................................... 5 Returns & Credit Quality ........................................................................................................................................................................................................................................................... 6
1 Leveraged Finance Overview ....................................................................................................................................................................................... 9 1.1 European Leveraged Issuance by Type ................................................................................................................................................................................................................. 9 1.2 European Leveraged Issuance Percentage ........................................................................................................................................................................................................... 9 1.3 European Leveraged Average Deal Size ................................................................................................................................................................................................................ 9 1.4 Bank Credit Standards ................................................................................................................................................................................................................................................... 9 1.5 Factors Affecting Bank Credit Standards: January 2018 ............................................................................................................................................................................... 9 1.6 European Leveraged Issuance Percentage ........................................................................................................................................................................................................... 9 1.7 Factors Affecting Loan Demand: January 2018 .............................................................................................................................................................................................. 10 1.8 Global Comparison – High Yield Issuance ......................................................................................................................................................................................................... 10
2 Issuance – Leveraged Loans .......................................................................................................................................................................................11 2.1 European Leveraged Loan Issuance By Type .................................................................................................................................................................................................. 11 2.2 European Leveraged Loan Issuance by Industry ........................................................................................................................................................................................... 11 2.3 Forward Pipeline of Leveraged Loan Market ................................................................................................................................................................................................... 11 2.4 ELLI Total Institutional Loans Outstanding ...................................................................................................................................................................................................... 11 2.5 ELLI Ratings Diversification..................................................................................................................................................................................................................................... 11 2.6 Institutional and Pro Rata Spreads ....................................................................................................................................................................................................................... 11 2.7 Mezzanine Spreads ....................................................................................................................................................................................................................................................... 12
3 Issuance – High Yield Bonds Overview ......................................................................................................................................................................13 3.1 European High Yield Issuance ................................................................................................................................................................................................................................ 13 3.2 European High Yield Issuance by Sponsor ........................................................................................................................................................................................................ 13 3.3 European Corporate Bonds Outstanding (IG and HY only) ....................................................................................................................................................................... 13 3.4 European Corporate Bonds HY Maturity Wall: December 2017 ............................................................................................................................................................ 13 3.5 European Corporate HY Bonds Outstanding By Sector: 4Q 2017 .......................................................................................................................................................... 13 3.6 European Corporate HY Bonds Outstanding by Current Rating: December 2017 ......................................................................................................................... 13 3.7 European Corporate Bond Issuance by Rating: 4Q 2017 ........................................................................................................................................................................... 14 3.8 European Corporate Bond Issuance by Tenor: 4Q 2017 ............................................................................................................................................................................ 14 3.9 European HY Use of Proceeds ................................................................................................................................................................................................................................. 14
4 Issuance – European Developed Market High Yield Bonds ......................................................................................................................................15 4.1 European Developed Market HY Bond Issuance ............................................................................................................................................................................................ 15 4.2 European Developed Market HY Issuance by Currency ............................................................................................................................................................................. 15 4.3 European Developed Market HY Issuance by Industry: 4Q 2017 .......................................................................................................................................................... 15 4.4 European Developed Market HY Issuance by Country of Risk: 4Q 2017 ............................................................................................................................................ 15 4.5 European Developed Market HY Issuance, Fixed vs. Floating ................................................................................................................................................................. 15 4.6 European Developed Market HY Issuance, Sponsored vs. Corporate .................................................................................................................................................. 15 4.7 European Developed Market HY Rating Distribution at Issuance ......................................................................................................................................................... 16 4.8 European Developed Market Corporate Bonds Outstanding: 4Q 2017 ............................................................................................................................................... 16 4.9 European Developed Market HY Bond Issuance ............................................................................................................................................................................................ 17
5 Issuance – European Emerging Market High Yield Bonds .......................................................................................................................................18 5.1 European Emerging Market HY Bond Issuance .............................................................................................................................................................................................. 18 5.2 European Emerging Market HY Bond Issuance by Currency ................................................................................................................................................................... 18 5.3 European Emerging Market HY Issuance by Industry: 4Q 2017 ............................................................................................................................................................ 18 5.4 European Emerging Market HY Issuance by Country of Risk: 4Q 2017 .............................................................................................................................................. 18 5.5 European Emerging Market HY Issuance, Fixed vs. Floating ................................................................................................................................................................... 18 5.6 European Emerging Market HY Issuance, Sponsored vs. Corporate .................................................................................................................................................... 18 5.7 European Emerging Market HY Rating Distribution at Issuance ........................................................................................................................................................... 19 5.8 European Emerging Market Corporate Bonds Outstanding: 4Q 2017 ................................................................................................................................................. 19 5.9 European Emerging Market HY Bond Issuance .............................................................................................................................................................................................. 19
6 Credit Quality ................................................................................................................................................................................................................20 6.1 Developed Europe Issuer Rating Actions........................................................................................................................................................................................................... 20 6.2 Emerging Europe Issuer Rating Actions............................................................................................................................................................................................................. 20 6.3 Developed European Industry Rating Actions by Number of Ratings: 4Q 2017 ............................................................................................................................. 20 6.4 Emerging European Industry Rating Actions by Number of Ratings: 4Q 2017 ............................................................................................................................... 20 6.5 European High Yield Default Rates ....................................................................................................................................................................................................................... 20 6.6 European Leveraged Loan Default Rates ........................................................................................................................................................................................................... 20 6.7 Mezzanine and Senior Loan Default Rate .......................................................................................................................................................................................................... 21 6.8 Mezzanine and Senior Loan Recovery Rates .................................................................................................................................................................................................... 21 6.9 High-Yield bond CDS spreads vs. liquidity-stress index and HY bonds rated B3 neg and lower in Europe ....................................................................... 21 6.10 European Defaults ........................................................................................................................................................................................................................................................ 21
7 Relative Value and Total Return ..................................................................................................................................................................................22 7.1 Relative value: European HY Bonds, Cash vs. Synthetic ............................................................................................................................................................................. 22 7.2 European HY Bond Total Return ........................................................................................................................................................................................................................... 22 7.3 European Leveraged Loan Total Return ............................................................................................................................................................................................................ 22 7.4 Asset Class Total Return, 4Q 2017 ........................................................................................................................................................................................................................ 22

Table of Contents
European High Yield & Leveraged Loan Report Page 3
Summary of the Methodologies Adopted for this Report ................................................................................................................................. 23 Annex ..................................................................................................................................................................................................................... 27

Highlights and Market Environment
European High Yield & Leveraged Loan Report Page 4
Highlights and Market Environment
“European leveraged finance issuance (leveraged loans and high yield bonds) reached €324.4 billion in 2017”
“Leveraged loan issuance totaled €195.3 billion on 302 deals in 2017”
Highlights Issuance Highlights European leveraged finance issuance (leveraged loans and high yield bonds) increased in 4Q’17 to €103.6 billion, more than double the €48.0 billion in 3Q’17 and a 80.4% increase from €57.4 billion issued in 4Q’16. Fourth quarter issuance was equally as robust in the leveraged loan sector (128.2% increase quarter over quarter) as it was in the HY sector (98.3% increase quarter over quarter) The high yield bond share of the leveraged finance market decreased to 37.1% in 4Q’17, down from 40.4% in 3Q’17 but up from the 26.2% share in 4Q’16.
For the full year 2017, European leveraged finance issuance reached €324.4 billion, an increase of 45.0% from €223.6 billion in 2016. Leveraged loan issuance increased by 37.9% y-o-y to €195.3 billion while high yield bond issuance set a new high of €129.1 billion in 2017, an increase of 57.3% from €82.1 billion in the previous year.
Market and Economic Environment According to the January 2018 European Central Bank lending survey, credit standards for loans to enterprises in the fourth quarter remained broadly unchanged. For loans to enterprises, credit standards eased considerably for loans to large firms, but eased only slightly for loans to small and medium-sized enterprises (SMEs).
Net demand for loans to enterprises, housing loans, and consumer credit continued to increase in 4Q’17, with interest largely concentrated on long term loans. Fixed investment, iinterset rates, and working capital were the main drivers to increase demand, while internal financing contributed to a reduction in demand.
Issuance Issuance: Leveraged Loans Leveraged loan issuance, including first lien, second lien, and mezzanine financing, increased to €65.2 billion in the fourth quarter of 2017, up 128.2% q-o-q (€28.6 billion in 3Q’17) and up 53.8% y-o-y (€42.4 billion in 4Q’16). For the full year 2017, €195.3 billion in leveraged loans were issued, up 37.9% from €141.6 billion in 2016 and the highest issuance volume since €239.7 billion in 2007.
In the fourth quarter of 2017, only €13.2 billion of amend-and-extend (“A&E”) loans were financed, a significant increase from no A&E deals in 3Q’17 and down from €14.4 billion in 4Q’16. A&E loans issuance rose by 62.9% to €34.1 billion in 2017 from €20.9 billion in 2016.
In addition to A&E loans, a significant number of loans that had been amended to reduce pricing were executed in the

Highlights and Market Environment
European High Yield & Leveraged Loan Report Page 5
Institutional Spreads
Source: Dealogic, AFME, SIFMA
European CLO Outstanding
Source: AFME, SIFMA
“Primary high yield issuance totaled €129.1 billion on 306 deals in 2017”
fourth quarter: €15.5 billion were issued in 4Q’17, of which €9.2 billion were also A&E deals.
Most of the leveraged loans issued in 4Q’17 were 1st lien loans (€64.5 billion); there were two 2nd lien loans financed (€0.7 billion) and no mezzanine loans. For the full year 2017, no mezzanine loans were issued, €2.6 billion in 2nd lien loans and the remainder (€192.7 billion) in 1st lien loans.
The top three sectors in leveraged loan issuance in 4Q’17 accounted for slightly more than half of issuance; the leading sector was telecommunications (€19.3 billion), followed by computers & electronics (€9.0 billion), and real estate (€7.6 billion), with the balance split between 18 other sectors. For the full year 2017, the top three sectors in leveraged loan issuance were telecommunications (€37.6 billion), followed by computers & electronics (€30.6 billion) and chemicals (€18.9 billion).
Pricing spreads for institutional loans tightened by 24 basis points (bps) q-o-q and by 62 bps y-o-y while spreads for pro rata loans tightened by 8 bps q-o-q and by 44 bps y-o-y.
The share of deals used to refinance and/or repay debt rose to 69.0% of all deals by euro amount in the fourth quarter of 2017, up from 55.1% in 3Q’17 but down from 73.5% in 4Q’16. Refinancing and/or repayment of debt were the largest use of proceeds in 4Q’17 with €45.0 billion, followed by leveraged buyouts with €19.1 billion or 29.3% of total, and acquisitions with €1.0 billion or 1.6% of total. The remainder was split between general corporate and other purposes. For the full year 2017, the top use of proceeds mirrored 4Q’17: refinancing and/or repaying of debt (€134.2 billion or 68.7% of 2017 total), leveraged buyouts (€45.3 billion or 23.2%), and acquisitions (€13.9 billion or 7.1%).
European CLO outstandings, including SME deals, increased by 1.9% to €180.5 billion in 4Q’17 from 3Q’17, but remain below the €194.7 billion outstanding in 4Q’16. Non-SME CLOs outstanding increased by 5.1% to €101.7 billion in 4Q’17 from €96.7 billion in 3Q’17 but declined 3.2% y-o-y, while SME CLOs declined by 2.1% to €78.6 billion in 4Q’17 and by 12.1% from 4Q’16.
Issuance: High Yield Bonds Primary high yield issuance in 4Q’17 totaled €38.5 billion on 89 deals, a 98.3% increase from 3Q’17 (€19.4 billion on 50 deals) and a 155.4% increase from 4Q’16 (€15.1 billion on 41 deals). For the full year 2017, primary high yield issuance totaled €129.1 billion, up 57.3% from €82.1 billion in 2016.
In the fourth quarter of 2017, average deal size in developed market Europe increased by 20.0% to €434.9 million from €362.3 million in 3Q’17 and by 24.3% from €349.8 million in 4Q’16. Average deal size in emerging
0
50
100
150
200
250
200
250
300
350
400
450
500
550
600
Dec-12 Dec-13 Dec-14 Dec-15 Dec-16 Dec-17
Basi
s Po
ints
Widest differenceFranceGermanyNetherlandsSpainUnited Kingdom
0
50
100
150
200
250
300
350
4Q'08 4Q'09 4Q'10 4Q'11 4Q'12 4Q'13 4Q'14 4Q'15 4Q'16 4Q'17
€ Bi
llion
s SMENon-SME CLO

Highlights and Market Environment
European High Yield & Leveraged Loan Report Page 6
market Europe declined by 20.0% to €403.2 million in 4Q’17 from €503.8 million in 3Q’17 and declined by 1.5% y-o-y (€409.2 million in 4Q’16). For the full year 2017, the average deal size was €410.2 million in developed market Europe and €475.3 million in emerging market Europe, down 21.4% and up 13.5%, respectively, from full year 2016.
High yield issuance for refinancing and/or repayment of debt in developed market Europe increased to €15.4 billion, representing 43.6% of all issuance in 4Q’17, up from €4.7 billion (31.6% of total) in 3Q’17 and from €4.6 billion (45.4% of total) in 4Q’16. In emerging market Europe, €1.1 billion (34.4% of total) in high yield debt was issued for refinancing and/or repayment of debt in the fourth quarter of 2017, a decrease from €1.4 billion (29.8% of total) in 3Q’17 and an increase from no issuance in 4Q’16. For the full year 2017, high yield issuance for refinancing and/or repayment of debt was €39.5 billion in developed market Europe and €2.8 billion in emerging market Europe, up 26.8% and 218.6%, respectively, from 2016.
Three sectors accounted approximately half of the total high yield issuance volume in 4Q’17: the telecommunications industry led issuance with €11.7 billion (30.3% of total), followed by retail with €4.0 billion (10.4% of total), and transportation with €2.9 billion (7.7% of total). For the full year 2017, the telecommunications industry led high yield issuance with €24.7 billion, followed by finance (€21.0 billion) and metal & steel (€8.7 billion). In developed market Europe, the top three industries in 4Q’17 were: telecommunications (€11.7 billion or 33.1% of total issuance volume), followed by retail (€3.7 billion or 10.5% of total) and transportation (€2.9 billion or 8.4% of total). In emerging market Europe the top three sectors were: oil & gas (€0.8 billion or 23.3% of total), followed by finance and real estate/property(€0.7 billion or 21.6% of total each).
The proportion of USD-denominated issuance increased slightly to 18.8% of all issuance in 4Q’17, compared to 18.2% in 3Q’17 and 29.1% in 4Q’16. USD-denominated issuance in developed market Europe rose to €5.9 billion, or 16.9% of issuance from €1.6 billion or 10.9% in 3Q’17 and €1.3 billion (12.6% of total) in 4Q’16. Of high yield bonds issued in emerging market Europe, €1.3 billion or 39.8% was denominated in USD, down from €1.9 billion (42.0% of total) in 3Q’17 and down from €3.1 billion (63.0% of total) in 4Q’16. For the full year 2017, USD-denominated deals totaled €40.2 billion and accounted for 31.1% of total issuance, down from €33.7 billion, or 41.1% of total, in 2016.
Returns & Credit Quality All asset classes analysed recorded positive returns in the fourth quarter of 2017 with the exception of US HY

Highlights and Market Environment
European High Yield & Leveraged Loan Report Page 7
“Emerging market and developed market equities led returns in 2017”
“26 European high yield bond issuers defaulted in 2017”
distressed bonds. Both developed and emerging market equities led returns, with the MCSI Emerging Market Index led total returns with 7.5% q-o-q, followed by the S&P 500 (6.6% q-o-q) and the Russell 2000 Euro (3.3% q-o-q). Investment grade corporates and municipals outperformed both U.S. and European high yield, however.
The worst performing asset classes in 4Q’17 were U.S. High Yield Distressed (-3.1% q-o-q), U.S. Treasuries (0.1% q-o-q), and U.S. 30-year mortgages (0.2% q-o-q). For the full year 2017, equities and investment grade credit also generally led total returns, although all asset classes analysed recorded positive returns. The MCSI Emerging Market index led turns with a 37.4%total for the full year, followed by the S&P 500 (21.6%) and the Russell 2000 (14.5%). European covered bonds were the worst performers in the market, with 0.7% total return in 2017, followed by U.S. Treasuries (2.4%), US 30-year mortgages (2.5%) and European ABS/MBS (2.5%).
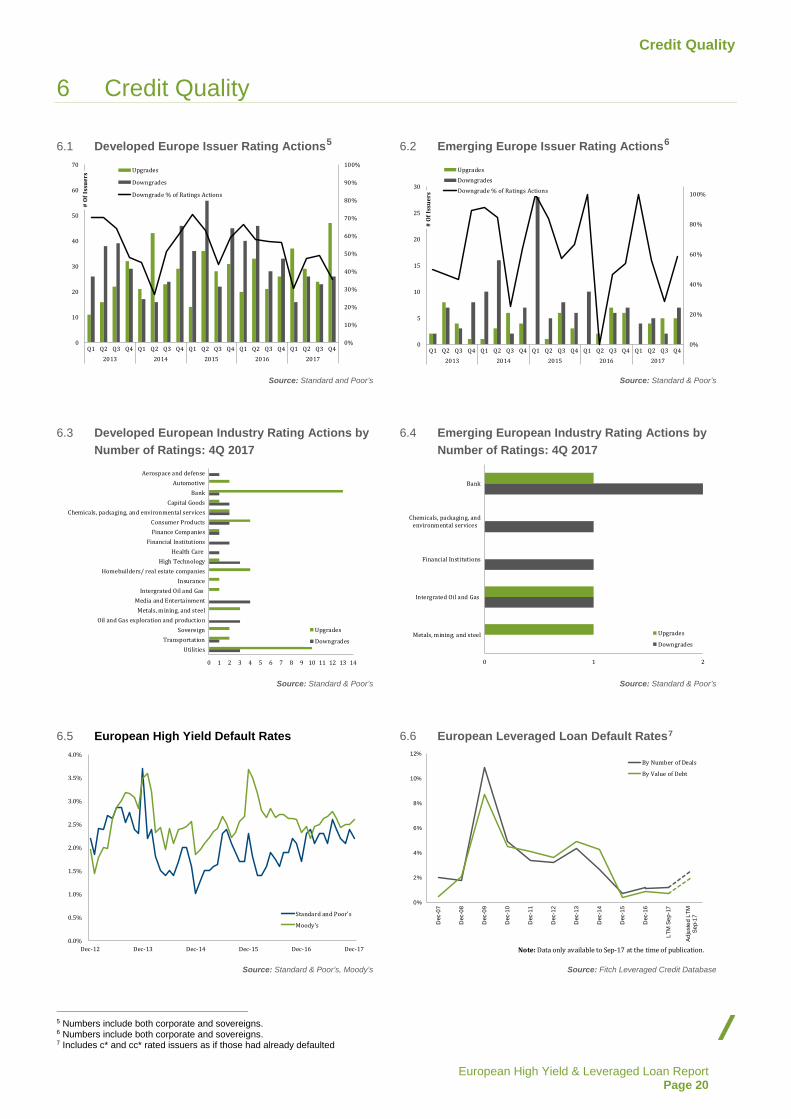
As of December 2017, S&P reported the trailing 12-month speculative-grade default rate at 2.2%, unchanged from 2.1% end-September 2017 and up from 1.7% end-December 2016.
Moody’s reported the trailing 12-month speculative-grade default rate in December 2017 to be 2.6%, up from 2.4% end-September 2017 and up from 2.3% end-September 2016.
Ten defaults were reported in the fourth quarter of 2017, with all but one from developed market Europe. For the full year 2017, 26 European high yield issuers defaulted, 22 in developed market Europe and the remaining four in emerging market Europe.
According to Standard and Poor’s, in 4Q’17 upgrades exceeded downgrades in developed market Europe (47 upgrades to 26 downgrades), a better ratio than 24 upgrades to 23 downgrades in 3Q’17 and a better ratio than in 4Q’16 (26 upgrades to 33 downgrades). In emerging market Europe, there were 5 upgrades and 7 downgrades by S&P in 4Q’17 compared to 5 upgrades and 2 downgrades in 3Q’17 and 6 upgrades and 7 downgrades in 4Q’16. Three sectors accounted for two-fifths of the rating actions in 4Q’17: banks (3 upgrades and 14 downgrades), utilities (3 upgrades and 10 downgrades) and consumer products (2 upgrades and 4 downgrades). For the full year 2017, upgrades exceeded downgrades in developed market Europe with 137 upgrades to 91 downgrades. In emerging market Europe, downgrades exceeded upgrades, with 14 upgrades to 18 downgrades. Combined, the number of upgrades increased to 151 in 2017 from 115 in 2016 while number of downgrades dropped sharply to 109 in 2017 from 170 in 2016 resulting in a much smaller downgrade to upgrade ratio in 2017.

Highlights and Market Environment
European High Yield & Leveraged Loan Report Page 8

Leveraged Finance Overview
European High Yield & Leveraged Loan Report Page 9
1 Leveraged Finance Overview
1.1 European Leveraged Issuance by Type 1.2 European Leveraged Issuance Percentage
Source: Dealogic, Thomson Reuters LPC Source: Dealogic, Thomson Reuters LPC
1.3 European Leveraged Average Deal Size 1.4 Bank Credit Standards1
Source: Dealogic, Thomson Reuters LPC Source: European Central Bank
1.5 Factors Affecting Bank Credit Standards: January 20182
1.6 European Leveraged Issuance Percentage3
Source: European Central Bank Source: European Central Bank
1 A positive net percentage number signifies tightening bank credit; a negative net percentage number signifies easing credit. 2 A positive net percentage signifies the factor contributed to tightening credit standards; a negative net percentage signifies the factor contributed to easing credit standards. 3 A positive net percentage signifies increased demand; a negative net percentage signifies decreased demand.
0
50
100
150
200
250
300
350
2016 2017
2008 2009 2010 2011 2012 2013 2014 2015 2016 2017 Q4
€ Bi
llion
s Leveraged LoansEurope Developed HYEurope EM HY
0%
10%
20%
30%
40%
50%
60%
70%
80%
90%
100%
2016 2017
2008 2009 2010 2011 2012 2013 2014 2015 2016 2017 Q4
Leveraged Loans
Europe Developed HY
Europe EM HY
0
100
200
300
400
500
600
700
800
900
2016 2017
2008 2009 2010 2011 2012 2013 2014 2015 2016 2017 Q4
€ M
illio
ns
Leveraged LoansEurope Developed HYEurope EM HY
-15
-10
-5
0
5
10
15
20
Jan-13 Jan-14 Jan-15 Jan-16 Jan-17 Jan-18
Net
Per
cent
age
SMELarge EnterprisesOverall
-15 -10 -5 0 5
Competition from Banks
Industry or Firm-Specific Outlook
General Economic Situation and Oulook
Competition from Non-Banks
Bank Access to Market Financing
Risk on Collateral Demanded
Bank Liquidity Position
Competition from Market Financing
Costs to Bank Capital Position
Bank's Risk Tolerance
Net Percentage -35
-25
-15
-5
5
15
25
35
Jan-13 Jan-14 Jan-15 Jan-16 Jan-17 Jan-18
Net
Per
cent
age
SMELarge EnterprisesOverall

Leveraged Finance Overview
European High Yield & Leveraged Loan Report Page 10
1.7 Factors Affecting Loan Demand: January 20184
Source: European Central Bank
1.8 Global Comparison – High Yield Issuance
Source: Dealogic
4 A positive net percentage signifies a factor that contributed to higher demand; a negative net percentage signifies a factor that contributed to lower demand.
-10 -5 0 5 10 15
Internal Financing
Loans from Non-Banks
Debt Issuance
Equity Issuance
Debt Restructuring
Loans from Other Banks
M&A, Restruturing
Inventories, Working Capital
Interest Rates
Fixed Investment
Net Percentage
€ Billions Q1 Q2 Q3 Q4 Full Year Q1 Q2 Q3 Q4 Full Year 2015 2014 2013 2012United States 64.2 48.2 49.0 48.8 210.2 33.71 54.22 49.38 38.27 175.6 191.5 185.2 196.8 214.8Asia Pacific 40.4 41.4 21.4 41.7 144.8 25.99 16.98 21.91 15.56 80.4 41.4 36.0 42.8 32.2Europe 36.7 34.6 19.4 38.5 129.1 10.57 32.50 23.94 15.06 82.1 97.8 112.4 101.1 65.6
2016 Prior Years2017

Issuance – Leveraged Loans
European High Yield & Leveraged Loan Report Page 11
2 Issuance – Leveraged Loans
2.1 European Leveraged Loan Issuance By Type 2.2 European Leveraged Loan Issuance by Industry
Source: Dealogic, Thomson Reuters LPC Source: Dealogic
2.3 Forward Pipeline of Leveraged Loan Market 2.4 ELLI Total Institutional Loans Outstanding
Source: Standard & Poor’s LCD Source: Standard & Poor’s LCD
2.5 ELLI Ratings Diversification 2.6 Institutional and Pro Rata Spreads
Source: Standard & Poor’s LCD Source: Dealogic, AFME, SIFMA
0
50
100
150
200
250
2016 2017
2008 2009 2010 2011 2012 2013 2014 2015 2016 2017 Q4
€ Bi
llion
s
Mezzanine
2nd Lien
1st Lien
0 1 2 3 4 5 6 7 8 9 10 11 12 13 14 15 16 17 18 19 20 21
TelecommunicationsComputers & Electronics
Real Estate/PropertyChemicalsPublishing
RetailProfessional Services
HealthcareInsurance
Food & BeverageAuto/Truck
FinanceMachinery
Consumer ProductsMetal & Steel
Construction/BuildingUtility & Energy
Dining & LodgingAerospace
TransportationLeisure & Recreation
€ Billions
0
5
10
15
20
25
30
35
40
45
50
55
Dec-12 Dec-13 Dec-14 Dec-15 Dec-16 Dec-17
€ Bi
llion
s Europe
US
0
20
40
60
80
100
120
140
160
2008 2009 2010 2011 2012 2013 2014 2015 2016 2017
€ Bi
llion
s
0%
10%
20%
30%
40%
50%
60%
70%
80%
90%
100%
2008 2009 2010 2011 2012 2013 2014 2015 2016 2017
NR
Other
B
BB
150
200
250
300
350
400
450
Dec-12 Jun-13 Dec-13 Jun-14 Dec-14 Jun-15 Dec-15 Jun-16 Dec-16 Jun-17 Dec-17
Basi
s Po
ints
Institutional
Pro Rata

Issuance – Leveraged Loans
European High Yield & Leveraged Loan Report Page 12
2.7 Mezzanine Spreads
Source: Dealogic, AFME, SIFMA
0
250
500
750
1,000
Dec-12 Jun-13 Dec-13 Jun-14 Dec-14 Jun-15 Dec-15 Jun-16 Dec-16 Jun-17 Dec-17
Basi
s Po
ints

Issuance – High Yield Bonds Overview
European High Yield & Leveraged Loan Report Page 13
3 Issuance – High Yield Bonds Overview
3.1 European High Yield Issuance 3.2 European High Yield Issuance by Sponsor
Source: Dealogic, Thomson Reuters LPC Source: Dealogic, Thomson Reuters LPC
3.3 European Corporate Bonds Outstanding (IG and HY only)
3.4 European Corporate Bonds HY Maturity Wall: December 2017
Source: Bloomberg, AFME, SIFMA Source: Bloomberg, AFME, SIFMA
3.5 European Corporate HY Bonds Outstanding By Sector: 4Q 2017
3.6 European Corporate HY Bonds Outstanding by Current Rating: December 2017
Source: Bloomberg, AFME, SIFMA Source: Bloomberg, AFME, SIFMA
0
50
100
150
200
250
300
350
0
20
40
60
80
100
120
140
2016 2017
2008 2009 2010 2011 2012 2013 2014 2015 2016 2017 Q4
# of
Dea
ls
€ Bi
llion
s Europe Emerging HY
Europe Developed HY
# of Deals (Right)
0%
10%
20%
30%
40%
50%
60%
70%
80%
90%
100%
2016 2017
2008 2009 2010 2011 2012 2013 2014 2015 2016 2017 Q4
Developed Corporate
Developed LBO
Emerging Corporate
Emerging LBO
0
1
2
3
4
5
6
Jun-13 Dec-13 Jun-14 Dec-14 Jun-15 Dec-15 Jun-16 Dec-16 Jun-17 Dec-17
€ Tr
illio
ns
High Yield
Investment Grade
0
10
20
30
40
50
60
70
80
90
100
2018 2020 2022 2024 2026 2028 2030 2032 2034 2036 2038
€ Bi
llion
s Financials
Non-Financials
Utilities5.1%
Technology2.3%
Materials10.2%
Industrials5.8%
Health Care1.4%
Governments0.9%
Financials33.0%
Energy8.9%
Consumer Staples4.6%
Consumer Discretionary
11.2%
Communications16.6%
0
50
100
150
200
250
300
BB+ BB BB- B+ B B- CCC+ CCC RemainingHY
€ Bi
llion
s

Issuance – High Yield Bonds Overview
European High Yield & Leveraged Loan Report Page 14
3.7 European Corporate Bond Issuance by Rating: 4Q 2017
3.8 European Corporate Bond Issuance by Tenor: 4Q 2017
Source: Dealogic, AFME, SIFMA Source: Dealogic, AFME, SIFMA
3.9 European HY Use of Proceeds
Source: Dealogic, AFME, SIFMA
0
5
10
15
20
25
Developed Emerging
€ Bi
llion
s B
BB
CCC
NA/NR
0
5
10
15
20
25
30
<5 Years 5 - 7 Years 8 - 10 Years 10+ Years Other
€ Bi
llion
s
0%
10%
20%
30%
40%
50%
60%
70%
80%
90%
100%
2016 2017
2008 2009 2010 2011 2012 2013 2014 2015 2016 2017 Q4
Other Restructuring Repay Debt/Refinancing
LBO/MBO General Corporate Purposes Acquisitions

Issuance – European Developed Market High Yield Bonds
European High Yield & Leveraged Loan Report Page 15
4 Issuance – European Developed Market High Yield Bonds
4.1 European Developed Market HY Bond Issuance 4.2 European Developed Market HY Issuance by Currency
Source: Dealogic, Thomson Reuters LPC Source: Dealogic, Thomson Reuters LPC
4.3 European Developed Market HY Issuance by Industry: 4Q 2017
4.4 European Developed Market HY Issuance by Country of Risk: 4Q 2017
Source: Dealogic Source: Dealogic
4.5 European Developed Market HY Issuance, Fixed vs. Floating
4.6 European Developed Market HY Issuance, Sponsored vs. Corporate
Source: Dealogic, Thomson Reuters LPC Source: Dealogic, Thomson Reuters LPC
0
50
100
150
200
250
300
0
20
40
60
80
100
120
2016 2017
2008 2009 2010 2011 2012 2013 2014 2015 2016 2017 Q4
# of
Dea
ls
€ Bi
llion
s
Europe Developed HY
# of Deals (Right)
0
20
40
60
80
100
120
2016 2017
2008 2009 2010 2011 2012 2013 2014 2015 2016 2017 Q4
€ Bi
llion
s
Other
GBP
USD
EUR
0.0 2.0 4.0 6.0 8.0 10.0 12.0 14.0
AgribusinessForestry & Paper
HealthcareConsumer Products
Dining & LodgingUtility & Energy
MachineryPublishing
Leisure & RecreationConstruction/Building
Auto/TruckChemicals
Oil & GasInsurance
Real Estate/PropertyFinance
Computers & ElectronicsMetal & Steel
Professional ServicesTransportation
RetailTelecommunications
€ Billions0.0 2.0 4.0 6.0 8.0 10.0 12.0 14.0
Finland
Bulgaria
Belgium
Denmark
Greece
Portugal
Luxembourg
Netherlands
Spain
Norway
Sweden
Switzerland
Germany
United Kingdom
France
Italy
€ Billions
0
20
40
60
80
100
120
2016 2017
2008 2009 2010 2011 2012 2013 2014 2015 2016 2017 Q4
€ Bi
llion
s Floating
Fixed
0
10
20
30
40
50
60
70
80
2016 2017
2008 2009 2010 2011 2012 2013 2014 2015 2016 2017 Q4
€ Bi
llion
s LBO
Corporate

Issuance – European Developed Market High Yield Bonds
European High Yield & Leveraged Loan Report Page 16
4.7 European Developed Market HY Rating Distribution at Issuance
4.8 European Developed Market Corporate Bonds Outstanding: 4Q 2017
Source: Dealogic, AFME, SIFMA Source: Bloomberg, AFME, SIFMA
0%
10%
20%
30%
40%
50%
60%
70%
80%
90%
100%
Q1 Q2 Q3 Q4 Q1 Q2 Q3 Q4 Q1 Q2 Q3 Q4 Q1 Q2 Q3 Q4 Q1 Q2 Q3 Q4
2013 2014 2015 2016 2017
NA/NR
CCC
B
BB
0.0
0.5
1.0
1.5
2.0
2.5
3.0
3.5
4.0
4.5
5.0
Developed Europe
€ Tr
illio
ns
Investment GradeHigh YieldNon-Rated

Issuance – European Developed Market High Yield Bonds
European High Yield & Leveraged Loan Report Page 17
4.9 European Developed Market HY Bond Issuance
Source: Dealogic
Issuer Industry Group Date CurrencyAmount
(Millions) Coupon Moodys S&P Fitch3AB Optique Developpement SAS Retail 06/10/2017 EUR 175 3M EURIBOR +412.5 B3 B B+
EUR 250 4.000 B3 B B+ADLER Real Estate AG Real Estate/Property 29/11/2017 EUR 300 2.125 NA BB+ NA
EUR 500 1.5 NA BB+ NAAltice Finco SA Telecommunications 05/10/2017 EUR 675 4.750 B3 B- NAAnglian Water (Osprey) Financing plc Utility & Energy 01/12/2017 GBP 240 4 Ba3 NA BB+ArcelorMittal SA Metal & Steel 28/11/2017 EUR 500 0.950 Ba1 BB+ BB+Arena Luxembourg Finance SARL Transportation 11/10/2017 EUR 125 3M EURIBOR +275 Ba3 NA NA
EUR 350 2.875 Ba3 NA NAB2Holding ASA Finance 02/11/2017 EUR 200 3M EURIBOR +425 NA NA NABanca IFIS SpA Finance 10/10/2017 EUR 400 4.500 NA NA BBBorealis Finance LLC Transportation 16/11/2017 USD 150 7.5 NA NA NABormioli Pharma Bidco Srl Consumer Products 02/11/2017 EUR 280 3M EURIBOR +350 B2 B NABurger King France SAS Dining & Lodging 07/12/2017 EUR 60 3M EURIBOR +525 B3 NA NACattolica Assicurazioni Insurance 05/12/2017 EUR 500 4.25 NA BB+ NACBR Fashion Finance BV Retail 25/10/2017 EUR 450 5.125 B2 B NACMA CGM SA Transportation 17/10/2017 EUR 500 5.250 B3 NA NA
06/11/2017 EUR 250 5.25 B3 B- NACoastal Holding AS (Startup 126 17 AS) Transportation 30/10/2017 NOK 400 3M Other +400 NA NA NACodic International SA Real Estate/Property 23/11/2017 EUR 35 4.25 NA NA NAConstellium NV Metal & Steel 02/11/2017 EUR 400 4.25 B3 B- NA
USD 500 5.875 B3 B- NACooperativa Muratori & Cementisi CMC di Ravenna Construction/Building 08/11/2017 EUR 325 6 B2 B NACrystal Almond SARL Telecommunications 04/12/2017 EUR 95 10 NA B BCTC Bondco GmbH Machinery 30/11/2017 EUR 406 5.25 Caa2 CCC+ CCC+eDDM Debt AB Finance 01/12/2017 EUR 50 8 NA NA NADufry One BV Retail 10/10/2017 EUR 800 2.500 Ba2 BB NAEC Finance plc Transportation 18/10/2017 EUR 350 2.375 B1 BB NAEurohold Bulgaria AD Sofia Finance 30/11/2017 EUR 70 6.5 NA NA BEuropcar Drive DAC Transportation 18/10/2017 EUR 600 4.125 B3 B- NAFortuna Midco Ltd Insurance 15/12/2017 USD 350 6M Libor +575 NA NA NAGhelamco Invest NV Real Estate/Property 15/11/2017 EUR 47 4.3 NA NA NA
EUR 54 4.8 NA NA NAGlobal Ship Lease Inc Finance 23/10/2017 USD 360 9.875 B3 B B-GLX Holding AS Computers & Electronics 01/12/2017 NOK 1,350 3M Other +525 NA NA NAGreenalia SA Utility & Energy 31/10/2017 EUR 6 6.75 NA NA NAGruppo Pro-Gest SpA Forestry & Paper 07/12/2017 EUR 250 3.25 B2 BB- NAHaya Finance 2017 SA Real Estate/Property 09/11/2017 EUR 225 3M EURIBOR +512.5 B3 B- NA
EUR 250 5.25 B3 B- NAHI Bidco AS Finance 30/10/2017 NOK 350 3M Other +800 NA NA NA
NOK 1,000 3M Other +550 NA NA NAHospitality Invest AS Real Estate/Property 18/10/2017 NOK 850 3M Other +600 NA NA NAIdavang A/S Agribusiness 23/11/2017 EUR 85 3M EURIBOR +650 NA NA NAIHS Markit Ltd Publishing 28/11/2017 USD 500 4 Ba1 BB+ BBBINEOS Finance plc Chemicals 25/10/2017 EUR 550 2.125 Ba1 BB+ BBB-Inter Media Communication Srl Professional Services 14/12/2017 EUR 300 4.875 NA BB- NAInternational Personal Finance plc Finance 18/12/2017 EUR 12 5.75 NA NA BB+Jaguar Land Rover Automotive plc Auto/Truck 04/10/2017 USD 500 4.500 Ba1 BB+ NAKistefos AS Finance 31/10/2017 NOK 600 3M Other +600 NA NA NALendify Sweden 1 AB Finance 05/10/2017 SEK 100 3M Other +500 NA NA NAMatterhorn Telecom Holding SA Telecommunications 14/11/2017 EUR 400 4 NR B NANaviera Armas SA Transportation 10/11/2017 EUR 300 3M EURIBOR +425 B1 BB- NANavios Maritime Holdings Inc Transportation 14/11/2017 USD 305 11.25 NA NA NANewCo GB SAS Dining & Lodging 07/12/2017 EUR 200 8 B3e CCC NAOkea AS Oil & Gas 30/10/2017 USD 120 7.5 NA NA NAOPR-Vakuus Oy Finance 10/11/2017 EUR 40 10.75 NA NA NAOrexo AB Healthcare 30/10/2017 SEK 325 3M Other +450 NA NA NAOrpea SA Healthcare 05/12/2017 EUR 63 2.2 NA NA NAPerstorp Holding AB Chemicals 06/12/2017 EUR 250 3M EURIBOR +425 B3 B- NAPicard Bondco SA Retail 06/12/2017 EUR 310 5.5 Caa1 B- CCC+Picard Groupe SAS Retail 06/12/2017 EUR 1,190 3M EURIBOR +300 B2 B+ B+Pinewood FinCo plc Leisure & Recreation 29/11/2017 GBP 250 3.75 Ba2 BB BB+Pioneer Holding LLC Professional Services 16/10/2017 USD 280 9.000 NA CCC+ NAPlatin 1426 GmbH Computers & Electronics 07/12/2017 EUR 425 5.375 B3 B NAPrague CE SARL Chemicals 06/12/2017 EUR 234 10 NA CCC- NARaffinerie Heide GmbH Oil & Gas 24/11/2017 EUR 250 6.375 B3 B NARexel SA Computers & Electronics 06/11/2017 EUR 500 2.125 Ba3 BB- BBSafari Holding Verwaltungs GmbH Leisure & Recreation 01/12/2017 EUR 350 5.375 B2 B NASaipem Finance International BV Oil & Gas 27/10/2017 EUR 500 2.625 Ba1 BB+ NASalini Impregilo SpA Construction/Building 19/10/2017 EUR 500 1.75 NA BB+ NAScatec Solar AS Utility & Energy 31/10/2017 NOK 750 3M Other +475 NA NA NAShop Direct Funding plc Computers & Electronics 27/10/2017 GBP 550 7.75 B2 NA B+Star Bulk Carriers Corp Transportation 02/11/2017 USD 50 8.3 NA NA NATakko Luxembourg 2 SCA Retail 26/10/2017 EUR 225 3M EURIBOR +537.5 B2 B NA
EUR 285 5.375 B2 B NATelecom Italia SpA Telecommunications 05/10/2017 EUR 1,250 2.375 Ba1 BB+ BBB-Telenet Finance Luxembourg Notes SARL Telecommunications 29/11/2017 EUR 600 3.5 Ba3 BB- BB
USD 1,000 5.5 Ba3 BB- BBThomas Cook Finance 2 plc Professional Services 30/11/2017 EUR 400 3.875 B1 B BB-Tikehau Capital SCA Finance 20/11/2017 EUR 300 3 NA NA NATVL Finance plc Dining & Lodging 18/12/2017 GBP 30 3M LIBOR +487.5 B3 B- NAUnilabs SubHolding AB Healthcare 06/10/2017 EUR 155 5.750 Caa1 CCC+ NAUnipol Gruppo SpA Insurance 21/11/2017 EUR 500 3.5 Ba2 BB+e NAUPC Holding BV Telecommunications 13/10/2017 USD 550 5.500 B2 NA BVallourec SA Metal & Steel 11/10/2017 EUR 400 6.625 Ba1 B NA
23/10/2017 EUR 150 6.625 NA B NAVerisure MidHolding AB Professional Services 15/11/2017 EUR 980 5.75 Caa1 CCC+ NA
SEK 1,650 3M Other +575 NA CCC+ NAVolvo Car AB Auto/Truck 17/11/2017 EUR 500 2 Ba2 BB+ NAWelltec A/S Oil & Gas 17/11/2017 USD 340 9.5 B2 B- NAWind Tre SpA Telecommunications 24/10/2017 EUR 1,625 2.625 B1 BB- BB
EUR 1,750 3.125 B1 BB- BBEUR 2,250 3M EURIBOR +275 B1 BB- BBUSD 2,000 5 B1 BB- BB

Issuance – European Emerging Market High Yield Bonds
European High Yield & Leveraged Loan Report Page 18
5 Issuance – European Emerging Market High Yield Bonds
5.1 European Emerging Market HY Bond Issuance 5.2 European Emerging Market HY Bond Issuance by Currency
Source: Dealogic, Thomson Reuters LPC Source: Dealogic, Thomson Reuters LPC
5.3 European Emerging Market HY Issuance by Industry: 4Q 2017
5.4 European Emerging Market HY Issuance by Country of Risk: 4Q 2017
Source: Dealogic Source: Dealogic
5.5 European Emerging Market HY Issuance, Fixed vs. Floating
5.6 European Emerging Market HY Issuance, Sponsored vs. Corporate
Source: Dealogic, Thomson Reuters LPC Source: Dealogic, Thomson Reuters LPC
0
10
20
30
40
50
60
0
5
10
15
20
25
30
2016 2017
2008 2009 2010 2011 2012 2013 2014 2015 2016 2017 Q4
# of
Dea
ls
€ Bi
llion
s
Europe Emerging HY
# of Deals (Right)
0
5
10
15
20
25
30
2016 2017
2008 2009 2010 2011 2012 2013 2014 2015 2016 2017 Q4
€ Bi
llion
s Other
GBP
USD
EUR
0.0 0.5 1.0
Retail
Utility & Energy
Mining
Real Estate/Property
Finance
Oil & Gas
€ Billions0.0 0.5 1.0 1.5
Belarus
CzechRepublic
RussianFederation
Turkey
€ Billions
0
5
10
15
20
25
30
2016 2017
2008 2009 2010 2011 2012 2013 2014 2015 2016 2017 Q4
€ Bi
llion
s Floating
Fixed
0
5
10
15
20
25
2016 2017
2008 2009 2010 2011 2012 2013 2014 2015 2016 2017 Q4
€ Bi
llion
s
LBO
Corporate

Issuance – European Emerging Market High Yield Bonds
European High Yield & Leveraged Loan Report Page 19
5.7 European Emerging Market HY Rating Distribution at Issuance
5.8 European Emerging Market Corporate Bonds Outstanding: 4Q 2017
Source: Dealogic, AFME, SIFMA Source: Bloomberg, AFME, SIFMA
5.9 European Emerging Market HY Bond Issuance
Source: Dealogic
0%
10%
20%
30%
40%
50%
60%
70%
80%
90%
100%
Q1 Q2 Q3 Q4 Q1 Q2 Q3 Q4 Q1 Q2 Q3 Q4 Q1 Q2 Q3 Q4 Q1 Q2 Q3 Q4
2013 2014 2015 2016 2017
NA/NR
CCC
B
BB
0
50
100
150
200
250
Emerging Europe
€ Bi
llion
s Investment Grade
High Yield
Non-Rated
Issuer Industry Group Date CurrencyAmount
(Millions) Coupon Moodys S&P FitchAlfa Bank OAO Finance 13/07/2017 RUB 10,000 8.900 Ba2 BB+Gazprom OAO Oil & Gas 13/07/2017 CHF 500 2.250 Ba1 BB+ BBB-United Group BV Telecommunications 13/07/2017 EUR 575 4.375 B2 B
EUR 450 3M EURIBOR +437.5 B2 BEUR 325 4.875 B2 B
Nostrum Oil & Gas Finance BV Oil & Gas 17/07/2017 USD 725 8.000 B2 BPromsvyazbank OAO Finance 26/07/2017 USD 500 8.750 NA NA NARZD Capital Ltd Transportation 14/09/2017 CHF 450 2.100 Ba1 BBB-RusHydro OAO Utility & Energy 22/09/2017 RUB 20,000 8.125 Ba1 BB+ BB+TC Ziraat Bankasi AS Finance 25/09/2017 USD 500 5.125 Ba1 BB+SIBUR Securities Ltd Chemicals 29/09/2017 USD 500 4.125 Ba1 BB+
Credit Quality
European High Yield & Leveraged Loan Report Page 20
6 Credit Quality
6.1 Developed Europe Issuer Rating Actions5 6.2 Emerging Europe Issuer Rating Actions6
Source: Standard and Poor’s Source: Standard & Poor’s
6.3 Developed European Industry Rating Actions by Number of Ratings: 4Q 2017
6.4 Emerging European Industry Rating Actions by Number of Ratings: 4Q 2017
Source: Standard & Poor’s Source: Standard & Poor’s
6.5 European High Yield Default Rates 6.6 European Leveraged Loan Default Rates7
Source: Standard & Poor’s, Moody’s Source: Fitch Leveraged Credit Database
5 Numbers include both corporate and sovereigns. 6 Numbers include both corporate and sovereigns. 7 Includes c* and cc* rated issuers as if those had already defaulted
0%
10%
20%
30%
40%
50%
60%
70%
80%
90%
100%
0
10
20
30
40
50
60
70
Q1 Q2 Q3 Q4 Q1 Q2 Q3 Q4 Q1 Q2 Q3 Q4 Q1 Q2 Q3 Q4 Q1 Q2 Q3 Q42013 2014 2015 2016 2017
# O
f Iss
uers
Upgrades
Downgrades
Downgrade % of Ratings Actions
0%
20%
40%
60%
80%
100%
0
5
10
15
20
25
30
Q1 Q2 Q3 Q4 Q1 Q2 Q3 Q4 Q1 Q2 Q3 Q4 Q1 Q2 Q3 Q4 Q1 Q2 Q3 Q42013 2014 2015 2016 2017
# O
f Iss
uers
UpgradesDowngradesDowngrade % of Ratings Actions
0 1 2 3 4 5 6 7 8 9 10 11 12 13 14
Aerospace and defenseAutomotive
BankCapital Goods
Chemicals, packaging, and environmental servicesConsumer ProductsFinance Companies
Financial InstitutionsHealth Care
High TechnologyHomebuilders/ real estate companies
InsuranceIntergrated Oil and Gas
Media and EntertainmentMetals, mining, and steel
Oil and Gas exploration and productionSovereign
TransportationUtilities
Upgrades
Downgrades
0 1 2
Bank
Chemicals, packaging, andenvironmental services
Financial Institutions
Intergrated Oil and Gas
Metals, mining, and steel Upgrades
Downgrades
0.0%
0.5%
1.0%
1.5%
2.0%
2.5%
3.0%
3.5%
4.0%
Dec-12 Dec-13 Dec-14 Dec-15 Dec-16 Dec-17
Standard and Poor's
Moody's
0%
2%
4%
6%
8%
10%
12%
Dec
-07
Dec
-08
Dec
-09
Dec
-10
Dec
-11
Dec
-12
Dec
-13
Dec
-14
Dec
-15
Dec
-16
LTM
Sep
-17
Adju
sted
LTM
Sep-
17
By Number of Deals
By Value of Debt
Note: Data only available to Sep-17 at the time of publication.

Credit Quality
European High Yield & Leveraged Loan Report Page 21
6.7 Mezzanine and Senior Loan Default Rate 6.8 Mezzanine and Senior Loan Recovery Rates
Source: Fitch Leveraged Credit Database Source: Fitch Leveraged Credit Database
6.9 High-Yield bond CDS spreads vs. liquidity-stress index and HY bonds rated B3 neg and lower in Europe
Source: Moody’s
6.10 European Defaults
Source: Standard & Poor’s, Moody’s
0%
1%
2%
3%
4%
5%
6%
7%
8%
9%
10%
11%
Dec-07 Dec-08 Dec-09 Dec-10 Dec-11 Dec-12 Dec-13 Dec-14 Dec-15 Dec-16 LTMSep-17
Mezzanine Loans
Senior Loans
Note: Data only available to Sep-17 at the time of publication; there were no mezzaninedefaults or mezzanine loans outstanding in LTM Sep-17.
0%
10%
20%
30%
40%
50%
60%
70%
80%
90%
100%
Dec-07 Dec-08 Dec-09 Dec-10 Dec-11 Dec-12 Dec-13 Dec-14 Dec-15 Dec-16 LTMSep-17
Mezzanine Loans
Senior Loans
Note: Data only available to Sep-17 at the time of publication; there were no mezzaninedefaults or mezzanine loans outstanding in LTM Sep-17.
0%
2%
4%
6%
8%
10%
12%
14%
16%
18%
20%
0
100
200
300
400
500
600
700
800
900
1,000
Dec-12 Dec-13 Dec-14 Dec-15 Dec-16 Dec-17
CDS Spread (lhs)
Liquidity Stress-Index (rhs)
% B3 Neg or Lower (rhs)
Issuer Industry Group Country Date Reported By ReasonPinnacle Holdco S.a.r.l. High Technology Luxembourg October 2017 S&P Missed interest paymentBrunswick Rail Limited Transportation Russia October 2017 Moody's Distressed ExchangePacific Drilling S.A. Oil and gas Luxembourg November 2017 S&P, Moody's Chapter 11Pacific Drilling V Ltd. Oil and gas Luxembourg November 2017 Moody's BankruptcyBank RBK JSC Bank Kazakhstan November 2017 S&P Distressed exchangeSterling Mid-Holdings Ltd. Finance companies Jersey November 2017 S&P Distressed exchangeBibby Offshore Holdings Ltd. Oil and gas U.K. December 2017 S&P, Moody's Distressed exchangeElli Investments Ltd. Health care U.K. December 2017 S&P Missed interest paymentExpro Holdings U.K. 3 Ltd. Oil and gas U.K. December 2017 Moody's BankruptcyBibby Offshore Services Plc Oil and gas U.K. December 2017 Moody's Bankruptcy

Relative Value and Total Return
European High Yield & Leveraged Loan Report Page 22
7 Relative Value and Total Return
7.1 Relative value: European HY Bonds, Cash vs. Synthetic
7.2 European HY Bond Total Return
Source: Thomson Reuters Eikon, Markit Source: BAML
7.3 European Leveraged Loan Total Return 7.4 Asset Class Total Return, 4Q 2017
Source: Standard & Poor’s LCD Source: BAML , Bloomberg
0
20
40
60
80
100
120
140
160
180
200
220
0
100
200
300
400
500
600
700
800
Jan-13 Jan-14 Jan-15 Jan-16 Jan-17
Spre
ad,
Basi
s Po
ints
Basi
s Po
ints
HY Spread (right)
iBoxx EUR HY (left)
iTraxx XO 5Y (left)
-40%
-20%
0%
20%
40%
60%
80%
2008 2009 2010 2011 2012 2013 2014 2015 2016 2017 2017 Q4
-40%
-30%
-20%
-10%
0%
10%
20%
30%
40%
50%
2008 2009 2010 2011 2012 2013 2014 2015 2016 2017 2017 Q4
ELLI
ELLI (EUR-denominated only)
0% 1% 2% 3% 4% 5% 6% 7% 8%
MCSI EMS&P 500
Russell 2000Euro HY CCC and Lower Rated
Euro Fallen Angel HYU.S. Corporates
Global Fallen Angel HYEuro HY BB rated
U.S. MunicipalEuro High Yield
EMU Financial CorporatesS&P ELLI
U.S. HYU.S. ABS/MBS
EMU Covered BondsEMU ABS/MBS
U.S. Mortgages 30YU.S. Treasuries
Euro HY B RatedU.S. HY Distressed

Summary of the Methodologies Adopted for this Report
European High Yield & Leveraged Loan Report Page 23
Summary of the Methodologies Adopted for this Report 1. Leveraged Issuance – Overview 1.1. – 1.3. Leveraged Loans and High Yield Bonds Leveraged loan data are sourced from Thomson Reuters LPC and Dealogic.
Leveraged loan data from Thomson Reuters LPC are defined primarily as having sub-investment grade ratings and/or a margin spread minimum of 200 basis points (spread minimums will vary from year to year to make Thomson LPC’s cutoff). Leveraged loan aggregates will include first lien, second lien, and mezzanine financing. Discrepancies in Thomson Reuters LPC data are due to rounding and/or currency rate of exchange.
Leveraged loan data from Dealogic are defined primarily as coming from a leveraged or highly leveraged European deal; loan tranches must have sub-investment grade ratings, or, if unrated, a margin spread minimum of 125 basis points over a benchmark (e.g., Euribor, LIBOR). Under these guidelines, sub-investment grade-rated loans with a margin spread of less than 125 basis points are included. Deals must be European and are inclusive of both developed and emerging market Europe as defined in high yield criteria in Section 3. Deals must also be marketed either in Europe or in the United States. Loans not EUR-denominated are converted to EUR as of credit date for purposes of aggregation. Aggregates include new money as well as non-new money deals.
Criteria for high yield bond transactions can be found in Section 3, 4, and 5.
1.4. – 1.7. Bank Lending Surveys Data for loan demand and credit standards are sourced from the ECB’s bank lending survey. Graph numbers are net percentages of reporting banks.
1.8. Global Comparison – High Yield Issuance Data for global high yield issuance are sourced from Dealogic. Asian deals are inclusive of Japan and Australia.
2. Issuance – Leveraged Loans 2.1. – 2.2. Leveraged Loan Issuance Leveraged loan issuance data are sourced primarily from Dealogic and Thomson Reuters LPC. For more details on qualifying criteria, please refer to section 1.
2.3. Forward Pipeline of Leveraged Loan Market Forward leveraged loan pipeline data are sourced from S&P LCD.
2.4. S&P ELLI Total Institutional Loans Outstanding Total institutional loan outstanding data are sourced from S&P LCD and are outstanding loans in the S&P ELLI index.
2.5. S&P ELLI Ratings Diversification S&P ELLI ratings diversification are the percentages of currently outstanding loans in S&P’s ELLI index that are rated accordingly. Data are provided by S&P LCD.
2.6. – 2.7. Loan Spreads Loan spread data are sourced from Dealogic under our criteria for leveraged loans (see Section 1). For purposes of loan spread calculations, deals marketed in the US are excluded. Spreads are a weighted average of spread margin on new leveraged issuance on a rolling twelve months basis, and are typically benchmarked to LIBOR or EURIBOR. Institutional loan spread data are inclusive of 2nd lien; pro rata spreads include all revolvers and term loan A (Tla).
3. Issuance – High Yield Bonds Overview High yield bond transactions are sourced primarily from Dealogic, with supplemental information sourced from Bloomberg. High yield transactions are defined as transactions with a Dealogic “effective” rating of equal or less than BB+, and may include unrated transactions based on issuer and desk notes. Split-junk rated transactions are generally excluded.
European issuance, inclusive of both emerging market Europe and developed market Europe, are defined as an issue having a Dealogic “deal nationality” as well as “nationality of risk” within Europe issued in the euro, foreign, and global markets; deals marketed locally are excluded. Sovereign, sub-sovereign, and supranational parent issuers are excluded from issuance, as well as ABS/MBS issuers.
Emerging market Europe and developed market European issuance are defined by nationality of risk, rather than nationality of deal, and although primarily sourced from Dealogic, are ultimately subject to AFME’s discretion. Emerging and developed market issuances are mutually exclusive and will contain no overlap unless otherwise mentioned.

Summary of the Methodologies Adopted for this Report
European High Yield & Leveraged Loan Report Page 24
European emerging market bonds are further defined with having a minimum deal size of €75.0 million; deals on the same day from the same issuer are aggregated for the purpose of meeting this minimum. Deals are shown in EUR amount but include deals originated in other currencies and are converted to EUR at the exchange rate on the day of the deal. Russian ruble (RUB)-denominated issuance are excluded due to differences in terms and documentation; as of 4Q’10 this criteria no longer applies and may be included on a case by case basis.
3.2. European HY Issuance by Sponsor Data for high yield issuance by sponsor are sourced from Dealogic. LBO deals are defined as all high yield transactions whose issuer parent is a public or private finance entity (i.e., a financial sponsor), regardless of use of proceeds.
3.3. – 3.6. European Corporate Bonds Outstanding Data for European corporate outstanding are sourced from Bloomberg and AFME/SIFMA estimates. Criteria for European corporate bonds are: bonds must be placed in the domestic, euro, foreign and global markets with nationality of incorporation from a European developed or emerging market country as defined by AFME. Corporate bonds exclude non-Bloomberg verified securities, all structured notes, covered bonds, warrants, deposit notes, receipts, and certificates of deposit. All currencies are included and have been converted to EUR at time of pricing and/or issue.
High-yield ratings are sourced from Bloomberg’s composite rating, which is an average of all available ratings from four rating agencies: Moody’s, Standard and Poor’s, Fitch Ratings, or DBRS. Split-rated securities may be included in high yield numbers due to this.
Corporate bonds outstanding include certain securities that may be considered corporate securitisations or structured finance securities; while all effort is made to exclude the latter, the former will be counted toward the corporate bonds outstanding total, and will subsequently overlap to some extent to AFME structured finance outstanding numbers. Excludes unrated securities.
3.7. European Corporate Bond Issuance by Rating Data for HY issuance by rating are sourced from Dealogic, Bloomberg, and the three rating agencies. The composite rating is determined by the lowest
rating assigned by either Moody’s, Standard and Poor’s, or Fitch Ratings.
3.8. European Corporate Bond Issuance by Tenor Data for HY issuance by tenor are sourced from Dealogic. “Other” includes perpetuals.
3.9. European HY Issuance By Use of Proceeds Data for HY issuance by use of proceeds are sourced from Dealogic and aggregated for the purposes of this calculation. Please refer to Section 3 for criteria on high yield issue inclusion.
4. Issuance – European Developed Market High Yield Bonds 4.1. – 4.7., 4.9 European Developed Market HY Bond Issuance High yield bond issuance data are sourced from Dealogic. For further criteria on how high yield issuance are defined, please refer to section 3.
Developed European issuance are deals predominantly from western Europe and includes deals from Andorra, Austria, Belgium, Bulgaria, Cyprus, Switzerland, Germany, Denmark, Spain, Estonia, Finland, France, Faroe Islands, United Kingdom, Guernsey, Gibraltar, Greenland, Greece, Isle of Man, Ireland, Iceland, Italy, Jersey, Liechtenstein, Luxembourg, Monaco, Malta, Montenegro, Netherlands, Norway, Portugal, San Marino, and Sweden.
4.8. European Developed Market Corporate Bonds Outstanding Data for corporate bonds outstanding are sourced from Bloomberg. Please refer to Section 3 for criteria and methodology.
5. Issuance – European Emerging Market High Yield Bonds 5.1. – 5.7., 5.9. European Emerging Market HY Bond Issuance High yield bond issuance data are sourced from Dealogic. Criteria for all high yield issuance are found in section 3.
Emerging market European issuance deals are predominantly from Eastern Europe but will also additionally include Turkey, the Russian Federation, Kazakhstan, Turkmenistan, Uzbekistan, Tajikistan, Azerbaijan, and Kyrgyzstan. Certain sub-investment grade countries are not included in the emerging market total, including, among others, Iceland and Greece.

Summary of the Methodologies Adopted for this Report
European High Yield & Leveraged Loan Report Page 25
5.8. European Emerging Market Corporate Bonds Outstanding Data for corporate bonds outstanding are sourced from Bloomberg. Please refer to Section 3 for criteria and methodology.
6. Credit Quality 6.1. – 6.2. European Issuer Rating Actions European issuer upgrades and downgrades are sourced from S&P. The breakdown by emerging market and developed Europe are from AFME’s definition of developed and emerging markets and would be, under S&P’s guidelines, a combination of both European and EMEA rating actions. Multiple downgrades of a single issuer are counted separately. Rating actions are inclusive of both corporate (both credit and merger-related) as well as sovereign ratings.
6.3. – 6.4. European Issuer Rating Actions by # of Ratings Rating actions are sourced from S&P. Breakdown by emerging market and developed Europe are from AFME’s definition of developed and emerging markets and would be, under S&P’s guidelines, a combination of both European and EMEA rating actions. 6.5. European High Yield Default Rate European HY bond default rates are sourced from Standard and Poor’s and Moody’s, calculated on a trailing 12 month basis.
“Europe” for the S&P default rate is defined to include Austria, Belgium, Bulgaria, Channel Islands, Cyprus, Czech Republic, Denmark, Estonia, Finland, France, Germany, Greece, Hungary, Iceland, Ireland, Italy, Latvia, Lithuania, Luxembourg, Malta, Netherlands, Norway, Poland, Portugal, Slovak Republic, Slovenia, Spain, Sweden, Switzerland and the United Kingdom. Countries are subject to revision.
6.6. – 6.7. European Leveraged Loan Default Rate European LL default rates are sourced from Fitch Leveraged Credit Database, calculated on a trailing 12 month basis.
6.8. Leveraged Loan Recovery Rates European LL recovery rate are sourced from Fitch Leveraged Credit Database, calculated on a trailing 12 month basis. Recovery rates are based on median cash realised (cash or cash-pay debt received) recoveries for senior loans and on average cash realised recoveries (excluding any equity/warrants given in a debt exchange) for mezzanine loans.
6.9. HY CDS spreads vs. liquidity-stress index and HY bonds rated B3 negative and lower in Europe The liquidity stress index is calculated by Moody’s Investor Services as the percentage of speculative grade companies with the weakest liquidity profile in EMEA. Speculative grade liquidity is categorised in one of four ways: SGL 1: Very good liquidity. Most likely to meet obligations over the coming 12 months through internal resources without relying on external sources of committed financing. SGL 2: Good liquidity. Likely to meet obligations during the coming 12 months through internal resources but may rely on external sources of committed financing. The issuer’s ability to access committed financing is highly likely, based on Moody’s evaluation of near term covenant compliance. SGL3: Adequate liquidity. Expected to rely on external sources of committed financing. Based on Moody’s evaluation of near term covenant compliance there is only a modest cushion, and the issuer may require covenant relief in order to maintain orderly access to funding lines. SGL4: Weak liquidity. Relies on external sources of financing and the availability of that financing is, in Moody’s opinion, highly uncertain. The percentage of bonds rated B3 negative or lower is sourced from Moody’s
6.10. European Defaults Defaults reported by either Moody’s or Standard and Poor’s in the European bond markets and loan markets, when available.
7. Cash and Synthetic 7.1. Loans and Bonds, Cash and Synthetic Data are sourced from Markit and Thomson Reuters LPC. High yield bond cash and synthetic spreads from Markit; European leveraged loan cash bid prices from Thomson Reuters LPC, and European leveraged loans synthetic prices from Markit.
7.2. European HY Bond Total Return European HY bond total return data are sourced from the Bank of America-Merrill Lynch’s Euro High Yield Index (HE00). The index tracks the performance of EUR-denominated below-investment-grade corporate debt publicly issued in the euro domestic or Eurobond markets. Qualifying securities must have a below-investment-grade rating and an investment-grade rated country of risk. Qualifying securities must have at least one year remaining term to maturity, fixed coupon schedule and minimum amount outstanding of €100 million. Original issue zero coupon bonds,

Summary of the Methodologies Adopted for this Report
European High Yield & Leveraged Loan Report Page 26
“global securities” (debt issued simultaneously in the Eurobond and euro domestic markets), 144a securities and pay-in-kind securities, including toggle notes, qualify for inclusion in the index. Callable perpetual securities qualify provided they are at least one year from the first call date. Fixed-to-floating rate securities also qualify provided they are callable within the fixed rate period and are at least one year from the last call prior to the date the bond transitions from a fixed to a floating rate security. Defaulted, warrant-bearing and euro legacy currency securities are excluded from the index.
7.3. European Leveraged Loan Total Return Total return data are provided by S&P LCD and are total returns from S&P’s ELLI index, both ELLI and EUR-denominated ELLI. Total returns for ELLI EUR-denominated data are unavailable for 2003 and 2004.
7.4. Asset Class Total Return (Cash Basis) Total returns are sourced from respective index owners and Bank of America-Merrill Lynch’s indices.

Annex
European High Yield & Leveraged Loan Report Page 27
Annex Disclaimer Your receipt of this document is subject to paragraphs 3, 4, 5, 9, 10, 11 and 13 of the Terms of Use which are applicable to AFME’s website (available at http://www.afme.eu/Legal/Terms-of-Use.aspx) and, for the purposes of such Terms of Use, this document shall be considered a “Material” (regardless of whether you have received or accessed it via AFME’s website or otherwise).

European High Yield & Leveraged Loan Report Page 28
London Office 39th Floor 25 Canada Square London E14 5LQ United Kingdom
Brussels Office Rue de la Loi, 82 1040 Brussels Belgium
Frankfurt Office Skyper Villa Taunusanlage 1 60329 Frankfurt am Main Germany
Switchboard: +44 (0)20 3828 2700
Switchboard: +32 (0) 2 788 3971
Switchboard: +49 (0) 69 5050 60 590
AFME Gary Simmons – Managing Director, High Yield Julio Suarez – Associate Director, Research
SIFMA Kyle Brandon – Managing Director, Director of Research Justyna Podziemska – Assistant Vice President, Research
www.afme.eu
www.sifma.org
Follow AFME on Twitter @AFME_EU
AFME is registered on the EU Transparency Register, registration number 65110063986-76