european immigrants in the uk before and after the...
TRANSCRIPT
European immigrants in the UK before and
after the 2004 enlargement: Is there a
change in immigrant self-selection?
Simonetta Longhi and Magdalena Rokicka
NORFACE MIGRATION Discussion Paper No. 2012-30
www.norface-migration.org

1
European immigrants in the UK before and after the 2004 enlargement:
Is there a change in immigrant self-selection?*
Simonetta Longhi (email: [email protected]) Magdalena Rokicka (email: [email protected])
Institute for Social and Economic Research, University of Essex
This version: 15 October 2012
Abstract
The 2004 accession of Eastern European countries (EU8) to the European Union has generated concerns about the influx of low-skill immigrants to the Western member states (EU15). Only three countries, namely Ireland, Sweden, and the UK, did not impose restrictions to immigration from Eastern Europe. Did the elimination of barrier to immigration have an impact on the quality of immigrants arriving to the UK? Using EU15 immigrants as a control group, we find systematic differences between EU8 immigrants arrived before and after the enlargement. The elimination of barriers to immigration seems to have changed the quantity and quality of EU8 immigrants to the UK. Keywords: EU enlargement; East-West migration, UK labour market, self-selection
JEL Classification: F22; J30; J61
* We would like to thank participants to the 58th Annual North American Meetings of the Regional Science Association International, Miami (FLA), November 2011; to the European Society of Population Economic Conference, Bern (Switzerland), June 2012; to the 52nd European Regional Science Association Conference, Bratislava (Slovakia), August 2012; and the other members of the MIDI-REDI project for helpful comments and discussions. This work is part of the project “Migrant Diversity and Regional Disparity in Europe” (NORFACE-496, MIDI-REDIE) funded by NORFACE; financial support from NORFACE research programme on Migration in Europe - Social, Economic, Cultural and Policy Dynamics is acknowledged. This work also forms part of a programme of research funded by the Economic and Social Research Council (ESRC) through the Research Centre on Micro-Social Change (MiSoC) (award no. RES-518-28-001). The support provided by ESRC and the University of Essex is gratefully acknowledged. UK LFS data are available from the Data Archive at the University of Essex (www.data–archive.ac.uk); EU LFS are available from Eurostat (http://epp.eurostat.ec.europa.eu/portal/page/portal/microdata/lfs).
2
1. Introduction
The 2004 enlargement of the European Union (EU) to eight Eastern European countries
(EU8) has generated fears of large flows of low-skill immigrants from Eastern to Western
Europe. For this reason most Western European countries (EU15) imposed temporary
restrictions to the free movement of people from Eastern Europe. Only three countries did
not impose any restriction to immigration: Ireland, Sweden, and the UK. In this paper we
focus on the UK, which is the largest of these three countries.
The 2004 enlargement changed immigration rules for EU8 citizens by removing the
main administrative barriers to immigration almost overnight. This can be seen as a natural
experiment that we can exploit to analyse the impact of immigration restrictions on the self-
selection of immigrants. If changes in immigration policy change the quality of immigrants –
for the better or for the worse – such new immigrants may pose different political and
economic challenges than ‘older’ ones.1 Our main research question focuses on differences
in the personal characteristics and labour market outcomes of EU8 immigrants arrived before
and after the EU enlargement, compared to immigrants from other EU15 countries, and to
those remaining in the country or origin (i.e. migrants vs. non migrants).
Our analysis is partly related to those studies analysing the impact of the European
enlargement on the UK labour market. Although the focus there is on the impact on natives,
these studies also show descriptive statistics on the characteristics of immigrants. Using data
from 2004 to 2007, Blanchflower and Shadforth (2009) find that EU8 immigrants have a high
propensity to be in employment, but receive lower wages compared to British workers.
Although they compare EU8 immigrants arrived in the UK before to those arrived after the
2004 enlargement, Blanchflower and Shadforth (2009) do not make any comparison with
immigrants from the other EU15 countries. The comparison with European immigrants who
were not subject to changes in immigration rules (EU15) provides a useful starting point to
analyse changes in the quality of EU8 immigrants arrived in the UK before and after the
enlargement. Drinkwater et al. (2009) compare EU8 immigrants arrived before and after the
enlargement with immigrants from EU15 countries and find significant differences between
1 A related issue is how EU8 immigrants entering the UK after the 2004 enlargement differ from those migrating to European countries that imposed restrictions to immigration. However, a detailed analysis is out of the scope of this paper.
3
“new” and “old” immigrants in terms of earnings and employment. However, they only use
data from 2001 to 2006, thus including only two years after the enlargement.
We update and extend the previous literature with four new contributions. First, we
use data from 1997 to 2010: a much longer dataset compared to the previous studies. We
include in our analysis the recent economic downturn, which allows us to analyse to what
extent immigration adapts to changing economic conditions. Theories of migration suggest
that the role of pull factors diminishes when the conditions of the labour market in the
destination country deteriorates and becomes less attractive to the potential immigrants, and
this may have an impact on immigrant self-selection.
Second, we describe the main socio-demographic characteristics of EU8 immigrants
compared to those of immigrants from EU15, those of British people, and those of people
who remained in the sending countries. Although the comparison of different types of
European immigrants is not new, to date there is no evidence on how people who migrated to
the UK compare to those who remain in the sending country. This will give us further
insights on self-selection of immigrants at the source. Third, we analyse how different types
of European immigrants (EU15, EU8, arrived to the UK before and after the EU
enlargement) perform in the UK labour market compared to British people, not only in terms
of employment probability, but also in terms of type of jobs, wages, and job quality: a much
larger set of outcomes than the previous studies.
Migration theories suggest that a persistent and relatively large gap between returns to
education, work experience and other personal characteristics in the labour markets of
sending and receiving countries increases the incentive to migrate, unless the cost of
separation are high, or there are some administrative barriers. As there is free movement
from European countries (including EU8) into the UK, and communication and transport
within Europe is relatively easy, we may expect differences in labour market returns to be
among the most relevant factors associated to immigration. Our fourth contribution is the
comparison of labour market outcomes of people who migrated to the UK to similar people
who remained in their country of origin in terms of their individual characteristics,
employment probability and type of jobs, partially taking into account the characteristics of
the labour market in the country of origin and destination. To our knowledge this is the first
study comparing the labour market performance of immigrants to similar people who did not
migrate.
This paper is also related to that part of the literature focusing on immigration policies
and on the impact of the introduction of a point-based system for the selection of immigrants

4
(see e.g. Aydemir 2012 for a review). However, we approach the topic from a different angle
as we are interested in self-selection of immigrants (as opposed as selection by the destination
country) and on the impact of the elimination of administrative barriers to immigration.
Much of the literature on self-selection of immigrants at the source focuses on
selectivity on education and uses aggregated data to relate self-selection to differentials in
returns to education across countries (e.g. Belot and Hatton Forthcoming). Here we take a
more pragmatic approach; we use individual data and analyse a larger number of socio-
economic characteristics of migrants.
We find that compared to EU15 immigrants, EU8 immigrants are more likely to be
male, married and to have dependent children. They also seem to be negatively selected in
terms of education. Compared to EU8 immigrants arrived before, those arrived after the
enlargement seem to be less likely to live in London, less likely to be self-employed, and
more likely to be in paid employment. Nevertheless, they receive lower wages on average.
Overall, our results indicate that EU8 immigrants arrived after the enlargement may be more
negatively selected and more likely to be temporary – than permanent – migrants. If this is
the case, new immigrants may pose new challenges to socio-economic integration since, as
suggested by Dustmann (1999), they may be less likely to invest resources in the
accumulation of human capital (e.g. learning the language) while in the UK.
2. Background and related studies
Citizens of the European Union have the right to live and work in any of the countries
belonging to the Union. Although it was already mentioned in the Treaty of Rome in 1957,
freedom of movement of goods, services, money and people has been fully implemented
among the 15 member countries since the 1990s (e.g. Kahanec 2012). As a result, nowadays
most European countries have a dual system imposing restrictions to immigration for non-EU
citizens, while having no immigration barriers for EU citizens.
In 1957 the Treaty of Rome, which created the European Economic Community
(EEC), included six founding countries: Belgium, the Netherlands, Luxembourg, France,
Italy, and (West) Germany. Nine further countries gradually joined the community from 1973
to 1995: Denmark, Ireland, the UK, Greece, Spain, Portugal, Austria, Sweden, and Finland.
In May 2004 an unprecedentedly large group of ten new members, representing more than 70
million citizens, joined the EU. These include Malta, Cyprus and eight eastern European
countries (EU8): the Czech Republic, Estonia, Hungary, Latvia, Lithuania, Poland, Slovakia,
5
and Slovenia. Because of large differences in wages and GDP between EU15 and EU8
countries, most EU15 countries imposed temporary restrictions to free movement of people
from the EU8 countries. Three countries did not impose any restriction, thus granting
immediate unrestricted access to their labour markets: the UK, Ireland, and Sweden.2 More
countries had opened their labour markets by November 2008: Spain, Finland, France,
Greece, Portugal, Italy, the Netherlands and Luxembourg, while Germany and Austria
opened their labour markets only seven years after the enlargement, in May 2011.
While before 2004 East-West migration was mostly confined to the Western
European countries bordering the EU8 members, mainly Germany and Austria, the opening
of labour markets of Sweden, Ireland and the UK changed the overall geographical
distribution East-West migrants, with the UK becoming the largest recipient country. Pre-
enlargement estimates of the number of potential immigrants from EU8 countries into the UK
predicted immigrant flows of around 12,000 people per year (Dustmann et al. 2003); Home
Office figures show that around 50,000 immigrants from EU8 countries applied to the Work
Registration Scheme (WRS) quarterly between 2005 and 2007, with a sharp decrease from
48,000 to 23,000 quarterly between 2008 and 2009 (Home Office 2009).3
The majority of EU8 immigrants to the UK come from Poland (66%), followed by
Slovakia (10%) and Lithuania (9%) with less than 1,000 applicants coming from Slovenia
(see e.g. Blanchflower and Lawton 2008; Home Office 2009). Home Office data on WRS
applications for the period 2004-2009 suggest that these immigrants are young (81% are
between 18 and 34 years of age), male (56%) and have no dependants (92%). Most
registered in East Anglia and West and East Midlands, and work for temporary employment
agencies at relatively low hourly wages (70% earn from £4.50-£5.99 per hour, see also
Blanchflower and Lawton 2008). These immigrants take jobs mainly in administration and
business (40%), hospitality and catering (19%), agriculture (10%), manufacturing (7%) and
food processing industries (5%); see Home Office (2009).
Drinkwater et al. (2009) find that the proportion of male immigrants increases after
enlargement as well as the proportion of those with higher levels of education, although with
some differences between Polish and other EU8 immigrants. Immigrants arrived after the
enlargement are more likely to be self-employed, but earn on average less than their
2 In 2007 Bulgaria and Romania joined the EU; in this case however, the UK imposed restrictions to free movement. This further EU enlargement is not included in our analysis. 3 Similarly large figures have been observed for Ireland, where the latest census from 2006 listed around 120,000 immigrants from EU8 countries, which constitute 3% of total population of Ireland (Central Statistics Office Ireland 2007).
6
counterparts who arrived before. Interestingly, the geographical distribution of immigrants
arrived after the enlargement is much more even across UK regions, with a much lower
proportion settling in London. The results by Drinkwater et al. (2009) seem to suggest that
immigrants from EU8 countries arrived in the UK before the enlargement, when restriction to
immigration were still in place, may be more positively self-selected than those arriving after
2004, when free movement is allowed. Although the study by Drinkwater et al. (2009) is
related to ours, their focus is on the impact of the enlargement on natives’ labour market
opportunities rather than on immigrant self-selection. Furthermore, Drinkwater et al. (2009)
only use data up to 2006. Qualitative analyses of Polish communities in the UK show large
heterogeneity among recent immigrants, for example in their knowledge of the English
language, which leads to their different outcomes in the labour market (Fomina 2009). Those
with poor or very basic knowledge of English accept less favourable working conditions,
basic jobs sometimes below their qualifications, and are in general less optimistic about their
future in the UK.
Using data up to 2004 Dustmann and Weiss (2007) report that around 50% of
migrants who were still in the UK one year after arrival were not in the country five years
later. According to Dustmann and Weiss (2007) return migration seems to be more likely
among people from the EU, US, and Australia. It is not clear if this result can be extended to
immigrants from EU8 countries since the income gap between the UK and EU8 countries is
much larger than the one between the UK and other EU15 countries or the US. However
using a special component of the Polish Labour Force Survey for 2008 Iglicka (2010)
suggests that the number of Polish migrants returning to Poland (from any country) between
2004 and first quarter of 2008 is around 580,000. It is also possible that EU8 citizens who
migrated to the UK in the first place may move to other destinations within the EU.
3. Data and methods
3.1. The UK Labour Force Survey
Studies analysing the number of East-West immigrants into the UK mostly rely on two main
sources of data: administrative data from the Worker Registration Scheme (WRS), and
survey data such as the Labour Force Survey (LFS).
Up to April 2011, all EU8 immigrants who wanted to work in the UK had to register
to the WRS, which had been especially created to monitor the influx of EU8 workers. As
pointed out by Blanchflower and Lawton (2008) and by Dobson (2009), WRS data have
7
some limitations: first of all, they may underestimate the total number of EU8 workers in the
UK since self-employed are not required to register. On the other hand, since they only
record registrations and do not record workers leaving the UK, WRS data are likely to
overestimate the total number of EU8 immigrants currently working in the UK. The lack of
information about return migration is a caveat of migration studies using WRS data:
Blanchflower and Shadforth (2009) suggest that most of EU8 immigrants are temporary
migrants, and that, according to the UN definition, many of those coming from EU8 countries
are in fact commuters or temporary workers as their sojourn in the UK is shorter than 12
months (see also Blanchflower and Lawton 2008).
The other main source of data used by researchers (e.g. Gilpin et al. 2006;
Blanchflower and Shadforth 2009; Drinkwater et al. 2009) is the LFS; these are the data we
use for our analysis. The LFS is a survey of households which collects a large amount of
information on demographic characteristics, labour market status, and job characteristics of
individuals aged 16 and over living at private addresses in the UK. Since it is a sample of
households living in the UK, the LFS is much more likely to offer a more precise picture of
immigrants still living in the UK, including those who are self-employed.
Although it is a very comprehensive dataset, the UK LFS does not focus on
immigration and immigrants may be underrepresented in the survey if they are less likely
than the general population to live at private addresses (e.g. Gilpin et al. 2006; Drinkwater et
al. 2009) and more likely to refuse to participate in the survey (e.g. Johnson et al. 2002).
Nevertheless, it is likely that, as the proportion of immigrants living in the UK increases, the
probability of their inclusion in the survey increases as well. Furthermore, population-
corrective weights provided with the survey can be used to correct for differences in non-
response rates between natives and immigrants. The LFS has been widely used in the
empirical literature to analyse different aspects of immigration and is particularly useful for
the comparison of immigrants to British people since it provides rich data on the
characteristics of immigrants, their labour market status and their jobs which cannot be found
in administrative data such as WRS.
In the UK the LFS is collected quarterly and has a rotating panel structure in which
individuals are interviewed for up to five successive quarters. To reduce problems of
attrition, which may affect natives and immigrants differently, we focus on men and women
in working age (16-59/64) responding to their first interview and use data from 1997, since
this is the first year in which questions on wages are asked also in the first interview, and up
to 2010. There is another reason to use data from 1997: since we aim to compare EU8 to

8
EU15 immigrants, we need to start our analysis at a date later than the last European
enlargement previous to 2004 (Austria, Sweden and Finland joined the EU in 1995). Finally,
since in the dataset the number of immigrants from EU8 countries before 1997 is almost zero,
there is no gain in adding earlier years.
We keep in the survey native British people and EU immigrants but exclude
immigrants from all other countries.
3.2. Models for the analysis of Eastern European immigrants in the UK
We start by graphically analysing trends in the number of immigrants from EU15 and EU8
countries as captured in the UK LFS. We then compare descriptive statistics of the individual
and job characteristics of these two types of immigrants compared to British people (Sub-
section 4.1). To gain insights on the issue of self-selection of immigrants we split both
groups of EU15 and EU8 immigrants into two subgroups of those arrived before the EU
enlargement (May 2004) and those arrived after. Since the EU enlargement changed
immigration rules for EU8 but not for EU15 immigrants, we would expect no differences
between EU15 immigrants arrived before and after the enlargement. However, if the opening
of the borders has an impact on self-selection, we may see differences in the characteristics of
EU8 immigrants arrived before and after the enlargement.
Besides differences in observed characteristics, self-selection may have changed the
composition of immigrants also in terms of unobservable characteristics such as ability, or
motivation. Although we cannot directly analyse such characteristics, we may get insights on
these unobserved traits by analysing differences in location and labour market performance of
immigrants arrived before and after the enlargement, to those of British natives. In Sub-
section 4.2 we use a multinomial probit model to analyse patterns of location of immigrants
across the nine English Government Office Regions, plus Scotland, Wales and Northern
Ireland, and whether this differs across types of EU immigrants:
ijjijiit TIXy εββ ++= 2'
1'* (1)
where we model the probability of individual i living in region r at time t via the latent
variable *ity . The error terms εij are i.i.d. and follow a multivariate normal distribution. The
probability of observing individual i in region r is the probability that yitr > yitj for each j ≠ r.
Among the explanatory variables we include individual and household characteristics (Xi)
9
such as sex, marital status, whether there are dependent children in the household, dummies
for qualification levels, and dummies for quarter and year of the interview, to capture the
effect of changing economic conditions over the period of analysis (the effect of the recession
is therefore picked up by the year dummies). Since immigrants arriving in periods of growth
might be more likely to find good quality jobs than those arriving during recessions, we also
include three dummies for the period of arrival of the immigrant: on or before 1991, between
1992 and 2007, on or after 2008, with a value of zero (reference group) for British natives.
The models also include four additional variables (TIi). Two are dummies for the
origin of the immigrant: whether born in one of the other EU15 countries, and whether born
in one of the EU8 countries, with the group of British people used as reference. We also
include two further dummies – which may be interpreted as interaction terms – for whether
born in one of the other EU15 countries and arrived in the UK on or after the enlargement;
and whether born in one of the EU8 countries and arrived in the UK on or after the
enlargement.4 These last four variables should help us analyse whether immigrants from
Eastern Europe behave in a systematically different way than immigrants from Western
Europe, and whether those arrived after the enlargement (i.e. after free movement was
allowed) differ from those arrived before (and who therefore faced higher barriers to entry in
the UK). The comparison of EU8 immigrants arrived before and after the EU enlargement
with EU15 immigrants may give us an indication of the effect that the opening of the labour
market may have had on self-selection of immigrants from EU8 countries after controlling
for different times of arrivals.
While we expect the regression coefficient for those immigrants arrived after the
enlargement to be zero for EU15 immigrants, if the opening of the borders had an impact on
self-selection, the regression coefficient for EU8 immigrants arrived after the enlargement
may be different from zero. This would indicate that the opening of the UK borders may
have had an impact on the quality of immigrants arriving from Eastern European countries.
In Sub-section 4.3 we then analyse whether new immigrants are more likely to come
to the UK to study rather than work. We compare the activity status of EU immigrants to that
of British people by means of a multinomial probit model similar to equation (1). In this
4 It is worth stressing that this characteristic refers to when the individual entered the country, it does not refer to the year of the interview. Clearly, none of the immigrants arrived after 2004 is observed in the data before that date; however, many immigrants interviewed after the EU enlargement have arrived in the UK before 2004. Hence, it is also not possible to include a separate dummy for years of data after 2004 (i.e. not interacted with immigration status) in the model since this variable has no meaning for British people, who all arrived in the country before the enlargement (those born after 2004 have not yet reached employment age). Hence, although equation (1) may remind of a difference-in-difference framework, it is quite a different setting.

10
case, however, the latent variable refers to the probability that the main labour market status
of the person interviewed is either active, student, or another type of inactivity status. Again,
the model only includes people in working age and, because of different incentives and
behaviours between the sexes, the models are estimated separately for men and women.
Among the explanatory variables in Xi we exclude sex but now include age, number of years
spent in the UK (age for UK born) and dummies for region of residence to capture
differences in economic conditions across regions which may push people in and out of the
labour force. The variables in TIi remain unchanged.
For those immigrants who are active in the labour market we then analyse the
propensity to be in paid employment, self-employed, or unemployed compared to British
people. The opening of the UK labour market to EU8 countries have made it easier for EU8
immigrants to take up paid employment, but has not changed rules for self-employment.
Hence, EU8 immigrants arriving to the UK after 2004 may show a different propensity to be
self-employed than those arrived before the enlargement. If self-employment is the preferred
choice for all immigrants (e.g. Sahin et al. 2007) and the EU enlargement has not changed the
average entrepreneurial spirit of EU8 immigrants, then we may see no differences between
EU8 immigrants arrived before and after the enlargement. On the other hand, we may see
relevant differences if either self-employment was a forced choice for immigrants arrived
before enlargement, or the ease of immigration now attracts more people wanting to take up
paid employment rather than becoming self-employed. Once again we estimate a
multinomial probit model separately for men and women, in which the explanatory variables
are the same as in the activity status model.
We then go one step further to analyse whether EU8 immigrants tend to concentrate
in certain industries. Hence, for those immigrants who are in a paid job we model the
probability of working in one of seven main industries. Also in this case we use a
multinomial probit model, which we estimate separately for men and women, and in which
the explanatory variables are the same as in the activity status model. A similar analysis of
the occupational status of EU immigrants compared to British people is not possible since
changes in the occupational classification in 2001 reduces significantly the number of
observations, especially for EU8 immigrants arrived before the 2004 enlargement.
To get insights on the quality of the jobs taken up by EU immigrants compared to
those taken up by British people, we then estimate binary probit models for the probability of
holding a temporary job (instead of a permanent one with no fixed end); the probability of
holding a part-time job (i.e. working less than 30 hours per week, as opposed to working
11
more than 30 hours per week); and the probability of having a second job (or not). The
models are estimated separately for men and women and use the same explanatory variables
as in the activity status model. Finally, we compare wages of EU immigrants and of British
people. The dependent variable in this case is the log of hourly wages and the model is
estimated by means of OLS separately for men and women. The explanatory variables are
the same as in the activity status model, but with the addition of the square of age, years of
job tenure, a dummy for those working part-time, and a dummy for temporary jobs.
3.3. The European Labour Force Survey
For the second part of our analysis, in addition to the UK LFS we use the European LFS.
The EU LFS is a harmonised dataset which provides data on individual and labour market
characteristics of people living in the 25 European countries. Although the structure of the
EU LFS is very similar to that of the UK LFS, because of the harmonisation, the data are
often less detailed (for example, in the EU LFS it is not possible to identify each country of
birth, but only the larger area, e.g. EU non-EU).
We use the EU LFS to analyse the individual characteristics as well as selected labour
market and job characteristics of people in their origin country compared to those who
migrated to the UK. Hence, when using the EU LFS we do not analyse migrants, but natives
of that EU15 or EU8 country. In this paper we use the EU LFS for Ireland, Germany and
Poland since these represent the main groups of EU immigrants into the UK. These are likely
to be very different types of immigrants: Ireland is a traditional sending country for the UK
because of its geographical and cultural proximity. Germany is one of the largest EU15
countries, while Poland is one of the largest EU8 countries. Since economic conditions and
wage levels differ greatly between these three countries, we may expect people living in these
countries to have different labour market opportunities at home, different incentives to
migrate, and to perform differently when they migrate to the UK.
Because of data availability on the other variables, we focus or comparison on
respondents’ labour market status, their probability of holding a temporary job, their
probability of working part-time, and of holding a second job. Unfortunately, detailed wage
data are not available.
3.4. Models for the comparison with people in their country of origin
To complete the analysis of who migrates to the UK (Section 4.4), we compare descriptive
statistics of the individual and job characteristics of Irish, German and Polish immigrants in
12
the UK with the average individual and job characteristics of native people in Ireland,
Germany and Poland. This will give us some indication of how migrants compare to non
migrants from the same country in terms of individual characteristics.
We then compare labour market status and job characteristics across the different
countries and use the EU LFS to estimate models similar to equation (1) for the dependent
variables of interest, separately by country and for men and women. As dependent variables
we use labour market status, the probability of holding a temporary job, the probability of
working part-time, and of holding a second job. As explanatory variables in Xi we can only
include age, a dummy for those who are married, education and year dummies. These
models allow us to compute the probabilities of the different outcomes for Irish people in
Ireland, German people in Germany, and Polish people in Poland, which we compare with
the outcomes of similar Irish, German and Polish people who migrated to the UK.
For the comparison with immigrants to the UK we use the UK LFS to estimate similar
models – using the same explanatory variables – separately by gender and for Irish, German,
and Polish immigrant in the UK (the analysis of other nationalities is not possible at this stage
given the low number of observations for other EU immigrants in the UK LFS). Since the
difference between the performance of similar people in the UK and in the country of origin
may be related to the characteristics of the local labour market more than to self-selection of
migrants, alongside the predicted probabilities (e.g. of having a part-time job) we also
compare the average proportions (e.g. the proportions of jobs that are part-time) in the four
countries (see Section 4.4).
4. Empirical results
4.1. Who migrated from European countries into the UK?
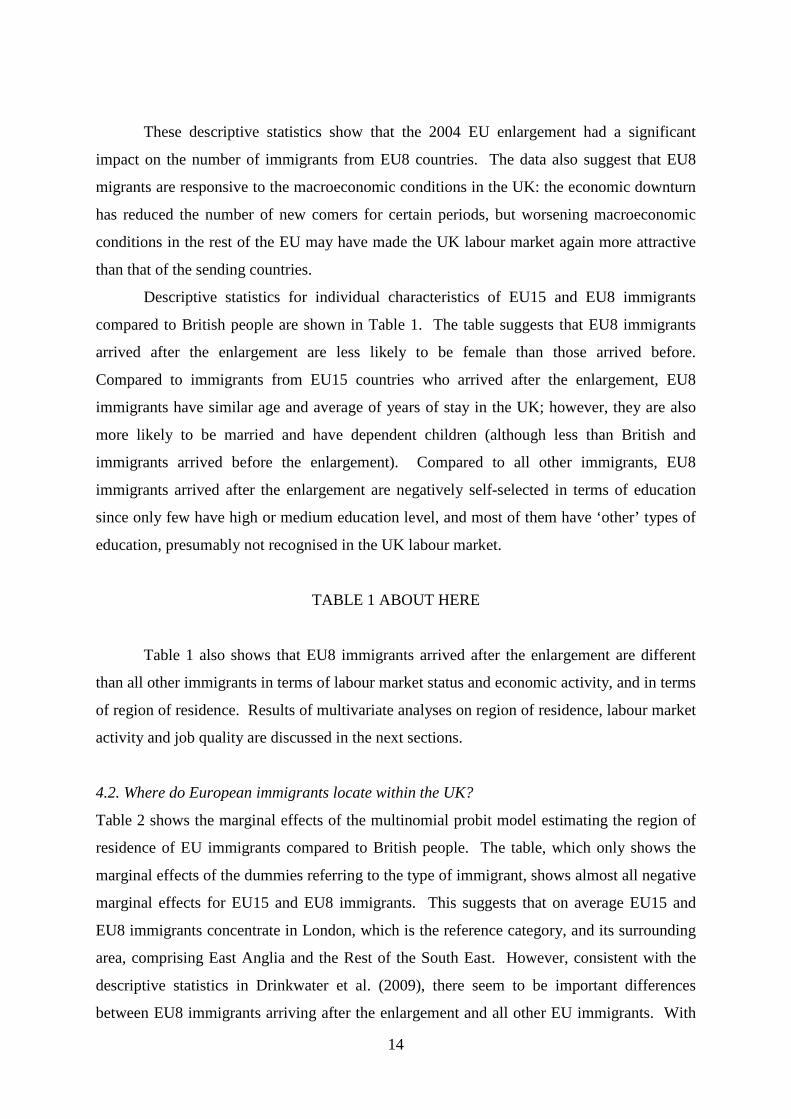
We start our analysis by looking at trends in the number of EU immigrants into the UK.
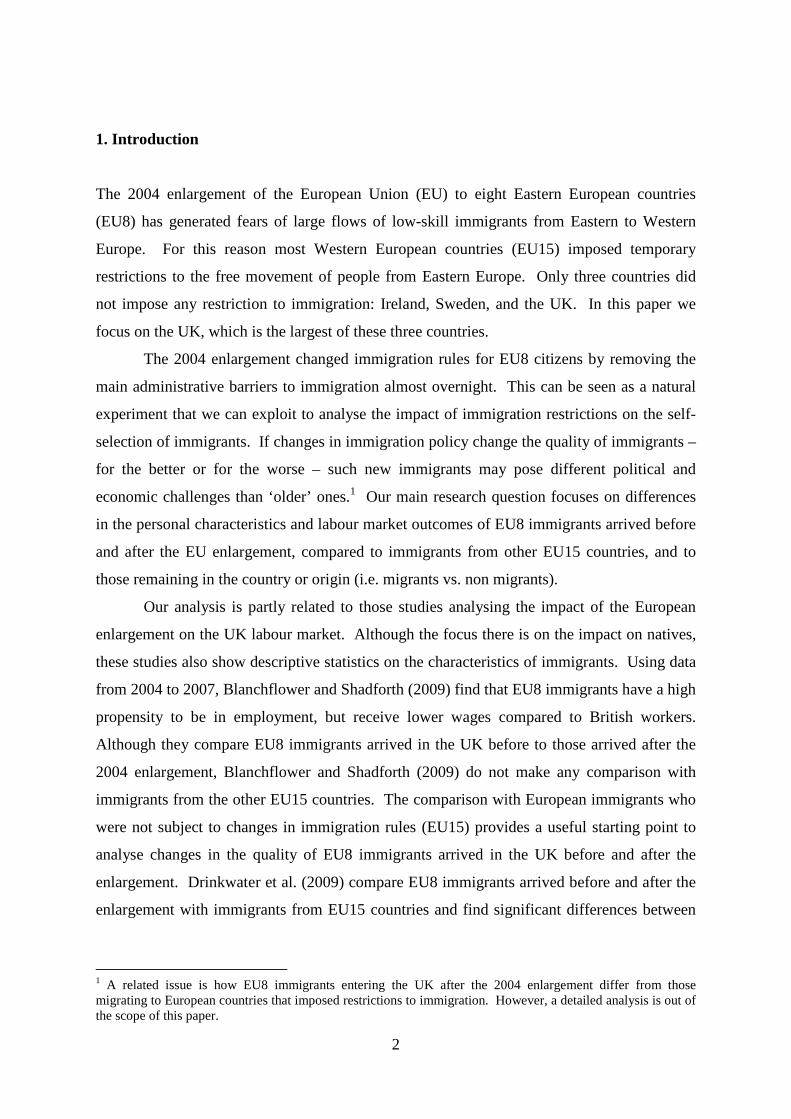
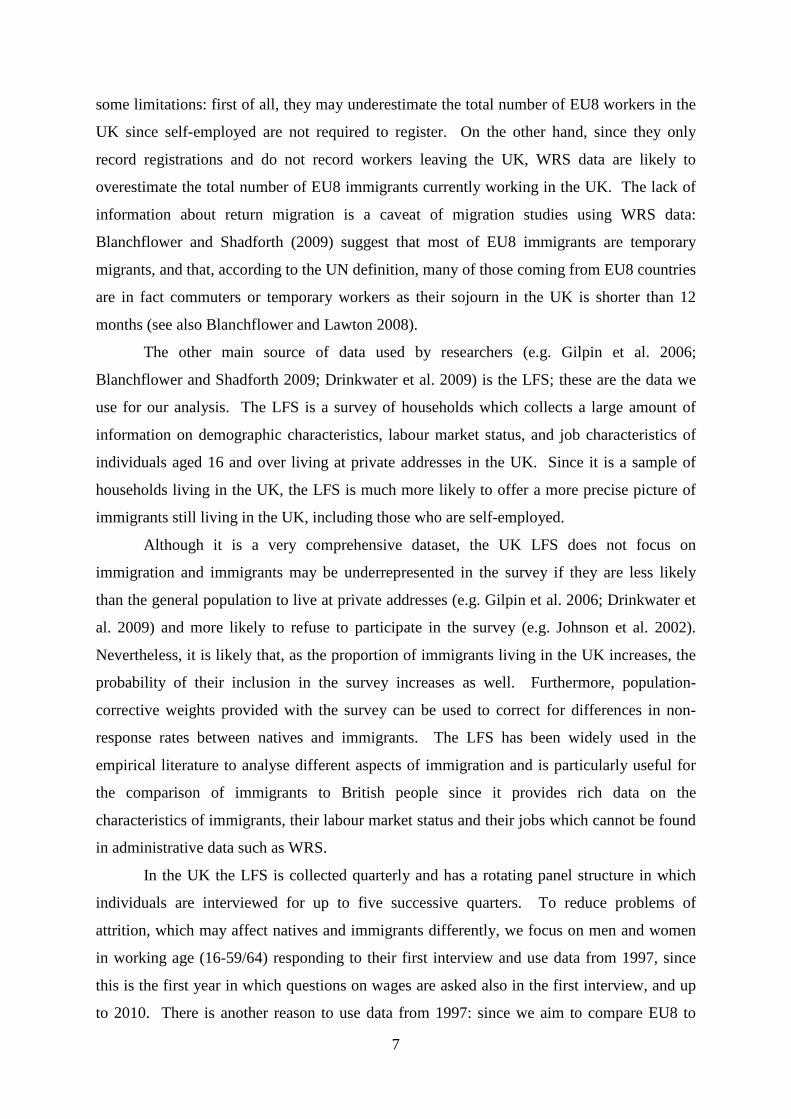
Figure 1 shows the evolution of the number of EU15 and EU8 immigrants from 1997 to 2010
according to the UK LFS; the left part of the figure shows quarterly data, while the right part
aggregates the quarters by calendar year. The number of EU8 citizens is comparatively small
before the 2004 enlargement but shows a sharp increase since the third quarter of 2004. This
trend persists until 2007, after which it stabilises until 2009. Being this the stock of
immigrants, it does not give any clear indication on whether changes in trends are due to an
increase in the number of immigrants leaving the UK, a decrease in the number of
newcomers, or both. In any case, the 2007 change in trend is most probably the result of the
13
less favourable macroeconomic conditions in the UK, and relatively good economic
prospects in the largest of the EU8 country, Poland, which is the main sending country of
EU8 immigrants. In 2010 the number of immigrants from EU8 countries seems to start
increasing again.
In contrast, the stock of immigrants from EU15 countries remains almost unchanged
until 2010, when it shows a gradual increase. In 2010 the stock of immigrants from EU8
countries is close to the stock of immigrants from the rest of the EU15 countries.
FIGURE 1 ABOUT HERE
In line with previous studies (e.g. Blanchflower and Lawton 2008) our data suggest
that most EU8 immigrants in the UK come from Poland (69%), followed by Lithuania (10%)
and Slovakia (8%). Among the EU8 countries, Slovenia and Hungary send the smallest
number of immigrants. These proportions only partially reflect differences in the size of the
population of the sending countries. With a population of almost 39 million, Poland is
overrepresented among EU8 immigrants in the UK, while with 10 million citizens each the
Czech Republic and Hungary are underrepresented. This can be explained by the
macroeconomic situation of the sending countries: Latvia, Lithuania, Poland and Slovakia
have the lowest GDP per capita in 2005 and high unemployment rate, which varies from 17%
in Poland to 9% in Latvia5.
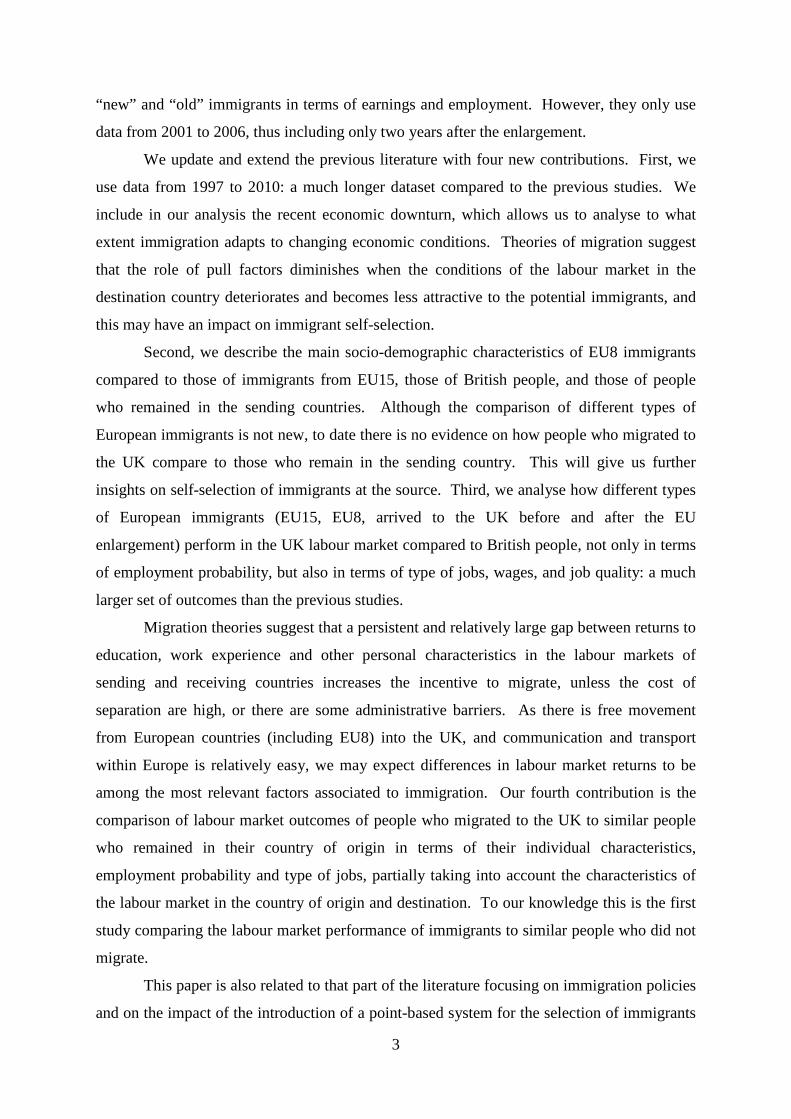
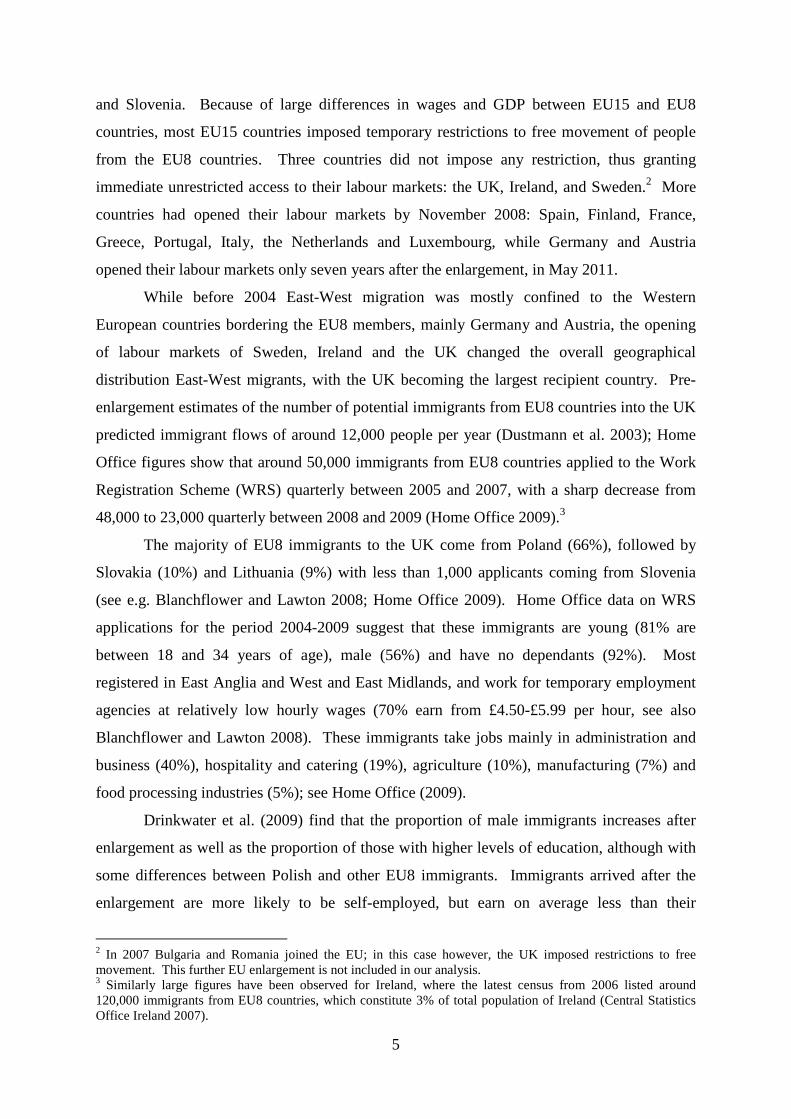
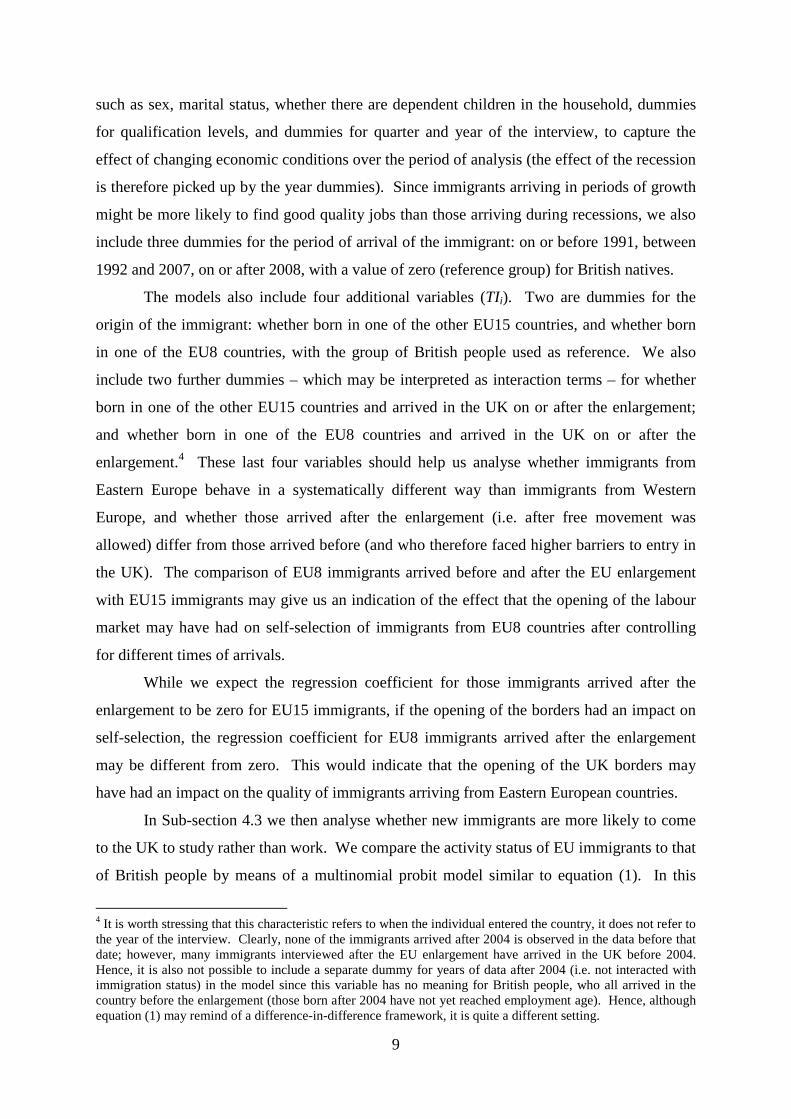
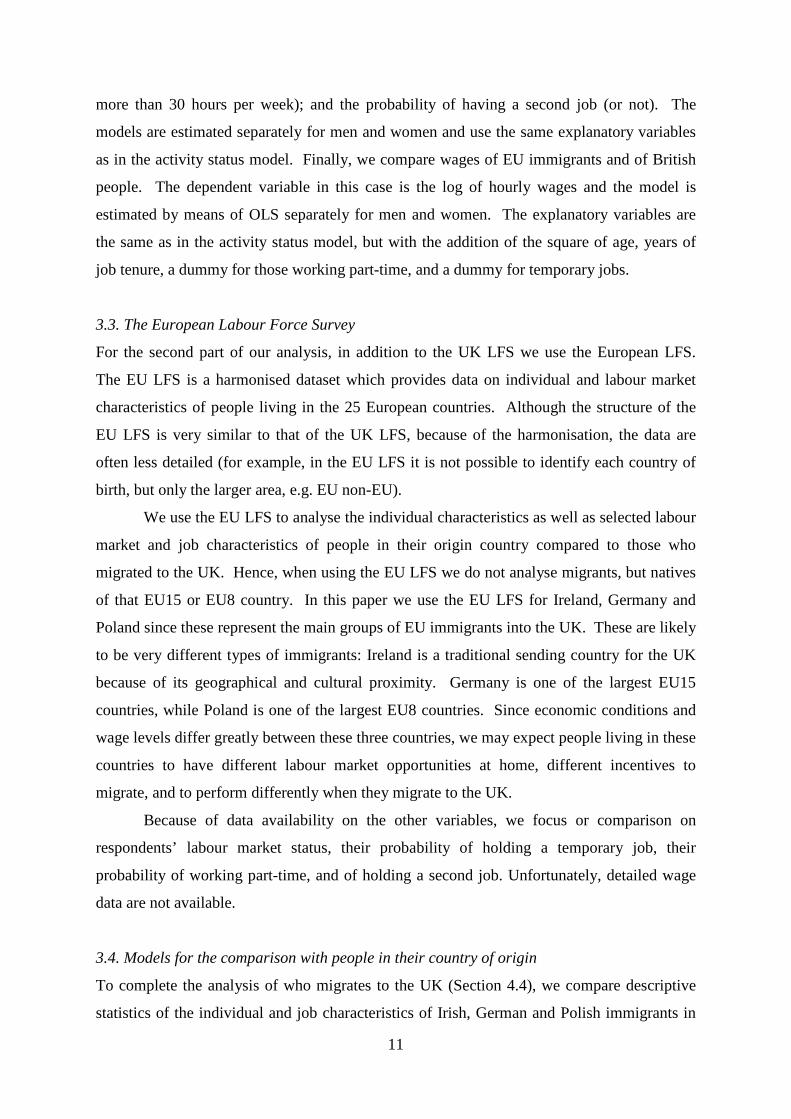
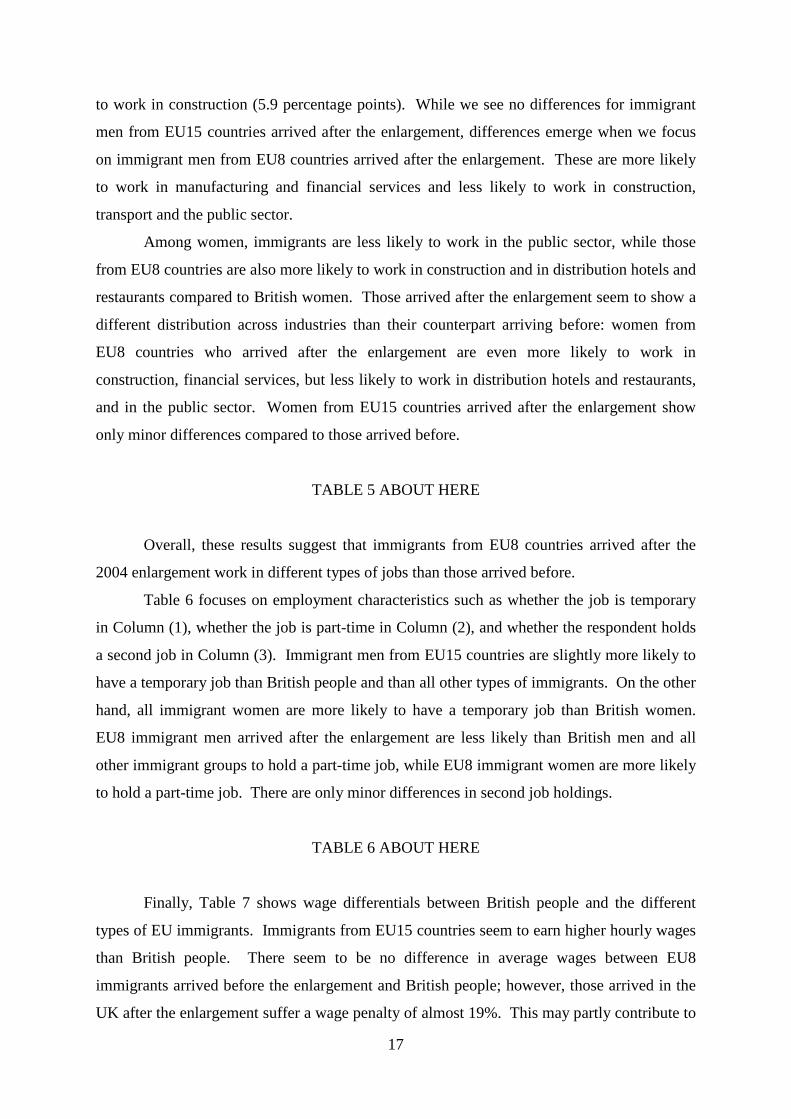
When we focus on the number of recent immigrants, who have arrived in the UK at
most two years before their first LFS interview we can have an idea of changes in the influx
of new immigrants. These are shown in Figure 2. In the LFS the stock of EU8 immigrants
recently arrived in the UK increases sharply from the second half of 2004, it peaks at the end
of 2006 and then starts decreasing. In the second half of 2009 the number of recently arrived
EU8 immigrants starts growing again. For EU15 countries, in contrast, the number of
recently arrived immigrants is much more stable. These trends are broadly consistent with
what found using WRS data by McCollum and Findlay (2011).
FIGURE 2 ABOUT HERE 5 EUROSTAT, http://epp.eurostat.ec.europa.eu/tgm/table.do?tab=table&init=1&plugin=1&language=en&pcode=tec00114 Although it has been suggested that the attractiveness of the UK for Polish people may be related to networks of immigrants established as early as right after World War II, studies suggest that there seem to be no direct network links between earlier and new (mainly before and after 1990s) immigrants from Poland (e.g. Garapich 2008; Parutis Forthcoming).
14
These descriptive statistics show that the 2004 EU enlargement had a significant
impact on the number of immigrants from EU8 countries. The data also suggest that EU8
migrants are responsive to the macroeconomic conditions in the UK: the economic downturn
has reduced the number of new comers for certain periods, but worsening macroeconomic
conditions in the rest of the EU may have made the UK labour market again more attractive
than that of the sending countries.
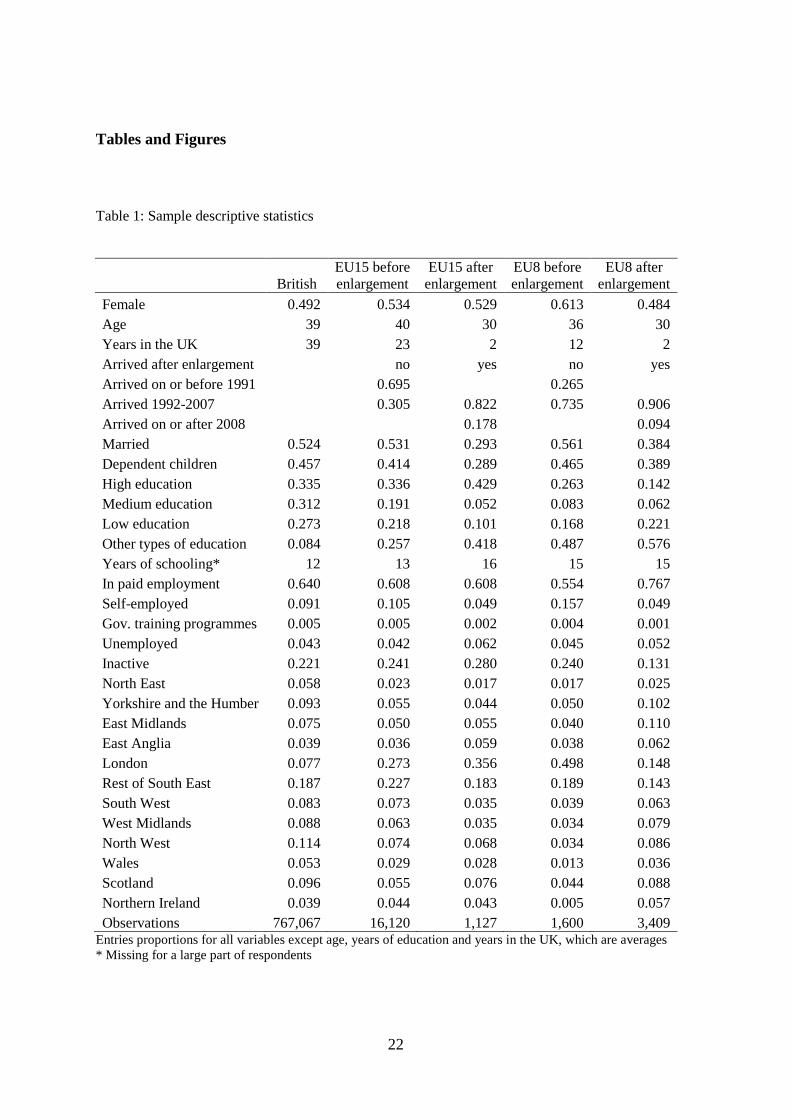
Descriptive statistics for individual characteristics of EU15 and EU8 immigrants
compared to British people are shown in Table 1. The table suggests that EU8 immigrants
arrived after the enlargement are less likely to be female than those arrived before.
Compared to immigrants from EU15 countries who arrived after the enlargement, EU8
immigrants have similar age and average of years of stay in the UK; however, they are also
more likely to be married and have dependent children (although less than British and
immigrants arrived before the enlargement). Compared to all other immigrants, EU8
immigrants arrived after the enlargement are negatively self-selected in terms of education
since only few have high or medium education level, and most of them have ‘other’ types of
education, presumably not recognised in the UK labour market.
TABLE 1 ABOUT HERE
Table 1 also shows that EU8 immigrants arrived after the enlargement are different
than all other immigrants in terms of labour market status and economic activity, and in terms
of region of residence. Results of multivariate analyses on region of residence, labour market
activity and job quality are discussed in the next sections.
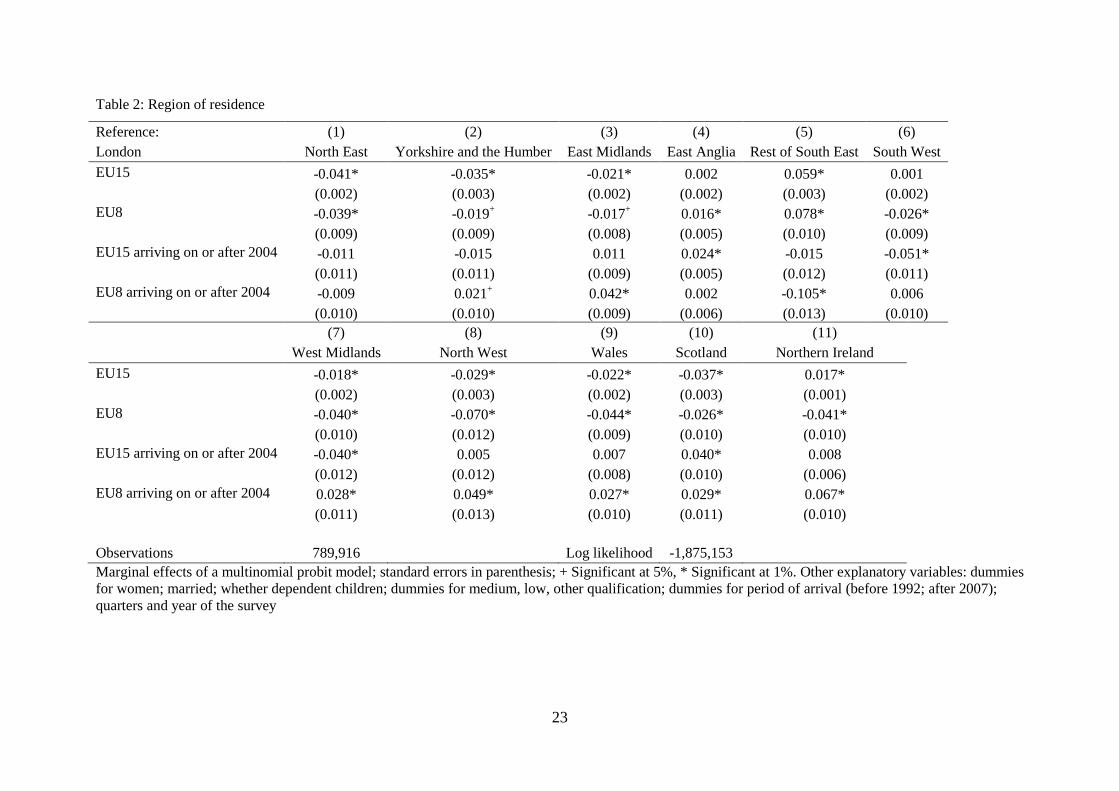
4.2. Where do European immigrants locate within the UK?
Table 2 shows the marginal effects of the multinomial probit model estimating the region of
residence of EU immigrants compared to British people. The table, which only shows the
marginal effects of the dummies referring to the type of immigrant, shows almost all negative
marginal effects for EU15 and EU8 immigrants. This suggests that on average EU15 and
EU8 immigrants concentrate in London, which is the reference category, and its surrounding
area, comprising East Anglia and the Rest of the South East. However, consistent with the
descriptive statistics in Drinkwater et al. (2009), there seem to be important differences
between EU8 immigrants arriving after the enlargement and all other EU immigrants. With

15
almost all positive marginal effects, Table 2 suggests that EU8 immigrants arrived after the
enlargement are more dispersed across UK regions – and less concentrated in London – than
all other immigrants and British people.
TABLE 2 ABOUT HERE
In particular, EU8 immigrants arrived after the enlargement are more likely to locate
in the Midlands and in the North West, and much less likely to locate in the Rest of the South
East. Immigrants arrived after the enlargement seem also more likely to locate in Scotland
and Wales compared to those arrived before. Overall, therefore, immigrants arrived after the
enlargement choose to live in different areas than those arrived before. There may be several
reasons for these differences. EU8 immigrants arrived after the enlargement may seek
different employment opportunities than those arrived earlier. They may have different
propensity to become self-employed, different requirements in terms of the economic sector
in which they want to work and of the quality of the job they are looking for (for example,
some of them may be interested only in temporary seasonal jobs which are typical of the
agricultural sector). It is also worth noting the recent availability of cheap flights between
Eastern Europe and different parts of the UK, although we have no way to analyse whether
this may be a cause or a consequence of immigration to regions other than London. We can,
however, analyse whether EU8 immigrants arrived after the enlargement have systematically
different labour market outcomes than those arrived before.
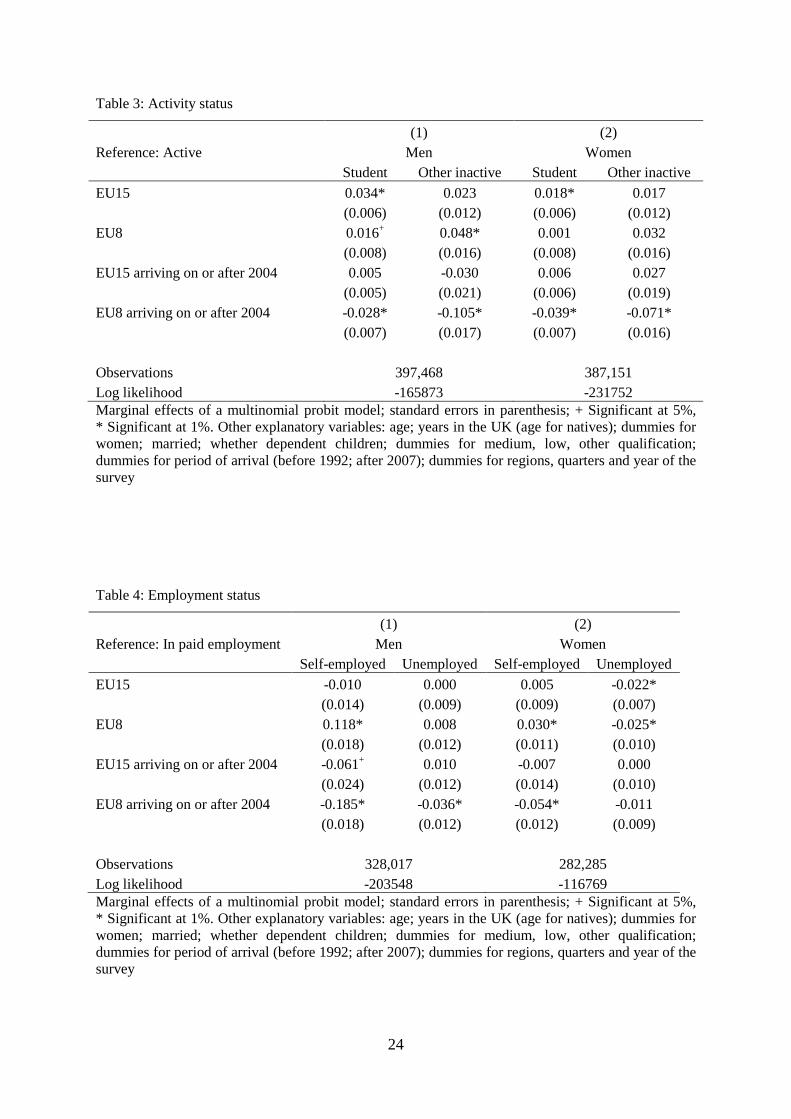
4.3. Activity status and type of jobs done by European immigrants into the UK
Table 3 shows the marginal effects for being either a student or in a different inactivity status,
compared to being active in the labour market. Column (1) shows the results for men, while
Column (2) shows the results for women.
The table suggests that, especially for men, immigrants are slightly more likely than
British people to be students. Those immigrants from EU8 countries arrived after the
enlargement, however, are comparatively less likely to be inactive than British people: male
are 2.8 percentage points less likely to be student and 10.5 percentage points less likely to be
in another inactivity status; for female these propensities are 3.9 and 7.1. Hence, it appears
that EU8 immigrants come to the UK for work-related rather than study-related reasons.
TABLE 3 ABOUT HERE

16
The marginal effects for being either self-employed or unemployed as opposed to
being in a paid job are shown in Table 4; Column (1) for men, and Column (2) for women.
The table suggests that immigrant women are marginally (about 2.5 percentage points) more
likely to be unemployed than British people. Immigrants from EU8 countries are much more
likely (11.8 percentage points for men and 3 percentage poins for women) to be self-
employed than British people, although those arrived after the enlargement are less likely to
be self-employed than those arrived before. The combination of these two coefficients
suggests that immigrants from EU8 countries arrived after the enlargement are slightly less
likely than British people to be self-employed.
Interestingly, EU8 immigrants arrived after the enlargement show systematically
different patterns of activity than those arrived before: not only they are 18.5 percentage
points less likely to be self-employed; they are also 3.6 percentage points less likely to be
unemployed. These results are consistent with what found by Blanchflower and Shadford
(2009). These results are conditional on a relatively large number of individual
characteristics. The differences between immigrants arrived before and after the enlargement
may either be due to self-employment being a forced choice for those arrived before the
enlargement, or to differences in individual unobserved characteristics (e.g. lack of
entrepreneurial spirit or higher motivation to take paid employment) between the two groups.
Alternatively, if recent immigrants are more likely to be temporary – rather than permanent –
migrants, they may be less willing to invest in self-employment activities. Furthermore, if
EU8 immigrants arrived before the enlargement are more likely to be temporary immigrants
than those arrived before the enlargement, they may also be more likely to accept lower
quality jobs (i.e. more likely to be temporary and have comparatively lower wages) than all
other groups.
TABLE 4 ABOUT HERE
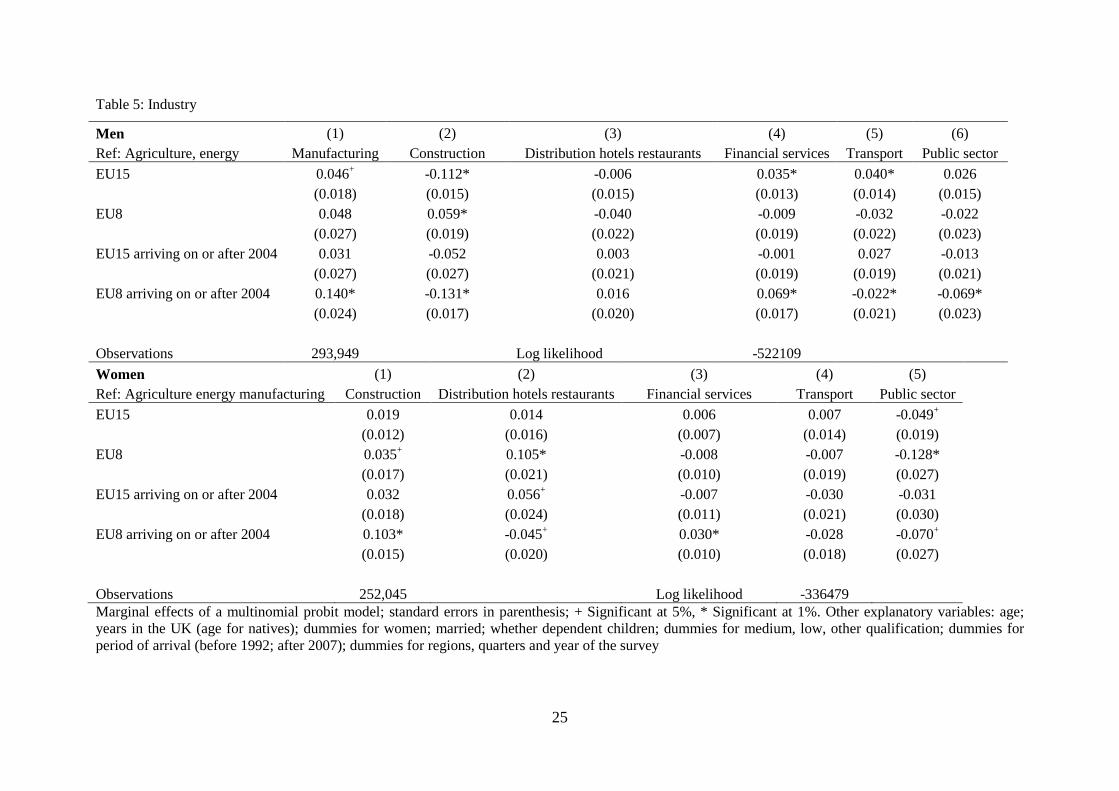
Do EU immigrants take jobs in the same industries as British people? The marginal
effects for the propensity of working in the different types of industries are shown in Table 5.
The top part of the table shows results for men, while the bottom part shows results for
women. Compared to British men, EU15 immigrant men are slightly more likely to work in
manufacturing, financial services and transport, and less likely to work in construction.
Immigrant men from EU8 countries, however, are significantly more likely than British men
17
to work in construction (5.9 percentage points). While we see no differences for immigrant
men from EU15 countries arrived after the enlargement, differences emerge when we focus
on immigrant men from EU8 countries arrived after the enlargement. These are more likely
to work in manufacturing and financial services and less likely to work in construction,
transport and the public sector.
Among women, immigrants are less likely to work in the public sector, while those
from EU8 countries are also more likely to work in construction and in distribution hotels and
restaurants compared to British women. Those arrived after the enlargement seem to show a
different distribution across industries than their counterpart arriving before: women from
EU8 countries who arrived after the enlargement are even more likely to work in
construction, financial services, but less likely to work in distribution hotels and restaurants,
and in the public sector. Women from EU15 countries arrived after the enlargement show
only minor differences compared to those arrived before.
TABLE 5 ABOUT HERE
Overall, these results suggest that immigrants from EU8 countries arrived after the
2004 enlargement work in different types of jobs than those arrived before.
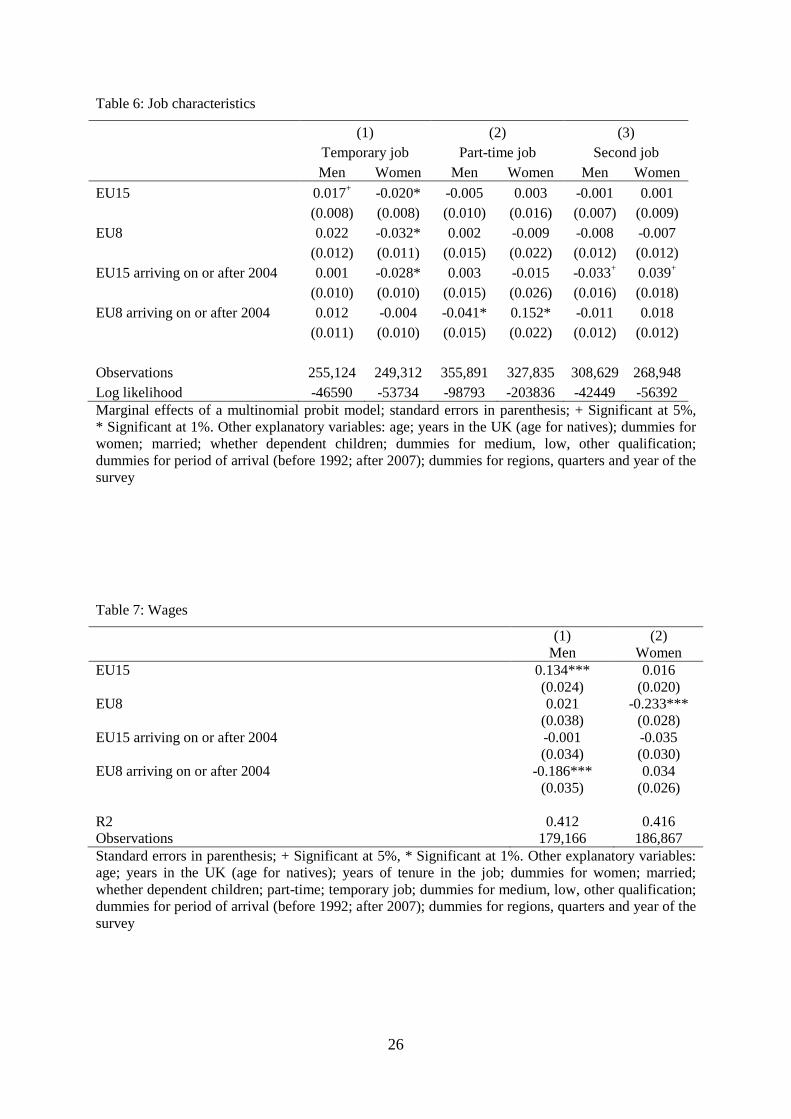
Table 6 focuses on employment characteristics such as whether the job is temporary
in Column (1), whether the job is part-time in Column (2), and whether the respondent holds
a second job in Column (3). Immigrant men from EU15 countries are slightly more likely to
have a temporary job than British people and than all other types of immigrants. On the other
hand, all immigrant women are more likely to have a temporary job than British women.
EU8 immigrant men arrived after the enlargement are less likely than British men and all
other immigrant groups to hold a part-time job, while EU8 immigrant women are more likely
to hold a part-time job. There are only minor differences in second job holdings.
TABLE 6 ABOUT HERE
Finally, Table 7 shows wage differentials between British people and the different
types of EU immigrants. Immigrants from EU15 countries seem to earn higher hourly wages
than British people. There seem to be no difference in average wages between EU8
immigrants arrived before the enlargement and British people; however, those arrived in the
UK after the enlargement suffer a wage penalty of almost 19%. This may partly contribute to

18
their higher probability of having a paid job. EU8 women earn around 23% less per hour
than British women, but there does not seem any additional wage penalty for those who
arrived to the UK after the enlargement.
Unfortunately we do not have any information on language proficiency. However, if
proficiency is not an issue for EU8 immigrants arrived after the enlargement, these results
may suggest that such immigrants may see themselves as temporary migrants, accepting low-
skill-low pay jobs on which to work for a limited period of time.
TABLE 7 ABOUT HERE
In summary, our results show that there are significant differences not only between
EU immigrants and British people, but also between immigrants from EU15 and from EU8
countries. These differences relate to all aspects analysed here: from the activity and
employment status to the type of jobs immigrants and British people do. Furthermore, our
models show often large differences, especially for EU8 immigrants, between those who
arrived in the UK before and those who arrived after the enlargement.
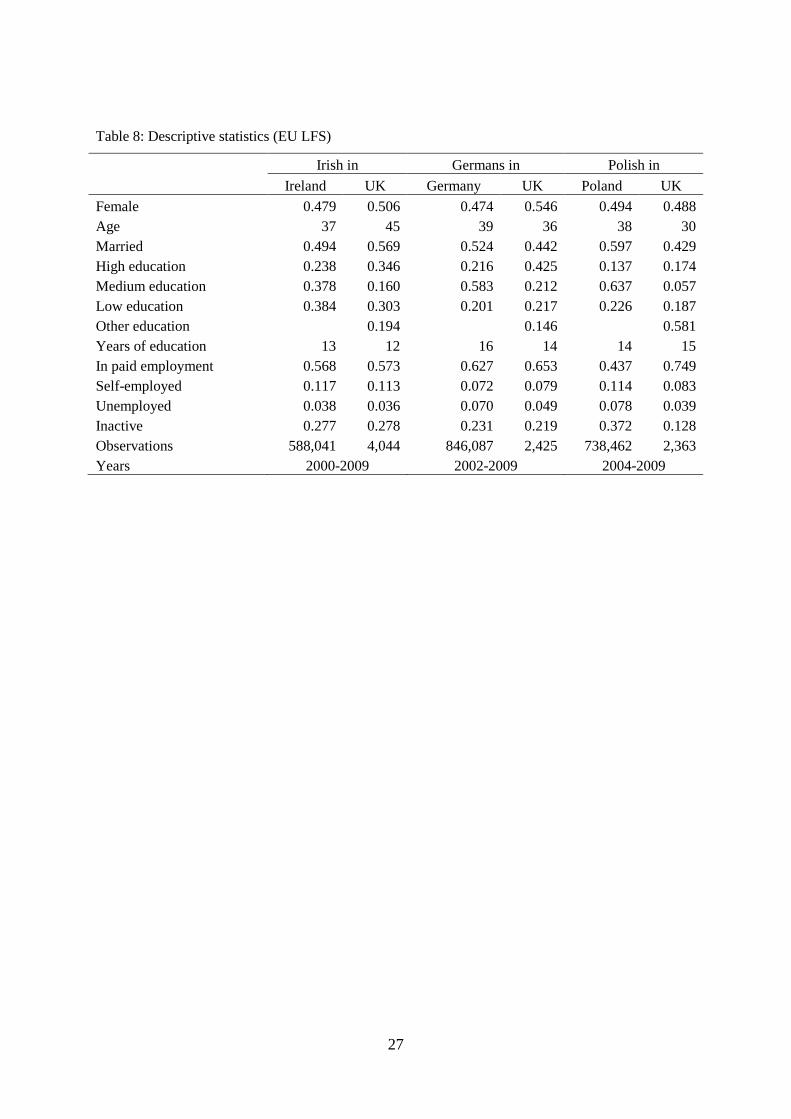
4.4. How do European immigrants in the UK compare to people in the country of origin?
How do Irish, German and Polish people who have migrated to the UK compare to those who
remained in the country of origin? Table 8 shows descriptive statistics for the characteristics
of Irish, German, and Polish people in their country of origin, compared to those who
migrated to the UK. With the exception of Polish people, migrants are comparatively more
likely to be female; with the exception of Irish people, migrants are younger and less likely to
be married than the average (working age) population in the sending country. Immigrants
from Ireland and Germany have on average higher levels of education than those remaining
in their country of origin; to some extent this applies also to Polish immigrants, although
most Polish immigrants have levels of education which are not easily translated into British
qualification (“other qualifications”). For Irish and German people, the distribution across
activity levels is similar for immigrants and for those remaining in the country of origin.
Polish people who migrated to the UK are comparatively more likely to be in paid
employment and less likely to be self-employed, unemployed or inactive, compared to Polish
people living in Poland. This may suggest that, despite the differences in education between
the two countries, gains from migration, in terms of employment probability, are higher for
19
Polish than Irish and German people. Unfortunately, the EU LFS does not allow us to
compare wages obtained by migrants to those obtained by non migrants.
TABLE 8 ABOUT HERE
Table 9 compares the employment characteristics of a representative person who is 30 years
of age, has a medium level of education, is not married and has no dependent children. The
representative person who has migrated to the UK lives in London, and the reference year is
2009, i.e. a year characterised by downturn in the UK. These probabilities are estimated on
the basis of regression coefficients of models estimated separately by country and sex (see
Sub-section 3.4). To have an idea of how the situation of the immigrant in the UK compares
to that of a similar person in the country of origin, Table 10 shows how the economic
situation differs among each country (the figures in Table 10 are computed using the UK and
EU LFS).
Table 10 suggests that in 2009 Ireland and Poland have higher proportions of self-
employment than the UK; according to Table 9, in 2009 Irish and Polish people arrived in the
UK before the enlargement have a much larger probability of being self-employed than
similar people in Ireland and Poland. If arrived after the enlargement, both Irish and Polish
immigrants to the UK are less likely to be self-employed than those arrived before and than
similar people who remained in the country of origin. For Germans there seems to be no
change across arrival cohorts: German men are less likely to be self-employed in the UK than
similar men remaining in Germany. The opposite seems to be true for German women:
immigrants to the UK seem to be more likely to be self-employed than similar women
remaining in Germany.
TABLES 9 AND 10 ABOUT HERE
For all groups, immigrants seem much less likely to be unemployed than similar
people who did not migrate, thus suggesting that people may migrate when they have a good
chance of securing a job abroad. Table 9 suggests that immigrants are also less likely to have
a temporary job than similar people remaining in the country of origin, while Table 10 also
suggests that the proportion of temporary jobs is lower in the UK than in the other three
countries. Table 9 also confirms that part-time is most common among women – rather than
men – and that, with few exceptions, immigrants are less likely to work part-time than similar
20
people remaining in the country of origin. For Polish women the probability of working part-
time is much lower for those arrived after, than those arrived before the enlargement. Finally,
there do not seem to be striking differences in terms of second job holding.
5. Summary and conclusions
In this paper we describe changes in immigration from European countries into the UK
following the 2004 EU enlargement. We show that the 2004 enlargement represents a
turning point for the UK, characterised by a fast increase in immigration from EU8 countries,
and that the increasing trend seems to stop during the recent recession. The number of
immigrants from EU15 countries, instead, remains relatively stable over the whole period.
Immigrants from EU8 countries are significantly different than immigrants from
EU15 countries, and those who arrived after the 2004 enlargement differ significantly from
those arrived before. In contrast to EU15 and earlier EU8 immigrants, new EU8 immigrants
are less likely to locate to London and more evenly spread across regions in the UK. They
are comparatively more likely to be active in the labour market – as opposed to students or
inactive – and to be in paid employment and less likely to be self-employed or inactive.
Their distribution across industries is also different from that of British people and other
types of immigrants; they are less likely to work part-time but earn substantially lower wages.
We also find substantial differences between people who migrate to the UK and those who
remain in the country of origin.
Overall our results suggest that the elimination of barriers to immigration for EU8
countries has changed not only the number, but also the characteristics of immigrants.
Immigrants arriving after the elimination of immigration barriers locate in different regions
and in different segments of the UK labour market. One of the possible reasons for such
differences, which we cannot explore in this paper, is that these new types of immigrants are
more likely to be temporary, to accept relatively unfavourable working conditions in the UK
but also to remain for a limited period. If this is the case, a new type of immigration may
pose new challenges to socio-economic integration.

21
References
Aydemir, A. (2012) Skill Based Immigrant Selection and Labor Market Outcomes by Visa Category, IZA Discussion Paper No. 6433.
Belot, M.V.K. and Hatton, T.J. (Forthcoming) Immigrant Selection in the OECD. Scandinavian Journal of Economics.
Blanchflower, D.G. and Lawton, H. (2008) The Impact of the Recent Expansion of the EU on the UK Labour Market, IZA Discussion Paper No. 3695.
Blanchflower, D.G. and Shadforth, C. (2009) Fear, Unemployment and Migration. The Economic Journal 119(February): F136-F182.
Central Statistics Office Ireland (2007) Population Statistics, http://www.cso.ie/en/statistics/population.
Dobson, J.R. (2009) Labour Mobility and Migration within the EU Following the 2004 Central and East European Enlargement. Employee Relations 31(2): 121-138.
Drinkwater, S., Eade, J. and Garapich, M. (2009) Poles Apart? EU Enlargement and the Labour Market Outcomes of Immigrants in the United Kingdom. International Migration 47(1): 161-190.
Dustmann, C. (1999) Temporary Migration, Human Capital, and Language Fluency of Migrants. Scandinavian Journal of Economics 101(2): 297-314.
Dustmann, C., Casanova, M., Fertig, M., Preston, I.P. and Schmidt, C.M. (2003) The Impact of EU Enlargement on Migration Flows. London, Home Office Report 25/03.
Dustmann, C. and Weiss, Y. (2007) Return Migration: Theory and Empirical Evidence from the UK. British Journal of Industrial Relations 45(2): 236-256.
Fomina, J. (2009) Światy Równoległe – Wizerunek Własny Polaków W Wielkiej Brytanii (Eng. Parallel Worlds, Self Image of Poles in the Uk and Ireland), Polish Academy of Sciences Institute of Philosophy and Sociology, European Studies Unit, Working Paper no. 4/2009.
Garapich, M.P. (2008) Odyssean Refugees, Migrants and Power - Construction of 'Other' within the Polish Community in the UK. Citizenship, Political Engagement, and Belonging: Immigrants in Europe and the United States. Ed. by Reed-Danahay, D. and Brettell, C. London, Rutgers University Press: 124-143.
Gilpin, N., Henty, M., Lemos, S., Portes, J. and Bullen, C. (2006) The Impact of Free Movement of Workers from Central and Eastern Europe on the Uk Labour Market. London, Department of Work and Pensions Working Paper No. 29.
Home Office (2009) Accession Monitoring Report May 2004 - March 2009. London, Home Office. Iglicka, K. (2010) Powroty Polaków W Okresie Kryzysu Gospodarczego. W Pętli Pułapki
Migracyjnej (Eng. Return Migration of Poles Turing Economic Crisis. In the Migration Trap), Centrum Stosunków Międzynarodowych, Raporty i Analizy No.1/09
Johnson, T.P., O'Rourke, D., Burris, J. and Owens, L. (2002) Culture and Survey Nonresponse. Survey Nonresponse. Ed. by Groves, R., Dillman, D., Eltinge, J. and Little, R. New York, John Wiley and Sons.
Kahanec, M. (2012) Labor Mobility in an Enlarged European Union, IZA Discussion Paper No. 6485. McCollum, D. and Findlay, A. (2011) Trends in A8 Migration to the UK During the Recession.
Population Trends 145(Autumn): 1-13. Parutis, V. (Forthcoming) "Economic Migrants" Or "Middling Transnationals"? East European
Migrants' Experiences of Work in the UK. International Migration. Sahin, M., Nijkamp, P. and Baycant-Levent, T. (2007) Migrant Entrepreneurship from the Perspective
of Cultural Diversity. Handbook of Research on Ethnic Minority Entrepreneurship. Ed. by Dana, L.-P. Cheltenham (UK), Edward Elgar: 99-113.
22
Tables and Figures
Table 1: Sample descriptive statistics
British EU15 before enlargement
EU15 after enlargement
EU8 before enlargement
EU8 after enlargement
Female 0.492 0.534 0.529 0.613 0.484 Age 39 40 30 36 30 Years in the UK 39 23 2 12 2 Arrived after enlargement no yes no yes Arrived on or before 1991 0.695 0.265 Arrived 1992-2007 0.305 0.822 0.735 0.906 Arrived on or after 2008 0.178 0.094 Married 0.524 0.531 0.293 0.561 0.384 Dependent children 0.457 0.414 0.289 0.465 0.389 High education 0.335 0.336 0.429 0.263 0.142 Medium education 0.312 0.191 0.052 0.083 0.062 Low education 0.273 0.218 0.101 0.168 0.221 Other types of education 0.084 0.257 0.418 0.487 0.576 Years of schooling* 12 13 16 15 15 In paid employment 0.640 0.608 0.608 0.554 0.767 Self-employed 0.091 0.105 0.049 0.157 0.049 Gov. training programmes 0.005 0.005 0.002 0.004 0.001 Unemployed 0.043 0.042 0.062 0.045 0.052 Inactive 0.221 0.241 0.280 0.240 0.131 North East 0.058 0.023 0.017 0.017 0.025 Yorkshire and the Humber 0.093 0.055 0.044 0.050 0.102 East Midlands 0.075 0.050 0.055 0.040 0.110 East Anglia 0.039 0.036 0.059 0.038 0.062 London 0.077 0.273 0.356 0.498 0.148 Rest of South East 0.187 0.227 0.183 0.189 0.143 South West 0.083 0.073 0.035 0.039 0.063 West Midlands 0.088 0.063 0.035 0.034 0.079 North West 0.114 0.074 0.068 0.034 0.086 Wales 0.053 0.029 0.028 0.013 0.036 Scotland 0.096 0.055 0.076 0.044 0.088 Northern Ireland 0.039 0.044 0.043 0.005 0.057 Observations 767,067 16,120 1,127 1,600 3,409
Entries proportions for all variables except age, years of education and years in the UK, which are averages * Missing for a large part of respondents
23
Table 2: Region of residence
Reference: (1) (2) (3) (4) (5) (6) London North East Yorkshire and the Humber East Midlands East Anglia Rest of South East South West
EU15 -0.041* -0.035* -0.021* 0.002 0.059* 0.001
(0.002) (0.003) (0.002) (0.002) (0.003) (0.002) EU8 -0.039* -0.019+ -0.017+ 0.016* 0.078* -0.026*
(0.009) (0.009) (0.008) (0.005) (0.010) (0.009) EU15 arriving on or after 2004 -0.011 -0.015 0.011 0.024* -0.015 -0.051*
(0.011) (0.011) (0.009) (0.005) (0.012) (0.011) EU8 arriving on or after 2004 -0.009 0.021+ 0.042* 0.002 -0.105* 0.006
(0.010) (0.010) (0.009) (0.006) (0.013) (0.010)
(7) (8) (9) (10) (11)
West Midlands North West Wales Scotland Northern Ireland
EU15 -0.018* -0.029* -0.022* -0.037* 0.017*
(0.002) (0.003) (0.002) (0.003) (0.001) EU8 -0.040* -0.070* -0.044* -0.026* -0.041*
(0.010) (0.012) (0.009) (0.010) (0.010) EU15 arriving on or after 2004 -0.040* 0.005 0.007 0.040* 0.008
(0.012) (0.012) (0.008) (0.010) (0.006) EU8 arriving on or after 2004 0.028* 0.049* 0.027* 0.029* 0.067*
(0.011) (0.013) (0.010) (0.011) (0.010)
Observations 789,916 Log likelihood -1,875,153 Marginal effects of a multinomial probit model; standard errors in parenthesis; + Significant at 5%, * Significant at 1%. Other explanatory variables: dummies for women; married; whether dependent children; dummies for medium, low, other qualification; dummies for period of arrival (before 1992; after 2007); quarters and year of the survey
24
Table 3: Activity status
(1) (2) Reference: Active Men Women
Student Other inactive Student Other inactive
EU15 0.034* 0.023 0.018* 0.017 (0.006) (0.012) (0.006) (0.012)
EU8 0.016+ 0.048* 0.001 0.032 (0.008) (0.016) (0.008) (0.016)
EU15 arriving on or after 2004 0.005 -0.030 0.006 0.027 (0.005) (0.021) (0.006) (0.019)
EU8 arriving on or after 2004 -0.028* -0.105* -0.039* -0.071* (0.007) (0.017) (0.007) (0.016)
Observations 397,468 387,151 Log likelihood -165873 -231752 Marginal effects of a multinomial probit model; standard errors in parenthesis; + Significant at 5%, * Significant at 1%. Other explanatory variables: age; years in the UK (age for natives); dummies for women; married; whether dependent children; dummies for medium, low, other qualification; dummies for period of arrival (before 1992; after 2007); dummies for regions, quarters and year of the survey
Table 4: Employment status
(1) (2) Reference: In paid employment Men Women
Self-employed Unemployed Self-employed Unemployed
EU15 -0.010 0.000 0.005 -0.022* (0.014) (0.009) (0.009) (0.007)
EU8 0.118* 0.008 0.030* -0.025* (0.018) (0.012) (0.011) (0.010)
EU15 arriving on or after 2004 -0.061+ 0.010 -0.007 0.000 (0.024) (0.012) (0.014) (0.010)
EU8 arriving on or after 2004 -0.185* -0.036* -0.054* -0.011 (0.018) (0.012) (0.012) (0.009)
Observations 328,017 282,285 Log likelihood -203548 -116769 Marginal effects of a multinomial probit model; standard errors in parenthesis; + Significant at 5%, * Significant at 1%. Other explanatory variables: age; years in the UK (age for natives); dummies for women; married; whether dependent children; dummies for medium, low, other qualification; dummies for period of arrival (before 1992; after 2007); dummies for regions, quarters and year of the survey
25
Table 5: Industry
Men (1) (2) (3) (4) (5) (6) Ref: Agriculture, energy Manufacturing Construction Distribution hotels restaurants Financial services Transport Public sector
EU15 0.046+ -0.112* -0.006 0.035* 0.040* 0.026 (0.018) (0.015) (0.015) (0.013) (0.014) (0.015)
EU8 0.048 0.059* -0.040 -0.009 -0.032 -0.022 (0.027) (0.019) (0.022) (0.019) (0.022) (0.023)
EU15 arriving on or after 2004 0.031 -0.052 0.003 -0.001 0.027 -0.013 (0.027) (0.027) (0.021) (0.019) (0.019) (0.021)
EU8 arriving on or after 2004 0.140* -0.131* 0.016 0.069* -0.022* -0.069* (0.024) (0.017) (0.020) (0.017) (0.021) (0.023)
Observations 293,949 Log likelihood -522109
Women (1) (2) (3) (4) (5) Ref: Agriculture energy manufacturing Construction Distribution hotels restaurants Financial services Transport Public sector
EU15 0.019 0.014 0.006 0.007 -0.049+ (0.012) (0.016) (0.007) (0.014) (0.019)
EU8 0.035+ 0.105* -0.008 -0.007 -0.128* (0.017) (0.021) (0.010) (0.019) (0.027)
EU15 arriving on or after 2004 0.032 0.056+ -0.007 -0.030 -0.031 (0.018) (0.024) (0.011) (0.021) (0.030)
EU8 arriving on or after 2004 0.103* -0.045+ 0.030* -0.028 -0.070+ (0.015) (0.020) (0.010) (0.018) (0.027)
Observations 252,045 Log likelihood -336479 Marginal effects of a multinomial probit model; standard errors in parenthesis; + Significant at 5%, * Significant at 1%. Other explanatory variables: age; years in the UK (age for natives); dummies for women; married; whether dependent children; dummies for medium, low, other qualification; dummies for period of arrival (before 1992; after 2007); dummies for regions, quarters and year of the survey
26
Table 6: Job characteristics
(1) (2) (3) Temporary job Part-time job Second job Men Women Men Women Men Women
EU15 0.017+ -0.020* -0.005 0.003 -0.001 0.001 (0.008) (0.008) (0.010) (0.016) (0.007) (0.009)
EU8 0.022 -0.032* 0.002 -0.009 -0.008 -0.007 (0.012) (0.011) (0.015) (0.022) (0.012) (0.012)
EU15 arriving on or after 2004 0.001 -0.028* 0.003 -0.015 -0.033+ 0.039+ (0.010) (0.010) (0.015) (0.026) (0.016) (0.018)
EU8 arriving on or after 2004 0.012 -0.004 -0.041* 0.152* -0.011 0.018 (0.011) (0.010) (0.015) (0.022) (0.012) (0.012)
Observations 255,124 249,312 355,891 327,835 308,629 268,948 Log likelihood -46590 -53734 -98793 -203836 -42449 -56392 Marginal effects of a multinomial probit model; standard errors in parenthesis; + Significant at 5%, * Significant at 1%. Other explanatory variables: age; years in the UK (age for natives); dummies for women; married; whether dependent children; dummies for medium, low, other qualification; dummies for period of arrival (before 1992; after 2007); dummies for regions, quarters and year of the survey
Table 7: Wages
(1) Men
(2) Women
EU15 0.134*** 0.016 (0.024) (0.020) EU8 0.021 -0.233*** (0.038) (0.028) EU15 arriving on or after 2004 -0.001 -0.035 (0.034) (0.030) EU8 arriving on or after 2004 -0.186*** 0.034 (0.035) (0.026) R2 0.412 0.416 Observations 179,166 186,867 Standard errors in parenthesis; + Significant at 5%, * Significant at 1%. Other explanatory variables: age; years in the UK (age for natives); years of tenure in the job; dummies for women; married; whether dependent children; part-time; temporary job; dummies for medium, low, other qualification; dummies for period of arrival (before 1992; after 2007); dummies for regions, quarters and year of the survey
27
Table 8: Descriptive statistics (EU LFS)
Irish in Germans in Polish in
Ireland UK Germany UK Poland UK
Female 0.479 0.506 0.474 0.546 0.494 0.488 Age 37 45 39 36 38 30 Married 0.494 0.569 0.524 0.442 0.597 0.429 High education 0.238 0.346 0.216 0.425 0.137 0.174 Medium education 0.378 0.160 0.583 0.212 0.637 0.057 Low education 0.384 0.303 0.201 0.217 0.226 0.187 Other education 0.194 0.146 0.581 Years of education 13 12 16 14 14 15 In paid employment 0.568 0.573 0.627 0.653 0.437 0.749 Self-employed 0.117 0.113 0.072 0.079 0.114 0.083 Unemployed 0.038 0.036 0.070 0.049 0.078 0.039 Inactive 0.277 0.278 0.231 0.219 0.372 0.128 Observations 588,041 4,044 846,087 2,425 738,462 2,363 Years 2000-2009 2002-2009 2004-2009

28
Table 9: Comparison between immigrants to the UK and similar people remaining in the country of
origin
Individual Probability
(1) Men
(2) Women
Irish in:
Ireland
UK Arrived
1992-2004
UK Arrived
2004-2007
Ireland
UK Arrived
1992-2004
UK Arrived
2004-2007 Probability self-empl. 0.096 0.179 0.087 0.005 0.004 0.002 Probability unemployed 0.161 0.067 0.074 0.045 0.040 0.027 Probability temporary job 0.119 0.019 0.046 0.128 0.096 0.201 Probability part-time job 0.149 0.044 0.025 0.310 0.245 0.213 Probability second job 0.024 0.051 0.051 0.010 0.008 0.008 Germans in:
Germany
UK Arrived
1992-2004
UK Arrived
2004-2007
Germany
UK Arrived
1992-2004
UK Arrived
2004-2007 Probability self-empl. 0.021 0.017 0.011 0.007 0.016 0.020 Probability unemployed 0.034 0.068 0.012 0.020 0.018 0.029 Probability temporary job 0.207 0.054 0.088 0.214 0.096 0.096 Probability part-time job 0.111 0.159 0.152 0.283 0.250 0.086 Probability second job 0.027 0.030 0.036 0.040 0.044 0.044 Polish in:
Poland
UK Arrived
1992-2004
UK Arrived
2004-2007
Poland
UK Arrived
1992-2004
UK Arrived
2004-2007 Probability self-empl. 0.088 0.301 0.020 0.033 0.022 0.002 Probability unemployed 0.119 0.028 0.020 0.116 0.007 0.009 Probability temporary job 0.448 0.027 0.082 0.501 0.020 0.067 Probability part-time job 0.077 0.018 0.017 0.134 0.282 0.168 Probability second job 0.057 0.018 0.016 0.036 0.057 0.033 Probabilities referring to a representative person who is 30 years of age, has a medium level of education, is not married and has no dependent children. The representative person who has migrated to the UK lives in London, and the reference year is 2009, i.e. a year characterised by downturn in the UK.
Table 10: Comparison country averages in 2009
UK Ireland Germany Poland Percentage self-employed (over active population) 9.3 15.8 9.7 18.0 Unemployment rate 7.3 11.1 6.5 8.7 Percentage employees with temporary jobs 5.0 8.1 14.1 26.5 Percentage employees with part-time jobs 25.3 22.9 25.7 7.5 Percentage employees with two jobs 3.8 1.9 3.3 8.3

29
0
1000
002
0000
03
0000
040
0000
Num
ber
of Im
mig
rant
s
1997
q1
1998
q1
1999
q1
2000
q1
2001
q1
2002
q1
2003
q1
2004
q1
2005
q1
2006
q1
2007
q1
2008
q1
2009
q1
2010
q1
2011
q1
quarter
Tot EU15 Immigrants
Tot EU8 Immigrants
050
0000
100
0000
150
0000
Num
ber
of Im
mig
rant
s
1996
1997
1998
1999
2000
2001
2002
2003
2004
2005
2006
2007
2008
2009
2010
2011
year
Tot EU15 Immigrants
Tot EU8 Immigrants
Figure 1: Number of immigrants in the UK LFS (weighted quarterly and yearly data)
020
000
400
0060
000
800
00
Num
ber
of R
ecen
t Im
mig
rant
s
1997
q1
1998
q1
1999
q1
2000
q1
2001
q1
2002
q1
2003
q1
2004
q1
2005
q1
2006
q1
2007
q1
2008
q1
2009
q1
2010
q1
2011
q1
quarter
Recent EU15 Immigrants
Recent EU8 Immigrants
05
0000
100
000
1500
0020
000
0
Num
ber
of R
ecen
t Im
mig
rant
s
1996
1997
1998
1999
2000
2001
2002
2003
2004
2005
2006
2007
2008
2009
2010
2011
year
Recent EU15 Immigrants
Recent EU8 Immigrants
Figure 2: Number of recent immigrants (1-2 years) in the UK LFS (weighted quarterly and yearly
data)