european industrial bioenergy initiative (eibi) eii 2013-2017 ip.pdf · (2) to strengthen eu...
TRANSCRIPT
1
European Industrial Bioenergy Initiative (EIBI)
Boosting the Contribution of Bioenergy to the EU Climate and Energy ambitions
Implementation Plan 2013 - 2017
Version of 24 January 2014
PREAMBLE
Since the official launch of EIBI in November 2010 a number of activities have taken place or are in the
process of implementation. So far in the scope of the EIBI a call for Expression of Interest (EoI) was
carried out which resulted in 53 submissions of potential EIBI projects of which 30 projects have
complied or nearly complied with the EIBI specifications. The results from the EIBI EoI show the huge
interest of the European Biofuels Industry in the EIBI and biofuels deployment.
Under FP7, the ERA-NET+ instrument pooling EU and MS funding has been used to support bioenergy
demonstration plants contributing to the implementation of the EIBI. Beyond these, some measures such
as FP7 demonstration projects, NER300 projects as well as relevant Members States projects (see annex
A) have made or are going to make contributions to the ambitious energy targets for 2020 set by the EU.
For biofuels alone, to reach a production capacity of 6Mtoe, approximately 30 large bioenergy plants are
needed in the next seven years, which is a very ambitious goal with regard to the investment needs and the
time needed for the construction of these capacities. The proposed EIBI schedule is set very tight which
strengthens the need to secure financing and long term political frameworks in the very near future.
This document proposes an Implementation Plan for the EIBI, for the period 2013-2017. For this purpose,
a number of actions are described (i.e. programme of demonstration1 and flagship
2 projects plus two
complementary activities), which are considered necessary to achieve the Initiative's objectives. Further
to this, some aspects of the implementation are also suggested for the different actions.
However, these implementation aspects still need to be streamlined and further defined, as some of the
issues associated to them are currently under discussion within the wider context of the overall SET-Plan
implementation (e.g. funding instruments, governance) and the preparation of the Horizon 2020
Framework Programme. Depending on the outcome of the on-going work, some adaptation may be
necessary. The EIBI Team is thus expected to keep working on the implementation modalities, under the
guidance of the SET-Plan Steering Group.
1. BACKGROUND, SCOPE & OBJECTIVES OF THE EIBI
1 Demonstration plants are considered the last non-economic step to demonstrate the performance and technical reliability of a
complete conversion concept in a value chain so that the the first-of-a-kind, commercial-scale industrial unit can be designed
with sufficient confidence for the investment (TRL 6-7). 2 Flagship plants are the first-of-a-kind, commercial-scale industrial demonstration units aiming at validating operational
sustainability and financial viability of a complete conversion concept defined by one of the value chains (TRL 8).
2
Bioenergy will play a key role in the EU long term energy strategy for all applications and especially the
transport sector, contributing up to 14 % of the EU energy mix and up to 10 % of energy demand in
transport in 20203. It is foreseeable that this EU demand will be dominated by renewable fuels substituting
gasoline, and middle distillates for the need of the road, aviation and marine transport sectors.
The feedstocks and bioenergy production technologies which are currently deployed already provide a
significant contribution, but will not be sufficient to reach these targets. The purpose of the EIBI is to
boost the contribution of sustainable4 bioenergy
5 to EU 2020 climate and energy objectives, with a
focused approach leveraging on public-private partnership to manage the risks and share the
financing.
Significant R&D and pilot activities have been going on for the past decade in EU Member States to
enlarge the feedstock basis and to develop processing technologies able to deal with a wider feedstock
basis, enhance feedstock conversion in valuable energy and co-products, minimize overall energy
consumption and meet EU sustainability criteria. These new processing technologies cannot be developed
at industrial scale on a stand-alone basis but as part of commercial “value chains”, i.e. integrated process
schemes, from feedstock to end products.
The scope of the EIBI is focused on innovative bioenergy value chains6 which are not yet
commercially available, and which could bring significant contribution to the bioenergy markets by
large scale deployment (large single units or larger number of smaller units), whilst complying with
the current sustainability requirements set in relevant EU legislation7.
The specific objectives of the EIBI are
(1) to enable commercial availability of advanced bioenergy at large scale by 2020, aiming
at production costs8 allowing competitiveness with fossil fuels at the prevailing economic
and regulatory market conditions, and advanced biofuels9, covering 6 to 9 Mtoe, i.e.
10at
least a minimum of 2 % of EU transportation energy needs by 2020. The rationale behind
3 Renewable Energy Roadmap — Renewable energies in the 21st century: building a more sustainable future, Communication
from the Commission to the European Parliament and the European Council Com (2006) 848, 10 Jan 2007 4 Throughout this document, the words “sustainability” and “sustainable” are covering three dimensions: social, environmental,
economic. 5 Bioenergy: heat and/or electricity and/or fuels produced at industrial scale from bio-resources (dedicated crops, agricultural
and forestry residues, municipal and industrial wastes and algae) 6 Value chain: specific combination of feedstock, processing technologies and marketable end-products. 7 Sustainability requirements as settled in the latest versions of the relevant RES Directive (2009/28/EC) and Fuel Quality
Directive (2009/30/EC) of the European Union 8 Production cost of biofuels depends heavily on investment intensity, on the degree of utilization of primary energy and on
feedstock price, with significant differences across geographic areas and specific feedstock types. 9 Advanced biofuels are biofuels typically produced from non-food/feed feedstocks such as woody biomass, wastes and
residues (i.e. wood, wheat straw, municipal waste), non-food crops (i.e. grasses, miscanthus) or algae:
Targeting similar or better end product properties than the biofuels currently on the market,
Having low carbon dioxide emission or high GHG reduction1,
Demonstrating high sustainability1 1 In accordance with the RED (2009/28/EC) and FQD (2009/30/EC) provisions.
10 Target amount of advanced biofuels as presented in the proposal COM(2012)595 for a Directive of the European Parliament
and of the Council amending Directive 98/70/EC relating to the quality of petrol and diesel fuels and amending Directive
2009/28/EC on the promotion of the use of energy from renewable sources from 17 Oct 2012.
3
the proposal of the target of at least a minimum of 2 % of EU transportation needs is based
on the compliance with the proposed revision COM(2012)595 of the RED and FQD.
(2) to strengthen EU technology leadership for renewable transport fuels, serving the fastest
growing area of transport fuels in the world
(3) to contribute to the targets of the Renewable Energy Directive of increasing the
percentage of renewable energy to 20 % through the increase of high efficiency CHP.
Because of the scale of investment needed and the risks involved (technology, feedstock & end product
prices, regulatory framework evolution), financing the latest stages of development of innovative
bioenergy technologies is a major obstacle for large scale industrial deployment of these
technologies. In order to meet the objective of producing 6 to 9 MToe of advanced biofuels by 2020,
substantial financial input is needed. Assuming a typical advanced biofuels unit has a capacity of 200
kToe/y, already for the 6 MToe objective 30 such units would need to be up and running by 2020.
Assuming a 3 year time line between decision to build and start up, and no decision to build before a
flagship unit (“first of its kind”) has been operating for at least 6 months, 30 units would need to be
decided by 2017. At 500 M€/unit, this would represent cumulative investments of 15 bn€. The main
challenge of the EIBI is to tackle this issue by leveraging on public-private partnerships based on efficient
governance and relevant funding sources and mechanisms.
The core activities of the EIBI aim at building and operating demonstration projects and/or flagship
plants for innovative bioenergy value chains with large market potential11
.
Seven such innovative bioenergy value chains have been identified (see chapter 2.1), which could bring
significant contributions to EU ambitious objectives, in addition to existing bioenergy value chains.
Within each of these “generic” value chains, different paths based on different biomass feedstocks
(including fossil co-processing), conversion technologies and/or energy products are possible, leading to a
wide range of options. Selecting the most relevant options cannot be achieved at a generic level, outside a
specific context of locally available feedstocks and targeted end products serving clearly identified
markets requesting them.
The EIBI is proposing a pragmatic approach to select the most promising options, based on
transparent criteria reflecting a set of key economic, environmental and social performances
expected. Its flexibility will allow adjusting the programme to the priorities of the EU and of the
Member States willing to join forces to boost the development of innovative bioenergy in Europe,
encouraging industry and technology champions to team up with the relevant European partners
and reach the capability and scale to bring a significant contribution to EU climate and energy
ambitions and compete on the world markets.
In line with the EU ambitions on climate and energy, sustainability aspects are central to the EIBI.
Economic, social and environmental sustainability is at the heart of the criteria proposed to evaluate
and select projects within this initiative (cf. section 3.2), and this along the whole value chain.
Further to this, a specific complementary activity is proposed to tackle the critical issue of
sustainable biomass supply (cf. section 4.1).
This paper describes the core activities needed for the phase between 2013 and 2017, in order to select,
fund, build and operate demonstration projects and flagship plants for the most promising options ready
for pre-industrial and/or industrial deployment. The complementary measures to be initiated during the
same period are also described. This document also suggests implementation modalities for the activities.
11 See pages 6 and 7 for the difference between funding mechanisms for demonstration and flagship plants.
4
If needed and decided by the EIBI Team, a revision of the Implementation Plan during the timeframe can
be anticipated.
For these actions to be possible and to give the programme credibility, it is crucial that adequate public-
private governance structures and funding mechanisms are defined as well as relevant funding secured. In
that context, the European Industrial Bioenergy Initiative closely cooperates with the Private Public
Partnership on Biobased Industries (Bio-based Industries Initiative)12
.
12 More information on the Bio-Based Industries Initiative: http://biconsortium.eu/
5
2. IMPLEMENTATION ACTIONS FOR 2013-2017
2.1 Overview of core activities
The core activity or “Implementation Actions for 2013-2017” aims at building and operating the early
demonstration and/or flagship projects which are ready to be deployed. The suggested implementation
approach is to use selection procedures already established for demonstration and flagship plants. This
document is presenting the complete scope of value chains of potential relevance to the EIBI. In principle,
within each of these seven “generic” value chains, “specific” value chains have the potential to be
developed to industrial scale based on existing technology and know-how developed up to pilot and
demonstration scale. In practise, authorities providing the public funding might decide to narrow the focus
to certain value chains and/or to “demonstration only” or “flagship only” projects, depending on the
sources, type and amount of funding. The EIBI is built as a coherent and flexible programme, adjusting to
level and sources of funding available, as they might evolve over time.
A main challenge to select the winning options is the diversity of bioenergy value chains of potential
relevance across the EU because of the diversity of feedstock situations and the different national
bioenergy markets, offering different level of support for the biofuels, bioheat and bioelectricity end
products. The seven value chains listed below reflect the variety of feedstocks and processing
technologies that will serve the advanced bioenergy markets of 2020. Each of the seven value chains is
viewed as an energy-driven biorefinery. Some of them may also produce high value by-products, e.g.
chemicals. These by-products might be produced aside the main energy products (fuels, power and heat) if
they contribute to the viability of a project. As indicated in the eligibility criteria, at least 70% of the
bioproducts produced by the plant shall be bioenergy, calculated on the basis of energy content of the
products sold.
Although significant efforts to develop processing technologies based on thermochemical and biological
pathways have been on going in the EU for more than a decade, there is a significant variation in the level
of maturity of technology options within each value chains. The few already existing demonstration
projects for specific variations of certain value chains do not allow concluding that these provide the best
approach and that no alternative route would deserve funding. Each value chain has the potential to
present relevant candidates between 2013 and 2017. These potential demonstration and flagship plants are
legitimate candidates to apply for funding under the EIBI. There is no fair, transparent and rational basis
to exclude “à priori” neither any of the 7 value chains nor specific variations of any of them. However,
value chain 7 “Energy carriers produced by photosynthetic microorganisms (algae or cyanobacteria)” is
less mature than other value chains at this moment. Thus, this value chain might not be eligible for
flagship plants at present technology status. But, the potential to shift this dynamics through technical
improvements exists and the learning rate is higher than that of other value chains so demo plants are
expected before the end of this decade. Hence the corner stone of the EIBI approach would be to
evaluate and select projects on the basis of transparent selection criteria.
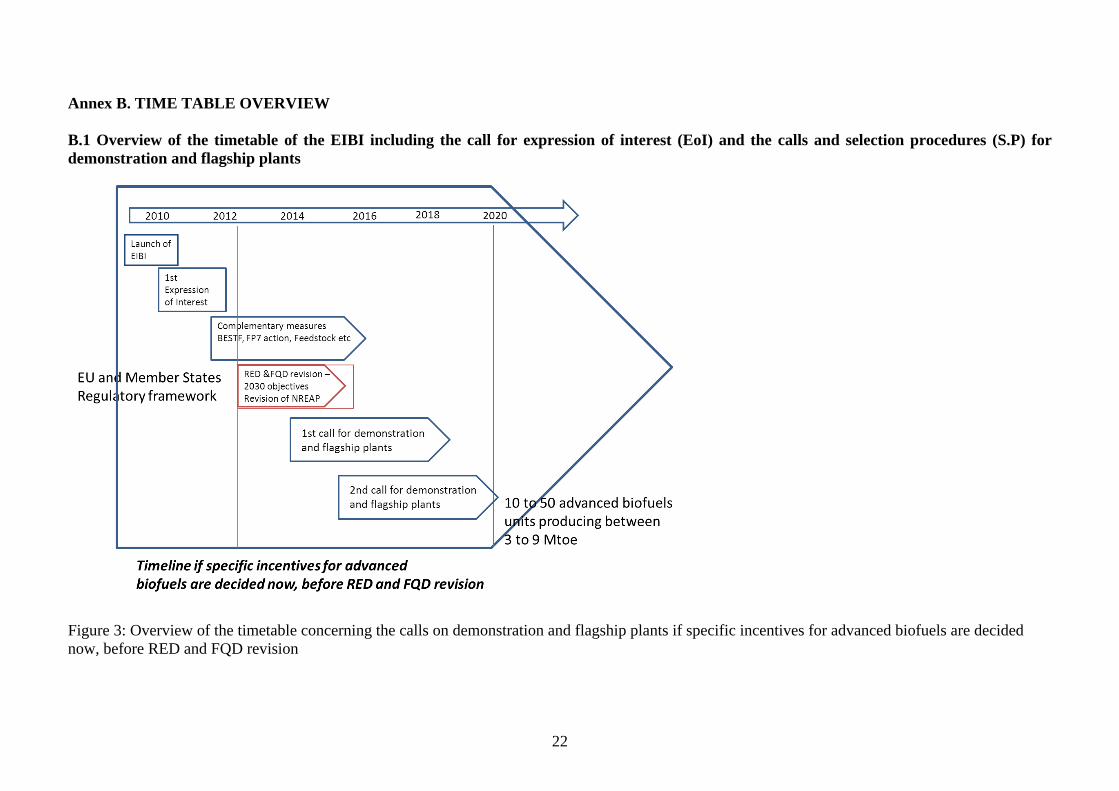
The selection procedures for demonstration plants (described in section 2.2) and for flagship plants
(section 2.3) require the existence of adequate funding programmes. Possible timelines for the
implementation are displayed in Annex b. Figures 3 and 4 depict two different scenarios for the selection
procedures of demonstration and flagship plants and other EIBI activities based on assumptions that either
interim support to the financing of the plants will happen before the revision of the RED and FQD (figure
3) or the assumption that the investment decisions are delayed (figure 4). Based on the EoI results which
demonstrate that the different value chains have reached different levels of maturity, not separated, but
rather combined calls for demonstration- and flagship plants will be issued.
6
These combined call for demonstration- and flagship plants will be an instrument to accommodate the
varying level of maturity of the seven value chains.
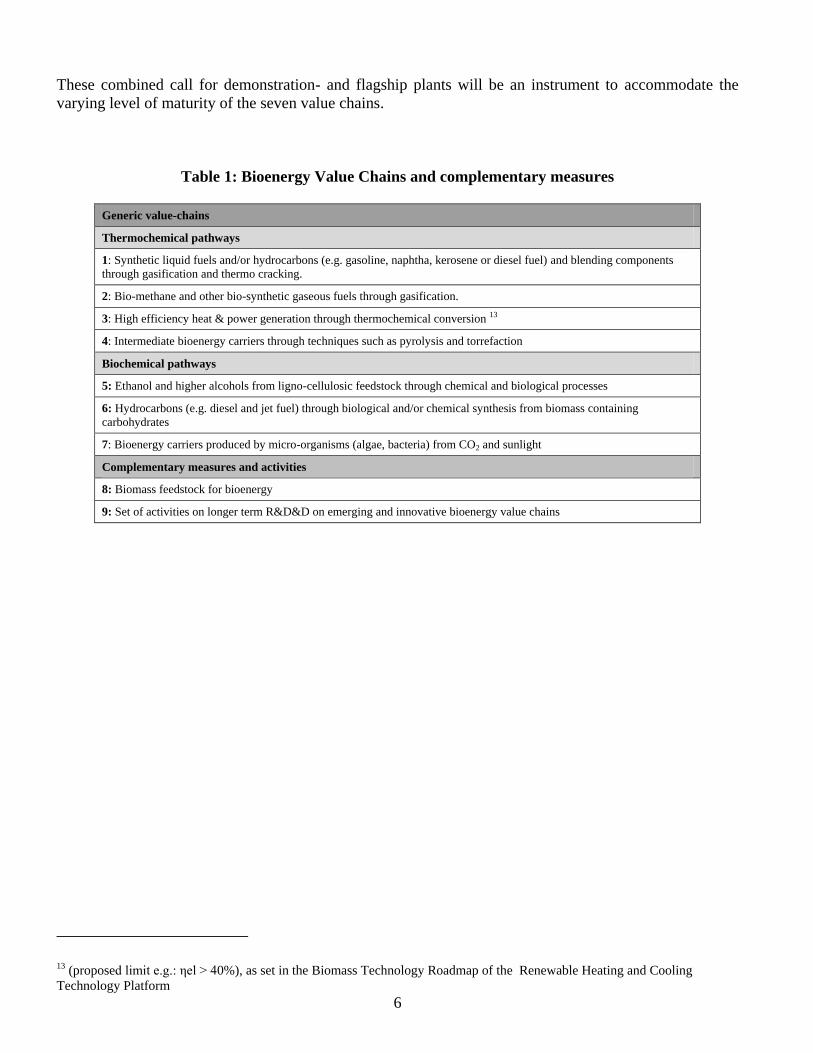
Table 1: Bioenergy Value Chains and complementary measures
Generic value-chains
Thermochemical pathways
1: Synthetic liquid fuels and/or hydrocarbons (e.g. gasoline, naphtha, kerosene or diesel fuel) and blending components
through gasification and thermo cracking.
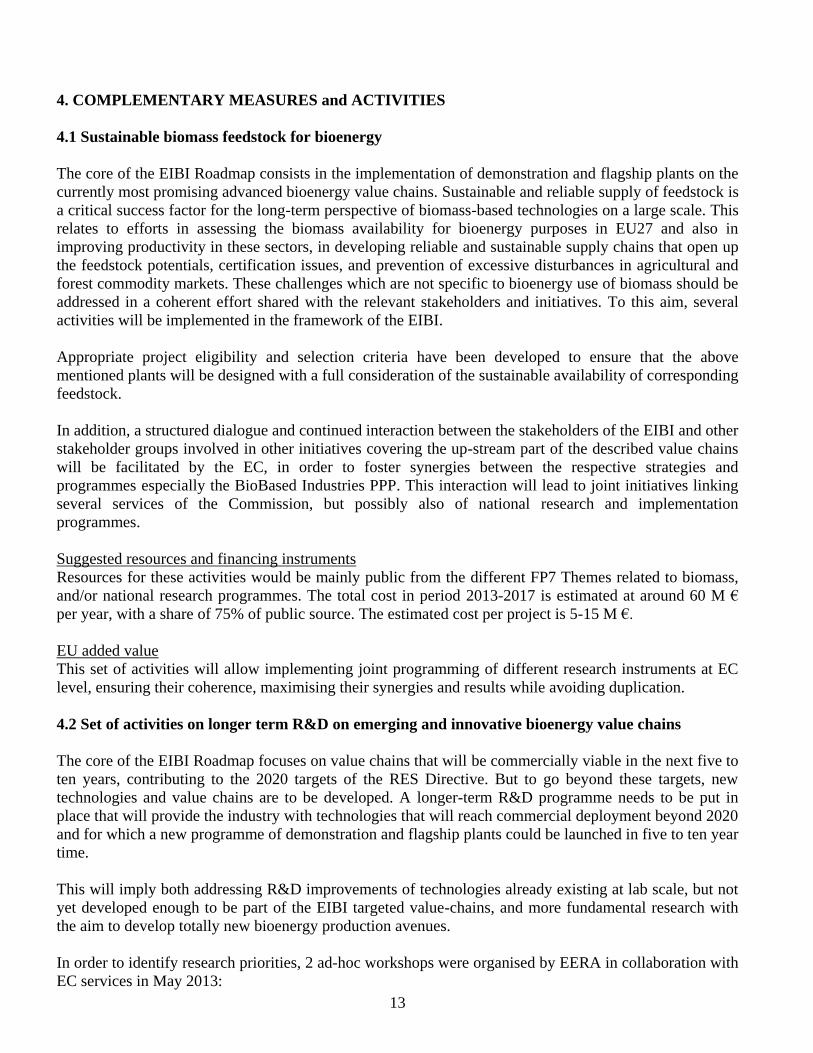
2: Bio-methane and other bio-synthetic gaseous fuels through gasification.
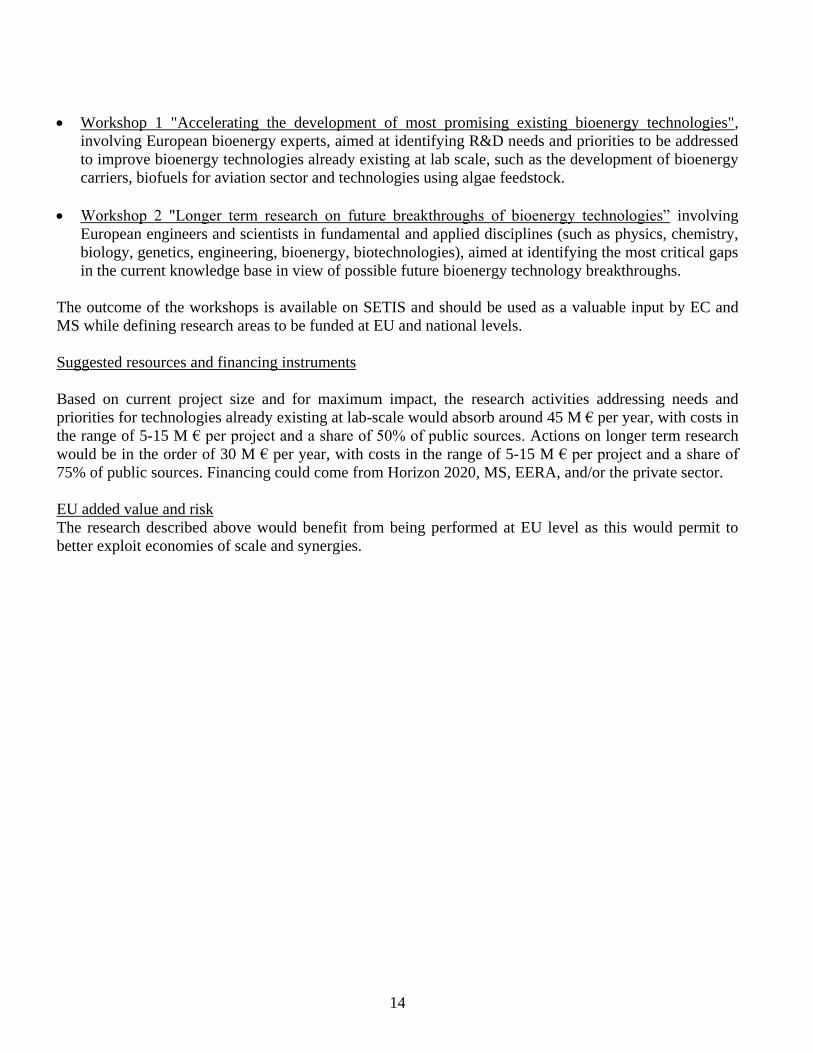
3: High efficiency heat & power generation through thermochemical conversion 13
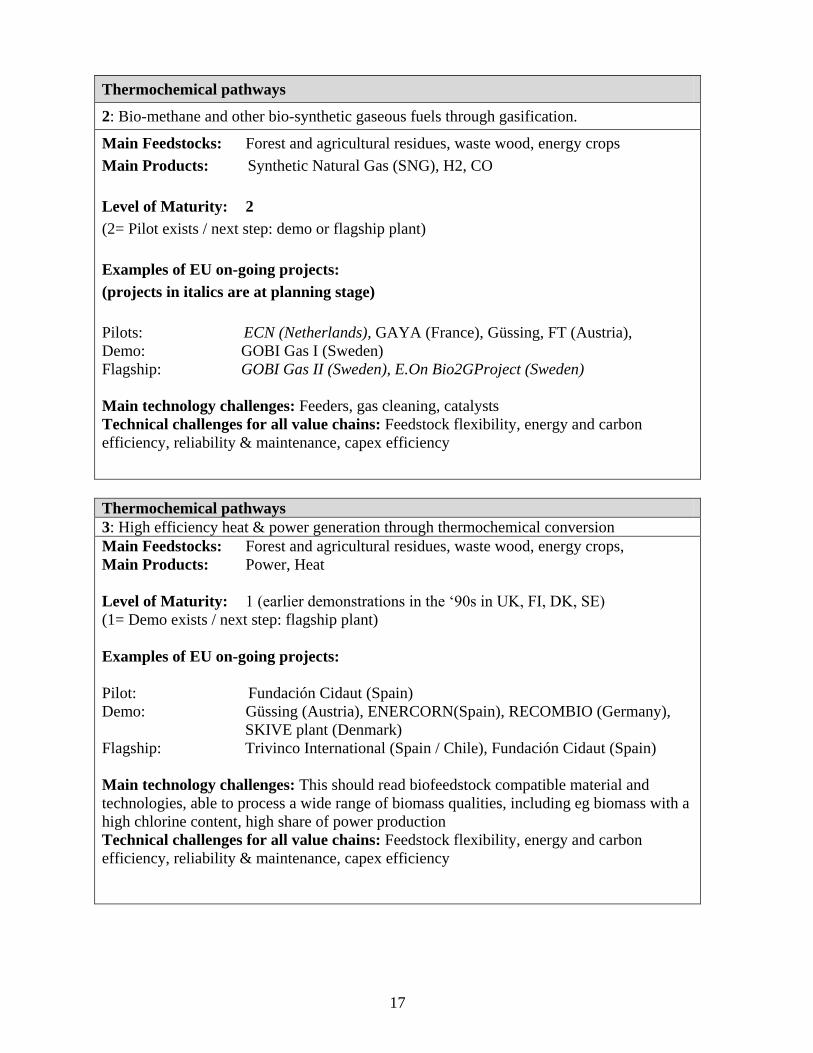
4: Intermediate bioenergy carriers through techniques such as pyrolysis and torrefaction
Biochemical pathways
5: Ethanol and higher alcohols from ligno-cellulosic feedstock through chemical and biological processes
6: Hydrocarbons (e.g. diesel and jet fuel) through biological and/or chemical synthesis from biomass containing
carbohydrates
7: Bioenergy carriers produced by micro-organisms (algae, bacteria) from CO2 and sunlight
Complementary measures and activities
8: Biomass feedstock for bioenergy
9: Set of activities on longer term R&D&D on emerging and innovative bioenergy value chains
13 (proposed limit e.g.: ηel > 40%), as set in the Biomass Technology Roadmap of the Renewable Heating and Cooling
Technology Platform
7
2.2 Demonstration plants
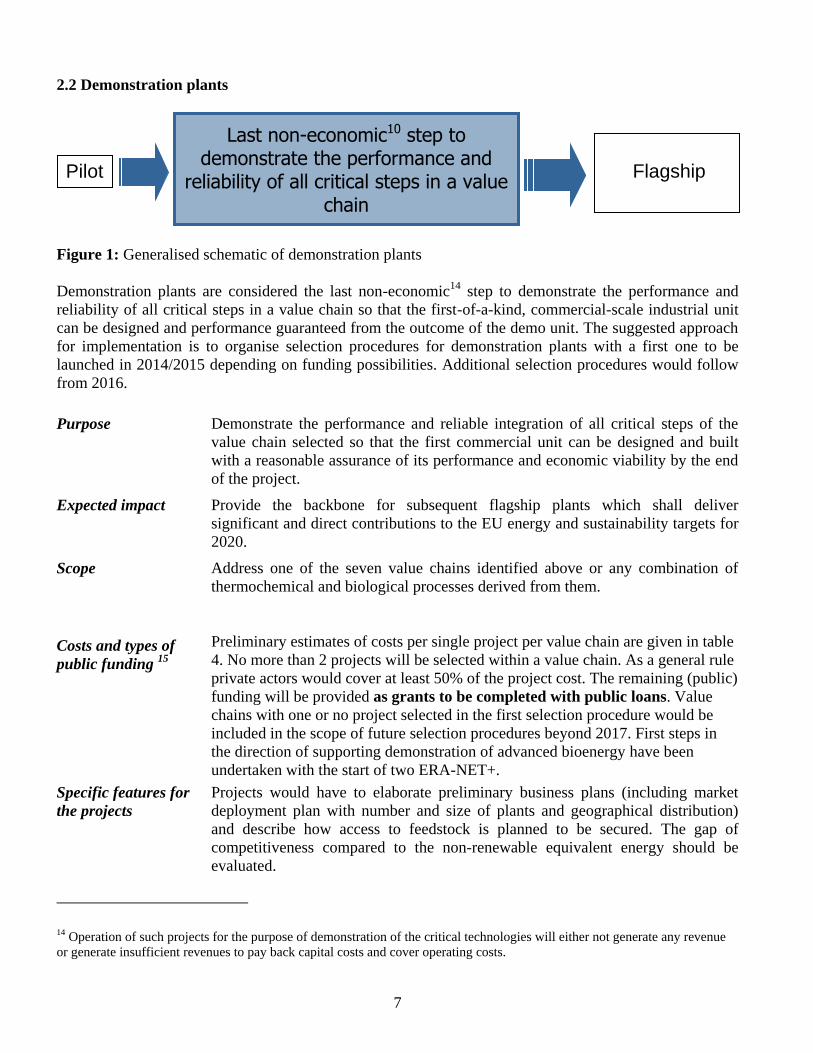
Figure 1: Generalised schematic of demonstration plants
Demonstration plants are considered the last non-economic14
step to demonstrate the performance and
reliability of all critical steps in a value chain so that the first-of-a-kind, commercial-scale industrial unit
can be designed and performance guaranteed from the outcome of the demo unit. The suggested approach
for implementation is to organise selection procedures for demonstration plants with a first one to be
launched in 2014/2015 depending on funding possibilities. Additional selection procedures would follow
from 2016.
Purpose Demonstrate the performance and reliable integration of all critical steps of the
value chain selected so that the first commercial unit can be designed and built
with a reasonable assurance of its performance and economic viability by the end
of the project.
Expected impact Provide the backbone for subsequent flagship plants which shall deliver
significant and direct contributions to the EU energy and sustainability targets for
2020.
Scope Address one of the seven value chains identified above or any combination of
thermochemical and biological processes derived from them.
Costs and types of
public funding 15
Preliminary estimates of costs per single project per value chain are given in table
4. No more than 2 projects will be selected within a value chain. As a general rule
private actors would cover at least 50% of the project cost. The remaining (public)
funding will be provided as grants to be completed with public loans. Value
chains with one or no project selected in the first selection procedure would be
included in the scope of future selection procedures beyond 2017. First steps in
the direction of supporting demonstration of advanced bioenergy have been
undertaken with the start of two ERA-NET+.
Specific features for
the projects
Projects would have to elaborate preliminary business plans (including market
deployment plan with number and size of plants and geographical distribution)
and describe how access to feedstock is planned to be secured. The gap of
competitiveness compared to the non-renewable equivalent energy should be
evaluated.
14 Operation of such projects for the purpose of demonstration of the critical technologies will either not generate any revenue
or generate insufficient revenues to pay back capital costs and cover operating costs.
Last non-economic10 step to demonstrate the performance and
reliability of all critical steps in a value chain
Pilot
Flagship
8
R&D components directly supporting the demonstration activity would be eligible
and get funding via existing R&D funding schemes at EU and national level.
Projects would have to include a clear description of the rationale for public
funding as well as sustainability assessment on the basis of a robust life-cycle
analysis approach for the entire value chain from feedstock production to the end
product.
2.3 Flagship plants
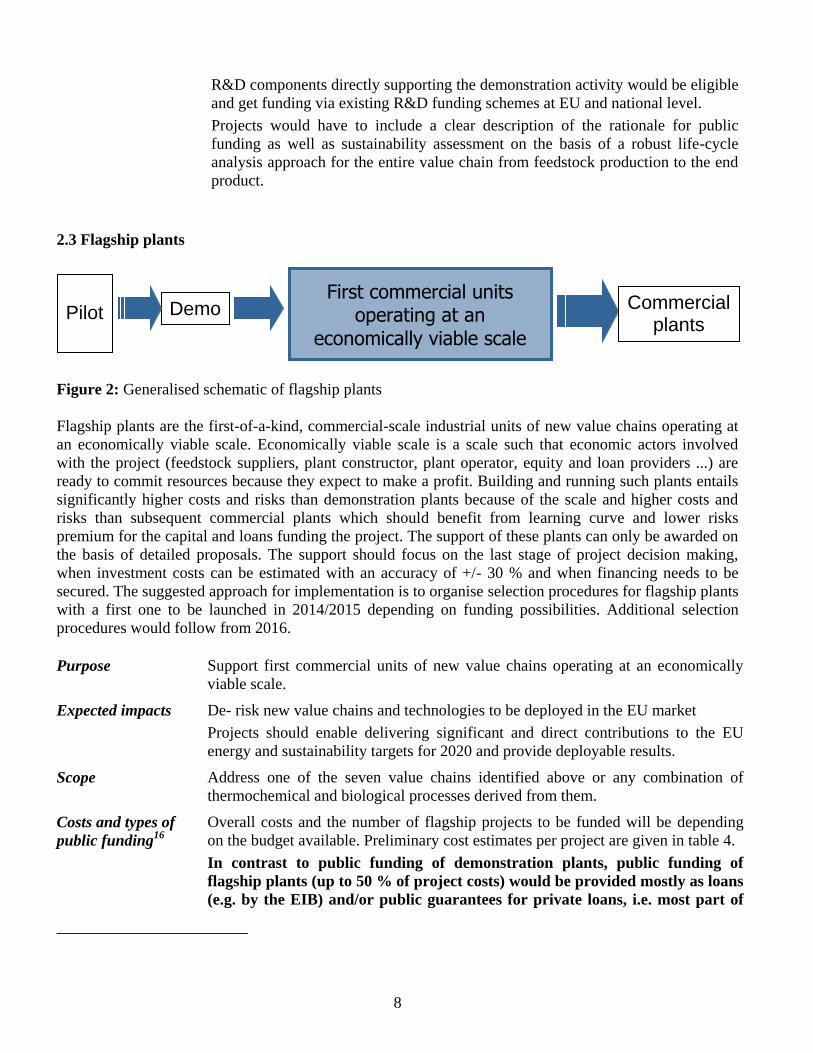
Figure 2: Generalised schematic of flagship plants
Flagship plants are the first-of-a-kind, commercial-scale industrial units of new value chains operating at
an economically viable scale. Economically viable scale is a scale such that economic actors involved
with the project (feedstock suppliers, plant constructor, plant operator, equity and loan providers ...) are
ready to commit resources because they expect to make a profit. Building and running such plants entails
significantly higher costs and risks than demonstration plants because of the scale and higher costs and
risks than subsequent commercial plants which should benefit from learning curve and lower risks
premium for the capital and loans funding the project. The support of these plants can only be awarded on
the basis of detailed proposals. The support should focus on the last stage of project decision making,
when investment costs can be estimated with an accuracy of +/- 30 % and when financing needs to be
secured. The suggested approach for implementation is to organise selection procedures for flagship plants
with a first one to be launched in 2014/2015 depending on funding possibilities. Additional selection
procedures would follow from 2016.
Purpose Support first commercial units of new value chains operating at an economically
viable scale.
Expected impacts De- risk new value chains and technologies to be deployed in the EU market
Projects should enable delivering significant and direct contributions to the EU
energy and sustainability targets for 2020 and provide deployable results.
Scope Address one of the seven value chains identified above or any combination of
thermochemical and biological processes derived from them.
Costs and types of
public funding16
Overall costs and the number of flagship projects to be funded will be depending
on the budget available. Preliminary cost estimates per project are given in table 4.
In contrast to public funding of demonstration plants, public funding of
flagship plants (up to 50 % of project costs) would be provided mostly as loans
(e.g. by the EIB) and/or public guarantees for private loans, i.e. most part of
First commercial units operating at an
economically viable scale
Demo Commercial plants
Pilot
9
the funding will be provided by private actors.
Specific features for
projects
Projects would have to present complete business plans (including subsequent
market deployment plans with the number, size of plants and foreseen geographical
distribution) as well as present commercial strategies and pre contractual
commitments from credible partners for both feedstock sourcing and end product
marketing.
Demonstration stage must have been passed successfully, otherwise it must be
explained why the demonstration step is not necessary.
It would be mandatory for projects to include a sustainability assessment on the
basis of a robust life-cycle analysis approach for the entire value chain from
feedstock production to the end product.
2.4 Overall estimated costs for 2013-2017
Assuming that for each of the 7 generic value chains one demonstration and one flagship project would be
selected, this would represent (public17
and private) funding requirements of up to app. 2800 M€ (sum of
the higher range of demo and flagship projects cost estimate amount to app. 2800 M€, i.e. about 35% of
the total cost of EIBI over the 10 years).
17 The term “public funding” used throughout this document encompasses very different tools such as grants, loans and loan
guarantees. Adding them up is both meaningless and misleading.
10
3. IMPLEMENTATION MODALITIES AND MONITORING
3.1 General principles for the project selection procedures
EIBI stakeholders (industry, academia, NGOs), MS, EC and financing community (e.g. EIB) have
worked together and defined a robust set of eligibility and selection criteria, as written down in the
“Project eligibility and selection criteria” from October 2010 (see Annex D).
In order to align with the evolution of the situation at EU level and industry readiness, a call of
expression of interest was organised in 2011 (cf. below). It allowed developing a clear picture of
the number and types of projects ready to apply.
Projects would be funded on a flexible basis involving MS resources, EIB loans, loan guarantee
and other possible sources of funding. The selection procedures would follow specifically
designed organisational modalities to be fine-tuned with the authorities providing public funding.
The EC will facilitate interactions between the different European funding schemes such as
Horizon 2020, EIB and NER300, and with national programmes to avoid duplication, and optimize
the use of resources and the impact of all schemes.
Objective of the Calls for Expression of Interest and results of the first call
Calls for expression of interest would be issued in order to update the EIBI partners (Industry, MS, EC
and associated members) on the actual stage of development of Bioenergy projects in the EU
corresponding to the specificities of the EIBI demonstration and flagship projects. Number and intervals
of Calls for expression of interest will be decided by the EIBI team.
It would follow a simplified and light procedure, involving:
The submission of a short project description (specific templates for demo and flagship projects),
presenting technology options, bioenergy end products targets, main partners, location of the plant,
feedstock base, budget requirements and funding approach.
A review process undertaken by a small dedicated working group of experts nominated by the
EIBI team, with the objective to determine which of the projects meet the minimum requirements
of the EIBI so that EIBI team can inform the proponents accordingly.
SETIS as a tool for managing the submission and review process, as well as the information
flows18
.
There would be no scoring and no "Go" / "No Go" statement, the essential objective being to "inform the
process" of promoting new European public/private partnership in the area of Bioenergy. It is a
complement and contribution to the work of SETIS, with a particular focus on the requirements of the
EIBI.
18 SETIS: Strategic Energy Technologiy Information System, setis.ec.europa.eu
11
A first call for expression of interest (EoI) was carried out with deadline for submission in autumn 2011.
The scope of the EoI was to establish a clear picture of the industrial interest and readiness around the
seven generic value chains. The results from the Expression of Interest showed that from 53 submissions
15 flagship and 15 demonstration plants would be eligible (completely or possibly eligible) for EIBI
funding. It needs to be taken into account that the EoI was not a pre-selection procedure for the EIBI, thus
might not have received the full industrial attention.
3.2 Summary approach for project eligibility and selection criteria
A set of criteria, reflecting the key features of the EIBI, has been prepared to evaluate and select the
demonstration and flagship projects within the initiative. The EIBI Project Eligibility and Selection
Criteria consist of four criteria. The first concern the administrative aspects of each application, which
relate to whether the project can be admitted for evaluation, thus it addresses formal eligibility aspects.
The second criteria concern the overall aims and objectives of each project and whether these are within
the overall aims and objectives of the EIBI, thus it addresses the compatibility of the project with the
EIBI. Finally the last two criteria address respectively the overall project and overall technology
objectives and how reliable, accurate, traceable and realistic the planning, the technical, environmental,
economic and market assumptions made in the project are. The scoring of the project and technology
criteria is weighted in order to prioritise the most important criteria.
The following key principles shape the architecture of the eligibility and evaluation criteria:
EU dimension and Industrial leadership: Consortium actors from different Member States or
Associated Countries, with at least 2 industrial actors and a science & technology actor19
.
Scale/Maturity (for demonstration plants): the scale should be high enough to be able to prove
technical and economic performance and provide enough data so that the technology can be
realistically scaled-up to industrial size after successful operation of the demonstration.
Minimum bioenergy content: At least 70% of the bioproducts produced by the plant shall be
bioenergy (biofuels, heat, power) calculated on basis of energy content of the products sold.
Innovation: At least one “technology brick” or the integration of “technology bricks” within the
considered value chain should not have been deployed at demonstration/commercial scale.
Timeline: The operation of demonstration and flagship plants receiving support under the 1st Call
and 2nd
Call of Projects must be planned no later than four years after the approval for construction
Feedstock: Realistic scenario for feedstock sourcing for future industrial units should be described
and volume potential of corresponding bioenergy market should be outlined.
Sustainability: in accordance with the RED (2009/28/EC) and FQD (2009/30/EC) provisions.
The Project Eligibility and Selection Criteria document is presented as annex D to this Implementation
Plan.
20 The Key performance Indicators can be found at SETIS: http://setis.ec.europa.eu/implementation/eii/eii-key-performance-
indicators/KPIs_EIBI/view
12
3.3 Monitoring of demonstration and flagship projects (Key Performance Indicators)20
Monitoring is necessary on two levels: first on the level of the EIBI programme, second on the level of the
individual projects. The outcome of the demonstration and flagship plants built as results of the above
mentioned selection procedures will be monitored by the EIBI Team. Key performance indicators (KPIs)
will be used as a measure of performance of the project which applies for funding under the EIBI. KPIs to
monitor the progress of projects from a technological point of view have been developed jointly by
representatives of the European Commission, including the Joint Research Centre, and the EBTP. They
have been presented to and agreed by the EIBI Team.
The agreed list of KPIs is presented as annex C to this Implementation Plan.
20 The Key performance Indicators can be found at SETIS: http://setis.ec.europa.eu/implementation/eii/eii-key-performance-
indicators/KPIs_EIBI/view
13
4. COMPLEMENTARY MEASURES and ACTIVITIES
4.1 Sustainable biomass feedstock for bioenergy
The core of the EIBI Roadmap consists in the implementation of demonstration and flagship plants on the
currently most promising advanced bioenergy value chains. Sustainable and reliable supply of feedstock is
a critical success factor for the long-term perspective of biomass-based technologies on a large scale. This
relates to efforts in assessing the biomass availability for bioenergy purposes in EU27 and also in
improving productivity in these sectors, in developing reliable and sustainable supply chains that open up
the feedstock potentials, certification issues, and prevention of excessive disturbances in agricultural and
forest commodity markets. These challenges which are not specific to bioenergy use of biomass should be
addressed in a coherent effort shared with the relevant stakeholders and initiatives. To this aim, several
activities will be implemented in the framework of the EIBI.
Appropriate project eligibility and selection criteria have been developed to ensure that the above
mentioned plants will be designed with a full consideration of the sustainable availability of corresponding
feedstock.
In addition, a structured dialogue and continued interaction between the stakeholders of the EIBI and other
stakeholder groups involved in other initiatives covering the up-stream part of the described value chains
will be facilitated by the EC, in order to foster synergies between the respective strategies and
programmes especially the BioBased Industries PPP. This interaction will lead to joint initiatives linking
several services of the Commission, but possibly also of national research and implementation
programmes.
Suggested resources and financing instruments
Resources for these activities would be mainly public from the different FP7 Themes related to biomass,
and/or national research programmes. The total cost in period 2013-2017 is estimated at around 60 M €
per year, with a share of 75% of public source. The estimated cost per project is 5-15 M €.
EU added value
This set of activities will allow implementing joint programming of different research instruments at EC
level, ensuring their coherence, maximising their synergies and results while avoiding duplication.
4.2 Set of activities on longer term R&D on emerging and innovative bioenergy value chains
The core of the EIBI Roadmap focuses on value chains that will be commercially viable in the next five to
ten years, contributing to the 2020 targets of the RES Directive. But to go beyond these targets, new
technologies and value chains are to be developed. A longer-term R&D programme needs to be put in
place that will provide the industry with technologies that will reach commercial deployment beyond 2020
and for which a new programme of demonstration and flagship plants could be launched in five to ten year
time.
This will imply both addressing R&D improvements of technologies already existing at lab scale, but not
yet developed enough to be part of the EIBI targeted value-chains, and more fundamental research with
the aim to develop totally new bioenergy production avenues.
In order to identify research priorities, 2 ad-hoc workshops were organised by EERA in collaboration with
EC services in May 2013:
14
Workshop 1 "Accelerating the development of most promising existing bioenergy technologies",
involving European bioenergy experts, aimed at identifying R&D needs and priorities to be addressed
to improve bioenergy technologies already existing at lab scale, such as the development of bioenergy
carriers, biofuels for aviation sector and technologies using algae feedstock.
Workshop 2 "Longer term research on future breakthroughs of bioenergy technologies” involving
European engineers and scientists in fundamental and applied disciplines (such as physics, chemistry,
biology, genetics, engineering, bioenergy, biotechnologies), aimed at identifying the most critical gaps
in the current knowledge base in view of possible future bioenergy technology breakthroughs.
The outcome of the workshops is available on SETIS and should be used as a valuable input by EC and
MS while defining research areas to be funded at EU and national levels.
Suggested resources and financing instruments
Based on current project size and for maximum impact, the research activities addressing needs and
priorities for technologies already existing at lab-scale would absorb around 45 M € per year, with costs in
the range of 5-15 M € per project and a share of 50% of public sources. Actions on longer term research
would be in the order of 30 M € per year, with costs in the range of 5-15 M € per project and a share of
75% of public sources. Financing could come from Horizon 2020, MS, EERA, and/or the private sector.
EU added value and risk
The research described above would benefit from being performed at EU level as this would permit to
better exploit economies of scale and synergies.

15
ANNEX A: VALUE CHAINS, SUMMARY DESCRIPTION AND EXAMPLES OF ONGOING
PROJECTS
Within each of the generic value chains presented in Table 1, specific variations based on different
feedstocks and/or processing technologies are being developed, and are currently at different stages of
maturity; some of them have attained the pilot scale where their technical viability has been confirmed
while few have reached the demonstration phase and have ascertained their technical reliability. Only one
of the advanced biofuel related value chains identified in Table 1 has come close to establish economic
viability in Europe so far, resulting in a running industrial demonstration unit plant (Chemtex plant in
Crescentino producing ethanol from lignocellulosic feedstock, value chain 521
). Therefore an
implementation strategy based on flexible approach will be applied to ensure compliance with the key
objectives of the initiative and make best use of the limited resources available.
Some of the technologies that could be deployed in the 7 generic value chains are already supported by
various actions at national, local, industrial and EC level. The EIBI is aiming to support the projects for
which the existing local, national and EU programmes could not bring enough funding because of the
magnitude of funding required.
In the following section, each value chain is briefly described and examples of on-going projects (and
projects at advanced planning stage in italics) are given. However, this list is not exhaustive and with a
variable degree of reliability22
. Preliminary estimates of costs per single project per value chain are
presented in table 4. It should be noted that because demonstration and flagship plants are by definition
"first ever built" the costs cannot be accurately estimated, until a basic design engineering study (+or – 30
% estimate) or a detailed engineering study (+ or – 10 % estimate) have been performed. It is suggested
that only a limited number of demonstration and flagship projects is selected in a specific selection
procedure, depending on the availability of public budget, the matching budget from the private
sector and the project eligibility and selection criteria.
21 Crescentino capacity around 60 kt/a bioethanol; validation of the technology may take place in bigger plants (80+ kt/a) 22 The EBTP-SABS project - European Biofuels Technology Platform-Support for Advanced Biofuels Stakeholders which has
started on 1 Sep 2013 will continuously work on improving the database of relevant projects: http://ebtp-sabs.eu/ .

16
Thermochemical pathways
1: Synthetic liquid fuels and/or hydrocarbons (e.g. gasoline, naphtha, kerosene or diesel fuel) and
blending components through gasification and thermo cracking.
Main Feedstocks: Forest and agricultural residues, waste wood, energy crops, black liquor
Main Products: FT diesel and naphtha, DME, Methanol
Level of Maturity: 1-2
(1= Demo exists / next step: flagship plant; 2= Pilot exists / next step: demo or flagship plant)
Examples of EU on-going23
projects:
(projects in italics are at planning stage)
Pilots: BioDME (Sweden), Bioliq-KIT (Germany), Güssing, FT (Austria), BioTfueL
(France)
Demo: Värmlandsmethanol (Sweden), BioDME/Biomethanol (Sweden),
Flagship: Forest BtL Project (Kemi/Ajos plant)(Finland), UPM BtL Project (France),
WoodSpirit Project (Netherlands),, Värmlandsmethanol (Sweden),
Main technology challenges: Feeders, gas cleaning, catalysts
Technical challenges for all value chains: Feedstock flexibility, energy and carbon efficiency,
reliability & maintenance, capex efficiency
23 Ongoing means investment decision made and project at engineering, procurement, construction (EPC) stage.
17
Thermochemical pathways
2: Bio-methane and other bio-synthetic gaseous fuels through gasification.
Main Feedstocks: Forest and agricultural residues, waste wood, energy crops Main Products: Synthetic Natural Gas (SNG), H2, CO
Level of Maturity: 2
(2= Pilot exists / next step: demo or flagship plant)
Examples of EU on-going projects:
(projects in italics are at planning stage)
Pilots: ECN (Netherlands), GAYA (France), Güssing, FT (Austria),
Demo: GOBI Gas I (Sweden)
Flagship: GOBI Gas II (Sweden), E.On Bio2GProject (Sweden)
Main technology challenges: Feeders, gas cleaning, catalysts
Technical challenges for all value chains: Feedstock flexibility, energy and carbon
efficiency, reliability & maintenance, capex efficiency
Thermochemical pathways
3: High efficiency heat & power generation through thermochemical conversion
Main Feedstocks: Forest and agricultural residues, waste wood, energy crops,
Main Products: Power, Heat
Level of Maturity: 1 (earlier demonstrations in the ‘90s in UK, FI, DK, SE)
(1= Demo exists / next step: flagship plant)
Examples of EU on-going projects:
Pilot: Fundación Cidaut (Spain)
Demo: Güssing (Austria), ENERCORN(Spain), RECOMBIO (Germany),
SKIVE plant (Denmark)
Flagship: Trivinco International (Spain / Chile), Fundación Cidaut (Spain)
Main technology challenges: This should read biofeedstock compatible material and
technologies, able to process a wide range of biomass qualities, including eg biomass with a
high chlorine content, high share of power production
Technical challenges for all value chains: Feedstock flexibility, energy and carbon
efficiency, reliability & maintenance, capex efficiency
18
Thermochemical pathways
4: Intermediate bioenergy carriers through techniques such as pyrolysis and torrefaction
Main Feedstocks: Forest and agricultural residues, wood waste, energy crops
Main Products: Bio-oil for light / heavy fuel oil applications
Level of Maturity: 1-2
(1= Demo exists / next step: flagship plant; 2= Pilot exists / next step: demo or flagship plant)
Examples of EU on-going projects (projects in italics at planning stage):
Pilots/Demos: Bioliq-KIT (Germany), PYTEC (Germany), BTG (Netherlands),
2G_Bio-oil project /UPM (Finland), BioTfueL(France), Fortum-Joensuu
(Finland), EMPYRO (Netherlands), ECN project (Netherlands)
Main technology challenges: Handling/stability of bio-oil, materials, specifications of
intermediates
Technical challenges for all value chains: Feedstock flexibility, energy and carbon efficiency,
reliability & maintenance, capex efficiency
19
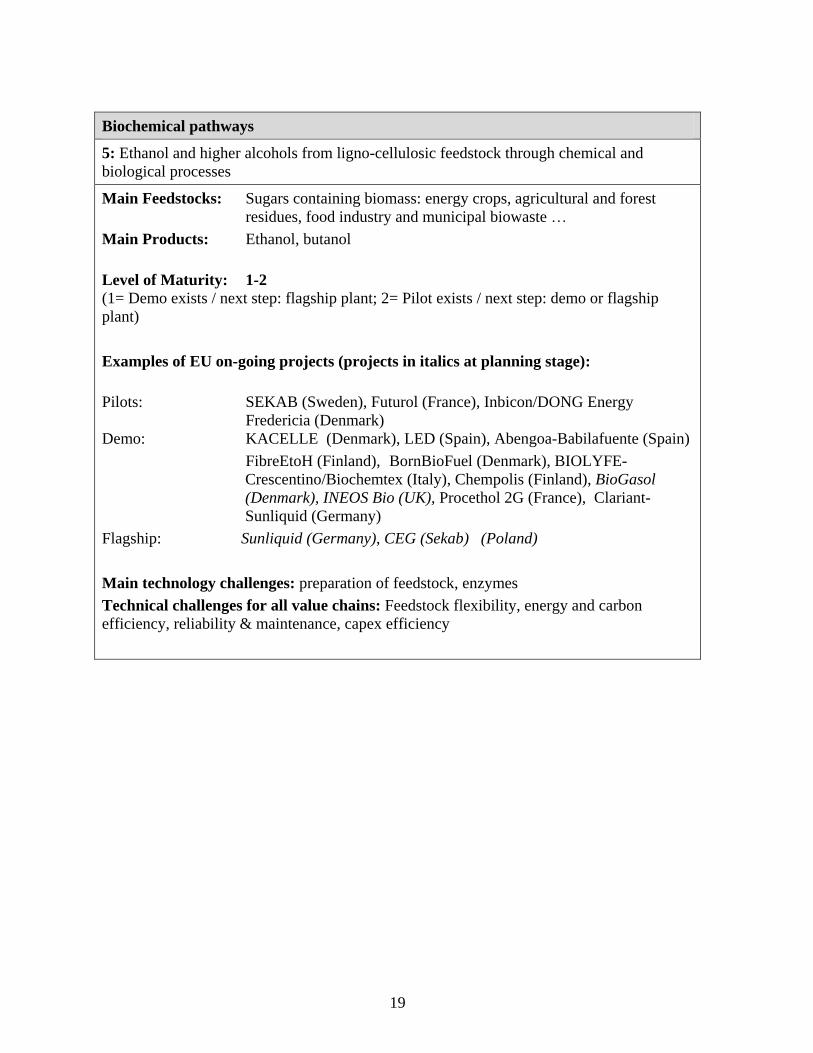
Biochemical pathways
5: Ethanol and higher alcohols from ligno-cellulosic feedstock through chemical and
biological processes
Main Feedstocks: Sugars containing biomass: energy crops, agricultural and forest
residues, food industry and municipal biowaste …
Main Products: Ethanol, butanol
Level of Maturity: 1-2
(1= Demo exists / next step: flagship plant; 2= Pilot exists / next step: demo or flagship
plant)
Examples of EU on-going projects (projects in italics at planning stage):
Pilots: SEKAB (Sweden), Futurol (France), Inbicon/DONG Energy
Fredericia (Denmark)
Demo: KACELLE (Denmark), LED (Spain), Abengoa-Babilafuente (Spain)
FibreEtoH (Finland), BornBioFuel (Denmark), BIOLYFE-
Crescentino/Biochemtex (Italy), Chempolis (Finland), BioGasol
(Denmark), INEOS Bio (UK), Procethol 2G (France), Clariant-
Sunliquid (Germany)
Flagship: Sunliquid (Germany), CEG (Sekab) (Poland)
Main technology challenges: preparation of feedstock, enzymes
Technical challenges for all value chains: Feedstock flexibility, energy and carbon
efficiency, reliability & maintenance, capex efficiency
20
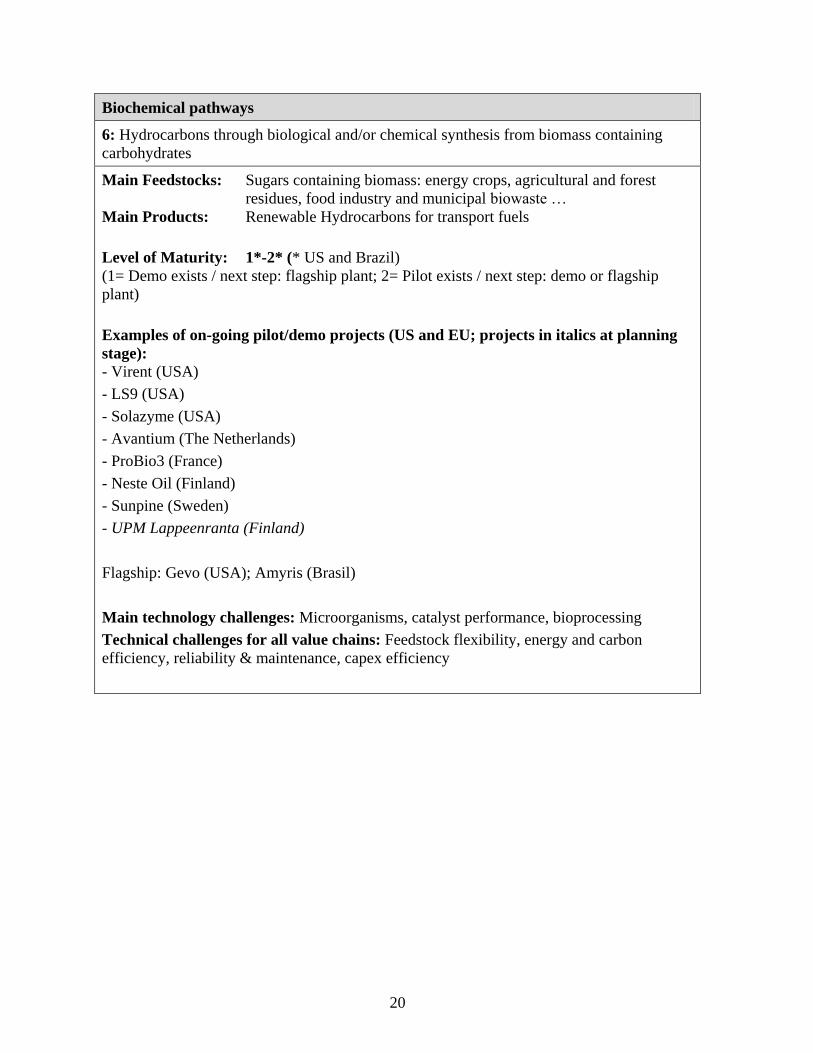
Biochemical pathways
6: Hydrocarbons through biological and/or chemical synthesis from biomass containing
carbohydrates
Main Feedstocks: Sugars containing biomass: energy crops, agricultural and forest
residues, food industry and municipal biowaste …
Main Products: Renewable Hydrocarbons for transport fuels
Level of Maturity: 1*-2* (* US and Brazil)
(1= Demo exists / next step: flagship plant; 2= Pilot exists / next step: demo or flagship
plant)
Examples of on-going pilot/demo projects (US and EU; projects in italics at planning
stage):
- Virent (USA)
- LS9 (USA)
- Solazyme (USA)
- Avantium (The Netherlands)
- ProBio3 (France)
- Neste Oil (Finland)
- Sunpine (Sweden)
- UPM Lappeenranta (Finland)
Flagship: Gevo (USA); Amyris (Brasil)
Main technology challenges: Microorganisms, catalyst performance, bioprocessing
Technical challenges for all value chains: Feedstock flexibility, energy and carbon
efficiency, reliability & maintenance, capex efficiency
21
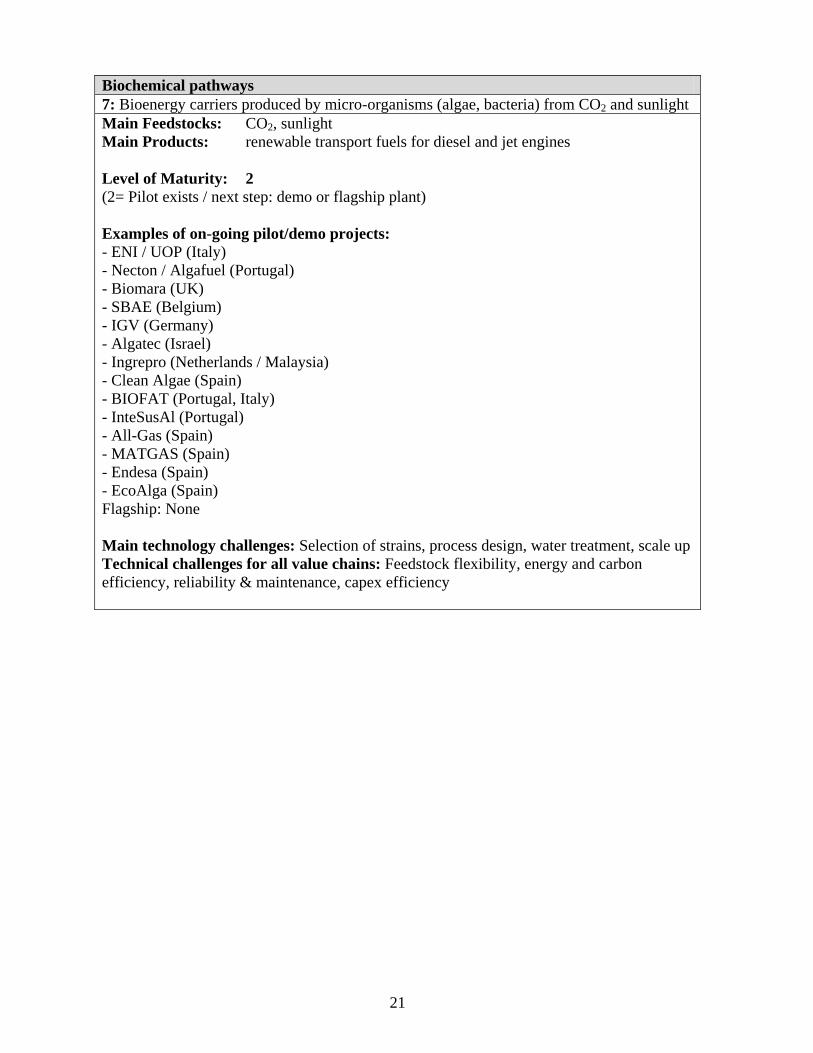
Biochemical pathways
7: Bioenergy carriers produced by micro-organisms (algae, bacteria) from CO2 and sunlight
Main Feedstocks: CO2, sunlight
Main Products: renewable transport fuels for diesel and jet engines
Level of Maturity: 2
(2= Pilot exists / next step: demo or flagship plant)
Examples of on-going pilot/demo projects:
- ENI / UOP (Italy)
- Necton / Algafuel (Portugal)
- Biomara (UK)
- SBAE (Belgium)
- IGV (Germany)
- Algatec (Israel)
- Ingrepro (Netherlands / Malaysia)
- Clean Algae (Spain)
- BIOFAT (Portugal, Italy)
- InteSusAl (Portugal)
- All-Gas (Spain)
- MATGAS (Spain)
- Endesa (Spain)
- EcoAlga (Spain)
Flagship: None
Main technology challenges: Selection of strains, process design, water treatment, scale up
Technical challenges for all value chains: Feedstock flexibility, energy and carbon
efficiency, reliability & maintenance, capex efficiency
22
Annex B. TIME TABLE OVERVIEW
B.1 Overview of the timetable of the EIBI including the call for expression of interest (EoI) and the calls and selection procedures (S.P) for
demonstration and flagship plants
Figure 3: Overview of the timetable concerning the calls on demonstration and flagship plants if specific incentives for advanced biofuels are decided
now, before RED and FQD revision

23
Figure 4: Overview of the timetable concerning the calls on demonstration and flagship plants if investment decisions are delayed beyond the RED and
FQD revision
24
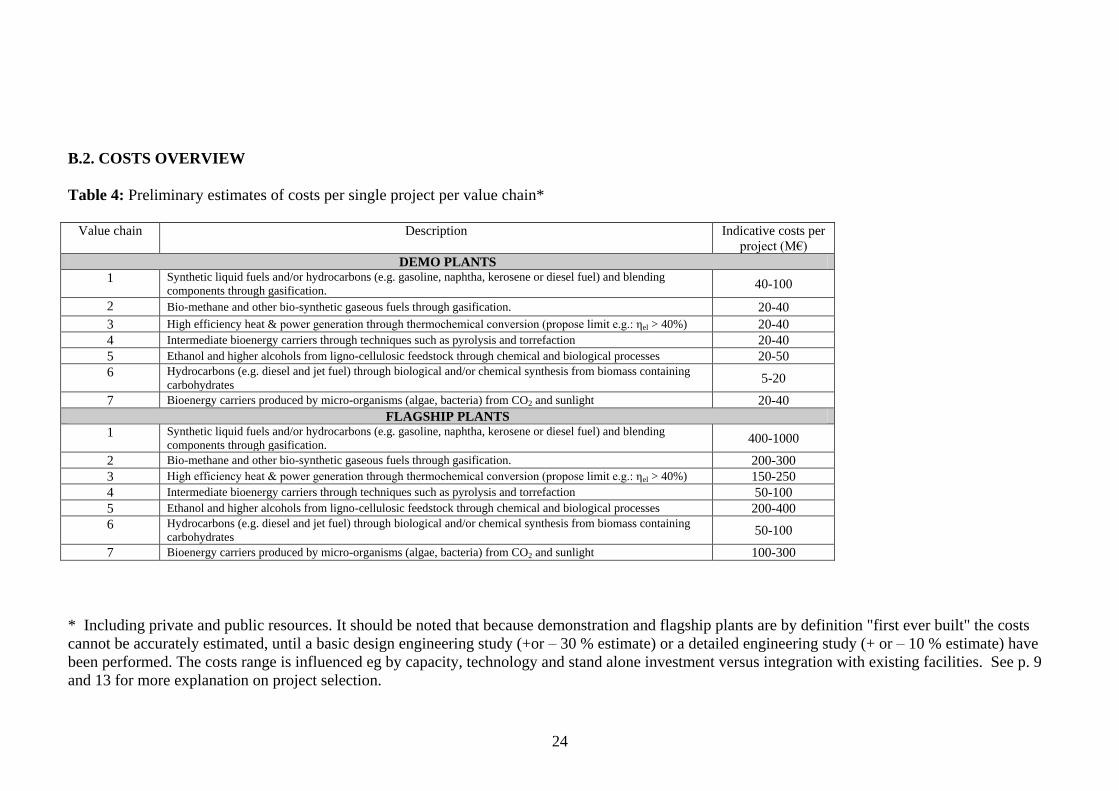
B.2. COSTS OVERVIEW
Table 4: Preliminary estimates of costs per single project per value chain*
Value chain Description Indicative costs per
project (M€)
DEMO PLANTS
1 Synthetic liquid fuels and/or hydrocarbons (e.g. gasoline, naphtha, kerosene or diesel fuel) and blending
components through gasification. 40-100
2 Bio-methane and other bio-synthetic gaseous fuels through gasification. 20-40
3 High efficiency heat & power generation through thermochemical conversion (propose limit e.g.: ηel > 40%) 20-40
4 Intermediate bioenergy carriers through techniques such as pyrolysis and torrefaction 20-40
5 Ethanol and higher alcohols from ligno-cellulosic feedstock through chemical and biological processes 20-50
6 Hydrocarbons (e.g. diesel and jet fuel) through biological and/or chemical synthesis from biomass containing
carbohydrates 5-20
7 Bioenergy carriers produced by micro-organisms (algae, bacteria) from CO2 and sunlight 20-40
FLAGSHIP PLANTS
1 Synthetic liquid fuels and/or hydrocarbons (e.g. gasoline, naphtha, kerosene or diesel fuel) and blending
components through gasification. 400-1000
2 Bio-methane and other bio-synthetic gaseous fuels through gasification. 200-300
3 High efficiency heat & power generation through thermochemical conversion (propose limit e.g.: ηel > 40%) 150-250
4 Intermediate bioenergy carriers through techniques such as pyrolysis and torrefaction 50-100
5 Ethanol and higher alcohols from ligno-cellulosic feedstock through chemical and biological processes 200-400
6 Hydrocarbons (e.g. diesel and jet fuel) through biological and/or chemical synthesis from biomass containing
carbohydrates 50-100
7 Bioenergy carriers produced by micro-organisms (algae, bacteria) from CO2 and sunlight 100-300
* Including private and public resources. It should be noted that because demonstration and flagship plants are by definition "first ever built" the costs
cannot be accurately estimated, until a basic design engineering study (+or – 30 % estimate) or a detailed engineering study (+ or – 10 % estimate) have
been performed. The costs range is influenced eg by capacity, technology and stand alone investment versus integration with existing facilities. See p. 9
and 13 for more explanation on project selection.
25
Annex C
EIBI Team Approved Version: 14-12-2011
EIBI
Key Performance Indicators
Draft working document – With proposed targets inserted
KPIs represent an essential toolkit for monitoring and reviewing the overall progress
of the EIBI, and of the individual research, development and demonstration (RDD)
activities performed in the frame of its implementation. KPIs will become
instrumental for planning RDD activities, funded under the current and up-coming
research and development programmes as well as other possible funding schemes that
will support the EIBI. More specifically, projects supporting implementation of the
EIBI will need to demonstrate the link between their objectives and the KPIs of the
EIBI to which they will contribute. As such, these projects will be integrated into the
Monitoring and Review Framework of the SET-Plan. The practicalities of this
exercise and the modus operandi, and particularly with reference to the later stages of
analysis of the data and their feeding into the technology-neutral planning toll of
SETIS, are still to be defined.
Drafting of the KPIs follows the principles established in the SET-Plan Information
System (SETIS), with both over-arching and specific key performance indicators
adapted to fit the needs of the bioenergy value chains identified by the EIBI. The KPIs
are compiled in parallel with the formulation of project eligibility criteria. It is clear
that implementation of the planning, monitoring and progress review in SETIS, based
on KPIs, first of all requires access to relevant and reliable data and the set-up of
monitoring and data feedback procedures. These procedures will be elaborated and
described in detail by the EIBI Team in the course of 2012.
Work on the development of KPIs is being carried out jointly by Commission staff
that represents SETIS, representatives of the European Biofuels Technology Platform
and representatives of the heat and power industrial sector. This document has been
compiled through input from a small Working Group comprising the following
members:
David Baxter (EC-JRC-IET), Mona-Maria Brinker (EBTP), Maria Georgiadou (EC-
RTD), Birger Kerckow (EBTP), Eva-Katrin Lindman (Euroheat & Power), Johan
Mogensen (Novozymes), Odile Pétillon (EADS), Philippe Schild (EC-RTD), Harri
Turpeinen (EBTP).
1. Over-arching KPIs
In many sectors bioenergy is used in direct competition with fossil energy and
transport fuels (energy carriers) and as such in most cases savings in greenhouse gas

26
(GHG) emissions are used as a comparator to assess “how good” bioenergy is in
terms of impact on the environment. Consequently, greenhouse gas (GHG) savings,
and the cost of achieving the savings, are an important indicator. The cost of
production of bioenergy or the energy-carrier product is also an important indicator,
although price to the customer on the market is ultimately the measure of economic
performance. (It is noted here that other EIIs, and the CCS EII in particular, use
Levelised Cost of Electricity and Cost of Avoided CO2 as KPIs, and if the EIBI Team
considers these measures appropriate, the same or similar methodologies could later
be incorporated into the EIBI KPIs.) In order to provide a measure of the performance
of the various bioenergy projects against the 2020 EU 20% target for renewable
energy, total bioenergy production from projects within the EIBI will also be
monitored. Hence, 3 over-arching KPIs are proposed:
Price before taxes24
of bioenergy products in 2020
(€/MWh) per value chain at point of sale to customer
(Annex I).
Targets for primary products:25 26
1. Synthetic liquid fuels by gasification: < 80 €/MWh
2. Biomethane (<= price as for natural gas) and other
synthetic gaseous fuels by gasification: (depends on
product, e.g. – DME <60 €/MWh), Hydrogen compressed
(<80 €/MWh ), CO (<30 €/MWh )
3, High efficiency heat and power by thermochemical
conversion: < 75€/MWh (el), <35 €/MWh (heat)
4. Intermediate bioenergy carriers: pyrolysis oil <50
€/MWh (to compete with Heavy Fuel Oil , but this depends
on actual product), torrefied product <30 €/MWh
5. Ethanol and higher alcohols from ligno-cellulosic
biomass by biological processes: <80 €/MWh (Note:
equates to <0,50 €/litre)
6. Hydrocarbons by biological processes and/or chemical
synthesis: < 80 €/MWh
7. Bioenergy carriers by micro-organisms (algae) from CO2
and sunlight: < 70 €/MWh for lipids (to be competitive
with vegetable oils and animal fats). Biomethane (<= price
as for natural gas)
GHG savings compared to fossil equivalents The GHG methodology and data behind the sustainability
scheme in the renewables directive (2009/28/EC) will be
24The purpose of this KPI is to give a rating for different technologies concerning their price
competitiveness, Hence this includes production, plus profit margin and relevant costs to point of sale
to a customer, and excludes product related taxes applied (e.g. VAT, excise duties and strategic
stockpile fee). 25 Energy content based on LHV 26 Reference is 2010 and based on an oil price of 86 USD/bbl: as appropriate, targets can be adjusted
with changes in the price of oil according to IEA
27
used as a reference for biofuels and bioliquids 27
.
Targets:
Biofuels – GHG savings from use of biofuels and
bioliquids shall be at least 60% (Reference: EU directive
2009/28/EC, production started on or after 1 January 2017
GHG savings). The methodology for calculation is given in
Annex V of directive 2009/28/EC.
For other energy products, reference data will be, as far as
available, obtained from recognised reference sources.
Targets:
For bioenergy products, other than biofuels and
bioliquids – while GHG savings are not yet defined in
directive 2009/28/EC, the Commission has indicated that in
the absence of specific targets, the targets set for biofuels
and bioliquids should be used (i.e. 60% according to RED)
and future agreed methodology will be adopted.
Total bioenergy produced by EIBI projects (TWh/year)
Targets:
2016: Intermediate step from 2012 to 2020 reflecting
maturity of first phase of demonstration projects (one
fourth of 2020 target)
2020: 35 TWh total energy from EIBI projects contribute to
the 20% renewables target; 17.5 TWh of the 10 %
renewable energy target for transportation will be reached
by advanced biofuels. The 17.5 TWh corresponds to 2 GW
installed capacity.
2. General KPIs for EIBI
Within each of the Value Chains, specific aspects of feedstock and/or processing
technologies are at different stages of development, some of them have attained the
pilot scale where their technical viability has been confirmed, while a few have
reached the demonstration phase and are being evaluated to ascertain their technical
reliability. None of the technologies in any of the Value Chains have reached the
flagship plant stage and consequently none have yet proven economic viability.
Some of the technologies that could be deployed in the 7 generic value chains are
already supported by actions at industrial, local, national and EC level and the
performance of those projects should be monitored. The general project KPIs are:
Number of Final Investment Decisions (FID) (i.e. approved projects of
Demonstration scale or Flagship scale) per value chain specified in the EIBI
27 One option would be to request information on the GHG savings and the methodology used in
obtaining the result
28
(See Bioenergy Roadmap)
Target: at least 1
Cumulative number of Final Investment Decisions (FID) (i.e. approved
projects of Flagship scale) based on technologies specified in the EIBI for all
value chains
Targets: at least 8
Gross installed output capacity of plants based on the EIBI value chains and
supported by the EIBI projects by 2020
Target: >2000 MW (total thermal capacity of all products)
Availability28
during agreed final period of project of demonstration/Flagship
plants in operation
Target: >95%
3. Project Specific KPIs:
To assess the progress of the portfolio of European projects and follow the success of
the value chains four types of KPIs are foreseen, Technology Specific, Resource
Specific, Health & Safety and Socio-Economic.
For the purpose of setting targets for the KPIs a cost base of 2010 has been assumed.
The price of oil will have a substantial impact on many costs in each of the value
chains and the cost base taken is $ 86 per barrel (IEA 2010).
It is noted that the “system boundary” for EIBI projects is defined as the plant gate as
the starting point, and the point at which the bioenergy product is sold to a customer
as a finished product (e.g. electricity or heat fed into a grid) or semi-finished product
(e.g. bio-oil for further refining) is the end point. Using this system boundary, costs
for conversion processes defined in the value chains are monitored. However, since
total costs of bioenergy products will also be (strongly) influenced by feedstock costs,
the latter will also be collected for policy monitoring purposes. It must be appreciated
that the cost of biomass feedstock paid by the conversion plant operator will depend
upon the state of the biomass delivered. The state of the biomass feedstock received,
whether wet (and needing to be dried), already dry, chipped, pelleted, torrefied, or in
the form of a bio-oil will have a significant effect on the cost of conversion and also
on the conversion efficiency of the process employed.
3.1 Technology-Specific
Plant at demonstration/flagship scale capable of achieving planned output
capacity during agreed final period of project (while meeting quality
28 Availability is defined as a percentage measure of the degree to which machinery and equipment is
in an operable and committable state at the point in time when it is needed; measured in hours per 8760
hours.
29
specifications of products29
, or meeting sales contract specifications)
Target: 100%
Plant at demonstration/flagship scale capable of product output at planned cost
Target: 100%
Greenhouse gas saving for each project compared with fossil fuel reference
Target: same as equivalent over-arching KPI
Net efficiency30
(based on LHV) of conversion of biomass feedstock from
plant gate to commercially marketable bioenergy product
Target: 75% (less than half of which is heat)
Capital intensity of the project (M€/MW)
Investment cost per unit of energy capacity (with allocation for fuel,
electricity, heat and co-products according to the proportion of the feedstock
used)
Value chain specific and for data collection purposes only, therefore no
targets
Cost per tonne of greenhouse gas saving (e.g. €/CO2 equivalent)
Target: dependent on technology (value chain). Refer to Eligibility Criteria
4.6 and Annex III
3.2 Resource-Specific
Cost of biomass resource delivered at the bioenergy plant gate
For data collection purposes only, therefore no targets
Price of biomass resource at farm, forest or market gate (while not in the
system boundary of the EIBI projects, this will indicate the intermediate costs
when taking into account the cost at the plant gate)
For data collection purposes only, therefore no targets
Annual quantity of biomass consumption by the project
Project specific and for data collection purposes only, therefore no targets
GHG emissions of value chain 7 (algae) “resource production to plant gate”
(e.g. CO2 equivalent per MWh biomass feedstock delivered)
Target: <108 kg/MWh.
29 Quality specifications may be CEN standards, CEN Workshop Agreements and in their absence
national or ISO standards 30 Net efficiency is the percentage of useful (commercially marketable bioenergy product) energy
output compared with the net sum of energy inputs (biomass and other energy inputs minus energy
content of commercially marketable non-energy bio-products)
30
3.3 Health, safety and environment
Number of deviations, license suspensions with respect to prevailing
emissions regulations along the whole value chain
Project specific and for data collection purposes only, therefore no targets
Number of accidents:
Targets: accidents <4; near-accidents31
<10
3.4 Socio-economic
Number of permanent jobs created by demonstration/flagship project,
including the plant itself and in the biomass supply and product chains (data
broken down indicating the location of the jobs, local, within a radius of 150
km, elsewhere in the EU).
Data collection purposes only, therefore no targets
4. Reporting
The practical implementation of the monitoring system requires a flow of information
from the projects to the EIBI Team and to SETIS. There are several steps in the
process with needs for input by various people:
o Data collection from EIBI projects and national projects - templates
will be used to satisfy the monitoring requirement of each of the KPIs
o Data checking, and when necessary verification, by the KPI
Monitoring Group (neutral experts) of the EIBI
o KPI Monitoring Group determines values for KPIs and reports to EIBI
Team
o Approved KPI data from EIBI reported to SETIS
o EIBI KPI Monitoring Group cooperation with SETIS on data
aggregation and reviewing of EIBI KPI data fed into the technology-
neutral planning tool of SETIS
o EIBI KPI Monitoring Group reports back to EIBI Team and the EIBI
Team reports back to projects
31 Computed as Lost Workday Injury Frequency (LWIF) of all workers (own staff and contractors),
where LWIF is calculated from the number of Lost Workday Injuries (LWI) divided by the number of
hours worked expressed in millions and as Total Recordable Case Frequency (TRCF). TRCF is
calculated from the sum of fatalities, LWIs, RWIs (Restricted Workday Injury) and MTC divided by
the number of hours worked in millions. These definitions are standard key performance indicators of
the oil industry sector, ref. CONCAWE Report 7/09 September 2009.
31
It is envisaged that data for KPIs would be collected periodically at maximum interval
of one year.
It is clearly the intention that all collected data are adequately protected and no
publication is allowed without the consent of the original project organisations.
The EIBI will follow guidance from SETIS on procedures for KPI reporting and any
other applicable data exchange.
The EIBI KPI Working Group will amend targets for demonstration/flagship projects
and on the data to be collected according to the needs defined by the EIBI Team. All
targets and methodologies need to be approved by the full EIBI Team.
32
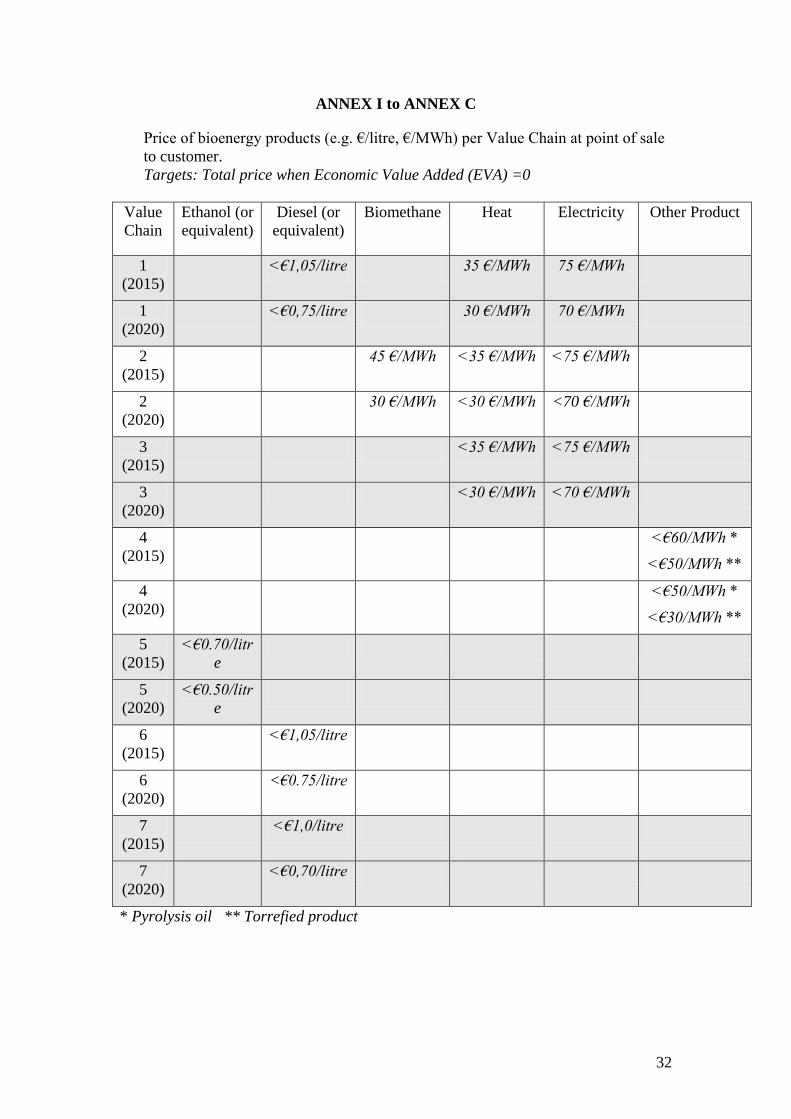
ANNEX I to ANNEX C
Price of bioenergy products (e.g. €/litre, €/MWh) per Value Chain at point of sale
to customer.
Targets: Total price when Economic Value Added (EVA) =0
Value
Chain
Ethanol (or
equivalent)
Diesel (or
equivalent)
Biomethane Heat Electricity Other Product
1
(2015)
<€1,05/litre 35 €/MWh 75 €/MWh
1
(2020)
<€0,75/litre 30 €/MWh 70 €/MWh
2
(2015)
45 €/MWh <35 €/MWh <75 €/MWh
2
(2020)
30 €/MWh <30 €/MWh <70 €/MWh
3
(2015)
<35 €/MWh <75 €/MWh
3
(2020)
<30 €/MWh <70 €/MWh
4
(2015)
<€60/MWh *
<€50/MWh **
4
(2020)
<€50/MWh *
<€30/MWh **
5
(2015)
<€0.70/litr
e
5
(2020)
<€0.50/litr
e
6
(2015)
<€1,05/litre
6
(2020)
<€0.75/litre
7
(2015)
<€1,0/litre
7
(2020)
<€0,70/litre
* Pyrolysis oil ** Torrefied product
33
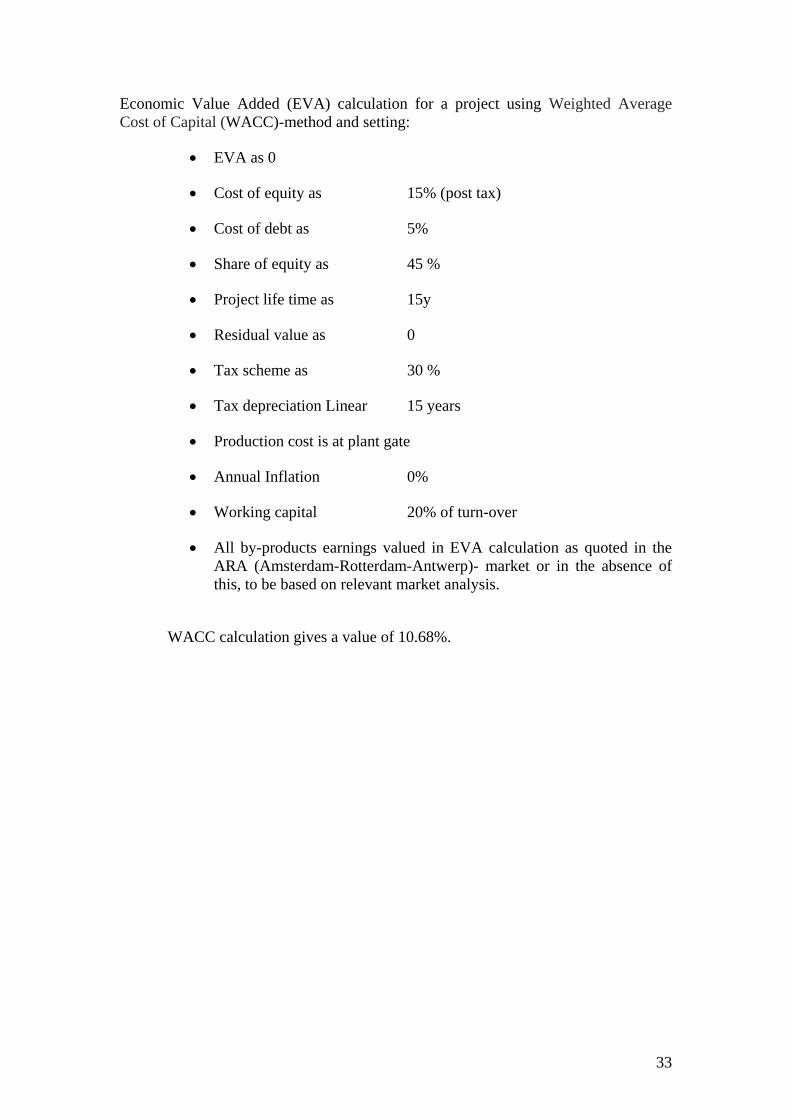
Economic Value Added (EVA) calculation for a project using Weighted Average
Cost of Capital (WACC)-method and setting:
EVA as 0
Cost of equity as 15% (post tax)
Cost of debt as 5%
Share of equity as 45 %
Project life time as 15y
Residual value as 0
Tax scheme as 30 %
Tax depreciation Linear 15 years
Production cost is at plant gate
Annual Inflation 0%
Working capital 20% of turn-over
All by-products earnings valued in EVA calculation as quoted in the
ARA (Amsterdam-Rotterdam-Antwerp)- market or in the absence of
this, to be based on relevant market analysis.
WACC calculation gives a value of 10.68%.
34
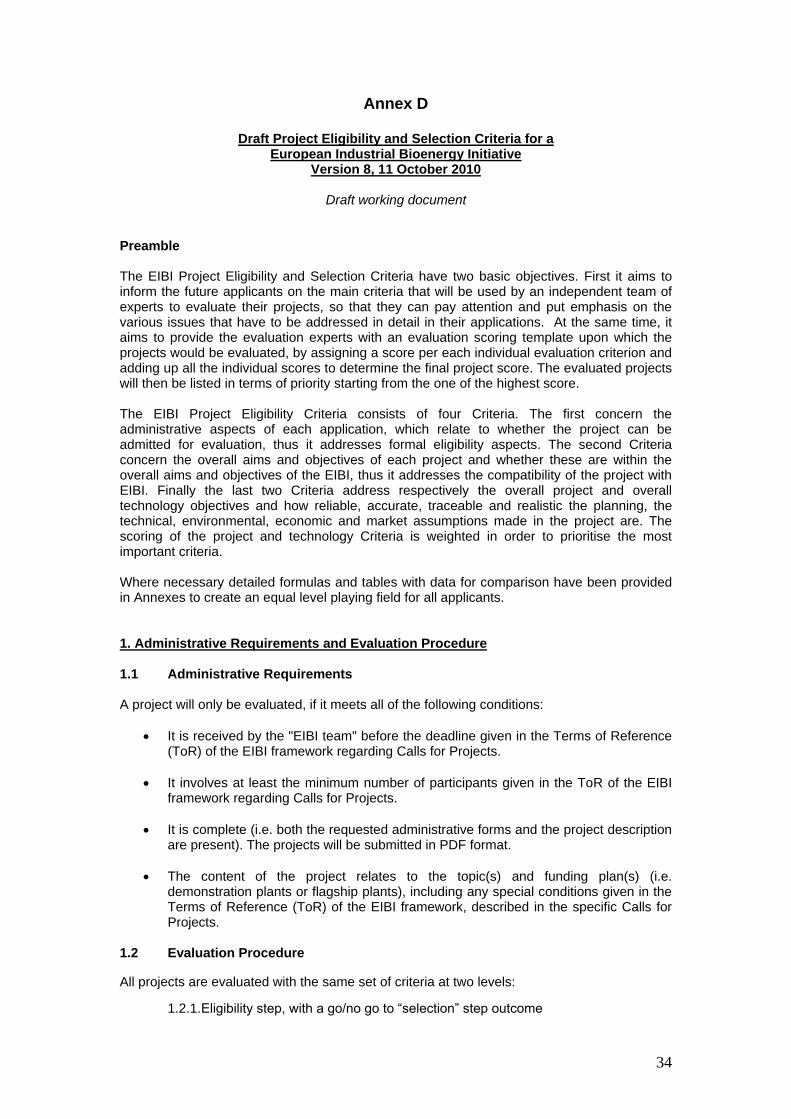
Annex D
Draft Project Eligibility and Selection Criteria for a European Industrial Bioenergy Initiative
Version 8, 11 October 2010
Draft working document Preamble The EIBI Project Eligibility and Selection Criteria have two basic objectives. First it aims to inform the future applicants on the main criteria that will be used by an independent team of experts to evaluate their projects, so that they can pay attention and put emphasis on the various issues that have to be addressed in detail in their applications. At the same time, it aims to provide the evaluation experts with an evaluation scoring template upon which the projects would be evaluated, by assigning a score per each individual evaluation criterion and adding up all the individual scores to determine the final project score. The evaluated projects will then be listed in terms of priority starting from the one of the highest score. The EIBI Project Eligibility Criteria consists of four Criteria. The first concern the administrative aspects of each application, which relate to whether the project can be admitted for evaluation, thus it addresses formal eligibility aspects. The second Criteria concern the overall aims and objectives of each project and whether these are within the overall aims and objectives of the EIBI, thus it addresses the compatibility of the project with EIBI. Finally the last two Criteria address respectively the overall project and overall technology objectives and how reliable, accurate, traceable and realistic the planning, the technical, environmental, economic and market assumptions made in the project are. The scoring of the project and technology Criteria is weighted in order to prioritise the most important criteria. Where necessary detailed formulas and tables with data for comparison have been provided in Annexes to create an equal level playing field for all applicants. 1. Administrative Requirements and Evaluation Procedure 1.1 Administrative Requirements A project will only be evaluated, if it meets all of the following conditions:
It is received by the "EIBI team" before the deadline given in the Terms of Reference (ToR) of the EIBI framework regarding Calls for Projects.
It involves at least the minimum number of participants given in the ToR of the EIBI framework regarding Calls for Projects.
It is complete (i.e. both the requested administrative forms and the project description are present). The projects will be submitted in PDF format.
The content of the project relates to the topic(s) and funding plan(s) (i.e. demonstration plants or flagship plants), including any special conditions given in the Terms of Reference (ToR) of the EIBI framework, described in the specific Calls for Projects.
1.2 Evaluation Procedure All projects are evaluated with the same set of criteria at two levels:
1.2.1. Eligibility step, with a go/no go to “selection” step outcome
35
1.2.2. Selection step, with a rating for ranking of projects
The Criteria 3 and 4 are to be used together for evaluating the projects. The weighting factors (0…10) in the right column of the tables are to be used as a multiplier when combining the individual criterion specific scores (scale 0…10) into an overall score for the project. Each of these Criteria provides a maximum of 500 weighted score points. Thresholds will be used as follows:
Individual criterion minimum score 5 (50%) Overall score minimum 350 weighted score points for each one of the
Criteria 3 and 4 (70%) and 700 weighted score points in total for both. Projects within a specific value chain are compared and selected. 2. Eligibility Evaluation Criteria 2.1. Relationship of a Project to EIBI At least 70% of the bioproducts produced by the plant shall be bioenergy (biofuels, heat, power) calculated on the basis of energy content of the products sold. 2.2. Technologies and Processes All projects must address innovative technologies and processes or novel integration of known technologies and processes to be established at the appropriate scale for first-of-its-kind
32 demonstration and flagship plants
33. At least one "section" of the value chain or the
integration of "sections" of the considered value chains should not have been deployed at demonstration / commercial scale before. 2.3. Feedstock, Renewable Energy Directive and Green House Gas emissions The projects have to be based on the conversion of biomass feedstocks for bioenergy (power, heat and biofuel), with full description of the feedstock supply chain, including feedstock production, logistics, and pre-treatment (if any). Projects addressing production of bio-products as a co-product to bioenergy as well as projects addressing co-processing of the biomass feedstocks with fossil fuels are also eligible. All projects, including power and heat generation, must comply with the sustainability criteria specified in the EU Renewable Energy Directive (RED 2009/28/EC, article 17) and meet the specified minimum Green House Gas (GHG) criteria for the year 2016; being 60 % deducted from Life Cycle Analysis (LCA)
34 and
based on RED calculation. 2.4. Site and Minimum Consortia Requirements The site of the demonstration plants or flagship plants must be in the EU or in the FP Associated Countries
35. To ensure an EU industrial dimension the projects will be based on
32
First-of-its-kind: projects concentrating on novel technologies and processes, and not replicating existing installations 33
Demonstration plants normally follow pilot-scale projects. They are considered the last non-economic step to demonstrate the technical, environmental and economical performance and reliability of all critical steps in a value chain so that the first commercial unit can be designed and the technical performance guaranteed from the outcome of the demonstration unit. Demonstration applies to processes that have been successfully tested at least at pilot scale. Flagship plants normally follow demonstration projects. They are the first commercial units of value chains operating at an economically viable scale 34
ILCD Handbook: General guide for Life Cycle Assessment – Provisions and action steps http://lct.jrc.ec.europa.eu/pdf-directory/ILCD-Handbook-General-guide-for-LCA-PROVISIONS-online-12March2010.pdf 35
Current, FP7, Associated Countries: Norway, Switzerland, Turkey, Israel, Albania, Bosnia and Herzegovina, Croatia, Faroe Islands, FYR Macedonia, Iceland, Liechtenstein, Montenegro, Serbia

36
consortia consisting from at least 3 organisations established in different EU Member States or in 2 different EU Member States and 1 Associated Country. At least 2 of the 3 minimum required organisations must be industrial actors and 1 must be a Science &Technology actor.
37
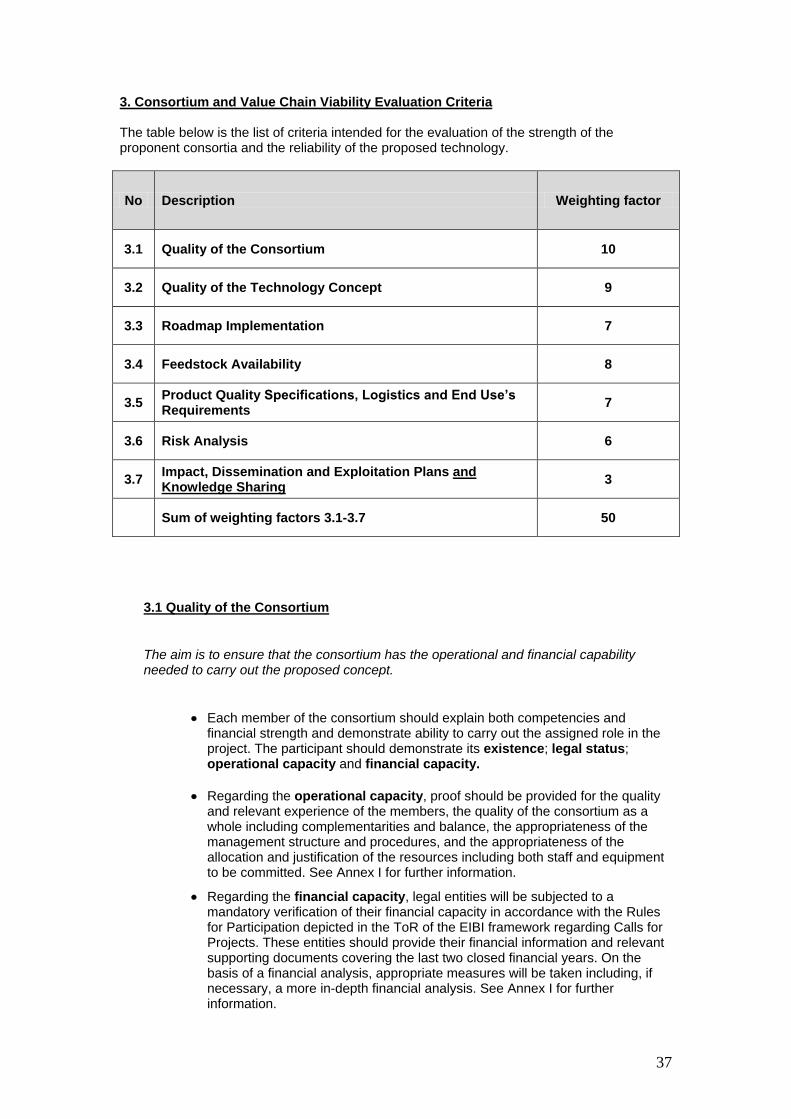
3. Consortium and Value Chain Viability Evaluation Criteria The table below is the list of criteria intended for the evaluation of the strength of the proponent consortia and the reliability of the proposed technology.
No Description Weighting factor
3.1 Quality of the Consortium 10
3.2 Quality of the Technology Concept 9
3.3 Roadmap Implementation 7
3.4 Feedstock Availability 8
3.5 Product Quality Specifications, Logistics and End Use’s Requirements
7
3.6 Risk Analysis 6
3.7 Impact, Dissemination and Exploitation Plans and Knowledge Sharing
3
Sum of weighting factors 3.1-3.7 50
3.1 Quality of the Consortium
The aim is to ensure that the consortium has the operational and financial capability needed to carry out the proposed concept.
Each member of the consortium should explain both competencies and financial strength and demonstrate ability to carry out the assigned role in the project. The participant should demonstrate its existence; legal status; operational capacity and financial capacity.
Regarding the operational capacity, proof should be provided for the quality and relevant experience of the members, the quality of the consortium as a whole including complementarities and balance, the appropriateness of the management structure and procedures, and the appropriateness of the allocation and justification of the resources including both staff and equipment to be committed. See Annex I for further information.
Regarding the financial capacity, legal entities will be subjected to a mandatory verification of their financial capacity in accordance with the Rules for Participation depicted in the ToR of the EIBI framework regarding Calls for Projects. These entities should provide their financial information and relevant supporting documents covering the last two closed financial years. On the basis of a financial analysis, appropriate measures will be taken including, if necessary, a more in-depth financial analysis. See Annex I for further information.
38
3.2 Quality of the Technology Concept
The aim is to ensure that a reliable technological concept is proposed in terms of techno-economic and environmental performance as well as in terms of working methodology and organisation.
An organised and hierarchical representation of all the work to be carried out in the project must be provided, broken down into sufficient detail to back up planning, assignment of proposed effort and costs, progress monitoring and control. (a detailed work plan, broken down into work clusters each encompassing identified deliverables and tasks. The work plan should follow the logical phases of the project implementation and portray specific milestones and a summary of efforts and costs
Illustration of the interdependencies between the components of the work clusters in terms of a graphic representation , e.g. Pert diagram or similar
Illustration of the planned timing of the work clusters and their components in terms of a graphic representation, e.g. GANTT chart or similar. The aim is to ensure that the technical objectives are followed but also that the project is completed within the approved budget and time.
A complete techno-economic evaluation of the entire value chain including feedstock, and socio-economic performance evaluation should be provided. The techno-economic analysis should be supported by a preliminary environmental performance evaluation on a basis of LCA methodology. Mass and energy balance data of the process flowsheets along with the detailed description of developing such process flowsheets should be included. The methodology should prove integration along the whole system and realize synergies, such as mass and energy integration. The LCA analysis should also provide insight on future improvement as planned in the project in order to ensure economic viability in a further step. 3.3 Roadmap Implementation
The aim is to ensure that implementation of the projects complies with the timeline of the SET Plan and that of the RED.
The operation of demonstration plants must be planned no later than four years after the approval for construction for the Calls of Projects according to the ToR of the EIBI framework regarding Calls for Projects.
The operation of the flagship plants must be planned no later than four years after the approval for construction for the Calls of Projects according to the ToR of the EIBI framework regarding Calls for Projects.
For both demonstration plants and flagship plants the projects should include a learning curve for further deployment of technology.
3.4 Feedstock Availability and Logistics The aim is to deliver cost-effectively sustainable biomass feedstock to the plant gate and to improve system efficiency.
39
Feedstock(s) qualification through physical and elemental analysis as well as quantification of the feedstock on an hourly and annual basis, (e.g. MWh/h & MWh/y)
A detailed analysis of the feedstock production, procurement and supply chain must be provided including where appropriate operations such as harvesting and size reduction, and logistics such as transport and storage.
All projects must include a properly justified plan for sourcing adequate quantities of sustainably produced feedstocks for the future commercial scale plants.
Development and optimization of production (planting or husbandry) and harvesting equipment or techniques for new and/or existing feedstocks.
Development and optimization of methods to treat and/or handle new and underused biomass feedstocks including logistics and cost calculation (economically and environmentally).
3.5 Production Quality Specifications, Logistics and End User's Requirements
The aim is to deliver cost-effectively final products to customer and to assure systems compatibility and efficiency.
All market products need to comply with existing European CEN technical standards at the time of submission of the application.
A detailed description of the product distribution and end use systems must be provided for non-fungible biofuels.
For new products it has to be described how quality requirements for both products and operations will be addressed.
For new types of biofuels requiring dedicated end use system logistics and/or vehicle fleet requirements the proposers have to present the schedules and capacities required for successful deployment of the concept (e.g. x vehicles will be built suitable to use the produced quantities of biofuel y). Description on emission changes (CO2 and other) from logistics and tailpipes shall be presented.
3.6 Risk Analysis
The aim is to identify, analyse and assess the risks associated with all steps of the value chain in order to propose and eventually prevention and mitigation measures.
A risk analysis encompassing risk identification, assessment and management must be included. The analysis should cover all elements of the overall concept and their breakdown to further components including the:
- Risks associated with sustainable biomass supply and price
- Risks associated with the technology of the conversion routes;
- Risks associated with the bio-product(s) and market price/evolution
40
- Risk in Capital and Production Cost estimation
Following the identification of all potential risks in all elements of the concept and their components, the projects should include an analysis of the assessment of identified risks using risk analysis principles, including
- Assessment of probability that the risk will occur
- Assessment of impact of risk on occurrence
- Calculation of exposure
Prevention and mitigation strategy
Commitments to establish a Quality Assurance Plan in order to follow-up the strategic objectives of the project and maintain the time schedule to reach the objectives and carry out the demonstration.
3.7 Impact, Dissemination and Exploitation plans and Knowledge Sharing
The aim is to ensure that there is a measurable impact that complies with the EIBI and SET Plan priorities, as well as with the goals of the EU's energy and climate policy through appropriate dissemination activities.
Contribution, at the European level, to the expected impacts listed in the ToR of the EIBI framework regarding Calls for Projects under the relevant topic/activity. In particular, demonstrate the capacity of the project to reinforce
- European industry and SMEs
- European S&T Knowledge and know-how base
- European environmental and climate policy objectives
Appropriateness of measures for the dissemination and knowledge sharing in view of generating:
An efficient information flow and publicity about the project,
An effective dissemination of the results obtained,
An effective contribution to European knowledge and innovation, as well as to a Europe-wide scale collaboration,
Benefits to EU public
Where appropriate training activities should be organised relevant to the project needs dedicated to professionals (technicians and engineers) as well as feedstock producers.
Appropriateness of measures for the management of knowledge and intellectual property aiming at maximising the returns from development and investments
- Provision of a consortium agreement between partners of the project handling among other management of knowledge and intellectual property
- Addition of an exploitation plan for an efficient implementation into industrial applications for demonstration plants and an efficient replication into commercial units for flagship plants.
41
4. Techno-Economic, Environmental and Social Evaluation Criteria These evaluation criteria are addressing economic and environmental performance.
No Description Weighting factor
4.1 Economic performance of the commercial concept 8
4.2 Future market deployment of the concept 4
4.3 Future contribution to reduce GHG emissions 8
4.4 Sustainably managed raw material 8
4.5 Environmental impacts other than GHG 3
4.6 Cost of avoided CO2 equivalent 9
4.7 Energy efficiency to primary energy products 8
4.8 Societal impacts (Employment, labour and work conditions)
2
Overall 50
4.1 Economic performance of the commercial concept
The aim is to ensure that the economic performance of the concept is reasonable and viable. The economic performance of the process proposed should be measured while taking into account capital investment required for the economic return on a basis of "Economic Value Added" analysis (EVA). For this, the methodology of the Weighted Average Cost of Capital (WACC) should be used. Information from criterion 3.2 should support the economic analysis. Detailed descriptions are presented in Annex II.
4.2 Future market deployment of the concept The aim is to ensure the full market deployment of the concept following the first flagship plant even beyond the SET Plan duration. The future market deployment should be estimated between the time of application and 2030. The future market deployment should be assessed based on the learning curve and the estimated number of future units that the concept could realistically generate while taking into consideration the following:
Sustainable raw material supply
Suitable sites (for instance if synergistic site is needed)
Labour, skills and training 4.3 Future contribution in reducing GHG emissions
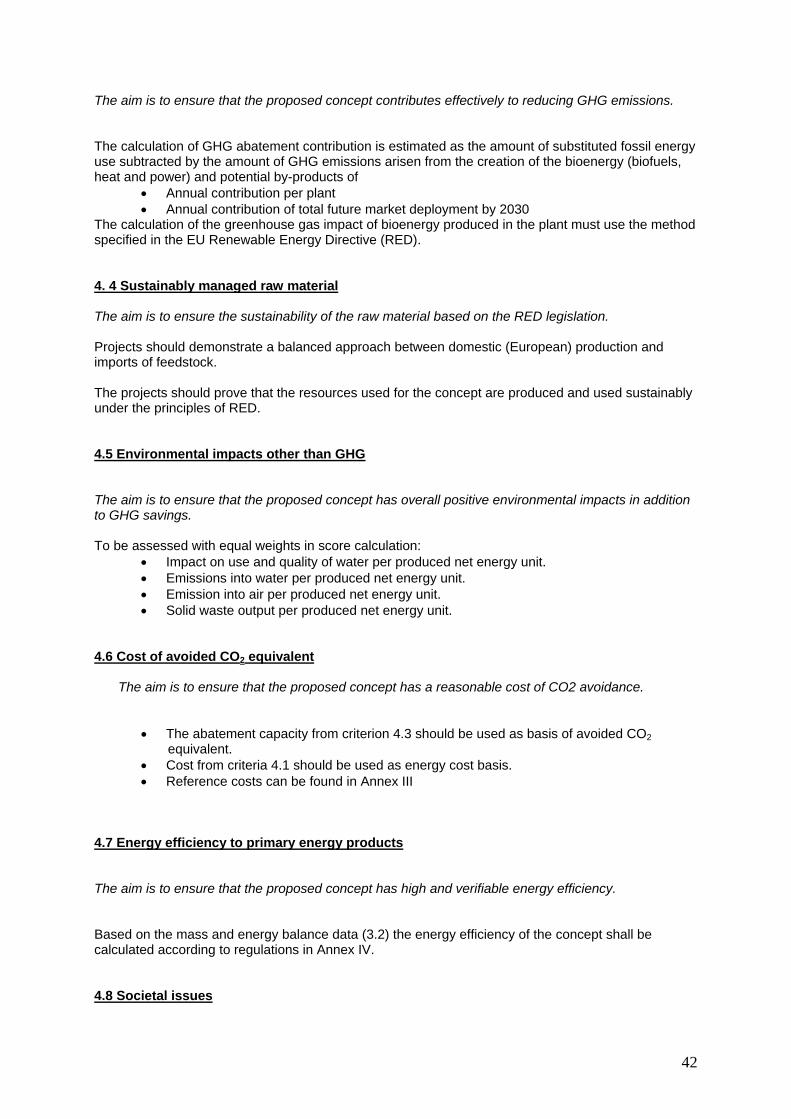
42
The aim is to ensure that the proposed concept contributes effectively to reducing GHG emissions. The calculation of GHG abatement contribution is estimated as the amount of substituted fossil energy use subtracted by the amount of GHG emissions arisen from the creation of the bioenergy (biofuels, heat and power) and potential by-products of
Annual contribution per plant
Annual contribution of total future market deployment by 2030 The calculation of the greenhouse gas impact of bioenergy produced in the plant must use the method specified in the EU Renewable Energy Directive (RED).
4. 4 Sustainably managed raw material The aim is to ensure the sustainability of the raw material based on the RED legislation. Projects should demonstrate a balanced approach between domestic (European) production and imports of feedstock. The projects should prove that the resources used for the concept are produced and used sustainably under the principles of RED. 4.5 Environmental impacts other than GHG The aim is to ensure that the proposed concept has overall positive environmental impacts in addition to GHG savings. To be assessed with equal weights in score calculation:
Impact on use and quality of water per produced net energy unit.
Emissions into water per produced net energy unit.
Emission into air per produced net energy unit.
Solid waste output per produced net energy unit.
4.6 Cost of avoided CO2 equivalent
The aim is to ensure that the proposed concept has a reasonable cost of CO2 avoidance.
The abatement capacity from criterion 4.3 should be used as basis of avoided CO2 equivalent.
Cost from criteria 4.1 should be used as energy cost basis.
Reference costs can be found in Annex III 4.7 Energy efficiency to primary energy products The aim is to ensure that the proposed concept has high and verifiable energy efficiency. Based on the mass and energy balance data (3.2) the energy efficiency of the concept shall be calculated according to regulations in Annex IV. 4.8 Societal issues

43
The aim is to ensure that the concept creates a benefit to the society. The projects should address the following societal issues with realistic and traceable arguments:
Employment effects.
Working conditions, health and safety.
Skills and training.
Rural development.
Social acceptance by the European citizens.
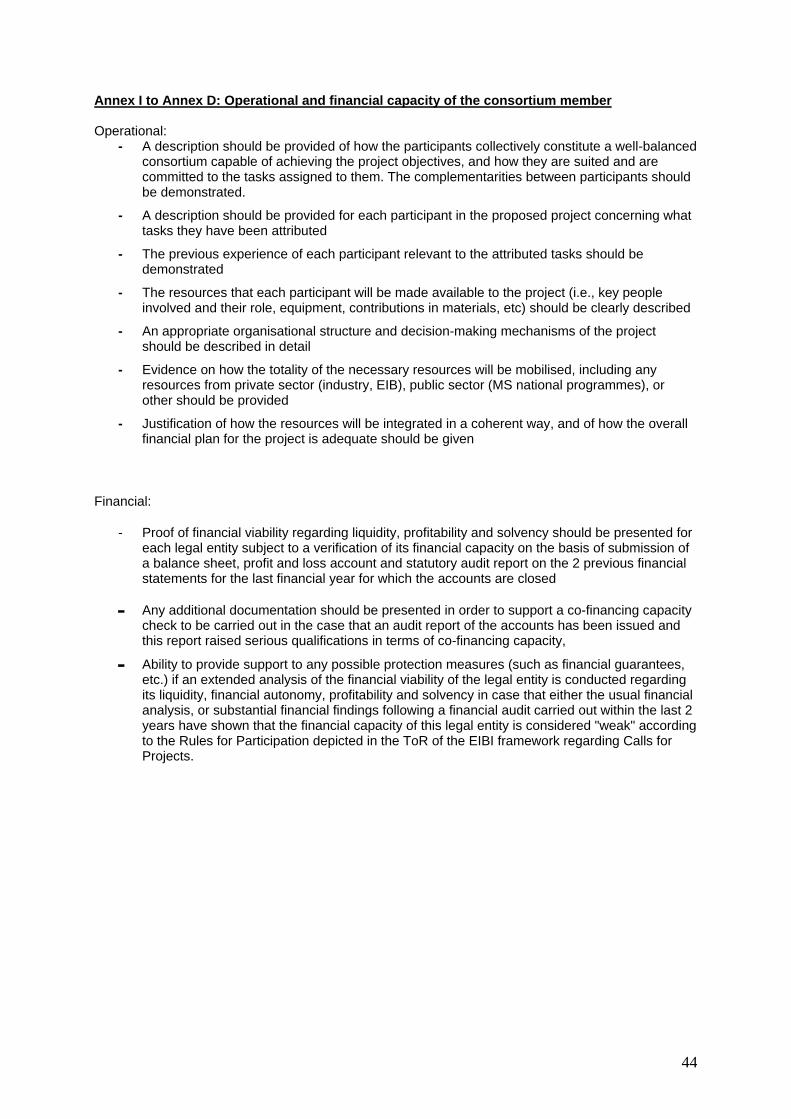
44
Annex I to Annex D: Operational and financial capacity of the consortium member Operational:
- A description should be provided of how the participants collectively constitute a well-balanced consortium capable of achieving the project objectives, and how they are suited and are committed to the tasks assigned to them. The complementarities between participants should be demonstrated.
- A description should be provided for each participant in the proposed project concerning what tasks they have been attributed
- The previous experience of each participant relevant to the attributed tasks should be demonstrated
- The resources that each participant will be made available to the project (i.e., key people involved and their role, equipment, contributions in materials, etc) should be clearly described
- An appropriate organisational structure and decision-making mechanisms of the project should be described in detail
- Evidence on how the totality of the necessary resources will be mobilised, including any resources from private sector (industry, EIB), public sector (MS national programmes), or other should be provided
- Justification of how the resources will be integrated in a coherent way, and of how the overall financial plan for the project is adequate should be given
Financial:
- Proof of financial viability regarding liquidity, profitability and solvency should be presented for each legal entity subject to a verification of its financial capacity on the basis of submission of a balance sheet, profit and loss account and statutory audit report on the 2 previous financial statements for the last financial year for which the accounts are closed
- Any additional documentation should be presented in order to support a co-financing capacity check to be carried out in the case that an audit report of the accounts has been issued and this report raised serious qualifications in terms of co-financing capacity,
- Ability to provide support to any possible protection measures (such as financial guarantees, etc.) if an extended analysis of the financial viability of the legal entity is conducted regarding its liquidity, financial autonomy, profitability and solvency in case that either the usual financial analysis, or substantial financial findings following a financial audit carried out within the last 2 years have shown that the financial capacity of this legal entity is considered "weak" according to the Rules for Participation depicted in the ToR of the EIBI framework regarding Calls for Projects.
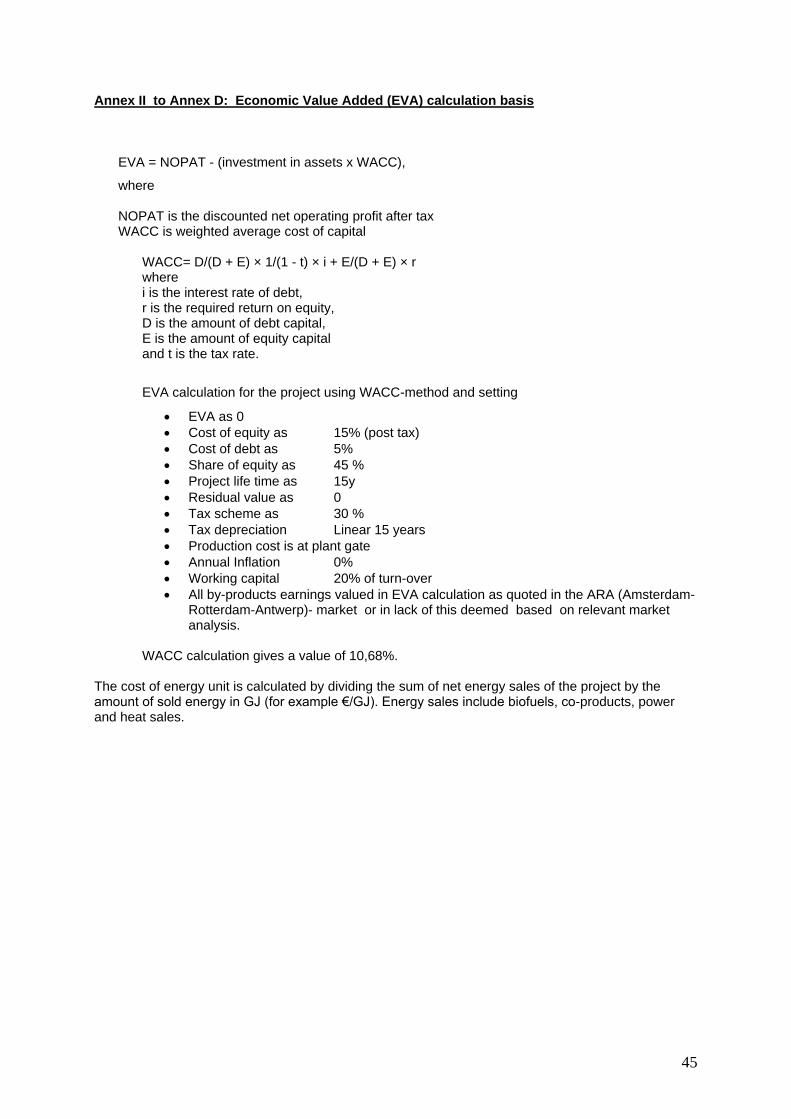
45
Annex II to Annex D: Economic Value Added (EVA) calculation basis
EVA = NOPAT - (investment in assets x WACC),
where NOPAT is the discounted net operating profit after tax WACC is weighted average cost of capital
WACC= D/(D + E) × 1/(1 - t) × i + E/(D + E) × r where i is the interest rate of debt, r is the required return on equity, D is the amount of debt capital, E is the amount of equity capital and t is the tax rate.
EVA calculation for the project using WACC-method and setting
EVA as 0
Cost of equity as 15% (post tax)
Cost of debt as 5%
Share of equity as 45 %
Project life time as 15y
Residual value as 0
Tax scheme as 30 %
Tax depreciation Linear 15 years
Production cost is at plant gate
Annual Inflation 0%
Working capital 20% of turn-over
All by-products earnings valued in EVA calculation as quoted in the ARA (Amsterdam-Rotterdam-Antwerp)- market or in lack of this deemed based on relevant market analysis.
WACC calculation gives a value of 10,68%. The cost of energy unit is calculated by dividing the sum of net energy sales of the project by the amount of sold energy in GJ (for example €/GJ). Energy sales include biofuels, co-products, power and heat sales.
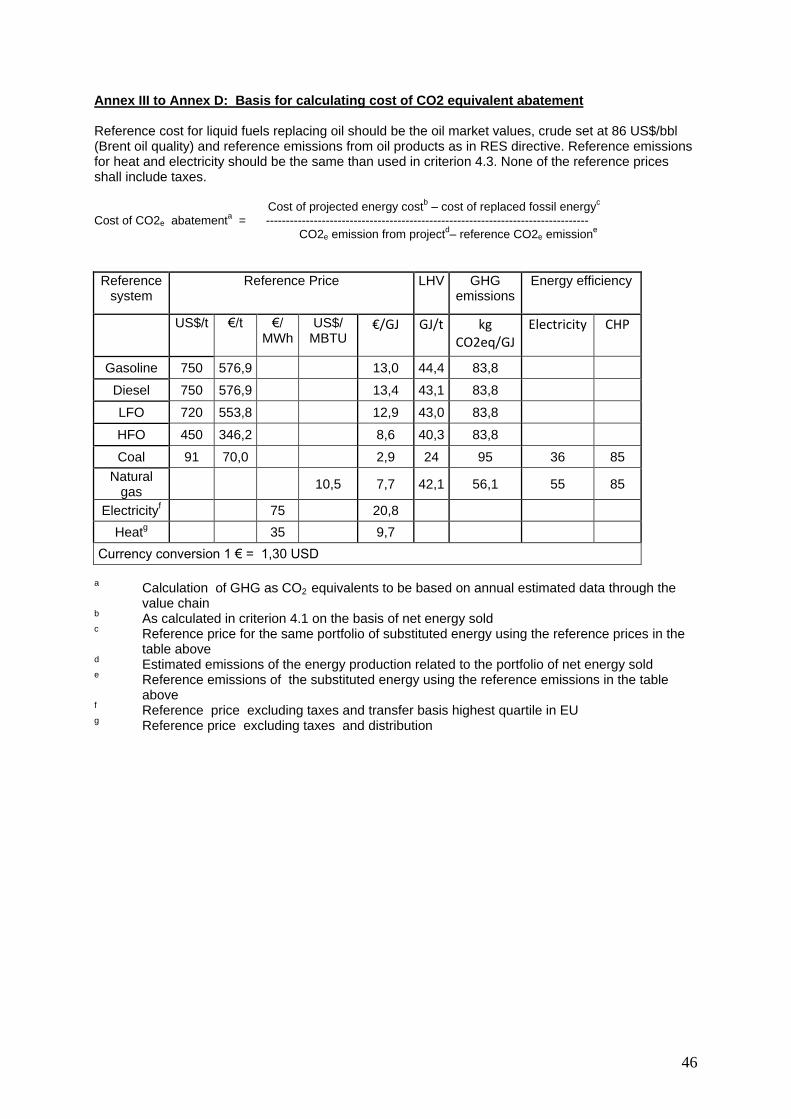
46
Annex III to Annex D: Basis for calculating cost of CO2 equivalent abatement Reference cost for liquid fuels replacing oil should be the oil market values, crude set at 86 US$/bbl (Brent oil quality) and reference emissions from oil products as in RES directive. Reference emissions for heat and electricity should be the same than used in criterion 4.3. None of the reference prices shall include taxes.
Cost of projected energy cost
b – cost of replaced fossil energy
c
Cost of CO2e abatementa = ---------------------------------------------------------------------------------
CO2e emission from projectd– reference CO2e emission
e
Reference system
Reference Price LHV GHG emissions
Energy efficiency
US$/t €/t €/ MWh
US$/ MBTU
€/GJ GJ/t kg CO2eq/GJ
Electricity CHP
Gasoline 750 576,9 13,0 44,4 83,8
Diesel 750 576,9 13,4 43,1 83,8
LFO 720 553,8 12,9 43,0 83,8
HFO 450 346,2 8,6 40,3 83,8
Coal 91 70,0 2,9 24 95 36 85
Natural gas
10,5 7,7 42,1 56,1 55 85
Electricityf 75 20,8
Heatg 35 9,7
Currency conversion 1 € = 1,30 USD a
Calculation of GHG as CO2 equivalents to be based on annual estimated data through the value chain
b As calculated in criterion 4.1 on the basis of net energy sold
c Reference price for the same portfolio of substituted energy using the reference prices in the table above
d Estimated emissions of the energy production related to the portfolio of net energy sold
e Reference emissions of the substituted energy using the reference emissions in the table above
f Reference price excluding taxes and transfer basis highest quartile in EU
g Reference price excluding taxes and distribution
47
Annex IV to Annex D: Energy efficiency calculation General
The energy efficiency for the whole value chain of the concept is calculated as the sum of energy content of the products, delivered at plant gate, divided by the sum of the energy content of raw materials and the additional energy used in logistics and operational process, including the feedstock related energy used. All additional energy contributions shall be traced back to their primary energy source (e.g. electricity input is divided by overall electricity production efficiency). The Well-to-Wheel Report from Joint-Research Centre (version 2C, March 2007) must be used, in the extent possible, as source of data on energy used in association with logistics, farming, electricity generation etc. Data from other sources must be referenced. All data used in the calculations shall be listed. Higher heating value is used for all energy in- and outputs that is given as combustion enthalpies. Two different energy efficiencies are calculated in order to gauge not only the overall energy efficiency but also the efficiency for production of the refined energy products motor fuel and power.
Energy efficiency of refined energy products
So this energy efficiency definition demonstrates the process’ efficiency in producing these two energy products which are both valuable and in high demand but are not easily produced from biomass – in contrast to heat.
Energy efficiency, all products or their substitutes
By Energy Products is meant fuel (motorfuel, heating oil...), electrical power and heat. If heat is included, this must be consistently included also in the project economics (criterion 4.1). By-products can be included by the substitution principle
36 allowing e.g. a chemical or feed
component to be valued for the energy credit equal to the energy saved by not producing the material that the co-product is most likely to replace.
36 As recommended in ISO-14040, Environmental Management – Lifecycle Assessment – Requirement and Guidelines