european influenza surveillance...
TRANSCRIPT
European Influenza Surveillance Scheme
Annual Report
2000-2001 influenza season
Utrecht, December 2001
Nivel, Netherlands Institute for Health Services ResearchPostbus 1568, 3500 BN Utrecht, the NetherlandsDrieharingstraat 6, Utrecht, the Netherlands
The European Influenza Surveillance Scheme Annual Report was prepared by the EISS co-ordination staff with the collaboration of the members of EISS.
EISS co-ordination staff (Nivel):Aad Bartelds, Tamara Meerhoff, John Paget, Koos van der Velden, Jouke van der Zee
Members of EISS:Aymard M (FR), Bartelds AIM (NL), Charlier N (B), Christie P (UK), Cohen JM (FR), Falcao I(PT), Fleming DM (UK), Grauballe P (DK), Havlickova M (CZ), Heckler R (DE), Heijnen M-L(NL), de Jong JC (NL), Lina B (FR), Linde A (SW), Manuguerra J-C (FR), de Mateo S (ES),Mensi C (IT), Mosnier A (FR), Müller D (CH), Mullins N (IRL), Nolan D (IRL), O’Flanagan D(IRL), Paget WJ (NL), Perez-Brena P (ES), Pregliasco F (IT), Prosenc K (SL), Rebelo deAndrade H (PT), Samuelsson S (DK), Schweiger B (DE), Socan M (SL), Thomas D (UK),Thomas Y (CH), Tumova B (CZ), Uphoff H (DE), Valette M (FR), Vega T (ES), van der VeldenK (NL), van der Werf S (FR), Watson J (UK), Yane F (B) and Zambon M (UK).
EISS is funded by the European Commission (DG-Health and Consumer Protection). EISS alsoreceives funding from GlaxoSmithKline and Roche.
Neither the European Commission, GlaxoSmithKline nor Roche, nor any person acting on theirbehalf is liable for any use made of the information in this report.
Suggested citation:
European Influenza Surveillance Scheme. Annual report: 2000-2001 influenzaseason. Utrecht, the Netherlands: Nivel, December 2001.
The report is accessible via the EISS website: www.eiss.org
ISBN 90-6905-550-3
4 Annual report: 2000-2001 influenza season, EISS,2002
Table of contents
European Influenza Surveillance Scheme: participating countries and institutions 5
Abbreviations 6Country codes 6Netherlands Institute for Health Services Research (Nivel) 6
Summary 7
1 Background 91.1 Introduction 91.2 Communicable disease surveillance in Europe 91.3 The funding of EISS 10
2 European Influenza Surveillance Scheme 122.1 Introduction 122.2 Objectives 122.3 Methods 132.4 Results 15
2.4.1 Objectives for the 2000-2001 influenza season 152.4.2 2000-2001 influenza season and previous seasons 17
2.5 Conclusions 24
3 Output 253.1 EISS Weekly Electronic Bulletin 253.2 Publications and conferences (2000-June 2001) 25
4 References 27
5 Appendices 285.1 Partners 285.2 Indicators of influenza activity 285.3 Members 29
European Influenza Surveillance Scheme: participating countries and institutions
Belgium Scientific Institute of Public Health Brussels
Czech Republic National Institute of Public Health Prague
Denmark Statens Serum Institut Copenhagen
France Open Rome ParisInstitut Pasteur ParisUniversité Claude Bernard Lyon
Germany Arbeitsgemeinschaft Influenza MarburgNiedersächsisches Landesgesundheitsamt HanoverRobert Koch-Institut Berlin
Ireland National Disease Surveillance Centre DublinIrish College of General Practitioners Dublin
Italy Università degli Studi di Milano MilanIstituto Superiore di Sanità RomeUniversità di Genova Genoa
Netherlands Erasmus University RotterdamNational Institute of Public Health and the Environment BilthovenNetherlands Institute for Health Services Research Utrecht
Portugal Instituto Nacional de Saude Lisbon
Slovenia Institute of Public Health Ljubljana
Spain Instituto de Salud Carlos III Madrid
Sweden Swedish Institute for Infectious Disease Control Solna
Switzerland Swiss Federal Office of Public Health BernUniversity Hospital of Geneva Geneva
United Kingdom Public Health Laboratory Service LondonRoyal College of General Practitioners Birmingham
Scottish Centre for Infection and Environmental Health Glasgow
Public Health Laboratory Service (Wales) Cardiff
See appendix 5.3 for further details.
6 Annual report: 2000-2001 influenza season, EISS,2002
Abbreviations
ARI Acute respiratory infectionCET Central European TimeEISS European Influenza Surveillance SchemeEC European CommissionEPIET European Programme for Intervention Epidemiology TrainingEU European UnionEuroGROG European Groupe Régional d’Observation de la GrippeFluNet Global WHO surveillance system of influenzaGPs General practitionersGROG Groupe Régional d’Observation de la GrippeILI Influenza-like illnessNivel Netherlands Institute for Health Services ResearchPHLS Public Health Laboratory ServiceRSV Respiratory syncytial virusWHO World Health Organization
Country codes
Belgium BCzech Republic CZDenmark DKFrance FRGermany DEIreland IRLItaly ITNetherlands NLPortugal PTSlovenia SLSpain ESSweden SWSwitzerland CHUnited Kingdom UK
Netherlands Institute for Health Services Research (Nivel)
The EISS co-ordination centre is based at Nivel in Utrecht, the Netherlands. Nivel is anindependent, non-profit research foundation. It has approximately 75 researchers and a grossannual turnover of about 10 million Euros.Nivel has been in charge of the Dutch sentinel surveillance network since 1970. It is a WHOCollaborating Centre for Primary Health Care and has an ISO-9001 certification for its researchactivities.
Annual report: 2000-2001 influenza season, EISS,2002 7
Summary
The European Influenza Surveillance Scheme (EISS) was established in March 1996. Theoriginal members of EISS were: Belgium, France, Germany, the Netherlands, Portugal, Spainand the United Kingdom. EISS has gradually grown over the years and now has 14 membercountries covering 16 influenza surveillance networks: Belgium, the Czech Republic, Denmark,England, France, Germany, Ireland, Italy, the Netherlands, Portugal, Scotland, Slovenia, Spain,Sweden, Switzerland and Wales. During the 2000-2001 influenza season, two new membersjoined the scheme: Ireland and Slovenia.
The surveillance of influenza by the members of EISS is based on an integrated clinical andvirological surveillance model. Sentinel primary care physicians report cases of influenza to adata collection centre and take nose and/or throat swabs from patients for laboratory testing.All laboratory tests are performed by a national reference laboratory. The integration of clinicaland virological information allows the presentation of influenza morbidity rates and virologicaldata in the same population.
Mild to moderate influenza activity was reported by the members of EISS between November2000 and February 2001. The levels of influenza activity in the United Kingdom, Spain andthe Netherlands were very low; the activity recorded in the Netherlands was the lowest since1970. Networks that experienced influenza activity that was similar to previous seasons werethe Czech Republic and Germany. Denmark and Portugal recorded levels of influenza activitythat were slightly higher than those observed during the 1999-2000 season.
Influenza activity in the EISS countries during the 2000-2001 influenza season was largelydue to the influenza A/New Caledonia/20/99 (H1N1) virus, which co-circulated with influenzaB viruses in some countries. Influenza A(H3N2) viruses were isolated sporadically. Influenza A(H1N1) tended to be the dominant virus circulating in the population in the first half of theseason and influenza B in the second half. The 2000-2001 influenza vaccine (containing theA/Moscow/10/99 (H3N2), A/New Caledonia/20/99(H1N1) and B/Beijing/ 184/93-like viruses)provided good protection to the viruses in circulation.
EISS initiated a number of projects during the 2000-2001 influenza season:- The EISS Weekly Electronic Bulletin was launched (see below);- The integration of EuroGROG into EISS (see below);- The European Influenza Diagnosis Quality Control Assessment was implemented;- The Clinical Reporting Quality Control Project was launched;- The Denominator Project was initiated.
The EISS Weekly Electronic Bulletin was introduced during the 2000-2001 influenza season.This bulletin provided a weekly overview of influenza activity in Europe on the EISS website inthe form of a map, a table and commentary written by experts from the EISS group. Thebulletin appeared for 28 consecutive weeks, from week 41 in 2000 to week 16 in 2001.
8 Annual report: 2000-2001 influenza season, EISS,2002
EISS also began the integration of the EuroGROG influenza surveillance system (a surveillancesystem that covers 29 countries in Europe) during the 2000-2001 season. A new EuroGROGwebsite is planned for the 2001-2002 season which will have the same structure as EISS andwill allow the combined surveillance systems to present a more comprehensive overview ofinfluenza activity in Europe.
EISS has established formal links with other communicable disease surveillance networks inEurope (those funded by the European Commission) and has continued its active support ofthe global WHO FluNet influenza surveillance system.
We welcome your visit to the EISS website (www.eiss.org) and comments to this annualreport.
Annual report: 2000-2001 influenza season, EISS,2002 9
1 Background
1.1 Introduction
Influenza is an important public health problem in the industrialised world. It is associatedwith increased general practice consultation rates, hospital admissions and excess deaths(Goddard et al., 2000; Fleming et al., 1999). It must also be considered in terms of increaseddays lost to absence from work, health care planning and influenza pandemic planning.
The WHO established an international network for the surveillance of influenza in 1949 (WHO,2000). This global surveillance system (called FluNET) comprises over 110 national influenzacentres, and influenza activity is published every week on the Internet (Flahault et al, 1998).National influenza centres in Europe have participated in this surveillance system since itscreation.
The surveillance of influenza morbidity in the general population began in the 1960s inwestern Europe (in England and Wales) and was based on sentinel physicians reporting clinicalcases of influenza to a central registry. In the early 1990s, efforts to integrate virologicalinformation was achieved by collecting nose and/or throat swabs from patients diagnosed withinfluenza. The swabs were sent to the national influenza reference laboratory for testing andsubtyping. The integration of clinical and virological data collected in the same population isthe basis of the European Influenza Surveillance Scheme (EISS) (Snacken et al., 1995;Fleming and Cohen, 1996; Snacken et al., 1998; Aymard et al., 1999; Zambon, 1998).
Efforts to create a European surveillance project have been ongoing since the 1980s. The firstproject was the Eurosentinel scheme (1987-1991). This was followed by the ENS-CAREInfluenza Early Warning Scheme (1991-1994) (Snacken et al., 1995; Fleming and Cohen,1996), the European Influenza Early Warning and Surveillance Scheme (1995) and theEuropean Influenza Surveillance Scheme (1996-) (Snacken et al., 1998; Aymard et al.,1999). The European Influenza Surveillance Scheme (EISS) began with the participation ofseven countries: Belgium, France, Germany, the Netherlands, Portugal, Spain and the UnitedKingdom.
There are many reasons why influenza surveillance networks in Europe have got together toshare information. Influenza is a communicable disease that spreads rapidly and efficiently;this means that it is very beneficial for countries to be informed about influenza activity inneighbouring countries (clinical morbidity and the influenza types and strains). Other benefitsof working together are that the different surveillance systems can learn from each other andthat shared experiences can be used to advise and guide the development and creation of newinfluenza surveillance networks in Europe.
10 Annual report: 2000-2001 influenza season, EISS,2002
1.2 Communicable disease surveillance in Europe
The European Union’s competence in public health has steadily increased over time. Whilesome mention of health was present in the early treaties, going back as far as the EuropeanCoal and Steel Community (ECSC) Treaty of 1951, its first substantive appearance was in theSingle European Act of 1987 (McKee and Maclehose, 2000-2001). This Act enabled thedevelopment of the Europe Against Cancer and Europe Against AIDS programmes (McKee andMaclehose, 2000-2001).
It was only in 1992, in Article 129 of the Maastricht Treaty, that a competence in the field ofcommunicable disease was actually defined (McKee and Maclehose, 2000-2001). TheAmsterdam Treaty of 1997 (Article 152) reinforced this competency and emphasised that “ahigh level of health protection should be ensured in the definition and implementation of allCommunity policies and activities” (McKee and Maclehose, 2000-2001).
The provisions of the different Treaties have enabled the development of a range of policies oncommunicable disease prevention and control (McKee and Maclehose, 2000-2001). In 1998,the European Parliament and the Council decided that a network for the epidemiologicalsurveillance and control of communicable diseases should be established in the Community(2119/98/EC, 24 September 1998).
On 22 December 1999, two Commission Decisions were adopted which further defined thisframework. The first Decision (2000/57/EC) concerned the terms of action for an early warningand response system: events that are potential public health threats are to be monitored andreported. The Decision describes procedures for the exchange of information, and stipulatesthe action to be undertaken in case of potential threats and in the case of confirmed threats topublic health. The second Decision (2000/96/EC) identifies the communicable diseases andspecial health issues that have to be covered by epidemiological surveillance in the“Community network”. Influenza is one of the communicable diseases listed in this Decision.
As a result of these two Decisions, a new European early warning and response system forcommunicable diseases was officially launched on 1 January 2000. EISS is one of theepidemiological surveillance networks that the EC funds to monitor communicable diseases inEurope.
1.3 The funding of EISS
EISS began receiving funding from the European Commission (EC) in November 1999. By thistime, the scheme included eight European Union (EU) Member States and two EU-relatedStates. Today, 16 surveillance networks are members of EISS: Belgium, the Czech Republic,Denmark, England, France, Germany, Ireland, Italy, the Netherlands, Portugal, Scotland,Slovenia, Spain, Sweden, Switzerland and Wales.
EISS has received funding from industry since September 2000 (GlaxoSmithKline and Roche).
Annual report: 2000-2001 influenza season, EISS,2002 11
The EISS project uses the following formula to separate EC and industry funding:
EC projects: All projects which concern the ongoing running of the surveillance system,the EISS website, the two regular annual meetings of EISS, theharmonisation and standardisation efforts (e.g. the quality controlstudies), and the extension of EISS to other countries in Europe,particularly Member States and pre-accession countries
Industry projects: All other projects (e.g. the EISS Weekly Electronic Bulletin)
In 2000 and 2001, 70-75% of the total EISS budget was funded by the EC and 25-30% byindustry.
EISS has a strict “code-of-conduct” concerning the influence of industry on its activities andpublications, including those on its website. Industry is not involved in the managementstructure of EISS (industry has an observer status at its two annual meetings) or in thepreparation of EISS documents, reports and publications.
12 Annual report: 2000-2001 influenza season, EISS,2002
2 European Influenza Surveillance Scheme
2.1 Introduction
The EISS project involves different partners in each country: sentinel surveillance systems,national influenza reference laboratories and national communicable disease surveillancecentres. These various partners are connected via an Internet website (www.eiss.org) (Snackenet al., 1995) which allows members to view influenza activity in the other networks and tolaunch detailed clinical and virological queries. Maps, figures, tables and data from previousyears can also be downloaded from the EISS database.
The co-ordination of the EISS project is based at the Netherlands Institute for Health ServicesResearch (Nivel) in Utrecht, the Netherlands. The role of the co-ordination centre is to:
- Co-ordinate the EISS website;- Manage and update the EISS database;- Co-ordinate EISS projects (e.g. the quality control projects);- Present results (e.g. write scientific articles);- Encourage the exchange of information between EISS participants;- Represent EISS at meetings (e.g. EC meetings);- Manage contracts (with the EC and industry);- Organise EISS meetings twice a year;- Write an annual report.
Two meetings are organised each year to co-ordinate the activities of EISS, one before theinfluenza season (September/October) and the second at the end of the season (April/May).The meetings have been organised on a regular basis since 1996 and represent an importantmoment to exchange information, research findings and initiate new projects. In September2000 the EISS meeting was held in Crete (at the Options for the Control of InfluenzaConference) and in May 2001 it was held in Siena, Italy.
2.2 Objectives
EISS has the following objectives:
� To facilitate the rapid exchange of information on influenza activity in Europe;� To combine clinical and virological data in the same population;� To identify causal viruses in the population and recognise virological changes;� To provide standardised information of high quality.
Annual report: 2000-2001 influenza season, EISS,2002 13
A number of specific objectives were established for the 2000-2001 influenza season:
� Integrate two new surveillance networks into EISS (Ireland and Slovenia);� Implement the EISS Weekly Electronic Bulletin (a weekly report on influenza activity in
Europe);� Implement the European Influenza Diagnosis Quality Control Assessment;� Launch the Clinical Reporting Quality Control Project;� Integrate the EuroGROG surveillance project into EISS;� Establish an automatic data transfer between the EISS and WHO FluNet;� Further develop the Denominator Project (objective: all EISS networks present influenza rates
based on the same denominator);� Organise EISS meetings before and after the 2000-2001 influenza season;� Write an annual report for the 2000-2001 influenza season.
2.3 Methods
MembershipAll countries in Europe are welcome to join EISS. Full members must meet the followingcriteria:
� The network is nationally or regionally representative;� The authority of the network is recognised by the national or regional health authority in the
country or region;� Clinical surveillance and virological surveillance are integrated in the same population
(community);� The network has functioned successfully for two years;� The network can deliver data on a weekly basis.
A total of 11 EU (Belgium, Denmark, France, Germany, Ireland, Italy, the Netherlands,Portugal, Spain, Sweden and the United Kingdom) and 3 non-EU states (the Czech Republic,Slovenia and Switzerland) are presently members of EISS. Since Scotland and Wales have theirown influenza surveillance networks, there are 16 networks in EISS. With the exception of theSpanish network, all networks are national; the Spanish influenza surveillance network is madeup of 6 regional networks covering 53% of the total population in Spain.
Two networks are “associate” members: the Irish and the Swedish networks. The Irish networkis an “associate” member because it has not yet been in operation for two years and theSwedish one because it does not yet combine clinical and virological data in the samepopulation.
Clinical information collected by EISSThe clinical surveillance of influenza by the EISS networks is generally based on reports madeby sentinel general practitioners. Some of the sentinel surveillance systems also includepaediatricians (the Czech Republic, France, Germany, Italy, Slovenia, Spain, Switzerland) andphysicians with other specialisations (Slovenia and Switzerland) (Table 1). The physiciansusually represent 1-5% of physicians working in the country, community or region.
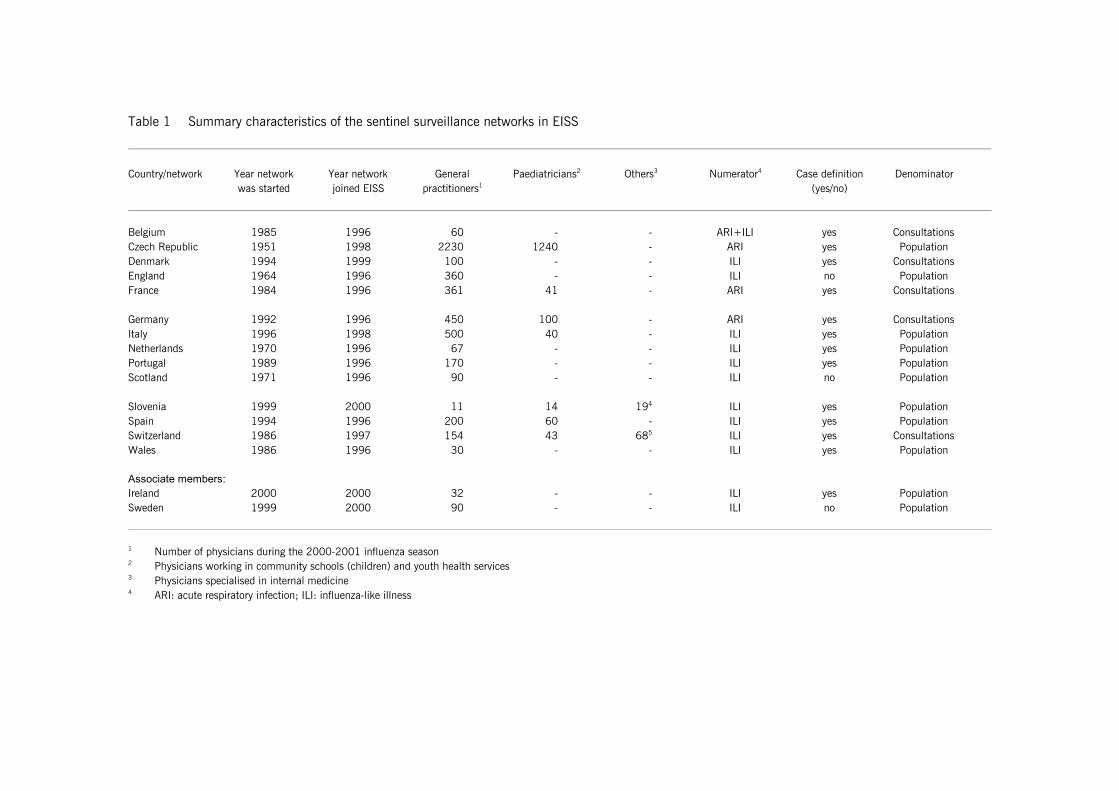
Table 1 Summary characteristics of the sentinel surveillance networks in EISS
Country/network Year network Year network General Paediatricians2 Others3 Numerator4 Case definition Denominatorwas started joined EISS practitioners1 (yes/no)
Belgium 1985 1996 60 - - ARI+ILI yes ConsultationsCzech Republic 1951 1998 2230 1240 - ARI yes PopulationDenmark 1994 1999 100 - - ILI yes ConsultationsEngland 1964 1996 360 - - ILI no PopulationFrance 1984 1996 361 41 - ARI yes Consultations
Germany 1992 1996 450 100 - ARI yes ConsultationsItaly 1996 1998 500 40 - ILI yes PopulationNetherlands 1970 1996 67 - - ILI yes PopulationPortugal 1989 1996 170 - - ILI yes PopulationScotland 1971 1996 90 - - ILI no Population
Slovenia 1999 2000 11 14 194 ILI yes PopulationSpain 1994 1996 200 60 - ILI yes PopulationSwitzerland 1986 1997 154 43 685 ILI yes ConsultationsWales 1986 1996 30 - - ILI yes Population
Associate members:Ireland 2000 2000 32 - - ILI yes PopulationSweden 1999 2000 90 - - ILI no Population
1 Number of physicians during the 2000-2001 influenza season2 Physicians working in community schools (children) and youth health services3 Physicians specialised in internal medicine4 ARI: acute respiratory infection; ILI: influenza-like illness
Annual report: 2000-2001 influenza season, EISS,2002 15
The case definitions and denominator populations used for the clinical surveillance of influenzavary by network. Most sentinel surveillance systems report data on the number of new cases ofinfluenza-like illness (ILI) (Denmark, the Netherlands, England, Ireland, Italy, Portugal,Scotland, Slovenia, Spain, Sweden, Switzerland and Wales), whilst others report the numberof new cases of acute respiratory infection (ARI) (Belgium (ARI and ILI), the Czech Republic,France and Germany) (Table 1).
Some sentinel surveillance systems have denominator populations that are based on patientlists (the Czech Republic, England, the Netherlands, Ireland, Italy, Portugal, Scotland,Slovenia, Spain, Sweden, Wales) whilst others are based on the total number of consultations(Belgium, Denmark, France, Germany and Switzerland). Surveillance systems with populationdenominators present the number of cases per 100,000 population and those withconsultation denominators the number of cases per 100 consultations (%) (Table 1).
Virological information collected by EISSFor the virological surveillance of influenza, the sentinel physicians are asked to take noseand/or throat swabs from patients with influenza-like illness or acute respiratory infection(depending on the sentinel surveillance system - see above). The swabs are sent to a centrallaboratory and tested for influenza viruses (if positive, subtypes are determined) and a panel ofother respiratory viruses. The panel includes infections that can cause symptoms that aresimilar to influenza e.g. respiratory syncytial virus (RSV).
EISS also collects data on influenza tests carried out by the participating reference laboratorieson non-sentinel surveillance material (e.g. material submitted by hospitals).
2.4 Results
2.4.1 Objectives for the 2000-2001 influenza season
EISS Weekly Electronic BulletinEISS successfully introduced the Weekly Electronic Bulletin on the public pages of the websiteduring the 2000-2001 influenza season. This bulletin provided a weekly overview of influenzaactivity in Europe in the form of a map describing the geographic spread of influenza, a table(morbidity rates and the dominant virus type for each network) and a commentary written byexperts from the EISS group. The bulletin appeared for 28 consecutive weeks, from week 41 in2000 to week 16 in 2001.
The European Influenza Diagnosis Quality Control AssessmentThis is a project that aims to assess the quality of virological testing by influenza referencelaboratories in Europe (in EISS and non-EISS countries). The study was carried out by DrMartine Vallette and Professor Michèle Aymard at the University of Lyon in France.
Laboratories across Europe were first asked if they would be willing to participate in the study.Sixteen reference laboratories accepted in the following countries: Belgium, Czech Republic,France (2 laboratories), Germany, Italy, Norway (2x), Portugal, Romania, Spain, Sweden,Switzerland, the Netherlands (2x) and United Kingdom.
The co-ordination centre in Lyon first prepared a panel of 24 coded samples (influenza A, B,RSV and no virus). Two panels of twelve samples were sent to the participating laboratories for
16 Annual report: 2000-2001 influenza season, EISS,2002
testing: one on 20.11.00 and the second on 4.12.00. All results were reported back to the co-ordination centre in Lyon, where the analysis and assessment was made. Preliminary findingsof this assessment were presented at our EISS meeting in May 2001.
The Clinical Reporting Quality Control ProjectThis project aims to standardise and harmonise clinical reporting systems in EISS. Dr Jean-Francois Aguilera, an EPIET trainee based at PHLS in London, is carrying out the project incollaboration with the EISS co-ordination centre. The project has two main components:
1) An inventory of methods used for the surveillance of influenza in Europe;2) The establishment of a clinical surveillance protocol and the evaluation of this protocol in a
number of EISS networks. The latter involves a visit to the country, discussions with all partiesinvolved in the surveillance system (the co-ordinators and a sample of sentinel physicians)and a written report.An evaluation of two EISS influenza surveillance networks (one of which will be Spain) isplanned during the 2001-2002 influenza season.
EuroGROGEuroGROG is a complementary influenza surveillance scheme that is based at the InstitutPasteur in Paris and covers 29 countries in Europe. The difference between EISS andEuroGROG is that whilst EuroGROG collects (limited) descriptive information on influenzaactivity from a large number of European countries, it does not collect standardised clinical andvirological data derived from the same population.
The EC has provided EISS with funding to create a new EuroGROG website which will havethe same structure as EISS. The plan is to develop a website and data collection procedurewhich are similar to EISS. Combining information from the two surveillance schemes willenable EISS to provide a more comprehensive picture of influenza activity in Europe.
The original objective was to have the new system running during the 2000-2001 influenzaseason. This was not possible and the EuroGROG website will now be launched during the2001-2002 influenza season.
Data transfer EISS-WHO FluNetEuropean networks participating in EISS enter their data into the EISS database every weekduring the influenza season (week 40 to week 20 of the following year). Most of the networksalso enter their data into the WHO-FluNet database. The members of EISS would like toestablish an automatic data transfer between EISS and FluNet. The implementation of thisdata transfer was planned for the 2000-2001 season but is now scheduled for the 2001-2002 influenza season.
Denominator ProjectFive networks in the EISS project present influenza rates per 100 consultations (Belgium,Denmark, France, Germany and Switzerland). They do so as they do not know the populationcovered by their sentinel physicians (in many countries this data is available in the form ofpatient lists as persons must be registered with a physician) (Schlaud, 1999). The objective ofthe Denominator Project is to develop a methodology that allows all EISS networks to use thesame population denominator.
Annual report: 2000-2001 influenza season, EISS,2002 17
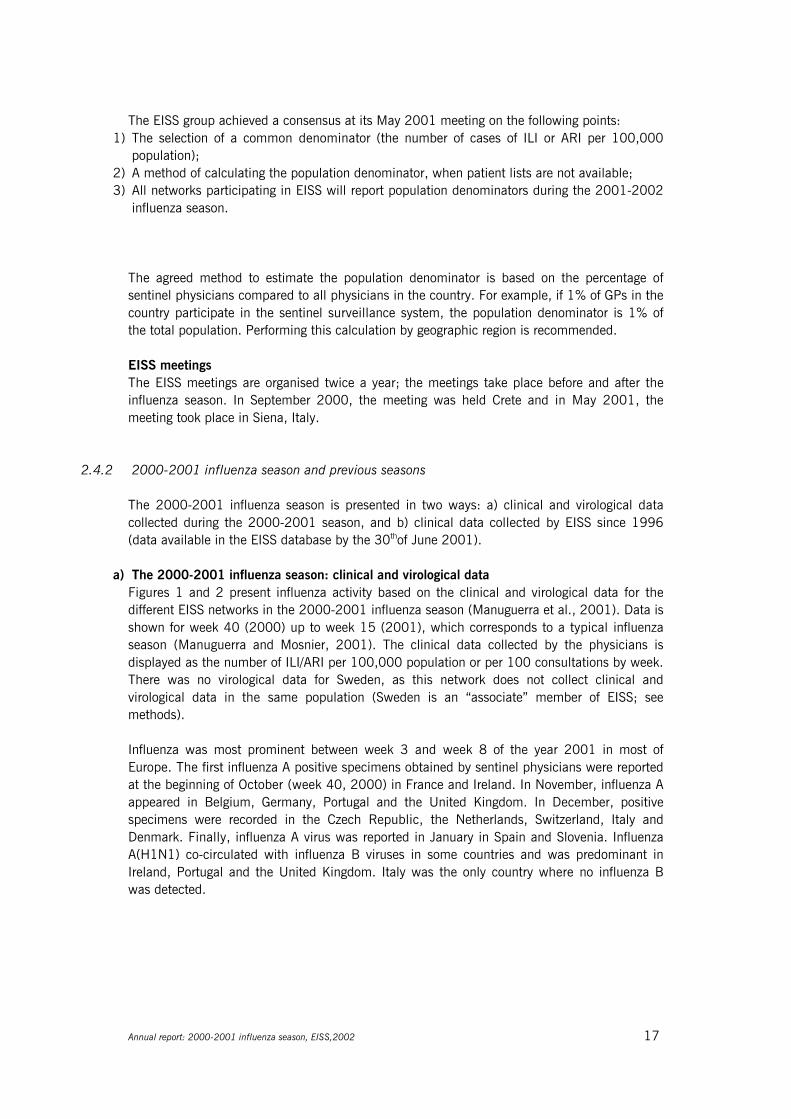
The EISS group achieved a consensus at its May 2001 meeting on the following points:1) The selection of a common denominator (the number of cases of ILI or ARI per 100,000
population);2) A method of calculating the population denominator, when patient lists are not available;3) All networks participating in EISS will report population denominators during the 2001-2002
influenza season.
The agreed method to estimate the population denominator is based on the percentage ofsentinel physicians compared to all physicians in the country. For example, if 1% of GPs in thecountry participate in the sentinel surveillance system, the population denominator is 1% ofthe total population. Performing this calculation by geographic region is recommended.
EISS meetingsThe EISS meetings are organised twice a year; the meetings take place before and after theinfluenza season. In September 2000, the meeting was held Crete and in May 2001, themeeting took place in Siena, Italy.
2.4.2 2000-2001 influenza season and previous seasons
The 2000-2001 influenza season is presented in two ways: a) clinical and virological datacollected during the 2000-2001 season, and b) clinical data collected by EISS since 1996(data available in the EISS database by the 30thof June 2001).
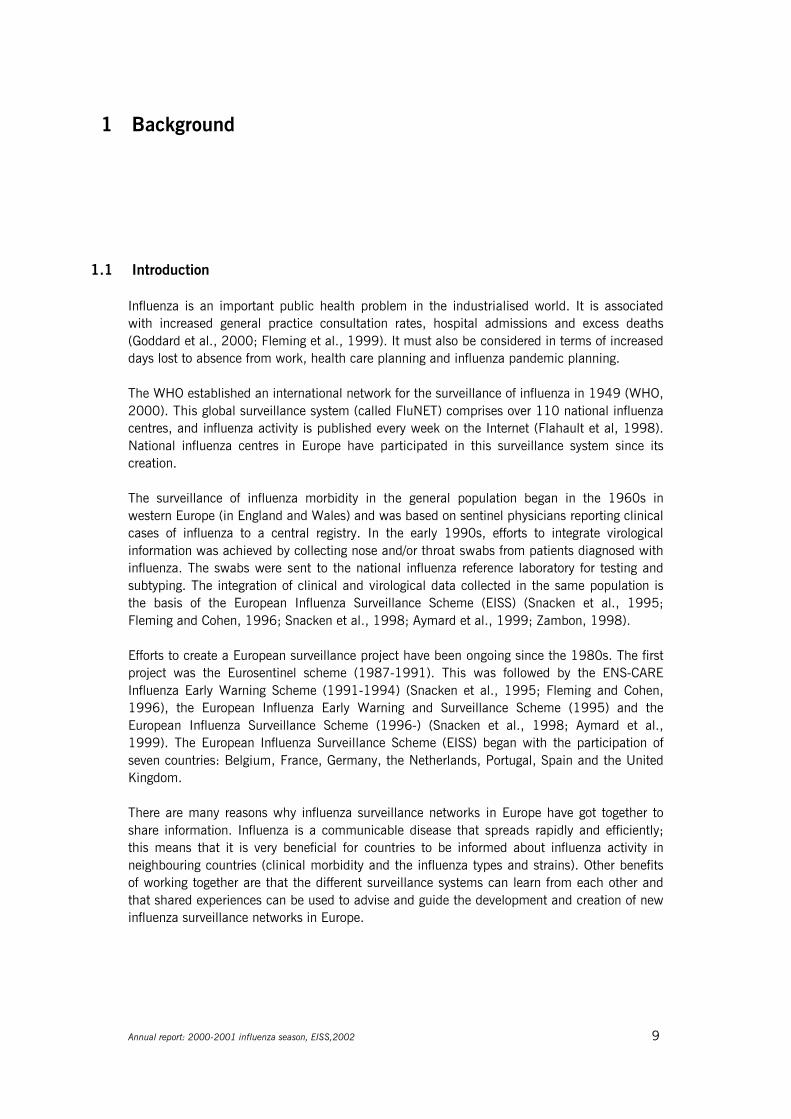
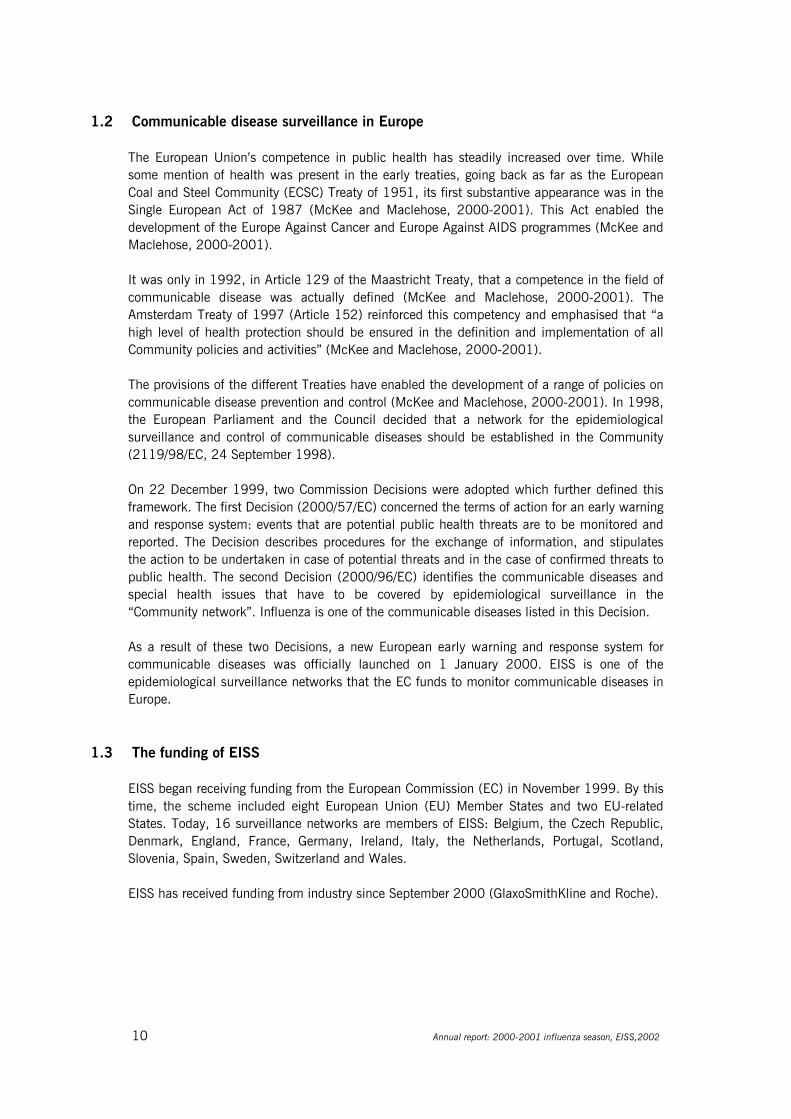
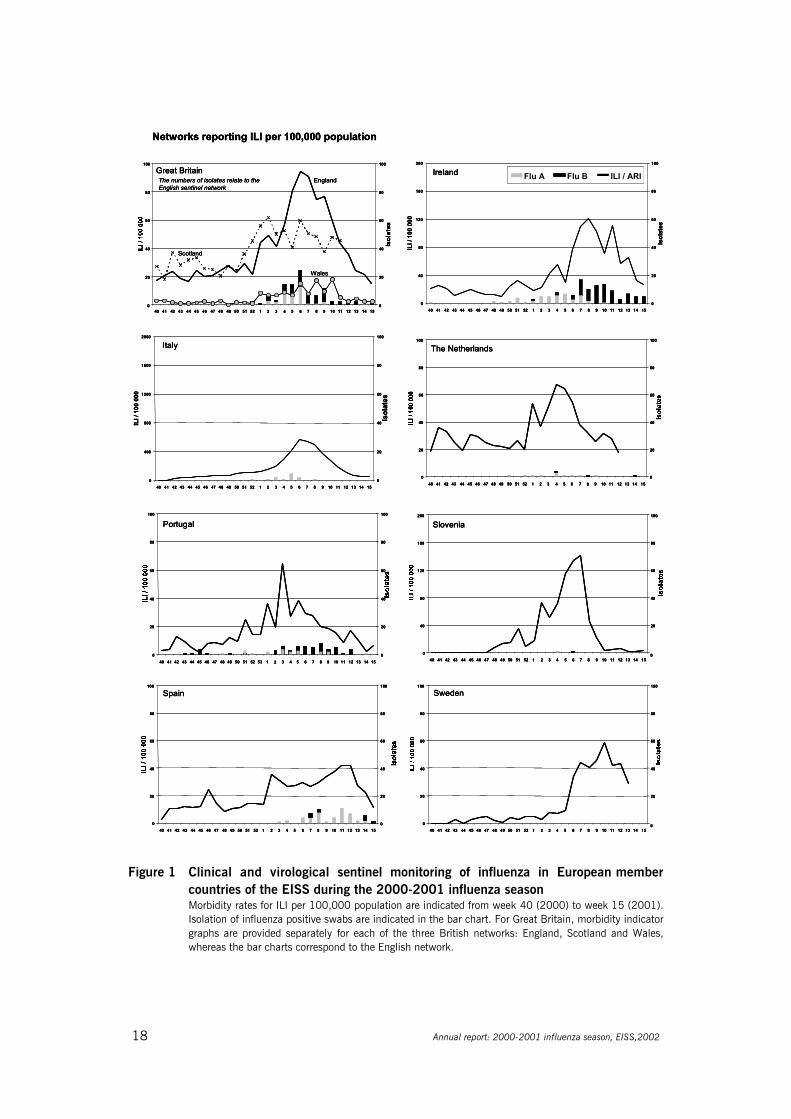
a) The 2000-2001 influenza season: clinical and virological dataFigures 1 and 2 present influenza activity based on the clinical and virological data for thedifferent EISS networks in the 2000-2001 influenza season (Manuguerra et al., 2001). Data isshown for week 40 (2000) up to week 15 (2001), which corresponds to a typical influenzaseason (Manuguerra and Mosnier, 2001). The clinical data collected by the physicians isdisplayed as the number of ILI/ARI per 100,000 population or per 100 consultations by week.There was no virological data for Sweden, as this network does not collect clinical andvirological data in the same population (Sweden is an “associate” member of EISS; seemethods).
Influenza was most prominent between week 3 and week 8 of the year 2001 in most ofEurope. The first influenza A positive specimens obtained by sentinel physicians were reportedat the beginning of October (week 40, 2000) in France and Ireland. In November, influenza Aappeared in Belgium, Germany, Portugal and the United Kingdom. In December, positivespecimens were recorded in the Czech Republic, the Netherlands, Switzerland, Italy andDenmark. Finally, influenza A virus was reported in January in Spain and Slovenia. InfluenzaA(H1N1) co-circulated with influenza B viruses in some countries and was predominant inIreland, Portugal and the United Kingdom. Italy was the only country where no influenza Bwas detected.
18 Annual report: 2000-2001 influenza season, EISS,2002
1 50
2 7 90
20
40
60
80
100
40 41 42 43 44 45 46 47 48 49 50 51 52 3 4 6 8 10 11 12 13 14 15
20
40
60
80
100
Sweden
10
3 80
20
40
60
80
100
40 41 42 43 44 45 46 47 48 49 50 51 52 2 4 5 6 7 9 10 11 12 13 14 15
20
40
60
80
100
Spain
2 9840 41 42 43 44 45 46 47 48 49 50 51 52 53 1 3 4 5 6 7 10 11 12 13 14 150
20
40
60
80
100
0
20
40
60
80
100
Portugal
1 50
2 7 90
40
80
120
160
200
40 41 42 43 44 45 46 47 48 49 50 51 52 3 4 6 8 10 11 12 13 14 15
20
40
60
80
100
Slovenia
Networks reporting ILI per 100,000 population
4 65 7 90
20
40
60
80
100
40 41 42 43 44 45 46 47 48 49 50 51 52 1 2 3 8 10 11 12 13 14 150
20
40
60
80
100
Great BritainEngland
Scotland
Wales
The numbers of isolates relate to the English sentinel network
Flu A Flu B ILI / ARI
0
400
800
1200
1600
2000
40 41 42 43 44 45 46 47 48 49 50 51 52 1 2 3 4 5 6 7 8 9 10 11 12 13 14 15
ILI /
100
000
0
20
40
60
80
100
Isol
ates
Italy
0
40
80
120
160
200
40 41 42 43 44 45 46 47 48 49 50 51 52 1 2 3 4 5 6 7 8 9 10 11 12 13 14 15
ILI /
100
000
0
20
40
60
80
100
Isol
ates
Ireland
82 4 90
20
40
60
80
100
40 41 42 43 44 45 46 47 48 49 50 51 52 1 3 5 6 7 10 11 12 13 14 150
20
40
60
80
100
The Netherlands
1 50
2 7 90
20
40
60
80
100
40 41 42 43 44 45 46 47 48 49 50 51 52 3 4 6 8 10 11 12 13 14 15
20
40
60
80
100
Sweden
10
3 80
20
40
60
80
100
40 41 42 43 44 45 46 47 48 49 50 51 52 2 4 5 6 7 9 10 11 12 13 14 15
20
40
60
80
100
Spain
2 9840 41 42 43 44 45 46 47 48 49 50 51 52 53 1 3 4 5 6 7 10 11 12 13 14 150
20
40
60
80
100
0
20
40
60
80
100
Portugal
1 50
2 7 90
40
80
120
160
200
40 41 42 43 44 45 46 47 48 49 50 51 52 3 4 6 8 10 11 12 13 14 15
20
40
60
80
100
Slovenia
Networks reporting ILI per 100,000 population
4 65 7 90
20
40
60
80
100
40 41 42 43 44 45 46 47 48 49 50 51 52 1 2 3 8 10 11 12 13 14 150
20
40
60
80
100
Great BritainEngland
Scotland
Wales
The numbers of isolates relate to the English sentinel network
Flu A Flu B ILI / ARI
0
400
800
1200
1600
2000
40 41 42 43 44 45 46 47 48 49 50 51 52 1 2 3 4 5 6 7 8 9 10 11 12 13 14 15
ILI /
100
000
0
20
40
60
80
100
Isol
ates
Italy
0
40
80
120
160
200
40 41 42 43 44 45 46 47 48 49 50 51 52 1 2 3 4 5 6 7 8 9 10 11 12 13 14 15
ILI /
100
000
0
20
40
60
80
100
Isol
ates
Ireland
1 50
2 7 90
20
40
60
80
100
40 41 42 43 44 45 46 47 48 49 50 51 52 3 4 6 8 10 11 12 13 14 15
20
40
60
80
100
Sweden
10
3 80
20
40
60
80
100
40 41 42 43 44 45 46 47 48 49 50 51 52 2 4 5 6 7 9 10 11 12 13 14 15
20
40
60
80
100
Spain
2 9840 41 42 43 44 45 46 47 48 49 50 51 52 53 1 3 4 5 6 7 10 11 12 13 14 150
20
40
60
80
100
0
20
40
60
80
100
Portugal
1 50
2 7 90
40
80
120
160
200
40 41 42 43 44 45 46 47 48 49 50 51 52 3 4 6 8 10 11 12 13 14 15
20
40
60
80
100
Slovenia
Networks reporting ILI per 100,000 population
4 65 7 90
20
40
60
80
100
40 41 42 43 44 45 46 47 48 49 50 51 52 1 2 3 8 10 11 12 13 14 150
20
40
60
80
100
Great BritainEngland
Scotland
Wales
The numbers of isolates relate to the English sentinel network
Flu A Flu B ILI / ARI
0
400
800
1200
1600
2000
40 41 42 43 44 45 46 47 48 49 50 51 52 1 2 3 4 5 6 7 8 9 10 11 12 13 14 15
ILI /
100
000
0
20
40
60
80
100
Isol
ates
Italy
0
40
80
120
160
200
40 41 42 43 44 45 46 47 48 49 50 51 52 1 2 3 4 5 6 7 8 9 10 11 12 13 14 15
ILI /
100
000
0
20
40
60
80
100
Isol
ates
Ireland
82 4 90
20
40
60
80
100
40 41 42 43 44 45 46 47 48 49 50 51 52 1 3 5 6 7 10 11 12 13 14 150
20
40
60
80
100
The Netherlands
82 4 90
20
40
60
80
100
40 41 42 43 44 45 46 47 48 49 50 51 52 1 3 5 6 7 10 11 12 13 14 150
20
40
60
80
100
The Netherlands
Figure 1 Clinical and virological sentinel monitoring of influenza in European membercountries of the EISS during the 2000-2001 influenza season Morbidity rates for ILI per 100,000 population are indicated from week 40 (2000) to week 15 (2001).Isolation of influenza positive swabs are indicated in the bar chart. For Great Britain, morbidity indicatorgraphs are provided separately for each of the three British networks: England, Scotland and Wales,whereas the bar charts correspond to the English network.
Annual report: 2000-2001 influenza season, EISS,2002 19
2 7
6 8
0%
5%
10%
15%
20%
40 41 42 43 44 45 46 47 48 49 50 51 52 1 3 4 5 6 80
50
100
150
200
250
300
Germany
Networks reporting ILI per 100 consultations
0%
10%
20%
30%
40%
50%
40 41 42 43 44 45 46 47 48 49 50 51 52 1 2 3 4 5 6 7 8 9 10 11 12 13 14 150
50
100
150
200
France
0%
10%
20%
30%
40%
50%
40 41 42 43 44 45 46 47 48 49 50 51 52 1 2 3 4 5 7 9 10 11 12 13 14 150
20
40
60
80
100
Belgium
Networks reporting ARI per 100,000 population (Czech Republic) and per 100 consultations
0
1000
2000
3000
4000
5000
40 41 42 43 44 45 46 47 48 49 50 51 52 53 1 2 3 4 5 6 7 8 9 10 11 12 13 14 150
50
100
150
200
250
300
Czech Republic
10%
1 3 8 4
0%
2%
4%
6%
8%
40 41 42 43 44 45 46 47 48 49 50 51 52 2 4 5 6 7 9 10 11 12 13 14 150
20
40
60
80
100
Denmark
0%
2%
4%
6%
8%
10%
40 41 42 43 44 45 46 47 48 49 50 51 52 1 2 3 5 6 7 80
20
40
60
80
100
Switzerland Flu A Flu B ILI / ARI
2 7
6 8
0%
5%
10%
15%
20%
40 41 42 43 44 45 46 47 48 49 50 51 52 1 3 4 5 6 80
50
100
150
200
250
300
Germany
Networks reporting ILI per 100 consultations
0%
10%
20%
30%
40%
50%
40 41 42 43 44 45 46 47 48 49 50 51 52 1 2 3 4 5 6 7 8 9 10 11 12 13 14 150
50
100
150
200
France
0%
10%
20%
30%
40%
50%
40 41 42 43 44 45 46 47 48 49 50 51 52 1 2 3 4 5 7 9 10 11 12 13 14 150
20
40
60
80
100
Belgium
Networks reporting ARI per 100,000 population (Czech Republic) and per 100 consultations
0
1000
2000
3000
4000
5000
40 41 42 43 44 45 46 47 48 49 50 51 52 53 1 2 3 4 5 6 7 8 9 10 11 12 13 14 150
50
100
150
200
250
300
Czech Republic
10%
1 3 8 4
0%
2%
4%
6%
8%
40 41 42 43 44 45 46 47 48 49 50 51 52 2 4 5 6 7 9 10 11 12 13 14 150
20
40
60
80
100
Denmark
0%
2%
4%
6%
8%
10%
40 41 42 43 44 45 46 47 48 49 50 51 52 1 2 3 5 6 7 80
20
40
60
80
100
Switzerland Flu A Flu B ILI / ARIFlu A Flu B ILI / ARI
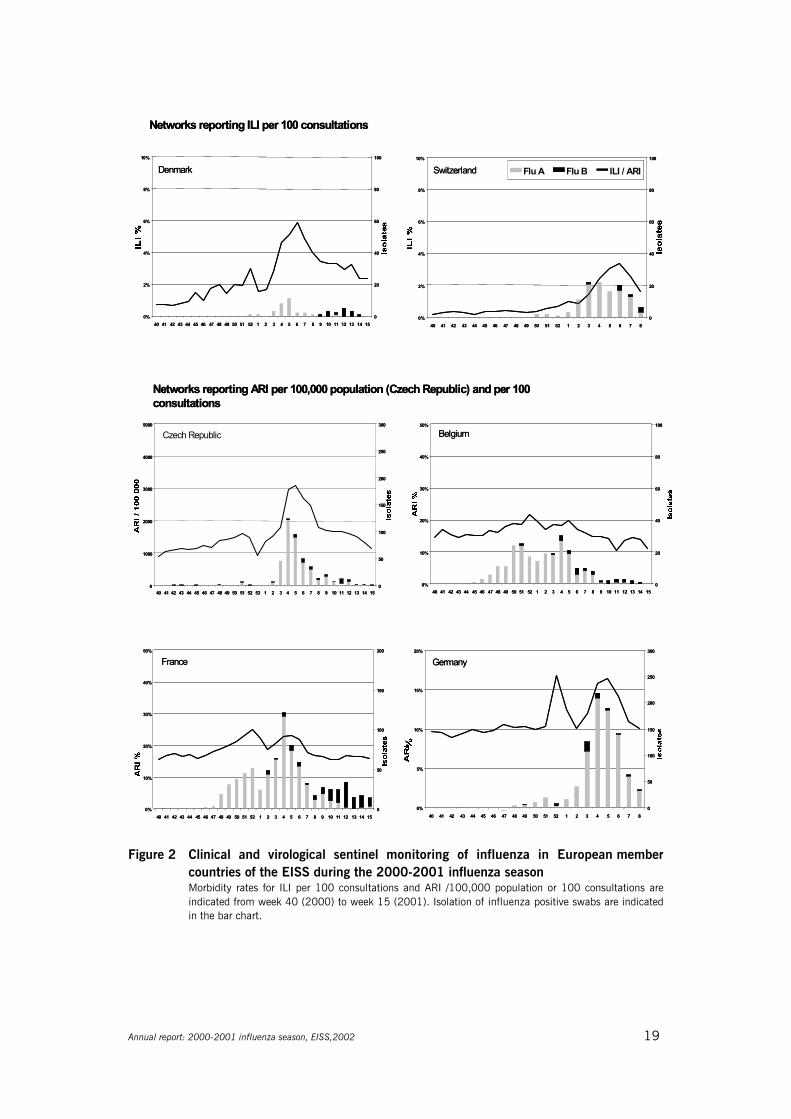
Figure 2 Clinical and virological sentinel monitoring of influenza in European membercountries of the EISS during the 2000-2001 influenza seasonMorbidity rates for ILI per 100 consultations and ARI /100,000 population or 100 consultations areindicated from week 40 (2000) to week 15 (2001). Isolation of influenza positive swabs are indicatedin the bar chart.
20 Annual report: 2000-2001 influenza season, EISS,2002
EISS 2000-2001 influenza season sentinel specimens
36%(n=1160)
1%(n=25)
17%(n=555)
46%(n=1472) A (untyped)
A (H1N1)
A (H3N2)
B
N=3212
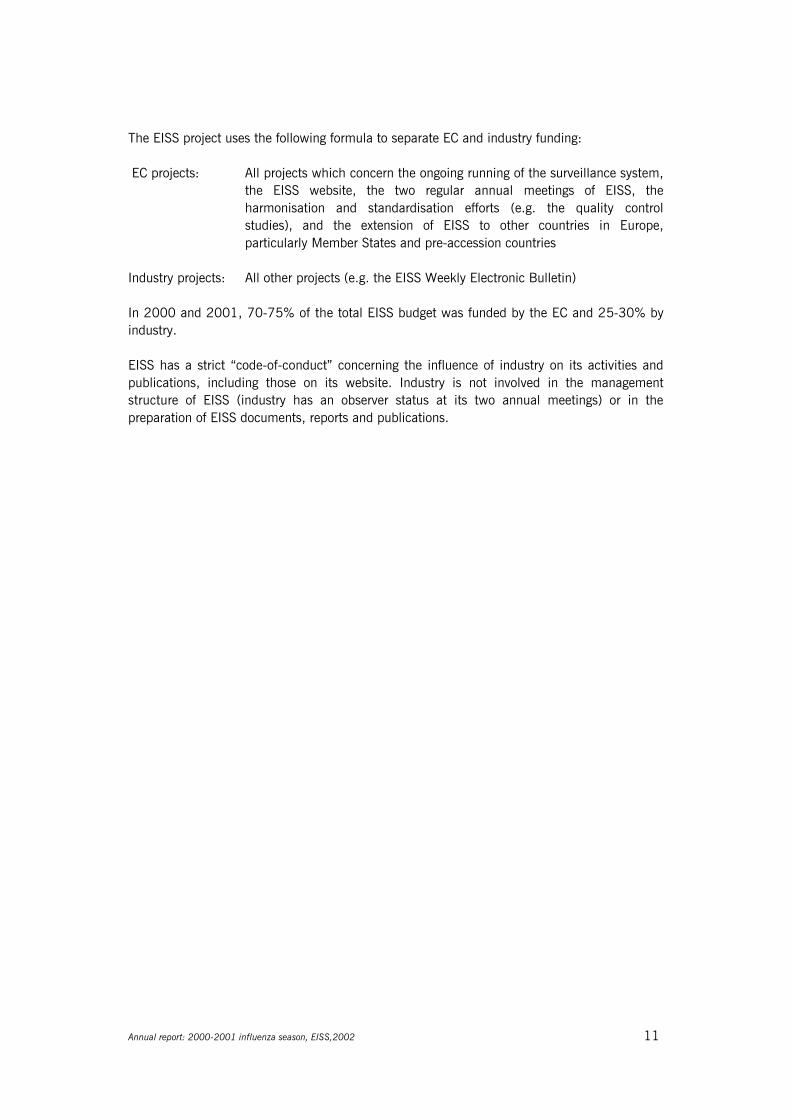
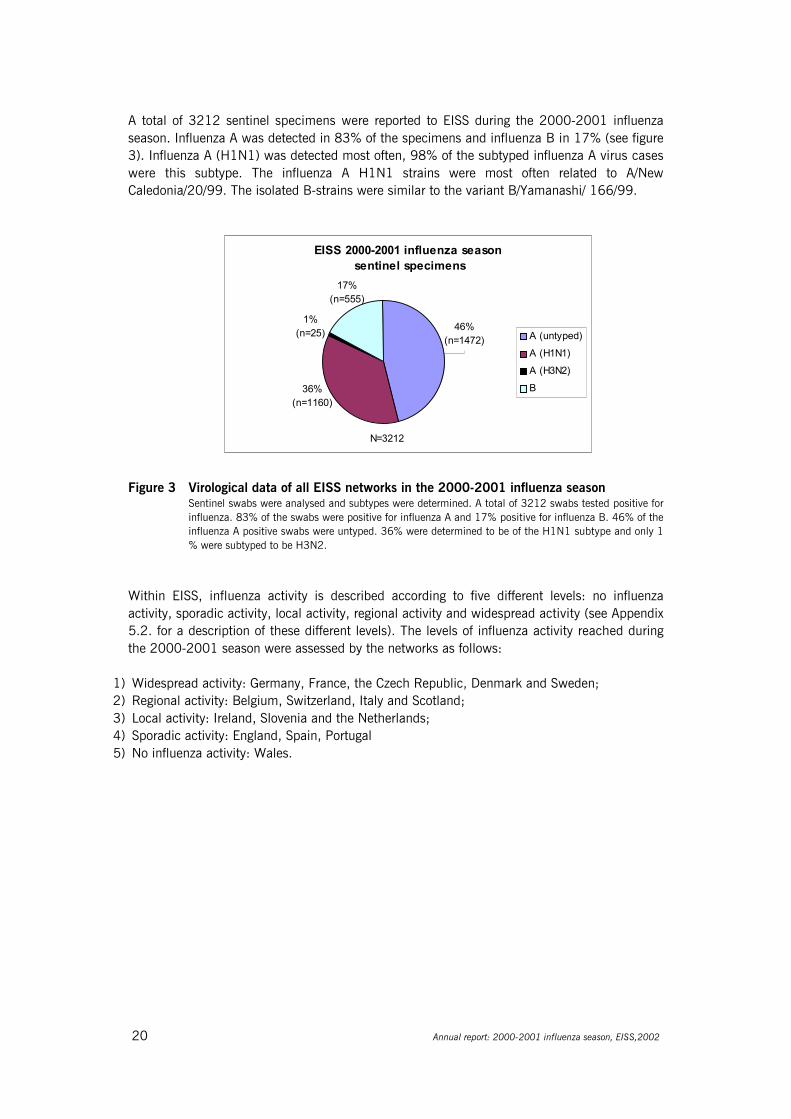
A total of 3212 sentinel specimens were reported to EISS during the 2000-2001 influenzaseason. Influenza A was detected in 83% of the specimens and influenza B in 17% (see figure3). Influenza A (H1N1) was detected most often, 98% of the subtyped influenza A virus caseswere this subtype. The influenza A H1N1 strains were most often related to A/NewCaledonia/20/99. The isolated B-strains were similar to the variant B/Yamanashi/ 166/99.
Figure 3 Virological data of all EISS networks in the 2000-2001 influenza seasonSentinel swabs were analysed and subtypes were determined. A total of 3212 swabs tested positive forinfluenza. 83% of the swabs were positive for influenza A and 17% positive for influenza B. 46% of theinfluenza A positive swabs were untyped. 36% were determined to be of the H1N1 subtype and only 1% were subtyped to be H3N2.
Within EISS, influenza activity is described according to five different levels: no influenzaactivity, sporadic activity, local activity, regional activity and widespread activity (see Appendix5.2. for a description of these different levels). The levels of influenza activity reached duringthe 2000-2001 season were assessed by the networks as follows:
1) Widespread activity: Germany, France, the Czech Republic, Denmark and Sweden;2) Regional activity: Belgium, Switzerland, Italy and Scotland;3) Local activity: Ireland, Slovenia and the Netherlands;4) Sporadic activity: England, Spain, Portugal5) No influenza activity: Wales.
Annual report: 2000-2001 influenza season, EISS,2002 21
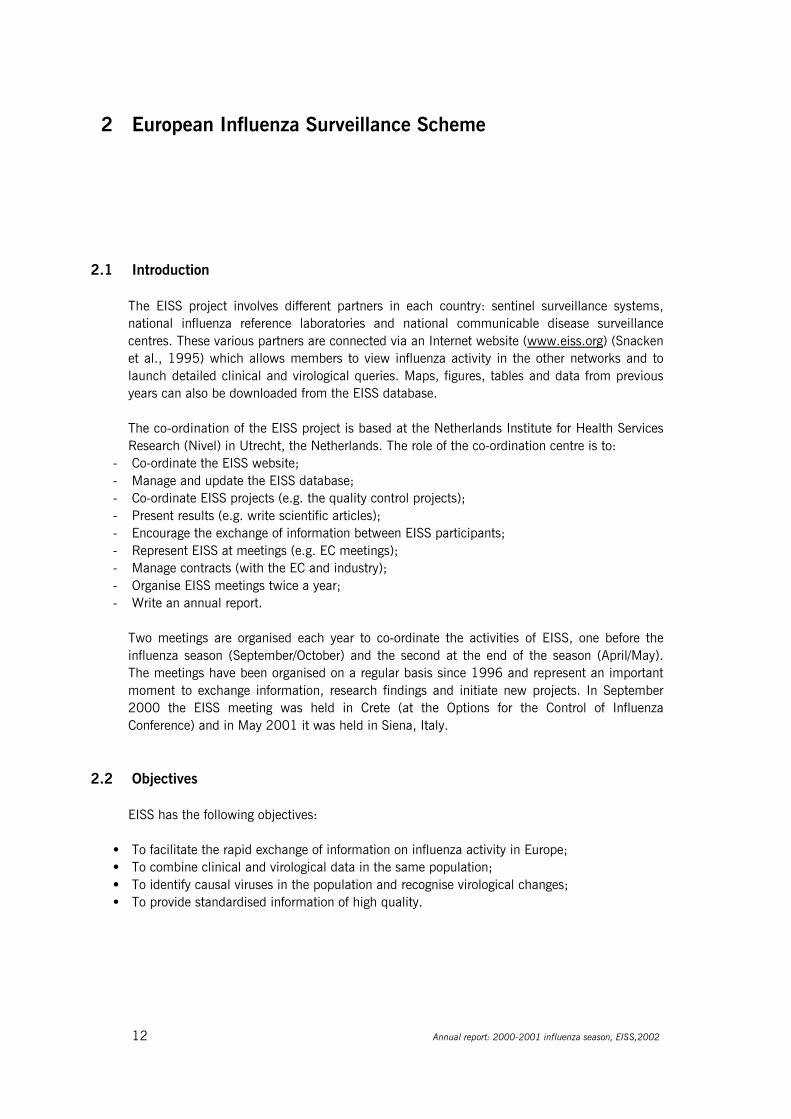
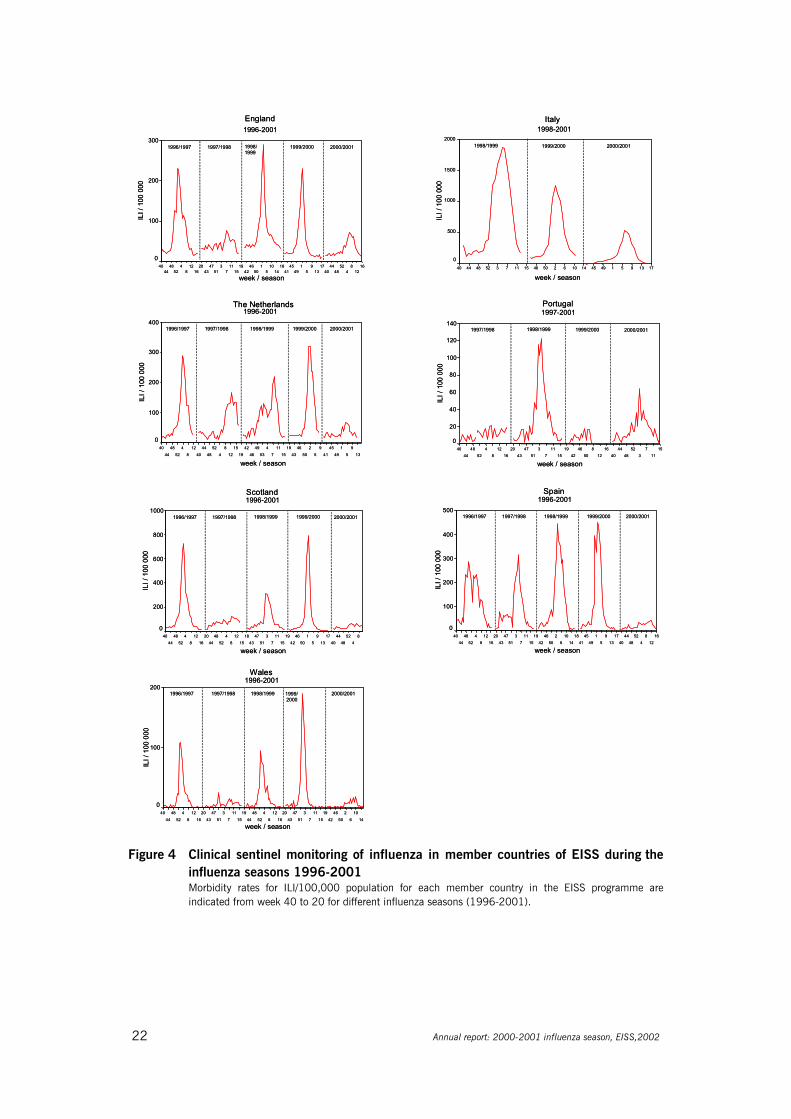
b) Influenza seasons 1996-2001: clinical data onlyFigures 4 and 5 (see page 22 and 23) display levels of influenza activity during the influenzaseasons between 1996 and 2001, as recorded in the EISS database. Networks that have beena member of EISS since 1996 have data for five seasons and the other networks have datasince joining the surveillance scheme. There are no figures for Ireland, Slovenia and Sweden asthey joined EISS in 2000.
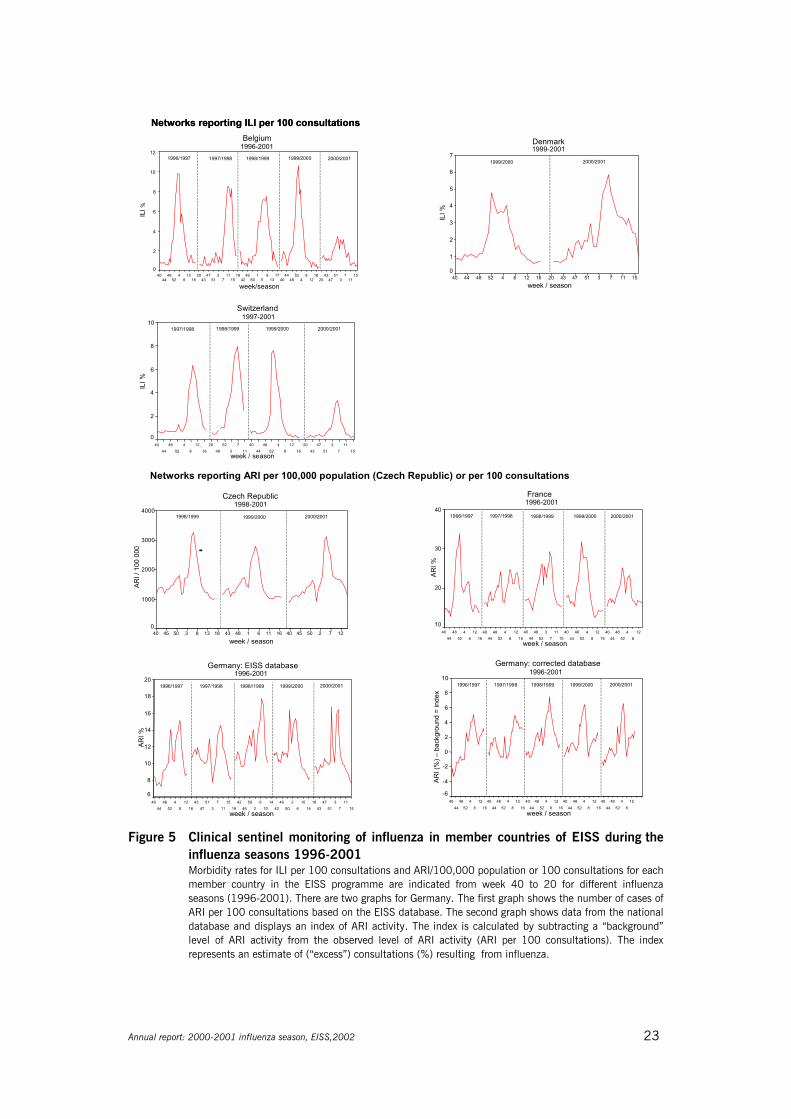
The figures highlight the different numerators (ILI or ARI) and denominators (per 100,000population or per 100 consultations) collected across Europe. Efforts to harmonize the EISSdenominators are underway and it is planned that all networks will present rates per 100,000population during the 2001-2002 influenza season (see the Denominator Project, page 16).
Figure 5 displays two graphs for Germany. The first graph shows the number of cases of ARIper 100 consultations based on data recorded in the EISS database. The second graph showsdata from the national database and displays an index of ARI activity. The index is calculatedby subtracting a “background” level of ARI activity from the observed level of ARI activity (ARIper 100 consultations). The result is an estimate of (“excess”) consultations (%) resulting fromacute respiratory infections.
The EISS networks generally experienced a mild to moderate 2000-2001 influenza season.Influenza activity was particularly low compared to previous seasons in the United Kingdom,the Netherlands, Spain and Switzerland. In the Czech Republic, France and Germany themorbidity rates were similar to previous seasons. Denmark and Portugal recorded morbidityrates that were a little higher than those observed during the 1999-2000 season (Manuguerraand Mosnier, 2000; Manuguerra et al., 2001).
22 Annual report: 2000-2001 influenza season, EISS,2002
England1996-2001
week / season
1612
84
5248
4440
1713
95
149
4541
1814
105
150
4642
1915
117
351
4743
2016
128
452
4844
40
ILI /
100
000
300
200
100
0
1996/1997 1997/1998 1998/ 1999/2000 2000/20011999
Portugal1997-2001
week / season
1511
73
5248
4440
1612
850
4642
1915
117
351
4743
2016
128
452
4844
40
ILI /
100
000
140
120
100
80
60
40
20
0
1997/1998 1998/1999 1999/2000 2000/2001
Italy1998-2001
week / season17139514945141062504615117352484440
ILI /
100
000
2000
1500
1000
500
0
1998/1999 1999/2000 2000/2001
Spain 1996-2001
week / season
1612
84
5248
4440
1713
95
149
4541
1814
106
250
4642
1915
117
351
4743
2016
128
452
4844
40
ILI /
100
000
500
400
300
200
100
0
1996/1997 1997/1998 1998/1999 1999/2000 2000/2001
Scotland 1996-2001
week / season
84
5248
4440
1713
95
150
4642
1915
117
351
4743
1815
128
452
4844
2016
128
452
4844
40
ILI /
100
000
1000
800
600
400
200
0
1996/1997 1997/1998 1998/1999 1999/2000 2000/2001
The Netherlands 1996-2001
week / season13
9
5
1
49
45
41
9
5
2
50
46
43
19
15
11
7
4
53
49
46
42
19
15
12
8
4
52
48
44
40
12
8
4
52
48
44
40
ILI /
100
000
400
300
200
100
0
1996/1997 1997/1998 1999/2000 2000/20011998/1999
Wales1996-2001
week / season14
10
6
2
50
46
42
19
15
11
7
3
51
47
43
20
16
12
8
4
52
48
44
19
15
11
7
3
51
47
43
20
16
12
8
4
52
48
44
40
ILI /
100
000
200
100
0
1996/1997 1997/199820001999/ 2000/20011998/1999
Figure 4 Clinical sentinel monitoring of influenza in member countries of EISS during theinfluenza seasons 1996-2001Morbidity rates for ILI/100,000 population for each member country in the EISS programme areindicated from week 40 to 20 for different influenza seasons (1996-2001).
Annual report: 2000-2001 influenza season, EISS,2002 23
Networks reporting ARI per 100,000 population (Czech Republic) or per 100 consultations
ARI %
France1996-2001
week / season
128
452
4844
4016
128
452
4844
4015
117
352
4844
4016
128
452
4844
4016
128
452
4844
40
40
30
20
10
1996/1997 1997/1998 1998/1999 1999/2000 2000/2001
2000/2001
Germany: corrected database1996-2001
week / season
128
452
4844
4016
128
452
4844
4016
128
452
4844
4016
128
452
4844
4016
128
452
4844
40
ARI (
%) –
back
grou
nd =
inde
x
10
8
6
4
2
0
-2
-4
-6
1997/1998 1998/1999 1999/20001996/19972000/2001
Germany: EISS database 1996-2001
week / season15
117
351
4743
1814
106
250
4642
1410
62
5046
4219
1511
73
5147
4316
128
452
4844
40
ARI %
20
18
16
14
12
10
8
6
1996/1997 1997/1998 1999/20001998//1999
Czech Republic1998-2001
week / season12725045401611614843181383504540
ARI /
100
000
4000
3000
2000
1000
0
1998/1999 1999/2000 2000/2001
77
8
Switzerland1997-2001
week / season15
11351
4743
2016
128
452
4844
40113
5248
2016
12452
4844
40
ILI %
10
8
6
4
2
0
1997/1998 1998/1999 1999/2000 2000/2001
Denmark1999-2001
week / season1511735147432016128452484440
ILI %
7
6
5
4
3
2
1
0
2000/20011999/2000
Networks reporting ILI per 100 consultationsNetworks reporting ILI per 100 consultations
week/season
1511
73
5147
4320
1612
84
5248
4440
1713
95
150
4642
1915
117
351
4743
2016
128
452
4844
40
ILI%
12
10
8
6
4
2
0
Belgium1996-2001
1996/1997 1997/1998 1998/1999 1999/2000 2000/2001
Figure 5 Clinical sentinel monitoring of influenza in member countries of EISS during theinfluenza seasons 1996-2001 Morbidity rates for ILI per 100 consultations and ARI/100,000 population or 100 consultations for eachmember country in the EISS programme are indicated from week 40 to 20 for different influenzaseasons (1996-2001). There are two graphs for Germany. The first graph shows the number of cases ofARI per 100 consultations based on the EISS database. The second graph shows data from the nationaldatabase and displays an index of ARI activity. The index is calculated by subtracting a “background”level of ARI activity from the observed level of ARI activity (ARI per 100 consultations). The indexrepresents an estimate of (“excess”) consultations (%) resulting from influenza.
24 Annual report: 2000-2001 influenza season, EISS,2002
2.5 Conclusions
The EISS project reached most of the specific objectives it set itself for the 2000-2001influenza season. The project successfully integrated Ireland and Slovenia into EISS. It alsoinitiated a number of new projects: the European Influenza Diagnosis Quality ControlAssessment project, the Denominator Project, the EISS Weekly Electronic Bulletin and theClinical Reporting Quality Control project.
An automatic data transfer between the EISS database and the WHO FluNet databases wasnot achieved and the definition of the data-set to be transmitted is ongoing. EISS was also notsuccessful in launching the EuroGROG project during the 2000-2001 influenza season. Thesetwo projects will be implemented during the 2001-2002 season.
Differences in the scale of influenza morbidity were observed among countries using the sameactivity parameters (e.g. ILI per 100,000 population). These differences can be explained bythe use of different case definitions (e.g. different ILI), some networks also havingpaediatricians reporting influenza activity (e.g. Germany, Switzerland and France) and differingconsultation rates for influenza. Consultation rates for influenza are probably higher in Belgiumthan in the United Kingdom as a medical certificate is required in Belgium after one day ofabsence from work. In the United Kingdom, a medical certificate is only necessary forabsences of 5 days and more.
Influenza activity was predominantly due to the influenza A virus (H1N1), antigenically similarto the vaccine variant A/New Caledonia/20/99. The B influenza viruses were predominant incertain countries such as Ireland, Portugal and the United Kingdom. Influenza infections wereactive during the period of January and February/March 2001, with little time lag betweencountries.
At the beginning of the season, the influenza A/H1N1 virus circulated in the population. At theend of the season, influenza B became the dominant type. The 2000-2001 vaccine containedthe A/Moscow/10/99(H3N2), A/New Caledonia/20/99(H1N1) and B/Beijing/184/ 93-likeviruses. This vaccine provided good protection to the circulating viruses.
Annual report: 2000-2001 influenza season, EISS,2002 25
3 Output
3.1 EISS Weekly Electronic Bulletin
A total of 28 Weekly Electronic Bulletins were produced during the 2000-2001 influenzaseason, from week 41 in 2000 to week 16 in 2001. These can be viewed on the EISSwebsite.
Three of the bulletin texts (edited) appeared in Eurosurveillance Weekly, an internet-basedpublication specialised on communicable diseases in Europe:
Influenza activity in Europe remains limitedEurosurveillance Weekly, Issue 313 January 2001
Low levels of influenza activity continue in EuropeEurosurveillance Weekly, Issue 51 February 2001See: http://www.eurosurv.org/2001/pfp/010201_pfp.htm
Influenza activity back to pre-winter levels in most of EuropeEurosurveillance Weekly, Issue 1512 April 2001See: http://www.eurosurv.org/2001/pfp/010412_pfp.htm
3.2 Publications and conferences (2000-June 2001)
Publications- Manuguerra J-C, Mosnier A (on behalf of EISS). Surveillance of influenza in Europe from
October 1999 to February 2000. Eurosurveillance 2000; 5: 63-68.
Conferences- Manuguerra J-C, Mosnier A, van der Werf S, Cohen J-M (on behalf of EISS). Surveillance of
influenza in Europe from October 1999 to February 2000 by the European InfluenzaSurveillance Scheme (on behalf of EISS). Options for the control of influenza IV conference,Hersonissos, Crete, Greece, 23-28 September 2000; Abstract P1-33.
- Manuguerra J-C (on behalf of EuroGROG). Surveillance of influenza: a pan Europeanperspective. Options for the control of influenza IV conference, Hersonissos, Crete, Greece,23-28 September 2000; Abstract W11-3.
- Mosnier A (on behalf of EISS). Proposal for a standardised clinical influenza surveillance inEurope. Options for the control of influenza IV conference, Hersonissos, Crete, Greece, 23-28September 2000; Abstract P1-32.

26 Annual report: 2000-2001 influenza season, EISS,2002
- Uphoff H, Cohen J-M, Fleming D, Noone A. Reporting of influenza surveillance morbidity datafrom an international European surveillance scheme: a simple index. Options for the control ofinfluenza IV conference, Hersonissos, Crete, Greece, 23-28 September 2000; Abstract P1-24.
- Van der Velden K (on behalf of EISS). Five years European Influenza Surveillance Scheme: afollow-up. Options for the control of influenza IV conference, Hersonissos, Crete, Greece, 23-28 September 2000; Abstract W21-8.
Annual report: 2000-2001 influenza season, EISS,2002 27
4 References
Aymard M, Valette M, Lina B, Thouvenot D, the members of Groupe Régional d’Observation de la Grippe and EuropeanInfluenza Surveillance Scheme. Surveillance and impact of influenza in Europe. Vaccine 1999;17: S30-S41.
Flahault A, Dias-Ferrao V, Chaberty P. Esteves K, Valleron A-J, Lavanchy D. FluNet as a tool for global monitoring ofinfluenza on the web. JAMA 1998;280(15):1330-1332.
Fleming DM and Cohen J-M. Experience of European Collaboration in Influenza surveillance in the winter 1993-1994. J.Public Health Medicine 1996;18:133-142.
Fleming DM, Zambon M, Bartelds AIM, de Jong JC. The duration and magnitude of influenza epidemics: a study ofsurveillance data from sentinel general practices in England, Wales and the Netherlands. European Journal ofEpidemiology 1999;15:467-473.
Goddard NL, Joseph CA, Zambon M, Nunn M, Fleming D, Watson JM. Influenza surveillance in England and Wales:October 1999 to May 2000. Communicable Disease and Public Health 2000;3(4):261-266.
Manuguerra J-C, Mosnier A on behalf of EISS. Surveillance of influenza in Europe from October 1999 to February 2000.Eurosurveillance 2000; 5:63-68.
Manuguerra J-C, Mosnier A, Paget WJ on behalf of EISS. Monitoring of influenza in the EISS. European network membercountries from October 2000 to February 2001. Eurosurveillance 2001;6:127-135.
McKee M & Maclehose L. Enlarging the European Union: implications for communicable disease control? Eurohealth2000-2001;6(5):6-8.
Schlaud M, editor. Comparison and harmonisation of denominator data for primary care health care research incountries of the European Community: the European Denominator Project. Amsterdam, the Netherlands: IOS Press,1999.
Snacken R, Bensadon M, Strauss A. The CARE Telematics Network for the surveillance of influenza in Europe. Methodsof Information in Medicine 1995;34:518-522.
Snacken R, Manuguerra J-C, Taylor P. European Influenza Surveillance Scheme on the Internet. Methods of Informationin Medicine 1998;37:266-270.
WHO. Communicable diseases 2000. WHO/CDS 2000.1:36-37.
Zambon M on behalf of EISS. Sentinel surveillance of influenza in Europe, 1997/1998. Eurosurveillance 1998; 3(3):29-31.
28 Annual report: 2000-2001 influenza season, EISS,2002
5 Appendices
5.1 Partners
European CommissionHealth & Consumer Protection Directorate-GeneralLuxembourg
IndustryGlaxoSmithKline Roche PharmaUnited Kingdom Switzerland
The EISS project would also like to thank Chiron Vaccines for hosting, in collaboration with theItalian influenza surveillance network, our EISS meeting in May 2001 in Siena, Italy.
Web ServiceQuad LogicFrance
5.2 Indicators of influenza activity (2000-2001 influenza season)
The levels of influenza activity are defined as follows:
ILI: influenza-like illnessARI: acute respiratory infectionRegion: the population under surveillance in a defined geographical area.
Countries may be made up of one or more regions for these purposes
No report: no report received.
No activity: reports indicate no evidence of influenza virus activity. Cases ofILI/ARI may be reported in the region but the overall level of clinicalactivity remains at baseline levels and influenza virus infections arenot being confirmed. Cases occurring in people recently returned fromother countries are excluded.
Sporadic: isolated cases of laboratory confirmed influenza infection in a region,or an outbreak in a single institution (such as a school, nursing homeor other institutional setting), with clinical activity remaining atbaseline levels. Cases occurring in people recently returned from othercountries are excluded.
Annual report: 2000-2001 influenza season, EISS,2002 29
Local outbreak: increased ILI/ARI activity in local areas (such as a city, county ordistrict) within a region, or outbreaks in two or more institutionswithin a region, with laboratory confirmed cases of influenza infection.Levels of activity in remainder of region, and other regions of thecountry, remain below baseline levels.
Regional activity: ILI/ARI activity above baseline levels in one or more regions with apopulation comprising less than 50% of the country's total population,with laboratory confirmed influenza infections in the affectedregion(s). Levels of activity in other regions of the country, remainbelow baseline levels.
Widespread activity: ILI/ARI activity above baseline levels in one or more regions with apopulation comprising 50% or more of the country's population, withlaboratory confirmed influenza infections.
5.3 Members
EISS co-ordination centre
Institution:Netherlands Institute for Health ServicesResearch (Nivel)PO Box 15683500 BN UtrechtThe NetherlandsTel.: +31 30 2729 700Fax: +31 30 2729 729
Individuals:John PagetKoos van der VeldenJouke van der Zee
Belgium
Institution:Scientific Institute of Public Health14, rue Juliette WytsmanB-1050 Brussels
Individuals:Fernande Yane
Czech Republic
Institution:National Institute of Public HealthNational Influenza CentreŠrobárova 48100 42 Prague 10
Tel.: +42 2 6708 2402Fax. +42 2 7173 0695
Individuals:Martina HavlickovaBela Tumova
Denmark
Institution:Statens Serum InstitutDepartment of EpidemiologyArtillerivej 5DK 2300 CopenhagenTel.: +45 32 68 3268Fax: +45 32 68 3874
Individuals:Per Grauballe
30 Annual report: 2000-2001 influenza season, EISS,2002
Susanne Samuelsson
France
Institution:OPEN ROME - Groupes Régioneaxd’Observation de la Grippe (GROG)39, rue St Antoine75004 ParisTel. +33 1 42 71 49 50Fax. +33 1 42 71 77 15
Centre National de Référence de la Grippe(France Nord)25, rue du Docteur Roux75724 Paris Cedex 15Tel.: +33 1 4568 8722 / 25Fax: +33 1 4061 3241
Centre Hospitalo-Universitaire de LyonCentre National de Référence de la Grippe(France Sud)8 Avenue Rockefeller69373 Lyon Cedex 08Tel.: +33 4 7877 7029Fax: +33 4 7801 4887
Individuals: Michèle AymardJean-Marie CohenBruno LinaJean-Claude ManuguerraAnne MosnierMartine ValetteSylvie van der Werf
Germany
Institution:ArbeitsGemeinschaft Influenza (AGI)Schuhmarkt 435037 MarburgTel.: +49 6421 29320Fax.: +49 6421 25730
National Reference Centre for InfluenzaNiedersächsisches LandesgesundheitsamtRoesebeckstraße 430449 HannoverTel.: +49 511 4505 201Fax: +49 511 4505-140
Individuals:Rolf HecklerBrunhilde SchweigerHelmut Uphoff
Ireland
Institution:Irish College of General Practitioners4-5 Lincoln PlaceDublin 2Tel.: +353 1 676 3705Fax: +353 1 676 5850
National Disease SurveillanceSir Patrick Dun's HospitalLower Grand Canal StreetDublin 2Tel.: +353 1 661 7346Fax: +353 1 661 7347
Individuals:Dermot NolanDarina O'Flanagan
Italy
Institution:Istituto de Virologia – Università degli Studidi MilanoVia Pascal 3820133 Milano
Annual report: 2000-2001 influenza season, EISS,2002 31
Tel.: +39 0223 67494Fax: +39 0226 680713
Dipartimento di Scienze della SaluteUniversità de GenovaVia Pastore 216132 GenovaTel.: +39 01035 38571Fax: +39 01035 38572
Istituto Superiore de Sanità (ISS)Viale Regina Margherita00161 RomaTel.: +39 06 4990 1Fax: +39 06 4938 7118
Laboratorio virus respiratori (ISS)Tel.: +39 0649 903243Fax: +39 0649 902082
Laboratorio Epidemiologie (ISS)Tel.: +39 0649 902273
Individuals:Fabrizio Pregliasco
The Netherlands
Institution:Erasmus University RotterdamFaculty of MedicineDepartment of VirologyPO Box 17383000 DR RotterdamTel.: +31 10 408 8067Fax: +31 10 408 9485
National Institute of Public Health and theEnvironment (RIVM)PO Box 13720 BA BilthovenTel.: +31 30 274 2115Fax: +31 30 274 4409
Netherlands Institute for Health ServicesResearch
PO Box 15683500 BN UtrechtTel.: +31 30 2729 700Fax: +31 30 2729 729
Individuals:JC de JongMarie-Louise HeijnenAad Bartelds
Portugal
Institution:Instiuto Nacional de SaudeAv Padre Cruz1699 Lisboa CodexTel.: +351 21 751 9200Fax: +351 21 759 0441
Individuals:Isabel Marinho FalcãoHelena Rebelo de Andrade
Slovenia
Institution:Institute of Public Health (IPH)Trubarjeva 201 LjubljanaTel.: +386 1 4323245Fax: +386 1 2323940Laboratory for Virology (IPH)Bohori eva 1501 Ljubljana
Individuals:Katarina ProsencMaja Socan
Spain
Institution:Instituto de Salud Carlos III
32 Annual report: 2000-2001 influenza season, EISS,2002
Centro Nacional de Epidemiología Servicio de Vigilancia EpidemiológicaC/Sinesio Delgado, 6 28029 MADRID Tel: +34 91 3877802 Fax: +34 91 3877816
Individuals:Salvador de MateoPilar Perez-BrenaTomás Vega Alonso
Sweden
Institution:Swedish Institute for Infectious DiseaseControlSE-171 82 SolnaTel.: +46 8 457 23 00Fax: +46 8 32 83 30
Individuals:Annika Linde
Switzerland
Institution:Swiss Federal Office of Public HealthDivision of Epidemiology and Infectious Diseases3003 BernTel. +41 31 323 87 06Fax +41 31 323 87 95
National Influenza CentreLaboratoire Central de VirologieDivision des Maladies InfectieusesHôpital Cantonal Universitaire de Genèverue Micheli du Crest, 24CH-1211 Geneva 14Tel. +41 22 372 40 81Fax +41 22 372 40 88
Individuals:Daniela MüllerYves Thomas
United Kingdom
Institution:EnglandPublic Health Laboratory ServiceCentral Public Health LaboratoryCommunicable Disease Surveillance Centre61 Colindale AvenueLondon NW9 5EQTel.: +44 20 8200 6868Fax: +44 20 8200 7868
Royal College of General Practitioners(RCGP)Research Unit54 Lordswood RoadBirmingham B17 9DBTel.: +44 121 426 1125Fax: +44 121 428 2084
ScotlandScottish Centre for Infection andEnvironmental HealthClifton House, Clifton PlaceGlasgow G3 7LNTel.: +44 141 300 1151Fax: +44 141 300 1170
WalesPHLS Communicable Disease SurveillanceCentreAbton HouseCardiff CF4 3QXTel.: +44 2920 521997Fax: +44 2920 521987
Individuals:EnglandDouglas FlemingJohn WatsonMaria Zambon
ScotlandPeter Christie
WalesDaniel Thomas

Annual report: 2000-2001 influenza season, EISS,2002 33

This report was produced by a contractor for Health & Consumer Protection Directorate General and represents the views of thecontractor or author. These views have not been adopted or in any way approved by the Commission and do not necessarilyrepresent the view of the Commission or the Directorate General for Health and Consumer Protection. The EuropeanCommission does not guarantee the accuracy of the data included in this study, nor does it accept responsibility for any use madethereof.