european investment bank carbon footprint report … · european investment bank . carbon footprint...
TRANSCRIPT

European Investment Bank
Carbon Footprint Report 2012
GHG emissions resulting from EIB internal operations
January to December 2012
This report has been prepared by Carbon Trust Advisory Services Ltd for the European
Investment Bank using data provided by the EIB for 2012 and reports published by the EIB for 2007 to 2011.
Report dated: 1st March 2013

CONTENTS
1 EXECUTIVE SUMMARY ............................................................................ 3 2 INTRODUCTION .................................................................................... 4 3 ORGANISATIONAL AND OPERATIONAL BOUNDARY ....................................... 5
3.1 Organisational boundary ......................................................................... 5 3.2 Operational boundary ............................................................................. 5 3.3 Reporting period covered ........................................................................ 6
4 METHODOLOGY .................................................................................... 8 4.1 Emission sources and activity data ........................................................... 8 4.2 Emission factors ................................................................................... 10 4.3 Emissions inventory calculation .............................................................. 11
5 CARBON FOOTPRINT ........................................................................... 12 5.1 Total emissions..................................................................................... 12 5.2 Stationary emissions analysis ................................................................. 15 5.3 Mobility emissions analysis..................................................................... 16 5.4 Paper consumption ............................................................................... 17 5.5 Waste ................................................................................................. 17
6 DATA ASSESSMENT AND METHODOLOGY CHANGES ..................................... 19 6.1 Data quality and completeness ............................................................... 19 6.2 Proposed future changes to methodology ................................................. 20 6.3 Company owned vehicles ....................................................................... 21
7 ENVIRONMENTAL INDICATORS 2012 ..................................................... 22 7.1 Emissions by Scope ............................................................................... 22 7.2 Emissions by type ................................................................................. 23 7.3 Other indicators .................................................................................... 23
8 ANNEX – GRI INDICATORS .................................................................... 24
FIGURES Figure 1: Boundary Diagram ....................................................................................... 7 Figure 2: 2007-2012 total emissions against targets ..................................................... 12 Figure 3: 2007-2012 scope 1, 2 and 3 emissions breakdown ......................................... 13 Figure 4: Emissions by source .................................................................................... 14 Figure 5: Mobility emissions ....................................................................................... 17 Figure 6: Waste emissions by type ............................................................................. 18
TABLES Table 1: Activity data ................................................................................................. 9 Table 2: Emission factors .......................................................................................... 10 Table 3: Stationary emissions and activity data ............................................................ 15 Table 4: Mobility emissions and activity data ............................................................... 16 Table 5: Waste emissions and activity data .................................................................. 17 Table 6: Data quality and completeness assessment ..................................................... 19 Table 8: Owned vehicles ............................................................................................ 21 Table 9: Waste categories ......................................................................................... 25

Page 3 of 25
1 EXECUTIVE SUMMARY
The EIB first calculated the carbon footprint of its head office operations in 2007 and
set a target to reduce relative emissions by 20%. This includes emissions from energy use in the buildings (natural gas for heating and power generation, and purchased electricity and steam for power), from mobility activities (owned vehicles,
business travel and employee commuting), from waste disposal and from the production of paper used in the offices. However, purchased electricity is covered by
green guarantees of origin so is treated as zero carbon on a net basis.
In 2012, the EIB’s total carbon footprint was 16,441 tCO2e, a decrease of 16% from 2011 and a decrease of 8% compared to 2007. The relative carbon footprint was 7.5 tCO2e per employee, a decrease of 17% compared to 2011 and a decrease of 37%
compared to 2007. This reflects a 46% increase in staff numbers since 2007. As such, the EIB has achieved the 20% target set in 2007 and should look to set a new
target. The most significant source of emissions (94% of total net emissions) relates to
mobility activities. Air travel represents the biggest share of this (56% of total net emissions). There are measures that can be taken to reduce these emissions, such as
the use of technologies such as tele- and video-conferencing, although it is a core part of EIB’s business activity and emissions will therefore remain significant. Commuting represents 38% of total net emissions although the methodology used to calculate
this needs to be improved to ensure that any improvement measures introduced can be properly monitored.
Page 4 of 25
2 INTRODUCTION
The European Investment Bank (EIB) was established in 1958 under the Treaty of
Rome. It is the European Union’s financing institution, with a remit to contribute towards the integration, balanced development and economic and social cohesion of the Member States. It raises funds on the capital markets to finance projects that
meet EU objectives: regional development, trans-European networks of transport, telecommunications and energy, research, development and innovation,
environmental improvement and protection, health and education. Outside of the European Union, the EIB implements the financial components of agreements
concluded under the European development aid and cooperation policies. The European Investment Fund (EIF) is a European Union agency, majority-owned by
the EIB, whose remit is to provide finance through private banks and funds to small and medium-sized enterprises. The EIF is included within the boundary of the EIB’s
carbon footprint and references to the EIB’s emissions in this report include the EIF. The EIB first calculated its carbon footprint in 2007 and adopted a 20% relative
reduction target from this baseline to 2020. This was consistent with the European Commission target for 2020 of a 20% reduction in EU greenhouse gas emissions from
1990 levels (with an 8% reduction to be achieved between 2008 and 2012 as agreed under the Kyoto Agreement). For Luxembourg, the National Emissions Reduction target was set at 28% by 2012 based on its relative wealth at the time.
The EIB’s commitment to measure and manage its footprint is consistent with its
environmental and social policies, principles and standards for the projects it finances. Understanding its carbon footprint also allows it to identify and implement measures to reduce emissions and to track performance against its target. Measures taken in
previous years include expansion into a BREEAM ‘excellent’ building and investment in the energy efficiency of existing buildings, in addition to some activities to reduce
travel related emissions. This report presents the analysis of EIB’s 2012 carbon footprint based on the GHG
Protocol Corporate Standard and the Global Reporting Initiative principles and indicators.
Page 5 of 25
3 ORGANISATIONAL AND OPERATIONAL BOUNDARY
3.1 Organisational boundary
The organisational boundary defines the businesses and operations that constitute the company for the purpose of accounting and reporting greenhouse gas emissions. Companies can choose to report either the emissions from operations over which it
has financial or operational control (the control approach) or from operations according to its share of equity in the operation (the equity share approach).
The EIB’s carbon footprint uses the operational control approach. As such, it includes
the EIB and EIF head office operations in Luxemburg (Kirchberg and Hamm). Smaller regional offices are not included at present due to difficulties obtaining consistent data, but we will examine how to address this in the future. These regional offices will
not represent a material share of the total footprint.
3.2 Operational boundary
Defining the operational boundary involves identifying emissions associated with its operations, categorising them as direct and indirect emissions, and choosing the scope
of accounting and reporting for indirect emissions.
The following definitions are used:
Direct GHG emissions
Scope 1: emissions from sources that are owned or controlled by the reporting entity (i.e. any owned or controlled activities that release emissions straight
into the atmosphere).
Indirect GHG emissions
Indirect emissions occur as a consequence of the reporting entity’s activities but at sources that are owned or controlled by another entity (and are therefore their
scope 1 emissions). These are classified as: Scope 2: Indirect GHG emissions from the consumption of purchased
electricity, heat, steam or cooling.
Scope 3: Indirect GHG emissions from other activities. A detailed Standard exists that sets out the rules for 15 categories of scope 3 emissions as
indicated in Figure 11
1 The Corporate Value Chain (Scope 3) Accounting & Reporting Standard, available: http://www.ghgprotocol.org/standards/product-and-supply-chain-standard

Page 6 of 25
The operational boundary for EIB’s carbon footprint report includes the following:
Scope 1: Natural gas combusted in boilers to heat EIB buildings and used in
the co-generation plant to generate heat and power, and transport fuel used to run vehicles owned by the EIB. There are no relevant fugitive emissions because air conditioning systems use ammonia.
Scope 2: Purchased grid electricity (from green tariffs) and steam used for
power in the properties (lighting, air conditioning, small power, elevators etc).
Scope 3: Transport fuel and power used by air and rail transport operators for
EIB business travel, by the outsourced mini-bus service that operates between the Luxembourg sites and by employee-owned vehicles for commuting to and
from work; emissions from waste management operations due to incineration or recycling of waste generated by the EIB; and, emissions generated in the production of office paper purchased by the EIB.
Figure 1 illustrates the organisational and operational boundary.
3.3 Reporting period covered
The reporting period covers 1 January 2012 to 31 December 2012.

Page 7 of 25
Figure 1: Boundary Diagram
Page 8 of 25
4 METHODOLOGY
Carbon footprint analysis for previous years has used the Bilan Carbone methodology,
taking an extract to report in accordance with the GHG Protocol. In November 2012, we conducted a methodology review, comparing Bilan Carbone, the GHG Protocol, ISO14064 and the Carbon Trust Standard. We presented a report to the EIB
comparing the different methodologies in terms of both technical accounting methodology and in terms of usage. To assess current best practice usage, we
analysed submissions to the Carbon Disclosure Project (CDP) in 2011 and found that 56% of companies reported using the GHG Protocol with others reporting against
various national schemes, such as the UK’s DEFRA Guidance or the US EPA Climate Leaders program, or independent standards such as ISO 14064. Bilan Carbone is not mentioned although may be grouped under the category ‘other’, which makes up 23%
of responses.
The GHG Protocol is recognized as the most widely used international accounting tool for government and business leaders to understand, quantify, and manage greenhouse gas emissions. It is an international standard used by a diverse range of
organisations, including many in the banking sector (155 reported into CDP in 2011), and it is widely accepted as best practice. Bilan Carbone is being developed to be
more consistent with the GHG Protocol. ISO14064 and the Carbon Trust Standard are recognised standards providing prescriptive guidance that can be used to gain external verification. However, it was more important to retain flexibility to ensure
that the methodology was fit for purpose, could evolve over time and minimised unnecessary burden on resources.
It was therefore agreed to directly align with the GHG Protocol2.
To calculate the GHG emissions inventory, we identified all relevant GHG emissions sources and collected activity data from the EIB then, using emission factors,
calculated emissions from each source. This was aggregated to corporate level for EIB’s total carbon footprint.
The following sections set out the details of the process followed.
4.1 Emission sources and activity data
Activity data is a quantitative measure of activity that results in GHG emissions. Table 1 shows the activity data provided by the EIB. It is mainly primary data e.g. the
amount of gas used for heating or the distance travelled by air, with the exception of commuting data that is based on the average number of vehicles and average
distance travelled. The activity data, with the addition of water consumed, is also used as environmental impact indicators as per the Global Reporting Initiative (GRI).
2 http://www.ghgprotocol.org/standards/corporate-standard

Page 9 of 25
Table 1: Activity data
Notes to Table 1:
1 The co-generation plant generates electricity that is sold to the grid. The EIB profits
directly from the sale of this electricity therefore the emissions associated with its generation (from the combustion of natural gas) are accounted for under scope 1. 2 The EIB began to purchase electricity originating 100% from renewable sources (hydropower, wind power and biomass) in 2007 and is the proprietor of the related
green guarantees of origin. As such, whilst emissions at a grid average factor are accounted for under scope 2, there are no net emissions associated with purchased electricity.
3 Primary data on distances travelled or fuel consumed for commuting is not currently
available. The EIB therefore counts the average number of available parking spaces on a monthly basis, deducted from the total number of available spaces, to arrive at an assumed number of cars per day. This is then multiplied by an average distance
travelled of 35 km, based on a survey conducted by the European Commission of its employees in Luxemburg. This figure is supported by 3rd party research3.
3 A. Aguilera (1999) ‘Growth in commuting distances in polycentric metropolitan areas: the
case of Paris’, 45th Congress of the European Regional Science Association. Available:
http://www-sre.wu-wien.ac.at/ersa/ersaconfs/ersa05/papers/255.pdf
Emission
scope
Emission source Units Resolution
Scope 1
Natural Gas for heating kWh By site, by month
Natural gas for co-generation1 kWh By site, by month
Owned vehicles km By vehicle
Scope 2 Purchased electricity2 kWh By site, by month
Purchased steam kWh By site, by month
Scope 3
Business travel – Air Passenger km By journey (inc. class
and distance)
Business travel – Rail Passenger km By journey (inc. class
and distance)
Outsourced minibus km Single figure
Employee commuting Parking spaces 3 Average count by month
Waste kg By type and treatment,
by site, by month
Paper consumption Tonnes By site
Page 10 of 25
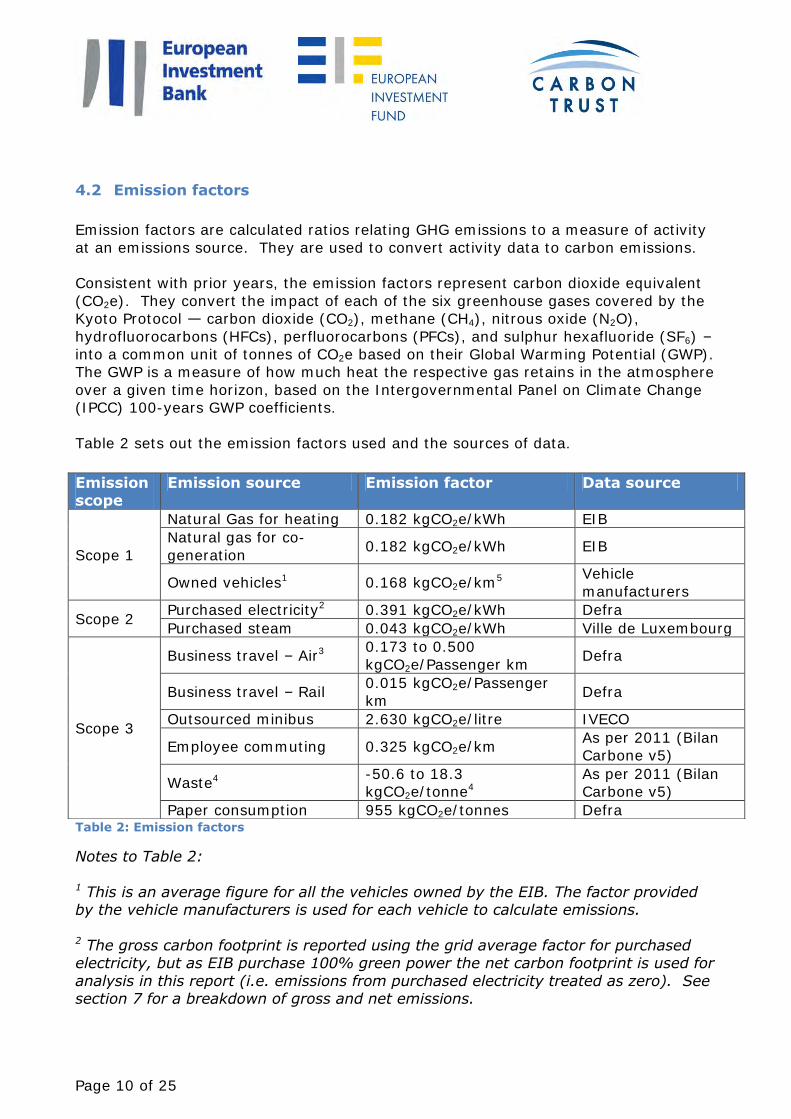
4.2 Emission factors
Emission factors are calculated ratios relating GHG emissions to a measure of activity
at an emissions source. They are used to convert activity data to carbon emissions. Consistent with prior years, the emission factors represent carbon dioxide equivalent
(CO2e). They convert the impact of each of the six greenhouse gases covered by the Kyoto Protocol — carbon dioxide (CO2), methane (CH4), nitrous oxide (N2O),
hydrofluorocarbons (HFCs), perfluorocarbons (PFCs), and sulphur hexafluoride (SF6) – into a common unit of tonnes of CO2e based on their Global Warming Potential (GWP). The GWP is a measure of how much heat the respective gas retains in the atmosphere
over a given time horizon, based on the Intergovernmental Panel on Climate Change (IPCC) 100-years GWP coefficients.
Table 2 sets out the emission factors used and the sources of data.
Table 2: Emission factors
Notes to Table 2:
1 This is an average figure for all the vehicles owned by the EIB. The factor provided by the vehicle manufacturers is used for each vehicle to calculate emissions.
2 The gross carbon footprint is reported using the grid average factor for purchased electricity, but as EIB purchase 100% green power the net carbon footprint is used for
analysis in this report (i.e. emissions from purchased electricity treated as zero). See section 7 for a breakdown of gross and net emissions.
Emission scope
Emission source Emission factor Data source
Scope 1
Natural Gas for heating 0.182 kgCO2e/kWh EIB
Natural gas for co-
generation 0.182 kgCO2e/kWh EIB
Owned vehicles1 0.168 kgCO2e/km5 Vehicle
manufacturers
Scope 2 Purchased electricity2 0.391 kgCO2e/kWh Defra
Purchased steam 0.043 kgCO2e/kWh Ville de Luxembourg
Scope 3
Business travel – Air3 0.173 to 0.500
kgCO2e/Passenger km Defra
Business travel – Rail 0.015 kgCO2e/Passenger
km Defra
Outsourced minibus 2.630 kgCO2e/litre IVECO
Employee commuting 0.325 kgCO2e/km As per 2011 (Bilan Carbone v5)
Waste4 -50.6 to 18.3 kgCO2e/tonne4
As per 2011 (Bilan Carbone v5)
Paper consumption 955 kgCO2e/tonnes Defra
Page 11 of 25
3 The emission factor for air travel includes a Radiative Forcing factor that accounts for
impacts other than CO2 emissions (including water vapour, contrails, NOx etc) that magnify the warming effect in the upper atmosphere. There is uncertainty about the
appropriate factor to use. The IPCC estimated 2-4 in 1999, with current best scientific evidence suggesting a factor of 1.94. Application of this multiplier is optional under the Greenhouse Gas Protocol. A factor of 2 has been used to be consistent with
previous years (as per Bilan Carbone).
The range of factors represents the different impact of distance (i.e. short-haul and long-haul) and travel class (i.e. economy and business class). 4 The range of factors represents the different impact of waste type and treatment type (i.e. recycling or incineration).
4.3 Emissions inventory calculation
An inventory of GHG emissions by source was calculated by applying the emission
factors to relevant activity data and aggregating the results to calculate EIB’s absolute carbon footprint. A relative footprint was also calculated using employee numbers in
Full Time Equivalent (FTE).
4 http://elib.dlr.de/19906/1/s13.pdf

Page 12 of 25
5 CARBON FOOTPRINT
5.1 Total emissions
The EIB’s total carbon footprint in 2012 was 16,441 tCO2e, a decrease of 16% compared to 2011 and a decrease of 8% compared to the 2007 baseline year.
The relative carbon footprint in 2012 was 7.5 tCO2e per employee, a decrease of 17% compared to 2011 and a decrease of 37% compared to the 2007 baseline year. The
additional reduction in relative emissions over absolute emission reductions reflects a 46% increase in staff numbers since 2007.
The EIB’s relative emission reduction target of 20% was achieved by 2009, and reductions have been maintained in subsequent years, as shown in Figure 2 below.
Figure 2: 2007-2012 total emissions against targets
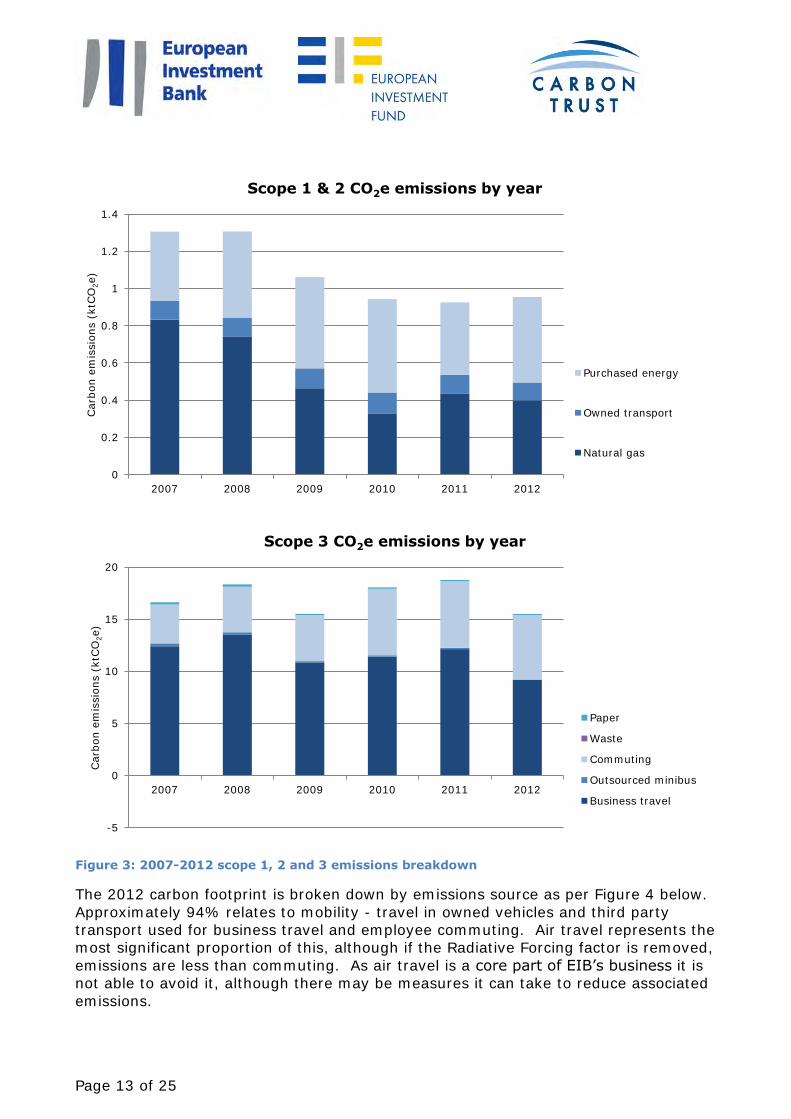
Figure 3 shows absolute emissions broken down by source for 2007 to 2012.
tCO2e/employee (actual), 7.52
tCO2e/employee (target), 11.03
0
2
4
6
8
10
12
0
5
10
15
20
25
2007 2008 2009 2010 2011 2012
Carb
on e
mis
sio
ns p
er
em
plo
yee (
tCO
2e/F
TE)
Absolu
te c
arb
on e
mis
sio
ns (
ktC
O2e)
Absolute and relative CO2e emissions by year
Scope 3
Scope 2
Scope 1
tCO2e/employee(actual)
tCO2e/employee(target)
Page 13 of 25
Figure 3: 2007-2012 scope 1, 2 and 3 emissions breakdown
The 2012 carbon footprint is broken down by emissions source as per Figure 4 below.
Approximately 94% relates to mobility - travel in owned vehicles and third party transport used for business travel and employee commuting. Air travel represents the most significant proportion of this, although if the Radiative Forcing factor is removed,
emissions are less than commuting. As air travel is a core part of EIB’s business it is not able to avoid it, although there may be measures it can take to reduce associated
emissions.
0
0.2
0.4
0.6
0.8
1
1.2
1.4
2007 2008 2009 2010 2011 2012
Carb
on e
mis
sio
ns (
ktC
O2e)
Scope 1 & 2 CO2e emissions by year
Purchased energy
Owned transport
Natural gas
-5
0
5
10
15
20
2007 2008 2009 2010 2011 2012
Carb
on e
mis
sio
ns (
ktC
O2e)
Scope 3 CO2e emissions by year
Paper
Waste
Commuting
Outsourced minibus
Business travel

Page 14 of 25
Figure 4: Emissions by source
Natural gas
(boilers) 147 15%
Natural gas
(co-generation) 252 27%
Owned vehicles
96 10%
Purchased
steam 459 48%
2012 CO2e emissions by source - Scope 1 & 2
Business travel
- air 9,151 59%
Business travel
- rail 17 0%
Outsourced
minibus 52 0%
Commuting
6,190 40%
Waste
-6 0%
Paper
consumption 83 1%
2012 CO2e emissions by source - scope 3

Page 15 of 25
5.2 Stationary emissions analysis
Stationary energy emissions were 858tCO2e (0.4tCO2e per employee) in 2012, representing 5% of total net emissions. This is 4% higher than 2011 (823tCO2e), and
29% lower than 2007 (1,206tCO2e).
Stationary emissions relate to the combustion of fuels in stationary equipment owned or controlled by the EIB for heating and power (scope 1), and from purchased heat and power (scope 2).
The activity data provided by the EIB and resulting emissions are shown in Table 3.
Site Emission
source
Activity data tCO2e Variance
to 2011
Variance
to 2007
Hamm Boiler 808,041 kWh Gas 147 -51% -43%
Hamm Co-generation 1,385,930 kWh Gas
252 +92% -34%
West Kirchberg
Steam heating 7,330,300 kWh Purchased Steam
315 +22% +30%
East Kirchberg
Steam heating 3,340,178 kWh Purchased Steam
144 +8% n/a
Table 3: Stationary emissions and activity data

Page 16 of 25
5.3 Mobility emissions analysis
Mobility emissions were 15,506tCO2e in 2012, representing 94% of total net emissions. This is 17% lower than 2011 (18,744tCO2e), and 6% lower than 2007
(16,526tCO2e).
Mobility emissions relate to the combustion of fuels in the vehicles owned or controlled by the EIB (scope 1) or third party transport for employee business travel and commuting to and from work (scope 3).
The activity data provided by the EIB and resulting emissions are shown in Table 4
Emission source Activity data tCO2e Variance
to 2011
Variance
to 2007
Owned vehicles (scope 1) 569,077 km 96 -7% -4%
Outsourced minibus 115,196 km / 19,687 litres
52 -63% -81%
Business travel – air (short haul, economy class)
7,652,955 km 1,506 -25% for total
flights
-26% for total
flights Business travel – air (short haul, business/1st class)
9,759,910 km 2,882
Business travel – air (long haul, economy class)
308,951 km 53
Business travel – air (long haul, business/1st class class)
9,411,701 km 4,709
Business travel – train 1,121,696 km 17 -58% -30%
Commuting1 1,489 parked
vehicles per day / 19,021,443 km
6,190 -3% +65%
Total transport emissions 15,506 -17% -6% Table 4: Mobility emissions and activity data
Notes to Table 4: 1 The increase in commuting emissions compared to 2007 reflects the increase in staff
numbers travelling to work and the increase in available parking spaces at the new East Kirchberg building that are now included in the calculation methodology
(previously, staff may have parked elsewhere but the methodology does not account for this).
Page 17 of 25
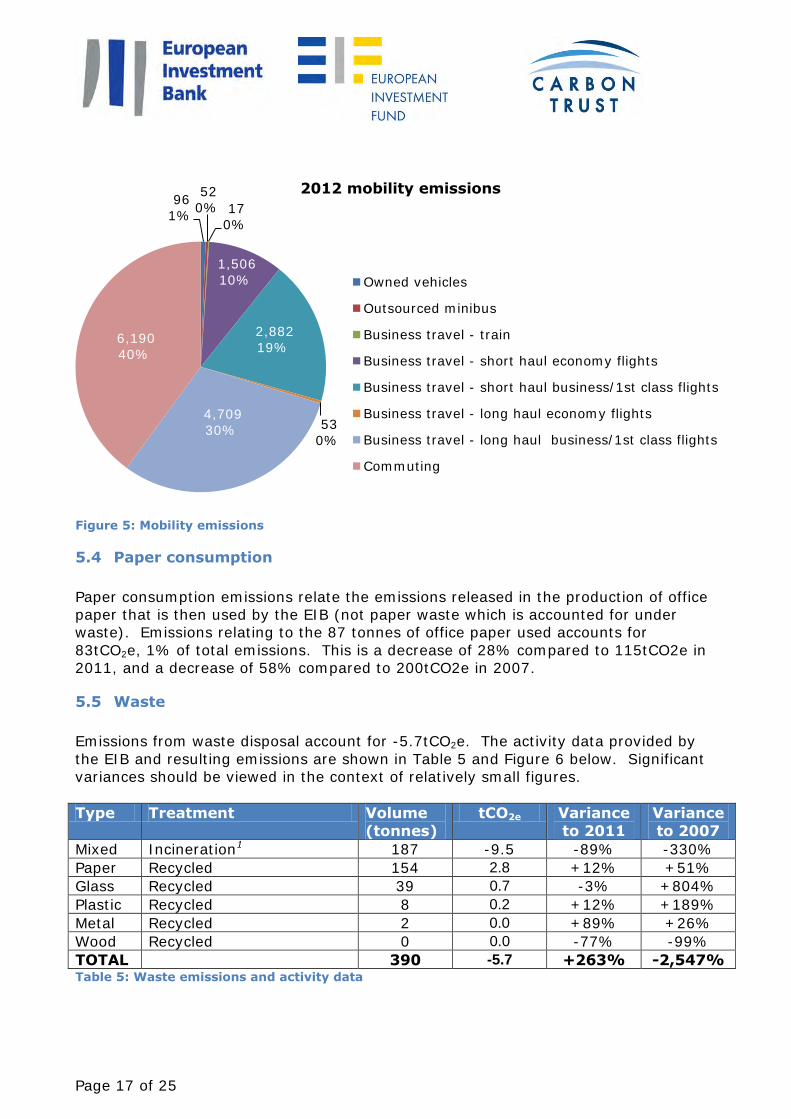
Figure 5: Mobility emissions
5.4 Paper consumption
Paper consumption emissions relate the emissions released in the production of office paper that is then used by the EIB (not paper waste which is accounted for under waste). Emissions relating to the 87 tonnes of office paper used accounts for
83tCO2e, 1% of total emissions. This is a decrease of 28% compared to 115tCO2e in 2011, and a decrease of 58% compared to 200tCO2e in 2007.
5.5 Waste
Emissions from waste disposal account for -5.7tCO2e. The activity data provided by
the EIB and resulting emissions are shown in Table 5 and Figure 6 below. Significant variances should be viewed in the context of relatively small figures.
Type Treatment Volume
(tonnes)
tCO2e Variance
to 2011
Variance
to 2007
Mixed Incineration1 187 -9.5 -89% -330%
Paper Recycled 154 2.8 +12% +51%
Glass Recycled 39 0.7 -3% +804%
Plastic Recycled 8 0.2 +12% +189%
Metal Recycled 2 0.0 +89% +26%
Wood Recycled 0 0.0 -77% -99%
TOTAL 390 -5.7 +263% -2,547% Table 5: Waste emissions and activity data
96
1%
52
0% 17
0%
1,506
10%
2,882
19%
53
0%
4,709
30%
6,190
40%
2012 mobility emissions
Owned vehicles
Outsourced minibus
Business travel - train
Business travel - short haul economy flights
Business travel - short haul business/1st class flights
Business travel - long haul economy flights
Business travel - long haul business/1st class flights
Commuting
Page 18 of 25
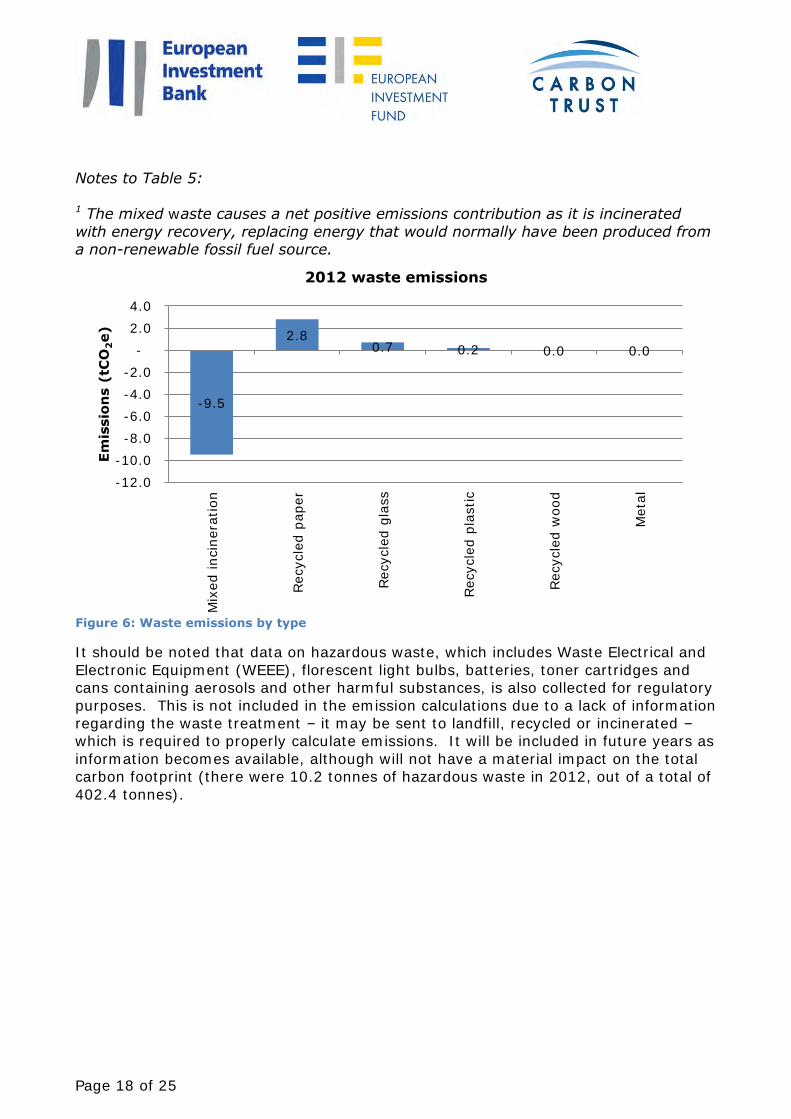
Notes to Table 5:
1 The mixed waste causes a net positive emissions contribution as it is incinerated
with energy recovery, replacing energy that would normally have been produced from a non-renewable fossil fuel source.
Figure 6: Waste emissions by type
It should be noted that data on hazardous waste, which includes Waste Electrical and
Electronic Equipment (WEEE), florescent light bulbs, batteries, toner cartridges and cans containing aerosols and other harmful substances, is also collected for regulatory
purposes. This is not included in the emission calculations due to a lack of information regarding the waste treatment – it may be sent to landfill, recycled or incinerated – which is required to properly calculate emissions. It will be included in future years as
information becomes available, although will not have a material impact on the total carbon footprint (there were 10.2 tonnes of hazardous waste in 2012, out of a total of
402.4 tonnes).
-9.5
2.8 0.7 0.2 0.0 0.0
-12.0
-10.0
-8.0
-6.0
-4.0
-2.0
-
2.0
4.0
Mix
ed incin
era
tion
Recycle
d p
aper
Recycle
d g
lass
Recycle
d p
lastic
Recycle
d w
ood
Meta
l
Em
issio
ns (
tCO
2e)
2012 waste emissions
Page 19 of 25
6 DATA ASSESSMENT AND METHODOLOGY CHANGES
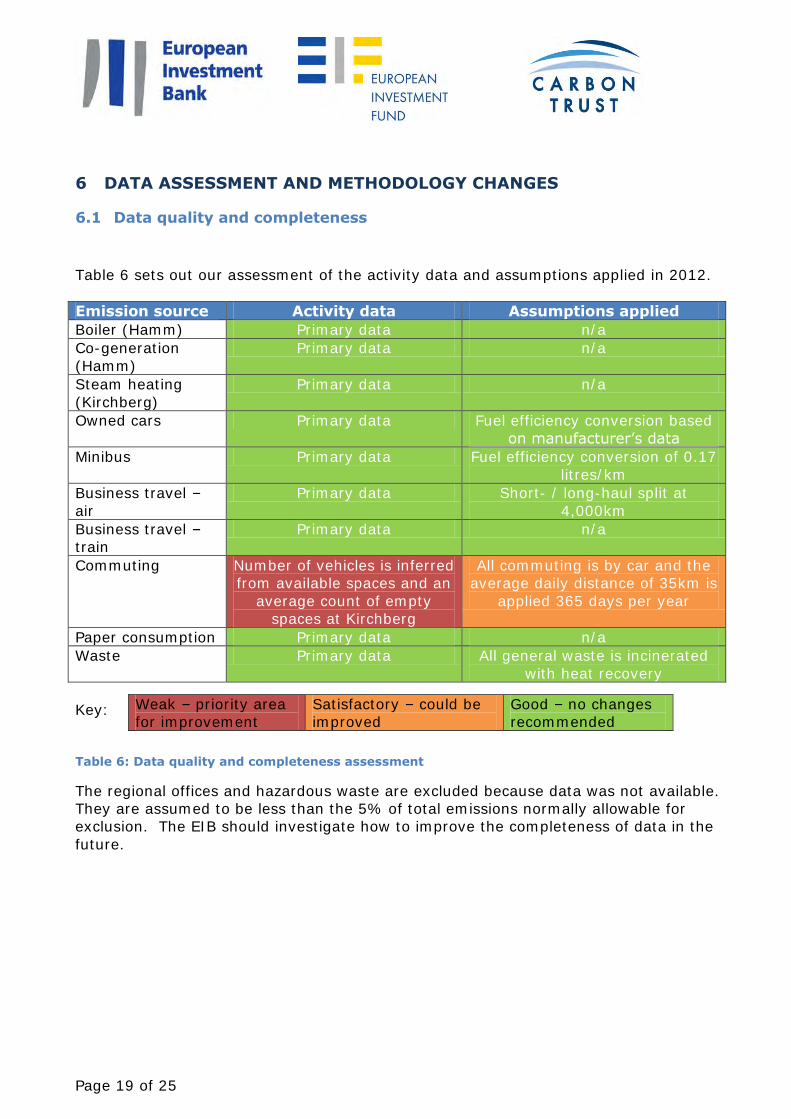
6.1 Data quality and completeness
Table 6 sets out our assessment of the activity data and assumptions applied in 2012.
Emission source Activity data Assumptions applied
Boiler (Hamm) Primary data n/a
Co-generation
(Hamm)
Primary data n/a
Steam heating
(Kirchberg)
Primary data n/a
Owned cars Primary data Fuel efficiency conversion based
on manufacturer’s data
Minibus Primary data Fuel efficiency conversion of 0.17
litres/km
Business travel –
air
Primary data Short- / long-haul split at
4,000km
Business travel – train
Primary data n/a
Commuting Number of vehicles is inferred from available spaces and an
average count of empty spaces at Kirchberg
All commuting is by car and the average daily distance of 35km is
applied 365 days per year
Paper consumption Primary data n/a
Waste Primary data All general waste is incinerated
with heat recovery
Key:
Table 6: Data quality and completeness assessment
The regional offices and hazardous waste are excluded because data was not available. They are assumed to be less than the 5% of total emissions normally allowable for exclusion. The EIB should investigate how to improve the completeness of data in the
future.
Weak – priority area for improvement
Satisfactory – could be improved
Good – no changes recommended
Page 20 of 25
6.2 Proposed future changes to methodology
For 2012 the methodology and emission factors used has been consistent with previous
years to allow comparison. For 2013 it is proposed to fully align with the GHG Protocol that will result in the following changes to emission factors:
Emission factor used for commuting. The emission factor currently used from Bilan Carbone is a complete cradle-to-grave factor (reflecting the full
product lifecycle of the vehicles used for commuting). For 2013, we propose to use the factor that relates only to emissions associated with the combustion of fuel for the vehicle in use. This more accurately reflects emissions associated
with commuting for the EIB given that the vehicles are owned by employees and used for other purposes over their life.
Emission factor used for waste. According to the GHG Protocol Scope 3
Standard, to avoid double-counting, the emissions associated with recycling and
energy generation from waste are attributed to the user of the recycled materials, with only transportation and minimal preparation emissions attributed
to the entity disposing of the waste. As such it is proposed for 2013 that the credit currently accounted for by the incineration of general waste (with heat recovery) will not be included in the emission factor for waste.

Page 21 of 25
6.3 Company owned vehicles
The 16 vehicles owned by the EIB represent 10% (96tCO2) of EIB’s net scope 1 and 2 emissions (excluding electricity at the grid average factor). The vehicles, including an additional seven replaced within the year (shaded grey), are ranked as follows:
Rank Emission gCO2/km KMs parcourus Total emission kgCO2
1 0 (Electric) 5,645 0
2 (replaces 3) 99 (Hybrid) 3,482 345
3 (replaced by 2) 104 95,229 9,904
4 (replaces 14) 149 23,842 3,552
5 (replaces 15) 150 29,059 4,359
6 (replaces 17) 150 44,831 6,725
7 152 7,596 1,155
8 154 33,000 5,082
9 154 17,016 2,620
10 158 48,476 7,659
11 162 18,110 2,934
12 (replaces 21) 175 6,435 1,126
13 (replaces 19) 183 19,000 3,477
14 (replaced by 4) 189 29,290 5,536
15 (replaced by 5) 189 29,851 5,642
16 (replaces 22) 195 17,522 3,417
17 (replaced by 6) 195 21,511 4,195
18 199 13,504 2,687
19 (replaced by 13) 199 27,350 5,443
20 223 11,854 2,643
21 (replaced by 12) 227 11,377 2,583
22 (replaced by 16) 245 25,606 6,273
23 281 29,491 8,287
TOTAL 569,077 95,643
Table 7: Owned vehicles
It should be noted that one of these vehicles (#1) is an electric car used by the IT
department to visit data centres with no associated emissions (electricity for recharging is not separable from electricity used in the buildings). The vehicle with the lowest emission factor (#2) is a full hybrid car.
The EIB has a policy to replace poor performing vehicles (in carbon efficiency terms).
The total annual emissions for the seven replaced in 2012 will be 17% lower than the cars they replace, saving 11.7tCO2 per year. Replacing the next three highest emitting
vehicles could save a further 8tCO2.

Page 22 of 25
7 ENVIRONMENTAL INDICATORS 2012
7.1 Emissions by Scope
Emissions (tCO2e) 2012 2011 2010 2009 2008 2007
Natural gas 399 433 329 464 743 833
Owned transport 96 103 112 107 99 100
Total Scope 1 495 536 441 570 842 933
Purchased electricity1 6,876 7,061 7,111 7,367 7,454 6,085
Purchased steam 459 390 502 490 374 249
Purchased cold supply 28 32
Total Scope 2 7,335 7,451 7,613 7,857 7,857 6,366
Business travel 9,168 12,131 11,413 10,858 13,489 12,407
Outsourced minibus 52 141 130 130 270 270
Commuting 6,190 6,369 6,369 4,407 4,363 3,749 Waste (6) (2) (4) 0 (1) 0
Paper consumption 83 115 146 120 227 200
Total Scope 3 15,488 18,754 18,054 15,515 18,348 16,626
Total Gross emissions 23,317 26,741 26,108 23,943 27,047 23,926
Green tariff (6,876) (7,061) (7,111) (7,367) (7,392) (5,993)
Total net emissions2 16,441 19,682 18,997 16,576 19,653 17,932 % change from 2011 -16%
% change from 2007 -8% 10% 6% -8% 10% 0%
Number of employees 2,185 2,175 2,079 1,906 1,769 1,501
Net emissions per employee 7.52 9.05 9.14 8.69 11.11 11.92
% change from 2011 -17%
% change from 2007 -37% -24% -24% -27% -7% 0% 1
Assumes the grid average emission conversion factor for Luxembourg in 2009 (latest available) for all years for comparability 2 Small differences in total due to rounding

Page 23 of 25
7.2 Emissions by type
Indicators Total tCO2e
2012
tCO2e per
employee
2012
tCO2e per
employee
2011
tCO2e per
employee
2010
tCO2e per
employee
2009
tCO2e per
employee
2008
tCO2e per
employee
2007
Energy emissions1 858 0.39 0.38 0.41 0.52 0.68 0.82
Mobility emissions 15,506 7.10 8.62 8.67 8.13 10.31 11.10
Copying paper
emissions 83 0.04 0.053 0.10 0.06 0.13 0.13
Waste emissions -5.7 -0.0026 -0.0007 -0.0020 0.0001 -0.0007 0.0002 Total (net
emissions)2 16,441 7.52 9.05 9.14 8.69 11.11 11.92
1 Based on net emissions therefore does not include grid electricity as per scope 2;
2 Small differences in total due to rounding
7.3 Other indicators
Total m3
2012
m3 per
employee
2012
m3 per
employee
2011
m3 per
employee
2010
m3 per
employee
2009
m3 per
employee
2008
m3 per
employee
2007
Water 52,813 24.17 29.88 29.57 40.89 37.34 41.11
Total kWh
2012
kWh per
employee
2012
kWh per
employee
2011
kWh per
employee
2010
kWh per
employee
2009
kWh per
employee
2008
kWh per
employee
2007
Purchased electricity
with green certificates 17,573,827 8,042.94 8,296.82 8,742.91 9,878.63 10,679.51 10,205.32
Total tonnes
2012
Tonnes per
employee
2012
Tonnes per
employee
2011
Tonnes per
employee
2010
Tonnes per
employee
2009
Tonnes per
employee
2008
Tonnes per
employee
2007
Total copying paper 87 0.04 0.04 0.05 0.05 0.07 0.07

Page 24 of 25
8 ANNEX – GRI INDICATORS
EN5: Energy saved due to conservation and efficiency improvements.
Energy savings due to conservation and efficiency improvements have resulted in a decrease by 18% of the energy purchased by the EIB per employee since 2007.
Energy source 2012 2007 Variance %
change
Natural gas (kWh) 2,193,971 4,040,540 -1,846,569 -46%
Electricity (kWh) 17,573,827 15,619,594 1,954,233 13%
Steam (kWh) 10,670,478 5,785,063 4,885,415 84%
Total (kWh) 30,438,276 25,445,197 4,993,079 20%
Number of employees 2,185 1,501 684 46%
Energy per employee 13,931 16,952 -3,021 -18%
EN 6: Initiatives to provide energy-efficient or renewable energy based
products and services, and reductions in energy requirements as a result of these initiatives.
For electricity consumption: lighting and thermal production: estimated consumption reduction of 530,000 kwh/year for 2013 (-2.9%)
Energy heating (natural gas and purchased steam) consumption: thermal
production and regulations: estimated consumption reduction of 510,000 kwh/year for 2013 (-4.7%)
Water used by EIB facilities: water treatment, air-cooler: estimated consumption reduction of 5,500 m3 / year for 2013 (-8.4%)
EN22: Total weight of waste by type and disposal method.
The EIB disposes of waste through the Luxembourg municipal authorities. Waste is sorted in-house to the extent possible so that it can ultimately be recycled. All
unsorted waste is incinerated with energy recovery. Details of the quantities of waste by the official categorisation are shown in Table 8 below:
The Luxembourg "SuperDrecksKëscht Green Label" was first awarded to the Bank for its internal waste recycling practices in 2007 and renewed annually to date for the
East, West and Hamm buildings. The criteria for obtaining the label are as follows: visible and accessible collection sites; safe and environmentally correct storage;
good management in terms of waste recycling and disposal.

Page 25 of 25
Code CED
Official description of waste Quantity (kg)2011
Quantity (kg) 2012
080317 waste printing toner containing dangerous substances
2,012 cartridges
5310 cartridges
150101 paper / cardboard 72,200 75,606
150102 plastic packaging 1,449 406
150106 mixed packaging 4,968 5,952
150107 glass packaging 39,444 39,444
160214 Electronic and electrical scrap sorting 690 0
200101 paper and cardboard 65,120 77,958
200125 used cooking oil 2,172
200133
batteries and accumulators in 160601, 160602 or 160603 and unsorted batteries
and accumulators containing these batteries
285.5 351
200135
electrical and electronic equipment discarded
containing hazardous components other than 200121 and 200123
431 392
200136
electrical and electronic equipment discarded containing hazardous components other than 200121 and 200123
3963 6,421
200137 Treated wood waste 0 0
200138 Untreated wood waste 356 82
200139 plastics 766 1,438
200139 plastics PSE-PP-PE 301 563
200140 waste metals 893 1,575
200301 mixed municipal waste (garbage) 71,496 136,500
200301 mixed municipal waste (compactor) 120,460 50,212
200108 kitchen waste and canteen waste 136 136
150110 packaging containing residues of hazardous or contaminated by residues
713 964
150110 packaging containing residues of hazardous or contaminated by residues
24 16
160601 lead-acid accumulators 18 0
170411 cables other than those in 170410 16 141
170604 insulation materials other than those mentioned in 170601 and 170603
1,083 1,396
200121 fluorescent tubes and other mercury-containing waste
303 230
200121 Energy saving bulbs 178 309
200121 Incandescent bulbs 30 157
170107 Flat glass with frame 1060 0
TOTAL 386,382 402,420
(of which hazardous waste not included in emissions calculation)
12,543
(3%) Table 8: Waste categories