european ivd market statistics - vdgh to both 2014 and 2015 sales data eliminates possible...
TRANSCRIPT

European IVDMarket StatisticsR E P O R T 2 0 1 6

O V E R V I E W

MedTech Europe is pleased to publish the market estimates of the In Vitro Diagnostic (IVD) industry in Europe, for the year 2016. The MedTech Europe figures include macroeconomic and healthcare data for all 28-member states, the European Free Trade Association members – Switzerland, Norway and Iceland, as well as data from Turkey are available.
In vitro diagnostics (IVDs) are an essential part of today’s healthcare. IVDs are used to diagnose, monitor, screen and assess predispositions to diseases, thereby contributing to the available medical information regarding a patient. By allowing earlier and more targeted treatments, IVDs help to reduce hospitals stays and convale-scences, resulting in a healthier population, reduced costs and economic growth in the long run.
Four out of the five largest European IVD markets (Italy being the exception), are showing slight growth in 2016 and overall revenues across EU-28 plus EFTA increased by +1% to €10,839 million. However, this remains below the revenues recorded in 2011 (€10,943).
While the IVD revenues in Germany stagnated overall (+0,3%), market growth was seen in both microbiology +1,5% and immunochemistry +4,5%. From the largest five markets, UK is experiencing the highest increase of +2,5%, largely due to increase in the glucose test strip market. In Italy the IVD market dropped with -1.9% compared to 2015, with decrease revenues in both clinical chemistry -2,1% and immunochemistry -4,6%. After decreasing for three consecutive years) 2012 - 2014, and stagnation in 2015 (+0,1%) in 2016 the French IVD market marks a second year of stagnation with a sight growth of +0,5%. In Spain, the IVD market remains stagnant, but marks a growth of +0,3%. For the first time since 2008, the Greek IVD market increased with 1,6% in 2016. On the contrary, Netherlands showed a -4,0% decrease in IVD.In the newer EU member states, IVD expenditure averages 1,2% of total healthcare expenditure (THE) significantly higher than the 0,7% seen in older member states (EU-15), but in absolute terms the new member states spend only €9,7 per capita compared to €22,6 in the EU-15. Growth in the newer states at +8,2% compares to only +0,2% in the EU-15 states.
1 1 ,000
10,800
10,600
10,400
10,200
10,000
9,8002006 2007 2008 2009 2010 201 1 2012 2013 2014 2015 2016 2017
EUROPEAN IVD MARKET REVENUES (MILLION € )
EUROPEAN IVD MARKET STATISTICS REPORT 2016 2
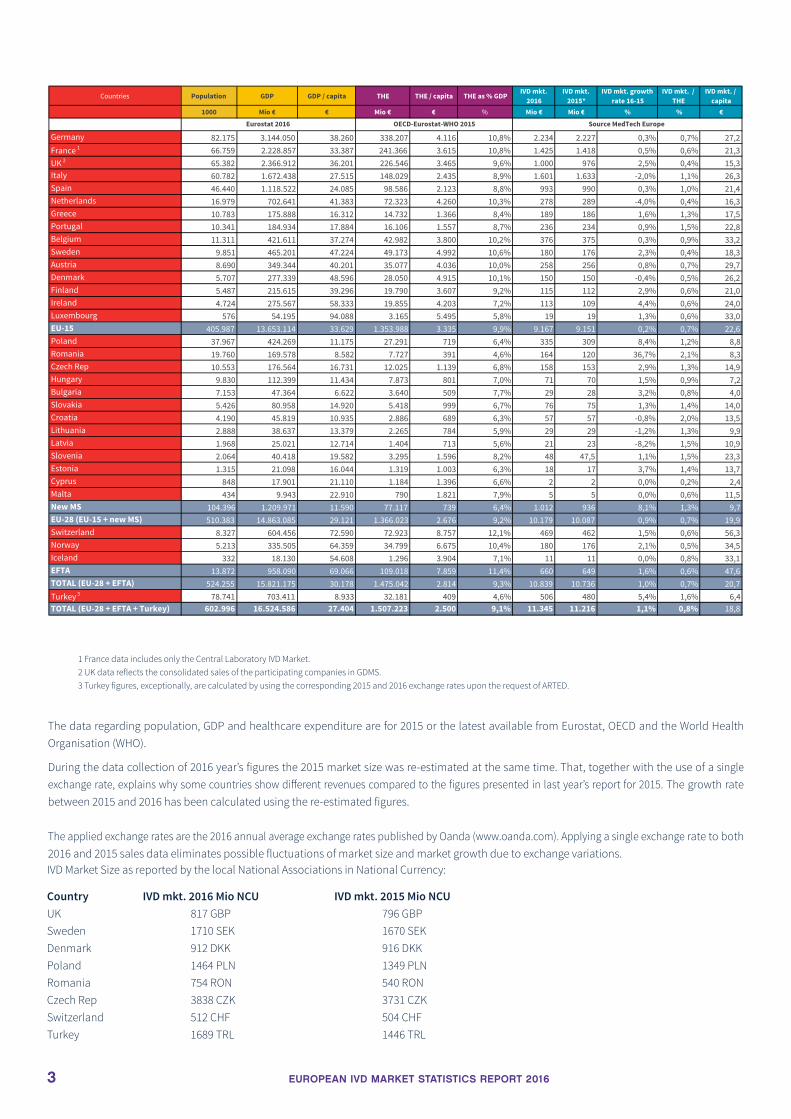
1 France data includes only the Central Laboratory IVD Market.2 UK data reflects the consolidated sales of the participating companies in GDMS.3 Turkey figures, exceptionally, are calculated by using the corresponding 2015 and 2016 exchange rates upon the request of ARTED.
The data regarding population, GDP and healthcare expenditure are for 2015 or the latest available from Eurostat, OECD and the World Health Organisation (WHO).
During the data collection of 2016 year’s figures the 2015 market size was re-estimated at the same time. That, together with the use of a single exchange rate, explains why some countries show different revenues compared to the figures presented in last year’s report for 2015. The growth rate between 2015 and 2016 has been calculated using the re-estimated figures.
The applied exchange rates are the 2016 annual average exchange rates published by Oanda (www.oanda.com). Applying a single exchange rate to both 2016 and 2015 sales data eliminates possible fluctuations of market size and market growth due to exchange variations.
Countries Population GDP GDP / capita THE THE / capita THE as % GDPIVD mkt.
2016IVD mkt.
2015*IVD mkt. growth
rate 16-15IVD mkt. /
THEIVD mkt. /
capita1000 Mio € € Mio € € % Mio € Mio € % % €
Germany 82.175 3.144.050 38.260 338.207 4.116 10,8% 2.234 2.227 0,3% 0,7% 27,2France 1 66.759 2.228.857 33.387 241.366 3.615 10,8% 1.425 1.418 0,5% 0,6% 21,3UK 2 65.382 2.366.912 36.201 226.546 3.465 9,6% 1.000 976 2,5% 0,4% 15,3Italy 60.782 1.672.438 27.515 148.029 2.435 8,9% 1.601 1.633 -2,0% 1,1% 26,3Spain 46.440 1.118.522 24.085 98.586 2.123 8,8% 993 990 0,3% 1,0% 21,4Netherlands 16.979 702.641 41.383 72.323 4.260 10,3% 278 289 -4,0% 0,4% 16,3Greece 10.783 175.888 16.312 14.732 1.366 8,4% 189 186 1,6% 1,3% 17,5Portugal 10.341 184.934 17.884 16.106 1.557 8,7% 236 234 0,9% 1,5% 22,8Belgium 11.311 421.611 37.274 42.982 3.800 10,2% 376 375 0,3% 0,9% 33,2Sweden 9.851 465.201 47.224 49.173 4.992 10,6% 180 176 2,3% 0,4% 18,3Austria 8.690 349.344 40.201 35.077 4.036 10,0% 258 256 0,8% 0,7% 29,7Denmark 5.707 277.339 48.596 28.050 4.915 10,1% 150 150 -0,4% 0,5% 26,2Finland 5.487 215.615 39.296 19.790 3.607 9,2% 115 112 2,9% 0,6% 21,0Ireland 4.724 275.567 58.333 19.855 4.203 7,2% 113 109 4,4% 0,6% 24,0Luxembourg 576 54.195 94.088 3.165 5.495 5,8% 19 19 1,3% 0,6% 33,0EU-15 405.987 13.653.114 33.629 1.353.988 3.335 9,9% 9.167 9.151 0,2% 0,7% 22,6Poland 37.967 424.269 11.175 27.291 719 6,4% 335 309 8,4% 1,2% 8,8Romania 19.760 169.578 8.582 7.727 391 4,6% 164 120 36,7% 2,1% 8,3Czech Rep 10.553 176.564 16.731 12.025 1.139 6,8% 158 153 2,9% 1,3% 14,9Hungary 9.830 112.399 11.434 7.873 801 7,0% 71 70 1,5% 0,9% 7,2Bulgaria 7.153 47.364 6.622 3.640 509 7,7% 29 28 3,2% 0,8% 4,0Slovakia 5.426 80.958 14.920 5.418 999 6,7% 76 75 1,3% 1,4% 14,0Croatia 4.190 45.819 10.935 2.886 689 6,3% 57 57 -0,8% 2,0% 13,5Lithuania 2.888 38.637 13.379 2.265 784 5,9% 29 29 -1,2% 1,3% 9,9Latvia 1.968 25.021 12.714 1.404 713 5,6% 21 23 -8,2% 1,5% 10,9Slovenia 2.064 40.418 19.582 3.295 1.596 8,2% 48 47,5 1,1% 1,5% 23,3Estonia 1.315 21.098 16.044 1.319 1.003 6,3% 18 17 3,7% 1,4% 13,7Cyprus 848 17.901 21.110 1.184 1.396 6,6% 2 2 0,0% 0,2% 2,4Malta 434 9.943 22.910 790 1.821 7,9% 5 5 0,0% 0,6% 11,5New MS 104.396 1.209.971 11.590 77.117 739 6,4% 1.012 936 8,1% 1,3% 9,7EU-28 (EU-15 + new MS) 510.383 14.863.085 29.121 1.366.023 2.676 9,2% 10.179 10.087 0,9% 0,7% 19,9Switzerland 8.327 604.456 72.590 72.923 8.757 12,1% 469 462 1,5% 0,6% 56,3Norway 5.213 335.505 64.359 34.799 6.675 10,4% 180 176 2,1% 0,5% 34,5Iceland 332 18.130 54.608 1.296 3.904 7,1% 11 11 0,0% 0,8% 33,1EFTA 13.872 958.090 69.066 109.018 7.859 11,4% 660 649 1,6% 0,6% 47,6TOTAL (EU-28 + EFTA) 524.255 15.821.175 30.178 1.475.042 2.814 9,3% 10.839 10.736 1,0% 0,7% 20,7Turkey 3 78.741 703.411 8.933 32.181 409 4,6% 506 480 5,4% 1,6% 6,4TOTAL (EU-28 + EFTA + Turkey) 602.996 16.524.586 27.404 1.507.223 2.500 9,1% 11.345 11.216 1,1% 0,8% 18,8
Eurostat 2016 OECD-Eurostat-WHO 2015 Source MedTech Europe
3 EUROPEAN IVD MARKET STATISTICS REPORT 2016
IVD Market Size as reported by the local National Associations in National Currency:
Country IVD mkt. 2016 Mio NCU IVD mkt. 2015 Mio NCU UK 817 GBP 796 GBPSweden 1710 SEK 1670 SEKDenmark 912 DKK 916 DKKPoland 1464 PLN 1349 PLNRomania 754 RON 540 RONCzech Rep 3838 CZK 3731 CZKSwitzerland 512 CHF 504 CHFTurkey 1689 TRL 1446 TRL

C O U N T R YS P E C I F I C
D ATA
EUROPEAN IVD MARKET STATISTICS REPORT 2016 4

Although there are variations in healthcare systems, reimbursement policies, etc. from country to country, healthcare cost containment is a constant across the various countries in this report. Besides budget restrictions, greater centralization both in the public and private laboratory sectors
has increased the power of purchasing organizations.
EUROPEAN IVD MARKET 2016 (MILLION €)
5 EUROPEAN IVD MARKET STATISTICS REPORT 2016
2.234
1.601
1.425
1.000
993
506
469
376
335
278
258
236
189
180
180
164
158
150
115
113
76
71
57
48
29
29
21
19
18
11
5
2
0 500 1.000 1.500 2.000 2.500
Germany
Italy
France
UK
Spain
Turkey
Switzerland
Belgium
Poland
Netherlands
Austria
Portugal
Greece
Sweden
Norway
Romania
CzechRep
Denmark
Finland
Ireland
Slovakia
Hungary
Croatia
Slovenia
Bulgaria
Lithuania
Latvia
Luxembourg
Estonia
Iceland
Malta
Cyprus

EUROPEAN IVD MARKET STATISTICS REPORT 2016 6
IVD MARKET PER CAPITA (€)
The differences in total healthcare expenditure, both in relative terms to GDP and absolute amounts, demonstrate the wide variation in access to
healthcare across the thirty-two countries in this report. Relative to GDP Switzerland is the leading country at 12%, followed by Germany, France
and the Scandinavian countries. In absolute amounts Switzerland remains in first position, followed by Norway, Luxemburg, Sweden and Denmark.
The per capita expenditure also shows a wide variation from a low of €2,4 in Cyprus to €56,3 in Switzerland, which remains also the leading country
in per capita expenditure on IVD.
56,32
34,49
33,24
33,13
32,99
29,69
27,19
26,34
26,23
24,01
23,26
22,82
21,38
21,35
21,03
18,27
17,53
16,35
15,29
14,97
14,01
13,73
13,50
11,52
10,86
9,87
8,82
8,30
7,22
6,43
4,03
2,36
0,00 10,00 20,00 30,00 40,00 50,00 60,00
Switzerland
Norway
Belgium
Iceland
Luxembourg
Austria
Germany
Italy
Denmark
Ireland
Slovenia
Portugal
Spain
France
Finland
Sweden
Greece
Netherlands
UK
CzechRep
Slovakia
Estonia
Croatia
Malta
Latvia
Lithuania
Poland
Romania
Hungary
Turkey
Bulgaria
Cyprus

GERMANY“In 2016, the German IVD-Market grew only about +0.3%. This is a reduction of the growth rate compared to 2015 (+1.0%). The market development differed strongly between the various segments. Laboratory diagnostics (reagents and instruments) increased by +1.9%, which is a stronger growth rate compared to 2015 (+1.5%) and 2014 (+0.8%). The rapid diagnostic testing market decreased by -2.5% in 2016. After a slight growth in 2015, the 2016 result for this segment suggests the continuation of the negative market trend, indicated by the negative growth rates of 2014 and 2013.A large portion of this development continues to be caused by the glucose self-testing market. This market segment decreased by -1.2% in 2016. Several reasons had an impact on this development. The restrictive legal framework that forces medical doctors to prescribe generic, low-priced test strips to not overstep their respective budget remains in place. In addition, new sensor-based technologies for the measurement of blood sugar are becoming more and more popular in Germany. Furthermore, a double-digit minus for haemostasis rapid tests had a negative knock-on effect.The regulative environment in Germany is still strict. The floating quota percentage for laboratory service fees remains in place and unchanged in 2016. Consequently, price pressure remains strong in the German IVD-Market. Despite the restrictive regulative environment various market segments continue to thrive. The sales numbers for the market segment immunochemistry reagents increased by +4.2%, the sales of microbiology reagents rose by +1.5%.” - VDGH, German IVD industry association
FRANCE“The Central Laboratory IVD French market * is estimated at 1.425 billion €, in stagnation with a non-significant growth of +0.5% compared to 2015. The Central Laboratory IVD French market is in stagnation since 2014 with continuous non-significant growth (+0.5% in 2016 vs 2015, +0.1% in 2015 vs 2014), after three years of slight but steady decrease (-0.4% in 2014 and -0.3% in both 2013 and 2012).” - SIDIV, French IVD industry association
UNITED KINGDOM“2016 saw the most significant political change in the UK in modern history, and dramatic consequences to the power bases of leading political parties. In June 2016 the British people went to the polls to vote on a single question - whether to remain in the European Union or to leave. By a majority of 52% to 48% of eligible votes, the decision was to leave (this was 37% of total eligible voters who voted leave). David Cameron immediately resigned as Prime Minister, and the subsequent leadership election resulted in the appointment of Theresa May. A reshuffle of Ministers was expected and some replacements and moves were made, but the Secretary of State for Health, Jeremy Hunt, remained in place.Against this background of political upheaval, the NHS continued to struggle to meet its obligations and targets with little additional funding to close the demand gap, estimated to be £20bn by 2020 due to the aging population and other pressures. Pathology services, still seen as a ‘back office’ function, and therefore cost, were expected to continue changing through consolidation of laboratories and demand optimisation. Many Pathology departments issued tenders for Managed Services Contracts (MSCs) to provide new, integrated and consolidated laboratory facilities for groups of hospitals, often with workflow study and redesign elements to try to achieve greater productivity and efficiency. Such MSCs provide complete packages of equipment supplies and services for agreed charges against key performance indicators for uptime and workload. In some cases contracts have been issued based on cost per result charges rather than cost per test or itemised components. The overall national picture for Pathology services in England is one of continuing consolidation, but so far not to the extent that some envisaged from the recommendations made by Lord Carter of Coles, which proposed a possible reduction from about 300 laboratories to perhaps as few as 50, and savings of £500m to the NHS. An example of a consolidation sometimes cited as a success story is the grouping of three hospital labs into Surrey Pathology Services (SPS). This has now also incorporated the Royal Berkshire Hospital and is known as BSPS, with Microbiology services going to another hospital. Savings made (or that will be made) have not been revealed, but some integration issues due to computer system incompatibility have been reported, and this is a common problem in lab groupings where capital is not made available to ensure such integrations can be completed smoothly.Within the pathology disciplines molecular techniques are making significant impacts in the speed of diagnosis of infectious diseases, and bringing emphasis back to local ‘hot lab’ provision of some urgent tests. Antimicrobial resistance awareness has also led to some application of point-of-care technologies to help identify quickly where antibiotics are necessary and to empower clinicians to with-hold them where they are not. Much still remains to be done, however, to convince many healthcare providers that IVDs are part of the solution to better more efficient he-alth care provision rather than additional cost.” - BIVDA, British IVD industry association
7 EUROPEAN IVD MARKET STATISTICS REPORT 2016
+0,3%
IVD MARKET
2.234 M €
+0,5%
IVD MARKET
1.425 M €
+2,5%
IVD MARKET
1.000 M €

ITALY“Under Italian Stability Law 2016 (Law December 28, 2015, no. 208):
• public healthcare providers with a deficit spending of 10% or more have to follow a specific financial re-equilibrium plan in order to get back to balance within three years;
• public procurement drives towards a higher centralization at regional/national level; • regional budgets for medical device expenditure are expected to be fixed to keep that spending, at national level,
not higher than 4,4% of the overall healthcare funding; once those budgets will be fixed, in the regions where the spending for medical devices will turn out to be higher companies are expected to repay (pro quota) 40% of the 2015 regional extra spending (45% of the 2016 and 50% from 2017); waiting for still missing technical decrees, the mechanism is actually in standby.
Based on the above framework, the number of diagnostic laboratories continue to decrease and the 2016 IVD market (1,600 Bill euro) decreased by 1,9% compared to 2015.” - ASSOBIOMEDICA, Italian IVD industry association
SPAIN“Market remains stagnant with no clear trends but expected to improve slightly for the next years. Consolidation of laboratories still a trend but not too much room left for consolidation. Most of laboratories already consolidated looking for economy of scale and homogenization of the region’s procedures and technologies.Price driven market at least for mature technologies. Introduction of innovation or new tests very slow due to a very heterogeneous marked with 17 regions with different purchase approaches.Continuous monitoring of glucose begins to be reimbursed in some regions subject to individual approval. Other glucose test strips suffer a commoditization approach.” – FENIN, Spanish IVD industry association
GREECE“Year 2016 ended, for the ninth consecutive year, with recession in Greece, reaching - 0,05% vs 2015, thus cumulative recession of the last nine (9) years, since 2008, reaching -27,4%. The capital controls that were implemented on 28/6/2015 are still in place. The Greek IVD market grew last year, for the first time after 2008, by 1.6%, reaching a size of € 189M. In the public sector, which accounts for approximately 65% of the total IVD market in Greece, the Hospital Operating Expenses were increased by 5,8% in 2016 vs. the 2015 expenses, providing also for the hospitalization costs of the uninsured population. Public procurement, based on tenders and negotiations, is dictated by the Observatory of Prices of the MoH, which continuously pushes prices down, regardless of technical specifications, volumes or method. New legislation, concerning procurement in the public sector, was voted and implemented in August 2016, further enhancing the importance of the price criterion over the quality and most economic advantageous offers.The private sector – accounting for approximately 35% of the total IVD market in Greece – is also under pressure and has contracted by more than 30% since 2009. Private healthcare providers have been constantly suffering great losses annually, since 2013, in the form of claw backs and rebates towards the main insurance provider, EOPYY, hence, some of them have been pushed out of business while the survivors are attempting to pass these losses over to their suppliers.Most of the IVD suppliers still suffer from the losses imposed to them in 2012 by the haircut of the Greek Government bonds that were given to them as payment for the public sector purchases of the period 2007-2009. These losses have not yet been overcome and have left a lasting effect on the Greek IVD market. DSO decreased from 440 days at the end of 2015 to 310 days at the end of 2016. ” – SEIV, Greek IVD industry association
PORTUGAL“The Portuguese IVD market grew slightly in the range of 0,8% driven by an increase on the demand for health care services. On the other side price erosion was hindering a higher growth. The debts, continue to be a concern as they continue to be high. At the end of the year we closed with 287 days in average outstanding.” - APIFARMA, Portuguese IVD industry association
EUROPEAN IVD MARKET STATISTICS REPORT 2016 8
-2,0%
IVD MARKET
1.601 M €
+0,3%
IVD MARKET
993 M €
+1,6%
IVD MARKET
189 M €
+0,9%
IVD MARKET
236 M €

BELGIUM“In 2016, the IVD market grew by 0,3 % , reagents (total) revenues: + 0,3 % and Instruments, Consumables, Software: - 1,8 %. Within the total national healthcare budget 2016, the IVD expenditures increased by 0,6 % compared to 2015. (IVD expenditures 2016 = 1.296 million €).
The average budget increase was 3,3 % for the last 10 years, but decreased by an average of 0,9 % during the last 5 years.At the end of 2015, the Minister of Health started discussions with beMedTech concerning a ‘Pact of Medical Technologies’ with the industry. The pact ensures that the industry, for the next few years, can operate in a stable budgetary framework so that it can continue to invest in the development of innovative technologies.The ‘Pact of Medical Technologies’ was signed by the minister in October 2016, based on a united short and long time vision.Specific IVD objectives and plans are as follows:
• Diabetes Convention: reimbursement of sensor technology for type 1 diabetes patients (July 2016) Extra budget: 10 million euro. • IVD Regulation: implementation in cooperation with the government and the competent authorities. • Work out a reimbursement procedure for IVD assays in general and a specific procedure for companion diagnostics • Next generation sequencing: roadmap 2016-2020 for NGS in routine analysis in oncology and haematology
Budget: 7,1 million euro • Point-of-care testing: develop a regulatory framework” - beMedtech, Belgian IVD industry association
SLOVENIA“With 1,1% growth, the Slovenian IVD market is showing very modest growth for the second year (last year was 0,6%). Taking into consideration that the number of IVD samples are constantly growing, at least 2-3% per year, it’s obvious that requests for lowering prices in the public sector and at the same time strong pricing competition are the main reasons for the stagnation of the market value growth.” - SIEDMA, Slovenian IVD industry association.
TURKEY“End-user market value growth in local currency has reached double digit while the announced tender test numbers have increased by 6.7%, mainly due to regular test number growth and the upsurge in number of tests of some specialty parameters like Vitamin D and Procalcitonin. Distributors’ surging costs especially inservice procurement tenders’ due to a 30% increase in minimum wage (applied from Jan 1st) and a 10% average appreciation of euro against Turkish lira resulted in higher end-user prices. Therefore, generally speaking, end-user price hike seems to be a result of rising costs within the distribution channel rather than the price increase effect generated by manufacturers, which means a slight reduction of manufacturer prices in hard currencies.2016 has been a difficult year for Turkey. The coup attempt took place in July, which negatively affected the political arena and the economy, leading to an economic slowdown and currency depreciation. One of the resultant turmoil’s main effects on healthcare companies has been the extended payment terms due to an increasing budget deficit.Construction of city hospitals financed by PPP model have continued and preparations for opening 3 small-mid size hospitals have been completed within the year. A total of 23-25 new hospitals are planned to be built by the same model, which will eventually replace some old ones but also will provide extra capacity to serve the growing population. These new hospitals are expected to constitute an estimated 20% of all bed capacity in the country by 2023. Nature of funding, construction companies’ decision-making power in choosing laboratory service providers, required high scale laboratory management know-how & technology coupled with 5+5 year contracts with service providers will have an impact on the IVD market.” - ARTED, Turkish IVD industry association
9 EUROPEAN IVD MARKET STATISTICS REPORT 2016
+0,3%
IVD MARKET
376 M €
+1,1%
IVD MARKET
48 M €
+5,4%
IVD MARKET
506 M €
D ATAG AT H E R I N G

EUROPEAN IVD MARKET STATISTICS REPORT 2015 8
D ATAG AT H E R I N G
EUROPEAN IVD MARKET STATISTICS REPORT 2016 10

The results presented in this report are based on individual estimates made for 28 EU countries and the EFTA countries:
• 14 countries participating in the Global Diagnostic Market Statistics (GDMS, former EDMS) programme: Austria, Belgium, Czech Republic, Denmark, France, Germany, Italy, the Netherlands, Poland, Portugal, Slovakia, Spain, Switzerland, and the UK.
• The National Association Members of MedTech Europe and the MedTech Europe’s Market Research Committee have estimated the IVD market in 18 other countries not participating in the GDMS programme: Bulgaria, Croatia, Cyprus, Estonia, Finland, Greece, Hungary, Iceland, Ireland, Latvia, Lithuania, Luxembourg, Malta, Norway, Romania, Slovenia, Sweden and Turkey.
The figures per country are compiled from the Global Diagnostic Market Statistics (GDMS) programme, through which companies report invoiced sales of reagents, instruments and consumables to an independent auditor, CIP, as based on the Global IVD (former EDMA) Classification. This is done in association with the MedTech Europe’s Market Research Committee and the National Association Members. More than 85% of the market is covered in major countries by GDMS, ensuring the reliability and objectiveness of the information provided by MedTech Europe and its members. MedTech Europe encourages all IVD suppliers and countries to participate in the GDMS programme, which is the largest in vitro diagnostic audit in Europe and the most accurate source of information for understanding and predicting market trends.
11 EUROPEAN IVD MARKET STATISTICS REPORT 2016

ABOUT IN VITRO DIAGNOSTICS In vitro diagnostics (IVDs) are non-invasive tests performed on biological samples (for example blood, urine or tissues) to diagnose or exclude a disease. IVDs provide valuable information about how the body is functioning and the state of health. They are used for diagnosis, screening and therapeutic monitoring of diseases. IVDs have a broad scope ranging from sophisticated technologies performed in clinical laboratories to simple self-tests, such as those for pregnancy and glucose monitoring.
ABOUT MEDTECH EUROPE MedTech Europe is the European trade association representing the medical technology industries, indiagnosis, prevention and cure. MedTech Europe started as an alliance in October 2012 formed by two organisations - EDMA, representing the European in vitro diagnostic industry; and Eucomed, representing the European medical devices industry. Our members include European national medical technology associations, distributors, and manufacturers of Medical Technologies operating in Europe, Middle East and Africa. MedTech Europe’s mission is to make innovative medical technology available to more people, while helping healthcare systems move towards a sustainable path. We also promote medical technology’s value for Europe through our five-year industry strategy, which focuses on value based innovations that support more sustainable healthcare systems. MedTech Europe provides technical, regulatory and market research information to our members.The European in vitro diagnostic industry is a market worth around €11 billion. Driven by research and development, 95% of the industry is comprised of small and medium size enterprises and approximately 1 billion euros per year is reinvested in R&D. Developed by MedTech Europe, the Global Diagnostic Market Statistics (GDMS) and Management Information System (MIS) programmes provide a comprehensive overview of the latest market trends based on the Global IVD Product Classification (GIVD). For more information, visit http://www.medtecheurope.org.
FOR MORE INFORMATIONTeodora Angelova Market Research Coordinator Email: [email protected]: +32 2 777 02 74
EUROPEAN IVD MARKET STATISTICS REPORT 2016 12