european laboratory for particle physics (cern) …ific.uv.es/~martinee/docs/ppe-96-091.pdf ·...
TRANSCRIPT

EUROPEAN ORGANIZATION FOR NUCLEAR RESEARCH
EUROPEAN LABORATORY FOR PARTICLE PHYSICS (CERN)
CERN-PPE/96-914 July 1996
Rb and Rc ?Contributions to the Moriond Workshop on Rb and Rc
XXXI Rencontres de MoriondQCD and High Energy Hadronic Interactions
March 1996
Alain Blondel1), Andrew O. Bazarko2), Jeffrey A. Snyder3), Fernando Martınez-Vidal4),Giovanni Calderini5), Jerome Baudot2), Helenka Przysiezniak6)2), Pippa S. Wells2),
James G. Branson7), Piotr H. Chankowski8), Pierre Chiapetta9)
Abstract
As of March 1996, the measurements of Rb and Rc were in serious discrepancywith the Standard Model expectations. The programme committee of MoriondQCD organized an extensive discussion session on the subject. The experimentalfacts were described critically by specialists of these measurements, and possibleinterpretations by new physics were presented. The written contributions to theMoriond proceedings are collated in the following.
1) Ecole Polytechnique, Palaiseau, France.2) CERN, Geneva, Switzerland3) Yale University, New Haven, USA4) University of Valencia, Spain5) Scuola Normale Superiore, Pisa, Italy6) University of Alberta, Canada7) University of California, San Diego, USA8) Institute of Theoretical Physics, Warsaw University, Poland9) Centre de Physique Theorique, Marseille, France
Contributions to the Rb;Rc workshop
1 Introduction:Rb, Rc and QCD (Alain Blondel)
2 Rb measurements using lifetime tags at LEP (Andrew Bazarko)
3 A high purity measurement of Rb at SLD (Jeffrey Snyder)
4 Measurement of Rb using leptons, event shape and multivariate tags at LEP(Fernando Martınez-Vidal)
5 Is our knowledge of the charm sector correct? (Giovanni Calderini)
6 Rc measurements at LEP (Jerome Baudot)
7 Gluon splitting into heavy quarks (Helenka Przysiezniak)
8 Are the LEP and SLD heavy flavour data averaged correctly? (Pippa Wells)
9 Effects of QCD in Rb and Rc (James Branson)
10 Rb in the MSSM: how big can it be? (Piotr Chankowski)
11 Hadrophilic Z’: an explanation of LEP1, SLC and CDF anomalies?(Pierre Chiappetta)
12 Summary: Rb, Rc and QCD (Alain Blondel)

Introduction: Rb, Rc and QCD
Alain BLONDEL
L.P.N.H.E. Ecole Polytechnique, IN2P3-CNRS, 91128 Palaiseau France; and CERN, PPE division
Precision measurements using the b quark, i.e. the isopartner of the heaviest fermiontop, probe new physics that could have escaped the more precise tests using light fermionsand leptons in particular. At present, the measured decay rate of the Z boson in b quarks is3 standard deviations away from the Standard Model (SM) value. Is this the long-soughtnew physics? Or could this be an experimental artefact? After a brief introduction of theimportant observables in this game, I recall the accuracy (10�3) with which the StandardModel (SM) works for the light fermions (section 2) In comparison, the 2% (resp. 7%)discrepancy in Rb (resp. Rc) seems enormous (section 3). Of course, given the difficultyof the measurement, one should first ask how it could be wrong, (section 4), before tryingto find how new physics could explain it (section 5). Although this topic is at first sightthe concern of electroweak afficionados, I will explain in section 6 how it is linked, via thetotal hadronic width, to the determination of the strong coupling constant �s, and thereforeconstitutes an adequate topic of discussion for a forum of hadronic interaction experts.

1 DefinitionsThe observables Rb, Rc, andR` are defined as ratios of partial decay widths of the Z boson:
Rb =�Z!bb
�Z!hadrons
; Rc =�Z!cc
�Z!hadrons
; R` =�Z!hadrons
�Z!`+`�: (1)
They are obtained from the corresponding event ratios at the Z pole, after a small correctionfor photon exchange.
2 The Standard Model WorksThe situation of precision electroweak measurements was reviewed by Malgeri [1, 2]at Moriond Electroweak 1996. The weak mixing angle sin2 �e�w is now measured fromforward-backward and polarization asymmetries at the Z pole with a relative precision of1:210�3, the leptonic width of the Z 1:610�3, the W mass 210�3 , all in perfect agreementwith the SM predictions. As is well known, the agreement of these measurements with theSM would not be achieved if electroweak radiative corrections were not taken into account.Moreover, a good fit is obtained only for a given range of the top quark mass, remarkablyenough, consistent for the various observables, and with the latest determination of the topquark mass [3]. The high quality of the agreement between the most precise observationscan be seen on figure 1.
0.229
0.23
0.231
0.232
0.233
0.234
0.235
83 83.5 84 84.5 85
LEP/SLD/CDF/D0 March 1996Preliminary
α(mz2)=1/128.89±0.09
mt=175 ± 9 GeV
Γlepton (MeV)
sin2 θ ef
fle
pt
STANDARD MODEL
mt120
220
mH
1000
300
60
68% C.L.
99% C.L.
Figure 1:Contours of constant �2 for sin2 �e�wversus �`. The SM predictionsas a function of Mt and MH
are shown.The star indicates the predictionsof the SM, if the only electroweakcorrection applied is the runningof �(M2
Z).The arrow indicated on the star showsthe influence of the �(M2
Z) erroron the predictions.The agreement with the latest determinationof the top quark mass is striking.
3 Rb does notThe first precise measurements of Rb came in early 1993, when analysis of data takenwith vertex detectors at LEP became available. Since summer 1993, the situation has

evolved slowly, with a discrepancy of the combined average of the LEP experiments grow-ing slowly from about two standard deviations to more than three. This slow evolution canbe explained by the fact that results were systematically limited from the very beginning.Progress can only come from improved techniques and understanding.
In addition measurements of Rc have developped a discrepancy at the level of 2 stan-dard deviations, so that the present results are [2]:
Rb = 0:2211 � 0:0016 SM Value : 0:2155 discrepancy : 3:5� (2)
Rc = 0:1598 � 0:0069 SM Value : 0:172 discrepancy : 1:8� (3)
with a negative correlation of -0.30. The correlation stems from the fact that charm eventsare the main background to the Z! bb signal.
One very popular scenario for discrepancies from the Standard Model in Rb and Rc isthe possibility of new effects in the Z! bb partial width, �b = �SMb + ��b. If one takesthis scenario, the relative change of Rb due to this new effect is large, while that of Rc, orR` is small:
�Rb
Rb
=��b
�b
� 1 �Rb;�Rc
Rc
= ���b
�b
� Rb;�R`
R`
= +��b
�b
� Rb (4)
Taking this constraint into account is essentially equivalent to forcing Rc to its StandardModel Value of 0.172. This also shifts the best value of Rb via the correlation:
Rb; ( Rc �xed to SM) = 0:2202 � 0:0016 (5)
Which is 2.9 standard deviations from the SM expectation.The precision in the Standard Model prediction is very good. Dominant sources of
uncertainty are [4]: i) the top quark mass error itself, Mt = 175 � 9 GeV leads to�Rb = 0:0003; ii) the uncertainty in the b quark mass corrections, 0.5 MeV error on Mb
gives �Rb = 0:0002; iii) the QCD corrections essentially cancel in Rb, residual ones areestimated to give an error smaller than �Rb = 0:0001. An error in the calculation can beruled out as source of the observed discrepancy.
4 Experimental ProcedureThe art of experimenters is to design efficient and self-calibrating b-tags. This is devel-opped in detail in the following articles [5, 7]. There are three main sources of informationto design a tag: i) the presence of large transverse momentum leptons (lepton tag); ii) thepresence of tracks that miss significantly the primary vertex, indicating the presence of aheavy object with large multiplicity decaying with a long lifetime (lifetime tag); iii) consis-tency of the event shape with the presence of a heavy boosted object (event shape tag); Thelifetime tag is by far the most efficient, SLD has recently achieved up to 37% efficiencywith a purity of 97% [6].
By now, all experiments use an internal calibration of the tag by the double taggingtechnique: since b quarks are produced in pairs, one can take events where one b is taggedand count which fraction of these have the second b tagged to extract the tagging efficiency

(�b). IfNt is the number of events with one tag and Ntt the number of events with two tags,then one gets two equations:
Nt
2Nhad
= �bRb;Ntt
Nhad
= �2bRb: (6)
which can be solved for �b and Rb. This avoids the need to calculate �b from a model, thatwould have to describe very well vertexing and other delicacies but also fragmentationand decays of b-hadrons, inducing considerable uncertainty. In practice, things are not sosimple. Equations 6 are only valid in absence of backgrounds and assume explicitely thatin a Z! bb event, the probabilities to tag the two bs are independent statistically. Theyhave to be modified for these effects:
Nt
2Nhad
= �bRb + �cRc + �udsRuds;Ntt
Nhad
= Cb�2bRb + �2cRc + �2udsRuds; (7)
where Cb ' 1 � �, � being the correlation of tagging efficiency between the two hemi-spheres in a Z! bb event, while �c; �uds are the efficiency of the tag for charm and u; d; s
events respectively.Both hemisphere correlations and background tag efficiencies are obtained from
Monte-Carlo. This is where systematic errors originate, and they dominate the measure-ment errors. The key issues are: hemisphere correlations and charm background. .These are explained in great detail by A. Bazarko [5], J. Snyder [6], F. Martinez-Vidal [7],for the various methods of b-tagging, J. Baudot [8] and G. Calderini [9] for the measure-ment of Rc and the understanding of charm background, J. Branson [10] for the influenceof hadronization and QCD on the hemisphere correlations. A collective mistake of 2% inthe hemisphere correlations could explain the observed anomaly...
Finally, since several methods are used by different experimental group, comes the verydelicate task of combining them to produce one number. This is particularly difficult here,since systematic errors dominate. This question is addressed by P. Wells [11].
5 Physics interpretationsAny scenario that explains the observed discrepancy in terms of new physics must i) pro-duce large effects on at least Rb and possibly Rc, ii) preserve all existing precision tests ofthe Standard Model, both in Z decays and in other experiments such as W-mass, neutrino-scattering, and also b-hadron decays. This is not easy. Here are three examples:1)An apparent increase in �b could be due to additional production of b�b pairs by gluons(gluon splitting) in the hadronization process. Experimental cross-checks can be made,as summarized by H. Przysieszniak [12]. This of course would not explain a low value ofRc.2)Radiative corrections to theZ! bb vertex could be induced by new particles that coupleto the b quark. Although, a priori, such effects have a natural tendency to decreaseRb, mod-els with enough parameter space, such as Supersymmetry, can be arranged to increase it.Complete fits to the Minimal Supersymmetric Model are described by P. Chankowski [13].3)A brute force explanation could be that the couplings of the physical Z boson are notthose of the Standard Model. Mixing with a Z’ would do it, provided couplings of theZ’ to leptons are suppressed, in order to respect the leptonic measurements. These Z’ arecalled hadrophilic or leptophobic. Such a scenario is presented by Chiapetta [14].

6 Why is Rb relevant for QCDAll determinations of the strong coupling constant �s suffer from one of the followingweaknesses: i) non-pertubative corrections; ii) hadronization effects; iii) missing higherorders; iv) imprecision of experimental data.
All but one. R` offers a clean, pristine, high statistics, low systematics, calculated tothird order, infrared free, etc... determination of �s.
R` = R`0
�1 + 1:06
�s
�+ 0:9(
�s
�)2 � 15(
�s
�)3 + :::
�(8)
If one takes all observables containing the hadronic width of the Z, R`, �peak;0had , �Z, the best
Standard Model fit gives �s = 0:123 � 0:004 for a Higgs boson mass of 300 GeV. Thecentral value shifts to 0.121 for a Higgs boson mass of 65 GeV, and 0.125 for a Higgs bosonmass of 1000 GeV. The sensitivity to the top quark mass is much smaller in the StandardModel, thanks to a cancellation between the radiative affects on the Z! bb vertex and theeffective mixing angle sin2 �e�w which enters in the vector couplings.
Of course the Rb discrepancy ruins the argument. If Rb or Rc are affected by newphysics, so is R`. The measurement of �s becomes unreliable.
It is easy to combine equations 8 and 4 to obtain the shift of �s (extracted from R`
assuming the SM) from its true value, if the shift in Rb is due to new physics in �b:
��s = +4:005�Rb (9)
So, if one believe Rb, �s becomes 0:105�0:008. If one also belive Rc, �s becomes 0:16�0:03....!
0.21
0.22
0.23
0.23 0.24sin2θeff
lept
Rb
α(mz2)=1/128.89±0.09
αs=0.118±0.003
mt=175 ± 9 GeV
Rc=0.172
LEP/SLD/CDF/D0 March 1996Preliminary
SM
mt
90 GeV
150 GeV
200 GeV
250 GeV
mH (GeV)
60, 300, 1000
1 σ constraint from
Rl and αs
Rb
sin2θefflept
Figure 2:sin2 �e�w , Rb and the SM prediction.The constraint from R`,using the world average value�s = 0:118 � 0:003,is the oblique band.
One can reverse the proposition. If a reliable value of �s were available, one could testthe Rb discrepancy with R`. The 1995 edition of PDG [15] has produced a combination of

�s measurements which does not include that from R`. Thanks to new evaluations of �s
from hadronic � decays and lattice QCD calculations of the Quarkonium spectra, the Worldaverage value of �s is now rather precise: 0:118�0:003. (Although the 10 measurementsused give a �2 of 9, the error has been conservatively increased. It would be 0.0017 if theerrors given on each individual measurement were taken at face value).
The agreement between �s = 0:123 � 0:004 obtained from the hadronic width, and0:118�0:003 from the world average can be translated in a possible deviation in Rb usingequation 9:
��s = 0:005 � 0:005 ) �Rb = 0:0012 � 0:0013 ) Rb = 0:2167 � 0:0013 (10)
One realizes that R` provides a more powerful test, although less direct, of the followingquestion: is there an anomaly in the Z! bb partial width? Although the possible anomalyis of the same sign as that indicated by the measurement ofRb itself, it is much smaller, andnot significant. The direct measurement of Rb and this indirect one differ by 1.7 standarddeviations. This is well seen on figure 2 where the measurements of sin2 �e�w , Rb and R`
are compared in the sin2 �e�w ;Rb plane.
References
[1] For LEP and SLD data, see: L. Malgeri, in XXXI Rencontres de Moriond, weak In-teractions and Unified Theories, ed. Tran Than Van, to appear in the Proceedings.For the W mass: K. Streets, (Do coll.) and D. Benjamin (CDF coll.), in XXXI Ren-contres de Moriond, weak Interactions and Unified Theories, ed. Tran Than Van, toappear in the Proceedings.
[2] The LEP Collaborations, CERN-PPE 95-172. Update for the 1996 winter confer-ences, LEPEWWG 96-01. Contains a very complete list of experimental referenceson precision measurements at LEP, Fermilab and SLC.
[3] CDF Coll. G. Tartarelli,(CDF/PUB/TOP/PUBLIC/3664) in XXXI Rencontres deMoriond, weak Interactions and Unified Theories, ed. Tran Than Van, to appear inthe Proceedings.D0 Coll. R. Hall, ibid.
[4] Reports of the working group on precision calculations at the Z resonance, CERNyellow report CERN 95-03 (1995).
[5] A. Bazarko, these proceedings.[6] J. Snyder, these proceedings.[7] F.Martinez-Vidal, these proceedings.[8] J. Baudot, these proceedings.[9] G. Calderini, these proceedings.
[10] J. Branson, these proceedings.[11] P. Wells, these proceedings.[12] H. Przisieszniak, these proceedings.[13] P. Chankowski, these proceedings.[14] P. Chiapetta, these proceedings.[15] L. Montanet et al., Physical Review D50, 1173 (1994)
and 1995 off-year partial update for the 1996 edition available on the PDG WWWpages (URL: http://pdg.lbl.gov/).

Rb MEASUREMENTS USING LIFETIME TAGS AT LEP
Andrew O. Bazarko
CERN, CH-1211 Geneva 23
abstract
Rb = �Z0!b�b=�Z0
!hadrons measurements by Aleph, Delphi, and Opal using life-time tags are reviewed. These measurements currently dominate the world averagevalue of Rb.

1. Introduction
The current average of LEP and SLD measurements of Rb, the ratio of the Z0 partial
width into b quarks and its total hadronic partial width, �nds1 Rb = 0:2202 � 0:0016 when
Rc is �xed to its Standard Model value of 0.172. This is almost 3� from the Standard Model
prediction, RSM
b= 0:2155 � 0:0004. Of the many observables measured precisely at the Z0
resonance, Rb is found to di�er most signi�cantly with the Standard Model.
Rb has the feature that most Electroweak and QCD radiative corrections cancel in the
ratio, leaving Rb sensitive to radiative corrections that couple preferentially to b quarks, like
the large CKM coupling to top quarks. For example, Rb is expected to di�er from Rd by
approximately 2% for mt = 175 GeV/c2.
Rb is obtained by measuring the ratio of b�b and hadronic cross sections at the Z0 pole.
The experimental problem is to tag a subsample of b�b events with known e�ciency and purity.
Z0 ! b�b events are di�erent enough from other Z0 decays that high purity tagging is possible.
Of the tagging methods used, lifetime tags o�er the best performance and measurements
using them dominate the current world average. This article covers the Rb measurements
using lifetime tags performed by aleph,2 delphi,3 and opal.4 Other LEP Rb measurements,
particularly delphi's multivariate analysis, which includes lifetime information, are describedby Martinez-Vidal.5 Finally, SLD has designed a high purity tag, which, in addition to lifetime
information, uses the invariant mass of the tracks emerging from a reconstructed secondaryvertex; new results with this tag are presented by Snyder.6
2. Lifetime b tagging
Events are divided into hemispheres by the plane perpendicular to the thrust axis, orin the case of aleph by the plane perpendicular to the highest momentum jet. With the\double tag method" both event hemispheres have a chance to be tagged. Two quantities, the
numbers of tagged hemispheres Ns and double-tagged events Nd, are measured, allowing twounknowns, Rb and �b, to be determined:
Ns = 2N(Rb�b +Rc�c +Ruds�uds)
Nd = N [Rb�2
b(1 + �) +Rc�2
c +Ruds�2
uds] (1)
whereN is the number of hadronic events and �b, �c, �uds, are the hemisphere tagging e�ciencies
for the respective quark avors. A correlation parameter � is introduced, because the e�ciencyto tag both hemispheres can di�er from the square of the single tag e�ciency, �db = �2b(1 + �):Compared with event tagging, the double tag method avoids the large systematic uncertaintydue to �b in favor of a smaller systematic uncertainty due to � and an overall statistical
precision limited by the number of double-tagged events Nd.
2.1. Primary vertex reconstruction
At LEP the region of beam overlap or beamspot is about 120 �m in the horizontal
direction, 10 �m in the vertical, and 1 cm along the beams. The Z0 decay point | the primary
vertex | must be reconstructed for each event by augmenting the beamspot constraint withinformation from the tracks in the event.
To do this, delphi and opal begin by �tting a primary vertex using the beamspot and
all tracks compatible with it. The track with the largest ��2 contribution to the overall �2
is examined. If its ��2 exceeds a designated threshold the track is dropped and the �t is
repeated. This process continues until no track contributes a ��2 above the threshold.aleph associates every track with a jet and projects each track into the plane perpen-
dicular to its jet. This procedure removes most of the e�ect of lifetime for tracks originating

from the decay of long-lived particles. A primary vertex is �tted with the projected tracks
and the beamspot. In following iterations, tracks consistent with the �tted primary vertex
also contribute their longitudinal components to the �t. A track is deemed consistent with the
primary vertex if its point of closest approach to its jet along the direction of the jet is behind
the primary vertex.
Using such algorithms, it is possible to reconstruct the Z0 decay point at LEP with a
resolution of about 60 �m in both the horizontal and beam directions.
2.2. Impact parameter signi�cance
aleph and delphi employ lifetime tags based on track impact parameter signi�cance.
The impact parameter is the distance of closest approach in space between a track and the
primary vertex, and it is signed positive (negative) if the point of closest approach between the
track and its associated jet is in front of (behind) the primary vertex. The impact parameter
signi�cance S is the ratio of the signed impact parameter and its error.
Tracks originating from the decay of long-lived particles will tend to have positive impact
parameter signi�cances, whereas tracks originating from the primary vertex will have signi�-
cances of random sign, due to limited resolution. The distribution of track impact parameter
signi�cances is shown in Figure 1. The negative S distribution therefore provides a measure of
the tag's resolution function R. The probability PT that a track originates from the primaryvertex is obtained from the integral over R. Probabilities from tracks with positive S in ahemisphere are combined to form a hemisphere probability PH, which is the tagging variable.
2.3. Decay length signi�cance
opal 's lifetime tag is based on the distance between the primary vertex and a re-
constructed secondary vertex. Using an iterative procedure similar to the one described forprimary vertex �nding, a secondary vertex is �tted for each jet if at least four associatedcharged tracks contribute ��2 < 4 to the �t. The vertex decay length L is the distance fromthe primary to the secondary vertex along the total momentum vector of the tracks assignedto the secondary vertex. It is signed positive (negative) if the secondary vertex is in front of(behind) the primary along the same momentum vector. Like the negative S distribution, the
negative L=�L distribution provides a control sample with which to measure resolution e�ects.The distribution of decay length signi�cances is shown in Figure 2.
δ / σδ
ALEPH
1
10
10 2
10 3
10 4
10 5
-30 -20 -10 0 10 20 30
Figure 1: Track impact parameter signi�-cance distribution for data (points) and sim-
ulation (histogram) from aleph.
Figure 2: Decay length signi�cance distri-bution for data (points) and simulation
(histograms) from opal.

3. Summary of results
The Rb results from LEP using lifetime tags are presented in Figure 3. They are essen-
tially the same as those available at the time of the 1995 summer conferences, when delphi
and opal presented preliminary updates of published results. The only development is that
delphi has �nalized its updates and submitted them for publication.
� aleph's Rb measurement uses an impact parameter signi�cance tag.
� delphi makes three separate Rb measurements, all of which include lifetime information
and two of which rely explicitly on an impact parameter signi�cance tag. The �rst Rb
measurement is procedurally the same as aleph's. The second measurement is from a
mixed tag analysis, where a lepton tag is also used. In this case, a sample of lifetime-
tagged hemispheres is selected. Double-tagged events are those from the sample with a
lepton tag in the opposite hemisphere. The purity of the lepton tag is estimated from
�ts to lepton distributions. Because the double-tagged events are chosen this way, this
measurement is statistically independent from the �rst measurement. delphi's third Rb
measurement is from a multivariate analysis, in which lifetime and event shape variables
are combined to provide tagging criteria; see Martinez-Vidal.5
� opal requires either a decay length signi�cance tag or a lepton tag. Tagging events inthis way provides increased statistics from lifetime-lepton double-tagged events that issimilar to the combination of delphi's lifetime and mixed tag measurements.
Figure 3: Rb measurements performed by the LEP experiments using lifetime tags, with Rc
�xed to its Standard Model value of 0.172. The smaller error bars indicate the statistical
uncertainty and the overall error bars indicate statistical and systematic uncertainties added
in quadrature. Data samples included are given in years. The three individual measurements
contributing to delphi's overall measurement are also shown. The LEP/SLD average, from
Ref. [1], includes an estimate of correlated uncertainties between experiments.
4. Sources of systematic uncertainty
The dominant uncertainties in lifetime tags are due to charm background and hemisphere
correlations. The impact of these uncertainties on Rb is given by:
�Rb
Rb
� �1:5��c
�band
�Rb
Rb
= �� (2)

That is, the uncertainty in � translates directly into a relative error in Rb, whereas the impact
of the uncertainty in �c is relative to the b tagging e�ciency. A performance summary of
lifetime tags (for opal, of the combined lifetime-lepton tag) is given in the following table.
�b �c �uds �
aleph 26 1:18 � 0:15 0:088 � 0:010 �5:7� 0:8
delphi 21 1:67 � 0:15 0:260 � 0:013 �4:8� 0:6
opal 23 1:36 � 0:13 0:103 � 0:016 0:59 � 0:32
4.1. Charm contamination
Uncertainties in estimating �c are listed below. These uncertainties are reviewed by
Calderini.10
� Charmed hadron production fractions. Because the D+ lifetime is long, the relative
production rate of D0 and D+ is important. In the past, the only available measurements
of the relative D0, D+, D�s, and �c rates were from cleo7 and argus8 at
ps = 10:55
GeV. Measurements at LEP have veri�ed that these relative rates apply atps = 91
GeV. This source of uncertainty contributes about 0.0009 to the error on Rb.
� Charmed hadron decay multiplicities. Higher decay multiplicities cause tags more readily,
making uncertainties in topological branching ratios an important source of error. Dmeson decay multiplicities were measured by Mark iii,9 including tracks from K0 ! ��
decay. At LEP K0's are su�ciently boosted to be excluded from secondary vertex orimpact parameter tags, so an additional uncertainty arises from this di�erence. Theuncertainty due to decay multiplicities contributes about 0.0009 to the error on Rb.
� Charmed hadron lifetime and fragmentation uncertainties each contribute about 0.0004to the error on Rb.
4.2. Hemisphere correlations
Several sources can introduce correlations in the tagging e�ciencies between the hemi-spheres. Three general sources of correlation are identi�ed:
� Geometrical correlations. Events tend to be back-to-back, and tracks from both hemi-spheres tend to occupy similar regions of the detector's acceptance, introducing a positive
correlation.
� Event shape correlations. Gluon radiation correlates the momenta of the b and �b quarks,taking energy away from both and increasing the e�ect of multiple scattering. Both hemi-
spheres are then less likely to tag, which introduces a positive correlation. Hard gluon
radiation can force both b's into the same hemisphere, thereby producing a negative
correlation. Uncertainties arising from such QCD e�ects are discussed by Branson.11
� Correlations due to the shared primary vertex. E�ects that tend to in ate or shrink the
primary vertex uncertainty cause correlations, both positive and negative. For example, ahemisphere with a particularly long b hadron decay length tends to o�er fewer tracks for
the primary vertex reconstruction, making its uncertainty greater. While the hemispherewith the long decay length results in a tag, tagging the opposite hemisphere is less likely,
leading to a negative correlation.
Correlations are estimated using Monte Carlo simulation. The Monte Carlo simulation's
ability to reliably calculate a source of correlation is checked against data by studying the
tagging e�ciency as a function of an observable that re ects the correlating e�ect. For example,
using the orientation of the thrust axis to study geometrical e�ects, or the thrust value to study
the e�ects of gluon radiation. To the extent that the hemisphere correlations are due to gross
detector or algorithm e�ects the simulations are believed to be reliable. In practice, correlation
uncertainties are also limited by the Monte Carlo simulation statistics available to set them.
In the LEP/SLD average, the uncertainties due to hemisphere correlations are assumed to be
uncorrelated between experiments.
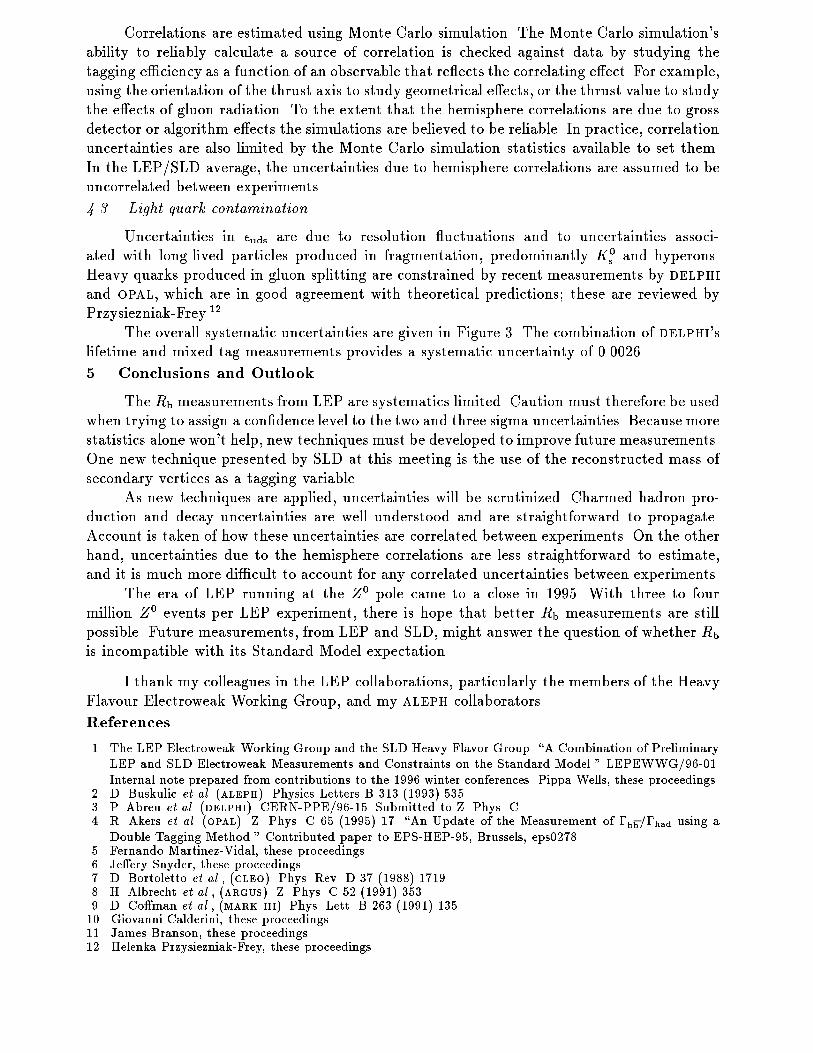
4.3. Light quark contamination
Uncertainties in �uds are due to resolution uctuations and to uncertainties associ-
ated with long-lived particles produced in fragmentation, predominantly K0
s and hyperons.
Heavy quarks produced in gluon splitting are constrained by recent measurements by delphi
and opal, which are in good agreement with theoretical predictions; these are reviewed by
Przysiezniak-Frey.12
The overall systematic uncertainties are given in Figure 3. The combination of delphi's
lifetime and mixed tag measurements provides a systematic uncertainty of 0.0026.
5. Conclusions and Outlook
The Rb measurements from LEP are systematics limited. Caution must therefore be usedwhen trying to assign a con�dence level to the two and three sigma uncertainties. Because morestatistics alone won't help, new techniques must be developed to improve future measurements.One new technique presented by SLD at this meeting is the use of the reconstructed mass of
secondary vertices as a tagging variable.As new techniques are applied, uncertainties will be scrutinized. Charmed hadron pro-
duction and decay uncertainties are well understood and are straightforward to propagate.Account is taken of how these uncertainties are correlated between experiments. On the otherhand, uncertainties due to the hemisphere correlations are less straightforward to estimate,and it is much more di�cult to account for any correlated uncertainties between experiments.
The era of LEP running at the Z0 pole came to a close in 1995. With three to fourmillion Z0 events per LEP experiment, there is hope that better Rb measurements are stillpossible. Future measurements, from LEP and SLD, might answer the question of whether Rb
is incompatible with its Standard Model expectation.
I thank my colleagues in the LEP collaborations, particularly the members of the HeavyFlavour Electroweak Working Group, and my aleph collaborators.
References
1. The LEP Electroweak Working Group and the SLD Heavy Flavor Group. \A Combination of Preliminary
LEP and SLD Electroweak Measurements and Constraints on the Standard Model." LEPEWWG/96-01.
Internal note prepared from contributions to the 1996 winter conferences. Pippa Wells, these proceedings.2. D. Buskulic et al. (aleph). Physics Letters B 313 (1993) 535.3. P. Abreu et al. (delphi). CERN-PPE/96-15. Submitted to Z. Phys. C.4. R. Akers et al. (opal). Z. Phys. C 65 (1995) 17. \An Update of the Measurement of �b�b=�had using a
Double Tagging Method." Contributed paper to EPS-HEP-95, Brussels, eps0278.5. Fernando Martinez-Vidal, these proceedings.6. Je�ery Snyder, these proceedings.7. D. Bortoletto et al., (cleo). Phys. Rev. D 37 (1988) 1719.8. H. Albrecht et al., (argus). Z. Phys. C 52 (1991) 353.9. D. Co�man et al., (mark iii). Phys. Lett. B 263 (1991) 135.10. Giovanni Calderini, these proceedings.11. James Branson, these proceedings.12. Helenka Przysiezniak-Frey, these proceedings.

A High Purity Measurement of Rb at SLD
Je�rey A. SnyderPhysics Dept., Yale University, New Haven, CT 06511, U.S.A.
Representing the SLD Collaboration
ABSTRACT
Precision measurement of Rb can provide important information about the Standard Modeland beyond. SLD has developed a new method for measuring Rb with very high purity. Thismeasurement has the lowest systematic error reported to date and future measurements usingthis method will likely have the lowest total uncertainty.
This paper will be divided into the �ve sections: introduction, hardware, topological ver-texing tag method, results and conclusions. The introduction will discuss the importance ofRb and the problems with other measurement techniques. The hardware section will givea brief description of the SLC/SLD system concentrating on its advantages over LEP. Anoutlook towards the future of SLD Rb measurements will be included in the conclusions.

1 Introduction
The quantity Rb is de�ned as:
Rb ��(Z0
!bb)
�(Z0!hadrons)
(1)
Most of the standard model corrections to the partial widths are common to all quarks andthus cancel in the ratio. Only the b vertex corrections (�vertb ) are signi�cant in Rb; in essence,Rb isolates the b vertex corrections. The largest standard model contribution to �vertb comefrom loops containing top quarks and is hence sensitive to mtop. Many type of new physicshave similar contributions: for example, chargino/stop loops in supersymmetry or chargedHiggs/top loops in the Higgs doublet model. These e�ects are typically 1%, so a very precisemeasurement of Rb along with a precise measurement of the top mass can rule out certaintypes of new physics.1)
2 Hardware
The SLAC Large Detector (SLD) is a large general{purpose detector optimized to work atthe Z0 resonance.2) For this analysis the most important components are the central driftchamber (CDC) and the vertex detector (VXD2). The CDC is a jet{cell drift chamber with 80planes of wires arranged in 10 superlayers of 8 wires each. The hit resolution is approximately100�m in the r� direction. Using charge division, some z information is obtained, but theresolution is poor. The VXD2 is a unique design which uses charge{coupled devices (CCDs)to obtain true 3{d hits rather than using microstrips or crossed strips which can lead to hitconfusion. There are over 100 million pixels in this device | arranged in two logical layers.The hit resolution is about 5�m in all three dimensions.3)
The SLAC Linear Collider (SLC) is a novel type of collider. Both electrons and positronsare accelerated down the same linac, but at the end they are sent into di�erent arcs. Atthe end of the collider arcs the two bunches are travelling directly at one another with theircenter of mass at rest. The bunches collide at the center of SLD and any remnants are directedtoward beam dumps. The beam spot size was (on average) 2:5�m � 0:6�m during the 1994run. The pulse{to{pulse jitter in the interaction point is signi�cantly smaller than this size.
This small and stable beam spot allows us to use the average interaction point (hIPi)position over several Z0 decays to determine the transverse location of a given Z0 decay.This method avoids the misidenti�cation of the primary vertex that would arise if only thatdecay's tracks were used for the interaction point determination. It also reduces the taggingcorrelations due to poor IP measurements, and it makes it easier to understand and simulatethe impact parameter resolutions. The uncertainty in the xy{hIPi position is 7�m for mostevents. The z position of the interaction point must be determined on an event{by{eventbasis, but we can use the xy position in this determination. The uncertainty in the z positionof the IP is estimated to be 38�m.
3 Topological Vertexing Tag Method
The general method for measuring Rb involves several basic steps. First one must obtain apure Z0!qq sample. The standard method is to require a large number of charged tracks andlarge visible energy in the event. Next one must form a tag variable. This variable must beable to remove most non{b decays while still e�ciently tagging b decays. By doing so it also

removes charm and light quark modeling systematics, including correlation with Rc. Thereare several characteristics of B hadrons that are useful for tagging: the B{lifetime is long(� 1:51ps), the B{mass is large (� 5GeV/c2) and the semi{leptonic decay spectrum is hard.
Single (or event) tag methods use the number of events and the number of tagged events tocalculate Rb. In order to do this they rely on Monte Carlo estimates of the tagging e�cienciesfor each quark (�i � N i
tagged=Nitrue). In double (or hemisphere) tag methods the most critical
e�ciency, �b, is measured from the data (�datab ) while the other e�ciencies are estimated fromMonte Carlo. The b{purity of the tag is often denoted as �b � N b
tagged=Nalltagged.
3.1 Disadvantage of Lifetime Tagging Methods
All lifetime{based tagging methods share a common disadvantage: The purity is limited dueto the long lifetime of primary charm events. Simply because of the exponential nature oflifetimes, it is di�cult to improve the purity of a given tag without signi�cant e�ciency loss.The measurements done at the LEP experiments are already systematically limited by residualcharm.4) In addition, SLD's measurement is not more precise despite our better resolutionand precision hIPi advantage.
3.2 Topological Vertexing
Vertices are found by forming a 3{d vertex probability from the overlap of individual trackprobability functions.5) We de�ne D as the distance from the primary vertex (PV) to thedecay vertex, L is the distance along this axis from the PV to the point of closest approach(POCA) for this track, and T is the transverse distance between the track's POCA and thevertex axis. Tracks satisfying L=D > 0:3 & T < 1mm are attached to the most distant vertexfrom the primary vertex. The invariant mass of the tracks forming the vertex can then beused as a tagging variable.
Since there is usually neutral energy missing we attempt to determine this and add it backto the invariant mass. If all the momentum were associated with the vertex, then the directionof the vertex axis would agree with the direction of the vertex momentum. If it does not,then we add back the missing pt to align the two vectors. Because of tracking errors, thereare many cases where the apparent missing pt is very large. We eliminate most of these byminimizing the pt to be consistent with both the vertex and hIPi errors and by limiting the
total mass (M =qM2
raw + jpvt j2+ jpvt j) to be less than twice the raw mass. In many cases the
missing pt is consistent with zero and no mass is added to the vertex.
3.3 Event Selection
In order to separate fully{recorded hadronic events from all others (partially measured hadronicevents, leptonic Z0 events and non{Z0 events) we require several characteristics of each event:For Z0!`+`� rejection, the event must have at least 7 good tracks in CDC and more than18 GeV in charged tracks. Our �ducial acceptance is j cos(�thrust)j < 0:71. To verify that thedetector is in operating condition, we require at least 3 tracks with at least 2 vertex detectorhits and at least 1 track starting at rr� < 39cm. To reduce gluon splitting events we requirethe number of reconstructed jets to be either two or three.
Similarly, we select quality tracks based on many criteria: For the drift chamber (CDC)segment of the track we require j�Zj < 1:5cm, j�r�j < 1:0cm, �2=d:o:f: < 5, pt > 0:4GeV/c,r0 < 40cm, � 40 CDC hits, and j cos �j < 0:80. For the combined track (CDC+VXD) werequire �r� < 250�m, �2=d:o:f: < 5, and j�xyj < 3mm.

3.4 Determining Rb from Double Hemisphere b{Tags
From data one measures the single hemisphere tag fraction and the double tag event fraction:
FS = �bRb + �cRc + �uds(1� Rb � Rc) (2)
FD = �bdoubleRb + �c
doubleRc + �udsdouble(1� Rb � Rc) (3)
where: �i is the hemisphere tagging e�ciency and �idouble is the double hemisphere tagging
e�ciency. The two hemispheres in an event might be correlated. We de�ne the correlationcoe�cient, �, such that:
�double = �2 + (�� �2)� ) � =�double� �2
�� �2(4)
) FD =h�b2 + (�b � �b
2)�biRb + �c
2Rc + �uds2(1� Rb � Rc) (5)
where it is assumed that �c and �uds are negligible.We can solve for �b and Rb:
�datab =FD � Rc�c(�c � �uds)� FS�uds � �bRb(�
datab � [�datab ]2)
FS �Rc(�c � �uds)� �uds(6)
Rb =(FS � Rc(�c � �uds)� �uds)
2
FD � Rc(�c � �uds)2 + �uds2 � 2FS�uds � �bRb(�datab � [�datab ]2)
(7)
These coupled equations can then be solved by initially setting �datab and Rb to zero anditerating until both quantities converge. Note that �b, �c and �uds come from the Monte Carlosimulation while Rc comes from other measurements or the standard model value.
4 Results
Using the 1993|1995 data we �nd 71210 events which pass the selection criteria as hadronicevents. The e�ciencies and b{purity are shown in �gure 1 For a mass cut of 2.0 GeV/c2 wemeasure:
Rb = 0:2176 and �datab = 36:9 � 0:6% (8)
assuming an Rc = 0:171. From the Monte Carlo we expect: �b = 35:9%, �c = 1:06%, �uds =0:07%, and �b = 0:47% which implies �b = 97:2%. The statistical error, �Rb
(stat:) = 0:0033.The systematics are shown in �gure 2. The largest physics systematic contribution comes
from the b{correlation estimate. The many charm systematics also combine to give a largecontribution. The double{tagging essentially eliminates the b{quark systematics. The detectorsystematics are dominated by the uncertainties in the impact resolution z component.
The result is therefore:
Rb = 0:2176 � 0:0033(stat) � 0:0017(sys) � 0:0008(Rc) (9)
5 Conclusions
SLD has successfully used a topological vertex tagging method to measure Rb. By utilizingthe high mass of B mesons a very high purity can be obtained while retaining high e�ciency.This mass tag method relies on the small hIPi provided by the SLC and the precise resolution

96/03/14 01.15
Mass Cut(GeV/c2)
80.784.2
91.197.2
98.2
98.6
52.349.4
43.5
35.9
27.7
19.7
εb
εc
εuds
εb(measured)
Πb
Preliminary
0
0.1
0.2
0.3
0.4
0.5
0.6
0.7
0.8
0.9
1
0 0.5 1 1.5 2 2.5 3
Figure 1: Performance of the mass tag as a function of mass cut.
Mass(GeV/c2)Mass(GeV/c2)Mass(GeV/c2)Mass(GeV/c2)Mass(GeV/c2)Mass(GeV/c2)Mass(GeV/c2)Mass(GeV/c2)
Net Uncertainty (exc. Rc)StatisticsRcPhysics Systematics (exc. Rc)Detector SystematicsCharm Systematic (exc. Rc)Correlation Systematic
Preliminary
∆Rb/
Rb*
100
0
0.5
1
1.5
2
2.5
3
3.5
4
4.5
5
0 0.5 1 1.5 2 2.5 3
Figure 2: Net uncertainty as a function of mass cut.

of SLD's vertex detector. Other experiments may have some di�culty in using this exactmethod.
SLD is scheduled to run for another three years to accumulate half a million more Z0
decays. This additional data will allow the use of harder cuts to further eliminate primarycharm backgrounds. We have also installed an improved vertex detector which should enhanceour b{tagging e�ciency. This will assist in reducing systematics:
� �c term: dRb ' (�2Rc�b
)d�c
� Rc term: dRb ' (�2�c�b)dRc
� �b term: dRb ' (Rb�b)d�b
We also expect that further study of the correlation systematics will allow us to reduce thatuncertainty.
REFERENCES
[1] See e.g.: \Heavy Flavours," J.H. K�uhn and P.M. Zerwas et al. in Z Physics at LEP 1 ,G. Altarelli, R. Kleiss and C. Verzegnassi, eds., CERN Yellow Book 89{08, vol. 1 (1989)267. \High Energy Tests of the Electroweak Standard Model," M. Swartz, presented at theXVIth Inter. Symp. on Lepton{Photon Interactions, Ithaca, NY, August 1993. \Estimationof Oblique Electroweak Corrections," M.E. Peskin and T. Takeuchi, Phys. Rev. D46 (1992)381.[2] \The SLD Design Report," SLAC{Report{273, 1984 (unpublished).[3] \Design and Performance of the SLD Vertex Detector, a 120 MPixel Tracking System,"G.D. Agnew et al., Proc. of the XXVIth Inter. Conf. on High Energy Physics, Dallas, TX,August 1992, p. 1862.[4] A. Bazarko, these proceedings.[5] \ZVTOP | A Topological Vertex Finding Algorithm for Hadronic Jets," D. Jackson, tobe submitted to Nucl. Inst. Meth.

MEASUREMENT OF Rb = �b�b=�had USING LEPTONS, EVENT SHAPE
AND MULTIVARIATE TAGS AT LEP
F. Mart��nez-Vidal
IFIC, Centro Mixto Univ. of Valencia { CSIC,
Avda. Dr. Moliner 50, E{46100 Burjassot (Valencia), Spain
Abstract
The partial decay width of the Z to bb quark pairs has been precisely measured by the LEP collab-
orations using methods based on lifetime tags. In this paper, alternative measurements using lepton,
event shape and multivariate tags are presented and the combined results are compared with the
lifetime tagging measurements. The accuracy of lifetime measurements is actually dominated by sys-
tematics. Any improvement in precision requires better external knowledge of the charm and light
quark physics a�ecting Rb . However, analyses combining leptons, event shape and lifetime informa-
tion have not the same limitations in systematic errors and the statistics of analyzed events is still
partial. Therefore including the high global LEP statistics, such alternative analyses are promising
and interesting improvements in precision on Rb can be reached.

1 Introduction
In the Standard Model, the decay Z! b�b di�ers from other hadronic Z decays because of the existence
of �nal state electroweak interactions involving the top quark. The e�ect of these vertex corrections
can be isolated in the Rb = �b�b=�had ratio, independently of other theoretical uncertainties due to the
strong coupling constant, Higgs mass, higher order corrections in the Z propagator (oblique corrections)
and in the vertex due to light quark loops, which basically cancel in the ratio. Thus, the value of
Rb can be used to infer the top mass through these vertex corrections in the Minimal Standard Model1). As the top quark discovery has recently been reported by the CDF and D0 collaborations and its
mass measured 2), the theoretical prediction of Rb is very precise. Therefore it is extremely important
to study experimentally the top quark mass e�ect, since it provides a privileged tool to reveal virtual
e�ects of new physics 3). However, it requires a high precision measurement better than 0.5%. The
latest Rb LEP average value is 0.75% precise and disagrees about 3 standard deviations from the
Standard Model prediction 4).
The precise Rb measurement is experimentally di�cult mainly because quarks can not be observed
as such. One can consider that the task of b-tagging is twofold. On one hand, one is interested in
having as pure and e�cient as possible b quark subsamples. On the other hand, one is interested in
having a classi�er for which the e�ciencies are well known. So far, the most precise results are obtained
from double lifetime tag analyses, as described in detail by A. O. Bazarko 5). In this kind of analyses
the b-tagging performaces are powerful (typically of 35% e�ciency for 90% purity) and the e�ciency is
measured directly from data obtaining a good statistical accuracy combined with a reduced systematic
error. However, contaminations of non-b avours and hemisphere correlations (including vertex-vertex
and lepton-vertex from mixed tags) are estimated from simulation. Hemisphere correlations are small
(in the range from 0 to 2%, depending on the value of the cut). The corresponding systematic errors
are also small and basically dominated by statistical e�ects inside each experiment. So, it seems
that they are well under control 1. However, backgrounds are relatively large, specially from charm
events. The consequence is that Rb is quite sensitive to Monte Carlo inputs from the charm sector
whose values, coming mainly from low energy data, have still large incertainties and rather unstable
central values with time 7). Moreover, as the inputs are common, the systematic uncertainties are
correlated between individual experiments and they are di�cult to reduce when combining them.
Finally, another important problem of these analyses is the large correlation with the Rc parameter
(about -35%) which means that the �nal Rb value depends strongly on the assumed value of Rc .
Therefore, to resolve the question of whether the Rb deviation is real, it is strongly required to
wait more reliable and �ne measurements of low energy data and to use alternative analyses measuring
Rb as independently as possible from all previously mentioned sources of systematics. They may be
a�ected by other kind of systematics, but in the combination with other results the total error can be
reduced. This paper reviews such alternative LEP analyses. First, in section 2 we shall describe how
Rb is extracted from lepton tagging. Section 3 reviews the event shape analyses from ALEPH and L3
and section 4 describes the DELPHI multivariate analysis, which combines event shape and lifetime
information to tag b quarks. Finally, in section 5 we present the conclusions. All results presented in
this review have been published and references are given in the corresponding sections.
2 Rb from global lepton �ts
Lepton tagging relies on heavy quark semileptonic decays. Due to the hard fragmentation of heavy
quarks and their high mass, the b semileptonic decay will produce leptons with a high momentum
(p) and a high momentum transverse (p?) to the jet axis (which is used as an estimator of the heavy
quark direction). As it is shown in �gure 1, the lepton momentum distributions for b and c quarks
are rather similar, but the transverse momentum distribution from c decays is softer than that from b
quark decays, allowing a separation between bb and cc events. The upper limit of b-tagging e�ciency
1May be the only e�ect not so well understood is the gluon radiation 6).

is twice the b semileptonic decay ratio (about 10% for e and � separately). Momentum cuts and
identi�cation e�ciencies for inclusive leptons and muons lowers the limit to below 10% for about 90%
purity.
0
2000
4000
6000
8000
10000
12000
14000
5 7.5 10 12.5 15 17.5 20 22.5 25 27.5
b→l
b→c→l
c→l
X→l
MIS
DATA
ALEPH
ALEPH
(a)
(b)
P (GeV/c)
Even
ts /
GeV
/c
0
2000
4000
6000
8000
10000
0.5 1 1.5 2 2.5 3 3.5 4 4.5 5
P⊥ (GeV/c)
Even
ts /
0.2
GeV
/c
Figure 1: (a) Momentum and (b) momentum transverse to the jet axis for identi�ed leptons (e and � in hadronicZ decays). All lepton candidate sources taken from simulation are indicated.
The number of prompt leptons in a sample of hadronic events is determined by the products
Rb Br(b! `), Rb Br(b! c! `)and Rc Br(c! `). The individual factors in the products can be
isolated by a simultaneous consideration of the (p; p?) spectrum of single and dilepton events. Such
maximum likehood �ts are performed by all four LEP collaborations. By extending the �t to include
the cos� variation of the number of single and dilepton events, AbFB, A
cFB can in principle be measured.
As the momentum spectrum of the leptons is strongly a�ected by the heavy quark fragmentation, the
parameters hxE(c)iand hxE(b)ican be extracted from these �ts within the framework of a particular
fragmentation model. Finally, the average b mixing parameter �� can also be obtained. The choice
of exactly which of these nine heavy avour parameters have to be measured and which need to be
taken from external sources is a balance between statistics and systematics. Only ALEPH performs a
global �t with all nine quantities. DELPHI �xes hxE(c)i, AbFB and Ac
FB from external measurements
and OPAL �xes additionally Rc . From the (p; p?) spectrum, L3 measures Rb and Br(b! `).
The results obtained by the four LEP collaborations are published in reference 8) and summarized
in table 1. Uncorrelated errors between experiments arise from knowledge of lepton identi�cation
e�ciencies and the contamination by instrumental backgrounds. Correlated errors come from semilep-
tonic decay model, semileptonic branching ratios and b and c fragmentation model. Parameters which
are �tted do not contribute with systematic uncertainties. The small number of dilepton events limits
the statistical error. However, the results have a di�erent systematics from the lifetime measurements
and therefore help to reduce the systematic error in overall LEP averages.
3 Event shape analyses from ALEPH and L3
The high mass and hard fragmentation of the b quark can be exploited by another separation technique,
with no restriction to any particular decay mode. Little energy is lost by gluon radiation in the
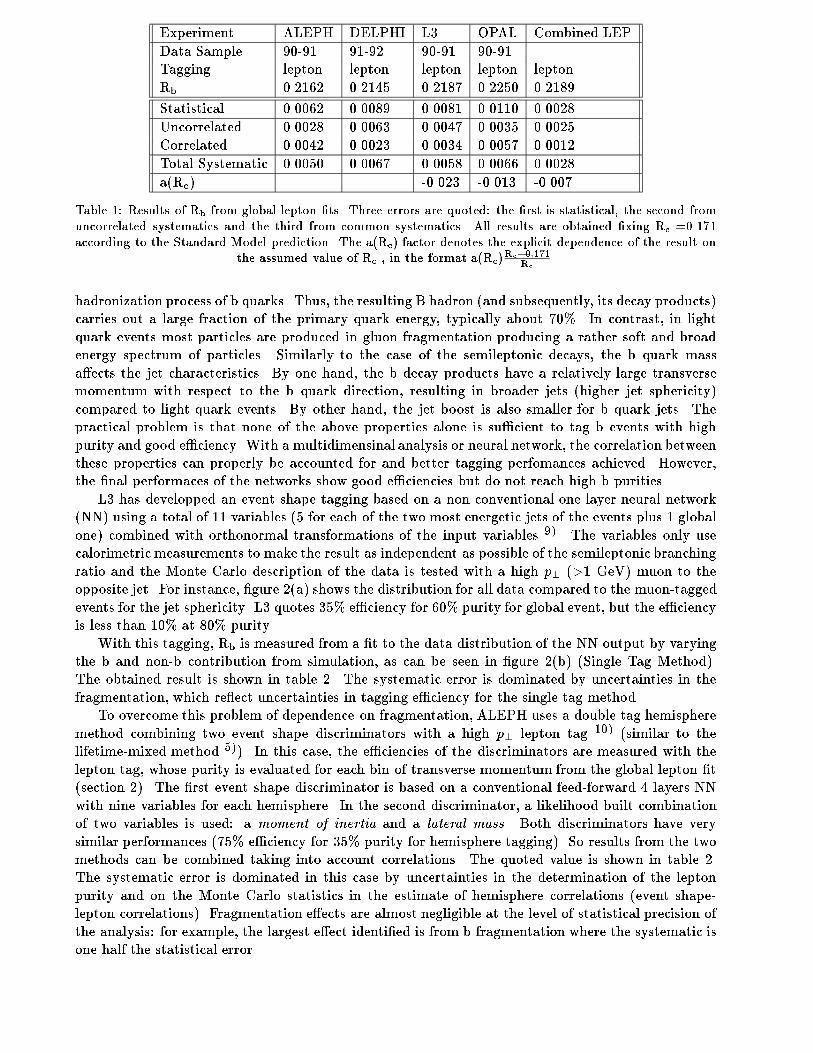
Experiment ALEPH DELPHI L3 OPAL Combined LEP
Data Sample 90-91 91-92 90-91 90-91
Tagging lepton lepton lepton lepton lepton
Rb 0.2162 0.2145 0.2187 0.2250 0.2189
Statistical 0.0062 0.0089 0.0081 0.0110 0.0028
Uncorrelated 0.0028 0.0063 0.0047 0.0035 0.0025
Correlated 0.0042 0.0023 0.0034 0.0057 0.0012
Total Systematic 0.0050 0.0067 0.0058 0.0066 0.0028
a(Rc) -0.023 -0.013 -0.007
Table 1: Results of Rb from global lepton �ts. Three errors are quoted: the �rst is statistical, the second fromuncorrelated systematics and the third from common systematics. All results are obtained �xing Rc =0.171according to the Standard Model prediction. The a(Rc) factor denotes the explicit dependence of the result on
the assumed value of Rc , in the format a(Rc)Rc�0:171
Rc
.
hadronization process of b quarks. Thus, the resulting B hadron (and subsequently, its decay products)
carries out a large fraction of the primary quark energy, typically about 70%. In contrast, in light
quark events most particles are produced in gluon fragmentation producing a rather soft and broad
energy spectrum of particles. Similarly to the case of the semileptonic decays, the b quark mass
a�ects the jet characteristics. By one hand, the b decay products have a relatively large transverse
momentum with respect to the b quark direction, resulting in broader jets (higher jet sphericity)
compared to light quark events. By other hand, the jet boost is also smaller for b quark jets. The
practical problem is that none of the above properties alone is su�cient to tag b events with high
purity and good e�ciency. With a multidimensinal analysis or neural network, the correlation between
these properties can properly be accounted for and better tagging perfomances achieved. However,
the �nal performaces of the networks show good e�ciencies but do not reach high b purities.
L3 has developped an event shape tagging based on a non conventional one layer neural network
(NN) using a total of 11 variables (5 for each of the two most energetic jets of the events plus 1 global
one) combined with orthonormal transformations of the input variables 9). The variables only use
calorimetric measurements to make the result as independent as possible of the semileptonic branching
ratio and the Monte Carlo description of the data is tested with a high p? (>1 GeV) muon to the
opposite jet. For instance, �gure 2(a) shows the distribution for all data compared to the muon-tagged
events for the jet sphericity. L3 quotes 35% e�ciency for 60% purity for global event, but the e�ciency
is less than 10% at 80% purity.
With this tagging, Rb is measured from a �t to the data distribution of the NN output by varying
the b and non-b contribution from simulation, as can be seen in �gure 2(b) (Single Tag Method).
The obtained result is shown in table 2. The systematic error is dominated by uncertainties in the
fragmentation, which re ect uncertainties in tagging e�ciency for the single tag method.
To overcome this problem of dependence on fragmentation, ALEPH uses a double tag hemisphere
method combining two event shape discriminators with a high p? lepton tag 10) (similar to the
lifetime-mixed method 5)). In this case, the e�ciencies of the discriminators are measured with the
lepton tag, whose purity is evaluated for each bin of transverse momentum from the global lepton �t
(section 2). The �rst event shape discriminator is based on a conventional feed-forward 4 layers NN
with nine variables for each hemisphere. In the second discriminator, a likelihood built combination
of two variables is used: a moment of inertia and a lateral mass. Both discriminators have very
similar performances (75% e�ciency for 35% purity for hemisphere tagging). So results from the two
methods can be combined taking into account correlations. The quoted value is shown in table 2.
The systematic error is dominated in this case by uncertainties in the determination of the lepton
purity and on the Monte Carlo statistics in the estimate of hemisphere correlations (event shape-
lepton correlations). Fragmentation e�ects are almost negligible at the level of statistical precision of
the analysis: for example, the largest e�ect identi�ed is from b fragmentation where the systematic is
one half the statistical error.

0
0.01
0.02
0.03
0.04
0.05
0.06
0 0.2 0.4 0.6 0.8 1
Sdir (Jet)
Data allData, jet opposite µ jetMC, jet opposite µ jet
Fra
ctio
n of
Eve
nts
(a)
0
1000
2000
3000
4000
5000
0 0.2 0.4 0.6 0.8 1
DataFitted MC totalFitted MC bFitted MC non-b
Fc
Num
ber
of E
vent
s
(b)
Figure 2: (a) Jet sphericity distribution for all jets compared to the muon-tagged sample in the L3 neuralnetwork. (b) Fit of the network response to the data. Also shown is the response for b and non-b events
separately.
Experiment ALEPH L3 Combined LEP
Data Sample 90-91 91
Tagging shape shape shape
Rb 0.2279 0.2220 0.2249
Statistical 0.0054 0.0030 0.0034
Uncorrelated 0.0036 0.0053 0.0035
Correlated 0.0032 0.0036 0.0034
Total Systematic 0.0048 0.0064 0.0049
a(Rc) -0.004 -0.021 -0.013
Table 2: Results of Rb from event shape analyses at LEP. Uncertainties from fragmentation are taken ascorrelated systematics.
4 The DELPHI multivariate analysis
In the double lifetime tag analyses, hemispheres are tagged as b and non-b. This leads to two equations
with six unknowns: Rb , Rc , three avour tagging e�ciencies (uds, c and b) and the b hemisphere
tag correlation. To obtain Rb and the b e�ciency from data, Rc has to be �xed to the Standard
Model value or external measurements. The background e�ciencies and the correlation have to be
taken from simulation. If the number of equations for physical observables were larger than the
number of unknowns, the latter could be extracted directly from the data, and the simulation would
be required only to estimate systematic errors and the in uence of hemisphere correlations, reducing
the dependence on simulation to a very small level. That is the principle of DELPHI multivariate
analysis 11). Also and contrary to all other analyses, a primary vertex is computed on each side to
reduce as much as possible the correlation between opposite hemispheres.
To provide the physical observables, a classical multivariate analysis technique based on avour
likelihood estimators (Luds, Lc and Lb) is used12). The total number of variables is thirteen and
they combine lifetime and event shape information. According to a classi�cation criteria (which is
called winning margin � and which is de�ned as the di�erence between the maximum and the second
avour likelihood), each hemisphere is classi�ed between six exclusive tagging categories ordered by
increasing b purity (uds-tight, uds-loose, charm, b-loose, b-medium and b-tight). There are 21 di�erent
observables (combinations of two hemispheres tags) and 17 independent unknowns: Rb , Rc and
15 uds, c and b tagging e�ciencies. The direct �t of this double tag matrix is degenerated. The

degeneracy in the b sector can be removed if two or more estimates of the six b e�ciencies are found
and injected in the �t of the double tag matrix 12). These estimates are obtained from the fraction
of hemispheres tagged in one of the previously de�ned categories, while the opposite hemisphere is
tagged as b with a given value of winning margin. The property of these category fractions is that
their asymptotic values provide an estimate of the corresponding b e�ciencies. In practice, a global
least square �t is performed to the double tag matrix and to the six winning margin distributions.
The only assumption of the analysis is a parameterization of the background for the distributions and
a reasonable b purity in the region of hard cuts. Figure 3 shows these distributions together with their
�ts. E�ects of remaining backgrounds are small and are included in the systematic uncertainties. In
this way all tagging e�ciencies and backgrounds are �nally derived from the data and the simulation
is only required to estimate systematic errors on the asumptions of the method and the in uence of
hemisphere correlations. Moreover, it can be shown that Rc has no explicit in ucence on Rb and only
remains a residual Rc dependence due to backgrounds.
DELPHI
10-4
10-3
10-2
10-1
0 5 10 15 20
Winning margin ∆
Fra
ctio
n ud
s-tig
ht
10-4
10-3
10-2
10-1
0 5 10 15 20
Winning margin ∆
Fra
ctio
n ud
s-lo
ose
10-3
10-2
10-1
0 5 10 15 20
Winning margin ∆
Fra
ctio
n ch
arm
10-3
10-2
10-1
0 5 10 15 20
Winning margin ∆
Fra
ctio
n b-
loos
e
10-3
10-2
10-1
0 5 10 15 20
Winning margin ∆
Fra
ctio
n b-
med
ium
10-3
10-2
10-1
0 5 10 15 20
Winning margin ∆
Fra
ctio
n b-
tight
Figure 3: Distributions of the fraction of events tagged as b in one hemisphere with a given value of winningmargin, that are classi�ed in one of the de�ned categories in the other hemisphere. The dashed lines show the be�ciencies �tted from the data. The distributions for simulation are also shown, together with the contributionsof uds, c and b quarks. To show the small backgrounds in the region of hard cuts, the vertical scale on each
plot goes down to one per mil of the e�ciency.
The quoted result using the 1991 to 1993 data set is shown in table 3 11). The total error is
dominated by statistics. The systematic error is also largely dominated by Monte Carlo statistics
(0.0020) with two main contributions: hemisphere correlations (the number of correlation coe�cients
is rather large) and analysis method, which includes the asumption of asymptotic purity and the back-
ground parameterization for the winning margin distributions. The correlated errors with the lifetime
measurements, i.e. charm and light quark systematics and gluon radiation, which dominate there the
total error, are in this case almost negligible (0.0008). Fragmentation e�ects are also negligible.

5 Conclusions
The results of lifetime, leptons, event shape and multivariate tags (event shape+lifetime) from LEP,
and their most recent average are summarized and compared in table 3.
Tagging lifetime leptons shape DELPHI multivariate Combined LEP
Rb 0.2201 0.2189 0.2249 0.2194 0.2203
Statistical 0.0010 0.0028 0.0034 0.0032 0.0009
Uncorrelated 0.0009 0.0025 0.0035 0.0020 0.0008
Correlated 0.0016 0.0012 0.0034 0.0008 0.0011
Total Systematic 0.0019 0.0028 0.0049 0.0022 0.0014
a(Rc) -0.017 -0.007 -0.013 -0.005
Table 3: Summary of all Rb measurements at LEP considering each method separately. All results are obtained�xing Rc =0.171 according to the Standard Model prediction.
From this table several conclusions can be extracted. First, lifetime measurements give the best
statistical accuracy but they are seriously limited by systematics which are correlated between exper-
iments. This systematics can not be reduced without signi�cant improvements in the external inputs
for charm and light quark physics a�ecting the measurement of Rb7). Second, lepton and event shape
measurements are more statistically limited but help in the average because they are almost uncorre-
lated with the lifetime measurements. Third, the DELPHI multivariate analysis has low systematics
(which can be reduced because it comes mainly from simulation statistics) compared to the lifetime
analyses. The systematics is di�erent and therefore uncorrelated. The statistical precision is poorer,
but appears to be almost uncorrelated. The dependence with Rc about four times smaller.
After correction taking into account photon exchange, the LEP average is R0b = 0:2206�0:0009(stat)�
0:0014(syst), where Rc is �xed to the Standard Model prediction of 0.171 and its correlation is -35%.
The current precision is 0.75% and the central value is about three standard deviations higher than
the Standard Model prediction of R0b = 0:2155� 0:0005 computed with the ZFITTER program 13)
for top quark massmt = 180� 12 GeV/c2 2). Errors from lifetime measurements will become di�cult
to go any further without better external inputs for charm and light quark physics a�ecting Rb7).
Alternative high statistics analyses combining event shape and lifetime information (as the DELPHI
multivariate) are promising and interesting improvements in precision can be reached.
Acknowledgements
I would like to thank to the Organization of the XXIIIst Rencontres de Moriond for the warmful
and fruitful atmosphere of the Conference. My very special thanks to Christian de la Vaissi�ere by its
decisive work with me, its continous encouragement and help in the preparation this review. Thanks
to K. Moenig by providing me with the average results presented here and T. Baroncelli for his useful
comments when preparing my talk.
References
1. A.A. Akhundov, D.Yu. Bardin, T. Riemann, Nucl. Phys. B276 (1986) 1.
J. Bernabeu, A. Pich, A. Santamaria, Phys. Lett. B200 (1988) 569.
J. Bernabeu, A. Pich, A. Santamaria, Nucl. Phys. B363 (1991) 326.
A. Denner, W. Hollik, B. Lampe, Z. Phys. C60 (1993) 193.
2. F. Abe et al. (CDF Collaboration), FERMILAB-PUB-95/022-E.
S. Abachi et al. (D0 Collaboration), FERMILAB-PUB-95/028-E.
3. A. Djouadi et al., Nucl. Phys. B349 (1991) 48.
R. Sekhar Chivukula, BUHEP-94-22, hep-ph/9409233.

P. Chiappetta, these proceedings.
P. Chankowski, these proceedings.
4. The LEP Collaborations ALEPH, DELPHI, L3, OPAL and The Electroweak Working Group,
CERN{PPE/95{172, 24 November 1995.
P.S. Wells, these proceedings.
5. A.O. Bazarko, these proceedings.
6. J.G. Branson, these proceedings.
7. G. Calderini, these proceedings.
8. D. Buskulic et al. (ALEPH Collaboration), Z. Phys. C62 (1994) 179.
P. Abreu et al. (DELPHI Collaboration), Z. Phys. C66 (1995) 323.
L3 Collaboration, L3 results on Rb and Br(b! `)for the Glasgow Conference, L3 Note 1625.
R. Akers et al. (OPAL Collaboration), Z. Phys. C60 (1993) 199.
9. O. Adriani et al. (L3 Collaboration), Phys. Lett. B307 (1993) 237.
10. D. Buskulic et al. (ALEPH Collaboration), Phys. Lett. B313 (1993) 549.
11. P. Abreu et al. (DELPHI Collaboration), Z. Phys. C65 (1995) 555.
P. Abreu et al., CERN{PPE/96{15, 30 January 1996. To be appear in Z. Phys. C.
12. P. Billoir et al. NIM A 360 (1995) 532-558.
13. D. Bardin et al., CERN-TH 6443/92.

Is our Knowledge of the Charm Sector
Correct?
Giovanni Calderini
Scuola Normale Superiore and INFN, Pisa, Italy
On behalf of the ALEPH, DELPHI, L3 and OPAL Collaborations
Abstract
A lot of techniques are used to measure Rb =�(Z!bb)
�(Z!qq)and they involve di�erent
sources of systematic errors. Nevertheless, charm sector knowledge is one of the largest
limitations to Rb accuracy apart from the particular method used.
Some of the most important techniques to extract Rb are examined, and for each of
them the largest sources of uncertainties coming from the charm sector are reviewed.
New recent results from the charm physics are reported, and their incidence on Rb sys-
tematics is discussed.

1 Introduction
Several methods have been recently used to measure Rb =�(Z!bb)
�(Z!qq), and some of them have
also been combined. Each technique involves di�erent sources of systematic errors, but the
uncertainty due to the charm sector knowledge is one of the critical ones for all the di�er-
ent methods. A few measurements by several experiments are taken into consideration, and
for each one the relevant systematic uncertainties from the charm sector are examined. The
improvements expected due to recent results from charm physics are also discussed.
2 Di�erent Methods to Extract Rb
The selection of bb events can be obtained using several tags, which are based on the di�erent
properties of heavy avour events with respect to the light quark ones and to the discrepancies
that bb events present from the residual cc decays. The competitivity of these tags has changed
with time, owing to the constant development of detectors. For this reason, the techniques
applied a few years ago have been generally replaced by new ones, which are more appropriate
to exploit the improved detector performances.
2.1 Lifetime Tag
This is at present the most e�cient tag to select bb events. It has become possible due to the
excellent tracking performance of new vertex silicon detectors.
A probability PH that all the tracks in the event come from the primary vertex is built. A
cut on this variable allows a selection of bb events with a low cc background (Fig. 1). This
ALEPH
Figure 1: Performance of cut in PH for bb event seection
technique is sometimes replaced by looking for secondary vertices far from the interaction point.
From a comparison between the number of events in which both hemispheres are tagged and
the number of the single tagged events, the e�ciency of b-tag can be extracted directly from
data; for this reason the method is basically insensitive to all the systematics from b sector.
This kind of analysis has been studied by several experiments [1, 2, 3, 4] and many sources
of systematic uncertainties have been quoted by each of them (Tab. 1). As a matter of fact,

ALEPH [1] DELPHI [2] OPAL [3] SLD [4]
c prod. fractions 0.0009 0.0016 0.0009 0.0013
c decay mult. 0.0006 0.0010 0.0010 0.0018
c lifetimes 0.0005 0.0006 0.0004 0.0003
c fragmentation 0.0001 0.0005 0.0008 0.0012
gluon splitting 0.0003 0.0003 0.0005 0.0004
uds background 0.0002 0.0006 0.0003 0.0001
Total Syst. 0.0014 0.0023 0.0017 0.0025
Table 1: Sources of systematic errors on Rb related to the charm physics for lifetime-tag analyses
by di�erent experiments
the largest ones for this kind of tag are the c production and the decay multiplicity for charmed
hadrons.
2.1.1 Charm production rates
At present, the LEP working group takes the input values for c-production rates from low
energy experiments. An implicit assumption underlies this procedure, the charm production
must be the same at low energies as at LEP. The validity of this hypothesis will be discussed
in the following. The values used from CLEO [5] and ARGUS [6] are quoted in Tab. 2.
More recently, LEP experiments too have provided measurements of rates for charm pro-
duction. The general strategy for these analyses is to isolate a sample of events containing a
candidate D. A two-component �t is performed to the D momentum distribution in order to
extract simultaneously (b! D) and (c! D) contributions (Fig. 2).
Values for charm production provided by LEP experiments with this type of method are
collected and summarized in Tab. 2.
Error source Value and Range (Low. Energy) New values from LEP
D0 fraction in cc events 0:557 � 0:053 0:583 � 0:035 PRELIM.
D+ fraction in 0:248 � 0:037 0:233 � 0:024 PRELIM.
Ds fraction 0:12 � 0:05 0:097 � 0:022 PRELIM.
�c fraction 0:08 � 0:05 0:076 � 0:033 PRELIM.
Table 2: Rates for charmed meson production in cc events from low-energy experiments used
as input for Rb measurement, compared with the recent LEP results
There is a very good agreement between LEP numbers and low-energy ones and this is a
con�rmation of our initial assumption. The charm production is substantially the same at LEP
and low energy experiments, where seems to be no signi�cative suppression for the heaviest
charm states. A second comment for the LEP values is that the present accuracies seem to be
very good and fully competitive with the CLEO/ARGUS results. For this reason, in the next
future, a good gain could be reached in Rb measurement using as input for charm production
values an average of low energy and LEP results.
In a simultaneous �t anyway the two components (b! D) and (c! D) are anti-correlated.
For this reason an important check of this measurements can be provided by a recent ALEPH

0
0.005
0.01
0.015
0.02
0.025
0.03
0.035
0.04
0.045
0.05
0 0.1 0.2 0.3 0.4 0.5 0.6 0.7 0.8 0.9 1
XE(D0)
1/N
(Zh)
dN
(D0 →
Kπ)
/dX
E
DELPHID0→Kπ
total
b b-
xE
1/N
ha
d d
N/d
x
xE
1/N
ha
d d
N/d
x
xE
1/N
ha
d d
N/d
x
a) Prompt D+
b) b → D+ X
c) Total D+
OPAL simulation
0
0.005
0.01
0.015
0.2 0.3 0.4 0.5 0.6 0.7 0.8 0.9 1
0
0.005
0.01
0.015
0.2 0.3 0.4 0.5 0.6 0.7 0.8 0.9 1
0
0.01
0.02
0.2 0.3 0.4 0.5 0.6 0.7 0.8 0.9 1
Figure 2: Examples of �t to distributions of D candidates to extract (b ! D) and (c ! D)
contributions

analysis. It is possible to restrict to a very pure bb sample of events in order to be insensitive
to D production from charm. The D invariant mass distribution is �tted to compute the D
production rate in bb events. This technique requires a careful study of background sources,
since they are often resonant in the D mass region. This ALEPH measurement, with the
addition of simple assumptions on J and �c production allows also a new estimation for nc(Tab. 3).
Experiment Measure in % Er. stat. Err. BR Er. sys.
ALEPH (PRELIM.) f(b! D0X) = 57:3 2.4 2.0 1.8
ALEPH (PRELIM.) f(b! D+X) = 21:3 1.3 1.4 1.2
ALEPH (PRELIM.) f(b! DsX) = 18:8 2.2 2.2 1.4
ALEPH (PRELIM.) f(b! �cX) = 12:0 3.5 1.6 0.8
ALEPH + CLEO f(b! �cX) = 7:2 - - 3.2
CLEO f(b! charm:) = 1:8(�2) 0.3 - �1:00:
Total nc = 1:202 0.049 0.036 �0:0420:043
Table 3: D production rate in bb events from ALEPH, leading to a preliminary nc estimation
In conclusion, the present knowledge of charm production rates seems generally satisfying.
There are several papers published by di�erent experiments, which allow averages and cross-
checks. A further improvement will be achieved when LEP measurements will be o�cially
added to the input values in Rb analyses.
2.1.2 Charged Multiplicity
Apart from charm production, the second large source of systematic errors on Rb coming from
the charm sector, is the decay multiplicity. At present there is only one measurement (MARK
III) [7] of the average number of tracks coming from theD�,D0 and Ds decays. The uncertainty
in Rb due to charm decay multiplicity is computed as the sum in quadrature of the separate
uncertainties from di�erent D mesons, weighted by their relative contributions. The average
D decay multiplicity quoted by MARK III is
nch = 2:56� 0:06
Unluckily this is the only measurement available for nch. Moreover its worth as an input in
Rb analyses is a�ected by the additional problem that it is missing of �c contribution. There's
also a problem of de�nition, since in most of Rb analyses the charged pions from Ks are not
taken into the track counting, while in MARK III analysis they are considered in extracting
the D decay multiplicity. For this reason, an additional uncertainty is quoted by the Rb LEP
working group, on the basis of the known fraction of Ks production in D decays [8]
BR(D ! KsX) = (46 � 6)%
A general remark can be done. While in the case of charm production rate, the scenario
seems satisfying, for charge multiplicity the bibliography is not so rich. There is jut one
measurement available and substantially the information which we obtain from this requires
some attention, due to the use of di�erent de�nitions with respect to most Rb analyses. LEP
seems to be somehow missing for this kind of study.

2.2 Lepton Tag
This tag was the �rst in time to be developed. It is essentially based on cuts on momentum and
transverse momentum of leptons with respect to the jet axis to which they belong. The high
mass of the heavy quarks and their hard fragmentation functions lead to the leptons having a
hard momentum spectrum and a large momentum component transverse to the heavy hadron
direction. The transverse momentum is typically smaller for c decays than for b decays, allowing
the two to be separated on a statistical basis. At present, this tag is much less performant than
the lifetime tag and for this reason it is often used in combination with the latter. For this
b-tagging technique, the main source of systematic error due to charm sector is the BR(c! l).
This quantity has not yet been measured at LEP, partly because the leptons originating from
c! l decays have a substantial overlap in their momentum distribution with lepton candidates
from other sources. Measurements of BR(c! l) have been made in the continuum below the
�(4s) at ARGUS [9], where no b pairs are produced. There are also measurements made at
PEP and PETRA [10]. The average result for this branching ratio is:
BR(c! l) = (9:8� 0:5)%
Anyway this type of tag is becoming less and less competitive with respect to the lifetime tag,
so that the impact of this systematics on the Rb accuracy is much more reduced.
2.3 Conclusions
It appears that for Rb purposes, our knowledge of the charm sector is acceptable, but there is
still some weak spot due essentially to measurements done by a single experiment. Apart from
this we should note that LEP numbers in the charm sector get more and more competitive and
a good gain is foreseen when this results will be o�cial included into the averages used for Rb.
References
[1] D. Buskulic et al., ALEPH Collaboration, Phys. Lett. B313 (1993) 237.
[2] P. Abreu et al., DELPHI Collaboration, \Measurement of the partial decay width Rb =�(Z!bb)
�(Z!qq)with the DELPHI detector at LEP", CERN-PPE/96-015.
[3] R. Akers et al., OPAL Collaboration, Z. Phys. C65 (1995) 17.
[4] SLD Collaboration, \Measurement of Rb at SLD", Talk presented by Erez Etzion at
Moriond QCD, 1996.
[5] D. Bortoletto et al., CLEO Collaboration, Phys. Rew. D37 (1988) 1719.
[6] H. Albrecht et al., ARGUS Collaboration, Z. Phys. C52 (1991) 353.
[7] D. Co�man et al., MARK III Collaboration, Phys. Lett. B263 (1991) 135.
[8] Particle Data Group, Phys. Rev. D45 (1992).
[9] H. Albrecht et al., ARGUS Collaboration, Phys. Lett. B278 (1992) 202.
[10] T. Pal et al., DELCO Collaboration, Phys. Rev. D33 (1986) 2708;
W. Bartel et al., JADE Collaboration, Z. Phys. C33 (1987) 339;
R. A. Ong et al., MARK II Collaboration, Phys Rev. Lett. 60 (1988) 2587.

.
Rc MEASUREMENTS AT LEP
J�erome BAUDOTCERN, CH-1211 Geneva 23, Switzerland
representing the LEP collaborations
abstract
The partial width Rc = �(Z!cc)
�(Z!qq)is a basic observable in Z physics. Within the
Standard Model its value is accurately predicted and other experimental measurementsat LEP involve its knowledge. The DELPHI and OPAL collaborations have presentedseveral Rc measurements. All methods are based on charmed hadron reconstructionand b=c separation. The LEP average, computed by the LEP Electroweak Heavy FlavorWorking Group, is presented to be 0:1596�0:0074. This is 1:8 standard deviation belowthe Standard Model expectation.
1

1. INTRODUCTION
Rc is de�ned as the partial width �(Z!cc)
�(Z!qq). Contrary to Rb, its prediction in the Standard
Model does not involve large radiative correction. In particular the Rc value is not very sensitiveto the top quark or Higgs boson mass. Making a precise Rc measurement is therefore both agood test of Standard Model and an usefull input for other related heavy avour measurements,like Rb. It improves the knowledge of the charm sector at LEP.
All recent Rc measurements at LEP are based on the determination of cross section ofcharmed hadrons in cc events. Older measurements using leptons have been already published1)
and will not be reviewed here. First single charmed hadron rate determination is presented.Then techniques to separate primary c quark hadronization and b hadron weak decays to charmare discussed. In order to reduce the amount of external inputs, double charm tagging methodsare also used to measure P (c! D�+) �Br(D�+
! D0�+) and Rc. They are described in thefourth section. Finally comparison of systematic errors and combination of results are given.
2. SINGLE TAG
At LEP, charm is dominantely produced through the weak decay Z ! cc, followed by thehadronisation P (c! charmed hadron) and the decay of the charmed hadron. The rate for theproduction of single charmed hadrons is composed of the following terms:
single rate = Rc � P (c! charmed hadron)�Br(charmed hadron! �nal state): (1)
To derive Rc from the measurement, the reconstruction e�ciency of the charmed hadron intothe �nal state needs to be known. This is the main part of the internal systematic uncertainty(see table 1). The techniques used to determine the relative proportion of charmed hadronsoriginating from primary c quark hadronisation and bottom hadrons decay are reviewed insection 3.
2.1. D�+rate
The most easily detectable charmed hadron is theD�+ in the decayD�+! D0�+, because
of the low Q value of the reaction. LEP collaborations2,3,5) have collected a few thousandof such decays. Extracting Rc from this measurement however is limited by the dependanceon external parameters, in particular the hadronisation fraction P (c ! D�+) � Br(D�+
!
D0�+) � Br(D0! K��+). Until Moriond 95, only low energy experiments were providing a
value for this input. Now P (c ! D�+) � Br(D�+! D0�+) is measured at LEP with double
charm tag (see section 4.1). This input contributes around 5% to the systematic uncertainty,which is almost at the level of statistical and internal systematic errors (see table 1).
2.2. Charm counting
Every charmed hadron produced at LEP will eventually decay into one of the ground-state charmed hadrons (Gc) D0;D+;D+
s ;�+c ;�
+c ;�
0c or
+c . Measuring their production rate (1)
therefore provides another method6,7) to determine Rc through equation 2 :
X
Gc
P (c! Gc) = 1 and then Rc =X
Gc
single rate(Gc) =X
Gc
Rc � P (c! Gc): (2)
Note also that all the charmed groundstate hadrons have not been recontructed. The �+c ;�
0c
and +c rates are estimated from the �+
c rate, so that the total rate of charm baryon in c quarkhadronisation is 1:14 � 0:05 the �+
c rate6) (this only contributes to 0:4% to the systematicerror).
2

Contrary to the single D�+ rate method, the individual fraction P (c! charmed hadron)does not need to be known here. Only the branching ratios Br(charmed hadron! �nal state)is taken from external sources. But due to a higher background, statistical and systematic errorsare greater (see table 1).
3. b=c SEPARATION TECHNIQUES
To distinguish between Z ! c ! charmed hadron and Z ! b ! bottom hadron !charmed hadron, information from either the reconstructed hadron or the event shape can beused.
3.1. Charm hadron variables
The exclusive reconstruction of a charmed hadron provides precise information on mo-mentum and decay length (or ight time). When produced in bottom decays charmed hadronshave a lower average momenta (see �gure 1b) and a higher decay length (see �gure 1a) thanin charm decay. Those di�erences allow a statistical separation3{7). The main systematic comes
nu
mb
er
of
eve
nts
/bin
)*
+
1/N
(Zh)
dN
(D(K
ππ)
/dX
E↑
0
0.002
0.004
0.006
0.008
0.01
0.012
0.014
0 0.1 0.2 0.3 0.4 0.5 0.6 0.7 0.8 0.9 1
DELPHI
b) D energy over beam energy
preliminaryOPAL
a) D decay lenght significance
b → D (MC)
data
c → D (MC)
data t(D) > 1ps
data
c → D (MC)overall MC
overall MC
10
10 2
10 3
-10 0 10 20 30 40
Figure 1: Distribution of discriminant variables between b and c events when a D meson isexculsively reconstructed.
from uncertainties in the simulation, with dominant errors due to the fragmentation parametersand lifetimes (see table 1).
3.2. Event and jet variables
Other variables related to the jet or the event shape can also be used to separate bb andcc events. DELPHI uses an anti-B cut on a variable computed from the impact parametersigni�cance of tracks in the event. This cut allows to reach a 80% charm purity in the mixedtag method9) (see subsection 4.1 and �gure 2b). This B-tagging bene�ts from the accuratestudy done for Rb measurements. OPAL3,4,6) trains a neural network with jet and event shapevariables to achieve a statistical separation of the two sources of charm hadrons (see �gure 2a).
4. DOUBLE TAG
Single tag (1) measurements are sensitive to the product Rc � P (c ! charmed hadron).If one charmed hadron is tagged in each hemisphere of the event, then it provides an additional
3

0
0.1
0.2
0 0.2 0.4 0.6 0.8 1
exclusive D from double mixed tag
a) Artificial neural network output b) log10( B-tag )
fra
ctio
n o
f to
tal e
ntr
ies
pe
r b
in
en
trie
s /
0.1
2
OPAL preliminary DELPHI 91-94 datadataoverall MCb events (MC)c events (MC)
dataoverall MCb events (MC)c events (MC)uds events (MC)
Figure 2: Distribution of discriminant variables based on event or jet shapes and lifetime tag.
information:double rate = Rc � (P (c! charmed hadron))2: (3)
Thus both Rc and P (c! charm hadron) can be estimated with respectively the ratio :
Rc /(single rate)2
double rate; (4)
P (c! charm hadron) /double rate
single rate: (5)
However a double tag requires a lot of statistics that the exclusive reconstruction alone can notprovide. The particular kinematics of the decay D�+
! D0�+ o�ers a solution. The pion, noted��, is produced with a very small transverse momentum (40 MeV/c2) with respect to the D�+
direction. This provides a unique feature to tag D�+ decay through an excess of events in thep2t distribution of tracks in the jet.
4.1. Mixed inclusive / exclusive tag
Charm is tagged in one hemisphere by the exclusive reconstruction ofD�+! D0�+ decays
followed by four or �ve di�erent channels forD0 decays to increase the available statistics. In theother hemisphere, the �
�is used to tag charm. Both the OPAL4) and DELPHI9) collaboration
measure P (c ! D�+) � Br(D�+! D0�+) with this double tagging method. Note that this
method does not require the knowledge of the e�ciency for D0 decay reconstruction, sinceit cancels in the ratio (5). The crucial point here is the estimation of the �
�signal. The p2t
ditribution of all ��candidate is shown in �gure 3. The background shape can be controlled
using exclusive candidates outside the D�+ mass region or wrong charge correlations betweemD�+ and �
�, but it is the main source of internal systematic error.
Results for P (c! D�+)�Br(D�+! D0�+) are presented in �gure 4. The LEP average
is compatible with the low energy data10), thus the average has been used to extract Rc fromsingle D�+ rate.
4.2. Double inclusive tag
A completly double inclusive tag is presented by the DELPHI8) collaboration, wherecharm is tagged with the simultaneous detection of �
�in both hemispheres. As shown in (4, 5)
4

Figure 3: Distribution of the transverse momentum w.r.t the jet for ��candidates. The back-
ground shape is �xed, and the solid line is the overall �t.
it provides both new independant measurements for Rc and P (c! D�+)�Br(D�+! D0�+).
The ��candidates are selected in the range p2t < 0:01 (GeV/c)2 in order to supress
background and bottom decays contamination. The signal contribution is estimated with a�t to four di�erent p2t distributions for single and double tagged events such that shapes forbackground and signal can be �xed entirely with data. This technique contributes to 4% tothe internal systematic error. Then the bottom decays contribution is substracted using P (b!D�+) measurement from single tag method, which is the only input, and contributes 3% to theuncertainty (see table 1).
Table 1: Comparison of uncertainties from di�erent Rc measurments
methods Charm counting Single tag Double tagD0 +D+ +D+
s + �+c exclusive D� inclusive �
�
statistics � 7% � 6% � 8%
internal systematics � 5% 2� 6% � 7%fragmentation � 5% � 4% � 4%b; c hadrons lifetimes � 3% � 2% -g ! cc � 1% � 1% -branching ratio (PDG 95) � 3% � 3% -P (c! D�)B(D�
! D0�) - � 4% -internal b! D� - - � 3%
Total precision 11% 11% 12%
5. COMBINATION OF MEASUREMENTS AND CONCLUSION
The results are presented in �gure 4. Whereas the lepton analysis1) have been published,most other measurements are preliminary. They all rely on the same input parameters, e.g.branching ratios for groundstates or fragmentation parameters, and the systematic errors havebeen computed in the same way (see table 1). The average10) of the LEP Electroweak Heavy
5

0.15 0.175 0.2
(a) P (c! D�+) �Br(D�+
! D0�+)
0.15 0.175 0.2
(b) Rc individual measurements and the average com-
puted with all heavy avour constraints
Figure 4: Measurements obtained by LEP collaborations using charm mesons reconstruction.The solid vertical line stands for the Standard Model expectation
Flavor Working Group has been done consistently with the procedure described in this pro-ceeding11) including all correlations between di�erent measurements. Rc measurement at LEPis 0:1596 � 0:0038(stat) � 0:0064(syst), 1:8 standard deviation below the Standard Model ex-pectation of 0:1725.
Acknowledgement
This review has been made possible thanks to numerous contacts with collaborators ofboth DELPHI and OPAL and thanks to the work of the LEP Electroweak Heavy Flavor WorkingGroup. I would like to thank personnally P. Antilogus, T. Benhke, D. Bloch, M. Hildreh, K.Moenig, F. Pierre and P.S. Wells.
References
1. ALEPH coll., D. Buskulic et al., Phys. Lett. B313 (1993) 535 and DELPHI coll., P. Abreu et al., Z.Phys.
C65 (1995) 5692. ALEPH coll., D. Buskulic et al., Z.Phys. C62 (1994) 13. OPAL coll., R. Akers et al., Z.Phys. C67 (1995) 574. OPAL coll., contributed paper to the EPS-HEP conference, Brussels 1995, eps0289, OPAL physics note
PN1755. DELPHI coll., contributed paper to the EPS-HEP conference, Brussels, eps0557, DELPHI note 95-1016. OPAL coll. CERN-PPE/96-517. DELPHI coll., DELPHI note 96-30 PHYS 6048. DELPHI coll., DELPHI note 96-33 PHYS 6069. DELPHI coll., DELPHI note 96-34 PHYS 60710. LEP Electroweak Heavy Flavor Working Group, LEPEWWG/96-0111. P.S. Wells, this proceeding
6

Gluon Splitting into Heavy Quarks
In e+e� Annihilations
H. Przysiezniak
U.of Alberta and CERN, PPE Division, 1211 Geneva 23
Abstract
Measurements of the multiplicity of heavy quark pairs from gluon splitting in e+e� annnihila-tions at LEP are presented. A counting technique, based on the b-tagging of jets in 4-jet topologies,has been used by DELPHI to measure �ng!b�b. The mean multiplicity of gluons splitting into bbwas measured to be
�ng!b�b = (0:22� 0:13)� 10�2:
The multiplicity of gluons splitting into cc �ng!c�c has been measured by OPAL in two separateanalyses. In the �rst, the production of D�� mesons at very low xD� is studied and indications forcc production from gluon splitting is found. The mean multiplicity of this process in multihadronicZ0 decays is measured to be �ng!c�c = (4:4�1:4�1:5)�10�2 . In the second, a 3-jet event topologyis selected and charmed hadrons are tagged in the lowest energy jet using leptons. From this, avalue of �ng!c�c = (2:26�0:28�0:45)�10�2 is determined. Averaging the two measurements yieldsthe �nal value of
�ng!c�c = (2:38� 0:48)� 10�2:
Both the �ng!b�b and �ng!c�c measurements are consistent with theoretical expectations.
Presented at the XXXIst Rencontres de Moriond,
QCD and High Energy Hadronic Interactions, 23{30 March, 1996.

1 Introduction
Heavy quarks can be produced in e+e� annihilation via two processes: e+e� ! Q�Q, the direct
production, and e+e� ! q�qg, where the gluon produces two heavy quarks, g! c�c or g! b�b. The
process of gluons splitting into heavy quarks can be reliably calculated in perturbative QCD theory,
since it is an infrared �nite quantity. However, in calculations at jet energy scales well above the quark
mass, as produced in the process e+e� ! Z0 ! q�qg, large logarithmic terms arise at all orders of the
perturbative expansion, spoiling its convergence. Theoretical predictions di�er signi�cantly from one
another (see Table 1). A measurement of these quantities would allow an important comparison with
QCD calculations. Since the Standard Model prediction for �bb=�had di�ers by almost three standard
deviations from the experimental value 1), knowledge of �ng!c�c and �ng!b�b can also be useful in an
attempt to explain at least a part of this di�erence as an excess of observed b hadrons arising from
gluons splitting into bb .
Prediction from �ng!c�c [10�2] �ng!b�b [10
�2]
Resummed + leading order 2) 1.35 0.177
Leading order 3) 0.607 0.100
Herwig 0.923 � 0.005 0.227 � 0.001
Jetset 1.701 � 0.013 0.160 � 0.004
Ariadne 2.177 � 0.015 0.326 � 0.006
Table 1: Theoretical predictions of ng!cc and ng!bb. The leading order calculation 3) is fully contained in the
resummed calculation 2). The Monte Carlo model predictions are taken from Ref. 2).
2 Gluon goes to cc: D�-tagging method
The process of gluons splitting into heavy quarks is studied by OPAL in an analysis of D� production
at very low D� energies 4). The study is based on a total of 1.246 million Z0 hadronic decay events
that are selected from data collected from 1990 to 1992. D� mesons are identi�ed via the decay
D�+ ! D0�+ followed by D0 ! K��+. The main contribution from gluon splitting to the D� signal
is expected in the low xD� � 2ED�=Ecm region.
Three main sources contribute to the D� signal: primary c events, primary b events, and gluons
splitting into a pair of heavy quarks that hadronize into a D� meson. Decays of c-quarks are separated
from those of b-quarks by a combination of bottom tagging methods using leptons, jet shape variables,
and lifetime information. In the resulting di�erential cross-section, an excess of events is observed at
very low xD� , above the expectations from the primary quark production processes b ! D� and
c ! D�. This is interpreted as a signal for g ! c�c. Using Monte Carlo to predict the shape of this
component, the rates of D� mesons from primary charm and from g ! c�c are determined in a �t to
this c-like sample. The result of the �t is shown in Fig.1 . The �nal value for the average number of
gluons splitting into a cc pair per hadronic Z0 decay event is
�ng!c�c = (4:4� 1:4� 1:5)� 10�2:
The systematic error includes the e�ects of errors from the b/c separation procedures, errors in the
D� reconstruction, and additional errors which are caused by the above �t having to assume speci�c
functional forms for the c! D� fragmentation function and for the g! c�c spectrum.

x(D*)
1/N
had d
N/d
x(D
*)c
c tagged
fit
c→D*
g→D*
(b) OPAL
0
0.001
0.002
0.003
0.004
0.005
0.006
0.007
0 0.2 0.4 0.6 0.8 1
Figure 1: The observed yield of D� mesons in c-tagged events, normalized to the total number of multihadronic
events. The dashed curve is the result from the �t allowing both quark and gluon contributions to vary. The
dotted line is the c! D� component, and the solid one indicates the component from gluon splitting. The errors
on the latter have been indicated by the shaded area, superimposed on the g! D� curve.
3 Gluon goes to cc: event topology method
In this approach gluon splitting into heavy quarks is studied by OPAL in an analysis of 3-jet events
with a prompt lepton in the lowest energy jet, which is assumed to be the gluon jet 5) . The study
is based on a total of 3.511 million Z0 hadronic decay events that are selected from data collected
from 1990 to 1994. The decay of a charmed hadron is then tagged by selecting events with either
an electron or a muon in the gluon jet, and requiring 2 < pe < 6 GeV=c and 2 < p� < 6 GeV=c
. The bb contribution to this sample is suppressed by requiring an anti-vertex tag and a cut on the
invariant mass of the gluon jet. A clear di�erence between g! c�c and background events is found in
the invariant mass distribution of the jet. The background subtracted distribution is shown in Fig. 2.
Monte Carlo is used to correct for the remaining non- g! c�c background, due to jet misassignment,
residual photon conversions, lepton misidenti�cations, Dalitz decays of �0 and � and leptons from
g ! b�b that survive the selection cuts. The result for the average number of charm quarks from
gluon splitting per hadronic Z0 decay, after correcting for the reconstruction e�ciency and the charm
hadron semileptonic branching ratio, is
�ng!c�c = (2:27� 0:28� 0:41)� 10�2;
where the �rst error is statistical and the second is systematic.

0255075
100125150175200225
5 10 15 20 25Mjet (GeV/c2)
Ent
ries/
2 G
eV/c
2
OPAL
Figure 2: The invariant mass of the lowest energy jet for background subtracted data (points) and the Jetset
spectrum normalized to the measured value of �ng!c�c (line histogram).
4 Gluon goes to bb: b-tagging in 4-jet events
Approximately 1:4� 106 hadronic Z0 events, collected by the DELPHI detector at LEP in 1994, were
used to establish the presence of g! b�b. Two b-jets are identi�ed using a lifetime based tag in events
with a 4-jet topology 6). The quantity PJ (see Ref. 7)) was de�ned for each reconstructed jet of the
event as the probability for the jet J to contain no decay products from long lived hadrons. A cut
PJ < 0:003 was applied on the two jets forming the smallest angle in the event, numbered as jets #1
and #2 (where jet #1 is more energetic than jet #2). This selection maximizes the probability that
the jets originated from secondary b quarks, i.e. from gluon splitting. The remaining two jets were
numbered #3 and #4.
To reduce the amount of background, two more variables were used: the rapidity �TJ of the jet J
with respect to the thrust direction of the event, and the angle �1234 between the planes P12, formed
by jets #1 and #2, and P34, formed by jets #3 and #4. A cut on �TJ helps in rejecting those selected
jets, mainly b-jets, coming from Z0 decay (primary production). A cut on the rapidity of jet #1 was
applied, by requiring �T1 < 1:2. It is also expected that the planes built with the selected jets be
more perpendicular in cases of g ! b�b occurrence than in background events, where jets #3 and #4
are usually originated by radiated gluons. A j cos�1234j < 0:8 cut is thus used.
After imposing all the cuts, 28 events in data were left, out of which 15.1 were estimated to be
background. Relying on Jetset simulation for the e�ciency evaluation of the g ! b�b signal, and
taking into account systematic e�ects, the average number of beauty quarks from gluon splitting per
hadronic Z0 decay was found to be
�ng!b�b = (0:22� 0:10� 0:08)� 10�2
where the �rst error is statistical and the second is systematic.

5 Summary and conclusions
The multiplicity of charm quark pairs from gluon splitting was measured by the OPAL collaboration
using two independent approaches: the analysis of D� production at low xD� and the analysis of
3-jet events with a prompt lepton in the lowest energy jet. The two measurements of �ng!c�c yield
consistent results and are averaged, noting that the dominant part of the systematic uncertainties are
uncorrelated, yielding a �nal average value of
�ng!c�c = (2:38� 0:48)� 10�2:
The error includes the statistical and systematic errors added in quadrature. The DELPHI search for
two b-jets in a 4-jet topology gives a measurement of �ng!b�b
�ng!b�b = (0:22� 0:13)� 10�2
The values for both ng!cc and ng!bb
are in good agreement with the theoretical calculations. Finally
it should be stressed that this value of �ng!b�b is consistent with the Jetset value of 0:16� 10�2 and
therefore lends support to the LEP method of accounting for g ! bb in the �bb=�had measurements1).
Acknowledgements
It is a pleasure to thank the organizers of the conference for their e�orts in arranging such an inspiring
and enjoyable meeting. I would like to express my thanks to my OPAL colleagues Ties Behnke and
Yoram Rozen, and to the DELPHI �ng!b�b group, for their help in the preparation of this talk and
manuscript.
References
1. LEP Electroweak Working Group, CERN-PPE/95-172.
2. M.H. Seymour, Nucl. Phys. B 436 (1995) 163.
3. M.L. Mangano, P. Nason, Phys. Lett. B 285 (1992) 160.
4. OPAL Collaboration, R. Akers et al., Z. Phys. C 67 (1995) 27.
5. OPAL Collaboration, R. Akers et al., Phys. Lett. B 353 (1995) 595.
6. DELPHI private communication from A. Baroncelli, P. Branchini, E. Graziani, C. Mariotti.
7. DELPHI Collab., P. Abreu et al., CERN-PPE/94-131
ARE THE LEP AND SLD HEAVY FLAVOUR
ELECTROWEAK DATA COMBINED CORRECTLY?
P. S. Wells,
CERN, 1211 Geneva 23, Switzerland
Abstract
This talk forms part of a mini-workshop on Rb and Rc, motivated by the current discrepancy
between the measurements and the Standard Model expectation. The question of whether the data
are combined correctly is addressed here. The complete averaging procedure used to combine all the
heavy avour electroweak data from LEP and SLD is described with a view to convincing the reader
that it is indeed correct. The sensitivity of the averages to the dominant sources of systematic error
is also discussed.

1 Introduction
The diverse measurements of electroweak quantities in the heavy quark sector from the four LEP exper-
iments and from SLD have been combined to give the best estimates of the electroweak parameters1; 2).
The average values of Rb and Rc are in poor agreement with the Standard Model expectation. The
details of the combination procedure are described here, with a view to convincing the reader that
it is correct. The measurements and averages are critically dependent on assumptions made about
sources of systematic errors. Their e�ect is discussed, and some general words of caution are given.
2 The principles of the averaging procedure
2.1 Back to Basics
For a single measurement, a1 � �1, with a Gaussian p.d.f., the �2 is given by:
�2(x) = (x� a1)2=�21:
Given two measurements, the best estimate, a0, is a linear combination of a1 and a2 with �2 given by:
�2(x) = (x� a1)2=�21 + (x� a2)
2=�22:
This has a minimum at x = a0, and the 1 standard deviation error is given by ��2 = �2(a0 � �0)�
�2(a0) = 1 (see �gure 1a ). Correlations between the measurements can be taken into account via the
covariance matrix, C. For example, if the two measurements have uncorrelated errors ui and 100%
correlated errors ci, i.e. a1 � u1 � c1 and a2 � u2 � c2, the covariance matrix is given by:
C =
�21 ��1�2
��1�2 �22
!=
u21 + c21 c1c2
c1c2 u22 + c22
!
and the �2, with the same properties as before, becomes:
�2(x) =X
ij=1;2
(x� ai)C�1ij (x� aj):
If there are several sources of correlated errors, cpi , the o�-diagonal terms areP
p cp1c
p2. This method
can be trivially extended to many measurements of the same parameter 3).
2.2 More than one parameter
In the case of the electroweak heavy avour analyses, we want the best estimates of 10 heavy avour
quantities 1), denoted x� (where index � corresponds to the parameter)
x� = Rb; Rc; Ab�bFB; A
c�cFB;Ab; Ac;
BR(b! `�); BR(b! c! `+); �;BR(c! D?+ ! �+D0):
The mixing parameter � and the three branching ratios are included because they are measured
simultaneously in several of the analyses. Individual measurements are denoted by r�i , where the
index i runs over the 76 measurements, and the index � indicates which of the 10 parameters this
measures. The �2 to be minimised w.r.t. the best estimates x� is given by:
�2 =Xij
(r�i � x�) C�1ij (r�j � x�)

Figure 1: The curves in (a) illustrate the combination of two uncorrelated measurements. In (b), a �ctitious
measurement of Rb which depends on Rc (eg. from double-tagging) is combined with a �ctitious measurement
of Rc which is independent of Rb (eg. using b{c separation in a D meson measurement). This illustrates the
main source of the correlation between the combined values of Rb and Rc.
0
1
2
3
4
5
0 1 2 3 4 5 6 7 8
χ 2
χ2 = χ12 + χ2
2
χ12 χ2
2
(a)
0.1
0.15
0.2
0.1 0.15 0.2Rb
Rc
∆χ2 = 1,4,9
Rc input
Rb input
Best estimate
(b)
where C is the 76�76 covariance matrix for all the heavy avour measurements. The 1 standard
deviation error for a parameter is de�ned by ��2 = 1, minimising the �2 w.r.t. all other parameters.
The calculation of the full covariance matrix, C = Cstat+Csyst, is an essential part of the procedure.
The statistical covariance matrix, Cstat, includes o�-diagonal terms frommultiparameter �ts, and looks
something like this: 0BBBBBBBBB@
a 0 0 0 0 0 ::
0 b 0 0 0 0 ::
0 0 c x y 0 ::
0 0 x d z 0 ::
0 0 y z e 0 ::
0 0 0 0 0 f ::
: : : : : : g
1CCCCCCCCCA
The systematic covariance matrix has the square of each total systematic error on the diagonal, Csystii .
The o�-diagonal terms are calculated from a detailed breakdown of systematic errors (whose relative
signs are important):
Csystij =
Xp
cpi c
pj
where the sum is over all sources of uncertainty, p, which a�ect both results i and j.
2.3 Interdependence of parameters
If a measurement r�i of parameter x� depends on the value of some other parameter x� ; � 6= �, this is
taken into account explicitly in the �2. For example, if the kth measurement is a precise double-tag
value of Rb which depends on Rc and was evaluated with Rc = Rusedc , the following expression can be

included in the �2:
rRb
k = Rmeasb + aRc
k
(xRc � Rusedc )
xRc
;
with the strength of the dependence given by the constant aRc
k (see �gure 1b).
2.4 Cross checks
Many cross checks can be made to verify that the combination procedure is correctly implemented.
These are facilitated by the exible framework in which the code runs. The �2 is well behaved with
a unique minimum for each parameter. Comparing results from independently written code gives
con�dence that they are technically correct, while the input tables for complicated multiparameter
�ts can be checked for consistency by ensuring that they reproduce the individual �t results. In
addition, averages made from subsets of results are consistent with those from simpler methods.
3 Common systematic errors
Sources of systematic uncertainty which are common to all the experiments, and which give a signi�-
cant contribution to the total error in Rb or Rc, are listed in table 1. The present errors and possible
improvements are indicated 4; 5). The \pulls" indicate how many sigma \wrong" each input would
have to be if it were the sole cause of the discrepancy with the Standard Model expectation.
3.1 Use of results from lower energy experiments at the Z
The validity of applying results from lower energy experiments at the Z energies is often questioned
because the mixture of heavy hadrons produced may be di�erent. A few comments are in order:
Semileptonic branching ratios: BR(b! `�) and BR(b! c! `+) are now taken from LEP mea-
surements, but CLEO data (including only B0 and B+) are still used for the decay spectra, while
BR(c! `) also relies on lower energy data 1).
Charm background for Rb: It is assumed that lower energy measurements of D fractions produced
in cc events are valid at the Z. This is born out by the consistency of lower energy and LEP
results (see table 1).
For measurements of Rc: Assumptions on the rates of D0, D+ are not needed. There is still a
gain in precision from using the lower energy average of BR(c! D?! �D0) = 0:178� 0:013 in
addition to the (consistent) LEP measurement of 0:164� 0:008.
3.2 Hemisphere correlations
The equations for the number of tagged hemispheres and double tagged events have been seen many
times in this workshop. They can be written as:
Nt=2Nhad = "bRb + "cRc + "uds(1�Rb � Rc);
Ntt=Nhad = Cb"2bRb + "2cRc + "2uds(1�Rb �Rc);
where Cb = "db="2b accounts for the fact that the tagging e�ciencies in the two hemispheres of the event
may not be independent ("db is the double-tagging e�ciency for a bb event). Neglecting background,

Table 1: Common systematic errors, with currently used \Value and range" (corresponding to PDG92),
reasonable \New Values" (uno�cial LEP average or PDG95) and the \Pull", which is de�ned by:
(Average{Standard Model)/(Signed error from this source).
Error source Value and range New value Rb pull Rc pull
Decay model b! ` ACCMM+ISGW�ISGW��
{47 {34
Decay model c! ` CL1 +CL2�CL3 {88 1
BR(c! `) (9:8� 0:5)% +21 +5
BR(b! c! `�) (1:3� 0:5)% {161 +168
hxE(b)i (if not in �t) 0:70� 0:02 0:695� 0:010 LEP {129 +16
hxE(c)i (if not in �t) 0:51� 0:02 0:515� 0:013 LEP {100 +13
b fragmentation model Peterson, Kartvelishvelli, Collins{Spiller 1 +67
c fragmentation model " {135 {8
BR(D0! K��+) (3:84� 0:13)% PDG'95 +61 +9
BR(D+ ! K��+�+) (9:1� 0:6)% PDG'95 +168 +25
BR(Ds+! ��+) (3:5� 0:4)% PDG'95 +178 +34
BR(�c ! pK��+) (4:4� 0:6)% PDG'95 +198 +30
c baryon/�c 1:15� 0:05 1 {94
D0 fraction in cc events 0:557� 0:053 0:583� 0:035 LEP {132 1
D+ fraction 0:248� 0:037 0:233� 0:024 LEP {11 +55
(D0 + D+) fraction 0:80� 0:07 {19 +124
Ds fraction 0:12� 0:05 0:097� 0:022 LEP {18 +119
�c fraction 0:08� 0:05 0:076� 0:033 LEP {198 1
D0 lifetime (ps) 0:420� 0:008 0:415� 0:004 PDG'95 {35 {76
D+ lifetime (ps) 1:066� 0:023 1:057� 0:015 PDG'95 {31 {52
Ds lifetime (ps) 0:450+0:030�0:026 0:467� 0:017 PDG'95 {44 {96
�c lifetime (ps) 0:191+0:015�0:012 0:206� 0:012 PDG'95 {323 {30
B decay multiplicity 5:5� 0:5 OPAL 5:7�0:3OPAL, DELPHI {263 +52
D decay multiplicity 2:53� 0:06 {15 +101
BR(D! Ks0X) 0:46� 0:06 +17 {109
N(g! bb) (0:16� 0:08)% {41 1
N(g! cc) (1:6� 0:8)% theory (2:38� 0:48)% OPAL {28 {24
Rate long-lived light h JETSET�10% {26 +118
Light quark frag. JETSET � small +20 {72
these equations give Rb � CbN2t =4NttNhad, i.e. Rb is very sensitive to the hemisphere correlations,
with the relative change in Rb directly proportional to Cb � 1. Estimates of the error in Cb � 1 are
between 0.3% and 1.3% and to date have been dominated by statistics (Monte Carlo or data). For
this reason the uncertainty has been taken to be uncorrelated between measurements. Varying the
assumptions on the correlated uncertainty due to Cb has a tiny e�ect on the Rb value or error. The
result would be much more sensitive to a change in the evaluation of Cb�1 or the error in this quantity.
This is an area of intense study, whose treatment is expected to be re�ned in the near future.

4 Electroweak results
The combination procedure is applied to physical observables. Small corrections are applied to give the
corresponding parameters for pure Z exchange. De�ning Rb � �(e+e� ! bb)=�(e+e� ! hadrons),
R0b � �(Z ! bb)=�(Z! hadrons), and similarly Rc and R0
c, the corrections for photon exchange are
given by R0b = Rb+0:0003 and R0
c = Rc� 0:0003. The combined results are given below. The overall
�2/d.o.f. = 41/(76{10), indicating that the measurements are self-consistent.
Result Correlation Matrix
R0b 0.2211�0.0016 1.0 -.30 .01 -.03 -.06 .05 -.11 -.07 .06 .10
R0c 0.1598�0.0070 -.30 1.0 .05 .02 .07 -.06 .02 .15 -.03 -.43
A0;bFB 0.1002�0.0028 .01 .05 1.0 .10 .04 .00 .02 -.15 .28 -.05
A0; cFB 0.0759�0.0051 -.03 .02 .10 1.0 -.01 .06 -.01 -.06 .06 .00
Ab 0.842�0.052 -.06 .07 .04 -.01 1.0 .07 .00 -.06 .03 -.03
Ac 0.618�0.091 .05 -.06 .00 .06 .07 1.0 .09 -.13 .15 .01
BR(b! `�)% 11.11�0.23 -.11 .02 .02 -.01 .00 .09 1.0 -.31 .39 -.01
BR(b! c! `+)% 7.81� 0.40 -.07 .15 -.15 -.06 -.06 -.13 -.31 1.0 -.45 -.06
� 0.1221�0.0051 .06 -.03 .28 .06 .03 .15 .39 -.45 1.0 .00
BR(c! D? ! �D0) 0.1681�0.0071 .10 -.43 -.05 .00 -.03 .01 -.01 -.06 .00 1.0
5 Conclusion
The aim of this paper has been to demonstrate that the combination of data is correct, in that the
averaging procedure is sensible, and performs as expected. Of course, the combined results are only
as correct as individual input measurements. Unknown sources of error are not taken into account
and any mistakes or incorrect assumptions in the input results are still present in the averages. It
should be remembered that all dependences are assumed to be linear and all errors are assumed to be
Gaussian. The input values and ranges for systematic errors will be updated in the near future, but
no big deviations are expected.
Acknowledgements
It is a pleasure to thank the organisers for arranging such a fruitful and enjoyable conference, the
LEP electroweak working group and LEP and SLD heavy avour groups for their careful studies and
collaboration, and in particular Mike Hildreth and Dave Charlton for input to this review.
References
1. The LEP Experiments, Combining Heavy Flavour Electroweak Measurements at LEP, CERN-
PPE/96-017, Submitted to NIM.
2. The LEP Experiments and the LEP ElectroweakWorking Group, A Combination of Preliminary
LEP Electroweak Measurements and Constraints on the Standard Model CERN-PPE/95-172
3. L. Lyons, D. Gibaut and P. Cli�ord, Nucl. Instr. Meth. A270 (1988) 110.
4. K. Hikasa et al., Phys. Rev. D45(1992)S1.
5. L. Montanet et al., Phys. Rev. D50(1994)1173, 1995 update (URL: http://pdg.lbl.gov/).

EFFECTS OF QCD IN Rb AND Rc
James G. Branson
University of California, San Diego
0.14
0.16
0.18
0.215 0.22 0.225
Preliminary
Rb
Rc
Abstract
The combined LEP and SLD measurements of Rb are about three standard devia-
tions above the standard model. The measurement techniques employed are claimed to
be highly reliable and systematically safe. Rc, which is measured using di�erent and
inherently less reliable techniques, is found to be 1.7 standard deviations low. In this
paper, I will examine what constraints the measurements of �s put on these measure-
ments. I will also explore possible sources of systematics related to the models used to
account for QCD e�ects in the processes measured.

1 Introduction
The LEP electroweak working group1; 2) has made a careful combination of the measure-
ments of Rb and Rc. Some of these results are preliminary but most have been published.
The two measurements are slighly correlated. When the two are determined simultaneously
the result is Rb = 0:2211� 0:0016 compared to 0.2156 expected in the Standard Model and
Rc = 0:1598� 0:0070 compared to 0.172 expected in the Standard Model. Rb is 3.4 standard
deviations or 2.6% high while Rc is 1.7 standard deviations or 7.0% low. This combined result
is shown in Figure 1. Since the deviation in Rc is rather large and less signi�cant statistically,
they have also quoted the best value of Rb assuming that Rc takes on its standard model
value. They �nd Rb(Rc = 0:172) = 0:2202� 0:0016, which is still 2.9 standard deviations or
2.1% high compared to the Standard Model.
0.14
0.16
0.18
0.215 0.22 0.225
Preliminary
Rb
Rc
Figure 1: The measurement of Rb and Rc is show as the point at the center of this �gure. Con�dence
level contours are shown fro 68% CL, 95% CL, and 99.7% CL. The Standard Model prediction is
shown as the point at the upper left. The arrow represents the uncertainty on the standard model
prediction and points in the direction of increasing top mass.
If the deviations in Rb and Rc are due to new physics beyond the standard model, theyrequire a change in the value of �s measured from Rhad on the Z0. If this �s measure-
ment becomes inconsistent with the other �s determinations, we must be skeptical of changes
in Rb and Rc.As the other speakers in this session have made clear, the measurement of Rb is
designed to be insensitive to models. The b tagging e�ciency is measered in the data
principally by comparing doubly tagged events to single tags. Models are only needed to
calculate small backgrounds and to determine the e�ciency correlation in the double tags.
QCD e�ects play a role in this correlation.Hard gluon emission can put both b and �b in the same hemisphere precluding a double
tag. If this process is not modeled correctly, an error could result. Gluon emission also intro-
duces correlations in the momenta of the two B particles. Since the e�ciency is momentum
dependent, this translates into an e�eciency correlation which is sensitive to the fragmenta-
tion model. Gluon splitting, the process in which a radiated gluon produces an additional
quark pair in the event can give rise to additional heavy quarks in the event and if not modeled
correctly will produce an error in the result. Finally, other, perhaps nonperturbative, aspects
of the QCD might not be modeled correctly.

2 New Physics in Rb and Rc Changes �s
When, due to new physics, Rb and Rc are found to be di�erent from their standard model
value, the partial widths of the Z into b and c quarks, �b and �c, must change. This in turn will
mean a change in the total width into hadrons, �had. This is a very well determined quantity
at LEP based on measurements of the Z0 peak cross section and total width. Figure 2 shows
an example of the detailed lineshape data used to determine �had. The �had measurement and
Standard Model prediction can be summarized as follows:
�had =P
q�q = 1745:0� 3:0 MeV vs. 1744.8 in SM,
�q =p2
4�G�M
3Z [ �gv
2 + �ga2](1 + �
qQED)(1 + �
qQCD) � �0
q(1 + �qQCD).
If �b and �c change, we need to adjust3; 4) �s and hence �qQCD to maintain consistency
with the measured value of �had. Note that the LEP Electroweak group uses �s = 0:123 as
measured from event shapes at LEP and �nds good agreement between the measured �hadand the Standard Model without modi�ed heavy quark partial widths. The dependence ofthe QCD radiative correction, �qQCD, is given by
�qQCD = 1:06(�s
�) + 0:85(�s
�)2 � 15(�s
�)3 �= 0:042 (for �s = 0:123).
This correction will be a small amount (0.002) larger for b quarks due to mass e�ects.
σ(e+ e− →
hadr
ons(
γ))
[nb
]
1992 Data1991 Data1990 DataFit Result
0
10
20
30
88 90 92 94 96
√s [GeV]
σ mea
s / σ
fit
0.96
1
1.04
88 90 92 94 96
Figure 2: Z0 lineshape data from L3 compared to the Standard Model �t. In the botton graph, the
deviation from the standard model is shown.
To understand the shift in �s needed to agree with the new heavy quark partial widths,
let us de�ne ��q � �q � �SMq . Let us then examine several scenarios.
� Assume ��u = ��d = ��s = 0 and ��c, ��b = are exactly as measured. This impliesthat ��had = �18:9 MeV and hence �s from �had becomes 0:156 � 0:006 which is in
gross disagreement with other measurements of �s. If we adjust Rc to be in agreement
with �s measurements, it is only a fraction of a standard deviation from the standardmodel. Therefore the large fractional deviation in �c seems unlikely in this scenario.
� Assume universality: ��u = ��c and ��d = ��s = ��b. This would make �s even
higher!
� Assume ��u = ��d = ��s = ��c = 0 and ��b = is exactly as measured. This calls
for ��had = 10:3 MeV and �s = 0:105 � 0:006. Here we get into tough discussions on

the correct value of �s. Low energy experiments tend to prefer values in the region of
0.113 (DIS). All the best LEP event shape measurements average 0.123. Which one is
right for �s(MZ)?
There are many other ways to set the partial widths to get any value of �s in the region
of 0.12. But there is no experimental motivation for any of them. If the partial widths into
quarks are all at variance with the SM, why are the leptonic widths ok?
One possible scenario is that there is new physics in Rb and a uctuation and/or a sys-
tematic problem in Rc. Perhaps the true Rb deviation from the SM is � 1� smaller than
measured now giving and �s which is very reasonable. The other scenario would be that
there are systematic problems in both Rb and Rc, and no new physics. We will look for some
problem in the measurement of Rb below.
3 Simulation of B Jets
It is important to study the basic simulation of b quark jets and a good deal of workhas gone into this at LEP. Figure 3 shows three comparisons5) between b jets and models.The �rst graph compares the energy distribution relative to the jet axis for b jets versus jets
from light quarks. The second graph shows a similar distribution comparing b jets with gluonjets. The third shows the number of charged tracks which are signi�cantly displaced from theprimary vertex. The model agrees well with the data in all of these distributions.
b jet
uds jet
n.mix quark jet
gluon jet
0. 10. 20. 30. 40. 50. 60.0.
0.02
0.04
0.06
0.08
0.1
OPAL
(1/E
jet )
dE
jet /d
χ
χ (degrees)
k⊥ definition:ycut=0.02
gluon jet, Jetset 7.4gluon jet, Herwig 5.8b jet, Jetset 7.4b jet, Herwig 5.8
0. 10. 20. 30. 40. 50. 60.0.
0.02
0.04
0.06
0.08
OPAL
(1/E
jet )
dE
jet /d
χ
χ (degrees)
b jet
gluon jet
k⊥ definition:ycut=0.02
0.5
1.
1.5
Co
rre
ctio
nfa
cto
rs (a)OPAL
Nr. significant tracks in h.e. jet, Nh.e.sig.
(1/N
eve
nt) d
Nje
t/d
(Nh
.e. )
sig
.
k⊥ definition:ycut=0.02
0. 2. 4. 6. 8. 10.0.
0.1
0.2
0.3
Data
MC, b jets
MC, c jets
MC, gluon jets
MC, uds jets
tag
(b)OPAL
Nr. significant tracks in h.e. jet, Nh.e.sig.
(1/N
eve
nt) d
Nje
t/d
(Nh
.e. )
sig
.
cone definition:R=30o
ε=10 GeV
0. 2. 4. 6. 8. 10.0.
0.1
0.2
0.3
Data
MC, b jets
MC, c jets
MC, gluon jets
MC, uds jets
tag
Figure 3: A comparison of the energy ow in b jets with (a) light quark jets, and (b) gluon jets. In
(c) the number of lifetime signi�cant tracks is checked in the MC model.
4 Gluon Emission
Hard gluon emission that causes both b and �b to be in the same hemisphere implies
changes in the rate of double tagging. This process should be fairly well measured and
modeled. Experiments have looked at the (negative) correlation this e�ect should induce.That is, since both b's are in the same hemisphere, double tagging becomes much less likely.
Gluon radiation will also induce a positive correlation by softening momenta and increasing
multiple scattering, thus reducing tagging probabilities in both hemispheres. Figure 4 shows

the general correlation studies done by ALEPH and DELPHI. They each include a study of
correlation due to gluon emission using variables like thrust. The third part of Figure 4 shows
a correlation computed by Delphi for data and Monte Carlo based on the thrust of the event.
Data events were selected by tagging in the oposite jet to reduce light quark background. The
agreement between data and Monte Carlo is impressive.
ALEPH
-0.01
0
0.01
-5 -4 -3 -2 -1 0
calculated correlationcomponent sum
θφgluon radiationvertex bias
log10PH
ρ
0
0.005
0.01
0.015
-5 -4 -3 -2 -1 0
data
MC
log10PH
ρ
Figure 4: Hemisphere correlations calculated by ALEPH, calculated by DELPHI, and correlations
due to gluon radiation obtained from the signed thrust in DELPHI data and MC.
5 Fragmentation Correlation
QCD predicts a correlation between the momenta of the two B mesons which is due to gluon
emission. Hard gluon emission is simulated fairly well. It is less clear what happens in thefragmentation process. JETSET has some positive correlation. The size of this correlationis not su�cient to change Rb by very much. If the correlation were actually larger than
simulated, Rb should increase.Figure 6 shows the correlations in the SLD experiment in data and Monte Carlo. In
particular the B momentum correlation is small and well reproduced in the Monte Carlo. The
second part of Figure 6 shows a scatter plot of the two B momenta as produced in JETSET. Aclear correlation is visible at both high momentum and low momentum. A larger correlation at
low momentum would be quite dangerous but would move Rb even further from the StandardModel. Opal estimates a 4 per mille e�ect due to this momentum correlation.
It has been pointed out6) at this conference, that the fragmentation models used may be
far from correct in some regions, for example if two heavy quarks have very low momentum.This is also a region where detection is very di�cult.
6 Gluon Splitting
Gluon splitting, which produces additional heavy quarks in an event, a�ects the tagging
e�ciency for light quarks. This has been discussed in the talk of Helenka Przysiezniak at this
conference. The measured values are g ! b�b = (0:22� 0:13)% and g ! c�c = (2:38� 0:48)%.These are now rather solid numbers. The LEP electroweak group assumes that gluon splitting
is as in JETSET with an uncertainty of 50%: F (g! bb) � (0:16� 0:08)%, and F (g! cc) �
(1:6� 0:8)%. With these assumptions, ALEPH, DELPHI and SLD derive a systematic error
on Rb of about �0:0002. Clearly, the measurements give us con�dence that gluon splitting is
not a major problem with the Rb measurement.

Figure 5: SLD correlations. Figure 6: Momentum correlation in JETSET.
7 CONCLUSIONS
In summary, we can draw the following conclusions. The measured value of Rc, which
deviates from the standard model by a large fraction (7% but only 1.7�) would require an
unacceptably large value of �s in order to agree with the precise lineshape measurements from
LEP. Assuming Rc takes on its standard model value, the measured value of Rb requires a
rather low value of �s which agrees with low energy measurements but disagrees with event
shape measurements at high energy. While many combinations of the partial decay widths
of the Z into quarks could �t all the data, we have no experimental motivation for anything
except a large value or Rb.
Jets from b quarks are well described in the Monte Carlo. Gluon emission can give a large
negative correlation but should be well modeled. B energy correlations are small and positive.
Gluon splitting corrections are small and the processes have now been measured.
While the Rb measurements appear to be very solid, it is still unclear whether there is new
physics behind them. The next round of measurements will hopefully give us a much clearer
picture.
I would like to thank the organizers for an informative and enjoyable conference, and
the LEP electroweak working group and LEP and SLD heavy avor groups for their careful
summaries.
References
1. The LEP Experiments, Combining Heavy Flavour Electroweak Measurements at LEP,
CERN-PPE/96-017, Submitted to NIM.
2. The LEP Experiments and the LEP Electroweak Working Group, A Combination of
Preliminary LEP Electroweak Measurements and Constraints on the Standard Model
CERN-PPE/95-172
3. Kaoru Hagiwara, KEK preprint 95-184.
4. J. Field, Private communication
5. OPAL Collaboration, CERN-PPE/95-126.
6. V. Khoze, Private communication.

Rb IN THE MINIMAL SUPERSYMMETRIC
STANDARD MODEL: HOW BIG CAN IT BE?
Piotr H. ChankowskiInstitute of Theoretical Physics, Warsaw University,
ul. Ho_za 69, 00{681 Warsaw, Poland.
Abstract
The possible magnitude of the supersymmetric contribution to Rb with imposed all availablephenomenological constraints and demanding good quality of the global �t to the precisionelectroweak data is summarized. For small tan� and M2 � j�j and � < 0, Rb remainslarge, � 0:2180 even for the lighter chargino mass � 90 GeV. It is an interesting mixtureof the up-higgsino and gaugino. The large tan � option (still not ruled out) for enhancementof Rb is also reviewed. In this case Rb up to � 0:2186 can be obtained.

1. The succeful tests of the Standard Model (SM) to a per mille level are challenged bythe measurements of the partial Z0 widths into bb and cc quarks. The recent values of thesequantities [1], Rb = 0:2211�0:0016 and Rc = 0:1598�0:0070 disagree with the SM predictionfor mt = 170(180) GeV at the level of 3:1(3:4)� and 1:7(1:7)� respectively. It is thereforetempting to interpret these discrepancies as a �rst signal of physics beyond the SM.
As is well known, the value of the strong coupling, �s(MZ) = 0:123� 0:005, obtained fromthe SM �t to the electroweak data is strongly correlated with the values of Rb and Rc predictedin that model [2] and apparently does not agree with the value of �s(MZ) extracted at lowenergies e.g. DIS or lattice calculations. In a model which predicts Rb and Rc di�erent by �Rb
and �Rc than the SM we would get from the �t �s(MZ) di�erent by ��s = �4(�Rb + �Rc).This means that if both Rb and Rc anomalies were to be fully explained by some sort of "newphysics" we would get �s(MZ) � 0:16 which is unacceptably large and one would have tomodify also Z0 couplings to light quarks [3]. On the other hand, if the experimental result forRc is due to a large statistical uctuation then the full explanation of Rb by \new physics"would bring �s(MZ) down to �s(MZ) � 0:108 which is also hard to accept. In view of that itseems reasonable to take measured Rb as a statistical hint for value of Rb somewhat larger thanpredicted by the SM and investigate other models to see how big Rb they can accomodate.In this note (based on ref. [4]) we do that for the MSSM which is the most popular and wellmotivated extension of the SM.
Any improvement in Rb must not destroy the perfect agreement of the SM with the otherprecision LEP measurements and must be consistent with several other experimental con-straints (which will be listed later on). It is, therefore, important to discuss the changes inRb in the context of global �ts to the electroweak data. It has been shown [5] that the best�t of the MSSM single out either very small (� 1) or very large (� mt=mb) values of tan �(tan � � v2=v1 where v1;2 are the VEV of the two Higgs doublets). Therefore, our presen-tation will be divided into small and large tan � cases. In both cases, in order to maintainexcelent agreement with the bulk of the precision data (i.e. to avoid new sources of the cus-todial SUV (2) symmetry breaking in the left currents) the superpartners of the left handedquarks of the third generation (and all left leptons) must be su�ciently heavy [6, 5], say,M~qL ,M~lL
> O(500 GeV). At the same time, Rb is sensitive mainly to the masses and couplingsof the superpartner of the right handed top quark, charginos and - in the case of large tan �- superpartner of the right handed bottom and CP�odd Higgs boson A0 [7]. The latter donot a�ect SUV (2) too much. Therefore, the requirement of good overall �t is not essentiallyin con ict with requirement of enhancement of Rb [5].
2. We begin with the low tan � case. When the lighter stop, ~t1, is dominantly right-handed,as required for a large b~t1C coupling, its coupling to Z0 is suppressed (it is proportional tog sin2 �W ). Therefore, signi�cant contribution can only come from diagrams in which charginosare coupled to Z0. Their actual magnitude depend on the interplay of the couplings in theC�i ~t1b vertex and the Z
0C�i C�
j vertex. The pattern of the chargino masses (which are mixtures
of winos ~W� and the two higgsinos ~H1 and ~H2) and couplings is determined by the ratior �M2=j�j (of the wino and higgsino masses) and depends crucially on the sign of � [4]. TheC�i ~t1b coupling is large only for charginos with large ~H2 component (it is then dominated bythe top Yukawa coupling), the second - for charginos with large ~W� component in at leastone of its two-component spinors. This combination never happens for � > 0. Large Rb canthen only be achieved at the expense of extremely light C�j and ~t1, either already ruled outby the existing mass limits or in con ict with global �2. In addition, Rb is larger for r > 1 i.e.for higgsino-like chargino as the enhancement of the C�1 ~t1b coupling is more important than

of the Z0C�1C�1coupling.
For � < 0 the situation is much more favourable. In the range r � 1 � 0:5 the secondchargino which for low tan �, is very close in mass to the lighter one, has large ~H2 higgsinocomponent and ~W� component. Large couplings in both types of vertices of the diagram withcharginos coupled to Z0 give signi�cant increase in Rb even for the lighter chargino as heavyas 80 � 90 GeV.
Figure 1: �2 as a function of mC1for r � M2=j�j = 0:5 (solid lines), 1 (dashed), 1:5 (dotted), and 3 (dash-
dotted) for both signs of � for mt = 170 GeV, tan � = 1:4, MA = M~t2= 1 TeV. In lower pannels the best
values of Rb with the restriction �2 < �2min
+ 1 (here �2min
denotes the best �2 for �xed value of mC1) are
shown. In addition we required M~t1> 60 GeV.
We now turn our attention to a global �t to the precision. We impose the followingconstraints: 1) �(Z0 ! N0
1N0
1) < 4 MeV (N0
i are the four neutralinos), 2) BR(Z0 ! N0
1N0
2) <
10�4, 3) Mh > 60(MA > 55) GeV for small (large) tan � [10], 4) BR(b ! s ) in the range(1:2 � 3:4) � 10�4 5) BR(t ! new) < 45% (following ref. [8]) 6) Recent exclusion curves inthe (mN1
;M~t1) plane from D0 obtained under the assumption mC1 > M~t1
[9].The role of the lower limit on the Higgs boson mass depends on the mass of the heavier
stop ~t2 and the left-right mixing angle. For M~t2> 500 GeV (as required for good quality of
the global �t) and small mixing angles (necessary for large Rb) Mh is above the experimentallimit in a large range of the parameter space. Very small and large left-right mixing anglesare, however, ruled out by this constraint.
The b ! s decay is a very important constraint on the parameters space [11]. In theMSSM an acceptable value of BR(b! s ) can be obtained in two ways. One is a cancellation

between the H� and supersymmetric contributions. This mechanism is however in con ictwith the increase of Rb. The other mechanism is based on the choice of the proper rangeof the left-right mixing angles. It turns out [4] that for small tan � the region of acceptableBR(b! s ) partly overlaps with the region of large Rb.
The results of a global �t are presented in Fig. 1 as projections of �2 as a function ofmC1 for several values of r. We also show the best values of Rb obtained with the restriction�2 < �2min + 1 where �2min is the minimum of the �2 for �xed mC1.
The value of mt = 170 GeV chosen for the plots is close to the best value obtained from the�t. Larger values of mt give worse �2 and this is a re ection of the well known from the SM �tscorrelation between the Higgs boson and the top quark masses [1]. HereMh is constrained bysupersymmetry and cannot follow the increase of mt. In our �t tan � is bounded so that thetop quark Yukawa coupling remains perturbative up to the GUT scale (we take tan � � 1:4for mt = 170 GeV). We impose this theoretical constraint to remain on the conservative side,as lower values of tan � (for the same mt) give larger Rb.
For � > 0, the best �t is obtained for mC1 � 50 GeV, well below the new experimentallimit from LEP1.5, mC1 > 65 GeV [10]. This limit is valid for mC1 � mN1
> 10 GeV. Inprinciple, the degeneracy of the chargino and neutralino masses can be better than 10 GeV.This occurs for r > 10 with M1 � 0:5M2 (note however, that supersymmetric contributionto Rb decreases for very large values of r) or for any value of r for su�ciently large M1 (M1
being the bino mass). On the other hand, for mC1 = 65 GeV the maximal reachable value ofRb is only Rb = 0:2173.
For � < 0 �2 (Rb) is small (large) for much larger values of mC1. In fact the new LEP1.5limit is totally irrelevant in this case. A chargino with mass 70 � 90 GeV and with thecomposition described by M2 � j�j remains an interesting potential possibility. Supersym-metric contribution to Rb decreases with the stop mass but even for M~t1
= mC1 = 90 GeV,Rb > 0:2175. Moreover, a signi�cant enhancement inRb is consistent with both con�gurations:M~t1
> mC1 and M~t1< mC1.
3. Signi�cant enhacement of Rb is also possible for large tan� values, tan � � mt=mb.In this case, in addition to the stop - chargino contribution there can be even larger positivecontribution from the h0, H0 and A0 Higgs boson exchanges in the loops, provided thoseparticles are su�ciently light and non-negligible sbottom-neutralino loop contributions.
The discussion of large tan � case is relatively simpler as most of the results is symmetricunder the simultaneous change of sign of � and �t. In this case, for both signs of � the charginocomposition is the same in the up and down Weyl spinors and is a monotonic function of theratio r. For enhancement inRb the b~t1C� coupling is more important than the Z0CC coupling,so higgsino-like chargino (r� 1) is more favourable.
For large tan �, the b ! s rate does not constrain the value of Rb at all due to thecancellation between H+ and chargino/stop contributions [4]. The lower experimental boundon the lightest Higgs boson mass in the large tan � scenario is � 40 GeV. Since in the MSSMMA0 �Mh0 , our results are not constrained by this bound.
In the parameter space which gives enhancement in Rb, also the decays t ! new areenhanced. In addition to t ! ~t1N0
i , important is also the decay t ! bH+. For instance, formt = 170 GeV, tan � = 50, mC1 = 65 GeV and MA = 55(65) GeV we get BR(t ! bH+)ranging from 37(34)% up to 49(46)% depending on the stop sector parameters. However, thedecay t! bH+ is not easily distinguishable from the standard one, t! bW+, for MH+ closeto MW [8] and we do not impose this constraint in the global �t.
In Fig. 2 we present the results of a global �t in the large tan� case, together with the

corresponding values of Rb. Important feature of the global �2 is the decrease in the quality ofthe �t for mt = 180 GeV (compared to the best �t for mt = 170 GeV). This e�ect is strongerthan similar e�ect for low tan �.
Figure 2: �2 as a function ofmC1(� > 0) forMA = 55 GeV (solid) andMA = 65 GeV (dashed) for mt = 170
GeV, tan � = 50 and 180 GeV, tan � = 55. M~t2= 1 TeV, M~
bR= 130 GeV. In lower pannels the best values
of Rb with the restriction �2 < �2min
+1 (here �2min
denotes the best �2 for �xed value of mC1) are shown. In
addition we required M~t1> 60 GeV.
The values of Rb are almost insensitive to the value of M~t1in the range 50 � 100 GeV
and show the expected dependence on MA and mC1 with the maximal values for very lightcharginos. It is, therefore, worth recalling that the new limit mC1 > 65 GeV is based on theassumption mC1 �mN1
> 10 GeV. As for low tan�, better degeneracy of the two masses isachieved for r > 10 (and/or for M1 > 0:5M2) and the best �ts for mC1 < 65 GeV is obtainedjust for such values of r. Still, the quality of the �t with charginos below 60 GeV decreasessigni�cantly mainly due to the chargino contribution to the Z0 wave function renormalizationwhich a�ects �Z [12]. Thus, the largest Rb wihich can be obtained requiring good quality ofthe �t is � 0:2186. It is also remarkable, that due to the combined e�ect of neutral Higgsexchange and the chargino-stop together with the neutralino - sbottom contributions, the Rb
remains greater than 0.2175 for masses well above the present experimental limits. E.g., formC1 �M~t1
�MA � 70 GeV, Rb = 0:2178.
4. We conclude that the new LEP1.5 limit,mC1 > 65 GeV still leaves open the possibilityof a supersymmetric explanation of Rb up to 0:2180(2186) for small (large) tan�. We also
conclude that Rb > 0:2175 (which is still interesting - see [13]) even for mC1 = M~t1= 90
GeV both in the small and large tan � cases. Thus LEP2 may not resolve this question. It isalso worth noting that the best �t in the MSSM give �2 � 14:5 for mt = 170 GeV whereassimilar �t in the SM gives at the minimum (arising for mt = 169 GeV and MHSM = 70 GeV)�2 � 18:4.
Finally, we stress that a good quality of the global �t requires the hierarchy M~t1� M~t2
(i.e. M~tR�M~tL
). This hierarchy is natural if the low energy values of the soft squark masseshave their origin in the renormalization group evolution from the GUT scale with the initialcondition m2
0 �M2
2 .
References
[1] The LEP Electroweak Working Group, CERN preprint LEPEWWG/96-01.
[2] A. Blondel, C. Verzegnassi Phys. Lett. 311B (1993) 346,J. Erler, P. Langacker Phys. Rev. D52 (1995) 441.
[3] P. Chiapetta these proceedings.
[4] P.H. Chankowski, S. Pokorski hep-ph/9603310.
[5] P.H. Chankowski, S. Pokorski Phys. Lett. 366B (1996) 188.
[6] P.H. Chankowski et al. Nucl. Phys. B417 (1994), 101.
[7] M. Boulware, D. Finnell Phys. Rev. D44 (1991) 2054.
[8] S. Mrenna, C.-P. Yuan Phys. Lett. 367B (1996) 188.
[9] S. Abachi et al. (D0 Collaboration) preprint FERMILAB-PUB-95-380-E (1995).
[10] L. Rolandi, H. Dijkstra, D. Strickland and G. Wilson (ALEPH, DELPHI, L3 and OPALcollaborations) Joint Seminar on the First Results from LEP1.5, CERN, Dec. 1995.
[11] R. Barbieri, G.F. Giudice Phys. Lett. 309B (1993) 86.
[12] R. Barbieri, F. Caravaglios, M. Frigeni Phys. Lett. 279B (1992) 169.
[13] A. Blondel these proceedings.

May 1996
HADROPHILIC Z0: AN EXPLANATION OF LEP1,
SLC AND CDF ANOMALIES?
P. ChiappettaCentre de Physique Th�eorique, UPR 7061,
CNRS Luminy, Case 907, F-13288 Marseille Cedex 9.
Abstract
In order to explain possible departures from the Standard Model predictions of b�b and c�cproduction at Z peak, we propose the existence of a Z 0 vector boson with enhanced couplings toquarks. We �rst show that this proposal is perfectly consistent with the full set of LEP1/SLCresults. We then show that there is a predicted range for enhanced Z 0q�q couplings whichexplains, for Z 0 masses in the TeV range, the excess of dijet events seen at CDF and leads tovisible deviations at LEP2.

Mai 1996
LE Z0 HADROPHILE EXPLIQUE-T-IL
LES ANOMALIES OBSERV�EES
A LEP1, A SLAC ET A CDF ?
P. ChiappettaCentre de Physique Th�eorique, UPR 7061,
CNRS Luminy, Case 907, F-13288 Marseille Cedex 9.
R�esum�e
A�n d'expliquer les d�eviations par rapport aux pr�edictions du Mod�ele Standard observ�ees �aLEP et au SLC dans le secteur des quarks lourds ( b�b et c�c), nous proposons l'existence d'unboson vectoriel Z 0 dont le couplage aux quarks est renforc�e. Nous montrons tout d'abordque cette hypoth�ese est parfaitement consistante avec les donn�ees de LEP et du SLC. Nous�etablissons ensuite l'existence d'un domaine de valeurs des couplages Z 0q�q capable d'expliquer,pour des masses du Z 0 autour du TeV, l'exc�es d'�ev�enements �a deux jets observ�e �a CDF etd'induire des e�ets visibles �a LEP2.

1 Introduction
Through measurements of the Z ! b�b and Z ! c�c widths and asymmetries, LEP and SLC
have given1) indications for possible departures from the SM predictions for b and c couplings
at the level of a few percent. In the b�b case such anomalies could be interpreted as a signal for
NP in the heavy quark sector: anomalous top quark properties2);3), ETC models4), Anomalous
Gauge boson couplings5), Supersymmetry contributions, new Higgses,6);7). A common feature
of all these explanations is that they fail to explain the possible existence of c�c anomalies.
We would like to propose8) a simple explanation based on the existence of a hadrophilic Z'
vector boson, i.e. one which would couple universally to quarks more strongly than to leptons.
We shall not propose here a speci�c model. We shall be limited to extracting from LEP1/SLC
experiments several suggestions about the required Z 0 properties. To achieve this, we shall �rst
rely on a model independent framework for the analysis of Z � Z 0 mixing e�ects9), in which
the Z 0f �f couplings were left free. We will then derive experimental informations on the Z �Z 0
mixing angle �M and on the Z 0f �f couplings showing that, indeed, the anomalies in b�b and c�c
production can be described by such an hadrophilic Z 0.
The next relevant question to be answered is that of whether the values of the Z 0 couplings
that we determined in this way do not contradict any already available experimental constraint
and in particular, the signi�cant excess of dijet events for large masses (above 500 GeV) seen
at CDF10). We shall show that this phenomenon could be naturally explained in terms of an
hadrophilic Z 0, whose mass lies in the range between 800 GeV and 1 TeV. In Ref.11) more
restrictions have been imposed on the Z 0 couplings, namely from assuming equality of left-
handed couplings within SU(2)L doublets and leaving free the right handed couplings. Our
next step will then consist of examining the consequences of this solution for other processes,
in particular possible Z 0 e�ects in e+e� ! f �f at LEP2.
2 Analysis of LEP1/SLC results.
We consider Z � Z 0 mixing e�ects at the Z peak in a model independent way following the
procedure given in ref.9). As well-known, the two relevant e�ects consist in a modi�cation of
the Z couplings to fermions, proportional to a mixing angle � �M , and in a Z mass shift which
induces a contribution to the �� parameter:
�Z0
� ' �2MM2
Z
M2Z0
(1)

From the latest available data1), we derive an upper value for the mixing angle at two standard
deviations:
j�M j <p0:005
MZ
MZ0
(2)
We then normalize the Z 0f �f couplings in the same way as the Zf �f ones:
�i e(0)2s1c1
�[g0V f � g0Af 5] (3)
(for Z couplings: gV l = �v12; gAl = �1
2; v1 = 1� 4s21; s
21c
21 = ��(0)=
p2G�M
2Z).
We measure the magnitude of the Z 0f �f couplings by de�ning the ratios �V l �g0
V l
gV land
�Al �g0
Al
gAl. The Z 0 couplings are summarized below in the form of allowed bands, at two
standard deviations, assuming that j�M j saturates the bound,eq. (2), with the two possible
signs: �M = �1.
Z 0l�l couplings
�M�V l ' (�2:25 � 6:25)(MZ0
1TeV) (LEP ) �M�V l ' (+1:75� 6:25)(
MZ0
1TeV) (SLC) (4)
�M�Al ' (�0:2� 0:5)(MZ0
1TeV) (5)
Z 0b�b couplings
�M�V b ' (�3:45� 20:72)(MZ0
1TeV) (LEP ) �M�V b ' (�24:24 � 25:98)(
MZ0
1TeV) (SLC) (6)
�M�Ab ' (+4:58� 9:84)(MZ0
1TeV) (LEP ) �M�Ab ' (+14:54 � 12:47)(
MZ0
1TeV) (SLC) (7)
Z 0c�c couplings
�M�V c ' (�6:94� 26:60)(MZ0
1TeV) (LEP ) �M�V c ' (�20:38 � 40:62)(
MZ0
1TeV) (SLC) (8)
�M�Ac ' (�7:88 � 8:46)(MZ0
1TeV) (LEP ) �M�Ac ' (�6:01 � 9:70)(
MZ0
1TeV) (SLC) (9)
From SLC data, a de�nite non zero value for �Ab is suggested. A priori we would not trust
values larger than the QCD strength (�s ' 0:12).
From the very precise measurement of �had we can derive a strong correlation between ��b
and ��c, that is peculiar of our Z 0 hypothesis. Our universality assumptions lead to:
��b�b
' �0:5��c�c
(10)
Thus, in a natural way, the relative shifts in �b and in �c are predicted to be of opposite
sign, with a ratio consistent with the experimental data and errors.

3 Analysis of CDF dijet events in terms of a Z 0.
The CDF collaboration10) has reported the observation of an excess of events with two-jet mass
above 500 GeV, compared to the QCD prediction. The two jet production in hadronic collisions
has been computed at next to leading order in QCD12). We shall now investigate whether the
observed dijet excess may be explained in terms of a hadrophilic Z 0. We have therefore to
add to the dominant QCD component the weak contributions arising from W,Z, exchanges
and from the Z 0 with couplings taken within the range suggested by the LEP/SLC analysis.
Since the weak contribution due to SM bosons has been evaluated at leading order13), we shall
therefore restrict our calculation to leading order.
The result of our investigation is shown in �gure 1. As one can see, the observed dijet excess
can be satisfactorily explained forMZ0 around 800�900 GeV and for typical values of couplings
j�Abj = j�V bj ' 3. The excess of dijet events has been �tted in Ref.11) by a Z 0 of mass 1 TeV
provided that its quark couplings are large and its width lies below 500 GeV. The uncertainty
due to our imperfect knowledge of the structure functions is small since we calculate a ratio.
The dominant weak contribution is due to the Z 0 pole: we are therefore not sensitive to the
sign of Z 0q�q couplings.
4 Z' E�ects in hadronic production at LEP2
We shall examine possible visible consequences at LEP2 of our assumption that a hadrophilic Z 0
exists. Since there is no indication for large Z 0l�l couplings, we shall concentrate our attention
on the three hadronic observables that will be measured at LEP2, i.e. the b�b cross section
�b(q2), the b�b forward backward asymmetry AFB;b(q
2) and the total hadronic production cross
section �h(q2), wherepq2 is the total center of mass energy14). The calculated shifts on these
three quantities due to a Z 0 will depend on products of Z 0 quark couplings with Z 0 lepton
couplings. Following a conservative attitude, we shall assume therefore that the leptonic Z 0
couplings lie in the domain of non observability at LEP215), corresponding for q2 = (175GeV )2
to the following limitations on the leptonic ratios:
j�V lj <� 8:02(MZ0
1TeV) j�Alj <� 1:01(
MZ0
1TeV) (11)
Using as input the upper bounds, we shall �rst compute the relative shifts ��b(q2)
�band
�AFB;b(q2)
AFB;b,
using a theoretical approach proposed very recently16). In �gure 2 we present our results for
the Z 0b�b couplings rescaled by the factor MZ0
1TeV. The observability regions of �gure 2 correspond

to a relative Z 0 e�ect in ��b�b
of at least �ve percent (dark area) and ten percent (grey area). As
one can see from an inspection of the �gure, values of the couplings lying in the neighbourhood
of j�Abj = j�V bj ' 3 should not escape indirect experimental detection in the �nal b�b channel
at LEP2 according to the analysis presented in ref.15). These values of the Z 0 couplings would
also be able to generate a clean e�ect in the total hadronic observables.
-10 -5 0 5 10
-6
-4
-2
0
2
4
6
Fig. 1 Fractional di�erence between dijet CDFdata10) and QCD compared to a hadrophilic Z 0
of mass MZ0 = 900 GeV for �V b = 4, �Ab = 3,�V c = 4 and �Ac = 3.
Fig. 2 Domains in Z 0b�b vector (abscissa) andaxial (ordinate) coupling ratios scaled by thefactor (MZ0=1TeV ). Observability limits from�b at LEP2 with two possible accuracies, 5%(Central dark), 10% (Central grey).

5 Conclusions
The presence of anomalous e�ects in heavy quarks decay channels at Z peak could be explained
by a Z 0 more strongly coupled to quarks than to leptons, a hadrophilic Z 0. It can also naturally
explain the observed excess of high mass dijet events at CDF provided that its couplings to
quarks are quite large, its mass range lies around 800�1000 GeV and it is wide. The existence
of a hadrophilic Z 0 with couplings and mass range constrained to produce LEP1/SLC and CDF
anomalies could be con�rmed by hadronic measurements at LEP2.
References
[1] P.B. Renton, Rapporteur talk at the Int. Conf. on High Energy Physics, Beijing (1995);see also P. Langacker, hep-ph/9511207; see also LEP and SLC contributions in theseproceedings.
[2] E. Malkawi and C.P. Yuan, Phys. Rev. D50 (1994) 4462.
[3] G.J. Gounaris, F.M. Renard and C. Verzegnassi, Phys. Rev. D52 (1995) 451.
[4] E.H. Simmons, R.S. Chivukula and J. Terning, BU-HEP-95-3x(1995).
[5] F.M. Renard and C. Verzegnassi, Phys. Lett. B345 (1995) 500 .
[6] J.D. Wells and G.L. Kane, SLAC-PUB-7038(1995); P. Chankowski in these proceedings.
[7] D. Comelli, F.M. Renard and C. Verzegnassi, Phys. Rev. D50 (1994) 3076.
[8] P. Chiappetta, J. Layssac, F.M. Renard and C. Verzegnassi, hep-ph 9601306, to appear inPhys. Rev. D.
[9] J. Layssac, F.M. Renard and C. Verzegnassi, Phys. Lett. B287 (1992) 267 , Z. Phys. C53(1992) 97.
[10] E. Buckley-Geer, FERMILAB-Conf-95/316-E (1995), to appear in Proccedings of Inter-national EPS Conference on HEP, Brussels.
[11] G. Altarelli, N. Di Bartolomeo, F. Feruglio, R. Gatto and M. Mangano, hep-ph 9601324.
[12] S. D. Ellis, Z. Kunszt and D. E. Soper, Phys. Rev. Lett. 69 (1992) 1496.
[13] C. Bourrely, J. Ph. Guillet and J. So�er, Nucl. Phys. B361 (1991) 86.
[14] Proceedings of LEP2 workshop (1995), CERN report 96-01 (G. Altarelli, T. Sjostrand andF. Zwirner eds).
[15] P. Chiappetta, C. Verzegnassi et al, in Proceedings of LEP2 workshop (1995), CERNreport 96-01 vol 1 p577 (G. Altarelli, T. Sjostrand and F. Zwirner eds).
[16] F.M. Renard and C. Verzegnassi, Phys. Rev. D52 (1995) 1369 and Phys. Rev. D53(1996) 1290 .

Summary: Rb, Rc and QCD
Alain BLONDEL
L.P.N.H.E. Ecole Polytechnique, IN2P3-CNRS, 91128 Palaiseau France; and CERN, PPE division
The Standard Model (SM) is ruled out at 99.7% C.L. by the measurements of Rb and Rc, ifone assumes Gaussian errors. Experiments are in good agreement with each other, all onthe same side of the SM. Systematic errors dominate the average. The averaging procedureis mechanically correct, and could not be incriminated for a bias in the average or for toosmall errors. Of course, it could not inject systematic uncertainties that would have beenunderestimated or overlooked by all experiments.
New results were presented: i) a new method by SLD uses a tag based on secondaryvertex with a high invariant mass; ii) new measurements of c! D� production rate makesingle tag measurements of Rc less model-dependent; iii) gluon splitting g ! b�b is mea-sured in agreement with the assumed theoretical values, and cannot explain the Rb discrep-ancy.
Possible correlations of tagging efficiency between hemispheres were identified as theweakest item in the experimental procedure. At present, these correlations are calculatedfrom hadronization Monte-Carlos, errors are MC statistics only, and, consequently, as-sumed uncorrelated between experiments. A negative correlation of -2%, common to allmethods and experiments, would be necessary to bring Rb in agreement with SM – andwith the measurement of the hadronic width. A particularly vicious possibility was dis-cussed during the Rencontres: b-hadron momentum correlations from fragmentation. Thesubject is an area of intense study.
Meanwhile, Supersymmetry volunteers to explain part of the Rb effect, but no discrep-ancy in Rc, please. To explain both, one has to call in the Hadrophilic or Leptophobic Z’.
With a large fraction of LEP Z peak data not yet analysed, more data to come fromSLD, and systematic error studies going on, the situation might change dramatically in thenext year.

1 Introduction
AVERAGE
0.2202�0.0016 SM=0.2155
0.2 0.21 0.22 0.23 0.24
Rb
Rc = 0.172 (fixed)
ALEPH (92) lifetime0.2192±0.0022±0.0026
DELPHI (92+93) lifetime0.2216±0.0017±0.0027
DELPHI (92+93) mixed0.2231±0.0029±0.0035
DELPHI (92+93) multivariate0.2194±0.0032±0.0022
OPAL (92-94 prel) lifetime + lepton0.2197±0.0014±0.0022
ALEPH (90+91) event shape0.228±0.005±0.005
L3 (91) event shape0.222±0.003±0.007
LEP lepton fits0.2219±0.0039
SLD (93-95 prel) vtx mass0.2176±0.0034±0.0017
0.2 0.21 0.22 0.23 0.24
0.1 0.15 0.2 0.25
Rc
ALEPH (90-91) lepton0.165±0.005±0.020
DELPHI (90-93) lepton0.1623±0.0085±0.0209
DELPHI (91-93) D+,D0,Ds,Λc0.164±0.011±0.019
DELPHI (91-94) πD, ππ double tag0.162±0.009±0.009
OPAL (90-92) D*0.148±0.008±0.014
OPAL (92-94) double tag0.155±0.013±0.017
OPAL (91-93) D+,D0,Ds,Λc0.166±0.011±0.014
Average0.1598±0.0070
SM=0.172
Figure 1: Measurements of Rb and Rc.
This paper summarizes the results of theRb,Rc mini-workshop [1] that took place in XXXIrencontres de Moriond, QCD and hadronic interactions. The measured values of Rb andRc are shown in figure 1. The various determinations agree well with each other. Theaverages are dominated by systematics:
Rb = 0:2211 � 0:0010stat � 0:0014syst (1)
Rc = 0:1598 � 0:0038stat � 0:0059syst (2)
with a -30% correlation. Consequently, the SM exclusion confidence level of 99.7%, whichassumes Gaussian errors, should be taken with a grain of salt. Many systematic errors arecommon, and the first accomplishment of the Heavy Flavour team of the LEP electroweakWorking Group (LEPEWWG) was to unify the terminology for sources of systematic er-rors. Indeed, uncertainties of similar physical origin could be termed differently. A wellknown example is given by the charm leptonic branching ratio (which affects the leptontags) and the charm lifetime (which affects the lifetime tags). They are both governed bythe D0=D+ production ratio, itself driven by the D� rate. These sources properly labeled,the variation of the corresponding parameters were unified between experiments. The restof the job is heavy but straightforward use of correlation matrices. However, as P. Wellspointed out, the LEPEWWG, consisting of members of the experiments, could not havediscovered sources of systematics that everyone ignored. It was indeed the point of thisworkshop to expose the analysis in detail, so that such possible problems could be pointedout.

2 Progress in the charm sectorUnderstanding charm production and decays is critical to measure Rc, but also as a back-ground in the measurement ofRb. Individual charmed hadrons have different leptonic BRs,lifetimes, decay multiplicities and possibly fragmentation functions, all of which affect de-tection efficiency of both charm- and b-tags.
There are two ways out of this problem.1.Eliminate charm backgroundBy cutting on the invariant mass of particles originating from a secondary vertex, at around2 GeV, charm background can efficiently be removed. This was first shown by the SLDcollaboration, and will certainly be done at LEP. The interaction point at SLC is so smalland well determined, that the line of flight between the primary and secondary verticescan be determined well enough to reconstruct the missing transverse momentum at thesecondary vertex, which can be added in the invariant mass determination . This allowsfurther improvement in the tag, but might be difficult at LEP.2.Measure charm properties at LEPSubstantial progress has been achieved in the measurement of charmed hadron productionrates.–Double-tagging measurements of Rc using D� tagging also determine P (c ! D�). Sofar, it was assumed that this probability was center-of-mass independent, and the value0:178� 0:013 from the � region were used. The new average from LEP is 0:164� 0:008.Although the average of these two numbers is presently used, LEP could now certainly usethe LEP value alone, avoiding this assumption altogether. The new input raised the valueofRc from the singleD� tag analysis, which incidently is the only individual measurementof Rc that disagrees with the SM value.–Measurements of D+;D0;Ds;�c production rates allow by straight summation a rathersolid determination of Rc.
So far these improvements have been performed only by some of the SLD/LEP exper-iments, and with partial statistics. The situation should still improve considerably. Thecharm sector constitutes the bulk of the given systematic error on Rb.
3 CorrelationsA large amount of discussion was devoted to the question of correlations of b-tagging be-tween hemispheres. There are several identified sources of correlations:– geometry produces positive correlations.– gluon radiation: very hard radiation brings both bs in the same hemisphere, leading tonegative correlation. Hard radiation leaves the two bs in opposite hemispheres, with softermomenta, leading to positive momentum and efficiency correlation.–sharing a common primary vertex leads to negative correlations.
The size of these effects is typically 5% or so. With the double tagging technique,Rb is directly affected by correlations. A characteristic common to all tagging techniquesis a very strong sensitivity of the b-tagging efficiency with b-hadron momentum. This isshown in figure 2. Consequently, the method is very sensitive to proper description by thehadronization Monte-carlos of the b-hadron momentum correlations. This point was ad-dressed by Branson, and lead to intense discussion, in particular by Khoze. A negative

Figure 2: Momentum dependenceof the b-tagging efficiencyin the ALEPH published analysis [2].This momentum dependence isvery similar for all experiments.
correlation of -2%, common to all methods and experiments, would be necessary to bringRb in agreement with SM. Priority will undoubtedly be given to gathering experimentalinformation on this point, and should lead to exciting experimental results in the near fu-ture.
In the present averaging, indeed, the tagging correlations are calculated by hadroniza-tion MC’s, errors are MC statistics only, and therefore averaged as independent. Of coursethis is a weak point, which will require clarification before the Rb discrepancy is finally es-tablished.
4 Gluon splitting
The first idea to explain the observed Rb discrepancy was that e+e� ! q�qb�b or e+e� !q�qc�c, although accounted for in the analysis, had been underestimated. These processeshave now been identified and measured by OPAL and DELPHI, and found to agree withthe expected values. Using the measured values instead off the JETSET predictions wouldshift Rb by �0:0002 � 0:0003. Gluon splitting cannot explain the discrepancy.

5 True exciting new physicsIf your enthusiasm has survived the previous sections, you might imagine thatRb is indeedsignal for new physics. There are two classes of possible explanations, new interaction attree level or radiative effects in the Z! bb vertex.
New interaction at tree levelSince the SU(2)L�U(1) gauge symmetry completely determines neutral current couplingswith one parameter sin2 �e�w with a level of precision far superior to the observed discrep-ancy, one has to turn to an additional intermediate boson, e.g. a Z’. This object has tobe rather heavy to have escaped detection so far. The Z’ couplings to hadrons must berather large to affect Rb;Rc, but respect of leptonic observables requires small couplingsto leptons. Thus the name hadrophilic [3] or leptophobic [4]. Excitement grew around thispossibility when the high Et anomaly –another effect in the 2-3 � range – was reported.Although this could possibly due to our limited knowledge of the gluon structure function,it is incredibly tempting to see it as the foothill of a Z’ resonance.
The Z’ models assume family universality. The typical number of parameters is 10:Z’ mass, Z-Z’ mixing angle �, and 8 couplings, gfv ; g
fa for f = e; �; u; d. A solution with
MZ0 ' 1000 GeV, � = 2:10�3, small lepton couplings, and large couplings to quarks,is found to agree very well with all experimental data, reducing the �2 of the fit by about10 units. The constraint set by the hadronic Z width forces the deviations to Rb and Rc tobe in the proportion �Rb ' �0:5�Rc, in agreement with observation within errors. Thisanticorrelation ensures that the Z’ scenario does not spoil the SM agreement with the moreprecise chiral couplings measurements from neutrino scattering by more than 1.6 � [5].
Although this scenario explains most of the 1-3 � anomalies presently observed, it israther unnatural and implies a rather large number of additional parameters.
New Physics in Z! bb vertex correctionsA large number of scenarios [6] have been proposed to explain the Rb anomaly by Z! bb
vertex corrections. Since the b is isopartner of the top, it attracts naturally interactions withnon-SM Higgses or other symmetry breaking objects. As a consequence all non-b physicsremains untouched, in particular the charm quark couplings. The correction to Rb can thenbe inferred either i) from the direct measurement of Rb with Rc fixed to SM, or ii) from themeasurement of the hadronic width using the 1995 PDG average�(M2
Z) = 0:118�0:003:
Direct; Rc �xed : Rb = 0:2202 � 0:0016 �Rb = +0:0047 � 0:0016 (3)
from �had : Rb = 0:2167 � 0:0013 �Rb = +0:0012 � 0:0013 (4)
average : (�2 = 2:9) Rb = 0:2181 � 0:0017 �Rb = +0:0026 � 0:0017: (5)
These two values being somewhat inconsistent, the error on the average has been increasedas usual by
p�2 = 1:7. It follows that the Rb discrepancy is reduced to 1.2%, with a
significance of only 1.5 �.The most appealing scenario is Minimal Supersymmetry (MSSM), as described by
Chankowski. Again, the parameter space is very large. Although most authors were apriori expecting negative values of �Rb, there are regions of the supersymmetric parame-ter space where positive corrections occur.a) the low tan� region. Loops with light chargino C1 and s-top ~t can generate �Rb of theright sign and magnitude, up to Rb � 0:2180, obtained in the vicinity of the constraints

mC1> 65 GeV, m~t > 60 GeV, imposed by the non-observation of these particles at LEP
1.5 [7].b) the large tan � region. Interestingly this solution would imply a large t! H+b decayrate, which might be visible in further investigations of top decays. An even larger valueof Rb � 0:2186 could be obtained at the edge of the present LEP1.5 limits.
These MSSM solutions require chargino and s-top that are within reach of LEP2, a veryexciting feature. Nevertheless, they cannot produce effects as large as that suggested bythe direct measurement of Rb.
6 Conclusions
The situation of Rb and Rc has been reviewed extensively. Beautiful new methods wereshown. New results on charm have reduced the Rc discrepancy to 1.7 �. The new SLDmeasurements ofRb leads the way to charm-background free measurements. A potentiallydangerous weakness in the treatment of efficiency correlations between event hemisphereshas been identified. A rather large effect would be necessary to explain theRb discrepancy,but this topic will certainly be studied further. With a large fraction of LEP1 data notyet analysed, more data to come from SLD, and systematic error studies going on, thesituation might change dramatically in the next year. Gluon splitting can now be ruled outby experiment as a source of excess of b events. A Z’ can be invoked to explain both theRb;Rc discrepancies and many others. More naturally, the MSSM can produce effects onRb only, but then the direct measurement of Rb is somewhat contradicted by that of thehadronic width. In this case the best guess for an anomaly is �Rb = +0:0026 � 0:0017.This is in fact very consistent with the MSSM scenarios, most of which also predict newparticles for LEP2. One way or another, the next coming months will be exciting.
AcknowledgementsIt is a pleasure to congratulate the organisers of Moriond QCD for organizing this veryfruitful and open discussion. My colleagues have done a beautiful and thorough job atlooking for mistakes or loopholes in their own work. All controversial conclusions in thissummary are my responsibility.
References
[1] A. Blondel, A. Bazarko, J. Snyder, F. Martinez-Vidal, H. Przysiezniak, J. Baudot,G. Calderini, J. Branson, P. Wells, P. Chiapetta, P. Chankowski for Moriond QCD1996. Related talks were given by M. Hildreth, E. Etzion, N. Di Bartolomeo and S.Pokorsky in Morriond Electroweak 1996.
[2] ALEPH Coll., Phys. Lett. B313 (1993) 535.[3] P. Chiapetta et al., hep-ph 96011306.[4] G. Altarelli et al., hep-ph 96011324.[5] This point was brought up in Moriond Electroweak 1996, analysed “on-line” by K.
McFarland, and followed-up by an addendum to [4], to appear in Phys. Lett. B.[6] See bibliography in P. Chiapetta’s article.
For an extensive review of such scenarios see: P. Bamert et al., hep-ph 9602438.[7] J. Nachtman and P.P. Rebecchi, Moriond Electroweak 1996.