european public finances and the great recession: france ... · european public finances and the...
TRANSCRIPT
FISCAL STUDIES, vol. 36, no. 4, pp. 405–430 (2015) 0143-5671
European Public Finances and the GreatRecession: France, Germany, Ireland, Italy,Spain and the United Kingdom Compared∗
ANTOINE BOZIO,† CARL EMMERSON,‡ ANDREAS PEICHL§and GEMMA TETLOW♦
†Paris School of Economics; Institut des politiques publiques (IPP)([email protected])‡Institute for Fiscal Studies([email protected])§Centre for European Economic Research (ZEW); University of Mannheim; CESifo;Institute for the Study of Labor (IZA)([email protected])♦Institute for Fiscal Studies; University College London([email protected])
Abstract
We compare economic trends over the financial crisis, and the tax and benefit reforms implemented in response, across six EU countries. Countries where the crisis led to a relatively greater increase in public spending than a decline in tax revenues – in particular, France and Italy – are found to have implemented consolidations that are more reliant on tax increases than spending cuts. While in Italy households with children have lost less from tax and benefit reforms than pensioner households, the reverse is true in Ireland and the United
∗The authors would like to thank the authors of the other papers in this special issue of Fiscal Studies.
Bozio is grateful to the Labex OSE (ANR-10-LABX-93-01) for funding his contribution to this paper.Emmerson and Tetlow are grateful to the Economic and Social Research Council (ESRC) for funding theircontribution to this paper through the grant entitled ‘Combining Micro- and Macro-Economic Approachesto Fiscal Policy Evaluation’, provided under the auspices of the Centre for the Microeconomic Analysis ofPublic Policy (grant number RES-544-28-5001). Any errors are the responsibility of the authors alone.
Keywords: fiscal policy, Great Recession, public deficit, public debt, redistribution.JEL classification numbers: E60, H12, H23, H50, H60.
C© 2015 The Authors. Fiscal Studies published by John Wiley & Sons Ltd. on behalf of Institute for Fiscal Studies.
This is an open access article under the terms of the Creative Commons Attribution License, which permits use, distributionand reproduction in any medium, provided the original work is properly cited.
406 Fiscal Studies
Kingdom. The pattern of cuts to public services also varies: France, Irelandand the UK chose to protect spending on health and schools from cuts, whileItaly and Spain chose to cut spending on these services relatively deeply.One clear improvement has been the introduction of greater independence andtransparency in the production of economic and fiscal forecasts. Unfortunately,in many cases, the fiscal response to the crisis missed opportunities to improvethe overall efficiency of the tax system.
Policy points
� The countries that experienced the largest deteriorations in their underlyingpublic finances as a result of the Great Recession tended to be those thatwere previously most heavily reliant on revenues from the financial sectorand the taxation of property and other assets. Risks to tax and spendingforecasts and how they are correlated should be an important considerationwhen setting fiscal policy.
� The period since the Great Recession provides numerous examples acrossEurope of missed opportunities to improve the efficiency of the taxsystem as countries implemented significant fiscal consolidations. In thenext phase of reforms, these opportunities should be taken. Failing that,policymakers should, at least, avoid adding to existing deficiencies.
� In some cases, reforms have proven to be fragile. Unstable reforms riskincreasing uncertainty; policymakers should instead try to ensure that theirreforms are implemented in a way that makes them as robust as possible.
� A clear improvement across most European countries has been theintroduction of greater independence and transparency in the productionof economic and fiscal forecasts. There are opportunities to improve thisfurther and, at a minimum, care should be taken to ensure that the progressmade in the last few years in this area is not lost.
I. Introduction
The global financial crisis led to deep recessions across many advancedeconomies. These were associated with falls in employment rates and sharpincreases in budget deficits. The size and duration of these adverse effectsvaried substantially across countries. The fiscal response also varied, buttypically comprised two parts: an active fiscal stimulus package, which wastemporary and aimed at limiting the length and depth of the recession, and afiscal consolidation, which was permanent and aimed at restoring the financialsustainability of the public finance position.
This special issue of Fiscal Studies contains papers examining the evolutionof the public finances in six European countries – Andre et al. for France,
C© 2015 The Authors. Fiscal Studies published by John Wiley & Sons Ltd. on behalf of Institute for Fiscal Studies
European public finances and the Great Recession 407
Blomer et al. for Germany, Keane for Ireland, Figari and Fiorio for Italy, Martıand Perez for Spain and Emmerson and Tetlow for the United Kingdom. Eachpaper looks at the evolution of GDP, employment and unemployment rates,and the public finances in the run-up to, and through, the financial crisis. Eachthen describes the scale, timing and nature of the fiscal response to the crisis,and the impact of the reforms on the incomes of different households and onspending on different public services. Each paper also assesses the extent towhich policymakers took advantage of the crisis to improve the efficiency ofthe overall tax and benefit system.
Compared with usual cross-country macroeconomic assessments of publicfinances (for example, by the IMF or the OECD), this special issue reliesheavily on the use of micro data and detailed microsimulation modelsand hence presents a deeper analysis that aims at enhanced comparabilitybetween these countries. In particular, the papers ask: ‘Which taxes have beenincreased?’, ‘Where has public spending been cut?’, ‘How do these changesaffect incentives to work, save and invest?’ and ‘Which households haveexperienced the greatest losses from these changes?’.
This introductory paper provides a brief comparison and discussion of someof the key stories and common themes that emerge from the six papers. SectionII looks at the impact of the financial crisis on GDP per head, employment andunemployment, and the evolution of the underlying public finance position.Section III compares the fiscal consolidations implemented in each of thesecountries up to the end of 2014, in terms of their scale and composition. SectionIV provides an assessment of the reforms carried out after the crisis, in termsof their ability to increase the efficiency of public interventions. Section Vconcludes.
II. Impact of the crisis
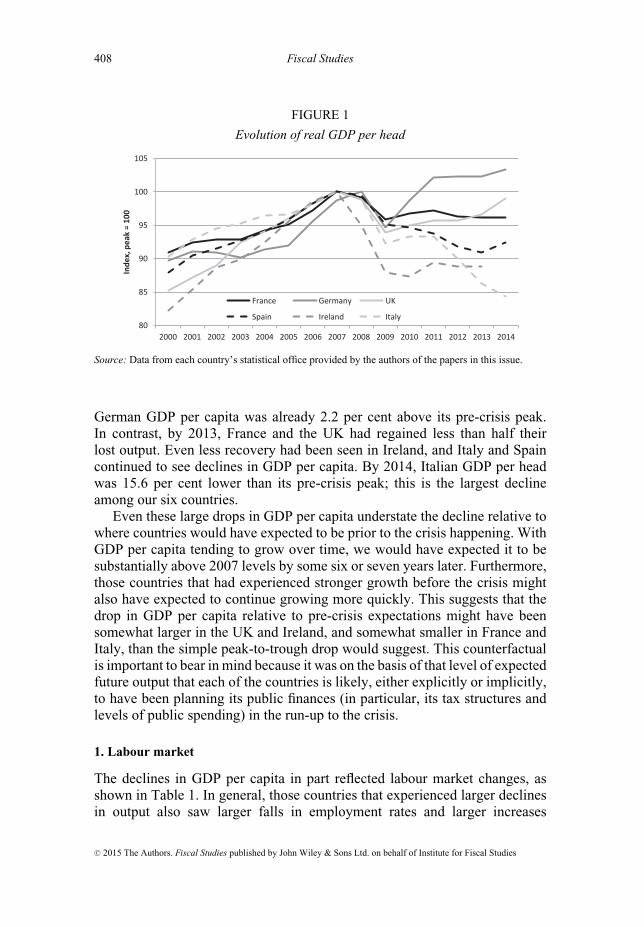
All six countries experienced sustained growth over the pre-crisis period, from2000 to 2007, as shown in Figure 1. Growth in GDP per capita was fastestin Ireland (averaging 2.8 per cent per year) and the UK (2.3 per cent), whilethe weakest growth was seen in France, Germany and Italy (all below 1½ percent per year). All countries experienced a decline in GDP per capita as thefinancial crisis struck – France, Ireland, Italy, Spain and the UK all experiencedcontractions from 2008 onwards, while Germany’s economy started to contracta year later. In 2009, GDP per capita was 4–8 per cent below its peak level infive of our six countries, with the smallest drop being in France (4.2 per cent).The outlier was Ireland, which experienced the most dramatic initial declinein GDP per capita: Irish GDP per capita was 12.0 per cent lower in 2009 thanit had been at its 2007 pre-crisis peak.
Perhaps even more striking than the differences in the size of the initialdecline in GDP per capita is the divergent paths from 2009 onwards. By 2011,
C© 2015 The Authors. Fiscal Studies published by John Wiley & Sons Ltd. on behalf of Institute for Fiscal Studies
408 Fiscal Studies
FIGURE 1
Evolution of real GDP per head
80
85
90
95
100
105
2000 2001 2002 2003 2004 2005 2006 2007 2008 2009 2010 2011 2012 2013 2014
Inde
x, p
eak
= 10
0
France Germany UK
Spain Ireland Italy
Source: Data from each country’s statistical office provided by the authors of the papers in this issue.
German GDP per capita was already 2.2 per cent above its pre-crisis peak.In contrast, by 2013, France and the UK had regained less than half theirlost output. Even less recovery had been seen in Ireland, and Italy and Spaincontinued to see declines in GDP per capita. By 2014, Italian GDP per headwas 15.6 per cent lower than its pre-crisis peak; this is the largest declineamong our six countries.
Even these large drops in GDP per capita understate the decline relative towhere countries would have expected to be prior to the crisis happening. WithGDP per capita tending to grow over time, we would have expected it to besubstantially above 2007 levels by some six or seven years later. Furthermore,those countries that had experienced stronger growth before the crisis mightalso have expected to continue growing more quickly. This suggests that thedrop in GDP per capita relative to pre-crisis expectations might have beensomewhat larger in the UK and Ireland, and somewhat smaller in France andItaly, than the simple peak-to-trough drop would suggest. This counterfactualis important to bear in mind because it was on the basis of that level of expectedfuture output that each of the countries is likely, either explicitly or implicitly,to have been planning its public finances (in particular, its tax structures andlevels of public spending) in the run-up to the crisis.
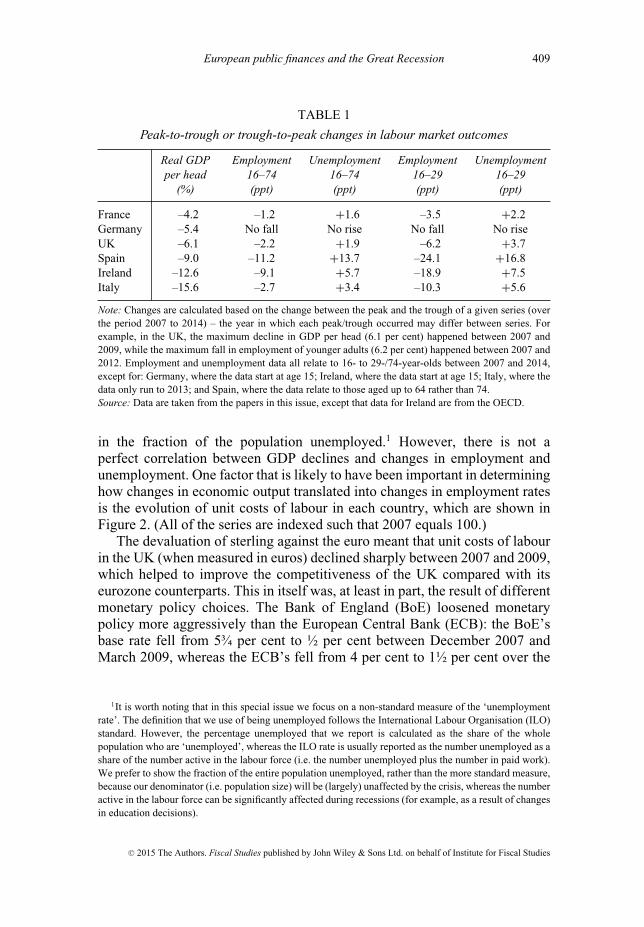
1. Labour market
The declines in GDP per capita in part reflected labour market changes, asshown in Table 1. In general, those countries that experienced larger declinesin output also saw larger falls in employment rates and larger increases
C© 2015 The Authors. Fiscal Studies published by John Wiley & Sons Ltd. on behalf of Institute for Fiscal Studies
European public finances and the Great Recession 409
TABLE 1
Peak-to-trough or trough-to-peak changes in labour market outcomes
Real GDPper head
(%)
Employment16–74(ppt)
Unemployment16–74(ppt)
Employment16–29(ppt)
Unemployment16–29(ppt)
France –4.2 –1.2 +1.6 –3.5 +2.2Germany –5.4 No fall No rise No fall No riseUK –6.1 –2.2 +1.9 –6.2 +3.7Spain –9.0 –11.2 +13.7 –24.1 +16.8Ireland –12.6 –9.1 +5.7 –18.9 +7.5Italy –15.6 –2.7 +3.4 –10.3 +5.6
Note: Changes are calculated based on the change between the peak and the trough of a given series (overthe period 2007 to 2014) – the year in which each peak/trough occurred may differ between series. Forexample, in the UK, the maximum decline in GDP per head (6.1 per cent) happened between 2007 and2009, while the maximum fall in employment of younger adults (6.2 per cent) happened between 2007 and2012. Employment and unemployment data all relate to 16- to 29-/74-year-olds between 2007 and 2014,except for: Germany, where the data start at age 15; Ireland, where the data start at age 15; Italy, where thedata only run to 2013; and Spain, where the data relate to those aged up to 64 rather than 74.Source: Data are taken from the papers in this issue, except that data for Ireland are from the OECD.
in the fraction of the population unemployed.1 However, there is not aperfect correlation between GDP declines and changes in employment andunemployment. One factor that is likely to have been important in determininghow changes in economic output translated into changes in employment ratesis the evolution of unit costs of labour in each country, which are shown inFigure 2. (All of the series are indexed such that 2007 equals 100.)
The devaluation of sterling against the euro meant that unit costs of labourin the UK (when measured in euros) declined sharply between 2007 and 2009,which helped to improve the competitiveness of the UK compared with itseurozone counterparts. This in itself was, at least in part, the result of differentmonetary policy choices. The Bank of England (BoE) loosened monetarypolicy more aggressively than the European Central Bank (ECB): the BoE’sbase rate fell from 5¾ per cent to ½ per cent between December 2007 andMarch 2009, whereas the ECB’s fell from 4 per cent to 1½ per cent over the
1It is worth noting that in this special issue we focus on a non-standard measure of the ‘unemploymentrate’. The definition that we use of being unemployed follows the International Labour Organisation (ILO)standard. However, the percentage unemployed that we report is calculated as the share of the wholepopulation who are ‘unemployed’, whereas the ILO rate is usually reported as the number unemployed as ashare of the number active in the labour force (i.e. the number unemployed plus the number in paid work).We prefer to show the fraction of the entire population unemployed, rather than the more standard measure,because our denominator (i.e. population size) will be (largely) unaffected by the crisis, whereas the numberactive in the labour force can be significantly affected during recessions (for example, as a result of changesin education decisions).
C© 2015 The Authors. Fiscal Studies published by John Wiley & Sons Ltd. on behalf of Institute for Fiscal Studies

410 Fiscal Studies
FIGURE 2
Nominal unit labour costs
60
80
100
120
140
2000 2001 2002 2003 2004 2005 2006 2007 2008 2009 2010 2011 2012 2013 2014
Inde
x, 2
007
= 10
0
France Germany UK (£) UK (€)
Spain Ireland Italy
Source: Authors’ calculations using data from AMECO, the annual macroeconomic database of the EuropeanCommission’s Directorate General for Economic and Financial Affairs (DG ECFIN).
same period. In addition, the BoE started a programme of quantitative easingin March 2009, whereas the ECB did not do this until much later.
Unit labour costs also fell in Ireland and (to a lesser extent) in Spain,although in these cases this decline in labour costs reflected a prolonged periodof low (and even negative) nominal wage growth. In both these countries,public sector wage moderation was a significant contributing factor: the Irishgovernment agreed to impose an effective four-year nominal pay freeze forpublic sector workers as part of its agreement with the ‘troika’ (the IMF, ECBand EU) in return for financial assistance, while the Spanish government alsoimposed tighter public sector wage settlements after 2010.
In contrast to Ireland and Spain, Italy did not experience a decline in unitlabour costs, despite a larger decline in GDP per capita. However, the effectof this on employment and unemployment (shown in Table 1) is masked bythe fact that there was extensive use of a wage supplementation scheme inItaly (Cassa Integrazione Guadagni).2 This allowed workers to work no (orvery few) hours and yet still receive 80 per cent of their previous salary andnot count as unemployed. The weak relationship between falling GDP and thelabour market in Italy has been documented by Jenkins et al. (2013).
The country that is a notable outlier in Table 1 and Figure 2 is Germany,which had experienced essentially no change in unit labour costs between 2000and 2007 and experienced virtually no rise in unemployment during the Great
2It is also the case that profits and gains to entrepreneurial activity in Italy declined more sharply inresponse to declining GDP than employment income did.
C© 2015 The Authors. Fiscal Studies published by John Wiley & Sons Ltd. on behalf of Institute for Fiscal Studies
European public finances and the Great Recession 411
Recession. One factor that is thought to have been important in both of thesetrends is the specific governance structure of German labour market institutions– in particular, traditional cooperation between employer associations, tradeunions and works councils.3
Although these countries saw very different changes in overall employmentand unemployment rates, the difference in impact across age groups displayssome remarkable regularities. First, in all five countries (excluding Germany),the fall in employment rates (and the rise in unemployment rates) has beensignificantly larger among those aged 16–29 than across the adult populationas a whole. Second, and even more strikingly, the falls in employment rates(and rises in unemployment rates) among those aged 55–74 have been muchsmaller than those for the adult population as a whole. In four of the fivecountries (France, Italy, Spain and the UK), the employment rate among olderindividuals actually continued to grow throughout the crisis and its aftermath.This is in sharp contrast to the experience of younger adults. For example, inItaly between 2007 and 2013, when employment among those aged 16–29 fellby 10.3 percentage points, the employment rate of those aged 55–74 rose by5.3 percentage points.
This growth in employment among older adults is also in contrast to theexperience of many earlier recessions. This pattern may in part be a responseto deliberate policy changes, such as increases in eligibility ages for publicly-provided pensions (as happened in France and the UK from 2010, in Spainfrom 2011, in Italy from 2012 and in Ireland from 2014).4 It may also reflectrigidities in labour markets. For example, in France (as Andre et al. discuss),legal barriers to renegotiating contracts and barriers to laying off workers madeit hard for employers to reduce nominal wages of existing permanent (oftenolder) members of staff and so – in the face of declining productivity and lowlevels of inflation – French firms preferred to stop recruiting (typically younger)staff or to stop renewing short-term contracts for (also typically younger) staff.While these may be contributing factors, the contrast between continued growthin employment of older workers and sharp falls in employment of youngerworkers is stark in all of these countries, despite substantial differences in theflexibility of their labour markets and other policies; these patterns warrantfurther investigation.
Table 1 may understate the negative effect of the crisis on employmentacross these countries because it looks only at employment and unemploymentbut not at ‘underemployment’ (that is, individuals working but for fewer hoursthan they would like). One other adjustment that happened, which cushioned
3Dustmann et al., 2014.4France, Ireland, Italy and Spain legislated for changes in their public pension eligibility ages as a direct
response to the problems caused by the financial crisis, whereas the increase in pension age in the UK hadbegun to be legislated many years earlier (in 1995).
C© 2015 The Authors. Fiscal Studies published by John Wiley & Sons Ltd. on behalf of Institute for Fiscal Studies

412 Fiscal Studies
the impact of the crisis on unemployment rates, was a reduction in hoursworked by those in employment. For example, many individuals working inthe private sector in the UK have seen their hours of work reduced, leadingto an increase in ‘underemployment’,5 while in Germany and Italy the hoursresponse has been subsidised explicitly by the government to limit detrimentalemployment effects.6
2. Public finances
The evolution of these six countries over the years running up to the financialcrisis, and where they stood on the eve of the crisis, varied somewhat – asFigure 3 shows. On the face of it, the weakest fiscal positions were thoseof France and the UK, which both ran deficits of between 2 and 4 per centof national income between 2002 and 2007, although both were intending toimplement a medium-term fiscal consolidation after 2007. For these countries(as Andre et al. and Emmerson and Tetlow discuss), the deficits in themid 2000s reflected, in part, repeated over-optimism in the official forecastsfor borrowing. Therefore, the officially-projected improvement in the fiscal
FIGURE 3
Government borrowing before the crisis: out-turns and pre-crisis forecasts
-6
-4
-2
0
2
4
6
2000 2001 2002 2003 2004 2005 2006 2007 2008 2009 2010 2011 2012
% o
f na
onal
inco
me
France Germany UK Spain Ireland Italy
Note: Figures shown are for general government borrowing on a Maastricht basis. Figures for the UK arefor financial years (April–March).Source: Data are taken from the papers in this issue.
5Bell and Blanchflower, 2013.6See the papers by Blomer et al. and Figari and Fiori respectively.
C© 2015 The Authors. Fiscal Studies published by John Wiley & Sons Ltd. on behalf of Institute for Fiscal Studies
European public finances and the Great Recession 413
position beyond 2007 (shown in Figure 3) was probably somewhat optimisticin both cases, given planned policy.
Italy had net borrowing persistently above 3 per cent of GDP just prior to thecrisis. However, efforts to increase tax revenues in 2007 resulted in borrowingfalling to 1.3 per cent of GDP. While this was superficially a sustainable fiscalposition, there was concern prior to the crisis that high taxes and stagnanteconomic growth threatened longer-run sustainability and so the focus pre-crisis was on policies that could stimulate the economy.
Like Italy, Germany had also already undergone a period of fiscal tighteningprior to 2007, having become the subject of an excessive deficit procedureby the European Commission in 2002. Between 2002 and 2006, Germanyimplemented a series of measures to improve the structural position of itspublic finances – culminating in 2007 with a balanced budget, which wasexpected to be maintained in the medium term.
Ireland and Spain, on the other hand, ran significant fiscal surpluses in2006 (in excess of 2 per cent of national income), following a period of fiscalstrengthening between 2002 and 2006. Although both were expecting somefiscal loosening after 2007, their fiscal forecasts still suggested they wouldremain well within the limits imposed by the Stability and Growth Pact. BothSpain and Ireland also had relatively low levels of government debt on the eveof the crisis (35.5 per cent and 24.0 per cent of GDP respectively).
With the exception of Germany, all of these countries experienced asignificant structural weakening of their public finances in the wake of thefinancial crisis – the scale of which had not been anticipated. To examine whathappened to the underlying position of the public finances, we need to adjustout-turn figures for public borrowing to strip out the effect of policy measuresadopted in direct response to the crisis. In particular, borrowing will havebeen affected by any initial fiscal stimulus and subsequent austerity measures.Each of the papers in this special issue presents a measure of ‘underlying’borrowing, which strips out the estimated impact of policy measures announcedand implemented since the crisis began. For example, in Italy,7 net borrowingwas 2.7 per cent of national income in 2008 and this had climbed to 3.2 percent of national income in 2014. But to describe the crisis as having nudgedup borrowing by just 0.4 per cent of national income would be to ignore thefact that net tax increases and net spending cuts were implemented between2008 and 2014, and these are estimated to have reduced borrowing in 2014by a sizeable 5.2 per cent of national income. Therefore, a better estimate ofthe impact on the underlying deficit in Italy over this period is that it wasincreased by 5.6 per cent of national income. This is explained by an estimatedincrease in underlying spending as a share of national income of 5.9 per centbeing offset slightly by an increase in underlying tax revenues of 0.4 per
7See figure 9 of the paper by Figari and Fiorio.
C© 2015 The Authors. Fiscal Studies published by John Wiley & Sons Ltd. on behalf of Institute for Fiscal Studies
414 Fiscal Studies
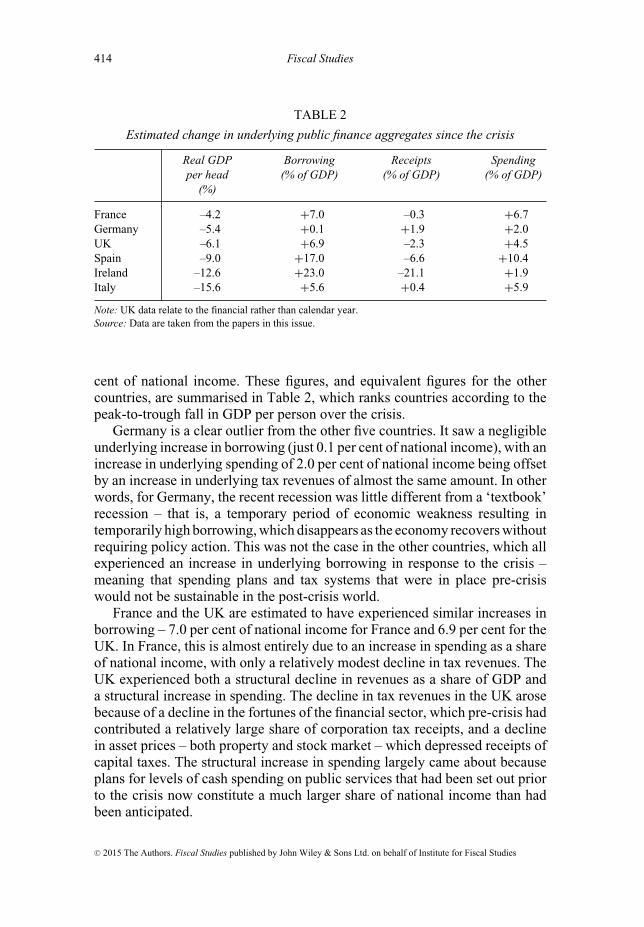
TABLE 2
Estimated change in underlying public finance aggregates since the crisis
Real GDPper head
(%)
Borrowing(% of GDP)
Receipts(% of GDP)
Spending(% of GDP)
France –4.2 +7.0 –0.3 +6.7Germany –5.4 +0.1 +1.9 +2.0UK –6.1 +6.9 –2.3 +4.5Spain –9.0 +17.0 –6.6 +10.4Ireland –12.6 +23.0 –21.1 +1.9Italy –15.6 +5.6 +0.4 +5.9
Note: UK data relate to the financial rather than calendar year.Source: Data are taken from the papers in this issue.
cent of national income. These figures, and equivalent figures for the othercountries, are summarised in Table 2, which ranks countries according to thepeak-to-trough fall in GDP per person over the crisis.
Germany is a clear outlier from the other five countries. It saw a negligibleunderlying increase in borrowing (just 0.1 per cent of national income), with anincrease in underlying spending of 2.0 per cent of national income being offsetby an increase in underlying tax revenues of almost the same amount. In otherwords, for Germany, the recent recession was little different from a ‘textbook’recession – that is, a temporary period of economic weakness resulting intemporarily high borrowing, which disappears as the economy recovers withoutrequiring policy action. This was not the case in the other countries, which allexperienced an increase in underlying borrowing in response to the crisis –meaning that spending plans and tax systems that were in place pre-crisiswould not be sustainable in the post-crisis world.
France and the UK are estimated to have experienced similar increases inborrowing – 7.0 per cent of national income for France and 6.9 per cent for theUK. In France, this is almost entirely due to an increase in spending as a shareof national income, with only a relatively modest decline in tax revenues. TheUK experienced both a structural decline in revenues as a share of GDP anda structural increase in spending. The decline in tax revenues in the UK arosebecause of a decline in the fortunes of the financial sector, which pre-crisis hadcontributed a relatively large share of corporation tax receipts, and a declinein asset prices – both property and stock market – which depressed receipts ofcapital taxes. The structural increase in spending largely came about becauseplans for levels of cash spending on public services that had been set out priorto the crisis now constitute a much larger share of national income than hadbeen anticipated.
C© 2015 The Authors. Fiscal Studies published by John Wiley & Sons Ltd. on behalf of Institute for Fiscal Studies
European public finances and the Great Recession 415
But these increases in borrowing are dwarfed by those seen in Spain andIreland. Using the relatively simple method described above to estimate thechange in the underlying public finance position, structural borrowing in Spainis estimated to have increased by 17 per cent of national income. However, asMartı and Perez point out, this may well overstate the impact of the crisis if thepost-crisis austerity measures have also had the effect of depressing economicoutput. An alternative estimate for Spain, allowing for these fiscal multipliereffects, is that underlying borrowing increased by over 14 per cent of nationalincome during the crisis (see Martı and Perez). Even this is a large number.In Spain’s case, two-thirds of the deterioration in the borrowing position wasdue to spending increasing as a share of national income. The remaining thirdcame from a fall in revenues as a share of national income, as pre-crisis revenuewindfalls unwound.
The underlying deterioration in Ireland’s public finances was even greaterthan that seen in Spain, with the vast majority of it being due to a fall in taxrevenues as a share of GDP (from their already low level relative to the othereconomies). The drop in revenues is largely explained by a decline in receiptsof capital taxes – such as stamp duties – which had grown strongly during theproperty price increases and associated construction boom in the years leadingup to the financial crisis.
Having had the strongest fiscal positions in 2007, Ireland and Spainexperienced the most dramatic deteriorations in their fiscal positions as thecrisis hit – highlighting the extent to which, with the benefit of hindsight, theyhad been reliant on unsustainable forms of economic activity and sources ofrevenue. The UK also suffered a decline in revenues as the income previouslyreceived from taxing the financial sector and asset transactions dried up. ForFrance and Italy, the main difficulty for the public finances (which affected theother countries too) came from inertia in public spending, as their economiesshrank relative to pre-crisis expectations while spending plans set pre-crisistook time (and active policy decisions) to adjust.
III. Fiscal response to the crisis
1. Public finance response
The size of the damage done to the public finances in France, Ireland, Italy,Spain and the UK required a significant fiscal tightening to be implemented atsome point if borrowing were to be restored to a sustainable path. Germany,on the other hand, did not need to make any net fiscal adjustment in responseto the crisis.
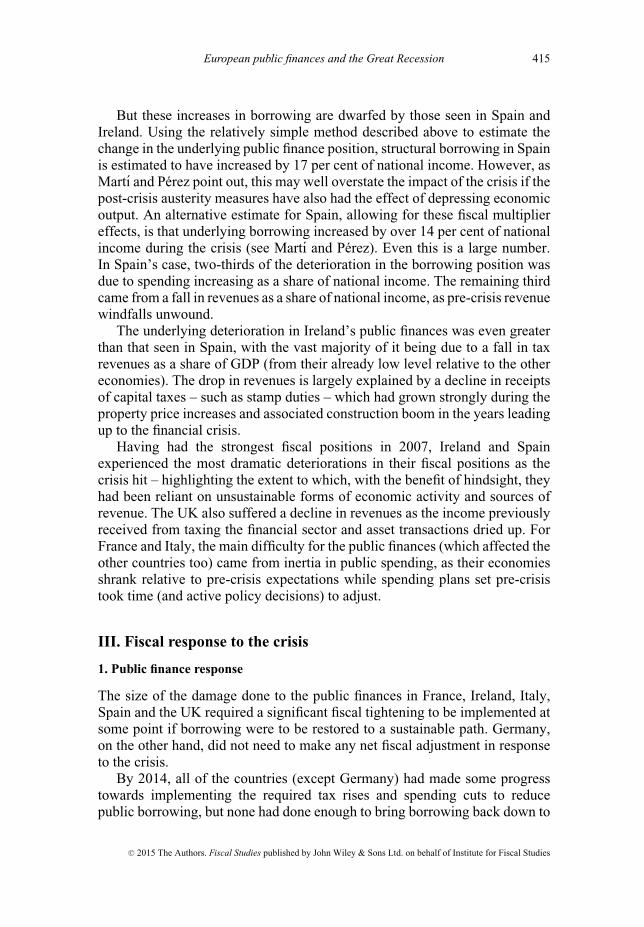
By 2014, all of the countries (except Germany) had made some progresstowards implementing the required tax rises and spending cuts to reducepublic borrowing, but none had done enough to bring borrowing back down to
C© 2015 The Authors. Fiscal Studies published by John Wiley & Sons Ltd. on behalf of Institute for Fiscal Studies
416 Fiscal Studies
FIGURE 4
Size and composition of post-crisis fiscal policy response up to 2014
-5
0
5
10
15
20
25
Ireland Spain France UK Italy Germany
% o
f na
onal
inco
me
Net spending cutNet tax riseUnderlying increase in borrowing
Note: UK data relate to the financial rather than calendar year. For Italy, the changes are measured up to2013.Source: Data are taken from the papers in this issue.
pre-crisis levels. The change in underlying borrowing and the effect of post-crisis net tax rises and spending cuts are shown in Figure 4 for each country.
France, Italy and the UK have all so far implemented sizeable, and similarly-sized, fiscal tightenings in response to the crisis – amounting to between 5and 6 per cent of national income. Spain has done a larger fiscal tightening,approaching 9 per cent of national income. Ireland has gone much further,complying with the plan agreed with the troika and implementing measurestotalling 18.5 per cent of national income by 2014, which led to the countrysuccessfully exiting the financial assistance programme in December 2013.
The composition of measures chosen has differed across the countries.France and Italy have – so far at least – relied relatively heavily on tax rises(comprising 65 per cent and 58 per cent of measures, respectively). Ireland,Spain and the UK have reduced borrowing mainly through reductions in publicspending (comprising 64 per cent, 63 per cent and 82 per cent of measures,respectively). This pattern is notable given that France and Italy saw essentiallyno decline in tax revenues relative to national income as a result of the crisis,while the other countries did. This means that, up to 2014 at least, the net effectof the crisis and post-crisis measures was to move France and Italy towardsbeing higher-tax economies than they were pre-crisis, while Ireland, Spain andthe UK have become lower-tax economies than they previously were.
Figure 4 shows that none of the countries (except Germany) has yetimplemented a large enough fiscal tightening to offset all of the rise in publicborrowing that happened as a result of the crisis. In other words, all fivecountries have, at least up until the end of 2014, chosen to allow borrowing toremain higher than was expected pre-crisis. However, as the papers on eachof the countries set out, further fiscal consolidation is planned beyond 2014
C© 2015 The Authors. Fiscal Studies published by John Wiley & Sons Ltd. on behalf of Institute for Fiscal Studies
European public finances and the Great Recession 417
in France, Ireland, Italy, Spain and the UK; in all cases, this consists mostlyof further cuts to public spending rather than further increases in taxation. Forsome countries (France, Italy and Spain), this will still leave public borrowingat a higher level than was intended pre-crisis; for the others (Ireland and theUK), current fiscal plans imply borrowing falling to significantly below thelevels planned pre-crisis.
Germany has implemented only a modest net tightening since the startof the crisis, with spending cuts being used mainly to finance net tax cuts.This modest package of measures also includes a number of changes that hadalready been planned prior to the crisis or that were simply due to followingearlier judgements by the Federal Constitutional Court, so they are not strictlya response to the crisis.
2. Tax and benefit changes
Although the size of tax and spending measures implemented in each of thecountries has varied a lot, there are some similarities in the types of measuresthat France, Ireland, Italy, Spain and the UK have relied on – as well as somenoteworthy differences.
All the countries except Germany have used increases in the main rate ofVAT to boost revenues. France increased the main rate from 19.6 per cent to20 per cent and the intermediate rate from 7 per cent to 10 per cent; Irelandincreased its main rate from 21 per cent in 2010 to 23 per cent in 2012; Italyincreased its main rate from 20 per cent to 22 per cent; Spain increased themain rate from 16 per cent to 21 per cent and the reduced rate from 7 per centto 10 per cent; and the UK increased its main rate from 17½ per cent to 20 percent.
A number of countries have also made changes to their income tax systemsto focus revenue-raising more heavily on higher-income individuals. Franceincreased the top marginal tax rate from 40 per cent to 45 per cent andintroduced an additional tax on incomes above €150,000 and the temporary(two-year) 75 per cent marginal tax rate on earnings above €1 million.Italy introduced a new ‘solidarity tax’ on incomes above €300,000, whilereducing the tax burden for low-wage workers and increasing tax credits. TheUK introduced a new 50 per cent top rate of income tax on incomes over£150,000 (later reduced to 45 per cent), while increasing the tax-free personalallowance (and tapering this away from those with incomes over £100,000).Spain increased the top marginal tax rate from 43 per cent to 52 per cent,deepened the progressivity of the income tax code and eliminated a number ofuniform tax credits. Ireland is something of an exception to this pattern, havingimplemented a number of income tax changes that will have increased the taxburden on lower-income, as well as higher-income, individuals.
C© 2015 The Authors. Fiscal Studies published by John Wiley & Sons Ltd. on behalf of Institute for Fiscal Studies

418 Fiscal Studies
All five of these countries have used increases in social securitycontributions (including mandatory pension contributions) to boost revenuesas well.
There have also been some consistent patterns in changes to corporatetaxation. Both France and the UK have reduced the effective corporation taxrate, while broadening the tax base to which it applies. The UK has done thisby cutting the headline rate of corporation tax alongside a reduction in capitalallowances. France has announced a significant expansion of the corporate taxbase, accompanied by a new corporate tax credit, which is based on the firm’swage bill.
In contrast to these consistent patterns of tax changes, there was a lotof variation in the role played by changes to benefits across the countries.Benefits were virtually unchanged in Spain, and in France and Italy benefitsfor some groups were actually increased. In contrast, Ireland and the UK haveimplemented significant benefit cuts – in both cases focusing cuts on benefitsfor those of working age rather than benefits for older individuals. For example,benefit cuts made in the UK are thought to have reduced spending by around1.7 per cent of GDP relative to unchanged policy, with much of this comingthrough less generous indexation of benefit rates.
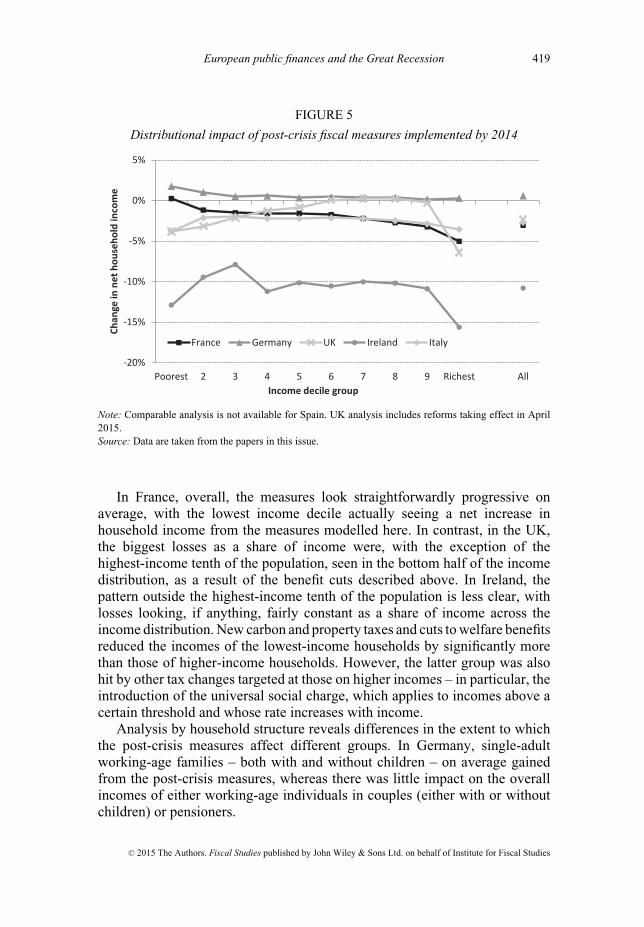
The estimated distributional impact of the tax and benefit measuresimplemented since the crisis began is shown in Figure 5 for those measureswhere it is possible to determine how household income would have beenaffected – in other words, Figure 5 excludes most corporate tax measures aswell as other measures that are difficult to assign to specific households. InGermany, the modelled measures correspond to an overall small net giveawayto households (averaging just 0.6 per cent of net income). In France, Italy andthe UK, the estimated net takeaway from households was larger, averaging 3.1per cent, 2.7 per cent and 2.3 per cent respectively. A much larger net takeawayhas been seen in Ireland, with the estimated direct impact on household incomesbeing to reduce them by a sizeable 10.8 per cent. Unfortunately, similar analysisis not available for Spain.8
In France, Ireland and the UK, the largest losses from the modelled post-crisis measures were for the highest-income tenth of the population. In Italy,the largest losses were seen among the poorest and richest income deciles, withrelatively similar-sized losses (typically just over 2 per cent of income) acrossthe rest of the income distribution. That the richest households experiencedthe largest losses in most countries at least in part reflects the set of measuresacross all the countries (described above) that targeted income tax rises onhigher-income individuals, while cutting income tax for lower-income peoplein many cases.
8A similar type of analysis for Spain, but only covering measures implemented up to 2012, is providedby Avram et al. (2013).
C© 2015 The Authors. Fiscal Studies published by John Wiley & Sons Ltd. on behalf of Institute for Fiscal Studies
European public finances and the Great Recession 419
FIGURE 5
Distributional impact of post-crisis fiscal measures implemented by 2014
-20%
-15%
-10%
-5%
0%
5%
Poorest 2 3 4 5 6 7 8 9 Richest All
Chan
ge in
net
hou
seho
ld in
com
e
Income decile group
France Germany UK Ireland Italy
Note: Comparable analysis is not available for Spain. UK analysis includes reforms taking effect in April2015.Source: Data are taken from the papers in this issue.
In France, overall, the measures look straightforwardly progressive onaverage, with the lowest income decile actually seeing a net increase inhousehold income from the measures modelled here. In contrast, in the UK,the biggest losses as a share of income were, with the exception of thehighest-income tenth of the population, seen in the bottom half of the incomedistribution, as a result of the benefit cuts described above. In Ireland, thepattern outside the highest-income tenth of the population is less clear, withlosses looking, if anything, fairly constant as a share of income across theincome distribution. New carbon and property taxes and cuts to welfare benefitsreduced the incomes of the lowest-income households by significantly morethan those of higher-income households. However, the latter group was alsohit by other tax changes targeted at those on higher incomes – in particular, theintroduction of the universal social charge, which applies to incomes above acertain threshold and whose rate increases with income.
Analysis by household structure reveals differences in the extent to whichthe post-crisis measures affect different groups. In Germany, single-adultworking-age families – both with and without children – on average gainedfrom the post-crisis measures, whereas there was little impact on the overallincomes of either working-age individuals in couples (either with or withoutchildren) or pensioners.
C© 2015 The Authors. Fiscal Studies published by John Wiley & Sons Ltd. on behalf of Institute for Fiscal Studies
420 Fiscal Studies
In Italy, there were losses, on average, across the income distribution among households with children. However, these were smaller than the losses among households containing an individual aged 65 or over. This distributional outcome arises from the increase in property taxes on main residences and the partial indexation of pension benefits, both of which have a larger impact (at least at the moment) on the older population. In France, pensioner households have been less affected than the average population, while households with children have fared relatively badly, especially those in work and in the upper half of the income distribution. Households where no adult is in work have been largely protected. This is mainly because of the decrease in the cap of the quotient familial, the income tax reductions that children can provide.
In Ireland, there have been losses across all the family types considered. While these are considerable for households containing retired individuals (5.3 per cent of net income for single retired individuals, 5.9 per cent for retired couples), their losses are on average considerably smaller than those for other family types due to the fact that the main benefits paid to those over 65 were not reduced, unlike those paid to working-age families. For example, one-earner couples with children have experienced average losses of 12.1 per cent of net income. A similar pattern is observed in the UK, where the smallest losses have been experienced by pensioners and working-age adults without children, while working-age families with children have experienced the largest losses on average.
3. Cuts to spending on public services
Part of the cuts to public spending has come from reductions in spending onpublic services. In order to assess how public service spending plans havechanged in response to the crisis, we need to use countries’ own classificationsand ways of reporting spending plans, rather than standard internationalspending classifications. However, this makes comparing changes in spendingon public services across countries rather more difficult. First, countries tendto use different aggregations of spending – for example, responsibility forspending on different areas of public service provision will fall to differentdepartments or ministries in each country. Second, different services are theresponsibility of different tiers or areas of government in each country andthese different entities may report spending in different ways. For example,in France, health spending is funded out of the social security budget andso is reported in a way that makes it not easily comparable to spendingon other public services in France, such as education. Third, the measureof public spending cuts depends heavily on the counterfactual trend in theabsence of policy measures, and the methodology used – not always explicitly
C© 2015 The Authors. Fiscal Studies published by John Wiley & Sons Ltd. on behalf of Institute for Fiscal Studies
European public finances and the Great Recession 421
presented – varies from country to country. These difficulties in cross-countrycomparisons of public spending highlight the much less developed analysisof the public service spending side of public finances in international settings;however, notwithstanding these constraints, we are still able to draw someinteresting comparisons.
In Germany, cuts to spending on public services were small (and, asdescribed above, mainly used to finance tax cuts) and came mainly fromreductions to spending on administration and the military.
In France, Italy and Spain, virtually all of the reduction in public spendinghas been brought about by cuts to spending on public services, while Irelandand the UK have implemented significant cuts to public service spending ontop of their cuts to benefit spending. The scale of these cuts is significant andthey vary in their timing and composition. For example, in 2014–15, spendingon public services in the UK was 9.2 per cent lower in real terms than it hadbeen in 2010–11. In France, while the initial cuts to public spending werelimited, central government spending is planned to be 8.7 per cent lower inreal terms in 2017 than it was in 2010. In Ireland, there were only relativelysmall changes to spending on health and education (of +3 per cent and –3 percent respectively), cuts of 13 per cent to spending on justice and deep cutsof 30 per cent or more to many other areas of government between 2007 and2014.
All of these countries – to a greater or lesser extent – have used nominalfreezes (and, in the cases of Ireland, Spain and higher earners in Italy, nominalcuts) to public sector wages as a way of limiting public spending growth.
Some reductions are intended to be brought about by reducing inefficiency.For example, Spain has focused on reducing duplication between tiersof government, while Italy has abolished provinces (the intermediate tier ofgovernment between municipalities and regions) and France has replaced itsprevious 22 regions with 13 new ones, with a similar objective.
However, it is implausible that all of the spending reduction across thesecountries will come entirely through efficiency savings and the removal ofduplication; some of it will be reflected in fewer and/or poorer-quality services.Exactly which services have been targeted for cuts reflects both the preferencesof the governments in each country and the public spending mechanisms inplace, which affect how easy it is for central government to constrain spendingin particular areas.
One example of the importance of the degree of central control overspending can be seen by contrasting the examples of the UK and Spain. The UKcentral government imposed a significant part of the desired spending cut onlocal government services. This was possible because local governments in theUK are severely constrained in their ability to borrow (and to raise additionalrevenue locally) and so reductions in the grant from central government to
C© 2015 The Authors. Fiscal Studies published by John Wiley & Sons Ltd. on behalf of Institute for Fiscal Studies
422 Fiscal Studies
local government feed directly into reductions in local government spending.9
In contrast, the cuts seen to public spending in Spain up to 2011 were muchsmaller than intended because of significant spending slippage by regionalgovernments resulting from a lack of transparency and misreporting of theirbudgets,10 while as of 2012 strengthened national fiscal rules led to significantspending cuts in regional spending, mainly on education and health.
Another example is apparent from comparing spending on health care inFrance and the UK. France has a social insurance health care system, meaningthat – subject to meeting the contributory and eligibility criteria – individualscan receive health care on demand from (private and public) providers, whoare then reimbursed by the public health care insurance based on prices set bythe government. Therefore, the only way for the French government to limithealth spending is indirectly by explicitly changing the eligibility criteria orthe rates at which it reimburses health care providers for different treatments.This contrasts with the UK, where health care is largely publicly provided,with health authorities essentially rationing care throughout the year to staywithin fixed budgets.11
Bearing in mind these potential differences in the ability of each governmentto control spending in different areas, we can examine which services faredbetter or worse in each country. France and the UK both afforded relativeprotection to spending on schooling and health,12 in contrast to Italy and Spainwhere cuts to these services were larger than average. Also, Ireland, Italy,Spain and the UK have all chosen to cut investment spending by more thanday-to-day spending.
IV. Was the crisis an opportunity for reforms aimed at improvingthe efficiency of public interventions?
1. Tax design
The effect of the post-crisis measures on the coherency of the tax and benefitsystem seems to have been mixed, both within and across countries. Sinceall the countries we have examined (except Germany) have implementedsignificant tax increases over the last few years in an effort to reduce public
9Innes and Tetlow, 2015.10See the paper by Martı and Perez in this issue.11This is an oversimplification of the UK and French systems. In practice in the UK, public health
providers can and do run deficits and governments sometimes top up health spending in response to publicpressure if the quality of services provided deteriorates too much. And in France, the government hasintroduced additional rules (fixed budgets) for funding health care providers, in order to achieve health carespending targets set in the budget. However, health spending is still far less subject to demand pressure inthe UK than in France.
12In both France and the UK, health spending is not being cut in real terms. However, this implies alower level of spending relative to a counterfactual of continued real-terms spending growth.
C© 2015 The Authors. Fiscal Studies published by John Wiley & Sons Ltd. on behalf of Institute for Fiscal Studies
European public finances and the Great Recession 423
borrowing, the net effect is likely to have been to disincentivise economicactivity (at least relative to what would have been expected pre-crisis).However, some countries more than others have taken this opportunity toimprove the structure and efficiency of their tax system.
In many countries, tax increases have taken the form of VAT increases(France, Ireland, Italy, Spain and the UK), with the idea that indirect taxationis a good way to raise revenues efficiently with little detrimental impact onincentives. In reality, VAT increases have detrimental impacts on incentivesto work and save and the efficiency gain should be specifically assessed ineach country. In the UK, given a relatively narrow VAT base, the increasein the main rate of VAT will have come at the cost of increasing distortionsfor both producers and consumers. In France, on the contrary, increases in thereduced rate of VAT will have reduced the distortions provided to producersand consumers. Ireland has had a mixed record of a succession of VATchanges (increases, reductions and then increases again), creating unnecessaryuncertainty and distortions.
A number of countries have changed personal income taxation by targetingtax increases on the richest households (France, Spain and the UK). Both Franceand the UK increased their top marginal income tax rate to 45 per cent (theUK via a rate of 50 per cent), but France went further in targeting top incomeswith an additional levy pushing its top marginal tax rate above 60 per cent(setting aside the temporary 75 per cent marginal tax rate for earnings above€1 million). In addition, income tax increases in France have particularlytargeted capital income. All these tax increases have reduced incentives towork and save. Spain also targeted top incomes, but subsequent reductions,particularly in income tax rates faced by those on lower incomes, havesimplified the system. The introduction of tax credits targeted at groups suchas low-income families with children will have boosted the incentive for thesegroups to enter paid work. In Ireland, the most significant revenue raised wasfrom a new tax on all forms of income above a threshold, which, at the veryleast, will have avoided introducing new distortions (apart from the obviousincentive to decrease one’s income, especially from just above the cliff edgeat which the tax starts to apply). This tax has a lower exemption limit than themain income tax, therefore bringing lower earners into the tax net. Ireland didnot specifically target tax increases on those with higher incomes. The newtax introduced does, however, have a progressive rate structure; therefore theproportional liability for this tax increases with income. The addition of a newincome tax not integrated into the previous system will have resulted in a morecomplicated system, however, and the progressive rate structure may distortbehaviour and create disincentives to work.
Company taxation was generally less subject to tax increases. Reforms tocorporate tax in the UK have made it more efficient, with particularly largetax cuts for high-profit, non-capital-intensive firms, which might be relatively
C© 2015 The Authors. Fiscal Studies published by John Wiley & Sons Ltd. on behalf of Institute for Fiscal Studies
424 Fiscal Studies
footloose. Similarly, in Spain, the tax base was broadened, while the rate hasrecently been cut from 30 per cent to 25 per cent. In France, the introductionof a corporate tax credit that effectively reduced employer social securitycontributions should have helped to boost labour demand during the recession.
In Ireland, a carbon tax and a residential property tax were both welcomeadditions to the Irish tax system. These are reforms that would typically hit thelowest income groups hardest, but the combined effect of the other measuresmore than offset this, such that the losses were greatest among the richestincome group. A swathe of new environmental taxes were also introduced inSpain.
The German reforms were of a different nature from those implementedin the other countries. Not only were they, on average, a net giveaway tohouseholds but they were also ones that were largely planned to be implementedbefore the crisis; they were also on a much smaller scale than those in othercountries.
A general judgement on the tax reforms carried out since the crisis emergesfrom the authors of this special issue: overall, reforms have not been usedas opportunities to increase efficiency. In particular in countries where thedesign of the tax system can be questioned, little effort has been dedicatedto designing a simpler and more efficient system. Figari and Fiorio point outthat Italy still lacks a clear longer-term tax strategy and so the tax reforms thathave been made are fragile and subject to frequent revision, sometimes evenprior to implementation. Andre et al. note that the complexity of the French taxsystem has been increased. The tax credit reducing employer social securitycontributions – a positive step in itself – is a prime example: instead of reducingsocial security contributions directly, the French government chose to createa corporate tax credit, computed on individual earnings of firms’ employees– credit that can then be claimed by employers a year later in the form ofreduced corporate tax liability. Reducing the high employer social securitycontributions would have been a better alternative for the overall design ofFrench taxation. In Ireland, the instability of the tax strategy, with numerouschanges to tax rules – for instance, to the rate of capital gains tax, which sinceOctober 2008 has been increased from 20 per cent to 22 per cent, then to 25per cent, then to 30 per cent and then to 33 per cent – has not contributed to thedesign of a more stable and efficient tax system. In Spain, the most recent taxreform falls short of a much-needed comprehensive review of the tax system,in particular with regards to the excessive role of social security contributions.
The relatively negative assessment from most of the authors in this issuesuggests a more general conclusion. Periods of crisis require a number ofdifficult choices for governments with little fiscal space, perhaps leavinglittle room for potentially politically costly reforms, even though they couldimprove efficiency over the longer term. The example of Germany could beconsidered a case in point – while it did manage to implement some efficiency-
C© 2015 The Authors. Fiscal Studies published by John Wiley & Sons Ltd. on behalf of Institute for Fiscal Studies
European public finances and the Great Recession 425
improving reforms to the tax system, these were announced before the financialcrisis.
2. Public spending
On the spending side, there is no doubt that in one domain – pension provision– the financial crisis has rather been an opportunity for reforms that have helpedassure the long-term financial sustainability of pension schemes, even in theabsence of macroeconomic shocks. Recent pension reforms in France, Ireland,Italy, Spain and the UK have all boosted the employment of older individuals.In France, the 2010 pension reform led to increases in the minimum retirementage from 60 to 62 and the full-rate pension age from 65 to 67. The thengovernment pressed for a rapid phase-in, using the financial crisis as the mainmotivation. Ireland increased its state pension qualification age from 65 to 66in 2014, with further increases to 67 in 2021 and to 68 in 2028 announced.It also reduced the pensions of public sector retirees. Italy passed legislationin 2012 to increase the statutory retirement age of women to align it withthat for men at age 66 years and 7 months in 2018, and then for the statutoryretirement age of both men and women to rise in line with life expectancy sothat it reaches at least 67 in 2021. In Spain, a rise in the retirement age from65 to 67 was phased in from 2013 despite only being legislated in 2011. Afurther tranche of pension reforms, which reduced how generously benefitsare indexed, has also improved the long-run financial sustainability of Spanishfiscal policy. The UK has accelerated the previously-planned increases in thestate pension age for men and women so that it will now reach 66 in 2020 and67 in 2028, and an automatic review process has been established to considerfurther increases in future. And again, Germany is here the counter-example,having legislated a pension reform that expanded early retirement and pensionexpenditures.
The assessment of most authors is less positive about some of the changesto public services. Many countries have opted to cut spending as a share ofnational income through the use of nominal freezes. Few examples of publicspending cuts based on careful studies, such as previous policy evaluation, canbe found in our countries of interest. A counter-example is Spain, where theCommission on the Reform of Public Administrations was established in 2012and came up with a number of initiatives to improve the efficiency of publicadministration and to increase the average hours of work of public employeesfrom 35 to 37½ per week.
3. Other structural reforms
In matters of structural reforms to labour markets and goods and servicesmarkets, Germany, Ireland and the UK stand out. The UK, with a relatively
C© 2015 The Authors. Fiscal Studies published by John Wiley & Sons Ltd. on behalf of Institute for Fiscal Studies
426 Fiscal Studies
flexible labour market and relatively open product market, did not see muchneed for the scale of structural reforms that other European countries feltthey needed to boost their economies. It could have taken the opportunity toliberalise its land-use planning significantly but did not.13 Ireland too had arelatively flexible labour market before the crisis. Germany also stands outbecause it made structural reforms to its labour market before the advent ofthe crisis: the Hartz reforms (2003–05) led to a general overhaul of the labourmarket rules in Germany, introducing more flexibility in hiring and dismissalprocedures, reducing unemployment insurance and introducing mini-jobs (seeBlomer et al.).
With a dramatic rise in unemployment, Spain has pushed for a sequenceof labour market reforms (2010–12), with the major reform in 2012 aiming toemulate the German Hartz reforms: reduced unemployment benefits, moreflexible dismissal procedures, and new regulations aiming to reduce theimpact of collective bargaining.14 In France, the labour market reforms havebeen much more limited, mostly attempting to reduce dismissal costs anduncertainties. In Italy, the so-called Jobs Act was introduced in early 2015with a similar aim of reducing dismissal costs and also aiming to reduce thesegmentation in the Italian labour market, enhance the incentives for firmsto hire or convert more workers to permanent contracts, and extend incomesupport to all the unemployed.
Reforms in goods and services markets have also been sparked by thecrisis. In France, a long list of small reforms aiming to reduce regulations ina number of businesses have been legislated in 2015. Similarly, in Spain, anumber of reforms have been implemented related to easing regulations inproduct markets, including the retail sector and the housing market, but withso far limited impact.15
4. Reforms to the budget and forecasting process
One clear improvement over the period since the crisis hit across all sixcountries in our study has been the introduction of greater transparency andindependence in the production of forecasts for both economic and fiscaloutcomes. In line with being signatories of the European Fiscal Compact,five of these countries have introduced independent fiscal councils, whichare responsible for producing these forecasts: France (the Haut conseil pourles finances publiques, HCFP), Germany (the Stability Council), Ireland (theIrish Fiscal Advisory Council, IFAC), Italy (the Parliamentary Budget Office)and Spain (the Independent Fiscal Responsibility Authority, AIReF). TheUK, while not a signatory of the European Fiscal Compact, also introduced
13Crafts, 2013.14Ortega and Penalosa, 2013.15Ortega and Penalosa, 2013.
C© 2015 The Authors. Fiscal Studies published by John Wiley & Sons Ltd. on behalf of Institute for Fiscal Studies
European public finances and the Great Recession 427
a new independent fiscal council (the Office for Budget Responsibility,OBR) charged with producing the official economic and fiscal forecasts.The exact responsibilities of these councils vary from country to country,but in all cases recent reforms have been a step forwards – to improving thetransparency of fiscal out-turns and forecasts and to reducing the extent towhich official forecasts contain undue (and politically-motivated) optimismabout the prospects for economic growth, public spending and revenues.However, further improvements are possible. For example, in France, whilethe HCFP produces the macroeconomic forecasts underpinning the budget, theFrench Treasury retains control over the scoring of policy measures.
Fiscal targets have also been revised in light of the financial crisis. Theeurozone countries are now covered by the target set under the ‘Two-Pack’agreement. In addition, Germany has introduced a balanced budget (‘debtbrake’) rule, which includes limits on structural net borrowing for both thefederal government (from 2016) and federal states (from 2020) with onlylimited escape clauses. The UK government also has new targets for achievingan overall budget surplus and for reducing the debt to GDP ratio. The targetto achieve an overall budget surplus is more stringent than the UK’s pre-crisisfiscal rule, which required that the current budget (i.e. excluding net investmentspending) should be balanced over the course of each economic cycle. InSpain, legislation – including constitutional reform – has been implementedthat places greater restrictions and monitoring on the borrowing, debt andspending of different tiers of government, including the introduction of limitson structural net borrowing (from 2020), a debt to GDP ratio rule and anexpenditure rule, in all cases for the central, regional and local governments,with only limited escape clauses.
V. Conclusions
All six of the countries in our study experienced a sharp decline in GDP as theglobal financial crisis struck. However, while the magnitude of the drops variedfrom country to country, perhaps more striking is the difference in subsequentrecoveries. By 2011, national income per head in Germany was already aboveits 2008 level; in France, Ireland (which had experienced a much larger drop)and the UK, a much more gradual recovery was underway; while output perhead was still falling in Spain, and Italy was about to experience a two-yeardrop in national income per capita that was almost as great as it experiencedbetween 2007 and 2009.
These heterogeneous shocks to output led to different magnitudes ofdeterioration in the underlying public finance position of these six countries.Ireland and Spain experienced the largest weakening of their public finances,followed by France, Italy and the UK. A notable exception is Germany,whose underlying deficit was hardly affected. Countries’ tax revenues tend
C© 2015 The Authors. Fiscal Studies published by John Wiley & Sons Ltd. on behalf of Institute for Fiscal Studies
428 Fiscal Studies
to have been affected more severely in cases where they were relatively reliantpre-crisis on revenues coming from the financial sector and from the taxationof property and other assets.
In response so far, the largest fiscal consolidation package has beenimplemented by Ireland. The majority of this tightening has been from spendingcuts rather than tax rises – in line with the Irish agreement with the troika.The consolidations implemented so far in France, Italy, Spain and the UKhave been smaller than that in Ireland but still significant – all in excessof 5 per cent of national income. The majority of the fiscal consolidationsimplemented so far in France and Italy have been from tax rises rather thanspending cuts, while Spain and the UK (like Ireland) have relied more heavilyon spending cuts. Only Ireland and the UK have made significant cuts tobenefit spending; the other countries have only made cuts to spending on publicservices.
The tax rises and spending cuts have naturally reduced household incomes.One common theme across the five countries that have implemented significantfiscal consolidation (i.e. all except Germany) is that those in the richest tenthof the population have, on average, seen their incomes reduced by a largerpercentage than those further down in the income distribution. The pattern oflosses across the rest of the income distribution varies across the five countries:in France, poorer households have tended to lose less than richer ones; thepattern of losses is flatter (or at least more complicated) in Ireland and Italy,while poorer households have tended to lose more than richer ones (with theexception of the richest) in the UK.
There is also no common pattern of losses across different demographic groups. In Italy, households with children have lost less, on average, than pensioner households. In contrast, in Ireland and the UK, average losses for pensioner households have been smaller than the average losses seen among working-age households with children.
The distribution of cuts to spending on public services also varies acrossthe five countries. France, Ireland and the UK chose to protect spending onhealth and schools from cuts, while Italy and Spain chose to cut spending onboth these services relatively deeply.
The impact of the tax and benefit reforms introduced since the crisis on thecoherency and efficiency of the overall tax and benefit system has been mixed.France has increased its reduced rate of VAT, which will have reduced thedistortions provided to producers and consumers. In contrast, the increase inthe main rate of VAT in the UK, which applies to a relatively narrow set ofgoods, will have increased this distortion. Reforms in Spain have simplified theincome tax schedule, whereas the UK has introduced two new effective incometax rates for those on the highest incomes, which has made the tax schedulemore complex. The UK has, however, implemented corporate tax cuts targetedat high-profit firms, which might be relatively mobile. The reforms to the tax
C© 2015 The Authors. Fiscal Studies published by John Wiley & Sons Ltd. on behalf of Institute for Fiscal Studies
European public finances and the Great Recession 429
system in Italy and Ireland have been particularly unstable – with some reformsbeing changed before implementation or subsequently reversed – leading touncertainty that would have best been avoided.
The one clear improvement has been the introduction of greaterindependence and transparency in the production of economic and fiscalforecasts, although even here there is room for improvement with, for example,the French Treasury still retaining control over the scoring of policy measures.
In many countries, however, this will not be the end of the story. In 2014,France, Ireland, Italy, Spain and the UK all still had deficits above 2 per cent ofnational income, and all had deficits above the level they were at in 2007 priorto the crisis. The intervening period has also seen the stock of government debtincrease significantly. So further borrowing reductions are planned, with allthese countries now relying mainly on further spending cuts, rather than taxrises, to bring about the remaining fiscal consolidation. The need for furtherspending cuts and/or tax rises could be an opportunity for countries to makereforms that improve the efficiency of the tax and benefit system. However,the lesson from the reforms made so far is that we perhaps ought not to be toooptimistic on this front and instead may have to be content to settle for reformsthat do not add to existing deficiencies.
References
Andre, M., Bozio, A., Guillot, M. and Paul-Delvaux, L. (2015), ‘French public finances throughthe financial crisis: it’s a long way to recovery’, Fiscal Studies, vol. 36, pp. 431–52 (thisissue).
Avram, S., Figari, F., Leventi, C., Levy, H., Navicke, J., Matsaganis, M., Militaru, E., Paulus, A.,Rastrigina, O. and Sutherland, H. (2013), ‘The distributional effects of fiscal consolidationin nine EU countries’, Institute for Social and Economic Research (ISER), EUROMODWorking Paper no. EM2/13.
Bell, D. N. F. and Blanchflower, D. G. (2013), ‘Underemployment in the UK revisited’, NationalInstitute Economic Review, no. 224, pp. F1–F15.
Blomer, M. J., Dolls, M., Fuest, C., Loffler, M. and Peichl, A. (2015), ‘German public financesthrough the financial crisis’, Fiscal Studies, vol. 36, pp. 453–74 (this issue).
Crafts, N. (2013), ‘Returning to growth: policy lessons from history’, Fiscal Studies, vol. 34,pp. 255–82.
Dustmann, C., Fitzenberger, B., Schonberg, U. and Spitz-Oener, A. (2014), ‘From sick manof Europe to economic superstar: Germany’s resurgent economy’, Journal of EconomicPerspectives, vol. 28, no. 1, pp. 167–88.
Emmerson, C. and Tetlow, G. (2015), ‘UK public finances: from crisis to recovery’, FiscalStudies, vol. 36, pp. 555–77 (this issue).
Figari, F. and Fiorio, C. V. (2015), ‘Fiscal consolidation policies in the context of Italy’s tworecessions’, Fiscal Studies, vol. 36, pp. 499–526 (this issue).
Innes, D. and Tetlow, G. (2015), ‘Delivering fiscal squeeze by cutting local governmentspending’, Fiscal Studies, vol. 36, pp. 303–25.
Jenkins, S. P., Brandolini, A., Micklewright, J. and Nolan, B. (eds) (2013), The Great Recessionand the Distribution of Household Income, Oxford: Oxford University Press.
C© 2015 The Authors. Fiscal Studies published by John Wiley & Sons Ltd. on behalf of Institute for Fiscal Studies

430 Fiscal Studies
Keane, C. (2015), ‘Irish public finances through the financial crisis’, Fiscal Studies, vol. 36,pp. 475–97 (this issue).
Martı, F. and Perez, J. J. (2015), ‘Spanish public finances through the financial crisis’, FiscalStudies, vol. 36, pp. 527–54 (this issue).
Ortega, E. and Penalosa, J. (2013), ‘Some thoughts on the Spanish economy after five years ofcrisis’, Bank of Spain, Occasional Paper no. 1304.
C© 2015 The Authors. Fiscal Studies published by John Wiley & Sons Ltd. on behalf of Institute for Fiscal Studies