european smart metering benchmark · with a weighted average cost per electricity smart meter of...
TRANSCRIPT
European smart meteringbenchmark
European Commission DG EnergyBELGIUM
PUBLIC
27 June 2019
Final Report Benchmarking Smart
Metering deployment in the EU-28 PUBLIC
Th
is d
ocum
en
t is
the
pro
pe
rty o
f T
racte
be
l Im
pa
ct
Be
lgiu
m S
.A.
An
y d
up
lica
tion
or
tra
nsm
issio
n t
o t
hird
pa
rtie
s is f
orb
idd
en
with
ou
t p
rio
r w
ritte
n a
ppro
va
l
BENCHMARKING SMART METERING DEPLOYMENT IN THE EU-28
Revised Final Report
TABLE OF CONTENTS
LIST OF ABBREVIATIONS ............................................................................................................ 3
1 EXECUTIVE SUMMARY.......................................................................................................... 5
2 BACKGROUND ...................................................................................................................... 15
2.1 Context ...................................................................................................................... 15
2.2 Objectives ................................................................................................................. 15
2.3 This report ................................................................................................................. 16
3 EUROPEAN LEGISLATIVE FRAMEWORK RELATED TO SMART METERING................. 16
3.1 Institutional background.......................................................................................... 17
3.2 Clean energy package and recast of Internal Electricity Market Directive......... 19
4 DATA COLLECTION AND VALIDATION METHODOLOGY ................................................. 22
4.1 Data collection at national level .............................................................................. 22
4.2 Data consolidation at European level .................................................................... 24
4.3 Stakeholders engagement activities ...................................................................... 24
5 BENCHMARKING .................................................................................................................. 24
5.1 Electricity smart meters ........................................................................................... 25
5.1.1 Regulatory framework ................................................................................... 25
5.1.2 Cost benefit analysis ..................................................................................... 28
5.1.3 Deployment state of play ............................................................................... 44
5.1.4 Functional specifications ............................................................................... 56
5.2 Gas smart meters ..................................................................................................... 62
5.2.1 Regulatory framework ................................................................................... 62
Final Report Benchmarking Smart
Metering deployment in the EU-28 PUBLIC
Th
is d
ocum
en
t is
the
pro
pe
rty o
f T
racte
be
l Im
pa
ct
Be
lgiu
m S
.A.
An
y d
up
lica
tion
or
tra
nsm
issio
n t
o t
hird
pa
rtie
s is f
orb
idd
en
with
ou
t p
rio
r w
ritte
n a
ppro
va
l
5.2.2 Cost benefit analysis ..................................................................................... 64
5.2.3 Deployment state of play ............................................................................... 73
5.2.4 Functional specifications ............................................................................... 80
5.3 Cross-cutting considerations ................................................................................. 83
5.3.1 Technical specifications ................................................................................. 83
5.3.2 Information security & Data management ..................................................... 88
5.3.3 Consumer outcomes ..................................................................................... 94
6 DEEP DIVES ........................................................................................................................ 106
6.1 Roll out of the 2nd generation of smart electricity meters in Italy ..................... 106
6.1.1 Regulatory framework ................................................................................. 108
6.1.2 Features and benefits of the 2G smart meter .............................................. 109
6.2 Digital transformation in Estonia .......................................................................... 110
6.2.1 Estonia, is one of the world’s most advanced digital nations ..................... 110
6.2.2 Central data hub .......................................................................................... 111
6.3 Advanced consumer services in The Netherlands ............................................. 112
6.3.1 Case study – Dynamic energy pricing ......................................................... 114
7 RECOMMENDATIONS FOR NATIONAL AUTHORITIES ................................................... 116
7.1 Purpose ................................................................................................................... 116
7.2 Recommendations ................................................................................................. 116
7.2.1 Global context .............................................................................................. 116
7.2.2 Legal framework .......................................................................................... 117
7.2.3 Cost benefit assessment ............................................................................. 118
7.2.4 State of play ................................................................................................. 119
7.2.5 Functional and technical specifications ....................................................... 120
7.2.6 Data management ....................................................................................... 122
7.2.7 Consumer satisfaction ................................................................................. 125
8 CONCLUSION ..................................................................................................................... 126
Final Report Benchmarking Smart
Metering deployment in the EU-28 PUBLIC
Th
is d
ocum
en
t is
the
pro
pe
rty o
f T
racte
be
l Im
pa
ct
Be
lgiu
m S
.A.
An
y d
up
lica
tion
or
tra
nsm
issio
n t
o t
hird
pa
rtie
s is f
orb
idd
en
with
ou
t p
rio
r w
ritte
n a
ppro
va
l
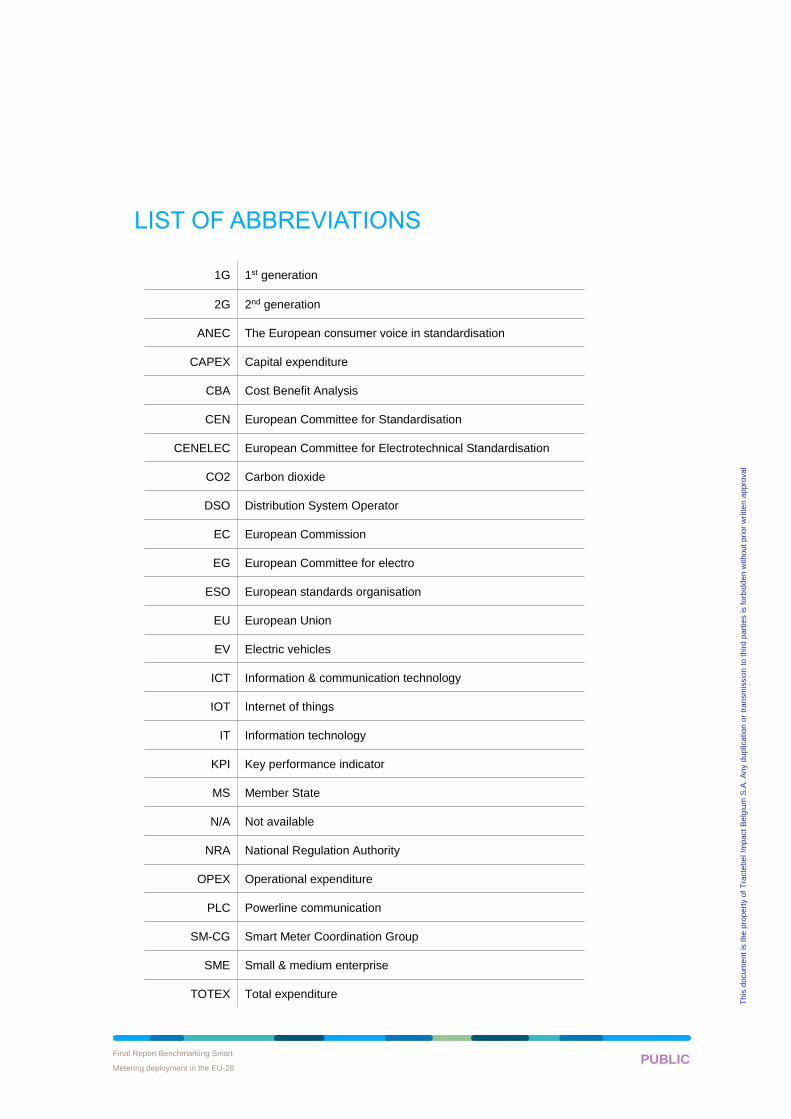
LIST OF ABBREVIATIONS
1G 1st generation
2G 2nd generation
ANEC The European consumer voice in standardisation
CAPEX Capital expenditure
CBA Cost Benefit Analysis
CEN European Committee for Standardisation
CENELEC European Committee for Electrotechnical Standardisation
CO2 Carbon dioxide
DSO Distribution System Operator
EC European Commission
EG European Committee for electro
ESO European standards organisation
EU European Union
EV Electric vehicles
ICT Information & communication technology
IOT Internet of things
IT Information technology
KPI Key performance indicator
MS Member State
N/A Not available
NRA National Regulation Authority
OPEX Operational expenditure
PLC Powerline communication
SM-CG Smart Meter Coordination Group
SME Small & medium enterprise
TOTEX Total expenditure

Final Report Benchmarking Smart
Metering deployment in the EU-28 • 5/127 PUBLIC
Th
is d
ocum
en
t is
the
pro
pe
rty o
f T
racte
be
l Im
pa
ct
Be
lgiu
m S
.A.
An
y d
up
lica
tion
or
tra
nsm
issio
n t
o t
hird
pa
rtie
s is f
orb
idd
en
with
ou
t p
rio
r w
ritte
n a
ppro
va
l
1 EXECUTIVE SUMMARY
As Miguel Arias Cañete, the EU Commissioner for Climate and Energy stated, the
European Union has already started the modernization and transformation towards a
climate neutral economy. And today, we are stepping up our efforts as we propose a
strategy for Europe to become the world's first major economy to go climate neutral by
20501.
To foster the transition of its economy from a centralized, rigid, fossil fuel-based energy
system towards a flexible, decentralized, decarbonized energy system, the European
Union has been adapting its policy and regulatory framework continuously. The Clean
Energy Package has thus been conceived as the central pillar of the Energy Union
strategy for the forthcoming decades.
With digitalisation being a main enabler for the rise of a resilient and secure grid of the
future, the recently updated European Union regulatory instruments stress more than
ever the need for a large-scale roll-out of smart energy meters. Despite the current
advanced stage of smart electricity and gas meter deployment in some Member States,
others they are still at the very beginning of this process. Yet, the objectives of the
European Union in terms of energy transition will not be reached if all European citizens
do not find themselves on the same page. Thus a harmonization effort is required
and guidance must be provided to stakeholders in order to observe consistent
application of smart meters’ provisions across Member States. The European
Commission is therefore calling for a fit for purpose deployment of smart metering
systems across the Energy Union.
The adoption of the 2009/72/EC Electricity Directive and the 2009/73/EC Gas Directive
has triggered the necessity to conduct a cost benefits analysis (CBA) on the deployment
of smart metering systems in each Member States. In 2014, a first benchmarking report
was presented by the European Commission, presenting the CBAs' outcome.
The aim of the present report is to update the information from that first benchmarking
report, gauge progress with smart metering since then, and even go one step further
and gather the returns of experience and lessons learned from previously initiated large
scale smart meters roll-out. This will help provide insights and guidelines for Member
States currently planning their deployment strategy.
The report considers for the 28 EU Member States, the regulatory framework
implemented at national level, the data management system architecture chosen, the
functional and technical specification of smart meters as well as whether consumer
benefits are incorporated into the roll-out strategy. Furthermore, the current roll-out state
of play is described and results of updated CBAs are analysed.
1 European Commission – Press release : http://europa.eu/rapid/press-release_IP-18-6543_en.htm
Final Report Benchmarking Smart
Metering deployment in the EU-28 • 6/127 PUBLIC
Th
is d
ocum
en
t is
the
pro
pe
rty o
f T
racte
be
l Im
pa
ct
Be
lgiu
m S
.A.
An
y d
up
lica
tion
or
tra
nsm
issio
n t
o t
hird
pa
rtie
s is f
orb
idd
en
with
ou
t p
rio
r w
ritte
n a
ppro
va
l
The data collection and validation methodology has been carried out by directly
engaging with National authorities – NRAs and Energy ministries – to collect relevant
information in a systematic manner. A standard questionnaire has been sent to NRAs
(or the entitled body for smart meters roll-out planning), to capture the state of play of
smart metering deployment in each Member State. Based on the answers received to
the questionnaire, country fiches have been elaborated and shared for early feedback.
The next phase consisted of the validation of the findings coming from the consolidated
analysis against the data gathered at Member States level. To this end, an informal
consultation with relevant stakeholders permitted to gather views and insights on the
recommendations that were preliminary drawn, following the consolidated analysis.
• From planning to realisation…
The Third Energy Package required Member States to conduct a CBA for smart
metering deployment, and to roll-out, for the case of electricity at least 80% by 2020, of
the positively assessed cases. Yet, the purpose of this report is to assess how far the
Member States have come in their national deployment plans with this obligation. The
first aspect to consider is the development of implementation laws that will enable a roll-
out strategy and detailed specifications to be put in place at national level.
The picture appears to be quite different when assessing the situation for gas and
electricity smart meters. While three quarters of Member States have adopted specific
legal provisions for the roll-out of electricity smart meters, only a quarter of them has
done so for the roll-out of gas smart meters.
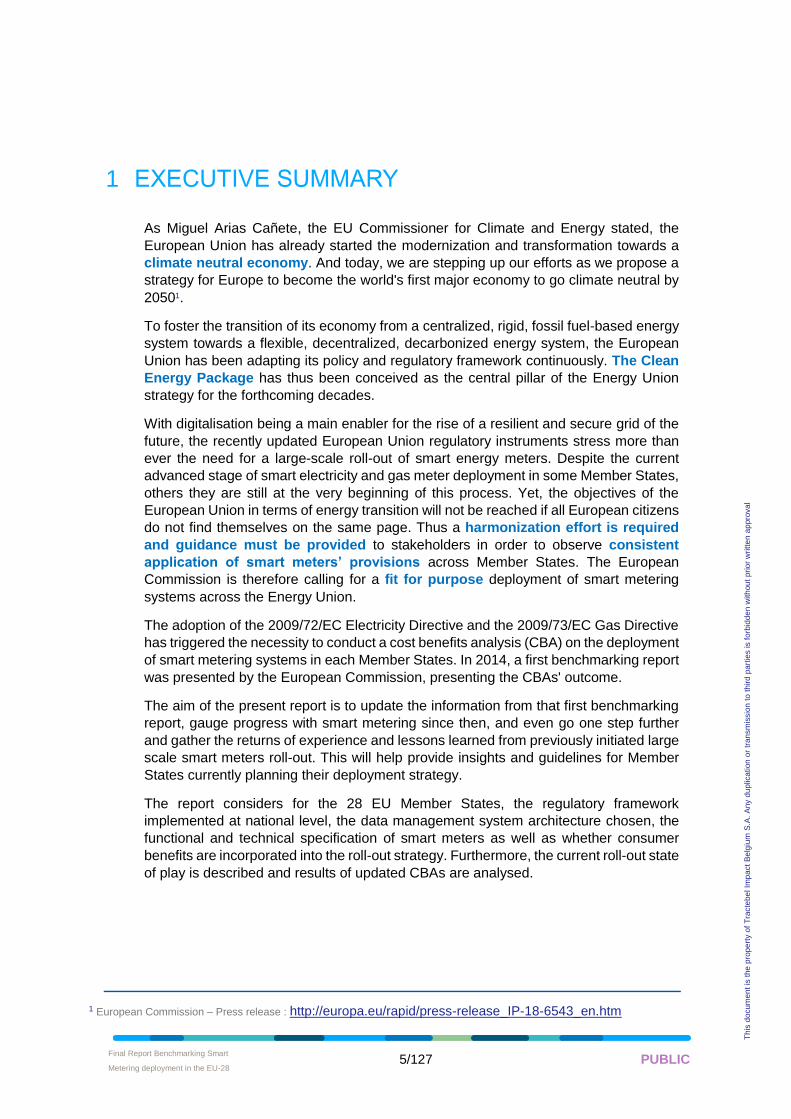
As of July 2018 all but two Member States have conducted at least one CBA for a large-
scale rollout of electricity smart meters to at least 80% by 2020 , with the results for most
of these being positive. This can be seen in Figure 1. Regarding gas smart meters, the
majority of Member States either did not conduct a CBA or did not specify whether the
CBA conducted was for gas as well as electricity. But for those Member States that did
perform a CBA for the roll-out of gas smart meters, the results were most of the time
negative.
Final Report Benchmarking Smart
Metering deployment in the EU-28 • 7/127 PUBLIC
Th
is d
ocum
en
t is
the
pro
pe
rty o
f T
racte
be
l Im
pa
ct
Be
lgiu
m S
.A.
An
y d
up
lica
tion
or
tra
nsm
issio
n t
o t
hird
pa
rtie
s is f
orb
idd
en
with
ou
t p
rio
r w
ritte
n a
ppro
va
l
Figure 1: Revised CBA results electricity smart meters considering a large-scale rollout to at least 80% by 2020 (as of July 2018).
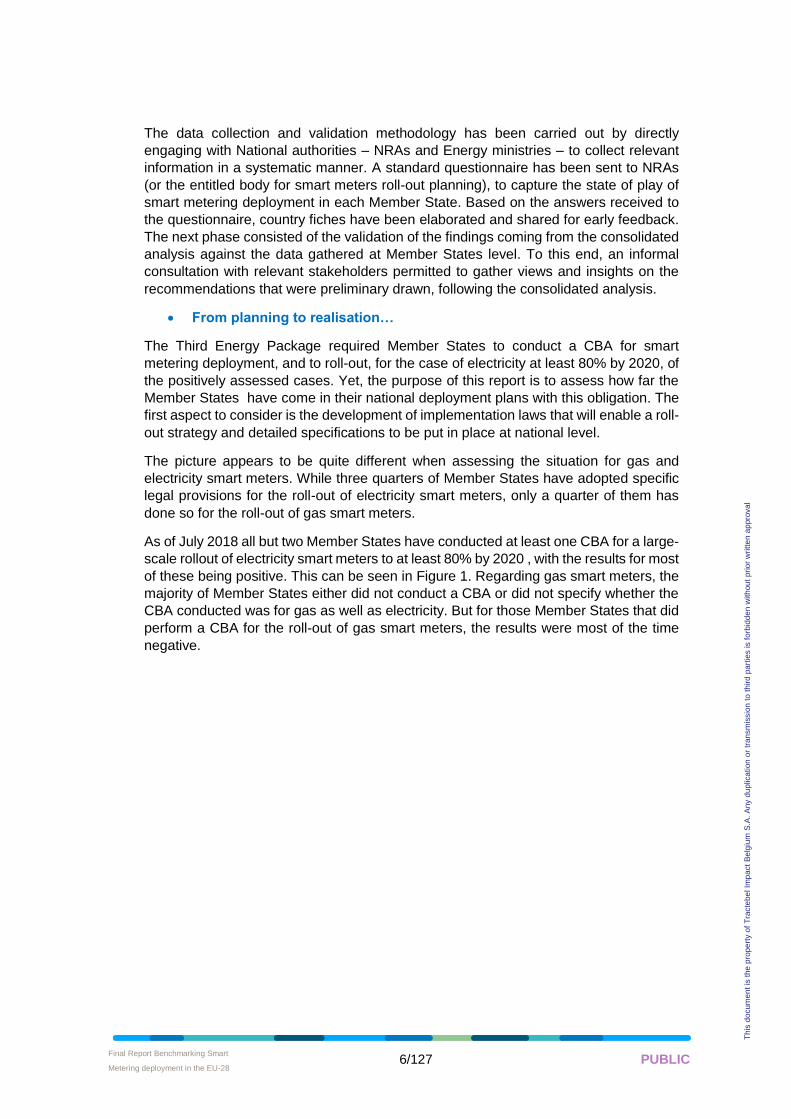
Taking a closer look at the CBA performed for electricity smart metering, more
specifically the cost items considered by Member States (see Figure 2), the capital costs
associated with smart meters themselves and the IT infrastructure was considered by
approximately 90% of the Member States. Other cost items considered by Member
States are the operation expenses linked to meter readings, IT maintenance,
telecommunications and network management, being considered by 85% of the
Member States when conducting their respective CBAs.
Figure 2: Ranking of the considered CAPEX and OPEX costs in the CBA for electricity smart metering deployment .
Final Report Benchmarking Smart
Metering deployment in the EU-28 • 8/127 PUBLIC
Th
is d
ocum
en
t is
the
pro
pe
rty o
f T
racte
be
l Im
pa
ct
Be
lgiu
m S
.A.
An
y d
up
lica
tion
or
tra
nsm
issio
n t
o t
hird
pa
rtie
s is f
orb
idd
en
with
ou
t p
rio
r w
ritte
n a
ppro
va
l
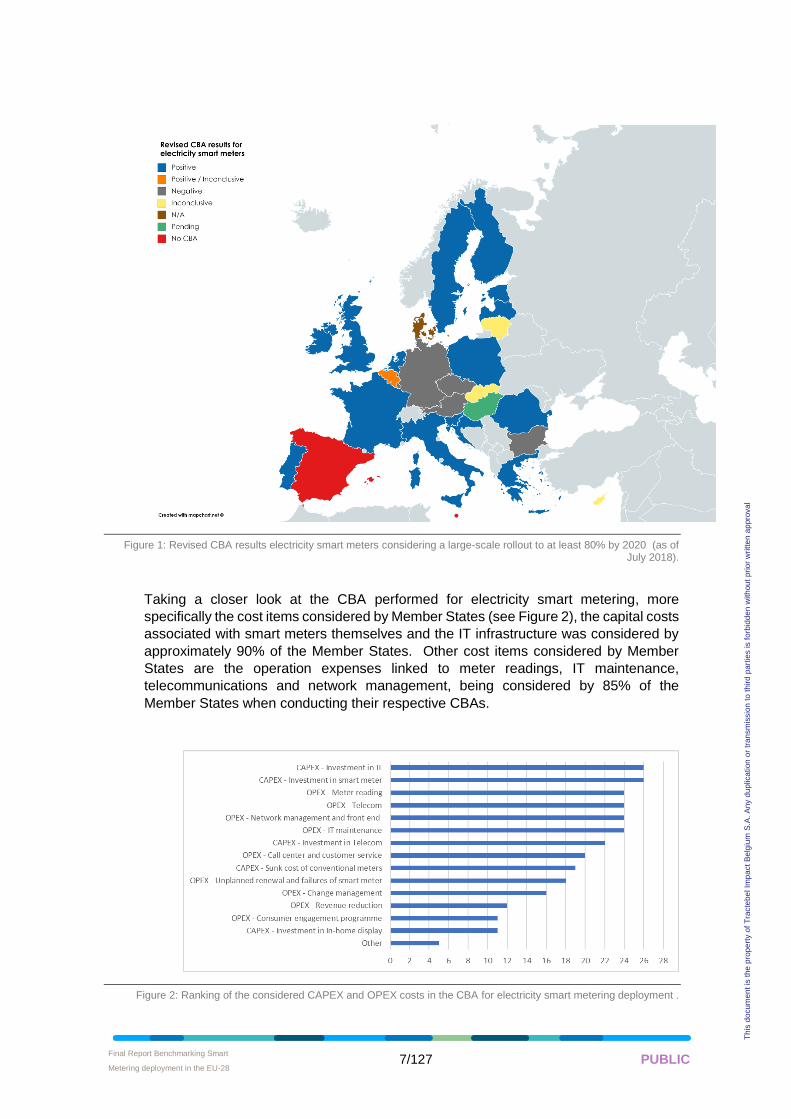
The most common benefits taking into account in the CBA for electricity smart metering
are related to DSOs, and are the operational savings that can be achieved through
remote meter readings and the reduction of non-technical losses. 75% of Member
States have also considered the consumer’s bill reduction as a result of increased
energy efficiency. Table 1 summarizes key electricity CBA parameters.
Range of value Average
Lifetime 8 to 50 years 16 + 8 years (71%)2
Evaluation period 8 to 50 years 22 + 13 years (60%)
Costs per metering points
€38 to €546 €211 + €117 (57%)
Benefits per metering points
€19 to €493 €216 + €150 (46%)
Energy savings3 5.42% - 7.85%4 N/A
Table 1: Key electricity CBA parameters
As of 2018, 33.83% of all electricity metering points were equipped with a smart meter
(ca. 99,080,000 smart meters). Taken separately, households electricity metering
points and SMEs metering points were equipped at 34.5% and 27.52%, respectively.
By 2020, based on the originally announced rollout plans 127,593,300 additional smart
meters were to be installed within the EU-28 (setting the total number of smart meters
to ca. 226 million). That would correspond to a penetration ratio of electricity smart
meters of ca. 78%.
However, given the speed of deployment observed in 2017, we estimate5 that only 24
million additional smart meters will be installed by 2020, setting the total number of
electricity smart meters to 123 million, which would correspond to a 42.5% penetration
rate. With a weighted average cost per electricity smart meter of 153,30€6, the
deployment of these 123 million smart meters would have required an aggregated
investment of €18.8 billion.
2 This percentage relates to the number of measurements that fall within the range of the average value quoted ± the standard
deviation given.
3 Estimates provided by VaasaETT report on “The role of Data for Consumer Centric Energy Markets and Solutions”
(https://esmig.eu/sites/default/files/report_-
_the_role_of_data_for_consumer_centric_energy_markets_and_solutions_2019.pdf)
4 The first figure relates to energy savings induced by non-real-time up to daily feedback on electricity consumption, while the
second relates to energy savings induced by real-time feedback on electricity consumption.
5 These estimations are based on the observed rate of deployment of electricity smart meters in 2017.
6 The computation of this weighted average includes Austria, Denmark, Estonia, Finland, France, Italy, Luxembourg, Malta,
the Netherlands, Spain, Sweden, United Kingdom, Greece, Ireland, Latvia, Poland, Romania and Slovenia.
Final Report Benchmarking Smart
Metering deployment in the EU-28 • 9/127 PUBLIC
Th
is d
ocum
en
t is
the
pro
pe
rty o
f T
racte
be
l Im
pa
ct
Be
lgiu
m S
.A.
An
y d
up
lica
tion
or
tra
nsm
issio
n t
o t
hird
pa
rtie
s is f
orb
idd
en
with
ou
t p
rio
r w
ritte
n a
ppro
va
l
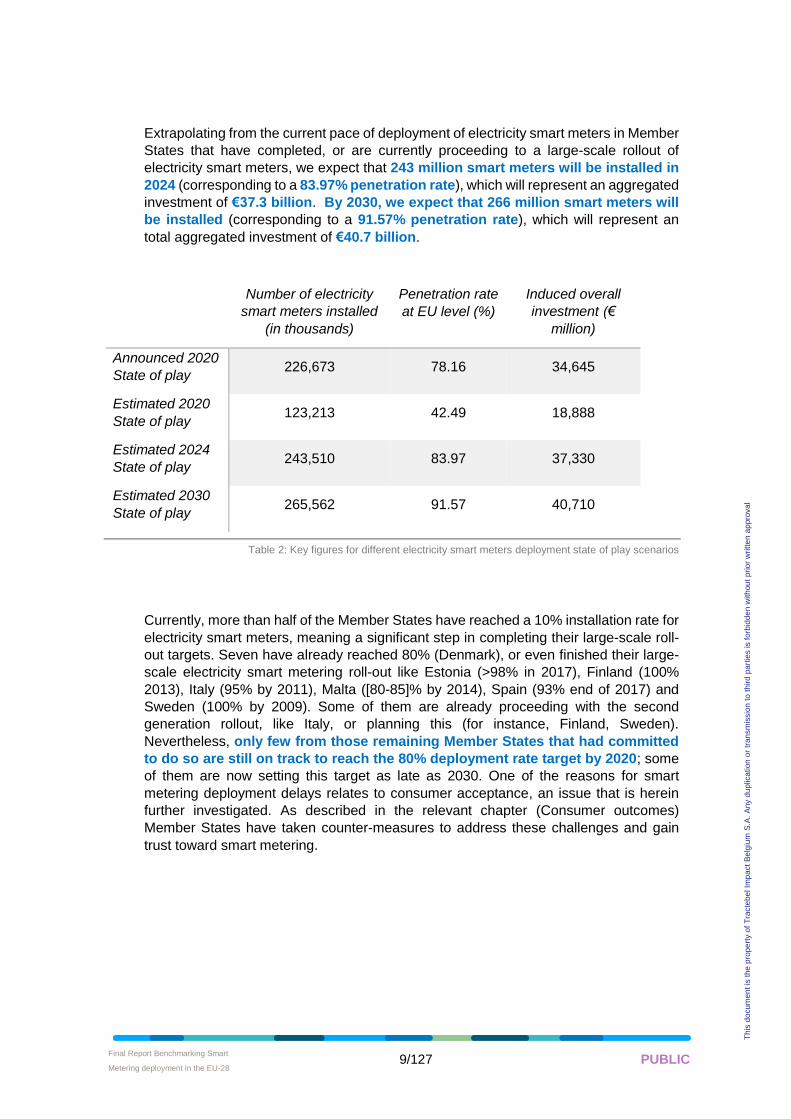
Extrapolating from the current pace of deployment of electricity smart meters in Member
States that have completed, or are currently proceeding to a large-scale rollout of
electricity smart meters, we expect that 243 million smart meters will be installed in
2024 (corresponding to a 83.97% penetration rate), which will represent an aggregated
investment of €37.3 billion. By 2030, we expect that 266 million smart meters will
be installed (corresponding to a 91.57% penetration rate), which will represent an
total aggregated investment of €40.7 billion.
Number of electricity
smart meters installed
(in thousands)
Penetration rate
at EU level (%)
Induced overall
investment (€
million)
Announced 2020
State of play 226,673 78.16 34,645
Estimated 2020
State of play 123,213 42.49 18,888
Estimated 2024
State of play 243,510 83.97 37,330
Estimated 2030
State of play 265,562 91.57 40,710
Table 2: Key figures for different electricity smart meters deployment state of play scenarios
Currently, more than half of the Member States have reached a 10% installation rate for
electricity smart meters, meaning a significant step in completing their large-scale roll-
out targets. Seven have already reached 80% (Denmark), or even finished their large-
scale electricity smart metering roll-out like Estonia (>98% in 2017), Finland (100%
2013), Italy (95% by 2011), Malta ([80-85]% by 2014), Spain (93% end of 2017) and
Sweden (100% by 2009). Some of them are already proceeding with the second
generation rollout, like Italy, or planning this (for instance, Finland, Sweden).
Nevertheless, only few from those remaining Member States that had committed
to do so are still on track to reach the 80% deployment rate target by 2020; some
of them are now setting this target as late as 2030. One of the reasons for smart
metering deployment delays relates to consumer acceptance, an issue that is herein
further investigated. As described in the relevant chapter (Consumer outcomes)
Member States have taken counter-measures to address these challenges and gain
trust toward smart metering.
Final Report Benchmarking Smart
Metering deployment in the EU-28 • 10/127 PUBLIC
Th
is d
ocum
en
t is
the
pro
pe
rty o
f T
racte
be
l Im
pa
ct
Be
lgiu
m S
.A.
An
y d
up
lica
tion
or
tra
nsm
issio
n t
o t
hird
pa
rtie
s is f
orb
idd
en
with
ou
t p
rio
r w
ritte
n a
ppro
va
l
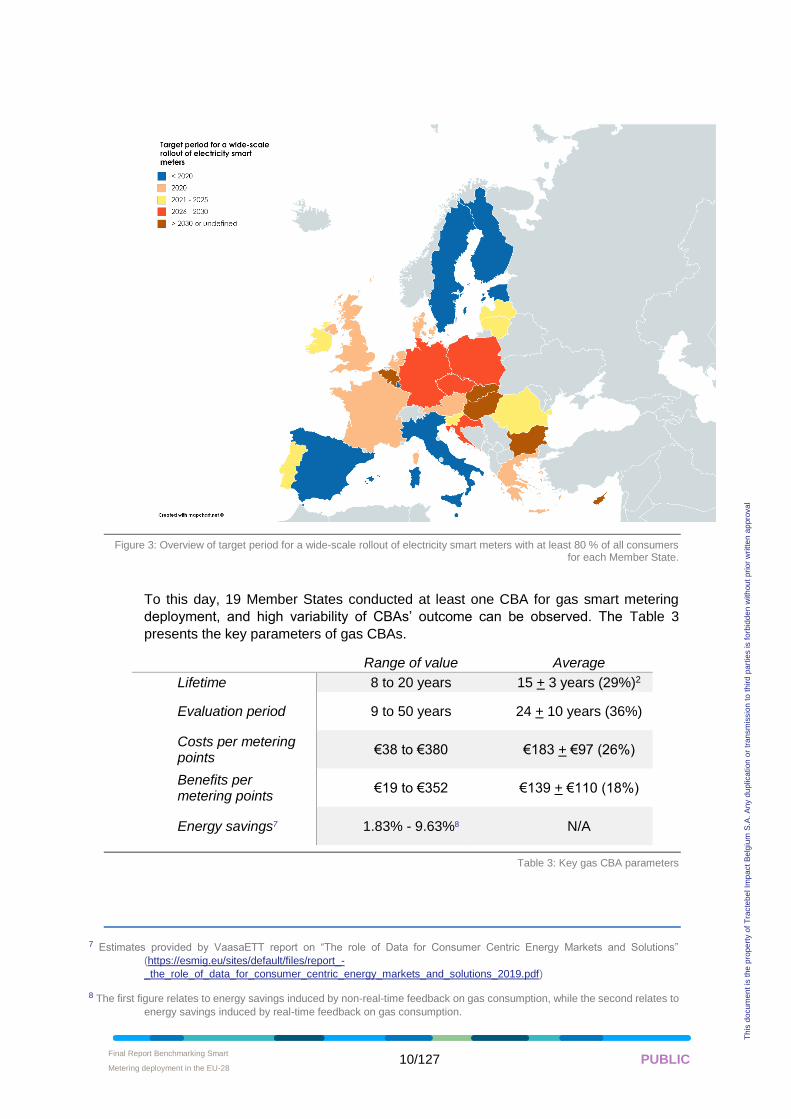
Figure 3: Overview of target period for a wide-scale rollout of electricity smart meters with at least 80 % of all consumers for each Member State.
To this day, 19 Member States conducted at least one CBA for gas smart metering
deployment, and high variability of CBAs’ outcome can be observed. The Table 3
presents the key parameters of gas CBAs.
Range of value Average
Lifetime 8 to 20 years 15 + 3 years (29%)2
Evaluation period 9 to 50 years 24 + 10 years (36%)
Costs per metering points
€38 to €380 €183 + €97 (26%)
Benefits per metering points
€19 to €352 €139 + €110 (18%)
Energy savings7 1.83% - 9.63%8 N/A
Table 3: Key gas CBA parameters
7 Estimates provided by VaasaETT report on “The role of Data for Consumer Centric Energy Markets and Solutions”
(https://esmig.eu/sites/default/files/report_-
_the_role_of_data_for_consumer_centric_energy_markets_and_solutions_2019.pdf)
8 The first figure relates to energy savings induced by non-real-time feedback on gas consumption, while the second relates to
energy savings induced by real-time feedback on gas consumption.
Final Report Benchmarking Smart
Metering deployment in the EU-28 • 11/127 PUBLIC
Th
is d
ocum
en
t is
the
pro
pe
rty o
f T
racte
be
l Im
pa
ct
Be
lgiu
m S
.A.
An
y d
up
lica
tion
or
tra
nsm
issio
n t
o t
hird
pa
rtie
s is f
orb
idd
en
with
ou
t p
rio
r w
ritte
n a
ppro
va
l
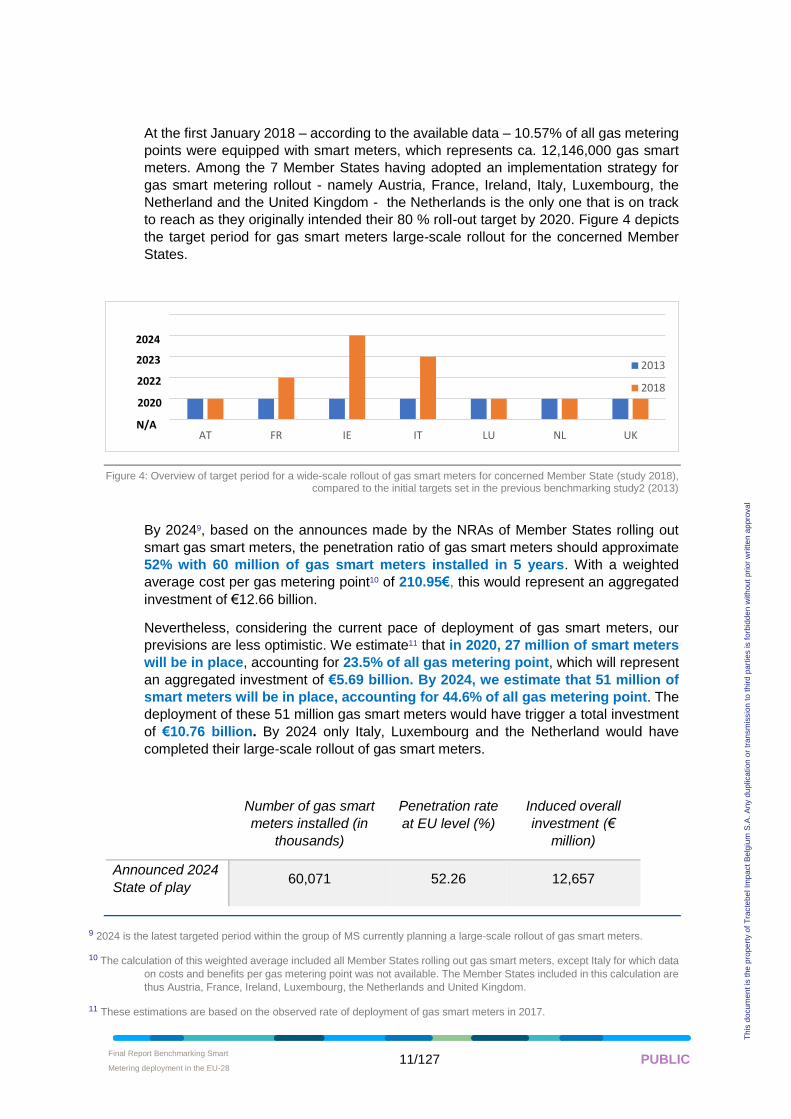
At the first January 2018 – according to the available data – 10.57% of all gas metering
points were equipped with smart meters, which represents ca. 12,146,000 gas smart
meters. Among the 7 Member States having adopted an implementation strategy for
gas smart metering rollout - namely Austria, France, Ireland, Italy, Luxembourg, the
Netherland and the United Kingdom - the Netherlands is the only one that is on track
to reach as they originally intended their 80 % roll-out target by 2020. Figure 4 depicts
the target period for gas smart meters large-scale rollout for the concerned Member
States.
Figure 4: Overview of target period for a wide-scale rollout of gas smart meters for concerned Member State (study 2018), compared to the initial targets set in the previous benchmarking study2 (2013)
By 20249, based on the announces made by the NRAs of Member States rolling out
smart gas smart meters, the penetration ratio of gas smart meters should approximate
52% with 60 million of gas smart meters installed in 5 years. With a weighted
average cost per gas metering point10 of 210.95€, this would represent an aggregated
investment of €12.66 billion.
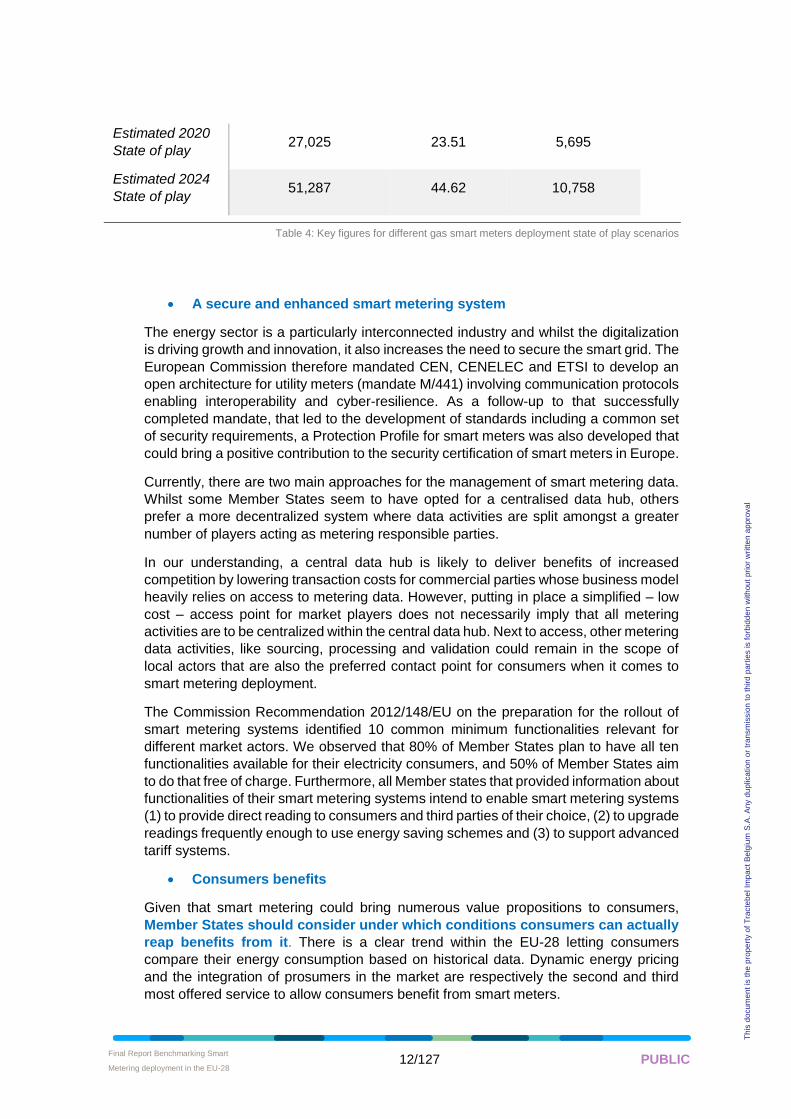
Nevertheless, considering the current pace of deployment of gas smart meters, our
previsions are less optimistic. We estimate11 that in 2020, 27 million of smart meters
will be in place, accounting for 23.5% of all gas metering point, which will represent
an aggregated investment of €5.69 billion. By 2024, we estimate that 51 million of
smart meters will be in place, accounting for 44.6% of all gas metering point. The
deployment of these 51 million gas smart meters would have trigger a total investment
of €10.76 billion. By 2024 only Italy, Luxembourg and the Netherland would have
completed their large-scale rollout of gas smart meters.
Number of gas smart
meters installed (in
thousands)
Penetration rate
at EU level (%)
Induced overall
investment (€
million)
Announced 2024
State of play 60,071 52.26 12,657
9 2024 is the latest targeted period within the group of MS currently planning a large-scale rollout of gas smart meters.
10 The calculation of this weighted average included all Member States rolling out gas smart meters, except Italy for which data
on costs and benefits per gas metering point was not available. The Member States included in this calculation are
thus Austria, France, Ireland, Luxembourg, the Netherlands and United Kingdom.
11 These estimations are based on the observed rate of deployment of gas smart meters in 2017.
AT FR IE IT LU NL UK
2013
2018
N/A
2020
2022
2023
2024
Final Report Benchmarking Smart
Metering deployment in the EU-28 • 12/127 PUBLIC
Th
is d
ocum
en
t is
the
pro
pe
rty o
f T
racte
be
l Im
pa
ct
Be
lgiu
m S
.A.
An
y d
up
lica
tion
or
tra
nsm
issio
n t
o t
hird
pa
rtie
s is f
orb
idd
en
with
ou
t p
rio
r w
ritte
n a
ppro
va
l
Estimated 2020
State of play 27,025 23.51 5,695
Estimated 2024
State of play 51,287 44.62 10,758
Table 4: Key figures for different gas smart meters deployment state of play scenarios
• A secure and enhanced smart metering system
The energy sector is a particularly interconnected industry and whilst the digitalization
is driving growth and innovation, it also increases the need to secure the smart grid. The
European Commission therefore mandated CEN, CENELEC and ETSI to develop an
open architecture for utility meters (mandate M/441) involving communication protocols
enabling interoperability and cyber-resilience. As a follow-up to that successfully
completed mandate, that led to the development of standards including a common set
of security requirements, a Protection Profile for smart meters was also developed that
could bring a positive contribution to the security certification of smart meters in Europe.
Currently, there are two main approaches for the management of smart metering data.
Whilst some Member States seem to have opted for a centralised data hub, others
prefer a more decentralized system where data activities are split amongst a greater
number of players acting as metering responsible parties.
In our understanding, a central data hub is likely to deliver benefits of increased
competition by lowering transaction costs for commercial parties whose business model
heavily relies on access to metering data. However, putting in place a simplified – low
cost – access point for market players does not necessarily imply that all metering
activities are to be centralized within the central data hub. Next to access, other metering
data activities, like sourcing, processing and validation could remain in the scope of
local actors that are also the preferred contact point for consumers when it comes to
smart metering deployment.
The Commission Recommendation 2012/148/EU on the preparation for the rollout of
smart metering systems identified 10 common minimum functionalities relevant for
different market actors. We observed that 80% of Member States plan to have all ten
functionalities available for their electricity consumers, and 50% of Member States aim
to do that free of charge. Furthermore, all Member states that provided information about
functionalities of their smart metering systems intend to enable smart metering systems
(1) to provide direct reading to consumers and third parties of their choice, (2) to upgrade
readings frequently enough to use energy saving schemes and (3) to support advanced
tariff systems.
• Consumers benefits
Given that smart metering could bring numerous value propositions to consumers,
Member States should consider under which conditions consumers can actually
reap benefits from it. There is a clear trend within the EU-28 letting consumers
compare their energy consumption based on historical data. Dynamic energy pricing
and the integration of prosumers in the market are respectively the second and third
most offered service to allow consumers benefit from smart meters.
Final Report Benchmarking Smart
Metering deployment in the EU-28 • 13/127 PUBLIC
Th
is d
ocum
en
t is
the
pro
pe
rty o
f T
racte
be
l Im
pa
ct
Be
lgiu
m S
.A.
An
y d
up
lica
tion
or
tra
nsm
issio
n t
o t
hird
pa
rtie
s is f
orb
idd
en
with
ou
t p
rio
r w
ritte
n a
ppro
va
l
But it must be understood that those value propositions can only benefit consumers if
they carry motivations and abilities to do so. With regards to these considerations it
should be noted that concerns about smart meters have been expressed in almost
all Member States; more specifically the accuracy of the smart meter, the
electromagnetic radiation they produce and privacy related issues being the main
concerns. Communication campaigns launched have a tendency to focus more on the
installation and the advantages of smart meters, but failed to address these concerns
expressed by European citizens. NRAs (or smart metering deployment responsible
parties) should proceed to the ex-post assessment of their communication campaigns’
outcomes in order to track the key messages that have been successfully delivered to
consumers. Probably more important, in a context of diversification of consumers
(prosumers) behaviours, they should consider systematically tailoring their
communication channels to a specifically targeted audience.
We conclude that smart metering system deployment should not constitute for Member
States a missed opportunity to enable the grid digitalization and to foster the integration
of European energy markets.
The level of progress of the legal and regulatory framework at national level shows a
contrasted picture. This fragmentation preclude service providers from reaching
economies of scale, which limits the upscaling of services offered to consumers
The CBA, as performed by many Member States does not fully capture the full range of
benefits enabled by smart metering. We recommend to national authorities to use the
Cost Benefit Assessment to investigate how to best meet consumer needs and monitor
the actual delivery of benefits, not to justify political choices.
When designing their data management system, Member States must fully integrate
considerations regarding the resilience of the system to cyber-attack, black-out recovery
capability as well as the feasibility of a system replacement if better options can be
considered. A significant proportion of smart meters installed in Europe today still have
a limited data storage capacity, which make it difficult to implement some value
propositions enabled by smart meters (e.g. hourly dynamic pricing) while being fully
compliant with the Measuring Instrument Directive12 (MID) requirements. A way around
this could be to make the whole smart metering system, and not just the smart meter
device, MID-compliant. That could be rather complicated though and cost-prohibitive for
some Member States. To help address this issue, the Commission could potentially
consider, always with due respect to accuracy and transparency of measurements, a
more inclusive interpretation, or even an update, of the MID requirements. This is to
ensure that those pioneers who deployed the earlier smart metering set-ups in Europe
are not punished having their customers deprived from access to novel energy services
and products.
12 https://eur-lex.europa.eu/legal-content/EN/TXT/?uri=CELEX%3A32014L0032
Final Report Benchmarking Smart
Metering deployment in the EU-28 • 14/127 PUBLIC
Th
is d
ocum
en
t is
the
pro
pe
rty o
f T
racte
be
l Im
pa
ct
Be
lgiu
m S
.A.
An
y d
up
lica
tion
or
tra
nsm
issio
n t
o t
hird
pa
rtie
s is f
orb
idd
en
with
ou
t p
rio
r w
ritte
n a
ppro
va
l
A better communication campaign and training of personnel to properly inform
customers on smart meters is required to enhance their acceptance and their ability to
reap benefit from it. The communications should also be broader (multi-channel), more
consumer-clusters specific and not time-consuming13.
13 Among other positive examples, a dedicated website relative to smart metering has been created in UK (weblink:
https://www.smartenergygb.org/en ) destined to address all consumers’ concerns, from request for installation,
safety and data privacy to smart metering benefits.
Final Report Benchmarking Smart
Metering deployment in the EU-28 • 15/127 PUBLIC
Th
is d
ocum
en
t is
the
pro
pe
rty o
f T
racte
be
l Im
pa
ct
Be
lgiu
m S
.A.
An
y d
up
lica
tion
or
tra
nsm
issio
n t
o t
hird
pa
rtie
s is f
orb
idd
en
with
ou
t p
rio
r w
ritte
n a
ppro
va
l
2 BACKGROUND
2.1 Context
The European Commission presented in its 2014 benchmarking report14 the state of
play of smart metering deployment in the European Union. This benchmarking report
intended to provide an overview of the national cost benefit analyses (CBA) that Member
States (MS) were invited to conduct following the adoption of the Electricity Directive
2009/72/EC15 and Gas Directive 2009/73/EC16.
The Electricity and Gas Directives promoted the wider user of smart metering systems
as a key enabler to allow active participation of consumers in the internal electricity and
gas markets, and to contribute to a secure, competitive and sustainable supply of
energy for Europe.17 According to these directives it is the Member States that decide
whether they will proceed with smart metering and the deployment target, usually on
the basis of an economic assessment of long-term costs and benefits to the market and
the individual consumer. Where the roll-out of smart meters is assessed positive, at
least 80 % of consumers are expected to be equipped with smart meters by 2020, in
accordance with the aforementioned Directives.
The current document comes to update the information presented in that earlier
benchmarking report regarding the implementation of smart metering in EU Member
States. Moreover, it aims to help put into light lessons learned from the field and early
returns of experience that might prove useful for others rolling out smart meters or
planning to do so in the near future and are looking for guidance.
2.2 Objectives
The objectives of this report, entitled “Benchmarking smart metering deployment in the
EU-28”, are to assess the current progress of smart metering deployment in the EU-28
against the objectives of the Third Energy Package adopted in 2009, consisting of the
Electricity Directive 2009/72/EC and Gas Directive 2009/73/EC. The scope of this study
includes both electricity and gas smart meters.
14 European Commission, “Benchmarking smart metering deployment in the EU-27 with a focus on electricity,” COM(2014)
356.
15 Directive 2009/72/EC concerning common rules for the internal market in electricity and repealing Directive 2003/54/EC, OJ
L211/55, 14.8.2009, p.55.
16 Directive 2009/73/EC concerning common rules for the internal market in natural gas and repealing Directive 2003/55/EC,
OJ L211, 14.8.2009, p.94.
17 Third Energy Package objectives and Council Communication – 2007.
Final Report Benchmarking Smart
Metering deployment in the EU-28 • 16/127 PUBLIC
Th
is d
ocum
en
t is
the
pro
pe
rty o
f T
racte
be
l Im
pa
ct
Be
lgiu
m S
.A.
An
y d
up
lica
tion
or
tra
nsm
issio
n t
o t
hird
pa
rtie
s is f
orb
idd
en
with
ou
t p
rio
r w
ritte
n a
ppro
va
l
This report also considers the latest policy initiatives undertaken by the European
Commission, especially the new provisions related to smart metering of the recast
Electricity Directive (Directive (EU) 2019/944)18 that has been recently adopted and
which further paves the way for smart metering deployment. Those provisions include,
amongst other topics of interest, smart metering system interoperability and support of
new services to deliver benefits and ultimately satisfaction to consumers.
The analysis of the updated information collected during this exercise will provide an
overall assessment of the smart metering landscape in Europe in a comprehensive and
consistent manner as well as its future outlook.
2.3 This report
This draft final report, as submitted to the European Commission, includes a detailed
description of the work performed, the information collected, the results as well as the
analyses performed for the different tasks, and principal conclusions and
recommendations.
3 EUROPEAN LEGISLATIVE FRAMEWORK RELATED TO SMART METERING
The development of smart metering systems has been carried out gradually through the
adoption of numerous legislative measures during the last decades (see Figure 1).
Originally introduced in the frame of end-use energy savings, the deployment of smart
metering systems was expected to contribute to the end consumers understanding of
their actual energy consumption hence creating stronger incentives on the demand-side
for energy efficiency. Pursuing the liberalization process of energy markets and the
constitution of a single European market, the European Commission has also
considered the smart metering systems as an effective tool to increase transparency
and competition on retail markets for electricity.
The booming of the digital economy and the proliferation of data, now considered as
economic and strategic assets, led the European institutions to take unprecedented
measures for the personal data protection of its citizens and table an overarching
comprehensive legislative framework for this19. This framework applies also to the
collection, processing and overall management of smart metering data when personal
data is concerned. In the case of non-personal data, non-discriminatory and transparent
access to it by eligible parties, and irrespectively of the data management model used,
is ensured through specific provisions and rules set in the recast Electricity Directive.
18 https://eur-lex.europa.eu/legal-content/EN/TXT/?uri=OJ:L:2019:158:TOC.
19 https://ec.europa.eu/info/law/law-topic/data-protection_en; Regulation (EU) 2016/679 on the protection of natural persons
with regard to the processing of personal data and on the free movement of such data, and repealing
Directive 95/46/EC (General Data Protection Regulation), OJ L119, 4.5.2016, p.1.
Final Report Benchmarking Smart
Metering deployment in the EU-28 • 17/127 PUBLIC
Th
is d
ocum
en
t is
the
pro
pe
rty o
f T
racte
be
l Im
pa
ct
Be
lgiu
m S
.A.
An
y d
up
lica
tion
or
tra
nsm
issio
n t
o t
hird
pa
rtie
s is f
orb
idd
en
with
ou
t p
rio
r w
ritte
n a
ppro
va
l
3.1 Institutional background
Directive 2006/32/EC20 on energy end-use efficiency and energy services prescribes
the use of cost-effective technological innovations such as “electronic metering” in order
to reach its energy saving target of 9% over the next nine years. Article 13 of this
Directive, entitled “Metering and informative billing of energy consumption”, provides
that end -consumers for electricity, natural gas, district heating and cooling and
domestic water should be provided with competitively priced individual meters that
reflect their actual consumption with information on actual time of use. Appropriate
billing information should be provided to consumers in order to enable them to regulate
their energy consumption. In particular, this information consists in the current actual
price and actual consumption of energy, the comparison with the consumption for the
same period in the previous year, and when possible, comparison with an average
normalized user of energy in the same user category. This Directive constitutes the first
step of making customers active by the use of metering.
Directive 2009/72/EC21 and Directive 2009/73/EC22, forming part of the so-called Third
Energy Package, provide in Article 3.11 that Member States and regulatory authorities
should recommend energy undertakings to optimise energy use via, amongst others,
introducing intelligent metering systems or smart grids where appropriate. Annex I of
the Directives provide instructions on the economic assessment of long-term costs and
benefits to the market and the consumers, which had to be performed by 3 September
2012, and on the implementation of smart metering systems. Annex I, in the case of
electricity, specifically states that: “Where roll-out of smart meters is assessed positively,
at least 80 % of consumers shall be equipped with intelligent metering systems by
2020”.
In the context of the smart grids development, the Commission Recommendation
2012/148/EU23 on the preparation for the roll-out of smart metering systems of 9 March
2012 defines a smart metering system as follows: “an electronic system that can
measure energy consumption, adding more information than a conventional meter, and
that can transmit and receive data using a form of electronic communication”. The
Recommendation provides guidance to Member States on the design of smart metering
systems to ensure the protection of personal data and recommend Member States to
include a data protection impact assessment in the design of smart grids and smart
metering systems. This Recommendation also provides guidelines on the methodology
for the economic assessment of the roll-out of smart metering, in accordance with Annex
I of Directives 2009/72/EC and 2009/73/EC. Finally, this Recommendation lists a set of
common minimum functional requirements for smart metering systems for electricity,
stemming from standards and experiences from earlier deployments, in order to make
them fit for purpose and help secure consumer benefits and increases in energy
efficiency.
20 https://eur-lex.europa.eu/legal-content/FR/ALL/?uri=CELEX:32006L0032
21 https://eur-lex.europa.eu/legal-content/EN/ALL/?uri=celex%3A32009L0072
22 https://eur-lex.europa.eu/legal-content/EN/ALL/?uri=CELEX%3A32009L0073
23https://publications.europa.eu/en/publication-detail/-/publication/a5daa8c6-8f11-4e5e-9634-3f224af571a6/language-fr
Final Report Benchmarking Smart
Metering deployment in the EU-28 • 18/127 PUBLIC
Th
is d
ocum
en
t is
the
pro
pe
rty o
f T
racte
be
l Im
pa
ct
Be
lgiu
m S
.A.
An
y d
up
lica
tion
or
tra
nsm
issio
n t
o t
hird
pa
rtie
s is f
orb
idd
en
with
ou
t p
rio
r w
ritte
n a
ppro
va
l
Directive 2012/27/EU24 on energy efficiency which updates the energy saving target to
20% by 2020, in its introductory remarks, takes note of the limited effects of the
provisions on metering and billing in Directives 2006/32/EC, 2009/72/EC and
2009/73/EC on energy savings, and states that: “it is important that the requirements of
Union law in this area be made clearer”. Article 9 is dedicated to metering and provides
additional instructions on the deployment and on the minimum common features of
smart metering systems as well as on data protection and privacy of final customers.
These functional requirements for the case of electricity are later on consolidated within
Article 20 of the recast Electricity Directive under the Clean Energy Package, and the
Energy Efficiency Directive is accordingly amended25.
Apart from the aforementioned provisions in energy-specific legislation, smart metering
systems need to comply, being measuring instruments, also to Directive 2014/32/EU26.
This Directive harmonises the national laws for making available on the market
measuring instruments and came to repeal the earlier Directive 2004/22/EC27 which
aimed at establishing the requirements that measuring instruments must satisfy in order
to be made available on the market. To ensure that a legal methodological control on
these instruments would not lead to barriers to their free movement, the Measuring
Instruments Directive (MID) provides that these essential requirements should be in
conformity with harmonized standards. Regulation (EU) No 1025/201228 on European
standardization designates the International Organisation for Standardisation (ISO), the
International Electrotechnical Commission (IEC) and the International
Telecommunication Union (ITU) as legitimate bodies to adopt international standards,
and designates the European Committee for Standardisation (CEN), the European
Committee for Electrotechnical Standardisation (CENELEC) and the European
Telecommunications Standards Institute (ETSI) as legitimate bodies to adopt EU-wide
standards.
The MID applies to ten different type of measuring instruments and notably gas meters
and electrical energy meters. Requirements for measuring instruments are updated
again in this Directive which provides the essential requirements common to all
measuring instrument in its Annex I, while Annex IV and Annex V respectively concern
gas meters and volume conversion devices, and active electrical energy meters.
In order to ensure that the provisions of Recommendation 2012/148/EU were followed
consistently across Member States, a template for conducting data protection impact
assessment has been developed at Union level. Commission Recommendation
2014/724/EU29 on the data protection impact assessment template for smart grid and
smart metering systems provides guidance to Member States on the use of this Data
Protection Impact Assessment Template (called the “DPIA Template”) “to help ensure
the fundamental rights to protection of personal data and to privacy in the deployment
of smart grid applications and systems and smart metering roll-out” (Article 1).
24 https://eur-lex.europa.eu/legal-content/EN/ALL/?uri=CELEX%3A32012L0027
25 https://eur-lex.europa.eu/legal-content/EN/TXT/?uri=OJ:L:2019:158:TOC;
26 https://eur-lex.europa.eu/legal-content/EN/TXT/?uri=CELEX%3A32014L0032
27 https://eur-lex.europa.eu/legal-content/EN/TXT/?uri=CELEX%3A32004L0022
28 https://eur-lex.europa.eu/legal-content/EN/TXT/?uri=CELEX:32012R1025
29 https://eur-lex.europa.eu/legal-content/EN/TXT/?uri=uriserv%3AOJ.L_.2014.300.01.0063.01.ENG
Final Report Benchmarking Smart
Metering deployment in the EU-28 • 19/127 PUBLIC
Th
is d
ocum
en
t is
the
pro
pe
rty o
f T
racte
be
l Im
pa
ct
Be
lgiu
m S
.A.
An
y d
up
lica
tion
or
tra
nsm
issio
n t
o t
hird
pa
rtie
s is f
orb
idd
en
with
ou
t p
rio
r w
ritte
n a
ppro
va
l
The Directive 2014/94/EU30 on the deployment of alternative fuels infrastructures
establishes a common framework of measures for the deployment of alternative fuels
infrastructures in order to minimise dependence on oil of transport. In Article 7, the
Directive states: “The recharging of electric vehicles at recharging points accessible to
the public shall, if technically feasible and economically reasonable, make use of
intelligent metering systems as defined in point (28) of Article 2 of Directive 2012/27/EU
and shall comply with the requirements laid down in Article 9(2) of that Directive”. This
provision is directed by the opportunity given by smart metering systems which allow
electric vehicles to be recharged during off-peak periods and which would also enable,
in the long-run, these vehicles to feed power from the batteries back into the grid at
times of high general electricity demand.
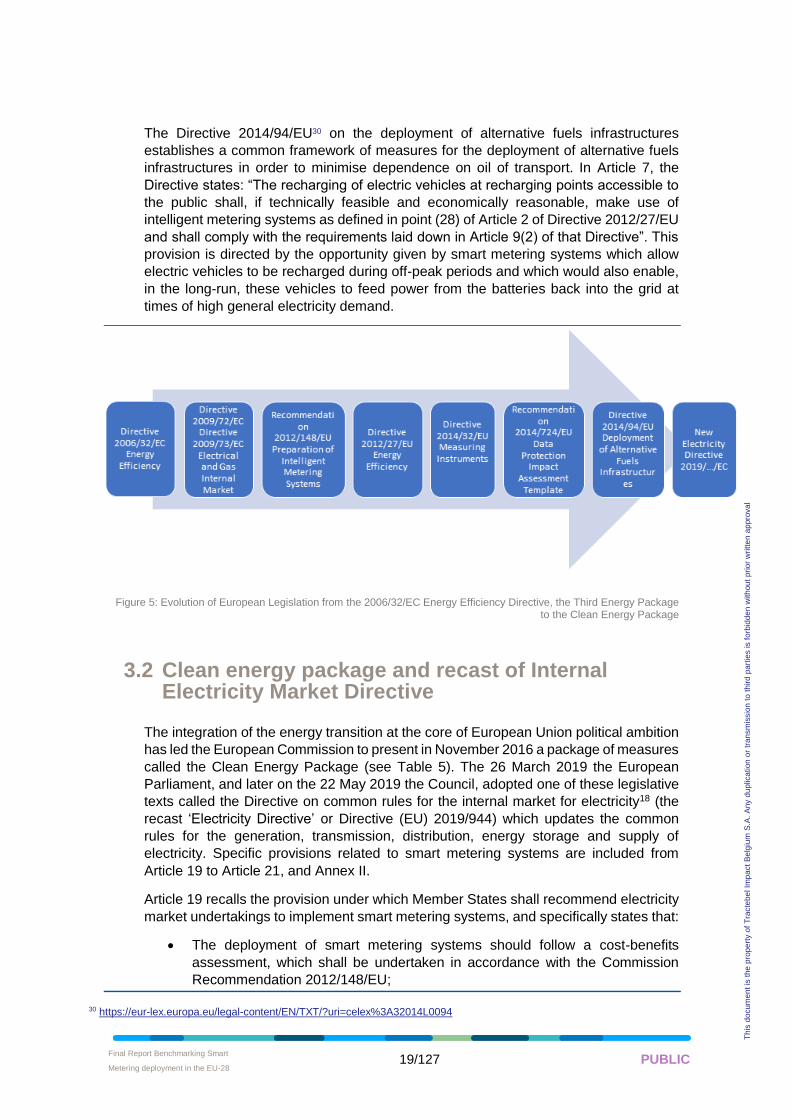
Figure 5: Evolution of European Legislation from the 2006/32/EC Energy Efficiency Directive, the Third Energy Package to the Clean Energy Package
3.2 Clean energy package and recast of Internal Electricity Market Directive
The integration of the energy transition at the core of European Union political ambition
has led the European Commission to present in November 2016 a package of measures
called the Clean Energy Package (see Table 5). The 26 March 2019 the European
Parliament, and later on the 22 May 2019 the Council, adopted one of these legislative
texts called the Directive on common rules for the internal market for electricity18 (the
recast ‘Electricity Directive’ or Directive (EU) 2019/944) which updates the common
rules for the generation, transmission, distribution, energy storage and supply of
electricity. Specific provisions related to smart metering systems are included from
Article 19 to Article 21, and Annex II.
Article 19 recalls the provision under which Member States shall recommend electricity
market undertakings to implement smart metering systems, and specifically states that:
• The deployment of smart metering systems should follow a cost-benefits
assessment, which shall be undertaken in accordance with the Commission
Recommendation 2012/148/EU;
30 https://eur-lex.europa.eu/legal-content/EN/TXT/?uri=celex%3A32014L0094
Final Report Benchmarking Smart
Metering deployment in the EU-28 • 20/127 PUBLIC
Th
is d
ocum
en
t is
the
pro
pe
rty o
f T
racte
be
l Im
pa
ct
Be
lgiu
m S
.A.
An
y d
up
lica
tion
or
tra
nsm
issio
n t
o t
hird
pa
rtie
s is f
orb
idd
en
with
ou
t p
rio
r w
ritte
n a
ppro
va
l
• Member States should publish the minimum functional and technical
requirement for these systems which should be in accordance with those
mandated in the Directive and in the spirit of the Commission Recommendation
2012/148/EU;
• Member States should ensure the interoperability of the smart metering systems
and their ability to provide output for consumer energy management systems;
• Final customers should contribute to the associated cost of deployment of smart
metering systems, in a transparent and non-discriminatory manner, while taking
into account the long-term benefits to the whole value chain;
• When the deployment of smart metering systems is negatively assessed,
Member States should revise this assessment at least every four year;
• Smart metering systems should be in accordance with applicable Union data
protection rules.
Article 20 provides that Member States should ensure that the deployed smart metering
systems are in accordance with European standards, the Commission
Recommendation 2012/148/EU, and with other specific requirements coming from
Article 9 of the Energy Efficiency Directive 2012/27/EU concerning:
• the type of data provided to customers;
• security of data and data communications;
• the availability of these data for the customers;
• the appropriate advice and information that should be given to final customers
prior to or at the time of installation of smart meters;
Article 21 provides that customers be entitled to a smart meter, even where the
deployment of smart metering systems has been negatively assessed. In such case,
customers should bear the associated costs of deployment, under fair, reasonable and
cost-effective conditions.
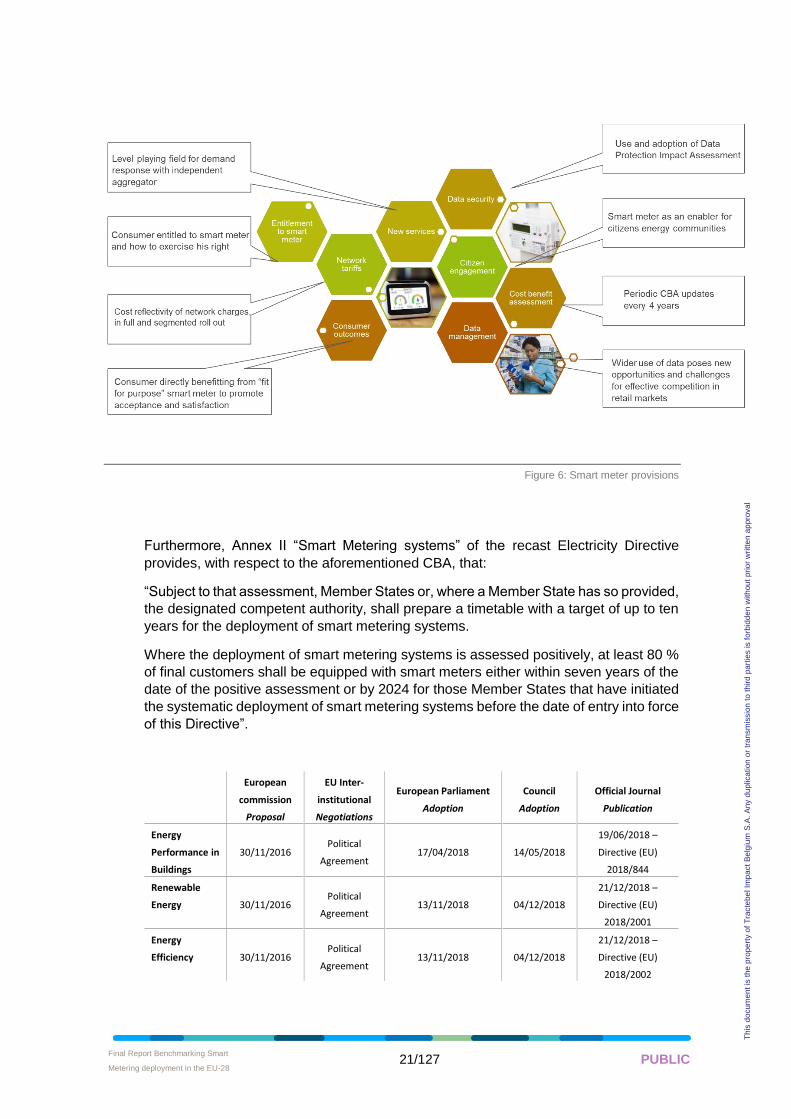
Thereby, the new Electricity Directive updates and puts forward the following provisions
that are of direct relevance to smart metering and its use as a tool for demand-side
management and flexibility (see Figure 6: Smart meter provisions):
• Establishment of a level playing field for demand response with independent
aggregator (Article 17)
• Entitlement to smart meter: consumers entitle to smart meter and how to
exercise this right (Article 21)
• Network tariffs: as a general principle of network charges, tariffs paid by
customers should fairly reflect the cost they impose on the network operator.
This should also be reflected on network charges related to smart metering
deployment (full or segmented roll out) (Article 19)
• Consumer Outcomes: consumers directly benefitting from smart meter to
promote acceptance and satisfaction, but also to ensure that deployment
does not fall short of expectations (of customers but also vis-à-vis the original
cost-benefit analysis, e.g. estimated energy savings) (Article 19)
• Data protection and security: follow applicable Union rules; use and adoption
of Data Protection Impact Assessment (Article 20, Annex II)
• Citizen engagement: wider use of data brings opportunities, but also poses
new challenges for effective competition in retail markets (Article 20)
• Cost benefit assessment: periodic CBA updates every 4 years in case of
negative CBA result (Article 19)
Final Report Benchmarking Smart
Metering deployment in the EU-28 • 21/127 PUBLIC
Th
is d
ocum
en
t is
the
pro
pe
rty o
f T
racte
be
l Im
pa
ct
Be
lgiu
m S
.A.
An
y d
up
lica
tion
or
tra
nsm
issio
n t
o t
hird
pa
rtie
s is f
orb
idd
en
with
ou
t p
rio
r w
ritte
n a
ppro
va
l
Figure 6: Smart meter provisions
Furthermore, Annex II “Smart Metering systems” of the recast Electricity Directive
provides, with respect to the aforementioned CBA, that:
“Subject to that assessment, Member States or, where a Member State has so provided,
the designated competent authority, shall prepare a timetable with a target of up to ten
years for the deployment of smart metering systems.
Where the deployment of smart metering systems is assessed positively, at least 80 %
of final customers shall be equipped with smart meters either within seven years of the
date of the positive assessment or by 2024 for those Member States that have initiated
the systematic deployment of smart metering systems before the date of entry into force
of this Directive”.
European
commission
Proposal
EU Inter-
institutional
Negotiations
European Parliament
Adoption
Council
Adoption
Official Journal
Publication
Energy
Performance in
Buildings
30/11/2016 Political
Agreement 17/04/2018 14/05/2018
19/06/2018 –
Directive (EU)
2018/844
Renewable
Energy 30/11/2016 Political
Agreement 13/11/2018 04/12/2018
21/12/2018 –
Directive (EU)
2018/2001
Energy
Efficiency 30/11/2016 Political
Agreement 13/11/2018 04/12/2018
21/12/2018 –
Directive (EU)
2018/2002
Final Report Benchmarking Smart
Metering deployment in the EU-28 • 22/127 PUBLIC
Th
is d
ocum
en
t is
the
pro
pe
rty o
f T
racte
be
l Im
pa
ct
Be
lgiu
m S
.A.
An
y d
up
lica
tion
or
tra
nsm
issio
n t
o t
hird
pa
rtie
s is f
orb
idd
en
with
ou
t p
rio
r w
ritte
n a
ppro
va
l
Governance
30/11/2016 Political
Agreement 13/11/2018 04/12/2018
21/12/2018 –
Regulation (EU)
2018/1999
Electricity
Regulation 30/11/2016 Political
Agreement 26/03/2019 22/05/2019
14/06/2019 -
Regulation (EU)
2019/943
Electricity
Directive 30/11/2016 Political
Agreement 26/03/2019 22/05/2019
14/06/2019 -
Directive (EU)
2019/944
Risk
Preparedness 30/11/2016 Political
Agreement 26/03/2019 22/05/2019
14/06/2019 -
Regulation (EU)
2019/941
ACER
30/11/2016 Political
Agreement 26/03/2019 22/05/2019
14/06/2019 -
Regulation (EU)
2019/942
Table 5: State of play of the Clean Energy Package as of June 201931.
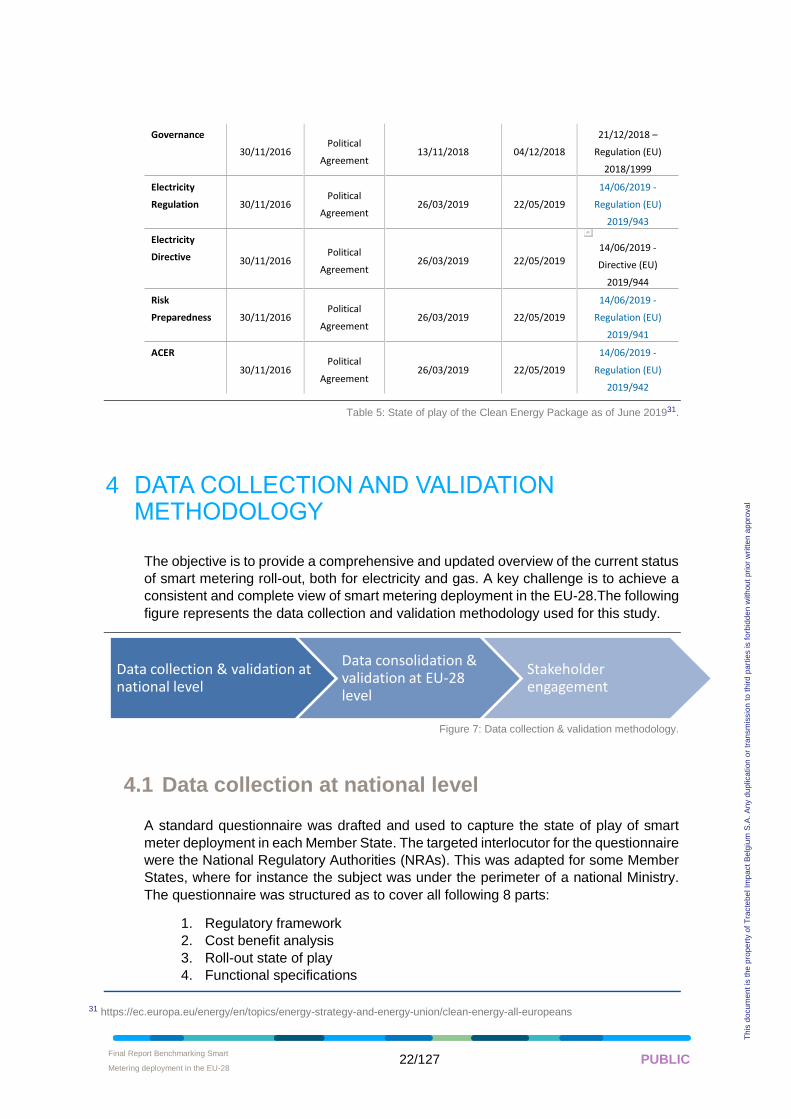
4 DATA COLLECTION AND VALIDATION METHODOLOGY
The objective is to provide a comprehensive and updated overview of the current status
of smart metering roll-out, both for electricity and gas. A key challenge is to achieve a
consistent and complete view of smart metering deployment in the EU-28.The following
figure represents the data collection and validation methodology used for this study.
Figure 7: Data collection & validation methodology.
4.1 Data collection at national level
A standard questionnaire was drafted and used to capture the state of play of smart
meter deployment in each Member State. The targeted interlocutor for the questionnaire
were the National Regulatory Authorities (NRAs). This was adapted for some Member
States, where for instance the subject was under the perimeter of a national Ministry.
The questionnaire was structured as to cover all following 8 parts:
1. Regulatory framework
2. Cost benefit analysis
3. Roll-out state of play
4. Functional specifications
31 https://ec.europa.eu/energy/en/topics/energy-strategy-and-energy-union/clean-energy-all-europeans
Data collection & validation at national level
Data consolidation & validation at EU-28 level
Stakeholder engagement
Final Report Benchmarking Smart
Metering deployment in the EU-28 • 23/127 PUBLIC
Th
is d
ocum
en
t is
the
pro
pe
rty o
f T
racte
be
l Im
pa
ct
Be
lgiu
m S
.A.
An
y d
up
lica
tion
or
tra
nsm
issio
n t
o t
hird
pa
rtie
s is f
orb
idd
en
with
ou
t p
rio
r w
ritte
n a
ppro
va
l
5. Technical specifications
6. Access to data and data management
7. Consumer outcomes
8. Data privacy / security
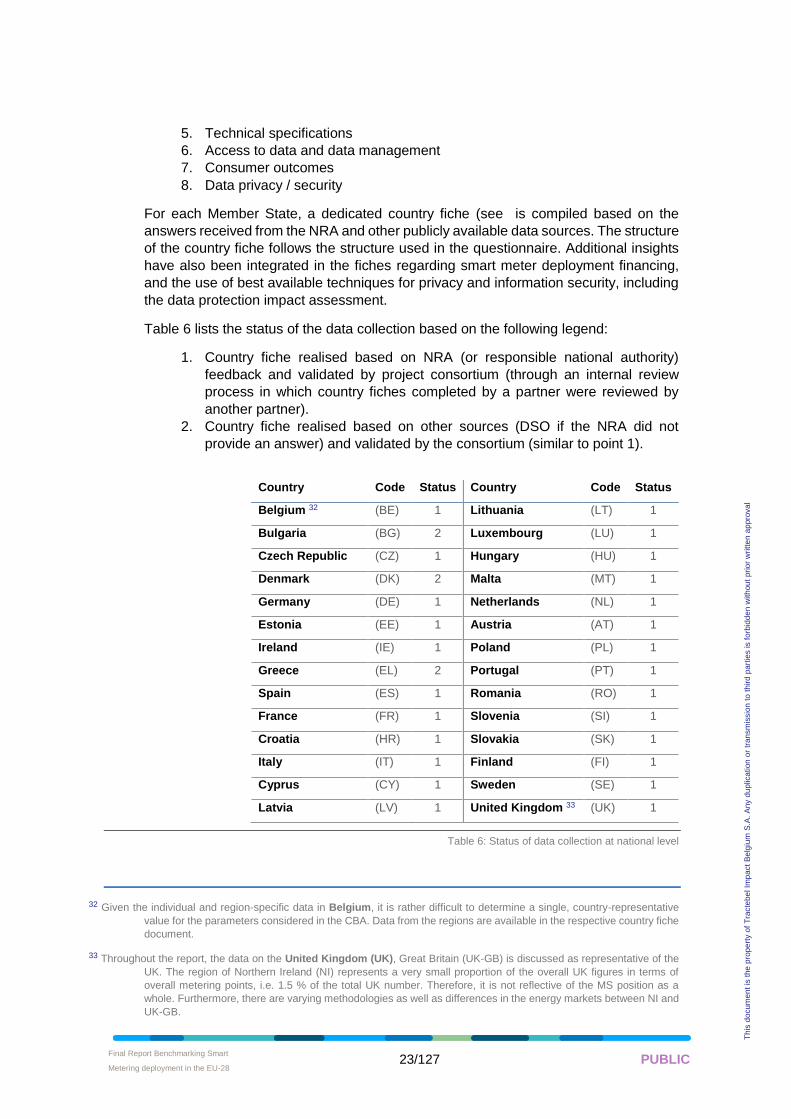
For each Member State, a dedicated country fiche (see is compiled based on the
answers received from the NRA and other publicly available data sources. The structure
of the country fiche follows the structure used in the questionnaire. Additional insights
have also been integrated in the fiches regarding smart meter deployment financing,
and the use of best available techniques for privacy and information security, including
the data protection impact assessment.
Table 6 lists the status of the data collection based on the following legend:
1. Country fiche realised based on NRA (or responsible national authority)
feedback and validated by project consortium (through an internal review
process in which country fiches completed by a partner were reviewed by
another partner).
2. Country fiche realised based on other sources (DSO if the NRA did not
provide an answer) and validated by the consortium (similar to point 1).
Country Code Status Country Code Status Belgium 32 (BE) 1 Lithuania (LT) 1
Bulgaria (BG) 2 Luxembourg (LU) 1
Czech Republic (CZ) 1 Hungary (HU) 1
Denmark (DK) 2 Malta (MT) 1
Germany (DE) 1 Netherlands (NL) 1
Estonia (EE) 1 Austria (AT) 1
Ireland (IE) 1 Poland (PL) 1
Greece (EL) 2 Portugal (PT) 1
Spain (ES) 1 Romania (RO) 1
France (FR) 1 Slovenia (SI) 1
Croatia (HR) 1 Slovakia (SK) 1
Italy (IT) 1 Finland (FI) 1
Cyprus (CY) 1 Sweden (SE) 1
Latvia (LV) 1 United Kingdom 33 (UK) 1
Table 6: Status of data collection at national level
32 Given the individual and region-specific data in Belgium, it is rather difficult to determine a single, country-representative
value for the parameters considered in the CBA. Data from the regions are available in the respective country fiche
document.
33 Throughout the report, the data on the United Kingdom (UK), Great Britain (UK-GB) is discussed as representative of the
UK. The region of Northern Ireland (NI) represents a very small proportion of the overall UK figures in terms of
overall metering points, i.e. 1.5 % of the total UK number. Therefore, it is not reflective of the MS position as a
whole. Furthermore, there are varying methodologies as well as differences in the energy markets between NI and
UK-GB.
Final Report Benchmarking Smart
Metering deployment in the EU-28 • 24/127 PUBLIC
Th
is d
ocum
en
t is
the
pro
pe
rty o
f T
racte
be
l Im
pa
ct
Be
lgiu
m S
.A.
An
y d
up
lica
tion
or
tra
nsm
issio
n t
o t
hird
pa
rtie
s is f
orb
idd
en
with
ou
t p
rio
r w
ritte
n a
ppro
va
l
4.2 Data consolidation at European level
Based on the data collected from the 28 Member States, a consolidated analysis,
covering both electricity and gas, has been carried out which details the most relevant
facts, and draws out recommendations. At this stage we have also investigated the data
comparability of collected information at national level. In this respect, most information
has been gathered using pre-selected answers and options from closed lists of
propositions. However, we have witnessed significant challenges to compare data and
some information might require additional treatment to allow a sensible benchmark,
especially economic outputs coming from the national cost benefit assessment and
more advanced topics like consumer outcomes and data management.
4.3 Stakeholders engagement activities
In order to deliver strong and undisputed recommendations, a workshop was organised
to test ideas and share the preliminary results with the target audience (NRAs) and other
relevant stakeholders. The workshop also triggered an informal consultation that
allowed stakeholders to express their views à posteriori on the material shared and the
views expressed during this interactive event.
5 BENCHMARKING
The aim of this study is to assess the current progress of smart metering deployment in
the EU-28 against the objectives of the Third Energy Package adopted in 2009, taking
also into consideration the latest policy initiatives undertaken by the European
Commission, especially the new provisions related to smart metering under the recast
Electricity Directive that has been recently adopted by the co-legislators18 and which
further paves the way for smart metering deployment.
Those provisions include, amongst other topics of interest, smart metering system
interoperability and support of new services to deliver benefits and ultimately
satisfaction to consumers.
The analysis of the data collected and herein presented provides an overall assessment
of the smart metering landscape in the EU-28, in a comprehensive and consistent
manner, as well as its outlook. Based upon this analysis, and consolidating our fact-
finding exercise, clear and strong recommendations will be framed on the way forward,
at both national and European level, towards a successful smart metering deployment
in Europe.
Final Report Benchmarking Smart
Metering deployment in the EU-28 • 25/127 PUBLIC
Th
is d
ocum
en
t is
the
pro
pe
rty o
f T
racte
be
l Im
pa
ct
Be
lgiu
m S
.A.
An
y d
up
lica
tion
or
tra
nsm
issio
n t
o t
hird
pa
rtie
s is f
orb
idd
en
with
ou
t p
rio
r w
ritte
n a
ppro
va
l
5.1 Electricity smart meters
5.1.1 Regulatory framework
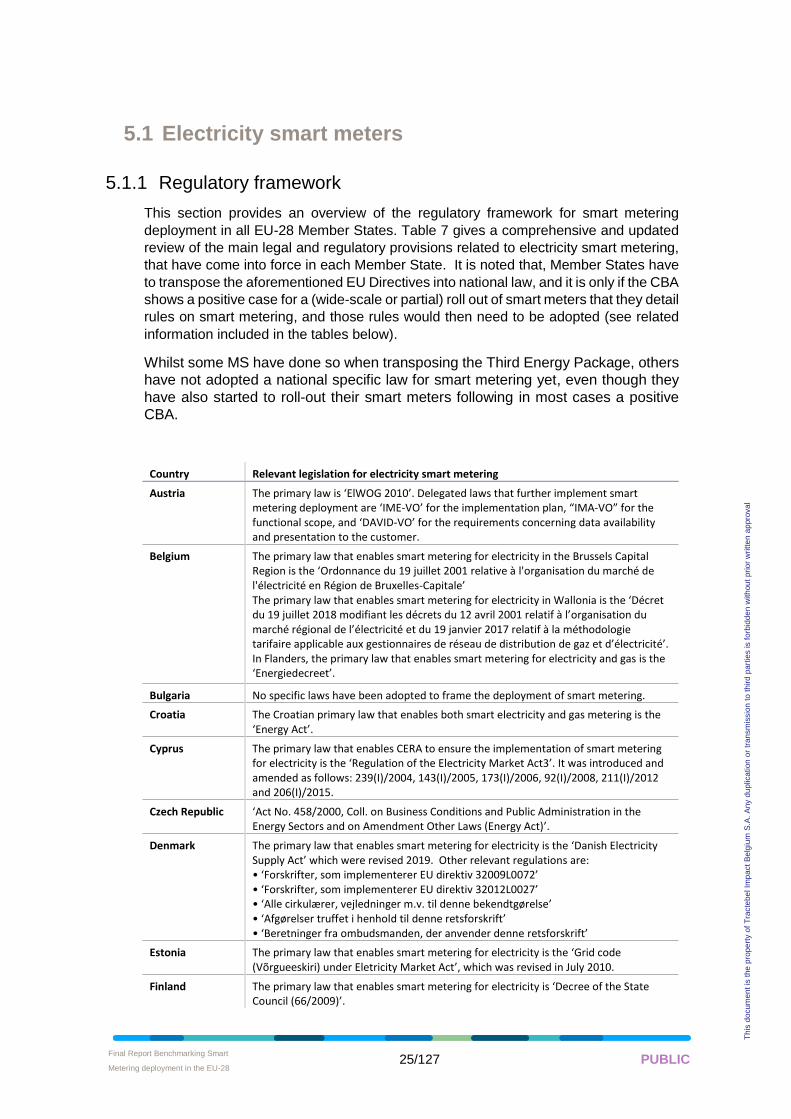
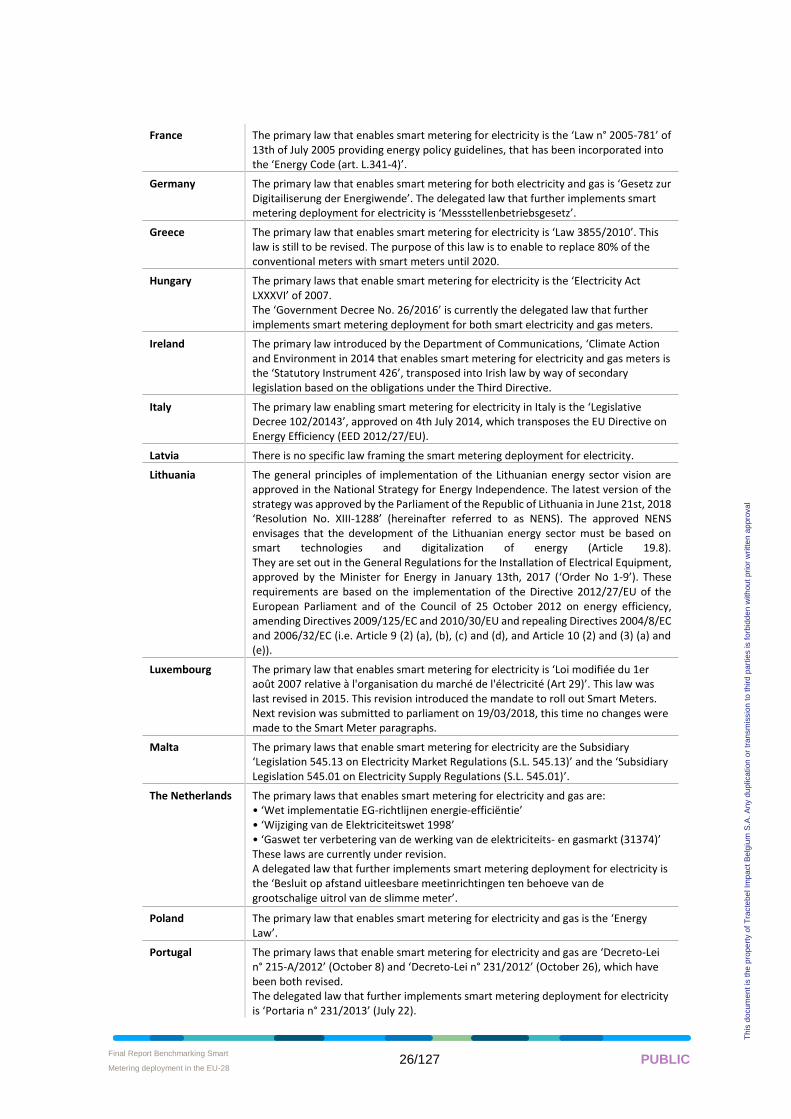
This section provides an overview of the regulatory framework for smart metering
deployment in all EU-28 Member States. Table 7 gives a comprehensive and updated
review of the main legal and regulatory provisions related to electricity smart metering,
that have come into force in each Member State. It is noted that, Member States have
to transpose the aforementioned EU Directives into national law, and it is only if the CBA
shows a positive case for a (wide-scale or partial) roll out of smart meters that they detail
rules on smart metering, and those rules would then need to be adopted (see related
information included in the tables below).
Whilst some MS have done so when transposing the Third Energy Package, others
have not adopted a national specific law for smart metering yet, even though they
have also started to roll-out their smart meters following in most cases a positive
CBA.
Country Relevant legislation for electricity smart metering
Austria The primary law is ‘ElWOG 2010’. Delegated laws that further implement smart metering deployment are ‘IME-VO’ for the implementation plan, “IMA-VO” for the functional scope, and ‘DAVID-VO’ for the requirements concerning data availability and presentation to the customer.
Belgium The primary law that enables smart metering for electricity in the Brussels Capital Region is the ‘Ordonnance du 19 juillet 2001 relative à l'organisation du marché de l'électricité en Région de Bruxelles-Capitale’ The primary law that enables smart metering for electricity in Wallonia is the ‘Décret du 19 juillet 2018 modifiant les décrets du 12 avril 2001 relatif à l’organisation du marché régional de l’électricité et du 19 janvier 2017 relatif à la méthodologie tarifaire applicable aux gestionnaires de réseau de distribution de gaz et d’électricité’. In Flanders, the primary law that enables smart metering for electricity and gas is the ‘Energiedecreet’.
Bulgaria No specific laws have been adopted to frame the deployment of smart metering.
Croatia The Croatian primary law that enables both smart electricity and gas metering is the ‘Energy Act’.
Cyprus The primary law that enables CERA to ensure the implementation of smart metering for electricity is the ‘Regulation of the Electricity Market Act3’. It was introduced and amended as follows: 239(I)/2004, 143(I)/2005, 173(I)/2006, 92(Ι)/2008, 211(I)/2012 and 206(I)/2015.
Czech Republic ‘Act No. 458/2000, Coll. on Business Conditions and Public Administration in the Energy Sectors and on Amendment Other Laws (Energy Act)’.
Denmark The primary law that enables smart metering for electricity is the ‘Danish Electricity Supply Act’ which were revised 2019. Other relevant regulations are: • ‘Forskrifter, som implementerer EU direktiv 32009L0072’ • ‘Forskrifter, som implementerer EU direktiv 32012L0027’ • ‘Alle cirkulærer, vejledninger m.v. til denne bekendtgørelse’ • ‘Afgørelser truffet i henhold til denne retsforskrift’ • ‘Beretninger fra ombudsmanden, der anvender denne retsforskrift’
Estonia The primary law that enables smart metering for electricity is the ‘Grid code (Võrgueeskiri) under Eletricity Market Act’, which was revised in July 2010.
Finland The primary law that enables smart metering for electricity is ‘Decree of the State Council (66/2009)’.
Final Report Benchmarking Smart
Metering deployment in the EU-28 • 26/127 PUBLIC
Th
is d
ocum
en
t is
the
pro
pe
rty o
f T
racte
be
l Im
pa
ct
Be
lgiu
m S
.A.
An
y d
up
lica
tion
or
tra
nsm
issio
n t
o t
hird
pa
rtie
s is f
orb
idd
en
with
ou
t p
rio
r w
ritte
n a
ppro
va
l
France The primary law that enables smart metering for electricity is the ‘Law n° 2005-781’ of 13th of July 2005 providing energy policy guidelines, that has been incorporated into the ‘Energy Code (art. L.341-4)’.
Germany The primary law that enables smart metering for both electricity and gas is ‘Gesetz zur Digitailiserung der Energiwende’. The delegated law that further implements smart metering deployment for electricity is ‘Messstellenbetriebsgesetz’.
Greece The primary law that enables smart metering for electricity is ‘Law 3855/2010’. This law is still to be revised. The purpose of this law is to enable to replace 80% of the conventional meters with smart meters until 2020.
Hungary The primary laws that enable smart metering for electricity is the ‘Electricity Act LXXXVI’ of 2007. The ‘Government Decree No. 26/2016’ is currently the delegated law that further implements smart metering deployment for both smart electricity and gas meters.
Ireland The primary law introduced by the Department of Communications, ‘Climate Action and Environment in 2014 that enables smart metering for electricity and gas meters is the ‘Statutory Instrument 426’, transposed into Irish law by way of secondary legislation based on the obligations under the Third Directive.
Italy The primary law enabling smart metering for electricity in Italy is the ‘Legislative Decree 102/20143’, approved on 4th July 2014, which transposes the EU Directive on Energy Efficiency (EED 2012/27/EU).
Latvia There is no specific law framing the smart metering deployment for electricity.
Lithuania The general principles of implementation of the Lithuanian energy sector vision are approved in the National Strategy for Energy Independence. The latest version of the strategy was approved by the Parliament of the Republic of Lithuania in June 21st, 2018 ‘Resolution No. XIII-1288’ (hereinafter referred to as NENS). The approved NENS envisages that the development of the Lithuanian energy sector must be based on smart technologies and digitalization of energy (Article 19.8). They are set out in the General Regulations for the Installation of Electrical Equipment, approved by the Minister for Energy in January 13th, 2017 (‘Order No 1-9’). These requirements are based on the implementation of the Directive 2012/27/EU of the European Parliament and of the Council of 25 October 2012 on energy efficiency, amending Directives 2009/125/EC and 2010/30/EU and repealing Directives 2004/8/EC and 2006/32/EC (i.e. Article 9 (2) (a), (b), (c) and (d), and Article 10 (2) and (3) (a) and (e)).
Luxembourg The primary law that enables smart metering for electricity is ‘Loi modifiée du 1er août 2007 relative à l'organisation du marché de l'électricité (Art 29)’. This law was last revised in 2015. This revision introduced the mandate to roll out Smart Meters. Next revision was submitted to parliament on 19/03/2018, this time no changes were made to the Smart Meter paragraphs.
Malta The primary laws that enable smart metering for electricity are the Subsidiary ‘Legislation 545.13 on Electricity Market Regulations (S.L. 545.13)’ and the ‘Subsidiary Legislation 545.01 on Electricity Supply Regulations (S.L. 545.01)’.
The Netherlands The primary laws that enables smart metering for electricity and gas are: • ‘Wet implementatie EG-richtlijnen energie-efficiëntie’ • ‘Wijziging van de Elektriciteitswet 1998’ • ‘Gaswet ter verbetering van de werking van de elektriciteits- en gasmarkt (31374)’ These laws are currently under revision. A delegated law that further implements smart metering deployment for electricity is the ‘Besluit op afstand uitleesbare meetinrichtingen ten behoeve van de grootschalige uitrol van de slimme meter’.
Poland The primary law that enables smart metering for electricity and gas is the ‘Energy Law’.
Portugal The primary laws that enable smart metering for electricity and gas are ‘Decreto-Lei n° 215-A/2012’ (October 8) and ‘Decreto-Lei n° 231/2012’ (October 26), which have been both revised. The delegated law that further implements smart metering deployment for electricity is ‘Portaria n° 231/2013’ (July 22).
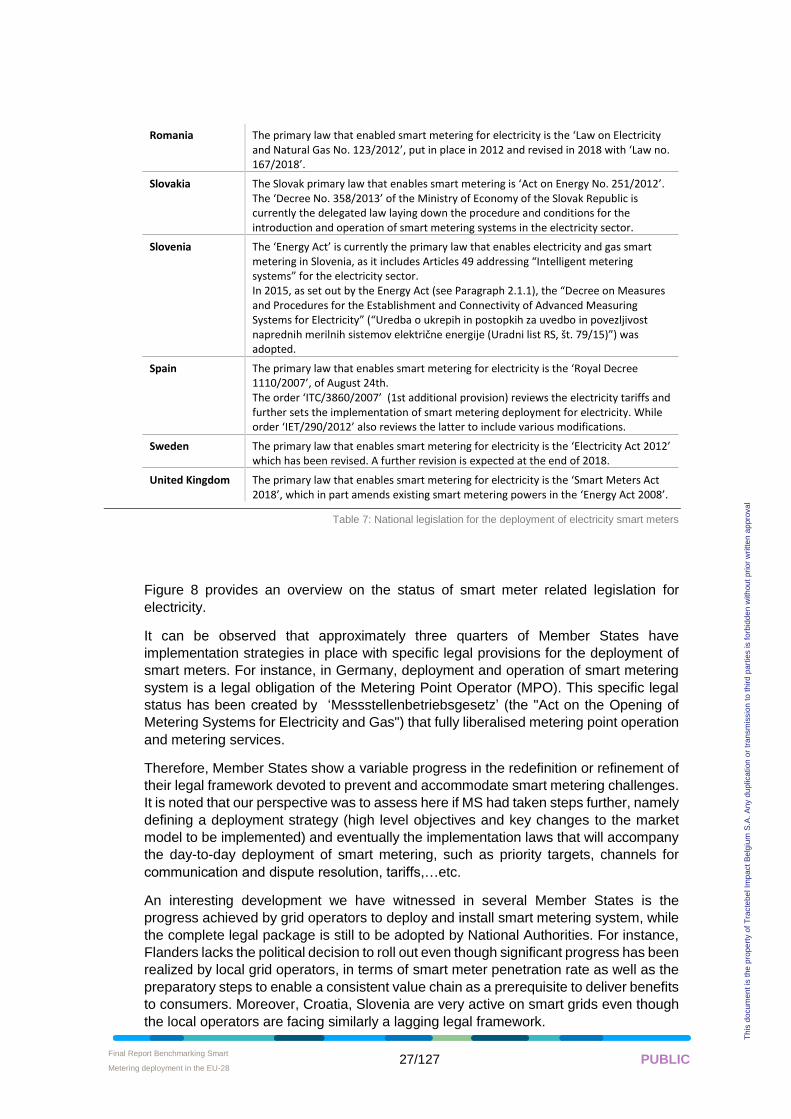
Final Report Benchmarking Smart
Metering deployment in the EU-28 • 27/127 PUBLIC
Th
is d
ocum
en
t is
the
pro
pe
rty o
f T
racte
be
l Im
pa
ct
Be
lgiu
m S
.A.
An
y d
up
lica
tion
or
tra
nsm
issio
n t
o t
hird
pa
rtie
s is f
orb
idd
en
with
ou
t p
rio
r w
ritte
n a
ppro
va
l
Romania The primary law that enabled smart metering for electricity is the ‘Law on Electricity and Natural Gas No. 123/2012’, put in place in 2012 and revised in 2018 with ‘Law no. 167/2018’.
Slovakia The Slovak primary law that enables smart metering is ‘Act on Energy No. 251/2012’. The ‘Decree No. 358/2013’ of the Ministry of Economy of the Slovak Republic is currently the delegated law laying down the procedure and conditions for the introduction and operation of smart metering systems in the electricity sector.
Slovenia The ‘Energy Act’ is currently the primary law that enables electricity and gas smart metering in Slovenia, as it includes Articles 49 addressing “Intelligent metering systems” for the electricity sector. In 2015, as set out by the Energy Act (see Paragraph 2.1.1), the “Decree on Measures and Procedures for the Establishment and Connectivity of Advanced Measuring Systems for Electricity” (“Uredba o ukrepih in postopkih za uvedbo in povezljivost naprednih merilnih sistemov električne energije (Uradni list RS, št. 79/15)”) was adopted.
Spain The primary law that enables smart metering for electricity is the ‘Royal Decree 1110/2007’, of August 24th. The order ‘ITC/3860/2007’ (1st additional provision) reviews the electricity tariffs and further sets the implementation of smart metering deployment for electricity. While order ‘IET/290/2012’ also reviews the latter to include various modifications.
Sweden The primary law that enables smart metering for electricity is the ‘Electricity Act 2012’ which has been revised. A further revision is expected at the end of 2018.
United Kingdom The primary law that enables smart metering for electricity is the ‘Smart Meters Act 2018’, which in part amends existing smart metering powers in the ‘Energy Act 2008’.
Table 7: National legislation for the deployment of electricity smart meters
Figure 8 provides an overview on the status of smart meter related legislation for
electricity.
It can be observed that approximately three quarters of Member States have
implementation strategies in place with specific legal provisions for the deployment of
smart meters. For instance, in Germany, deployment and operation of smart metering
system is a legal obligation of the Metering Point Operator (MPO). This specific legal
status has been created by ‘Messstellenbetriebsgesetz’ (the "Act on the Opening of
Metering Systems for Electricity and Gas") that fully liberalised metering point operation
and metering services.
Therefore, Member States show a variable progress in the redefinition or refinement of
their legal framework devoted to prevent and accommodate smart metering challenges.
It is noted that our perspective was to assess here if MS had taken steps further, namely
defining a deployment strategy (high level objectives and key changes to the market
model to be implemented) and eventually the implementation laws that will accompany
the day-to-day deployment of smart metering, such as priority targets, channels for
communication and dispute resolution, tariffs,…etc.
An interesting development we have witnessed in several Member States is the
progress achieved by grid operators to deploy and install smart metering system, while
the complete legal package is still to be adopted by National Authorities. For instance,
Flanders lacks the political decision to roll out even though significant progress has been
realized by local grid operators, in terms of smart meter penetration rate as well as the
preparatory steps to enable a consistent value chain as a prerequisite to deliver benefits
to consumers. Moreover, Croatia, Slovenia are very active on smart grids even though
the local operators are facing similarly a lagging legal framework.
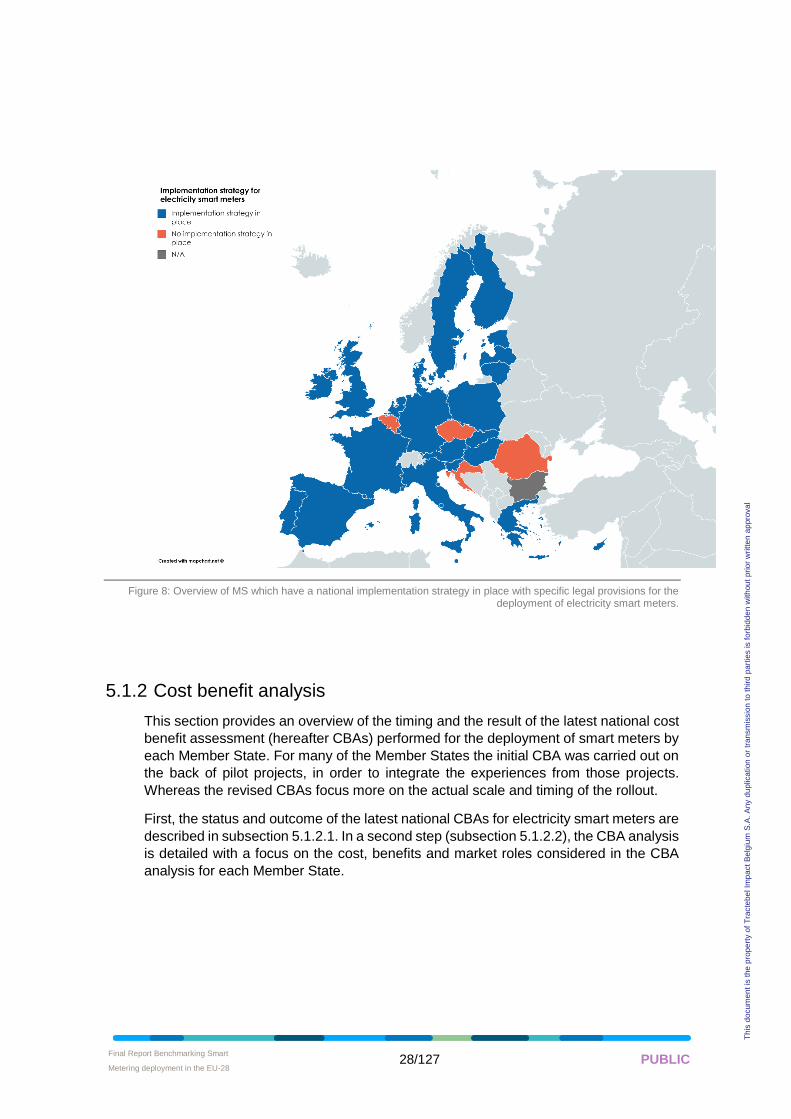
Final Report Benchmarking Smart
Metering deployment in the EU-28 • 28/127 PUBLIC
Th
is d
ocum
en
t is
the
pro
pe
rty o
f T
racte
be
l Im
pa
ct
Be
lgiu
m S
.A.
An
y d
up
lica
tion
or
tra
nsm
issio
n t
o t
hird
pa
rtie
s is f
orb
idd
en
with
ou
t p
rio
r w
ritte
n a
ppro
va
l
Figure 8: Overview of MS which have a national implementation strategy in place with specific legal provisions for the deployment of electricity smart meters.
5.1.2 Cost benefit analysis
This section provides an overview of the timing and the result of the latest national cost
benefit assessment (hereafter CBAs) performed for the deployment of smart meters by
each Member State. For many of the Member States the initial CBA was carried out on
the back of pilot projects, in order to integrate the experiences from those projects.
Whereas the revised CBAs focus more on the actual scale and timing of the rollout.
First, the status and outcome of the latest national CBAs for electricity smart meters are
described in subsection 5.1.2.1. In a second step (subsection 5.1.2.2), the CBA analysis
is detailed with a focus on the cost, benefits and market roles considered in the CBA
analysis for each Member State.
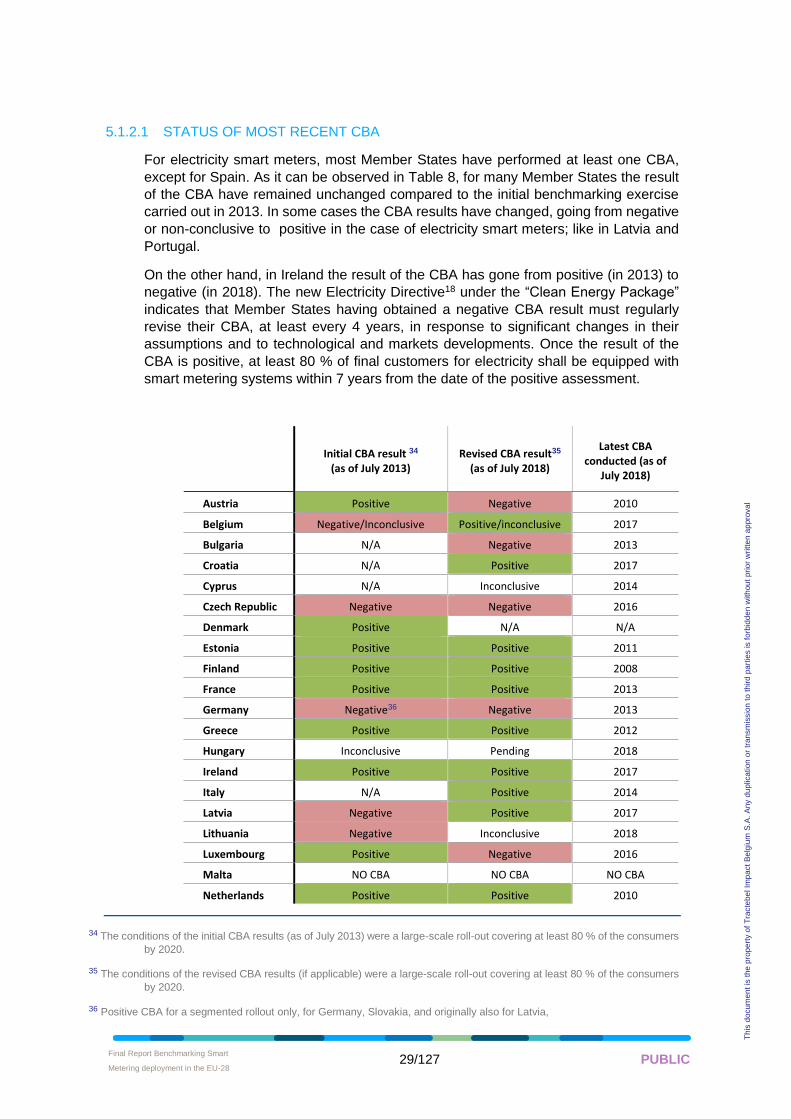
Final Report Benchmarking Smart
Metering deployment in the EU-28 • 29/127 PUBLIC
Th
is d
ocum
en
t is
the
pro
pe
rty o
f T
racte
be
l Im
pa
ct
Be
lgiu
m S
.A.
An
y d
up
lica
tion
or
tra
nsm
issio
n t
o t
hird
pa
rtie
s is f
orb
idd
en
with
ou
t p
rio
r w
ritte
n a
ppro
va
l
5.1.2.1 STATUS OF MOST RECENT CBA
For electricity smart meters, most Member States have performed at least one CBA,
except for Spain. As it can be observed in Table 8, for many Member States the result
of the CBA have remained unchanged compared to the initial benchmarking exercise
carried out in 2013. In some cases the CBA results have changed, going from negative
or non-conclusive to positive in the case of electricity smart meters; like in Latvia and
Portugal.
On the other hand, in Ireland the result of the CBA has gone from positive (in 2013) to
negative (in 2018). The new Electricity Directive18 under the “Clean Energy Package”
indicates that Member States having obtained a negative CBA result must regularly
revise their CBA, at least every 4 years, in response to significant changes in their
assumptions and to technological and markets developments. Once the result of the
CBA is positive, at least 80 % of final customers for electricity shall be equipped with
smart metering systems within 7 years from the date of the positive assessment.
Initial CBA result 34 (as of July 2013)
Revised CBA result35 (as of July 2018)
Latest CBA conducted (as of
July 2018)
Austria Positive Negative 2010
Belgium Negative/Inconclusive Positive/inconclusive 2017
Bulgaria N/A Negative 2013
Croatia N/A Positive 2017
Cyprus N/A Inconclusive 2014
Czech Republic Negative Negative 2016
Denmark Positive N/A N/A
Estonia Positive Positive 2011
Finland Positive Positive 2008
France Positive Positive 2013
Germany Negative36 Negative 2013
Greece Positive Positive 2012
Hungary Inconclusive Pending 2018
Ireland Positive Positive 2017
Italy N/A Positive 2014
Latvia Negative Positive 2017
Lithuania Negative Inconclusive 2018
Luxembourg Positive Negative 2016
Malta NO CBA NO CBA NO CBA
Netherlands Positive Positive 2010
34 The conditions of the initial CBA results (as of July 2013) were a large-scale roll-out covering at least 80 % of the consumers
by 2020.
35 The conditions of the revised CBA results (if applicable) were a large-scale roll-out covering at least 80 % of the consumers
by 2020.
36 Positive CBA for a segmented rollout only, for Germany, Slovakia, and originally also for Latvia,
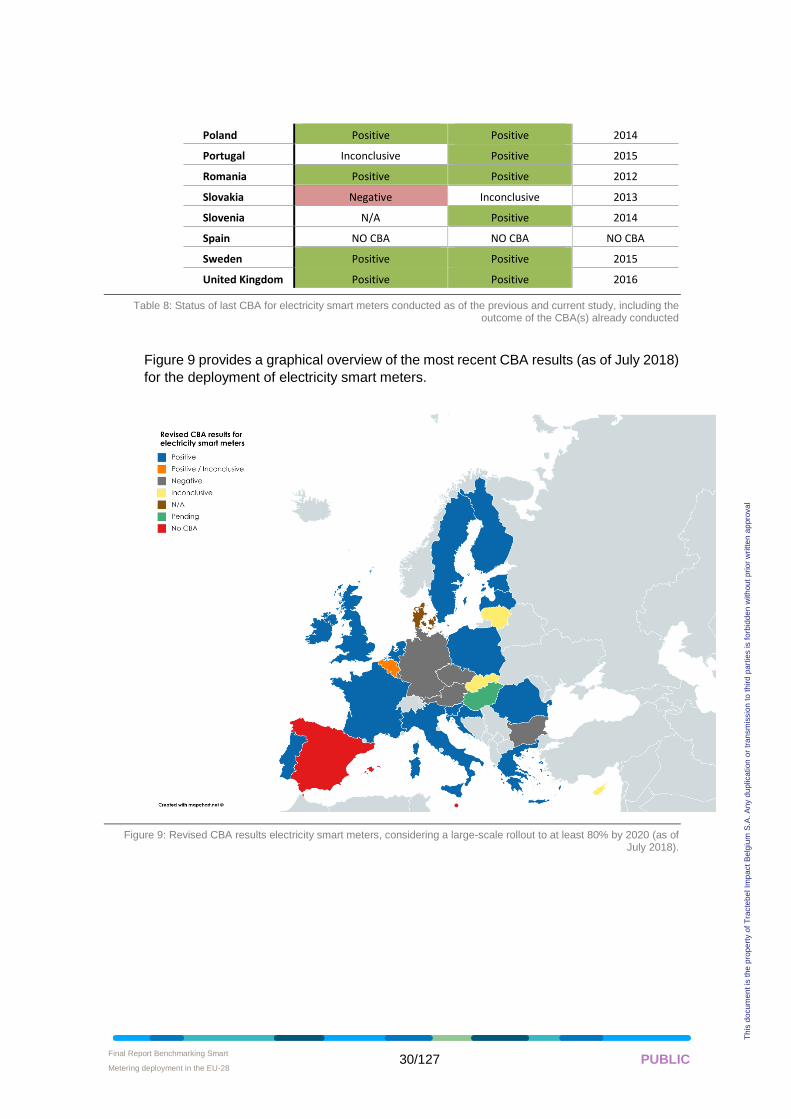
Final Report Benchmarking Smart
Metering deployment in the EU-28 • 30/127 PUBLIC
Th
is d
ocum
en
t is
the
pro
pe
rty o
f T
racte
be
l Im
pa
ct
Be
lgiu
m S
.A.
An
y d
up
lica
tion
or
tra
nsm
issio
n t
o t
hird
pa
rtie
s is f
orb
idd
en
with
ou
t p
rio
r w
ritte
n a
ppro
va
l
Poland Positive Positive 2014
Portugal Inconclusive Positive 2015
Romania Positive Positive 2012
Slovakia Negative Inconclusive 2013
Slovenia N/A Positive 2014
Spain NO CBA NO CBA NO CBA
Sweden Positive Positive 2015
United Kingdom Positive Positive 2016
Table 8: Status of last CBA for electricity smart meters conducted as of the previous and current study, including the outcome of the CBA(s) already conducted
Figure 9 provides a graphical overview of the most recent CBA results (as of July 2018)
for the deployment of electricity smart meters.
Figure 9: Revised CBA results electricity smart meters, considering a large-scale rollout to at least 80% by 2020 (as of July 2018).
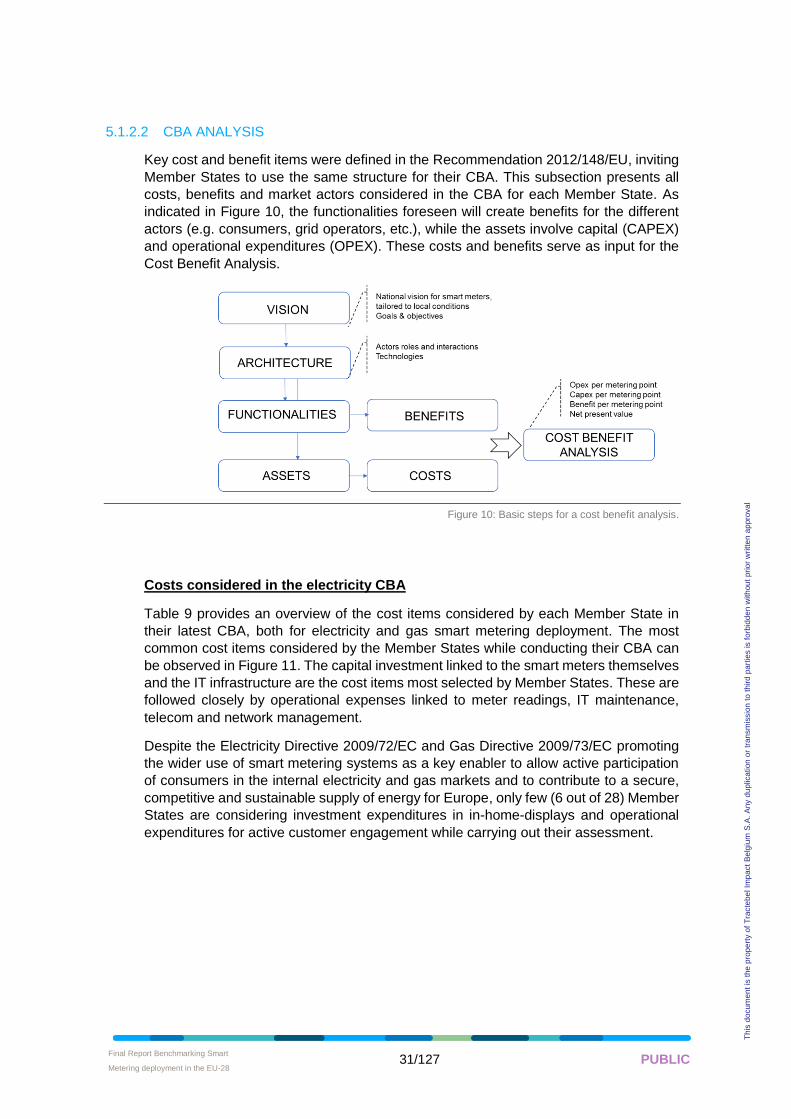
Final Report Benchmarking Smart
Metering deployment in the EU-28 • 31/127 PUBLIC
Th
is d
ocum
en
t is
the
pro
pe
rty o
f T
racte
be
l Im
pa
ct
Be
lgiu
m S
.A.
An
y d
up
lica
tion
or
tra
nsm
issio
n t
o t
hird
pa
rtie
s is f
orb
idd
en
with
ou
t p
rio
r w
ritte
n a
ppro
va
l
5.1.2.2 CBA ANALYSIS
Key cost and benefit items were defined in the Recommendation 2012/148/EU, inviting
Member States to use the same structure for their CBA. This subsection presents all
costs, benefits and market actors considered in the CBA for each Member State. As
indicated in Figure 10, the functionalities foreseen will create benefits for the different
actors (e.g. consumers, grid operators, etc.), while the assets involve capital (CAPEX)
and operational expenditures (OPEX). These costs and benefits serve as input for the
Cost Benefit Analysis.
Figure 10: Basic steps for a cost benefit analysis.
Costs considered in the electricity CBA
Table 9 provides an overview of the cost items considered by each Member State in
their latest CBA, both for electricity and gas smart metering deployment. The most
common cost items considered by the Member States while conducting their CBA can
be observed in Figure 11. The capital investment linked to the smart meters themselves
and the IT infrastructure are the cost items most selected by Member States. These are
followed closely by operational expenses linked to meter readings, IT maintenance,
telecom and network management.
Despite the Electricity Directive 2009/72/EC and Gas Directive 2009/73/EC promoting
the wider use of smart metering systems as a key enabler to allow active participation
of consumers in the internal electricity and gas markets and to contribute to a secure,
competitive and sustainable supply of energy for Europe, only few (6 out of 28) Member
States are considering investment expenditures in in-home-displays and operational
expenditures for active customer engagement while carrying out their assessment.
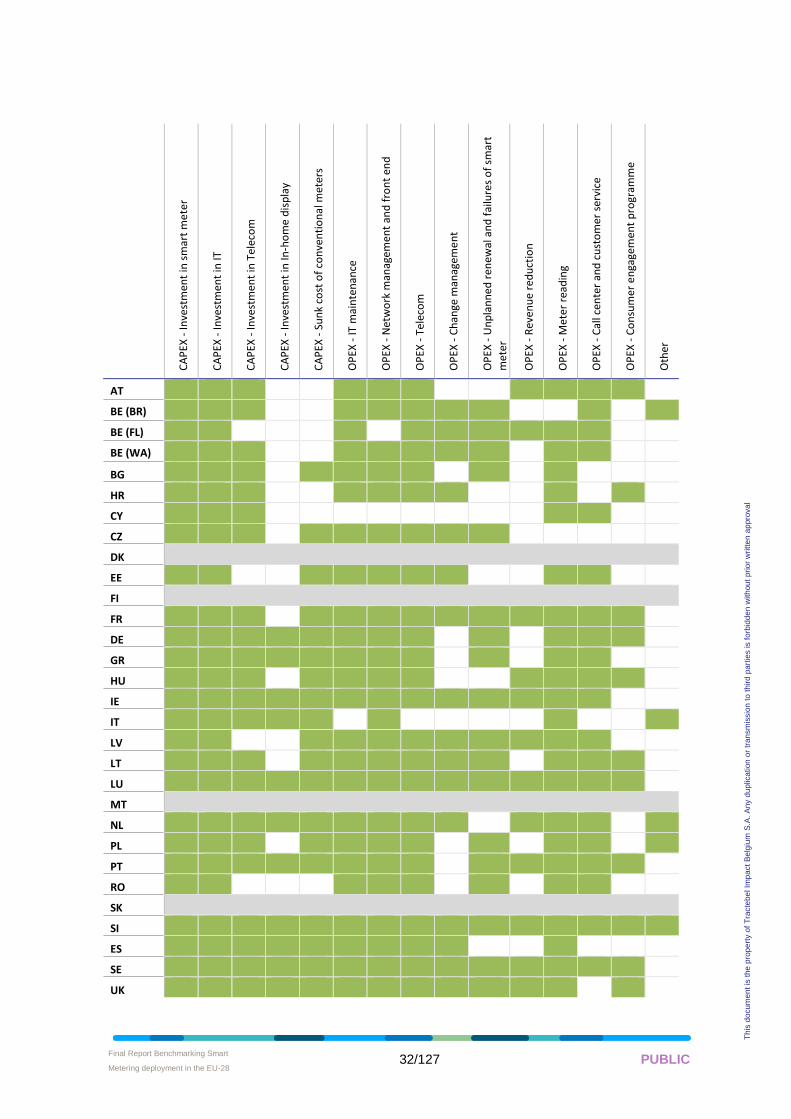
Final Report Benchmarking Smart
Metering deployment in the EU-28 • 32/127 PUBLIC
Th
is d
ocum
en
t is
the
pro
pe
rty o
f T
racte
be
l Im
pa
ct
Be
lgiu
m S
.A.
An
y d
up
lica
tion
or
tra
nsm
issio
n t
o t
hird
pa
rtie
s is f
orb
idd
en
with
ou
t p
rio
r w
ritte
n a
ppro
va
l
CA
PEX
- In
vest
men
t in
sm
art
me
ter
CA
PEX
- In
vest
men
t in
IT
CA
PEX
- In
vest
men
t in
Tel
eco
m
CA
PEX
- In
vest
men
t in
In-h
om
e d
isp
lay
CA
PEX
- S
un
k co
st o
f co
nve
nti
on
al m
eter
s
OP
EX -
IT m
ain
ten
ance
OP
EX -
Net
wo
rk m
anag
emen
t an
d f
ron
t en
d
OP
EX -
Tel
eco
m
OP
EX -
Ch
ange
man
agem
en
t
OP
EX -
Un
pla
nn
ed r
enew
al a
nd
fai
lure
s o
f sm
art
met
er
OP
EX -
Rev
enu
e re
du
ctio
n
OP
EX -
Met
er r
ead
ing
OP
EX -
Cal
l cen
ter
and
cu
sto
mer
ser
vice
OP
EX -
Co
nsu
mer
en
gage
men
t p
rogr
amm
e
Oth
er
AT
BE (BR)
BE (FL)
BE (WA)
BG
HR
CY
CZ
DK
EE 0 0
FI
FR
DE
GR
HU
IE
IT
LV
LT
LU
MT
NL
PL
PT
RO
SK
SI
ES
SE
UK
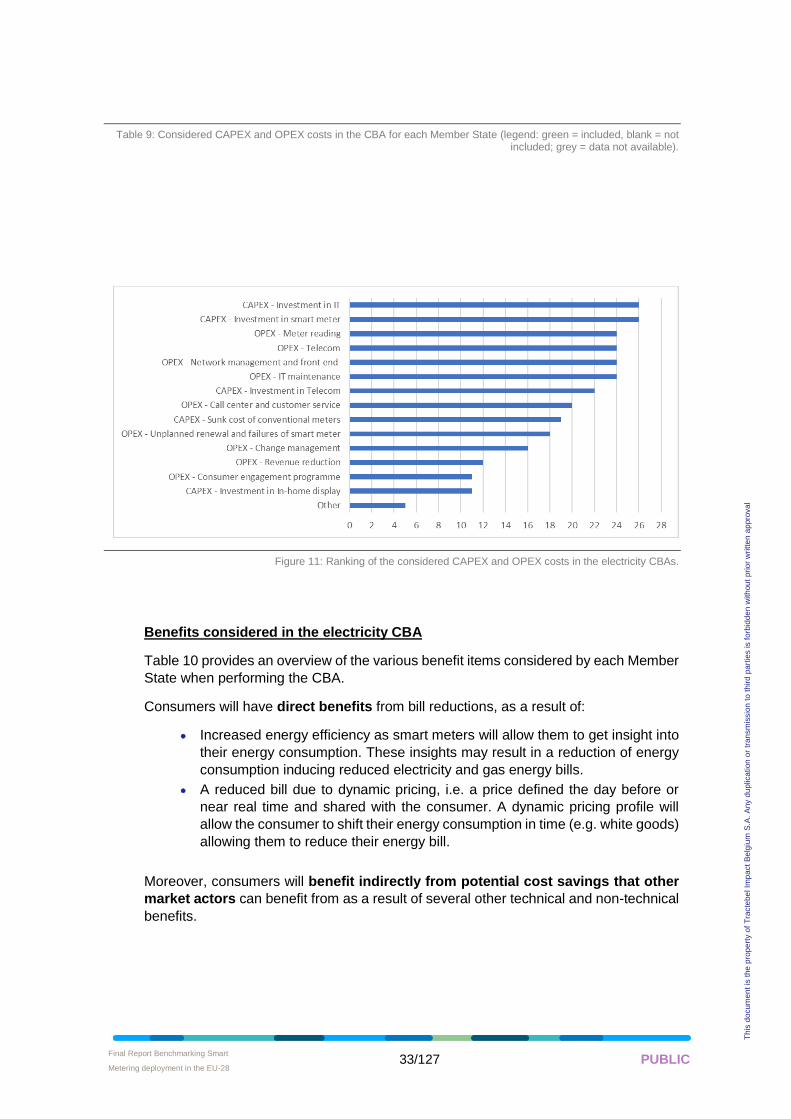
Final Report Benchmarking Smart
Metering deployment in the EU-28 • 33/127 PUBLIC
Th
is d
ocum
en
t is
the
pro
pe
rty o
f T
racte
be
l Im
pa
ct
Be
lgiu
m S
.A.
An
y d
up
lica
tion
or
tra
nsm
issio
n t
o t
hird
pa
rtie
s is f
orb
idd
en
with
ou
t p
rio
r w
ritte
n a
ppro
va
l
Table 9: Considered CAPEX and OPEX costs in the CBA for each Member State (legend: green = included, blank = not included; grey = data not available).
Figure 11: Ranking of the considered CAPEX and OPEX costs in the electricity CBAs.
Benefits considered in the electricity CBA
Table 10 provides an overview of the various benefit items considered by each Member
State when performing the CBA.
Consumers will have direct benefits from bill reductions, as a result of:
• Increased energy efficiency as smart meters will allow them to get insight into
their energy consumption. These insights may result in a reduction of energy
consumption inducing reduced electricity and gas energy bills.
• A reduced bill due to dynamic pricing, i.e. a price defined the day before or
near real time and shared with the consumer. A dynamic pricing profile will
allow the consumer to shift their energy consumption in time (e.g. white goods)
allowing them to reduce their energy bill.
Moreover, consumers will benefit indirectly from potential cost savings that other
market actors can benefit from as a result of several other technical and non-technical
benefits.
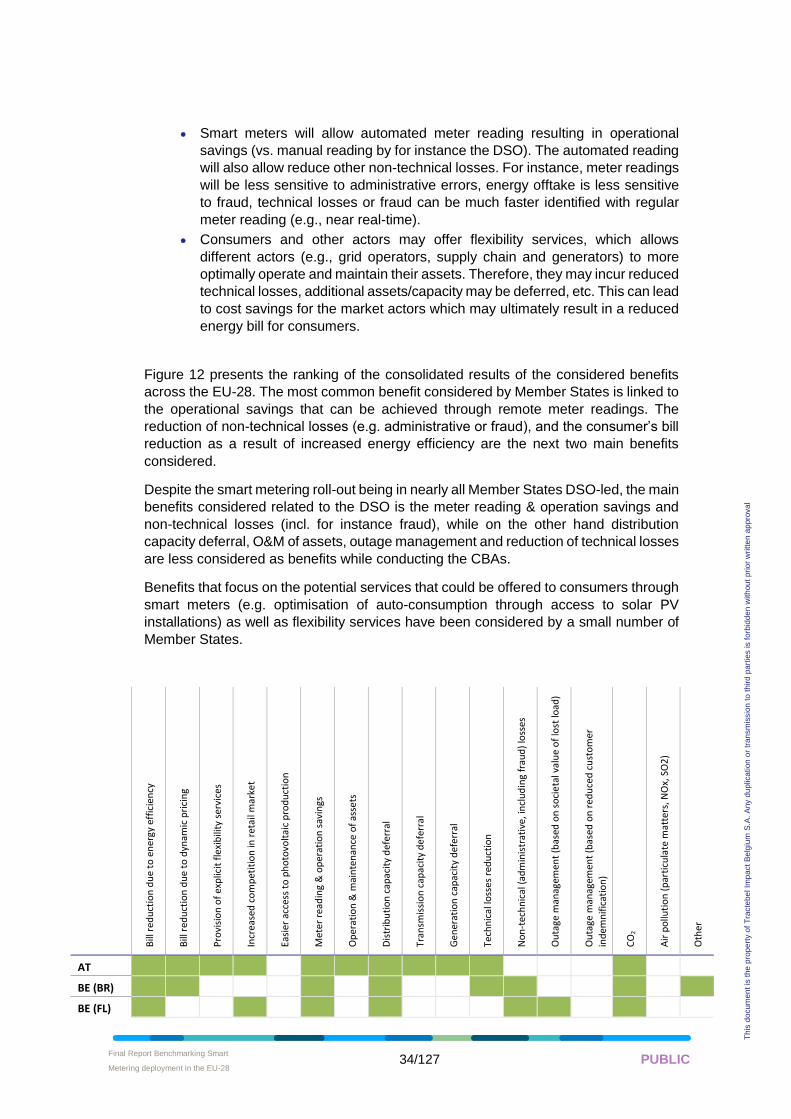
Final Report Benchmarking Smart
Metering deployment in the EU-28 • 34/127 PUBLIC
Th
is d
ocum
en
t is
the
pro
pe
rty o
f T
racte
be
l Im
pa
ct
Be
lgiu
m S
.A.
An
y d
up
lica
tion
or
tra
nsm
issio
n t
o t
hird
pa
rtie
s is f
orb
idd
en
with
ou
t p
rio
r w
ritte
n a
ppro
va
l
• Smart meters will allow automated meter reading resulting in operational
savings (vs. manual reading by for instance the DSO). The automated reading
will also allow reduce other non-technical losses. For instance, meter readings
will be less sensitive to administrative errors, energy offtake is less sensitive
to fraud, technical losses or fraud can be much faster identified with regular
meter reading (e.g., near real-time).
• Consumers and other actors may offer flexibility services, which allows
different actors (e.g., grid operators, supply chain and generators) to more
optimally operate and maintain their assets. Therefore, they may incur reduced
technical losses, additional assets/capacity may be deferred, etc. This can lead
to cost savings for the market actors which may ultimately result in a reduced
energy bill for consumers.
Figure 12 presents the ranking of the consolidated results of the considered benefits
across the EU-28. The most common benefit considered by Member States is linked to
the operational savings that can be achieved through remote meter readings. The
reduction of non-technical losses (e.g. administrative or fraud), and the consumer’s bill
reduction as a result of increased energy efficiency are the next two main benefits
considered.
Despite the smart metering roll-out being in nearly all Member States DSO-led, the main
benefits considered related to the DSO is the meter reading & operation savings and
non-technical losses (incl. for instance fraud), while on the other hand distribution
capacity deferral, O&M of assets, outage management and reduction of technical losses
are less considered as benefits while conducting the CBAs.
Benefits that focus on the potential services that could be offered to consumers through
smart meters (e.g. optimisation of auto-consumption through access to solar PV
installations) as well as flexibility services have been considered by a small number of
Member States.
Bill
red
uct
ion
du
e to
en
ergy
eff
icie
ncy
Bill
red
uct
ion
du
e to
dyn
amic
pri
cin
g
Pro
visi
on
of
exp
licit
fle
xib
ility
ser
vice
s
Incr
ease
d c
om
pet
itio
n in
ret
ail m
arke
t
Easi
er a
cces
s to
ph
oto
volt
aic
pro
du
ctio
n
Met
er r
ead
ing
& o
per
atio
n s
avin
gs
Op
erat
ion
& m
ain
ten
ance
of
asse
ts
Dis
trib
uti
on
cap
acit
y d
efer
ral
Tran
smis
sio
n c
apac
ity
de
ferr
al
Gen
erat
ion
cap
acit
y d
efe
rral
Tech
nic
al lo
sses
red
uct
ion
No
n-t
ech
nic
al (
adm
inis
trat
ive,
incl
ud
ing
frau
d)
loss
es
Ou
tage
man
agem
ent
(bas
ed o
n s
oci
eta
l val
ue
of
lost
load
)
Ou
tage
man
agem
ent
(bas
ed o
n r
edu
ced
cu
sto
mer
ind
emn
ific
atio
n)
CO
2
Air
po
lluti
on
(p
arti
cula
te m
atte
rs, N
Ox,
SO
2)
Oth
er
AT
BE (BR)
BE (FL)
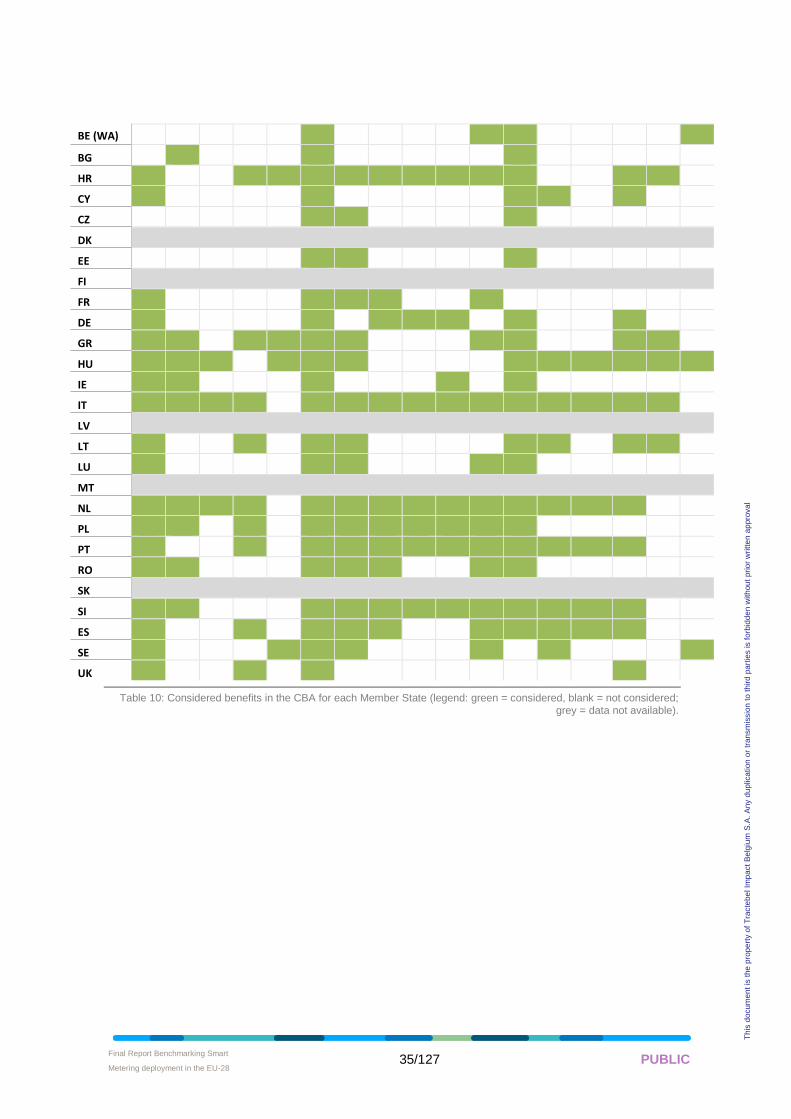
Final Report Benchmarking Smart
Metering deployment in the EU-28 • 35/127 PUBLIC
Th
is d
ocum
en
t is
the
pro
pe
rty o
f T
racte
be
l Im
pa
ct
Be
lgiu
m S
.A.
An
y d
up
lica
tion
or
tra
nsm
issio
n t
o t
hird
pa
rtie
s is f
orb
idd
en
with
ou
t p
rio
r w
ritte
n a
ppro
va
l
BE (WA)
BG
HR
CY
CZ
DK
EE
FI
FR
DE
GR
HU
IE
IT
LV
LT
LU
MT
NL
PL
PT
RO
SK
SI
ES
SE
UK
Table 10: Considered benefits in the CBA for each Member State (legend: green = considered, blank = not considered; grey = data not available).
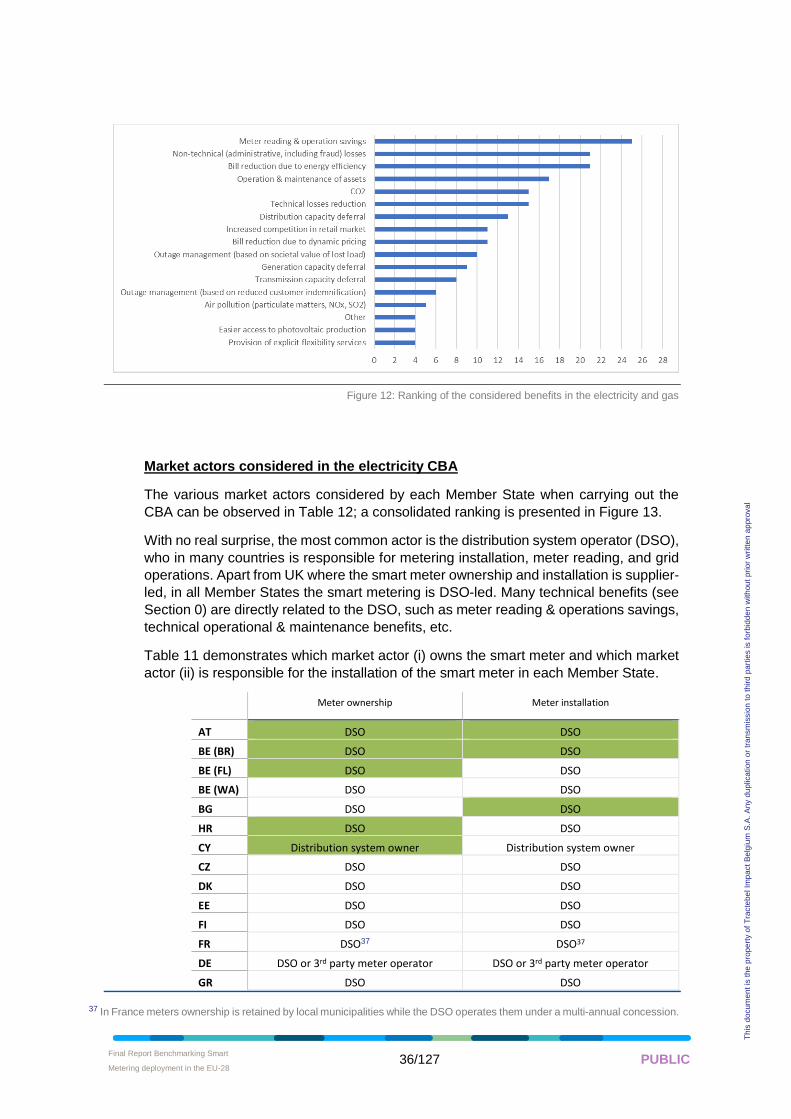
Final Report Benchmarking Smart
Metering deployment in the EU-28 • 36/127 PUBLIC
Th
is d
ocum
en
t is
the
pro
pe
rty o
f T
racte
be
l Im
pa
ct
Be
lgiu
m S
.A.
An
y d
up
lica
tion
or
tra
nsm
issio
n t
o t
hird
pa
rtie
s is f
orb
idd
en
with
ou
t p
rio
r w
ritte
n a
ppro
va
l
Figure 12: Ranking of the considered benefits in the electricity and gas
Market actors considered in the electricity CBA
The various market actors considered by each Member State when carrying out the
CBA can be observed in Table 12; a consolidated ranking is presented in Figure 13.
With no real surprise, the most common actor is the distribution system operator (DSO),
who in many countries is responsible for metering installation, meter reading, and grid
operations. Apart from UK where the smart meter ownership and installation is supplier-
led, in all Member States the smart metering is DSO-led. Many technical benefits (see
Section 0) are directly related to the DSO, such as meter reading & operations savings,
technical operational & maintenance benefits, etc.
Table 11 demonstrates which market actor (i) owns the smart meter and which market
actor (ii) is responsible for the installation of the smart meter in each Member State.
Meter ownership Meter installation
AT DSO DSO
BE (BR) DSO DSO
BE (FL) DSO DSO
BE (WA) DSO DSO
BG DSO DSO
HR DSO DSO
CY Distribution system owner Distribution system owner
CZ DSO DSO
DK DSO DSO
EE DSO DSO
FI DSO DSO
FR DSO37 DSO37
DE DSO or 3rd party meter operator DSO or 3rd party meter operator
GR DSO DSO
37 In France meters ownership is retained by local municipalities while the DSO operates them under a multi-annual concession.
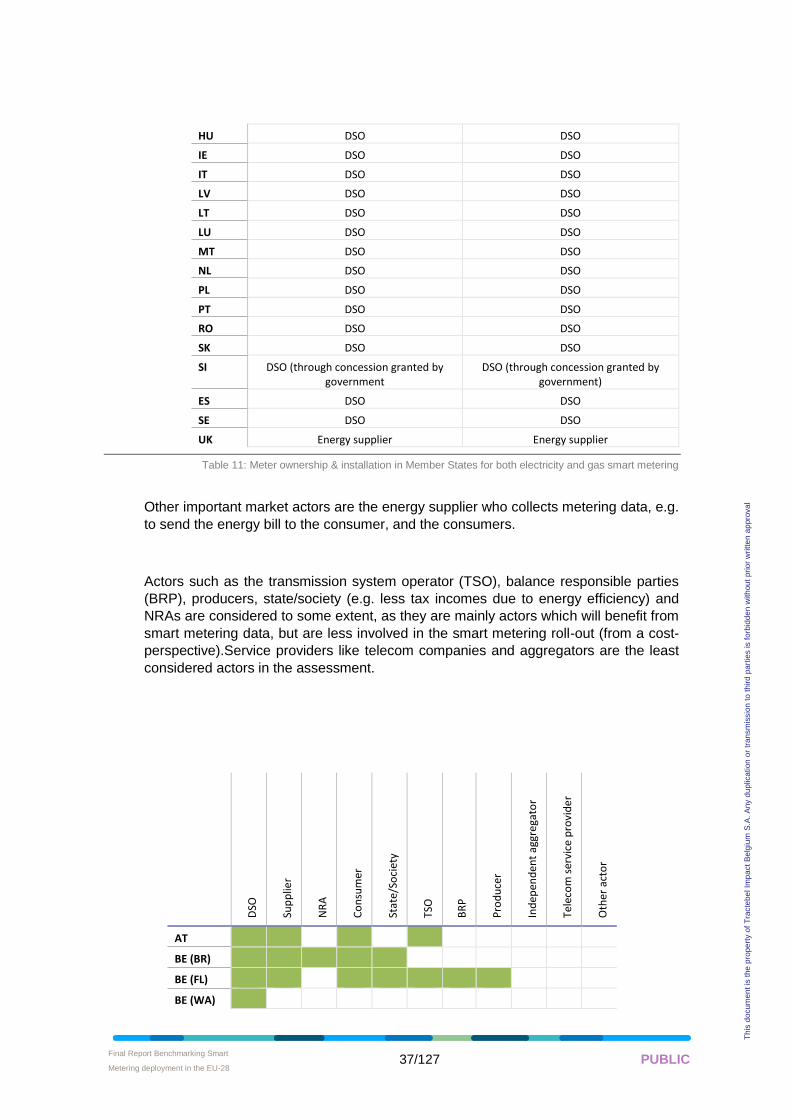
Final Report Benchmarking Smart
Metering deployment in the EU-28 • 37/127 PUBLIC
Th
is d
ocum
en
t is
the
pro
pe
rty o
f T
racte
be
l Im
pa
ct
Be
lgiu
m S
.A.
An
y d
up
lica
tion
or
tra
nsm
issio
n t
o t
hird
pa
rtie
s is f
orb
idd
en
with
ou
t p
rio
r w
ritte
n a
ppro
va
l
HU DSO DSO
IE DSO DSO
IT DSO DSO
LV DSO DSO
LT DSO DSO
LU DSO DSO
MT DSO DSO
NL DSO DSO
PL DSO DSO
PT DSO DSO
RO DSO DSO
SK DSO DSO
SI
DSO (through concession granted by government
DSO (through concession granted by government)
ES DSO DSO
SE DSO DSO
UK Energy supplier Energy supplier
Table 11: Meter ownership & installation in Member States for both electricity and gas smart metering
Other important market actors are the energy supplier who collects metering data, e.g.
to send the energy bill to the consumer, and the consumers.
Actors such as the transmission system operator (TSO), balance responsible parties
(BRP), producers, state/society (e.g. less tax incomes due to energy efficiency) and
NRAs are considered to some extent, as they are mainly actors which will benefit from
smart metering data, but are less involved in the smart metering roll-out (from a cost-
perspective).Service providers like telecom companies and aggregators are the least
considered actors in the assessment.
DSO
Sup
plie
r
NR
A
Co
nsu
mer
Stat
e/So
ciet
y
TSO
BR
P
Pro
du
cer
Ind
epen
den
t ag
gre
gato
r
Tele
com
ser
vice
pro
vid
er
Oth
er a
cto
r
AT
BE (BR)
BE (FL)
BE (WA)
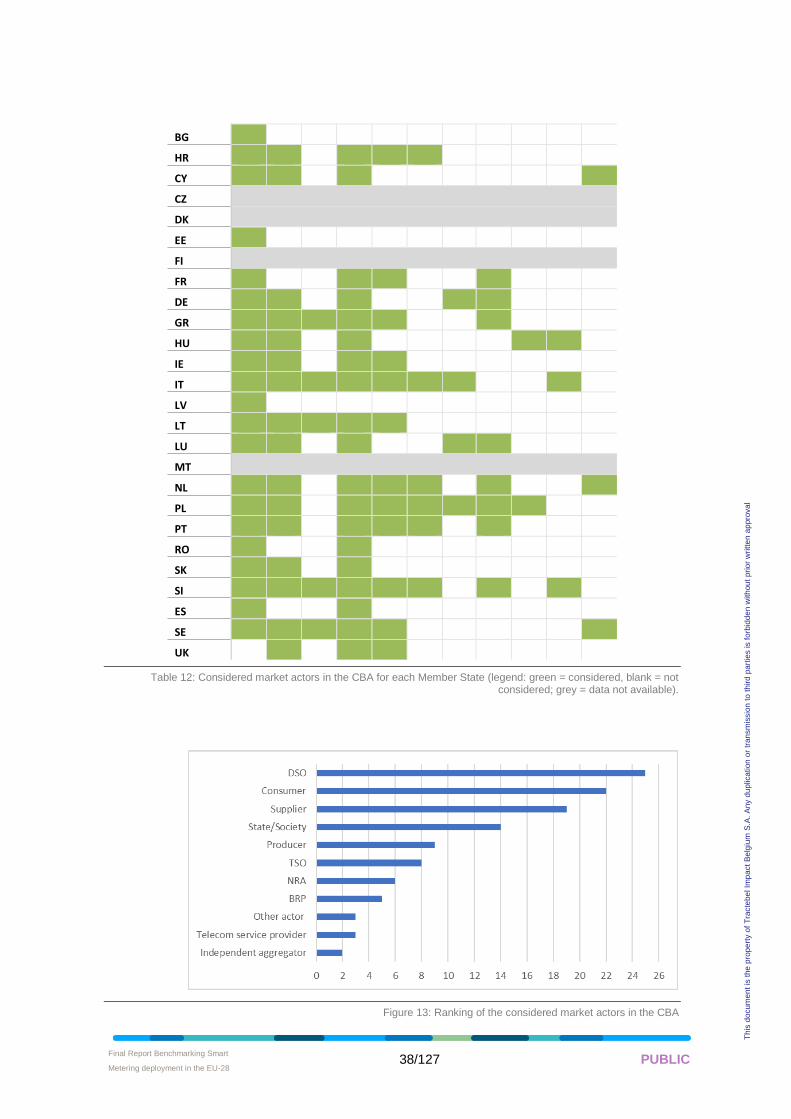
Final Report Benchmarking Smart
Metering deployment in the EU-28 • 38/127 PUBLIC
Th
is d
ocum
en
t is
the
pro
pe
rty o
f T
racte
be
l Im
pa
ct
Be
lgiu
m S
.A.
An
y d
up
lica
tion
or
tra
nsm
issio
n t
o t
hird
pa
rtie
s is f
orb
idd
en
with
ou
t p
rio
r w
ritte
n a
ppro
va
l
BG
HR
CY
CZ
DK
EE
FI
FR
DE
GR
HU
IE
IT
LV
LT
LU
MT
NL
PL
PT
RO
SK
SI
ES
SE
UK
Table 12: Considered market actors in the CBA for each Member State (legend: green = considered, blank = not considered; grey = data not available).
Figure 13: Ranking of the considered market actors in the CBA
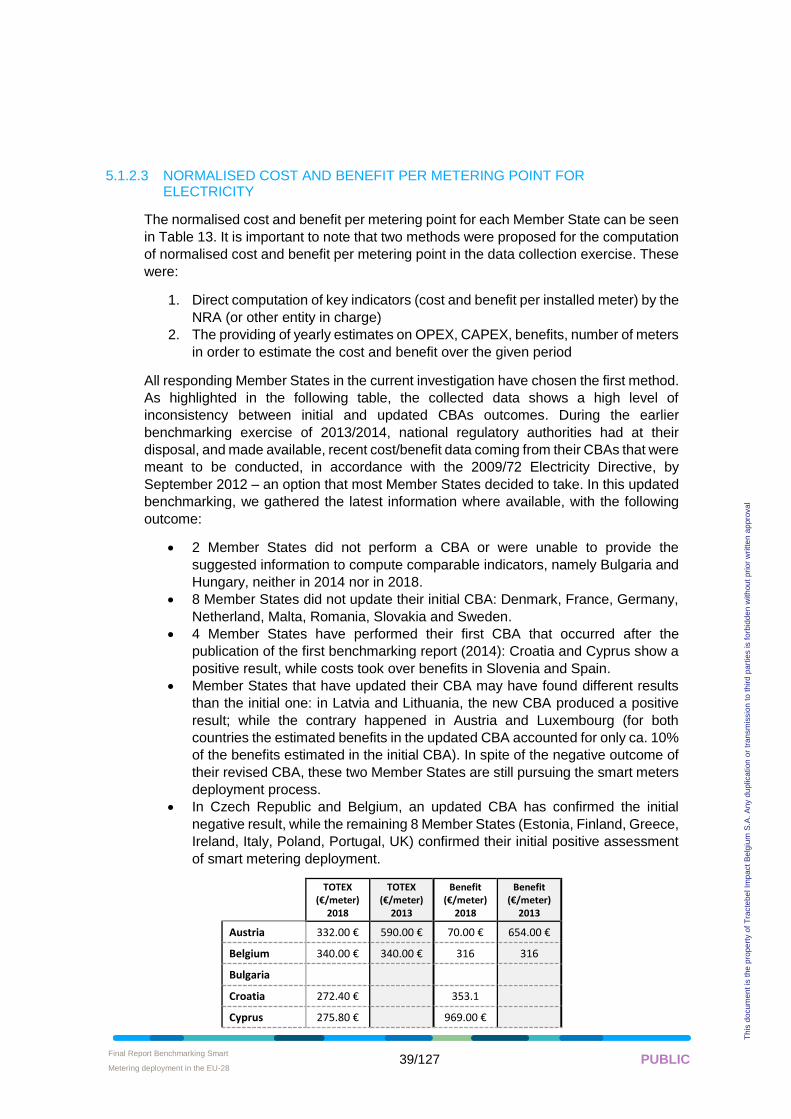
Final Report Benchmarking Smart
Metering deployment in the EU-28 • 39/127 PUBLIC
Th
is d
ocum
en
t is
the
pro
pe
rty o
f T
racte
be
l Im
pa
ct
Be
lgiu
m S
.A.
An
y d
up
lica
tion
or
tra
nsm
issio
n t
o t
hird
pa
rtie
s is f
orb
idd
en
with
ou
t p
rio
r w
ritte
n a
ppro
va
l
5.1.2.3 NORMALISED COST AND BENEFIT PER METERING POINT FOR ELECTRICITY
The normalised cost and benefit per metering point for each Member State can be seen
in Table 13. It is important to note that two methods were proposed for the computation
of normalised cost and benefit per metering point in the data collection exercise. These
were:
1. Direct computation of key indicators (cost and benefit per installed meter) by the
NRA (or other entity in charge)
2. The providing of yearly estimates on OPEX, CAPEX, benefits, number of meters
in order to estimate the cost and benefit over the given period
All responding Member States in the current investigation have chosen the first method.
As highlighted in the following table, the collected data shows a high level of
inconsistency between initial and updated CBAs outcomes. During the earlier
benchmarking exercise of 2013/2014, national regulatory authorities had at their
disposal, and made available, recent cost/benefit data coming from their CBAs that were
meant to be conducted, in accordance with the 2009/72 Electricity Directive, by
September 2012 – an option that most Member States decided to take. In this updated
benchmarking, we gathered the latest information where available, with the following
outcome:
• 2 Member States did not perform a CBA or were unable to provide the
suggested information to compute comparable indicators, namely Bulgaria and
Hungary, neither in 2014 nor in 2018.
• 8 Member States did not update their initial CBA: Denmark, France, Germany,
Netherland, Malta, Romania, Slovakia and Sweden.
• 4 Member States have performed their first CBA that occurred after the
publication of the first benchmarking report (2014): Croatia and Cyprus show a
positive result, while costs took over benefits in Slovenia and Spain.
• Member States that have updated their CBA may have found different results
than the initial one: in Latvia and Lithuania, the new CBA produced a positive
result; while the contrary happened in Austria and Luxembourg (for both
countries the estimated benefits in the updated CBA accounted for only ca. 10%
of the benefits estimated in the initial CBA). In spite of the negative outcome of
their revised CBA, these two Member States are still pursuing the smart meters
deployment process.
• In Czech Republic and Belgium, an updated CBA has confirmed the initial
negative result, while the remaining 8 Member States (Estonia, Finland, Greece,
Ireland, Italy, Poland, Portugal, UK) confirmed their initial positive assessment
of smart metering deployment.
TOTEX (€/meter)
2018
TOTEX (€/meter)
2013
Benefit (€/meter)
2018
Benefit (€/meter)
2013
Austria 332.00 € 590.00 € 70.00 € 654.00 €
Belgium 340.00 € 340.00 € 316 316
Bulgaria
Croatia 272.40 € 353.1
Cyprus 275.80 € 969.00 €
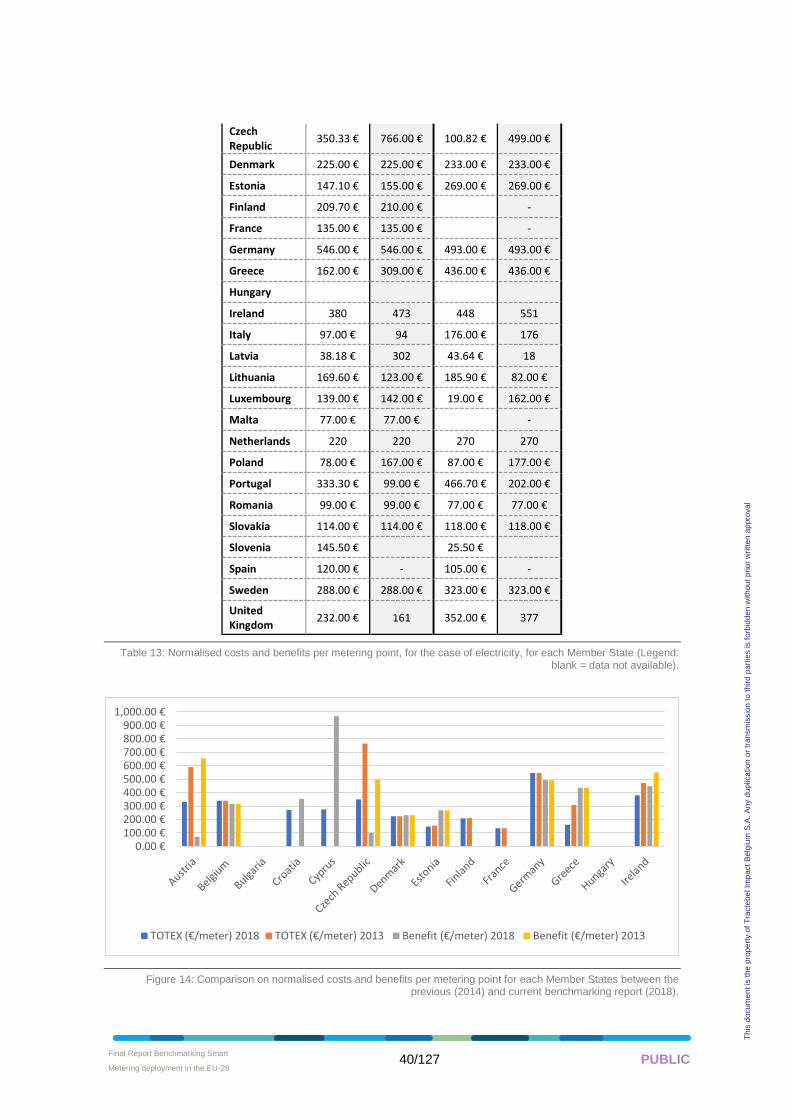
Final Report Benchmarking Smart
Metering deployment in the EU-28 • 40/127 PUBLIC
Th
is d
ocum
en
t is
the
pro
pe
rty o
f T
racte
be
l Im
pa
ct
Be
lgiu
m S
.A.
An
y d
up
lica
tion
or
tra
nsm
issio
n t
o t
hird
pa
rtie
s is f
orb
idd
en
with
ou
t p
rio
r w
ritte
n a
ppro
va
l
Czech Republic
350.33 € 766.00 € 100.82 € 499.00 €
Denmark 225.00 € 225.00 € 233.00 € 233.00 €
Estonia 147.10 € 155.00 € 269.00 € 269.00 €
Finland 209.70 € 210.00 € -
France 135.00 € 135.00 € -
Germany 546.00 € 546.00 € 493.00 € 493.00 €
Greece 162.00 € 309.00 € 436.00 € 436.00 €
Hungary
Ireland 380 473 448 551
Italy 97.00 € 94 176.00 € 176
Latvia 38.18 € 302 43.64 € 18
Lithuania 169.60 € 123.00 € 185.90 € 82.00 €
Luxembourg 139.00 € 142.00 € 19.00 € 162.00 €
Malta 77.00 € 77.00 € -
Netherlands 220 220 270 270
Poland 78.00 € 167.00 € 87.00 € 177.00 €
Portugal 333.30 € 99.00 € 466.70 € 202.00 €
Romania 99.00 € 99.00 € 77.00 € 77.00 €
Slovakia 114.00 € 114.00 € 118.00 € 118.00 €
Slovenia 145.50 € 25.50 €
Spain 120.00 € - 105.00 € -
Sweden 288.00 € 288.00 € 323.00 € 323.00 €
United Kingdom
232.00 € 161 352.00 € 377
Table 13: Normalised costs and benefits per metering point, for the case of electricity, for each Member State (Legend: blank = data not available).
Figure 14: Comparison on normalised costs and benefits per metering point for each Member States between the previous (2014) and current benchmarking report (2018).
0.00 €100.00 €200.00 €300.00 €400.00 €500.00 €600.00 €700.00 €800.00 €900.00 €
1,000.00 €
TOTEX (€/meter) 2018 TOTEX (€/meter) 2013 Benefit (€/meter) 2018 Benefit (€/meter) 2013
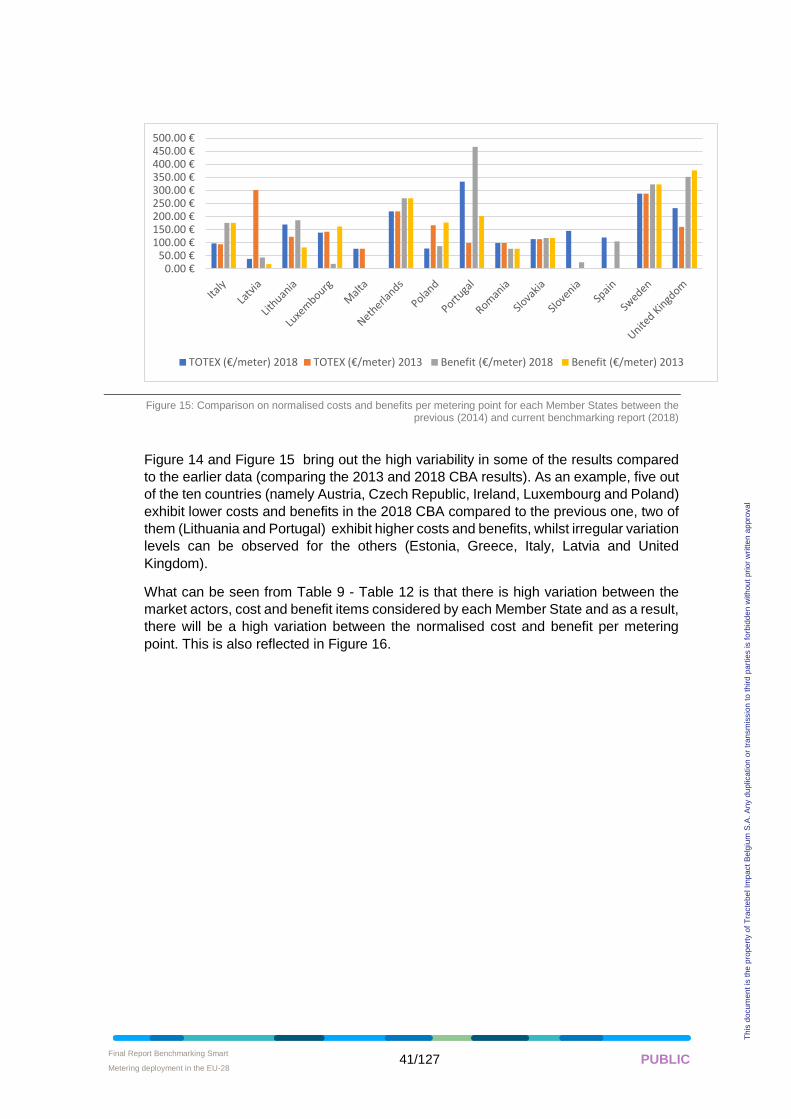
Final Report Benchmarking Smart
Metering deployment in the EU-28 • 41/127 PUBLIC
Th
is d
ocum
en
t is
the
pro
pe
rty o
f T
racte
be
l Im
pa
ct
Be
lgiu
m S
.A.
An
y d
up
lica
tion
or
tra
nsm
issio
n t
o t
hird
pa
rtie
s is f
orb
idd
en
with
ou
t p
rio
r w
ritte
n a
ppro
va
l
Figure 15: Comparison on normalised costs and benefits per metering point for each Member States between the previous (2014) and current benchmarking report (2018)
Figure 14 and Figure 15 bring out the high variability in some of the results compared
to the earlier data (comparing the 2013 and 2018 CBA results). As an example, five out
of the ten countries (namely Austria, Czech Republic, Ireland, Luxembourg and Poland)
exhibit lower costs and benefits in the 2018 CBA compared to the previous one, two of
them (Lithuania and Portugal) exhibit higher costs and benefits, whilst irregular variation
levels can be observed for the others (Estonia, Greece, Italy, Latvia and United
Kingdom).
What can be seen from Table 9 - Table 12 is that there is high variation between the
market actors, cost and benefit items considered by each Member State and as a result,
there will be a high variation between the normalised cost and benefit per metering
point. This is also reflected in Figure 16.
0.00 €50.00 €
100.00 €150.00 €200.00 €250.00 €300.00 €350.00 €400.00 €450.00 €500.00 €
TOTEX (€/meter) 2018 TOTEX (€/meter) 2013 Benefit (€/meter) 2018 Benefit (€/meter) 2013
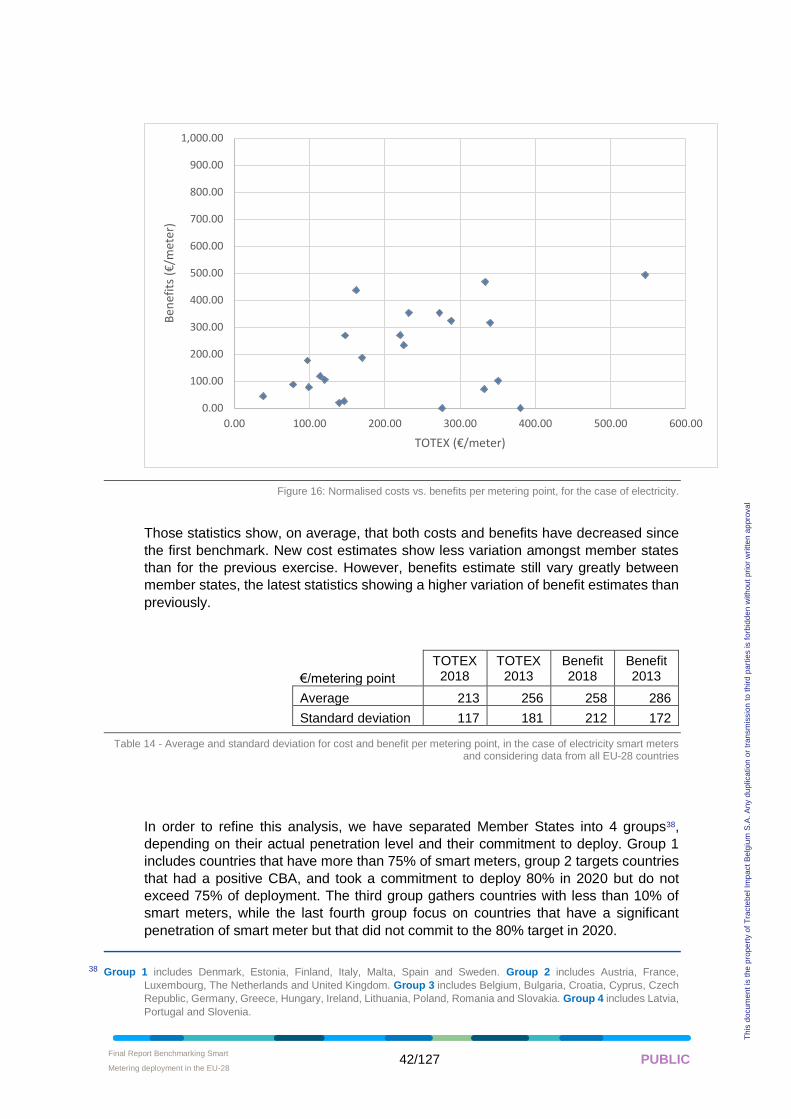
Final Report Benchmarking Smart
Metering deployment in the EU-28 • 42/127 PUBLIC
Th
is d
ocum
en
t is
the
pro
pe
rty o
f T
racte
be
l Im
pa
ct
Be
lgiu
m S
.A.
An
y d
up
lica
tion
or
tra
nsm
issio
n t
o t
hird
pa
rtie
s is f
orb
idd
en
with
ou
t p
rio
r w
ritte
n a
ppro
va
l
Figure 16: Normalised costs vs. benefits per metering point, for the case of electricity.
Those statistics show, on average, that both costs and benefits have decreased since
the first benchmark. New cost estimates show less variation amongst member states
than for the previous exercise. However, benefits estimate still vary greatly between
member states, the latest statistics showing a higher variation of benefit estimates than
previously.
€/metering point
TOTEX 2018
TOTEX 2013
Benefit 2018
Benefit 2013
Average 213 256 258 286
Standard deviation 117 181 212 172
Table 14 - Average and standard deviation for cost and benefit per metering point, in the case of electricity smart meters and considering data from all EU-28 countries
In order to refine this analysis, we have separated Member States into 4 groups38,
depending on their actual penetration level and their commitment to deploy. Group 1
includes countries that have more than 75% of smart meters, group 2 targets countries
that had a positive CBA, and took a commitment to deploy 80% in 2020 but do not
exceed 75% of deployment. The third group gathers countries with less than 10% of
smart meters, while the last fourth group focus on countries that have a significant
penetration of smart meter but that did not commit to the 80% target in 2020.
38 Group 1 includes Denmark, Estonia, Finland, Italy, Malta, Spain and Sweden. Group 2 includes Austria, France,
Luxembourg, The Netherlands and United Kingdom. Group 3 includes Belgium, Bulgaria, Croatia, Cyprus, Czech
Republic, Germany, Greece, Hungary, Ireland, Lithuania, Poland, Romania and Slovakia. Group 4 includes Latvia,
Portugal and Slovenia.
0.00
100.00
200.00
300.00
400.00
500.00
600.00
700.00
800.00
900.00
1,000.00
0.00 100.00 200.00 300.00 400.00 500.00 600.00
Ben
efit
s (€
/met
er)
TOTEX (€/meter)
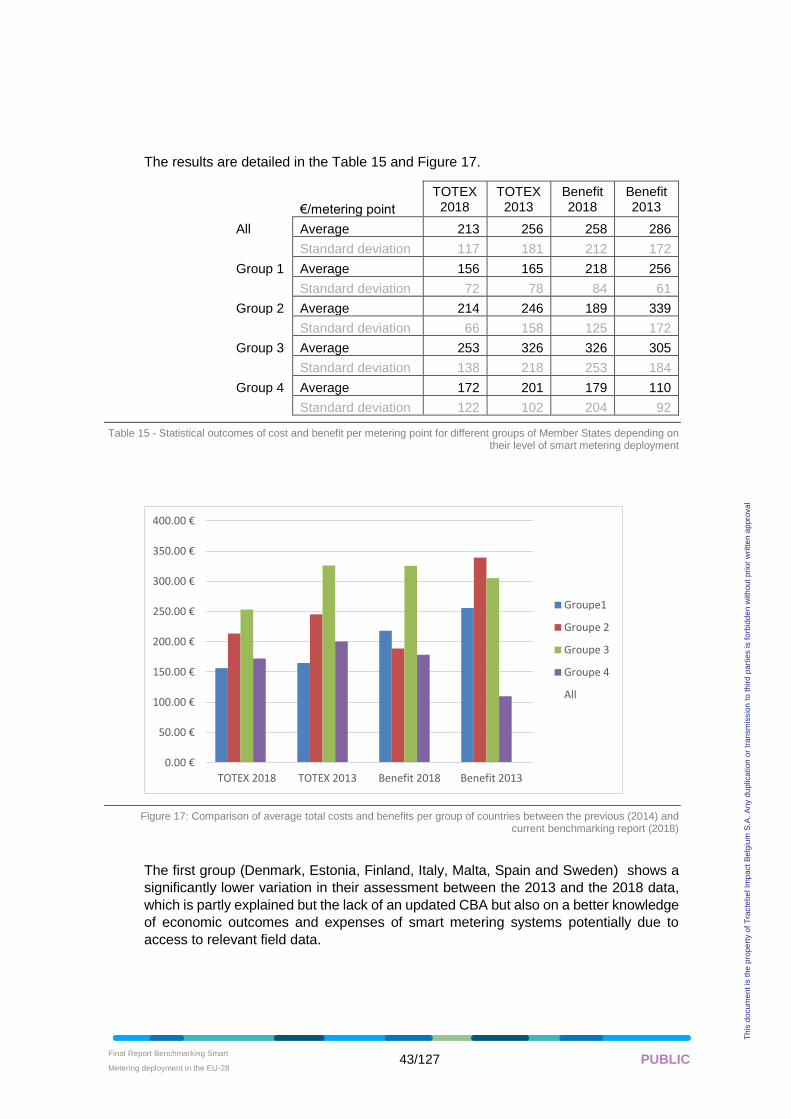
Final Report Benchmarking Smart
Metering deployment in the EU-28 • 43/127 PUBLIC
Th
is d
ocum
en
t is
the
pro
pe
rty o
f T
racte
be
l Im
pa
ct
Be
lgiu
m S
.A.
An
y d
up
lica
tion
or
tra
nsm
issio
n t
o t
hird
pa
rtie
s is f
orb
idd
en
with
ou
t p
rio
r w
ritte
n a
ppro
va
l
The results are detailed in the Table 15 and Figure 17.
€/metering point
TOTEX 2018
TOTEX 2013
Benefit 2018
Benefit 2013
All Average 213 256 258 286
Standard deviation 117 181 212 172
Group 1 Average 156 165 218 256
Standard deviation 72 78 84 61
Group 2 Average 214 246 189 339
Standard deviation 66 158 125 172
Group 3 Average 253 326 326 305
Standard deviation 138 218 253 184
Group 4 Average 172 201 179 110
Standard deviation 122 102 204 92
Table 15 - Statistical outcomes of cost and benefit per metering point for different groups of Member States depending on their level of smart metering deployment
Figure 17: Comparison of average total costs and benefits per group of countries between the previous (2014) and current benchmarking report (2018)
The first group (Denmark, Estonia, Finland, Italy, Malta, Spain and Sweden) shows a
significantly lower variation in their assessment between the 2013 and the 2018 data,
which is partly explained but the lack of an updated CBA but also on a better knowledge
of economic outcomes and expenses of smart metering systems potentially due to
access to relevant field data.
0.00 €
50.00 €
100.00 €
150.00 €
200.00 €
250.00 €
300.00 €
350.00 €
400.00 €
TOTEX 2018 TOTEX 2013 Benefit 2018 Benefit 2013
Groupe1
Groupe 2
Groupe 3
Groupe 4
All
Final Report Benchmarking Smart
Metering deployment in the EU-28 • 44/127 PUBLIC
Th
is d
ocum
en
t is
the
pro
pe
rty o
f T
racte
be
l Im
pa
ct
Be
lgiu
m S
.A.
An
y d
up
lica
tion
or
tra
nsm
issio
n t
o t
hird
pa
rtie
s is f
orb
idd
en
with
ou
t p
rio
r w
ritte
n a
ppro
va
l
The second group (Austria, France, Luxembourg, The Netherlands and United Kingdom
) shows a common pattern, namely that cost and benefits have both declined, but initial
benefits seems to have been significantly overestimated since their decrease is much
more important. The decrease in variation depicts an increased maturity and knowledge
of benefits and costs, using pilot project and early waves of deployment as a source of
feedback for the economic assessment.
The third group (Belgium, Bulgaria, Croatia, Cyprus, Czech Republic, Germany,
Greece, Hungary, Ireland, Lithuania, Poland, Romania and Slovakia ), characterized by
a lower commitment level towards smart metering deployment, has witnessed a
significant decrease in capital and operating expenses for smart metering assessment.
Their standard deviation remains very large though for both costs and benefits indicating
a different degree of commitment to continue pursuing a wider range deployment.
Finally the last group (Latvia, Portugal and Slovenia ) has demonstrated some sort of
ambiguity towards smart metering by deploying them without taking any formal
commitment for the target to reach. A simultaneous decrease in costs and increase in
benefits has triggered a wave of new commitment for smart metering, even though the
full roll out will require more than the business as usual to be completed within the next
10 years.
5.1.3 Deployment state of play
A detailed analysis has been performed on the progress and the current deployment
rate of the smart metering deployment across the EU-28, for each Member State.
5.1.3.1 MARKET DRIVERS FOR SMART METER ROLL-OUT
6 primary market drivers were identified for the deployment of smart meters:
• Enabling dynamic tariffs for households and SMEs;
• Digitalization of the distribution grid and optimization of the network operations;
• Digitalization of the retail market to foster innovation and new services by
private actors;
• Integrating decentralized energy resources with flexible access, such as load
shedding or infeed curtailment;
• Supporting actions for tackling fuel poverty;
• Supporting energy efficiency.
The primary drivers for the deployment of smart meters in each Member State can be
observed in Table 16. Figure 18 consolidates this information to visualize the ranking of
these market drivers across the EU-28.
The key driver to roll-out smart meters is the ‘digitalization of the distribution grid to allow
optimization of the network operations’, providing direct value for grid and generation
operators to optimize the operation and usage of their existing assets. This may defer
additional grid capacity (investments), leading to indirect benefits for the consumer. For
instance, the German legislator has conceived smart metering systems as a digital
infrastructure for the energy transition.
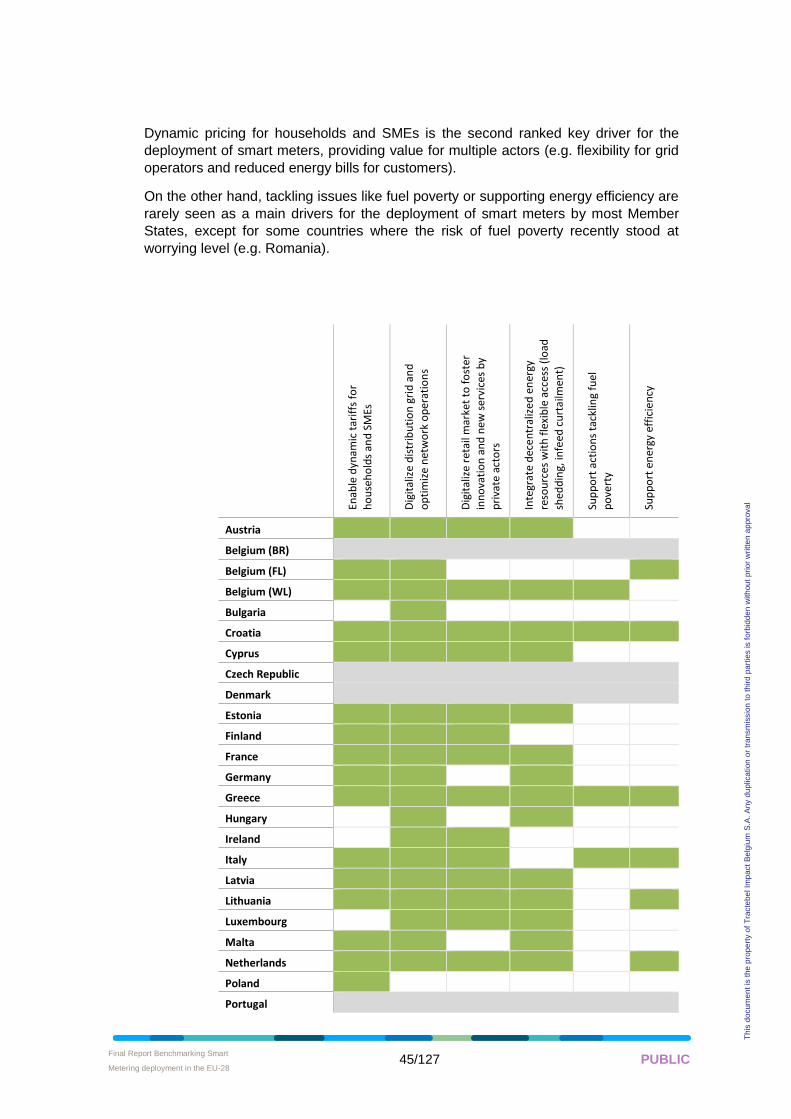
Final Report Benchmarking Smart
Metering deployment in the EU-28 • 45/127 PUBLIC
Th
is d
ocum
en
t is
the
pro
pe
rty o
f T
racte
be
l Im
pa
ct
Be
lgiu
m S
.A.
An
y d
up
lica
tion
or
tra
nsm
issio
n t
o t
hird
pa
rtie
s is f
orb
idd
en
with
ou
t p
rio
r w
ritte
n a
ppro
va
l
Dynamic pricing for households and SMEs is the second ranked key driver for the
deployment of smart meters, providing value for multiple actors (e.g. flexibility for grid
operators and reduced energy bills for customers).
On the other hand, tackling issues like fuel poverty or supporting energy efficiency are
rarely seen as a main drivers for the deployment of smart meters by most Member
States, except for some countries where the risk of fuel poverty recently stood at
worrying level (e.g. Romania).
Enab
le d
ynam
ic t
arif
fs f
or
ho
use
ho
lds
and
SM
Es
Dig
ital
ize
dis
trib
uti
on
gri
d a
nd
op
tim
ize
net
wo
rk o
per
atio
ns
Dig
ital
ize
reta
il m
arke
t to
fo
ster
inn
ova
tio
n a
nd
new
ser
vice
s b
y
pri
vate
act
ors
Inte
grat
e d
ece
ntr
aliz
ed
en
ergy
reso
urc
es w
ith
fle
xib
le a
cces
s (l
oad
shed
din
g, in
feed
cu
rtai
lmen
t)
Sup
po
rt a
ctio
ns
tack
ling
fuel
po
vert
y
Sup
po
rt e
ner
gy e
ffic
ien
cy
Austria
Belgium (BR)
Belgium (FL)
Belgium (WL)
Bulgaria
Croatia
Cyprus
Czech Republic
Denmark
Estonia
Finland
France
Germany
Greece
Hungary
Ireland
Italy
Latvia
Lithuania
Luxembourg
Malta
Netherlands
Poland
Portugal
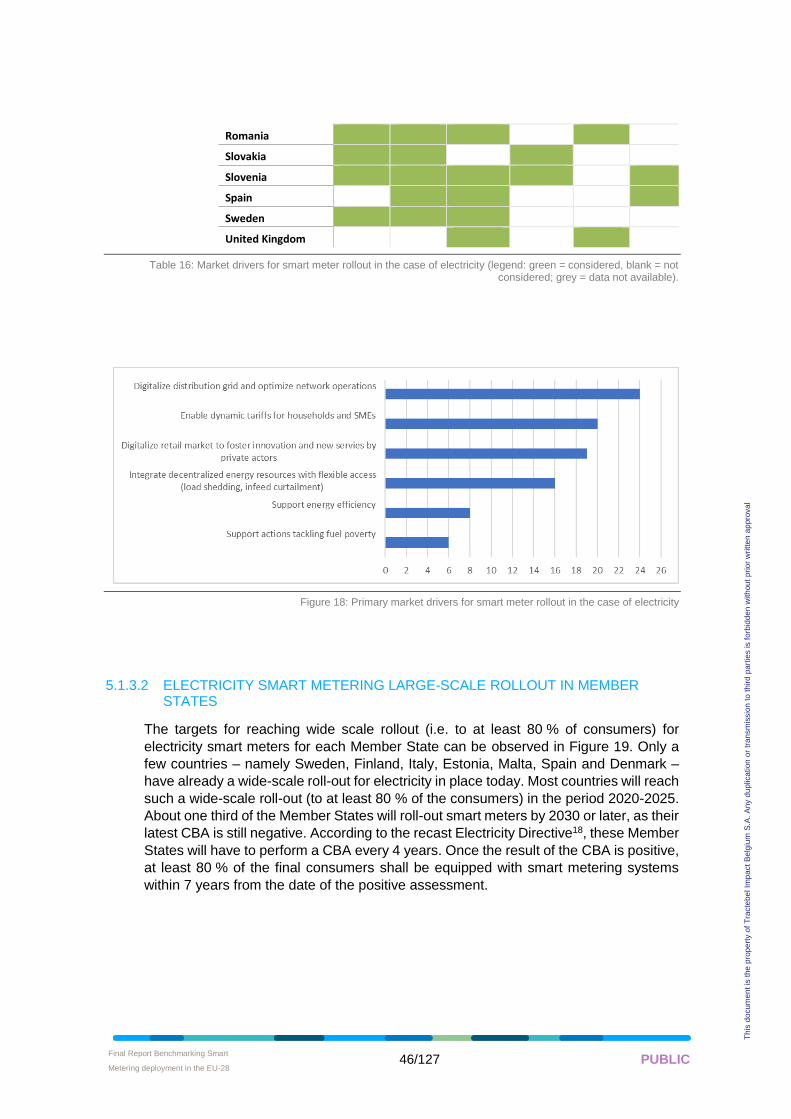
Final Report Benchmarking Smart
Metering deployment in the EU-28 • 46/127 PUBLIC
Th
is d
ocum
en
t is
the
pro
pe
rty o
f T
racte
be
l Im
pa
ct
Be
lgiu
m S
.A.
An
y d
up
lica
tion
or
tra
nsm
issio
n t
o t
hird
pa
rtie
s is f
orb
idd
en
with
ou
t p
rio
r w
ritte
n a
ppro
va
l
Romania
Slovakia
Slovenia
Spain
Sweden
United Kingdom
Table 16: Market drivers for smart meter rollout in the case of electricity (legend: green = considered, blank = not considered; grey = data not available).
Figure 18: Primary market drivers for smart meter rollout in the case of electricity
5.1.3.2 ELECTRICITY SMART METERING LARGE-SCALE ROLLOUT IN MEMBER STATES
The targets for reaching wide scale rollout (i.e. to at least 80 % of consumers) for
electricity smart meters for each Member State can be observed in Figure 19. Only a
few countries – namely Sweden, Finland, Italy, Estonia, Malta, Spain and Denmark –
have already a wide-scale roll-out for electricity in place today. Most countries will reach
such a wide-scale roll-out (to at least 80 % of the consumers) in the period 2020-2025.
About one third of the Member States will roll-out smart meters by 2030 or later, as their
latest CBA is still negative. According to the recast Electricity Directive18, these Member
States will have to perform a CBA every 4 years. Once the result of the CBA is positive,
at least 80 % of the final consumers shall be equipped with smart metering systems
within 7 years from the date of the positive assessment.
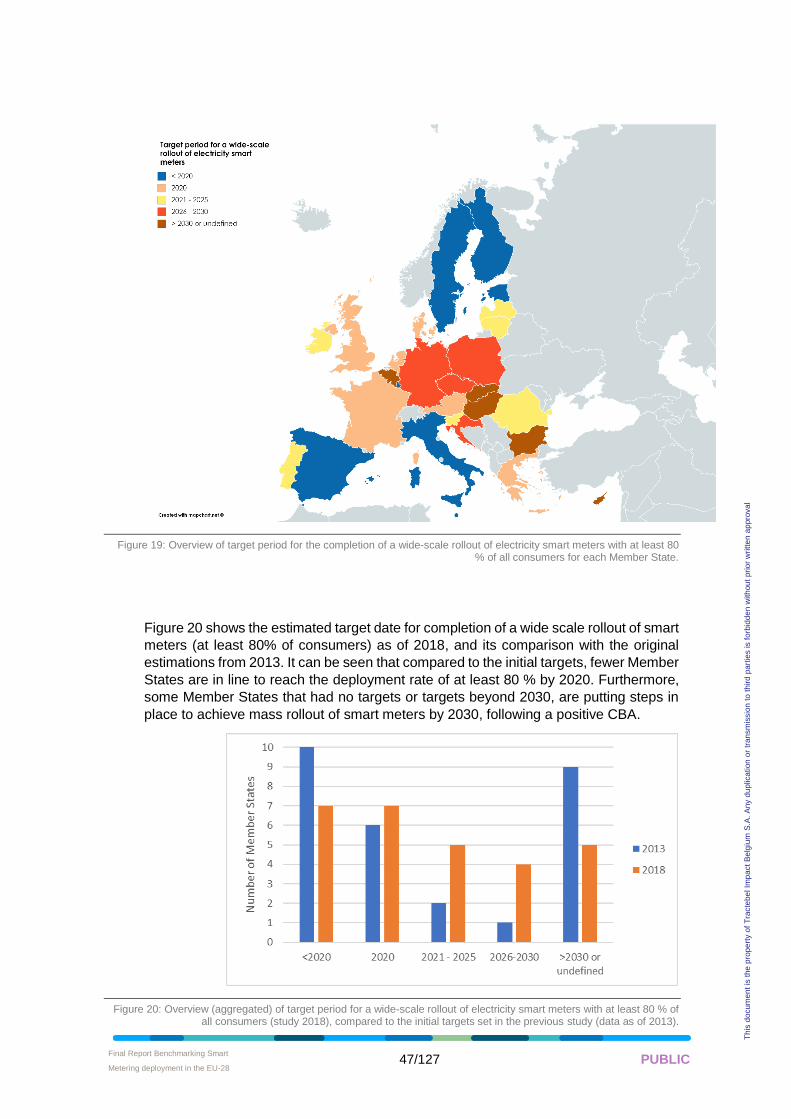
Final Report Benchmarking Smart
Metering deployment in the EU-28 • 47/127 PUBLIC
Th
is d
ocum
en
t is
the
pro
pe
rty o
f T
racte
be
l Im
pa
ct
Be
lgiu
m S
.A.
An
y d
up
lica
tion
or
tra
nsm
issio
n t
o t
hird
pa
rtie
s is f
orb
idd
en
with
ou
t p
rio
r w
ritte
n a
ppro
va
l
Figure 19: Overview of target period for the completion of a wide-scale rollout of electricity smart meters with at least 80 % of all consumers for each Member State.
Figure 20 shows the estimated target date for completion of a wide scale rollout of smart
meters (at least 80% of consumers) as of 2018, and its comparison with the original
estimations from 2013. It can be seen that compared to the initial targets, fewer Member
States are in line to reach the deployment rate of at least 80 % by 2020. Furthermore,
some Member States that had no targets or targets beyond 2030, are putting steps in
place to achieve mass rollout of smart meters by 2030, following a positive CBA.
Figure 20: Overview (aggregated) of target period for a wide-scale rollout of electricity smart meters with at least 80 % of all consumers (study 2018), compared to the initial targets set in the previous study (data as of 2013).
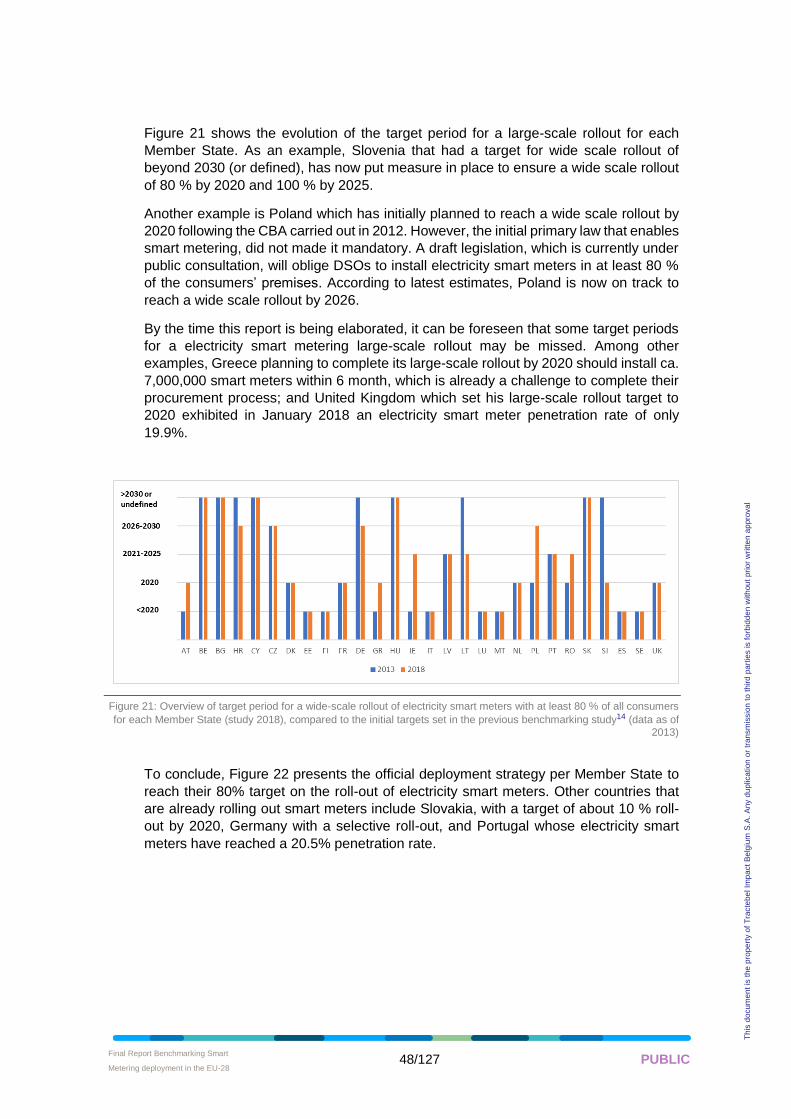
Final Report Benchmarking Smart
Metering deployment in the EU-28 • 48/127 PUBLIC
Th
is d
ocum
en
t is
the
pro
pe
rty o
f T
racte
be
l Im
pa
ct
Be
lgiu
m S
.A.
An
y d
up
lica
tion
or
tra
nsm
issio
n t
o t
hird
pa
rtie
s is f
orb
idd
en
with
ou
t p
rio
r w
ritte
n a
ppro
va
l
Figure 21 shows the evolution of the target period for a large-scale rollout for each
Member State. As an example, Slovenia that had a target for wide scale rollout of
beyond 2030 (or defined), has now put measure in place to ensure a wide scale rollout
of 80 % by 2020 and 100 % by 2025.
Another example is Poland which has initially planned to reach a wide scale rollout by
2020 following the CBA carried out in 2012. However, the initial primary law that enables
smart metering, did not made it mandatory. A draft legislation, which is currently under
public consultation, will oblige DSOs to install electricity smart meters in at least 80 %
of the consumers’ premises. According to latest estimates, Poland is now on track to
reach a wide scale rollout by 2026.
By the time this report is being elaborated, it can be foreseen that some target periods
for a electricity smart metering large-scale rollout may be missed. Among other
examples, Greece planning to complete its large-scale rollout by 2020 should install ca.
7,000,000 smart meters within 6 month, which is already a challenge to complete their
procurement process; and United Kingdom which set his large-scale rollout target to
2020 exhibited in January 2018 an electricity smart meter penetration rate of only
19.9%.
Figure 21: Overview of target period for a wide-scale rollout of electricity smart meters with at least 80 % of all consumers
for each Member State (study 2018), compared to the initial targets set in the previous benchmarking study14 (data as of
2013)
To conclude, Figure 22 presents the official deployment strategy per Member State to
reach their 80% target on the roll-out of electricity smart meters. Other countries that
are already rolling out smart meters include Slovakia, with a target of about 10 % roll-
out by 2020, Germany with a selective roll-out, and Portugal whose electricity smart
meters have reached a 20.5% penetration rate.
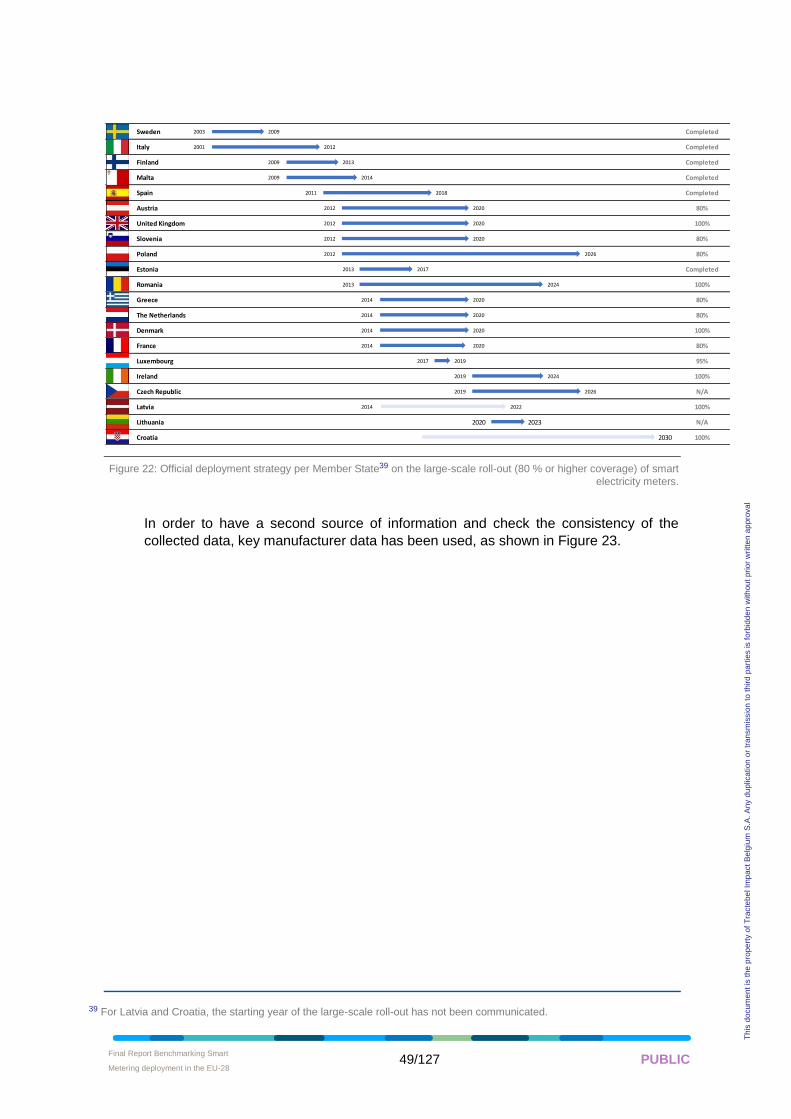
Final Report Benchmarking Smart
Metering deployment in the EU-28 • 49/127 PUBLIC
Th
is d
ocum
en
t is
the
pro
pe
rty o
f T
racte
be
l Im
pa
ct
Be
lgiu
m S
.A.
An
y d
up
lica
tion
or
tra
nsm
issio
n t
o t
hird
pa
rtie
s is f
orb
idd
en
with
ou
t p
rio
r w
ritte
n a
ppro
va
l
Figure 22: Official deployment strategy per Member State39 on the large-scale roll-out (80 % or higher coverage) of smart
electricity meters.
In order to have a second source of information and check the consistency of the
collected data, key manufacturer data has been used, as shown in Figure 23.
39 For Latvia and Croatia, the starting year of the large-scale roll-out has not been communicated.
Sweden 2003 2009 Completed
Italy 2001 2012 Completed
Finland 2009 2013 Completed
Malta 2009 2014 Completed
Spain 2011 2018 Completed
Austria 2012 2020 80%
United Kingdom 2012 2020 100%
Slovenia 2012 2020 80%
Poland 2012 2026 80%
Estonia 2013 2017 Completed
Romania 2013 2024 100%
Greece 2014 2020 80%
The Netherlands 2014 2020 80%
Denmark 2014 2020 100%
France 2014 2020 80%
Luxembourg 2017 2019 95%
Ireland 2019 2024 100%
Czech Republic 2019 2026 N/A
Latvia 2014 2022 100%
Lithuania 2020 2023 N/A
Croatia 2030 100%
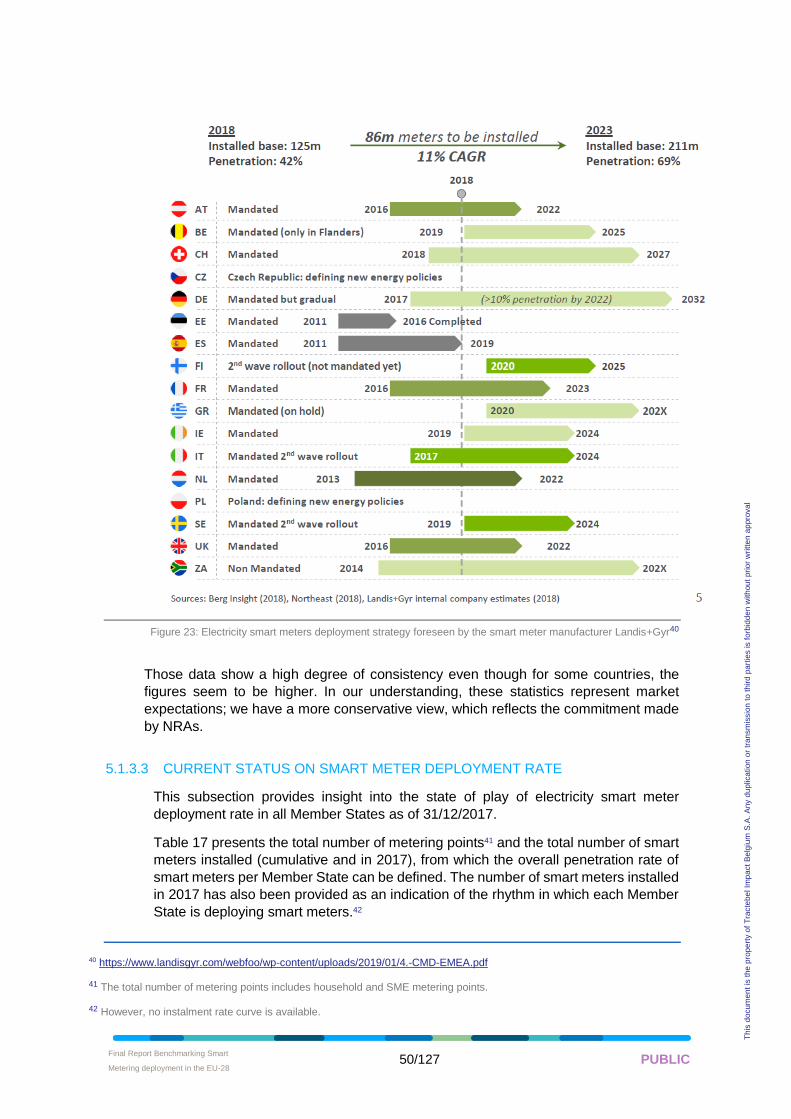
Final Report Benchmarking Smart
Metering deployment in the EU-28 • 50/127 PUBLIC
Th
is d
ocum
en
t is
the
pro
pe
rty o
f T
racte
be
l Im
pa
ct
Be
lgiu
m S
.A.
An
y d
up
lica
tion
or
tra
nsm
issio
n t
o t
hird
pa
rtie
s is f
orb
idd
en
with
ou
t p
rio
r w
ritte
n a
ppro
va
l
Figure 23: Electricity smart meters deployment strategy foreseen by the smart meter manufacturer Landis+Gyr40
Those data show a high degree of consistency even though for some countries, the
figures seem to be higher. In our understanding, these statistics represent market
expectations; we have a more conservative view, which reflects the commitment made
by NRAs.
5.1.3.3 CURRENT STATUS ON SMART METER DEPLOYMENT RATE
This subsection provides insight into the state of play of electricity smart meter
deployment rate in all Member States as of 31/12/2017.
Table 17 presents the total number of metering points41 and the total number of smart
meters installed (cumulative and in 2017), from which the overall penetration rate of
smart meters per Member State can be defined. The number of smart meters installed
in 2017 has also been provided as an indication of the rhythm in which each Member
State is deploying smart meters.42
40 https://www.landisgyr.com/webfoo/wp-content/uploads/2019/01/4.-CMD-EMEA.pdf
41 The total number of metering points includes household and SME metering points.
42 However, no instalment rate curve is available.
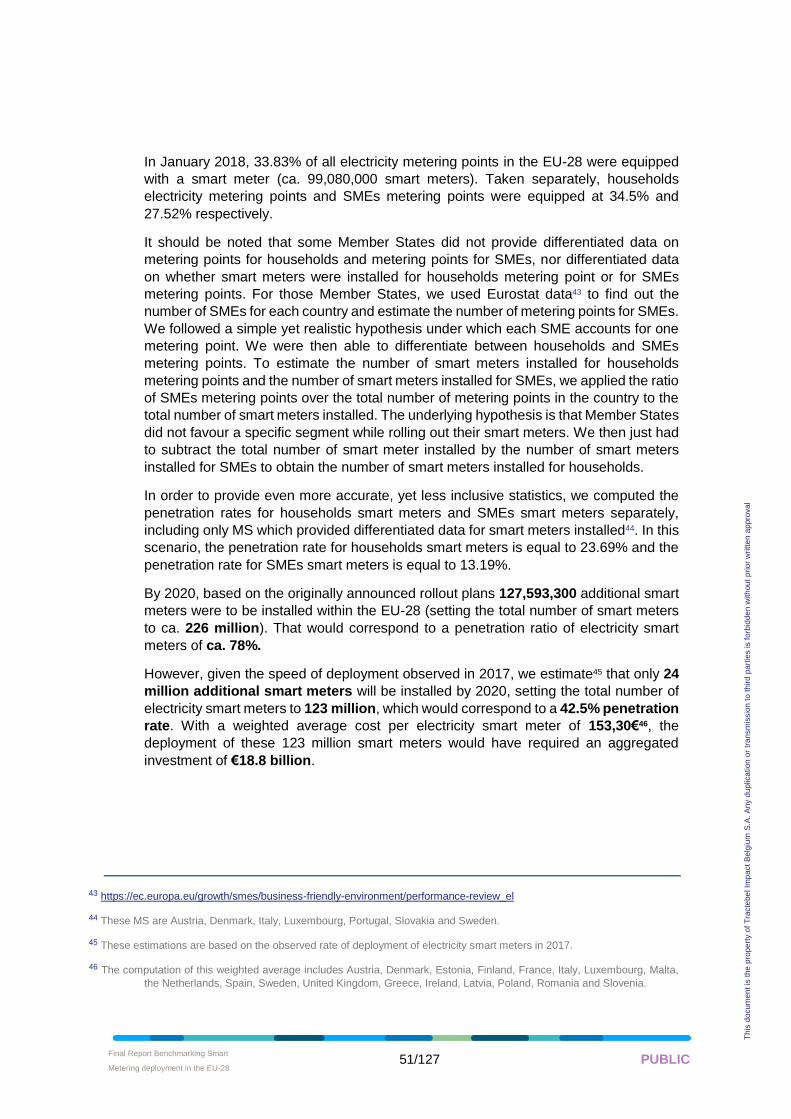
Final Report Benchmarking Smart
Metering deployment in the EU-28 • 51/127 PUBLIC
Th
is d
ocum
en
t is
the
pro
pe
rty o
f T
racte
be
l Im
pa
ct
Be
lgiu
m S
.A.
An
y d
up
lica
tion
or
tra
nsm
issio
n t
o t
hird
pa
rtie
s is f
orb
idd
en
with
ou
t p
rio
r w
ritte
n a
ppro
va
l
In January 2018, 33.83% of all electricity metering points in the EU-28 were equipped
with a smart meter (ca. 99,080,000 smart meters). Taken separately, households
electricity metering points and SMEs metering points were equipped at 34.5% and
27.52% respectively.
It should be noted that some Member States did not provide differentiated data on
metering points for households and metering points for SMEs, nor differentiated data
on whether smart meters were installed for households metering point or for SMEs
metering points. For those Member States, we used Eurostat data43 to find out the
number of SMEs for each country and estimate the number of metering points for SMEs.
We followed a simple yet realistic hypothesis under which each SME accounts for one
metering point. We were then able to differentiate between households and SMEs
metering points. To estimate the number of smart meters installed for households
metering points and the number of smart meters installed for SMEs, we applied the ratio
of SMEs metering points over the total number of metering points in the country to the
total number of smart meters installed. The underlying hypothesis is that Member States
did not favour a specific segment while rolling out their smart meters. We then just had
to subtract the total number of smart meter installed by the number of smart meters
installed for SMEs to obtain the number of smart meters installed for households.
In order to provide even more accurate, yet less inclusive statistics, we computed the
penetration rates for households smart meters and SMEs smart meters separately,
including only MS which provided differentiated data for smart meters installed44. In this
scenario, the penetration rate for households smart meters is equal to 23.69% and the
penetration rate for SMEs smart meters is equal to 13.19%.
By 2020, based on the originally announced rollout plans 127,593,300 additional smart
meters were to be installed within the EU-28 (setting the total number of smart meters
to ca. 226 million). That would correspond to a penetration ratio of electricity smart
meters of ca. 78%.
However, given the speed of deployment observed in 2017, we estimate45 that only 24
million additional smart meters will be installed by 2020, setting the total number of
electricity smart meters to 123 million, which would correspond to a 42.5% penetration
rate. With a weighted average cost per electricity smart meter of 153,30€46, the
deployment of these 123 million smart meters would have required an aggregated
investment of €18.8 billion.
43 https://ec.europa.eu/growth/smes/business-friendly-environment/performance-review_el
44 These MS are Austria, Denmark, Italy, Luxembourg, Portugal, Slovakia and Sweden.
45 These estimations are based on the observed rate of deployment of electricity smart meters in 2017.
46 The computation of this weighted average includes Austria, Denmark, Estonia, Finland, France, Italy, Luxembourg, Malta,
the Netherlands, Spain, Sweden, United Kingdom, Greece, Ireland, Latvia, Poland, Romania and Slovenia.
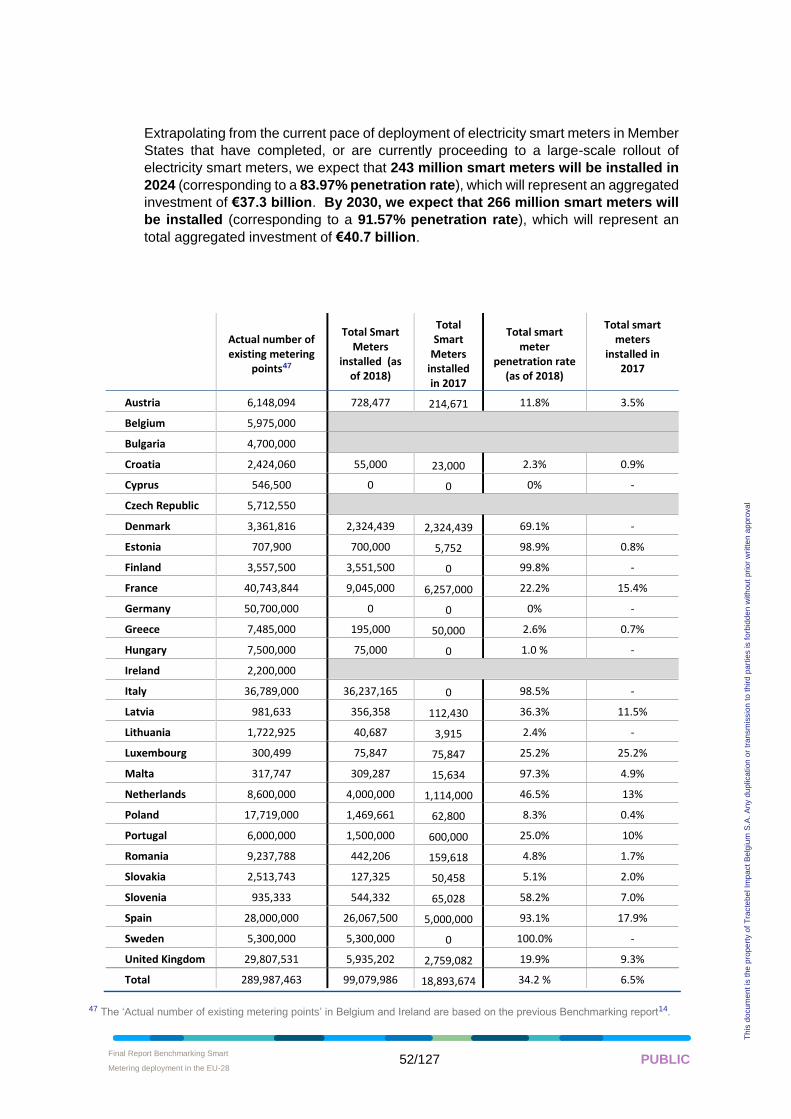
Final Report Benchmarking Smart
Metering deployment in the EU-28 • 52/127 PUBLIC
Th
is d
ocum
en
t is
the
pro
pe
rty o
f T
racte
be
l Im
pa
ct
Be
lgiu
m S
.A.
An
y d
up
lica
tion
or
tra
nsm
issio
n t
o t
hird
pa
rtie
s is f
orb
idd
en
with
ou
t p
rio
r w
ritte
n a
ppro
va
l
Extrapolating from the current pace of deployment of electricity smart meters in Member
States that have completed, or are currently proceeding to a large-scale rollout of
electricity smart meters, we expect that 243 million smart meters will be installed in
2024 (corresponding to a 83.97% penetration rate), which will represent an aggregated
investment of €37.3 billion. By 2030, we expect that 266 million smart meters will
be installed (corresponding to a 91.57% penetration rate), which will represent an
total aggregated investment of €40.7 billion.
Actual number of existing metering
points47
Total Smart Meters
installed (as of 2018)
Total Smart
Meters installed in 2017
Total smart meter
penetration rate (as of 2018)
Total smart meters
installed in 2017
Austria 6,148,094 728,477 214,671 11.8% 3.5%
Belgium 5,975,000
Bulgaria 4,700,000
Croatia 2,424,060 55,000 23,000 2.3% 0.9%
Cyprus 546,500 0 0 0% -
Czech Republic 5,712,550
Denmark 3,361,816 2,324,439 2,324,439 69.1% -
Estonia 707,900 700,000 5,752 98.9% 0.8%
Finland 3,557,500 3,551,500 0 99.8% -
France 40,743,844 9,045,000 6,257,000 22.2% 15.4%
Germany 50,700,000 0 0 0% -
Greece 7,485,000 195,000 50,000 2.6% 0.7%
Hungary 7,500,000 75,000 0 1.0 % -
Ireland 2,200,000
Italy 36,789,000 36,237,165 0 98.5% -
Latvia 981,633 356,358 112,430 36.3% 11.5%
Lithuania 1,722,925 40,687 3,915 2.4% -
Luxembourg 300,499 75,847 75,847 25.2% 25.2%
Malta 317,747 309,287 15,634 97.3% 4.9%
Netherlands 8,600,000 4,000,000 1,114,000 46.5% 13%
Poland 17,719,000 1,469,661 62,800 8.3% 0.4%
Portugal 6,000,000 1,500,000 600,000 25.0% 10%
Romania 9,237,788 442,206 159,618 4.8% 1.7%
Slovakia 2,513,743 127,325 50,458 5.1% 2.0%
Slovenia 935,333 544,332 65,028 58.2% 7.0%
Spain 28,000,000 26,067,500 5,000,000 93.1% 17.9%
Sweden 5,300,000 5,300,000 0 100.0% -
United Kingdom 29,807,531 5,935,202 2,759,082 19.9% 9.3%
Total 289,987,463 99,079,986 18,893,674 34.2 % 6.5%
47 The ‘Actual number of existing metering points’ in Belgium and Ireland are based on the previous Benchmarking report14.
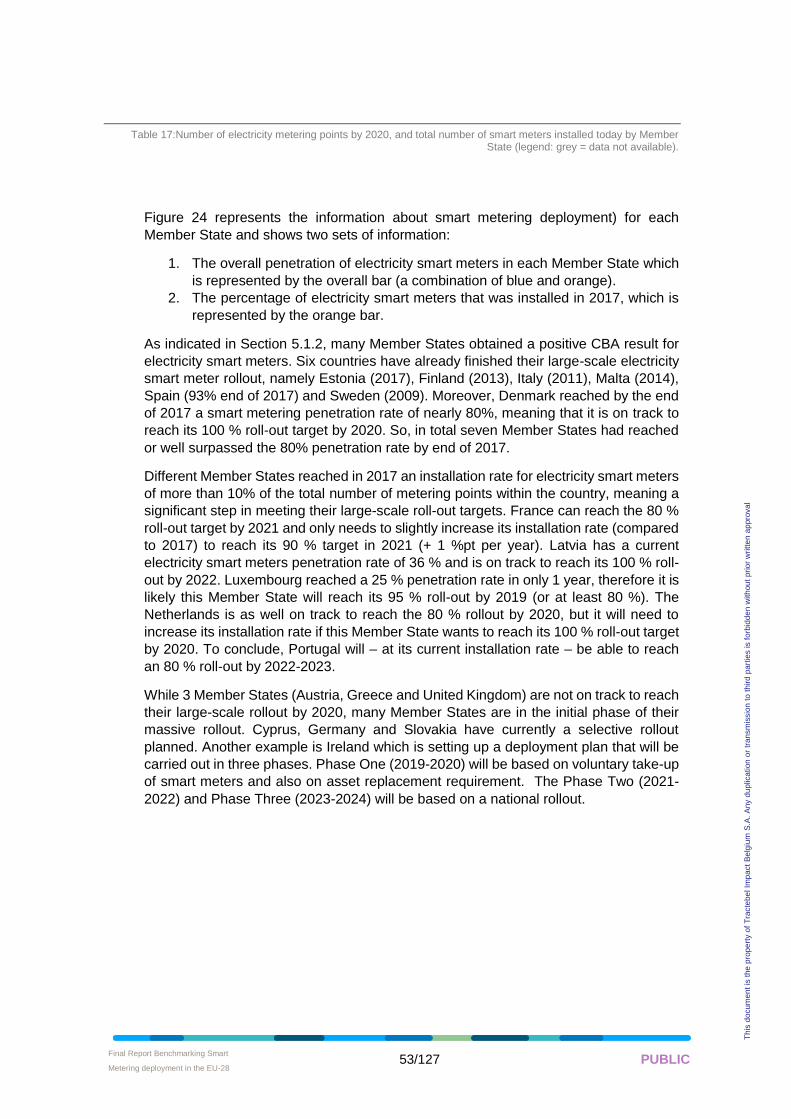
Final Report Benchmarking Smart
Metering deployment in the EU-28 • 53/127 PUBLIC
Th
is d
ocum
en
t is
the
pro
pe
rty o
f T
racte
be
l Im
pa
ct
Be
lgiu
m S
.A.
An
y d
up
lica
tion
or
tra
nsm
issio
n t
o t
hird
pa
rtie
s is f
orb
idd
en
with
ou
t p
rio
r w
ritte
n a
ppro
va
l
Table 17:Number of electricity metering points by 2020, and total number of smart meters installed today by Member State (legend: grey = data not available).
Figure 24 represents the information about smart metering deployment) for each
Member State and shows two sets of information:
1. The overall penetration of electricity smart meters in each Member State which
is represented by the overall bar (a combination of blue and orange).
2. The percentage of electricity smart meters that was installed in 2017, which is
represented by the orange bar.
As indicated in Section 5.1.2, many Member States obtained a positive CBA result for
electricity smart meters. Six countries have already finished their large-scale electricity
smart meter rollout, namely Estonia (2017), Finland (2013), Italy (2011), Malta (2014),
Spain (93% end of 2017) and Sweden (2009). Moreover, Denmark reached by the end
of 2017 a smart metering penetration rate of nearly 80%, meaning that it is on track to
reach its 100 % roll-out target by 2020. So, in total seven Member States had reached
or well surpassed the 80% penetration rate by end of 2017.
Different Member States reached in 2017 an installation rate for electricity smart meters
of more than 10% of the total number of metering points within the country, meaning a
significant step in meeting their large-scale roll-out targets. France can reach the 80 %
roll-out target by 2021 and only needs to slightly increase its installation rate (compared
to 2017) to reach its 90 % target in 2021 (+ 1 %pt per year). Latvia has a current
electricity smart meters penetration rate of 36 % and is on track to reach its 100 % roll-
out by 2022. Luxembourg reached a 25 % penetration rate in only 1 year, therefore it is
likely this Member State will reach its 95 % roll-out by 2019 (or at least 80 %). The
Netherlands is as well on track to reach the 80 % rollout by 2020, but it will need to
increase its installation rate if this Member State wants to reach its 100 % roll-out target
by 2020. To conclude, Portugal will – at its current installation rate – be able to reach
an 80 % roll-out by 2022-2023.
While 3 Member States (Austria, Greece and United Kingdom) are not on track to reach
their large-scale rollout by 2020, many Member States are in the initial phase of their
massive rollout. Cyprus, Germany and Slovakia have currently a selective rollout
planned. Another example is Ireland which is setting up a deployment plan that will be
carried out in three phases. Phase One (2019-2020) will be based on voluntary take-up
of smart meters and also on asset replacement requirement. The Phase Two (2021-
2022) and Phase Three (2023-2024) will be based on a national rollout.
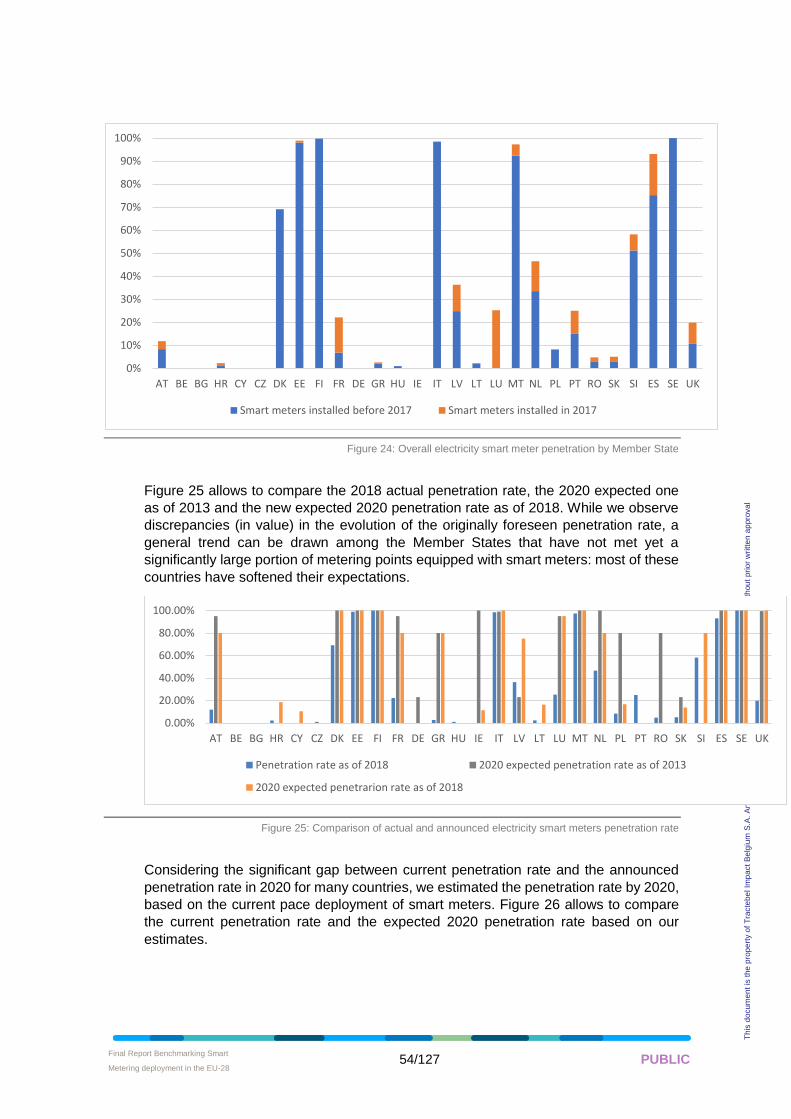
Final Report Benchmarking Smart
Metering deployment in the EU-28 • 54/127 PUBLIC
Th
is d
ocum
en
t is
the
pro
pe
rty o
f T
racte
be
l Im
pa
ct
Be
lgiu
m S
.A.
An
y d
up
lica
tion
or
tra
nsm
issio
n t
o t
hird
pa
rtie
s is f
orb
idd
en
with
ou
t p
rio
r w
ritte
n a
ppro
va
l
Figure 24: Overall electricity smart meter penetration by Member State
Figure 25 allows to compare the 2018 actual penetration rate, the 2020 expected one
as of 2013 and the new expected 2020 penetration rate as of 2018. While we observe
discrepancies (in value) in the evolution of the originally foreseen penetration rate, a
general trend can be drawn among the Member States that have not met yet a
significantly large portion of metering points equipped with smart meters: most of these
countries have softened their expectations.
Figure 25: Comparison of actual and announced electricity smart meters penetration rate
Considering the significant gap between current penetration rate and the announced
penetration rate in 2020 for many countries, we estimated the penetration rate by 2020,
based on the current pace deployment of smart meters. Figure 26 allows to compare
the current penetration rate and the expected 2020 penetration rate based on our
estimates.
0%
10%
20%
30%
40%
50%
60%
70%
80%
90%
100%
AT BE BG HR CY CZ DK EE FI FR DE GR HU IE IT LV LT LU MT NL PL PT RO SK SI ES SE UK
Smart meters installed before 2017 Smart meters installed in 2017
0.00%
20.00%
40.00%
60.00%
80.00%
100.00%
AT BE BG HR CY CZ DK EE FI FR DE GR HU IE IT LV LT LU MT NL PL PT RO SK SI ES SE UK
Penetration rate as of 2018 2020 expected penetration rate as of 2013
2020 expected penetrarion rate as of 2018
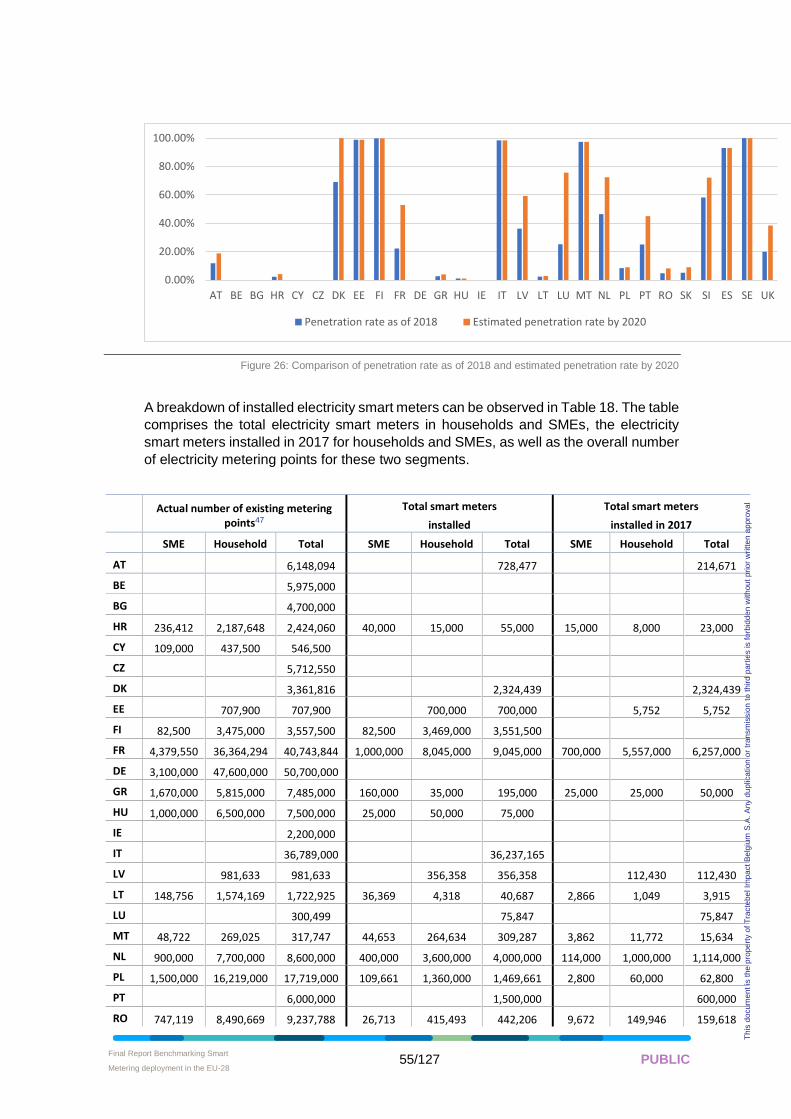
Final Report Benchmarking Smart
Metering deployment in the EU-28 • 55/127 PUBLIC
Th
is d
ocum
en
t is
the
pro
pe
rty o
f T
racte
be
l Im
pa
ct
Be
lgiu
m S
.A.
An
y d
up
lica
tion
or
tra
nsm
issio
n t
o t
hird
pa
rtie
s is f
orb
idd
en
with
ou
t p
rio
r w
ritte
n a
ppro
va
l
Figure 26: Comparison of penetration rate as of 2018 and estimated penetration rate by 2020
A breakdown of installed electricity smart meters can be observed in Table 18. The table
comprises the total electricity smart meters in households and SMEs, the electricity
smart meters installed in 2017 for households and SMEs, as well as the overall number
of electricity metering points for these two segments.
Actual number of existing metering points47
Total smart meters
installed
Total smart meters
installed in 2017
SME Household Total SME Household Total SME Household Total
AT 6,148,094 728,477 214,671
BE 5,975,000
BG 4,700,000
HR 236,412 2,187,648 2,424,060 40,000 15,000 55,000 15,000 8,000 23,000
CY 109,000 437,500 546,500
CZ 5,712,550
DK 3,361,816 2,324,439 2,324,439
EE 707,900 707,900 700,000 700,000 5,752 5,752
FI 82,500 3,475,000 3,557,500 82,500 3,469,000 3,551,500
FR 4,379,550 36,364,294 40,743,844 1,000,000 8,045,000 9,045,000 700,000 5,557,000 6,257,000
DE 3,100,000 47,600,000 50,700,000
GR 1,670,000 5,815,000 7,485,000 160,000 35,000 195,000 25,000 25,000 50,000
HU 1,000,000 6,500,000 7,500,000 25,000 50,000 75,000
IE 2,200,000
IT 36,789,000 36,237,165
LV 981,633 981,633 356,358 356,358 112,430 112,430
LT 148,756 1,574,169 1,722,925 36,369 4,318 40,687 2,866 1,049 3,915
LU 300,499 75,847 75,847
MT 48,722 269,025 317,747 44,653 264,634 309,287 3,862 11,772 15,634
NL 900,000 7,700,000 8,600,000 400,000 3,600,000 4,000,000 114,000 1,000,000 1,114,000
PL 1,500,000 16,219,000 17,719,000 109,661 1,360,000 1,469,661 2,800 60,000 62,800
PT 6,000,000 1,500,000 600,000
RO 747,119 8,490,669 9,237,788 26,713 415,493 442,206 9,672 149,946 159,618
0.00%
20.00%
40.00%
60.00%
80.00%
100.00%
AT BE BG HR CY CZ DK EE FI FR DE GR HU IE IT LV LT LU MT NL PL PT RO SK SI ES SE UK
Penetration rate as of 2018 Estimated penetration rate by 2020
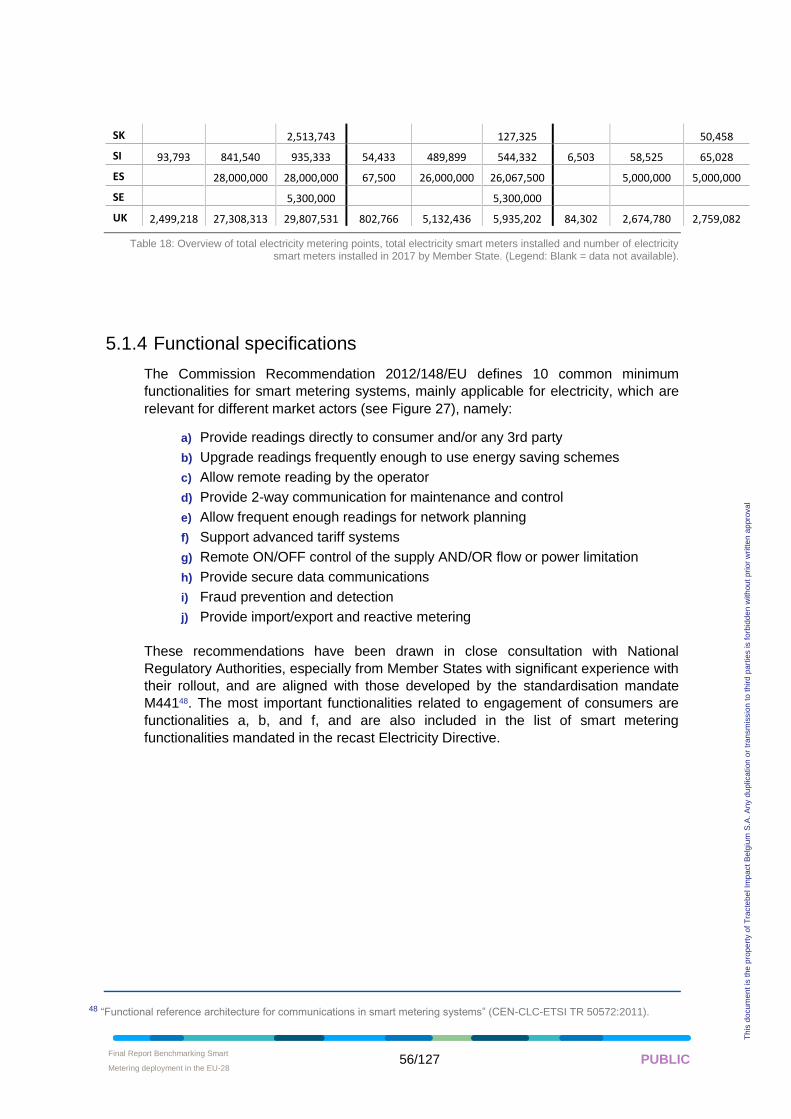
Final Report Benchmarking Smart
Metering deployment in the EU-28 • 56/127 PUBLIC
Th
is d
ocum
en
t is
the
pro
pe
rty o
f T
racte
be
l Im
pa
ct
Be
lgiu
m S
.A.
An
y d
up
lica
tion
or
tra
nsm
issio
n t
o t
hird
pa
rtie
s is f
orb
idd
en
with
ou
t p
rio
r w
ritte
n a
ppro
va
l
SK 2,513,743 127,325 50,458
SI 93,793 841,540 935,333 54,433 489,899 544,332 6,503 58,525 65,028
ES 28,000,000 28,000,000 67,500 26,000,000 26,067,500 5,000,000 5,000,000
SE 5,300,000 5,300,000
UK 2,499,218 27,308,313 29,807,531 802,766 5,132,436 5,935,202 84,302 2,674,780 2,759,082
Table 18: Overview of total electricity metering points, total electricity smart meters installed and number of electricity smart meters installed in 2017 by Member State. (Legend: Blank = data not available).
5.1.4 Functional specifications
The Commission Recommendation 2012/148/EU defines 10 common minimum
functionalities for smart metering systems, mainly applicable for electricity, which are
relevant for different market actors (see Figure 27), namely:
a) Provide readings directly to consumer and/or any 3rd party
b) Upgrade readings frequently enough to use energy saving schemes
c) Allow remote reading by the operator
d) Provide 2-way communication for maintenance and control
e) Allow frequent enough readings for network planning
f) Support advanced tariff systems
g) Remote ON/OFF control of the supply AND/OR flow or power limitation
h) Provide secure data communications
i) Fraud prevention and detection
j) Provide import/export and reactive metering
These recommendations have been drawn in close consultation with National
Regulatory Authorities, especially from Member States with significant experience with
their rollout, and are aligned with those developed by the standardisation mandate
M44148. The most important functionalities related to engagement of consumers are
functionalities a, b, and f, and are also included in the list of smart metering
functionalities mandated in the recast Electricity Directive.
48 “Functional reference architecture for communications in smart metering systems” (CEN-CLC-ETSI TR 50572:2011).
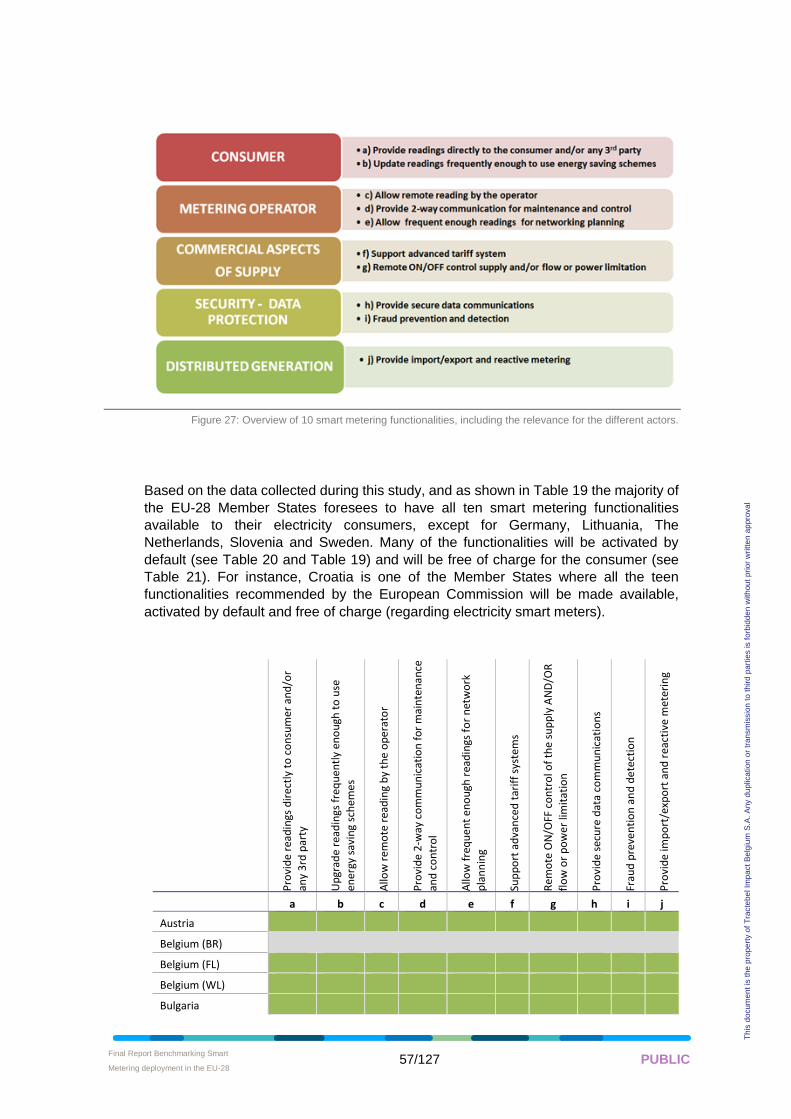
Final Report Benchmarking Smart
Metering deployment in the EU-28 • 57/127 PUBLIC
Th
is d
ocum
en
t is
the
pro
pe
rty o
f T
racte
be
l Im
pa
ct
Be
lgiu
m S
.A.
An
y d
up
lica
tion
or
tra
nsm
issio
n t
o t
hird
pa
rtie
s is f
orb
idd
en
with
ou
t p
rio
r w
ritte
n a
ppro
va
l
Figure 27: Overview of 10 smart metering functionalities, including the relevance for the different actors.
Based on the data collected during this study, and as shown in Table 19 the majority of
the EU-28 Member States foresees to have all ten smart metering functionalities
available to their electricity consumers, except for Germany, Lithuania, The
Netherlands, Slovenia and Sweden. Many of the functionalities will be activated by
default (see Table 20 and Table 19) and will be free of charge for the consumer (see
Table 21). For instance, Croatia is one of the Member States where all the teen
functionalities recommended by the European Commission will be made available,
activated by default and free of charge (regarding electricity smart meters).
Pro
vid
e re
adin
gs d
irec
tly
to c
on
sum
er a
nd
/or
any
3rd
par
ty
Up
grad
e re
adin
gs f
req
ue
ntl
y en
ou
gh t
o u
se
ener
gy s
avin
g sc
hem
es
Allo
w r
emo
te r
ead
ing
by
the
op
era
tor
Pro
vid
e 2
-way
co
mm
un
icat
ion
fo
r m
ain
ten
ance
and
co
ntr
ol
Allo
w f
req
ue
nt
en
ou
gh r
ead
ings
fo
r n
etw
ork
pla
nn
ing
Sup
po
rt a
dva
nce
d t
arif
f sy
stem
s
Rem
ote
ON
/OFF
co
ntr
ol o
f th
e su
pp
ly A
ND
/OR
flo
w o
r p
ow
er li
mit
atio
n
Pro
vid
e se
cure
dat
a co
mm
un
icat
ion
s
Frau
d p
reve
nti
on
an
d d
ete
ctio
n
Pro
vid
e im
po
rt/e
xpo
rt a
nd
rea
ctiv
e m
eter
ing
a b c d e f g h i j
Austria
Belgium (BR)
Belgium (FL)
Belgium (WL)
Bulgaria
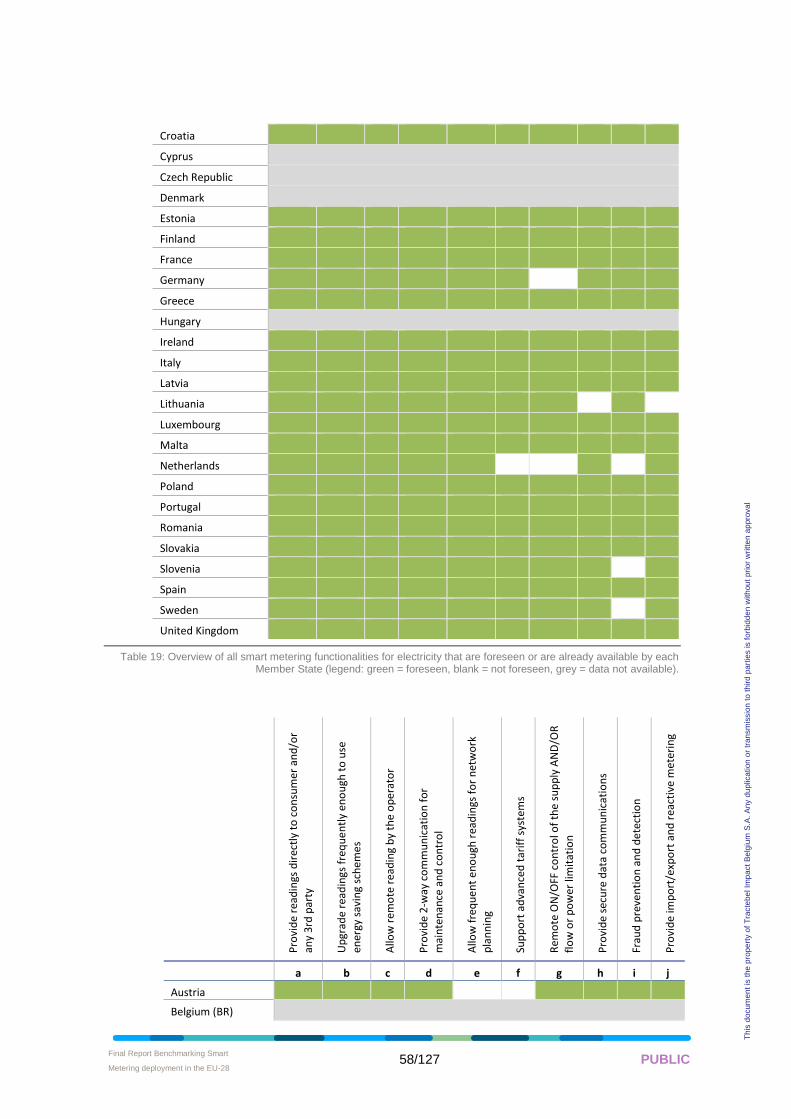
Final Report Benchmarking Smart
Metering deployment in the EU-28 • 58/127 PUBLIC
Th
is d
ocum
en
t is
the
pro
pe
rty o
f T
racte
be
l Im
pa
ct
Be
lgiu
m S
.A.
An
y d
up
lica
tion
or
tra
nsm
issio
n t
o t
hird
pa
rtie
s is f
orb
idd
en
with
ou
t p
rio
r w
ritte
n a
ppro
va
l
Croatia
Cyprus
Czech Republic
Denmark
Estonia
Finland
France
Germany
Greece
Hungary
Ireland
Italy
Latvia
Lithuania
Luxembourg
Malta
Netherlands
Poland
Portugal
Romania
Slovakia
Slovenia
Spain
Sweden
United Kingdom
Table 19: Overview of all smart metering functionalities for electricity that are foreseen or are already available by each Member State (legend: green = foreseen, blank = not foreseen, grey = data not available).
Pro
vid
e re
adin
gs d
irec
tly
to c
on
sum
er a
nd
/or
any
3rd
par
ty
Up
grad
e re
adin
gs f
req
ue
ntl
y en
ou
gh t
o u
se
ener
gy s
avin
g sc
hem
es
Allo
w r
emo
te r
ead
ing
by
the
op
era
tor
Pro
vid
e 2
-way
co
mm
un
icat
ion
fo
r
mai
nte
nan
ce a
nd
co
ntr
ol
Allo
w f
req
ue
nt
en
ou
gh r
ead
ings
fo
r n
etw
ork
pla
nn
ing
Sup
po
rt a
dva
nce
d t
arif
f sy
stem
s
Rem
ote
ON
/OFF
co
ntr
ol o
f th
e su
pp
ly A
ND
/OR
flo
w o
r p
ow
er li
mit
atio
n
Pro
vid
e se
cure
dat
a co
mm
un
icat
ion
s
Frau
d p
reve
nti
on
an
d d
ete
ctio
n
Pro
vid
e im
po
rt/e
xpo
rt a
nd
rea
ctiv
e m
eter
ing
a b c d e f g h i j
Austria
Belgium (BR)
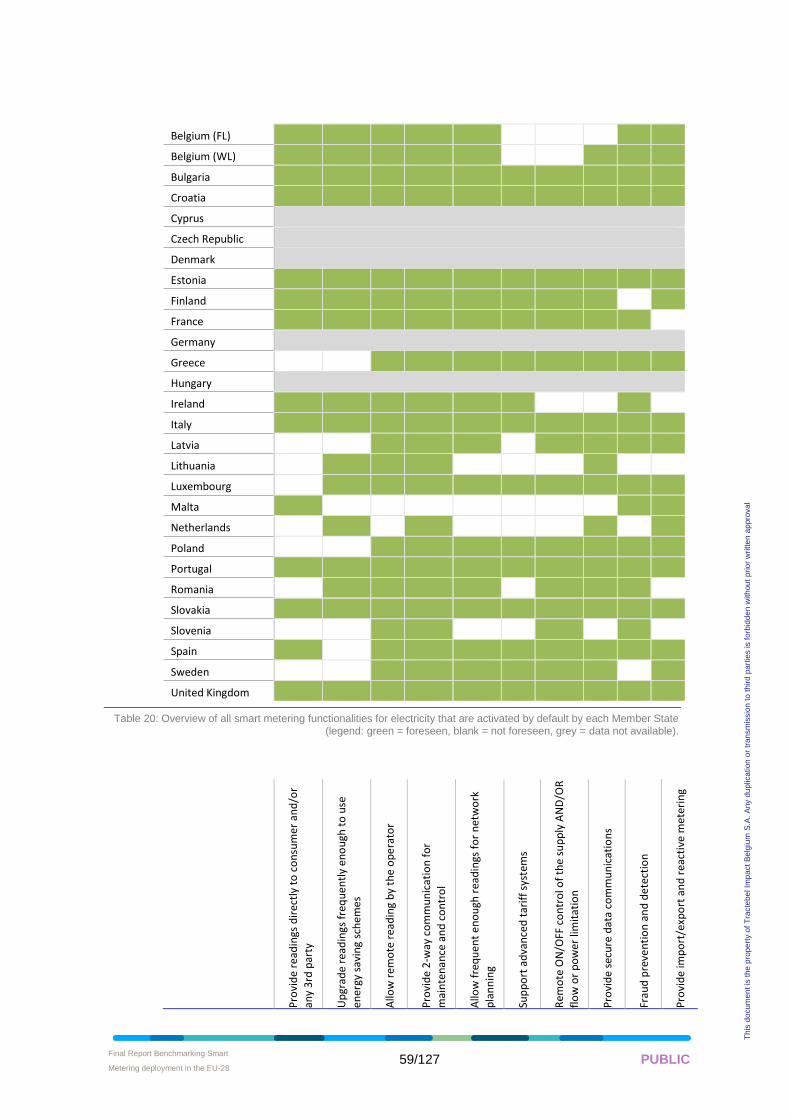
Final Report Benchmarking Smart
Metering deployment in the EU-28 • 59/127 PUBLIC
Th
is d
ocum
en
t is
the
pro
pe
rty o
f T
racte
be
l Im
pa
ct
Be
lgiu
m S
.A.
An
y d
up
lica
tion
or
tra
nsm
issio
n t
o t
hird
pa
rtie
s is f
orb
idd
en
with
ou
t p
rio
r w
ritte
n a
ppro
va
l
Belgium (FL)
Belgium (WL)
Bulgaria
Croatia
Cyprus
Czech Republic
Denmark
Estonia
Finland
France
Germany
Greece
Hungary
Ireland
Italy
Latvia
Lithuania
Luxembourg
Malta
Netherlands
Poland
Portugal
Romania
Slovakia
Slovenia
Spain
Sweden
United Kingdom
Table 20: Overview of all smart metering functionalities for electricity that are activated by default by each Member State (legend: green = foreseen, blank = not foreseen, grey = data not available).
Pro
vid
e re
adin
gs d
irec
tly
to c
on
sum
er a
nd
/or
any
3rd
par
ty
Up
grad
e re
adin
gs f
req
ue
ntl
y en
ou
gh t
o u
se
ener
gy s
avin
g sc
hem
es
Allo
w r
emo
te r
ead
ing
by
the
op
era
tor
Pro
vid
e 2
-way
co
mm
un
icat
ion
fo
r
mai
nte
nan
ce a
nd
co
ntr
ol
Allo
w f
req
ue
nt
en
ou
gh r
ead
ings
fo
r n
etw
ork
pla
nn
ing
Sup
po
rt a
dva
nce
d t
arif
f sy
stem
s
Rem
ote
ON
/OFF
co
ntr
ol o
f th
e su
pp
ly A
ND
/OR
flo
w o
r p
ow
er li
mit
atio
n
Pro
vid
e se
cure
dat
a co
mm
un
icat
ion
s
Frau
d p
reve
nti
on
an
d d
ete
ctio
n
Pro
vid
e im
po
rt/e
xpo
rt a
nd
rea
ctiv
e m
eter
ing
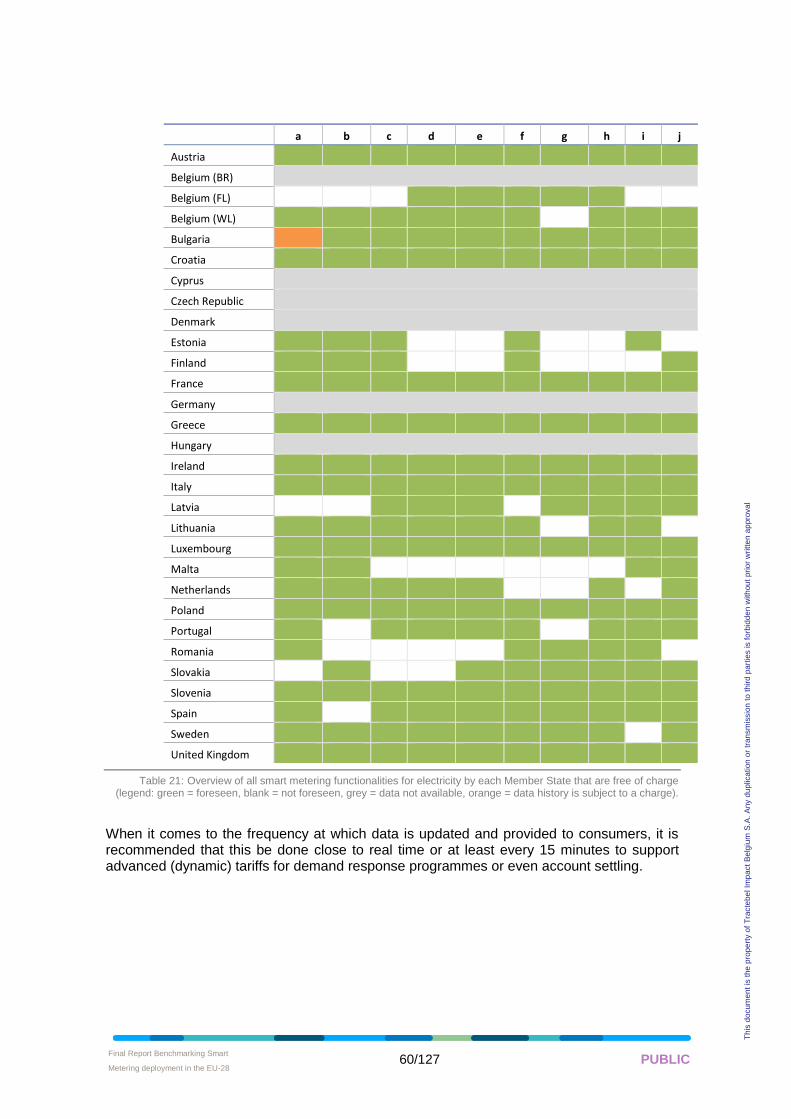
Final Report Benchmarking Smart
Metering deployment in the EU-28 • 60/127 PUBLIC
Th
is d
ocum
en
t is
the
pro
pe
rty o
f T
racte
be
l Im
pa
ct
Be
lgiu
m S
.A.
An
y d
up
lica
tion
or
tra
nsm
issio
n t
o t
hird
pa
rtie
s is f
orb
idd
en
with
ou
t p
rio
r w
ritte
n a
ppro
va
l
a b c d e f g h i j
Austria
Belgium (BR)
Belgium (FL)
Belgium (WL)
Bulgaria
Croatia
Cyprus
Czech Republic
Denmark
Estonia
Finland
France
Germany
Greece
Hungary
Ireland
Italy
Latvia
Lithuania
Luxembourg
Malta
Netherlands
Poland
Portugal
Romania
Slovakia
Slovenia
Spain
Sweden
United Kingdom
Table 21: Overview of all smart metering functionalities for electricity by each Member State that are free of charge (legend: green = foreseen, blank = not foreseen, grey = data not available, orange = data history is subject to a charge).
When it comes to the frequency at which data is updated and provided to consumers, it is recommended that this be done close to real time or at least every 15 minutes to support advanced (dynamic) tariffs for demand response programmes or even account settling.
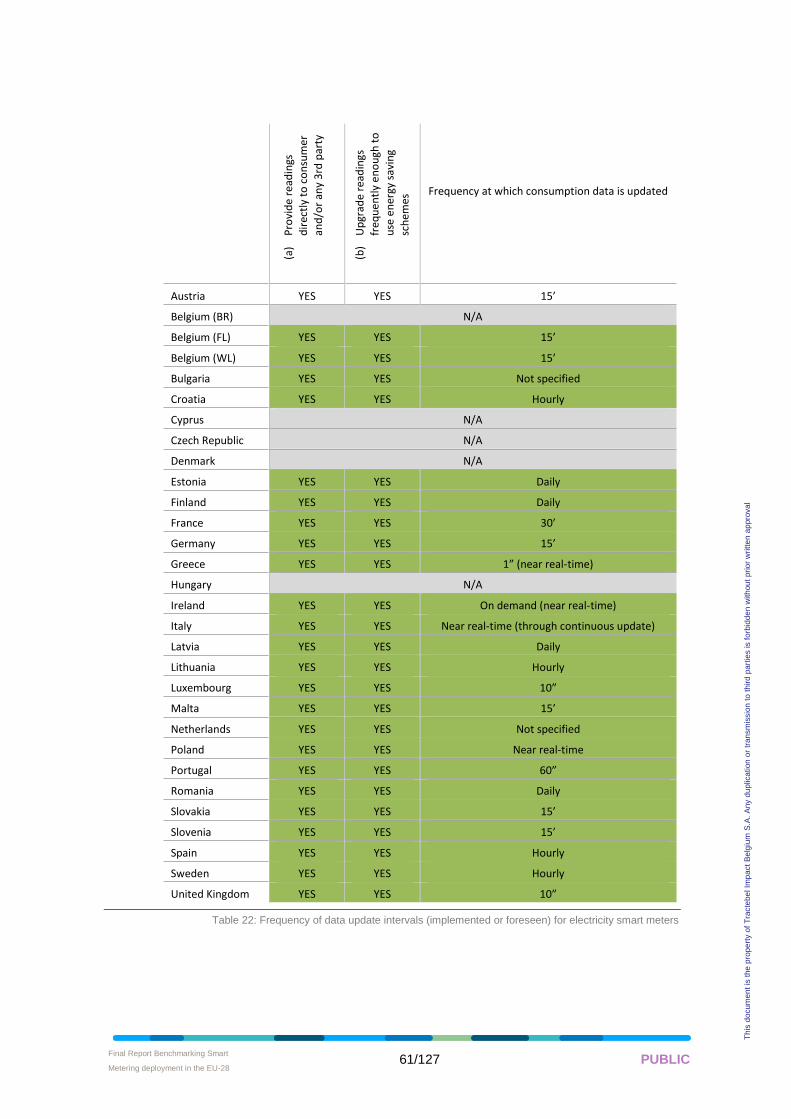
Final Report Benchmarking Smart
Metering deployment in the EU-28 • 61/127 PUBLIC
Th
is d
ocum
en
t is
the
pro
pe
rty o
f T
racte
be
l Im
pa
ct
Be
lgiu
m S
.A.
An
y d
up
lica
tion
or
tra
nsm
issio
n t
o t
hird
pa
rtie
s is f
orb
idd
en
with
ou
t p
rio
r w
ritte
n a
ppro
va
l
(a)
Pro
vid
e re
adin
gs
dir
ectl
y to
co
nsu
mer
and
/or
any
3rd
par
ty
(b)
Up
grad
e re
adin
gs
freq
ue
ntl
y e
no
ugh
to
use
en
ergy
sav
ing
sch
emes
Frequency at which consumption data is updated
Austria YES YES 15’
Belgium (BR) N/A
Belgium (FL) YES YES 15’
Belgium (WL) YES YES 15’
Bulgaria YES YES Not specified
Croatia YES YES Hourly
Cyprus N/A
Czech Republic N/A
Denmark N/A
Estonia YES YES Daily
Finland YES YES Daily
France YES YES 30’
Germany YES YES 15’
Greece YES YES 1” (near real-time)
Hungary N/A
Ireland YES YES On demand (near real-time)
Italy YES YES Near real-time (through continuous update)
Latvia YES YES Daily
Lithuania YES YES Hourly
Luxembourg YES YES 10”
Malta YES YES 15’
Netherlands YES YES Not specified
Poland YES YES Near real-time
Portugal YES YES 60”
Romania YES YES Daily
Slovakia YES YES 15’
Slovenia YES YES 15’
Spain YES YES Hourly
Sweden YES YES Hourly
United Kingdom YES YES 10”
Table 22: Frequency of data update intervals (implemented or foreseen) for electricity smart meters
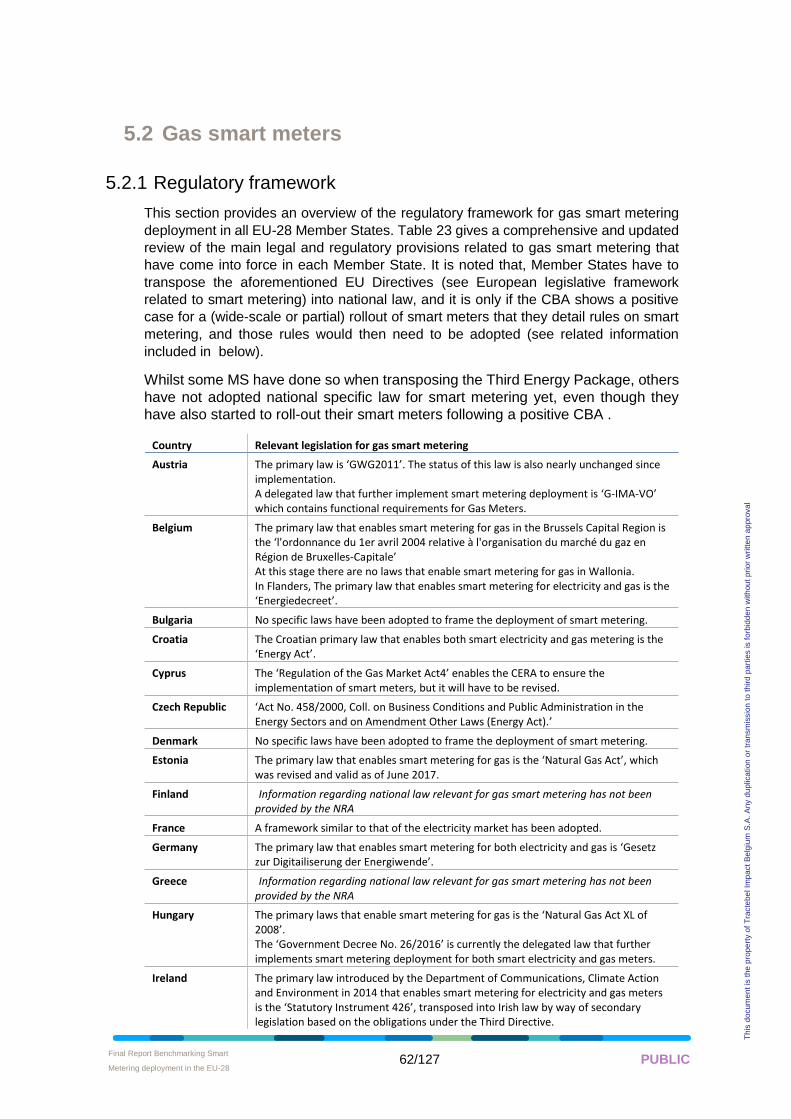
Final Report Benchmarking Smart
Metering deployment in the EU-28 • 62/127 PUBLIC
Th
is d
ocum
en
t is
the
pro
pe
rty o
f T
racte
be
l Im
pa
ct
Be
lgiu
m S
.A.
An
y d
up
lica
tion
or
tra
nsm
issio
n t
o t
hird
pa
rtie
s is f
orb
idd
en
with
ou
t p
rio
r w
ritte
n a
ppro
va
l
5.2 Gas smart meters
5.2.1 Regulatory framework
This section provides an overview of the regulatory framework for gas smart metering
deployment in all EU-28 Member States. Table 23 gives a comprehensive and updated
review of the main legal and regulatory provisions related to gas smart metering that
have come into force in each Member State. It is noted that, Member States have to
transpose the aforementioned EU Directives (see European legislative framework
related to smart metering) into national law, and it is only if the CBA shows a positive
case for a (wide-scale or partial) rollout of smart meters that they detail rules on smart
metering, and those rules would then need to be adopted (see related information
included in below).
Whilst some MS have done so when transposing the Third Energy Package, others
have not adopted national specific law for smart metering yet, even though they
have also started to roll-out their smart meters following a positive CBA .
Country Relevant legislation for gas smart metering
Austria The primary law is ‘GWG2011’. The status of this law is also nearly unchanged since implementation. A delegated law that further implement smart metering deployment is ‘G-IMA-VO’ which contains functional requirements for Gas Meters.
Belgium The primary law that enables smart metering for gas in the Brussels Capital Region is the ‘l'ordonnance du 1er avril 2004 relative à l'organisation du marché du gaz en Région de Bruxelles-Capitale’ At this stage there are no laws that enable smart metering for gas in Wallonia. In Flanders, The primary law that enables smart metering for electricity and gas is the ‘Energiedecreet’.
Bulgaria No specific laws have been adopted to frame the deployment of smart metering.
Croatia The Croatian primary law that enables both smart electricity and gas metering is the ‘Energy Act’.
Cyprus The ‘Regulation of the Gas Market Act4’ enables the CERA to ensure the implementation of smart meters, but it will have to be revised.
Czech Republic ‘Act No. 458/2000, Coll. on Business Conditions and Public Administration in the Energy Sectors and on Amendment Other Laws (Energy Act).’
Denmark No specific laws have been adopted to frame the deployment of smart metering.
Estonia The primary law that enables smart metering for gas is the ‘Natural Gas Act’, which was revised and valid as of June 2017.
Finland Information regarding national law relevant for gas smart metering has not been provided by the NRA
France A framework similar to that of the electricity market has been adopted.
Germany The primary law that enables smart metering for both electricity and gas is ‘Gesetz zur Digitailiserung der Energiwende’.
Greece Information regarding national law relevant for gas smart metering has not been provided by the NRA
Hungary The primary laws that enable smart metering for gas is the ‘Natural Gas Act XL of 2008’. The ‘Government Decree No. 26/2016’ is currently the delegated law that further implements smart metering deployment for both smart electricity and gas meters.
Ireland The primary law introduced by the Department of Communications, Climate Action and Environment in 2014 that enables smart metering for electricity and gas meters is the ‘Statutory Instrument 426’, transposed into Irish law by way of secondary legislation based on the obligations under the Third Directive.
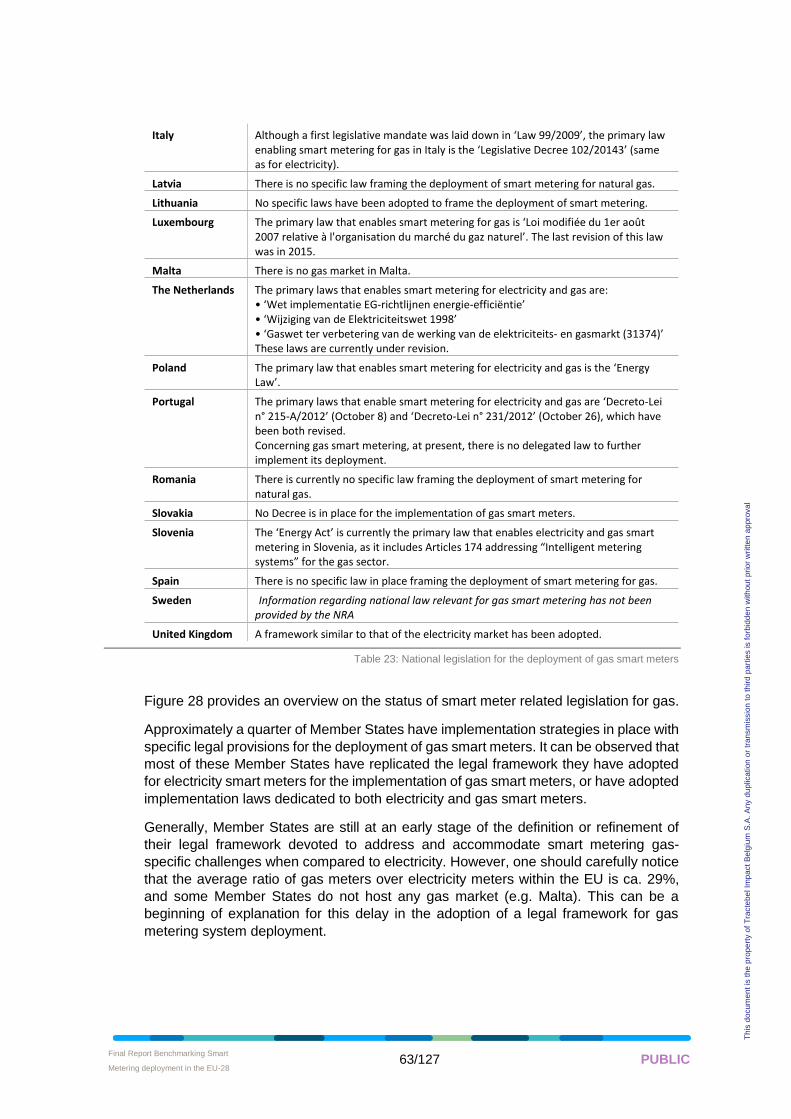
Final Report Benchmarking Smart
Metering deployment in the EU-28 • 63/127 PUBLIC
Th
is d
ocum
en
t is
the
pro
pe
rty o
f T
racte
be
l Im
pa
ct
Be
lgiu
m S
.A.
An
y d
up
lica
tion
or
tra
nsm
issio
n t
o t
hird
pa
rtie
s is f
orb
idd
en
with
ou
t p
rio
r w
ritte
n a
ppro
va
l
Italy Although a first legislative mandate was laid down in ‘Law 99/2009’, the primary law enabling smart metering for gas in Italy is the ‘Legislative Decree 102/20143’ (same as for electricity).
Latvia There is no specific law framing the deployment of smart metering for natural gas.
Lithuania No specific laws have been adopted to frame the deployment of smart metering.
Luxembourg The primary law that enables smart metering for gas is ‘Loi modifiée du 1er août 2007 relative à l'organisation du marché du gaz naturel’. The last revision of this law was in 2015.
Malta There is no gas market in Malta.
The Netherlands The primary laws that enables smart metering for electricity and gas are: • ‘Wet implementatie EG-richtlijnen energie-efficiëntie’ • ‘Wijziging van de Elektriciteitswet 1998’ • ‘Gaswet ter verbetering van de werking van de elektriciteits- en gasmarkt (31374)’ These laws are currently under revision.
Poland The primary law that enables smart metering for electricity and gas is the ‘Energy Law’.
Portugal The primary laws that enable smart metering for electricity and gas are ‘Decreto-Lei n° 215-A/2012’ (October 8) and ‘Decreto-Lei n° 231/2012’ (October 26), which have been both revised. Concerning gas smart metering, at present, there is no delegated law to further implement its deployment.
Romania There is currently no specific law framing the deployment of smart metering for natural gas.
Slovakia No Decree is in place for the implementation of gas smart meters.
Slovenia The ‘Energy Act’ is currently the primary law that enables electricity and gas smart metering in Slovenia, as it includes Articles 174 addressing “Intelligent metering systems” for the gas sector.
Spain There is no specific law in place framing the deployment of smart metering for gas.
Sweden Information regarding national law relevant for gas smart metering has not been provided by the NRA
United Kingdom A framework similar to that of the electricity market has been adopted.
Table 23: National legislation for the deployment of gas smart meters
Figure 28 provides an overview on the status of smart meter related legislation for gas.
Approximately a quarter of Member States have implementation strategies in place with
specific legal provisions for the deployment of gas smart meters. It can be observed that
most of these Member States have replicated the legal framework they have adopted
for electricity smart meters for the implementation of gas smart meters, or have adopted
implementation laws dedicated to both electricity and gas smart meters.
Generally, Member States are still at an early stage of the definition or refinement of
their legal framework devoted to address and accommodate smart metering gas-
specific challenges when compared to electricity. However, one should carefully notice
that the average ratio of gas meters over electricity meters within the EU is ca. 29%,
and some Member States do not host any gas market (e.g. Malta). This can be a
beginning of explanation for this delay in the adoption of a legal framework for gas
metering system deployment.
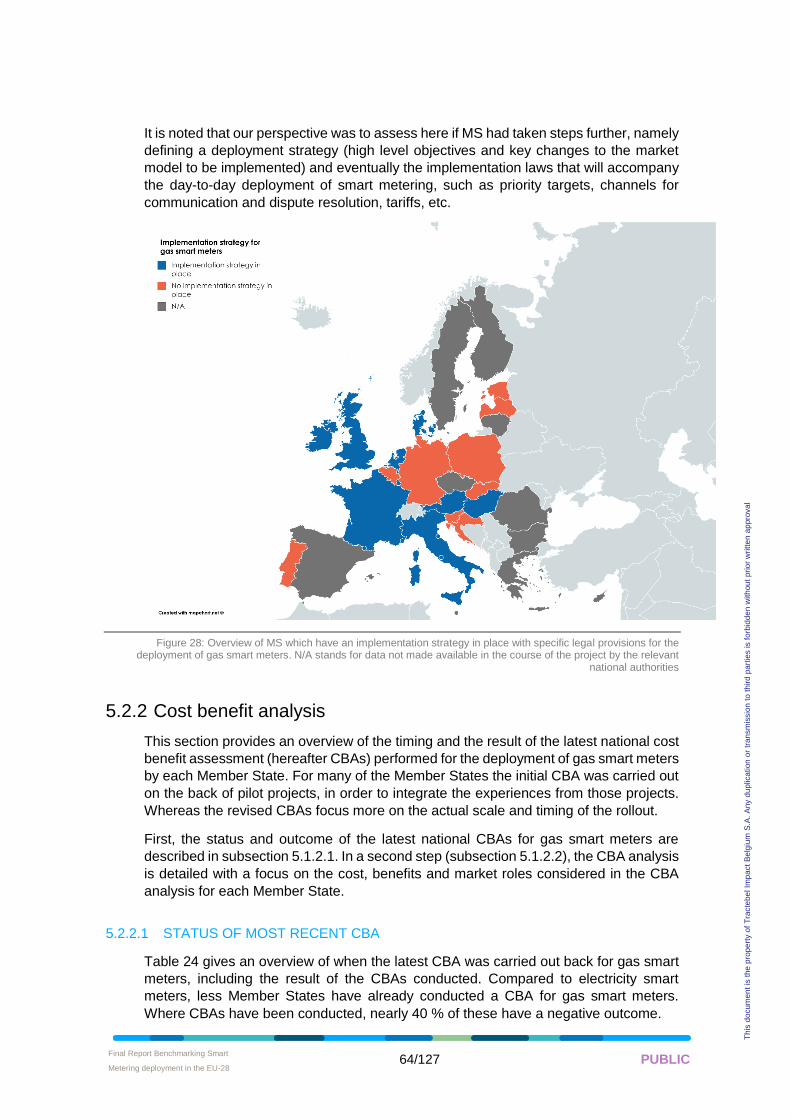
Final Report Benchmarking Smart
Metering deployment in the EU-28 • 64/127 PUBLIC
Th
is d
ocum
en
t is
the
pro
pe
rty o
f T
racte
be
l Im
pa
ct
Be
lgiu
m S
.A.
An
y d
up
lica
tion
or
tra
nsm
issio
n t
o t
hird
pa
rtie
s is f
orb
idd
en
with
ou
t p
rio
r w
ritte
n a
ppro
va
l
It is noted that our perspective was to assess here if MS had taken steps further, namely
defining a deployment strategy (high level objectives and key changes to the market
model to be implemented) and eventually the implementation laws that will accompany
the day-to-day deployment of smart metering, such as priority targets, channels for
communication and dispute resolution, tariffs, etc.
Figure 28: Overview of MS which have an implementation strategy in place with specific legal provisions for the deployment of gas smart meters. N/A stands for data not made available in the course of the project by the relevant
national authorities
5.2.2 Cost benefit analysis
This section provides an overview of the timing and the result of the latest national cost
benefit assessment (hereafter CBAs) performed for the deployment of gas smart meters
by each Member State. For many of the Member States the initial CBA was carried out
on the back of pilot projects, in order to integrate the experiences from those projects.
Whereas the revised CBAs focus more on the actual scale and timing of the rollout.
First, the status and outcome of the latest national CBAs for gas smart meters are
described in subsection 5.1.2.1. In a second step (subsection 5.1.2.2), the CBA analysis
is detailed with a focus on the cost, benefits and market roles considered in the CBA
analysis for each Member State.
5.2.2.1 STATUS OF MOST RECENT CBA
Table 24 gives an overview of when the latest CBA was carried out back for gas smart
meters, including the result of the CBAs conducted. Compared to electricity smart
meters, less Member States have already conducted a CBA for gas smart meters.
Where CBAs have been conducted, nearly 40 % of these have a negative outcome.
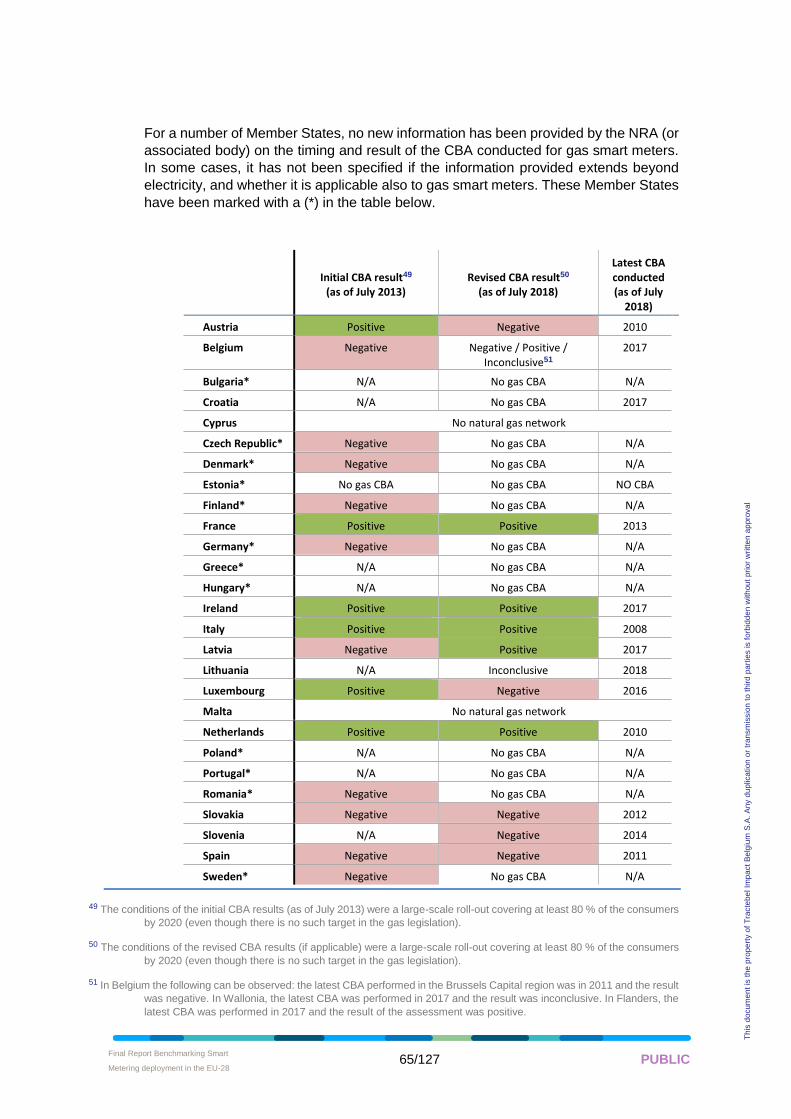
Final Report Benchmarking Smart
Metering deployment in the EU-28 • 65/127 PUBLIC
Th
is d
ocum
en
t is
the
pro
pe
rty o
f T
racte
be
l Im
pa
ct
Be
lgiu
m S
.A.
An
y d
up
lica
tion
or
tra
nsm
issio
n t
o t
hird
pa
rtie
s is f
orb
idd
en
with
ou
t p
rio
r w
ritte
n a
ppro
va
l
For a number of Member States, no new information has been provided by the NRA (or
associated body) on the timing and result of the CBA conducted for gas smart meters.
In some cases, it has not been specified if the information provided extends beyond
electricity, and whether it is applicable also to gas smart meters. These Member States
have been marked with a (*) in the table below.
Initial CBA result49 (as of July 2013)
Revised CBA result50 (as of July 2018)
Latest CBA conducted (as of July
2018)
Austria Positive Negative 2010
Belgium Negative Negative / Positive / Inconclusive51
2017
Bulgaria* N/A No gas CBA N/A
Croatia N/A No gas CBA 2017
Cyprus No natural gas network
Czech Republic* Negative No gas CBA N/A
Denmark* Negative No gas CBA N/A
Estonia* No gas CBA No gas CBA NO CBA
Finland* Negative No gas CBA N/A
France Positive Positive 2013
Germany* Negative No gas CBA N/A
Greece* N/A No gas CBA N/A
Hungary* N/A No gas CBA N/A
Ireland Positive Positive 2017
Italy Positive Positive 2008
Latvia Negative Positive 2017
Lithuania N/A Inconclusive 2018
Luxembourg Positive Negative 2016
Malta No natural gas network
Netherlands Positive Positive 2010
Poland* N/A No gas CBA N/A
Portugal* N/A No gas CBA N/A
Romania* Negative No gas CBA N/A
Slovakia Negative Negative 2012
Slovenia N/A Negative 2014
Spain Negative Negative 2011
Sweden* Negative No gas CBA N/A
49 The conditions of the initial CBA results (as of July 2013) were a large-scale roll-out covering at least 80 % of the consumers
by 2020 (even though there is no such target in the gas legislation).
50 The conditions of the revised CBA results (if applicable) were a large-scale roll-out covering at least 80 % of the consumers
by 2020 (even though there is no such target in the gas legislation).
51 In Belgium the following can be observed: the latest CBA performed in the Brussels Capital region was in 2011 and the result
was negative. In Wallonia, the latest CBA was performed in 2017 and the result was inconclusive. In Flanders, the
latest CBA was performed in 2017 and the result of the assessment was positive.
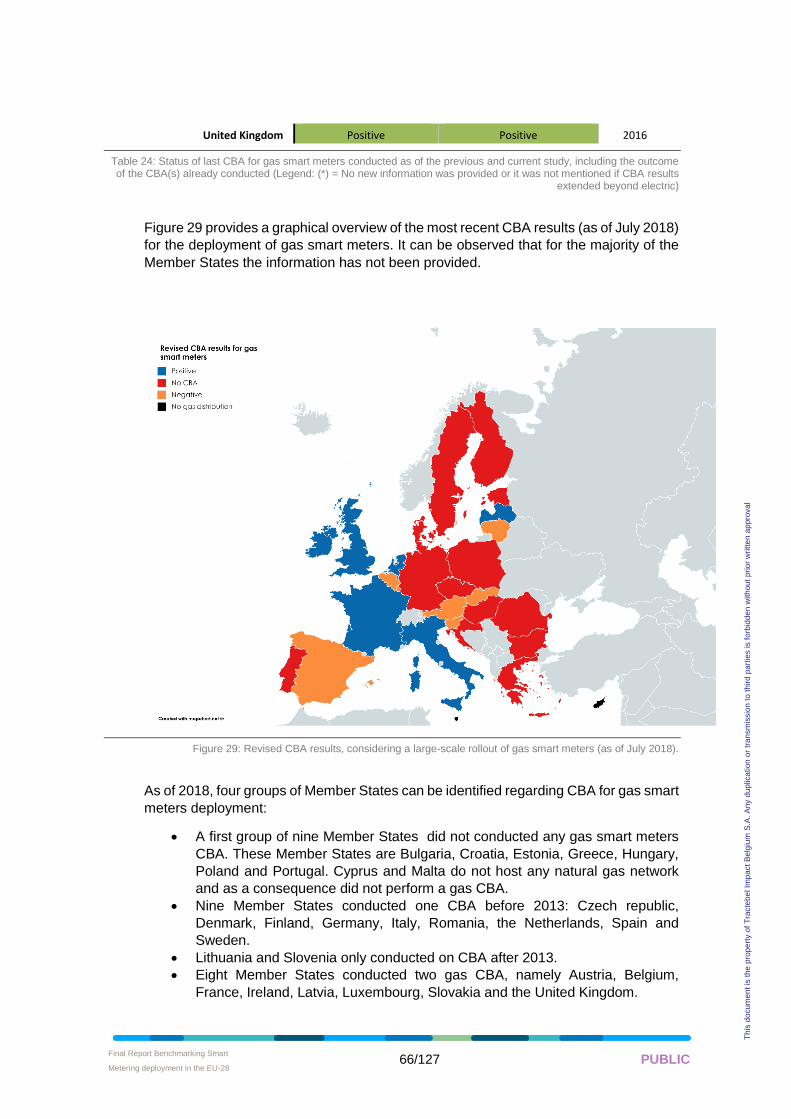
Final Report Benchmarking Smart
Metering deployment in the EU-28 • 66/127 PUBLIC
Th
is d
ocum
en
t is
the
pro
pe
rty o
f T
racte
be
l Im
pa
ct
Be
lgiu
m S
.A.
An
y d
up
lica
tion
or
tra
nsm
issio
n t
o t
hird
pa
rtie
s is f
orb
idd
en
with
ou
t p
rio
r w
ritte
n a
ppro
va
l
United Kingdom Positive Positive 2016
Table 24: Status of last CBA for gas smart meters conducted as of the previous and current study, including the outcome of the CBA(s) already conducted (Legend: (*) = No new information was provided or it was not mentioned if CBA results
extended beyond electric)
Figure 29 provides a graphical overview of the most recent CBA results (as of July 2018)
for the deployment of gas smart meters. It can be observed that for the majority of the
Member States the information has not been provided.
Figure 29: Revised CBA results, considering a large-scale rollout of gas smart meters (as of July 2018).
As of 2018, four groups of Member States can be identified regarding CBA for gas smart
meters deployment:
• A first group of nine Member States did not conducted any gas smart meters
CBA. These Member States are Bulgaria, Croatia, Estonia, Greece, Hungary,
Poland and Portugal. Cyprus and Malta do not host any natural gas network
and as a consequence did not perform a gas CBA.
• Nine Member States conducted one CBA before 2013: Czech republic,
Denmark, Finland, Germany, Italy, Romania, the Netherlands, Spain and
Sweden.
• Lithuania and Slovenia only conducted on CBA after 2013.
• Eight Member States conducted two gas CBA, namely Austria, Belgium,
France, Ireland, Latvia, Luxembourg, Slovakia and the United Kingdom.
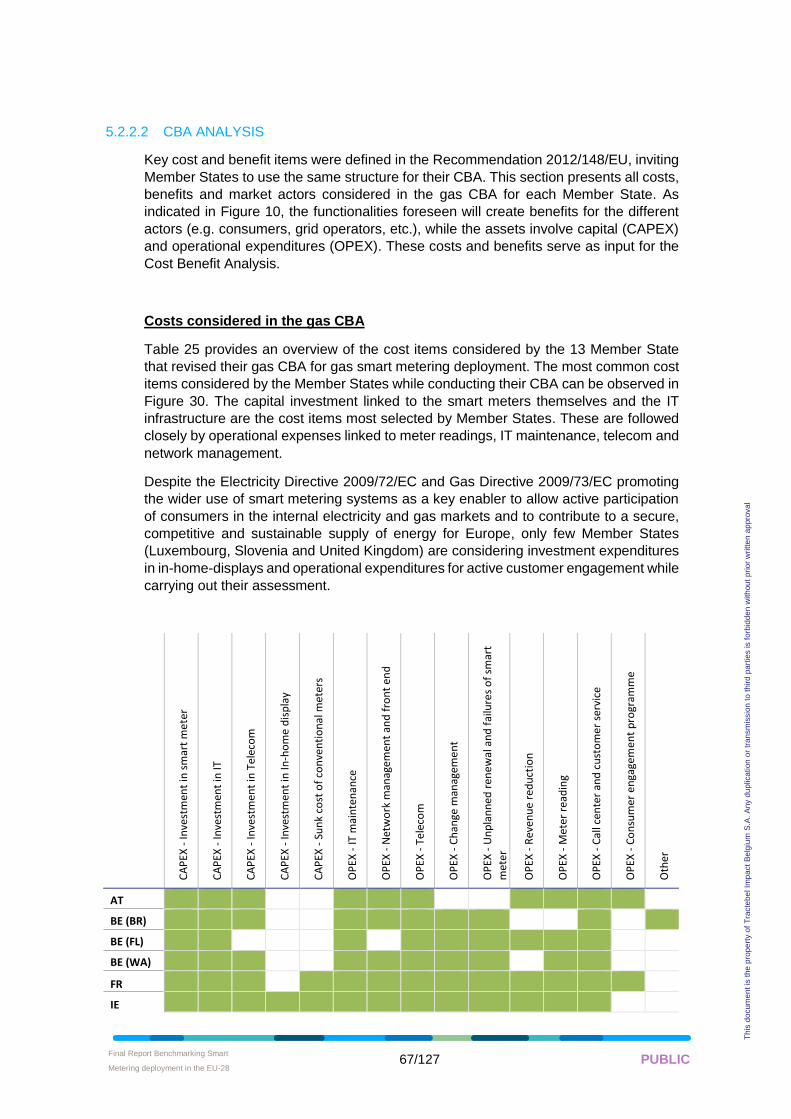
Final Report Benchmarking Smart
Metering deployment in the EU-28 • 67/127 PUBLIC
Th
is d
ocum
en
t is
the
pro
pe
rty o
f T
racte
be
l Im
pa
ct
Be
lgiu
m S
.A.
An
y d
up
lica
tion
or
tra
nsm
issio
n t
o t
hird
pa
rtie
s is f
orb
idd
en
with
ou
t p
rio
r w
ritte
n a
ppro
va
l
5.2.2.2 CBA ANALYSIS
Key cost and benefit items were defined in the Recommendation 2012/148/EU, inviting
Member States to use the same structure for their CBA. This section presents all costs,
benefits and market actors considered in the gas CBA for each Member State. As
indicated in Figure 10, the functionalities foreseen will create benefits for the different
actors (e.g. consumers, grid operators, etc.), while the assets involve capital (CAPEX)
and operational expenditures (OPEX). These costs and benefits serve as input for the
Cost Benefit Analysis.
Costs considered in the gas CBA
Table 25 provides an overview of the cost items considered by the 13 Member State
that revised their gas CBA for gas smart metering deployment. The most common cost
items considered by the Member States while conducting their CBA can be observed in
Figure 30. The capital investment linked to the smart meters themselves and the IT
infrastructure are the cost items most selected by Member States. These are followed
closely by operational expenses linked to meter readings, IT maintenance, telecom and
network management.
Despite the Electricity Directive 2009/72/EC and Gas Directive 2009/73/EC promoting
the wider use of smart metering systems as a key enabler to allow active participation
of consumers in the internal electricity and gas markets and to contribute to a secure,
competitive and sustainable supply of energy for Europe, only few Member States
(Luxembourg, Slovenia and United Kingdom) are considering investment expenditures
in in-home-displays and operational expenditures for active customer engagement while
carrying out their assessment.
CA
PEX
- In
vest
men
t in
sm
art
me
ter
CA
PEX
- In
vest
men
t in
IT
CA
PEX
- In
vest
men
t in
Tel
eco
m
CA
PEX
- In
vest
men
t in
In-h
om
e d
isp
lay
CA
PEX
- S
un
k co
st o
f co
nve
nti
on
al m
eter
s
OP
EX -
IT m
ain
ten
ance
OP
EX -
Net
wo
rk m
anag
emen
t an
d f
ron
t en
d
OP
EX -
Tel
eco
m
OP
EX -
Ch
ange
man
agem
en
t
OP
EX -
Un
pla
nn
ed r
enew
al a
nd
fai
lure
s o
f sm
art
met
er
OP
EX -
Rev
enu
e re
du
ctio
n
OP
EX -
Met
er r
ead
ing
OP
EX -
Cal
l cen
ter
and
cu
sto
mer
ser
vice
OP
EX -
Co
nsu
mer
en
gage
men
t p
rogr
amm
e
Oth
er
AT
BE (BR)
BE (FL)
BE (WA)
FR
IE
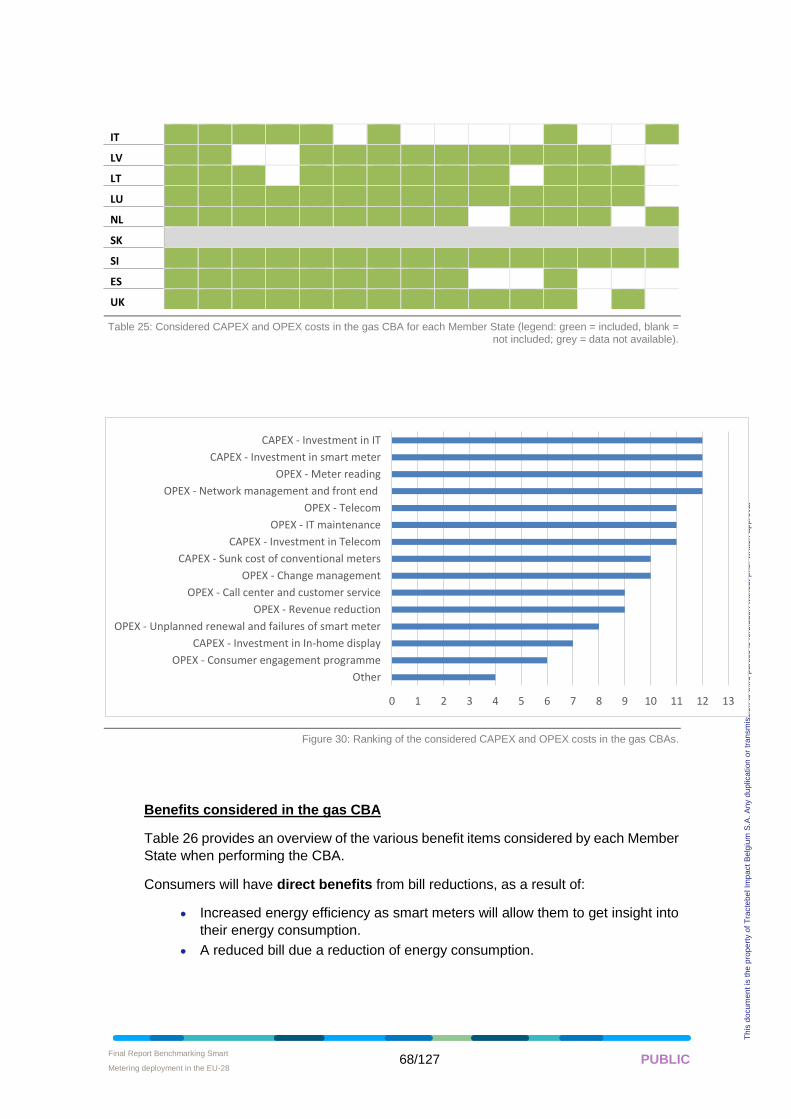
Final Report Benchmarking Smart
Metering deployment in the EU-28 • 68/127 PUBLIC
Th
is d
ocum
en
t is
the
pro
pe
rty o
f T
racte
be
l Im
pa
ct
Be
lgiu
m S
.A.
An
y d
up
lica
tion
or
tra
nsm
issio
n t
o t
hird
pa
rtie
s is f
orb
idd
en
with
ou
t p
rio
r w
ritte
n a
ppro
va
l
IT
LV
LT
LU
NL
SK
SI
ES
UK
Table 25: Considered CAPEX and OPEX costs in the gas CBA for each Member State (legend: green = included, blank = not included; grey = data not available).
Figure 30: Ranking of the considered CAPEX and OPEX costs in the gas CBAs.
Benefits considered in the gas CBA
Table 26 provides an overview of the various benefit items considered by each Member
State when performing the CBA.
Consumers will have direct benefits from bill reductions, as a result of:
• Increased energy efficiency as smart meters will allow them to get insight into
their energy consumption.
• A reduced bill due a reduction of energy consumption.
0 1 2 3 4 5 6 7 8 9 10 11 12 13
Other
OPEX - Consumer engagement programme
CAPEX - Investment in In-home display
OPEX - Unplanned renewal and failures of smart meter
OPEX - Revenue reduction
OPEX - Call center and customer service
OPEX - Change management
CAPEX - Sunk cost of conventional meters
CAPEX - Investment in Telecom
OPEX - IT maintenance
OPEX - Telecom
OPEX - Network management and front end
OPEX - Meter reading
CAPEX - Investment in smart meter
CAPEX - Investment in IT
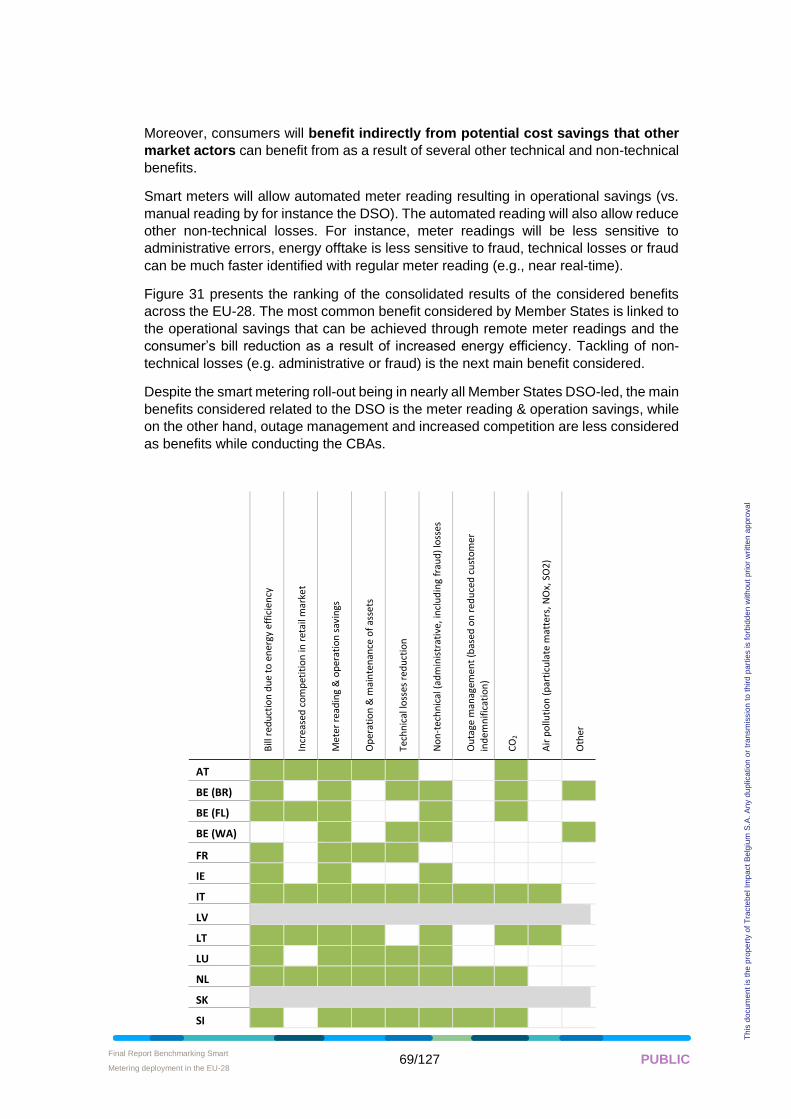
Final Report Benchmarking Smart
Metering deployment in the EU-28 • 69/127 PUBLIC
Th
is d
ocum
en
t is
the
pro
pe
rty o
f T
racte
be
l Im
pa
ct
Be
lgiu
m S
.A.
An
y d
up
lica
tion
or
tra
nsm
issio
n t
o t
hird
pa
rtie
s is f
orb
idd
en
with
ou
t p
rio
r w
ritte
n a
ppro
va
l
Moreover, consumers will benefit indirectly from potential cost savings that other
market actors can benefit from as a result of several other technical and non-technical
benefits.
Smart meters will allow automated meter reading resulting in operational savings (vs.
manual reading by for instance the DSO). The automated reading will also allow reduce
other non-technical losses. For instance, meter readings will be less sensitive to
administrative errors, energy offtake is less sensitive to fraud, technical losses or fraud
can be much faster identified with regular meter reading (e.g., near real-time).
Figure 31 presents the ranking of the consolidated results of the considered benefits
across the EU-28. The most common benefit considered by Member States is linked to
the operational savings that can be achieved through remote meter readings and the
consumer’s bill reduction as a result of increased energy efficiency. Tackling of non-
technical losses (e.g. administrative or fraud) is the next main benefit considered.
Despite the smart metering roll-out being in nearly all Member States DSO-led, the main
benefits considered related to the DSO is the meter reading & operation savings, while
on the other hand, outage management and increased competition are less considered
as benefits while conducting the CBAs.
Bill
red
uct
ion
du
e to
en
ergy
eff
icie
ncy
Incr
ease
d c
om
pet
itio
n in
ret
ail m
arke
t
Met
er r
ead
ing
& o
per
atio
n s
avin
gs
Op
erat
ion
& m
ain
ten
ance
of
asse
ts
Tech
nic
al lo
sses
red
uct
ion
No
n-t
ech
nic
al (
adm
inis
trat
ive,
incl
ud
ing
frau
d)
loss
es
Ou
tage
man
agem
ent
(bas
ed o
n r
edu
ced
cu
sto
mer
ind
emn
ific
atio
n)
CO
2
Air
po
lluti
on
(p
arti
cula
te m
atte
rs, N
Ox,
SO
2)
Oth
er
AT
BE (BR)
BE (FL)
BE (WA)
FR
IE
IT
LV
LT
LU
NL
SK
SI
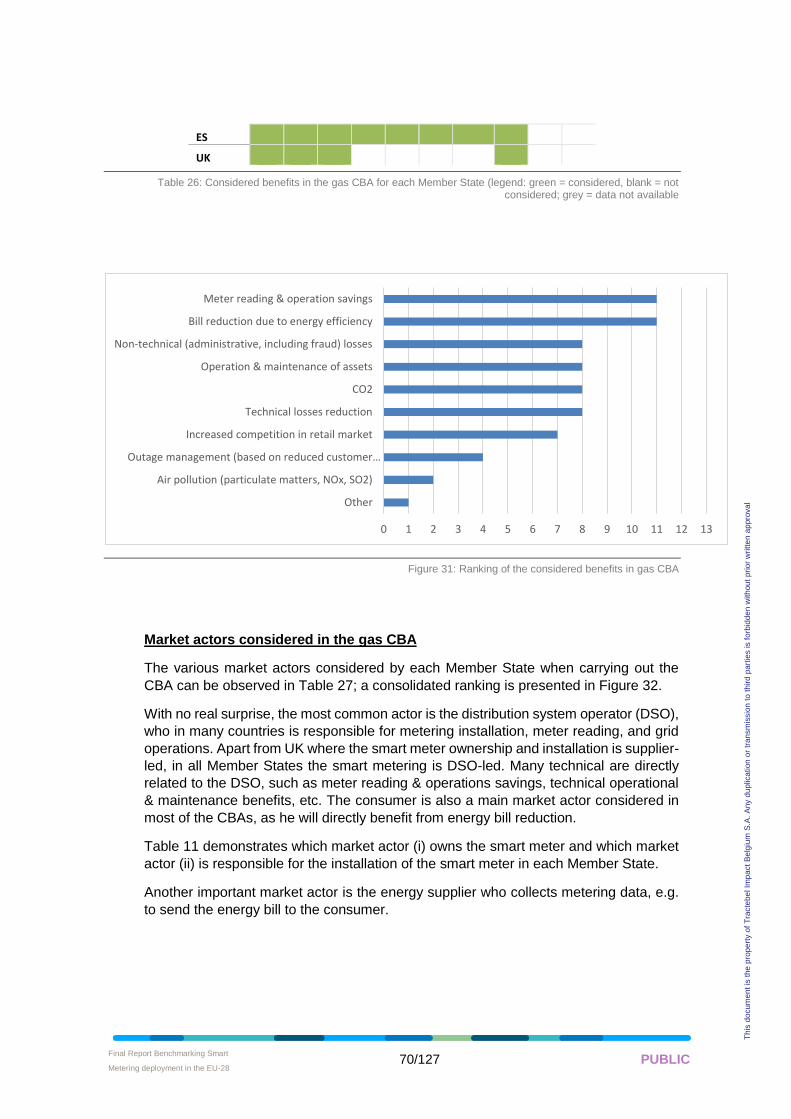
Final Report Benchmarking Smart
Metering deployment in the EU-28 • 70/127 PUBLIC
Th
is d
ocum
en
t is
the
pro
pe
rty o
f T
racte
be
l Im
pa
ct
Be
lgiu
m S
.A.
An
y d
up
lica
tion
or
tra
nsm
issio
n t
o t
hird
pa
rtie
s is f
orb
idd
en
with
ou
t p
rio
r w
ritte
n a
ppro
va
l
ES
UK
Table 26: Considered benefits in the gas CBA for each Member State (legend: green = considered, blank = not considered; grey = data not available
Figure 31: Ranking of the considered benefits in gas CBA
Market actors considered in the gas CBA
The various market actors considered by each Member State when carrying out the
CBA can be observed in Table 27; a consolidated ranking is presented in Figure 32.
With no real surprise, the most common actor is the distribution system operator (DSO),
who in many countries is responsible for metering installation, meter reading, and grid
operations. Apart from UK where the smart meter ownership and installation is supplier-
led, in all Member States the smart metering is DSO-led. Many technical are directly
related to the DSO, such as meter reading & operations savings, technical operational
& maintenance benefits, etc. The consumer is also a main market actor considered in
most of the CBAs, as he will directly benefit from energy bill reduction.
Table 11 demonstrates which market actor (i) owns the smart meter and which market
actor (ii) is responsible for the installation of the smart meter in each Member State.
Another important market actor is the energy supplier who collects metering data, e.g.
to send the energy bill to the consumer.
0 1 2 3 4 5 6 7 8 9 10 11 12 13
Other
Air pollution (particulate matters, NOx, SO2)
Outage management (based on reduced customer…
Increased competition in retail market
Technical losses reduction
CO2
Operation & maintenance of assets
Non-technical (administrative, including fraud) losses
Bill reduction due to energy efficiency
Meter reading & operation savings
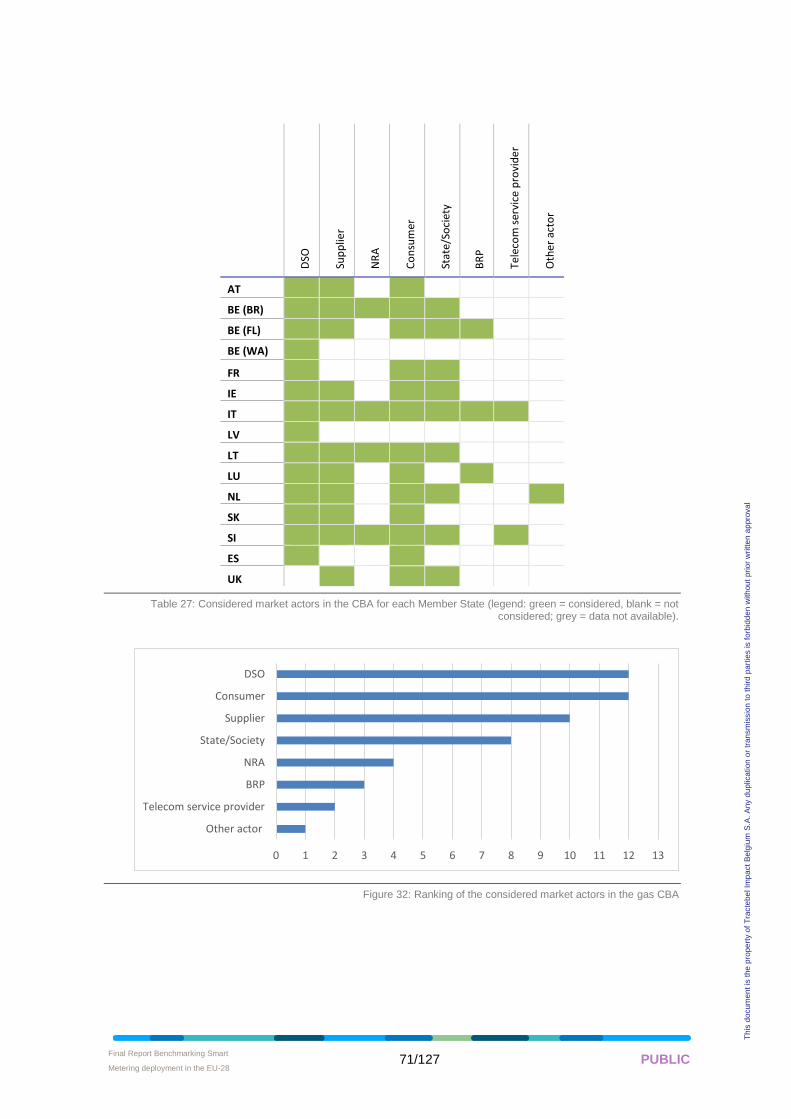
Final Report Benchmarking Smart
Metering deployment in the EU-28 • 71/127 PUBLIC
Th
is d
ocum
en
t is
the
pro
pe
rty o
f T
racte
be
l Im
pa
ct
Be
lgiu
m S
.A.
An
y d
up
lica
tion
or
tra
nsm
issio
n t
o t
hird
pa
rtie
s is f
orb
idd
en
with
ou
t p
rio
r w
ritte
n a
ppro
va
l
DSO
Sup
plie
r
NR
A
Co
nsu
mer
Stat
e/So
ciet
y
BR
P
Tele
com
ser
vice
pro
vid
er
Oth
er a
cto
r
AT
BE (BR)
BE (FL)
BE (WA)
FR
IE
IT
LV
LT
LU
NL
SK
SI
ES
UK
Table 27: Considered market actors in the CBA for each Member State (legend: green = considered, blank = not considered; grey = data not available).
Figure 32: Ranking of the considered market actors in the gas CBA
0 1 2 3 4 5 6 7 8 9 10 11 12 13
Other actor
Telecom service provider
BRP
NRA
State/Society
Supplier
Consumer
DSO
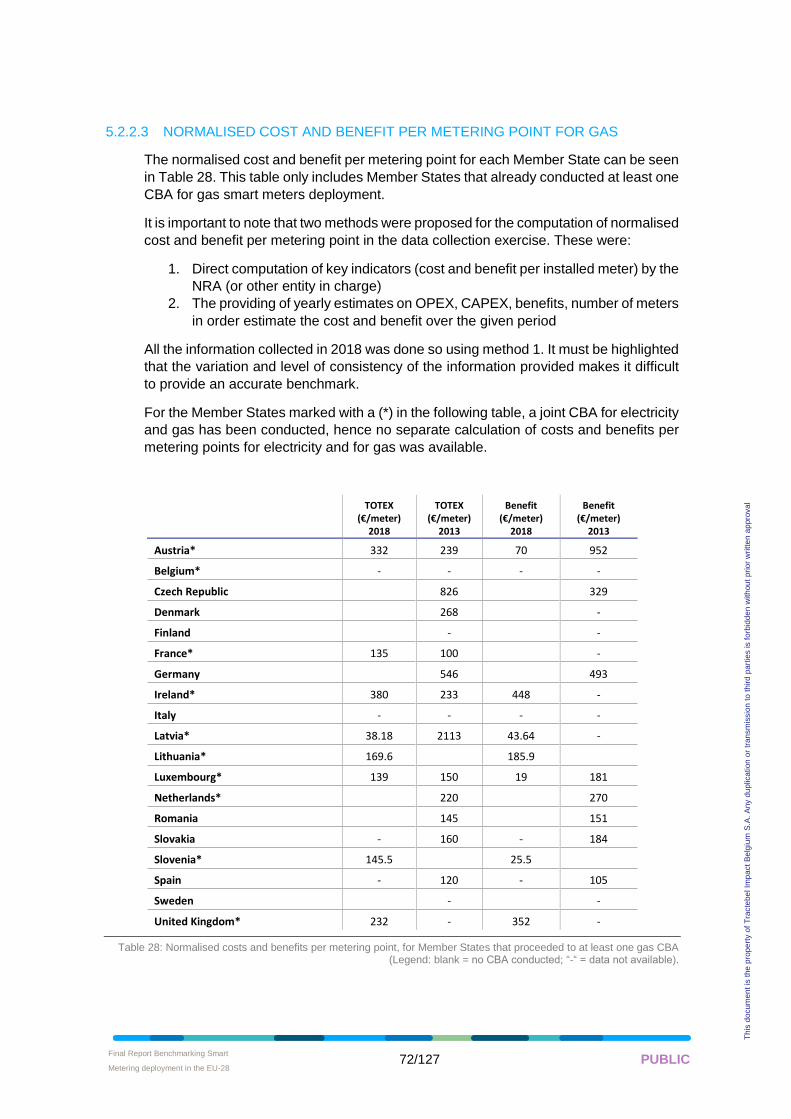
Final Report Benchmarking Smart
Metering deployment in the EU-28 • 72/127 PUBLIC
Th
is d
ocum
en
t is
the
pro
pe
rty o
f T
racte
be
l Im
pa
ct
Be
lgiu
m S
.A.
An
y d
up
lica
tion
or
tra
nsm
issio
n t
o t
hird
pa
rtie
s is f
orb
idd
en
with
ou
t p
rio
r w
ritte
n a
ppro
va
l
5.2.2.3 NORMALISED COST AND BENEFIT PER METERING POINT FOR GAS
The normalised cost and benefit per metering point for each Member State can be seen
in Table 28. This table only includes Member States that already conducted at least one
CBA for gas smart meters deployment.
It is important to note that two methods were proposed for the computation of normalised
cost and benefit per metering point in the data collection exercise. These were:
1. Direct computation of key indicators (cost and benefit per installed meter) by the
NRA (or other entity in charge)
2. The providing of yearly estimates on OPEX, CAPEX, benefits, number of meters
in order estimate the cost and benefit over the given period
All the information collected in 2018 was done so using method 1. It must be highlighted
that the variation and level of consistency of the information provided makes it difficult
to provide an accurate benchmark.
For the Member States marked with a (*) in the following table, a joint CBA for electricity
and gas has been conducted, hence no separate calculation of costs and benefits per
metering points for electricity and for gas was available.
TOTEX (€/meter)
2018
TOTEX (€/meter)
2013
Benefit (€/meter)
2018
Benefit (€/meter)
2013
Austria* 332 239 70 952
Belgium* - - - -
Czech Republic 826 329
Denmark 268 -
Finland - -
France* 135 100 -
Germany 546 493
Ireland* 380 233 448 -
Italy - - - -
Latvia* 38.18 2113 43.64 -
Lithuania* 169.6 185.9
Luxembourg* 139 150 19 181
Netherlands* 220 270
Romania 145 151
Slovakia - 160 - 184
Slovenia* 145.5 25.5
Spain - 120 - 105
Sweden - -
United Kingdom* 232 - 352 -
Table 28: Normalised costs and benefits per metering point, for Member States that proceeded to at least one gas CBA (Legend: blank = no CBA conducted; “-“ = data not available).
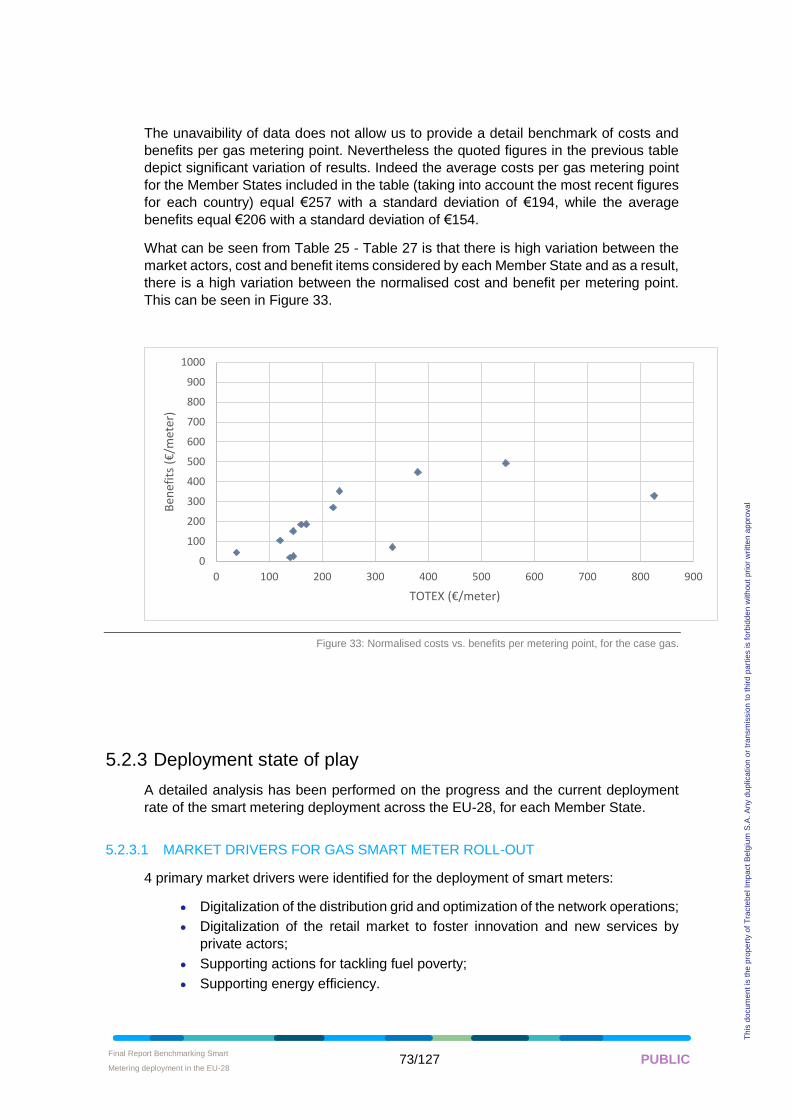
Final Report Benchmarking Smart
Metering deployment in the EU-28 • 73/127 PUBLIC
Th
is d
ocum
en
t is
the
pro
pe
rty o
f T
racte
be
l Im
pa
ct
Be
lgiu
m S
.A.
An
y d
up
lica
tion
or
tra
nsm
issio
n t
o t
hird
pa
rtie
s is f
orb
idd
en
with
ou
t p
rio
r w
ritte
n a
ppro
va
l
The unavaibility of data does not allow us to provide a detail benchmark of costs and
benefits per gas metering point. Nevertheless the quoted figures in the previous table
depict significant variation of results. Indeed the average costs per gas metering point
for the Member States included in the table (taking into account the most recent figures
for each country) equal €257 with a standard deviation of €194, while the average
benefits equal €206 with a standard deviation of €154.
What can be seen from Table 25 - Table 27 is that there is high variation between the
market actors, cost and benefit items considered by each Member State and as a result,
there is a high variation between the normalised cost and benefit per metering point.
This can be seen in Figure 33.
Figure 33: Normalised costs vs. benefits per metering point, for the case gas.
5.2.3 Deployment state of play
A detailed analysis has been performed on the progress and the current deployment
rate of the smart metering deployment across the EU-28, for each Member State.
5.2.3.1 MARKET DRIVERS FOR GAS SMART METER ROLL-OUT
4 primary market drivers were identified for the deployment of smart meters:
• Digitalization of the distribution grid and optimization of the network operations;
• Digitalization of the retail market to foster innovation and new services by
private actors;
• Supporting actions for tackling fuel poverty;
• Supporting energy efficiency.
0
100
200
300
400
500
600
700
800
900
1000
0 100 200 300 400 500 600 700 800 900
Ben
efit
s (€
/met
er)
TOTEX (€/meter)
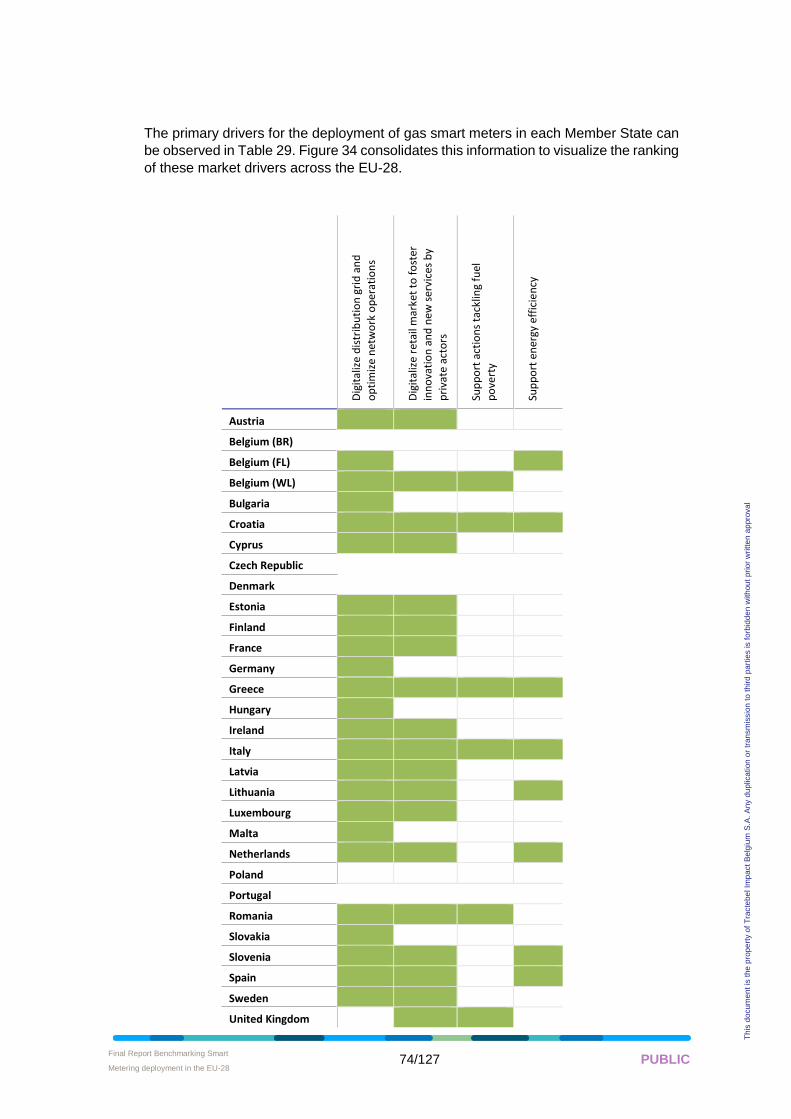
Final Report Benchmarking Smart
Metering deployment in the EU-28 • 74/127 PUBLIC
Th
is d
ocum
en
t is
the
pro
pe
rty o
f T
racte
be
l Im
pa
ct
Be
lgiu
m S
.A.
An
y d
up
lica
tion
or
tra
nsm
issio
n t
o t
hird
pa
rtie
s is f
orb
idd
en
with
ou
t p
rio
r w
ritte
n a
ppro
va
l
The primary drivers for the deployment of gas smart meters in each Member State can
be observed in Table 29. Figure 34 consolidates this information to visualize the ranking
of these market drivers across the EU-28.
Dig
ital
ize
dis
trib
uti
on
gri
d a
nd
op
tim
ize
net
wo
rk o
per
atio
ns
Dig
ital
ize
reta
il m
arke
t to
fo
ster
inn
ova
tio
n a
nd
new
ser
vice
s b
y
pri
vate
act
ors
Sup
po
rt a
ctio
ns
tack
ling
fuel
po
vert
y
Sup
po
rt e
ner
gy e
ffic
ien
cy
Austria
Belgium (BR)
Belgium (FL)
Belgium (WL)
Bulgaria
Croatia
Cyprus
Czech Republic
Denmark
Estonia
Finland
France
Germany
Greece
Hungary
Ireland
Italy
Latvia
Lithuania
Luxembourg
Malta
Netherlands
Poland
Portugal
Romania
Slovakia
Slovenia
Spain
Sweden
United Kingdom
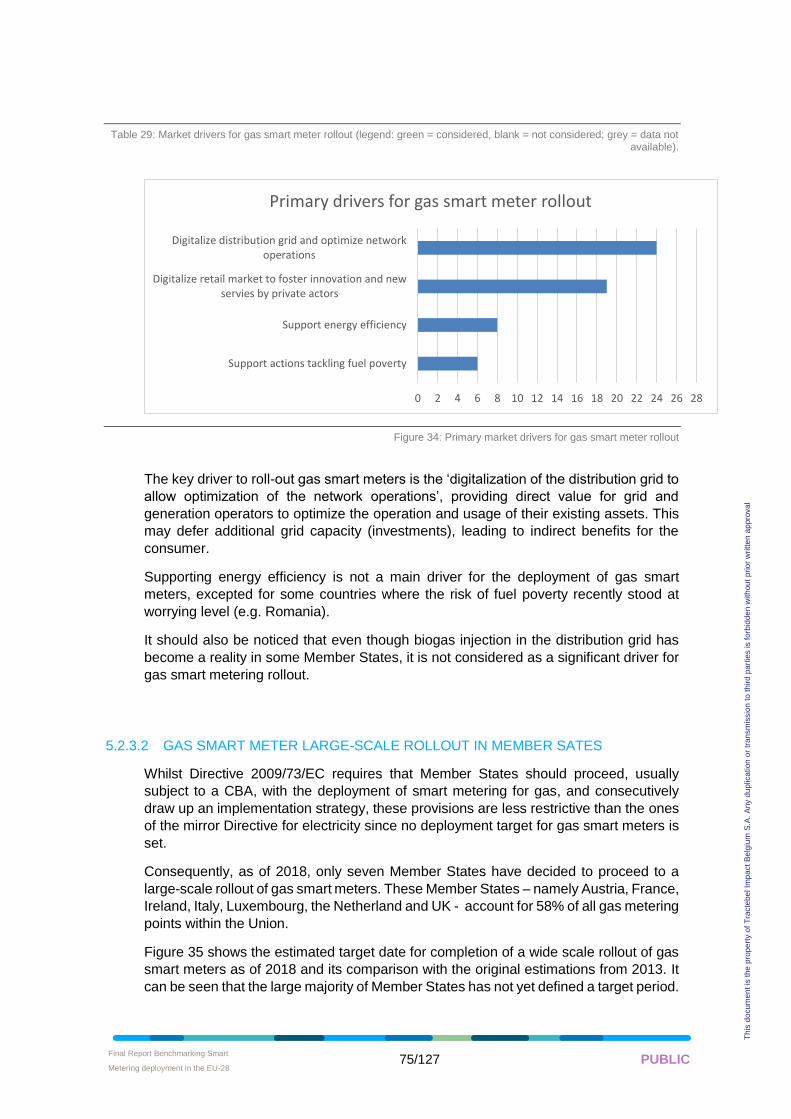
Final Report Benchmarking Smart
Metering deployment in the EU-28 • 75/127 PUBLIC
Th
is d
ocum
en
t is
the
pro
pe
rty o
f T
racte
be
l Im
pa
ct
Be
lgiu
m S
.A.
An
y d
up
lica
tion
or
tra
nsm
issio
n t
o t
hird
pa
rtie
s is f
orb
idd
en
with
ou
t p
rio
r w
ritte
n a
ppro
va
l
Table 29: Market drivers for gas smart meter rollout (legend: green = considered, blank = not considered; grey = data not available).
Figure 34: Primary market drivers for gas smart meter rollout
The key driver to roll-out gas smart meters is the ‘digitalization of the distribution grid to
allow optimization of the network operations’, providing direct value for grid and
generation operators to optimize the operation and usage of their existing assets. This
may defer additional grid capacity (investments), leading to indirect benefits for the
consumer.
Supporting energy efficiency is not a main driver for the deployment of gas smart
meters, excepted for some countries where the risk of fuel poverty recently stood at
worrying level (e.g. Romania).
It should also be noticed that even though biogas injection in the distribution grid has
become a reality in some Member States, it is not considered as a significant driver for
gas smart metering rollout.
5.2.3.2 GAS SMART METER LARGE-SCALE ROLLOUT IN MEMBER SATES
Whilst Directive 2009/73/EC requires that Member States should proceed, usually
subject to a CBA, with the deployment of smart metering for gas, and consecutively
draw up an implementation strategy, these provisions are less restrictive than the ones
of the mirror Directive for electricity since no deployment target for gas smart meters is
set.
Consequently, as of 2018, only seven Member States have decided to proceed to a
large-scale rollout of gas smart meters. These Member States – namely Austria, France,
Ireland, Italy, Luxembourg, the Netherland and UK - account for 58% of all gas metering
points within the Union.
Figure 35 shows the estimated target date for completion of a wide scale rollout of gas
smart meters as of 2018 and its comparison with the original estimations from 2013. It
can be seen that the large majority of Member States has not yet defined a target period.
0 2 4 6 8 10 12 14 16 18 20 22 24 26 28
Support actions tackling fuel poverty
Support energy efficiency
Digitalize retail market to foster innovation and newservies by private actors
Digitalize distribution grid and optimize networkoperations
Primary drivers for gas smart meter rollout
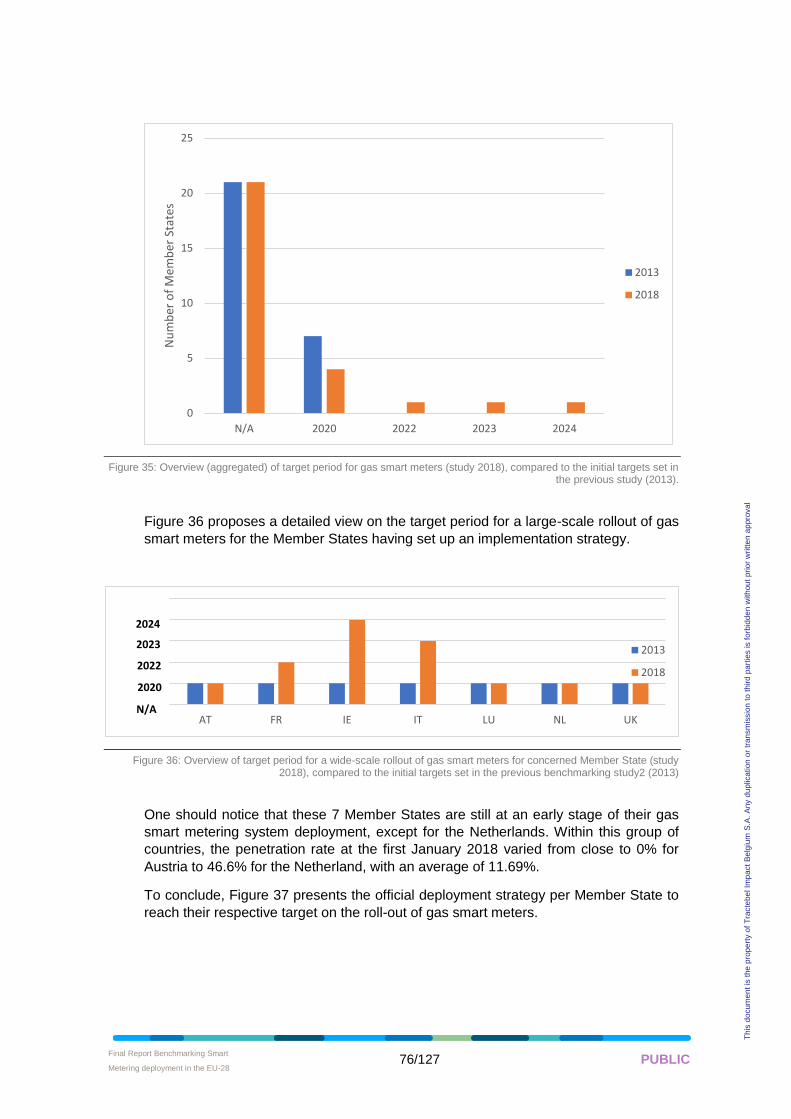
Final Report Benchmarking Smart
Metering deployment in the EU-28 • 76/127 PUBLIC
Th
is d
ocum
en
t is
the
pro
pe
rty o
f T
racte
be
l Im
pa
ct
Be
lgiu
m S
.A.
An
y d
up
lica
tion
or
tra
nsm
issio
n t
o t
hird
pa
rtie
s is f
orb
idd
en
with
ou
t p
rio
r w
ritte
n a
ppro
va
l
Figure 35: Overview (aggregated) of target period for gas smart meters (study 2018), compared to the initial targets set in the previous study (2013).
Figure 36 proposes a detailed view on the target period for a large-scale rollout of gas
smart meters for the Member States having set up an implementation strategy.
Figure 36: Overview of target period for a wide-scale rollout of gas smart meters for concerned Member State (study 2018), compared to the initial targets set in the previous benchmarking study2 (2013)
One should notice that these 7 Member States are still at an early stage of their gas
smart metering system deployment, except for the Netherlands. Within this group of
countries, the penetration rate at the first January 2018 varied from close to 0% for
Austria to 46.6% for the Netherland, with an average of 11.69%.
To conclude, Figure 37 presents the official deployment strategy per Member State to
reach their respective target on the roll-out of gas smart meters.
0
5
10
15
20
25
N/A 2020 2022 2023 2024
Nu
mb
er o
f M
emb
er S
tate
s
2013
2018
AT FR IE IT LU NL UK
2013
2018
N/A
2020
2022
2023
2024
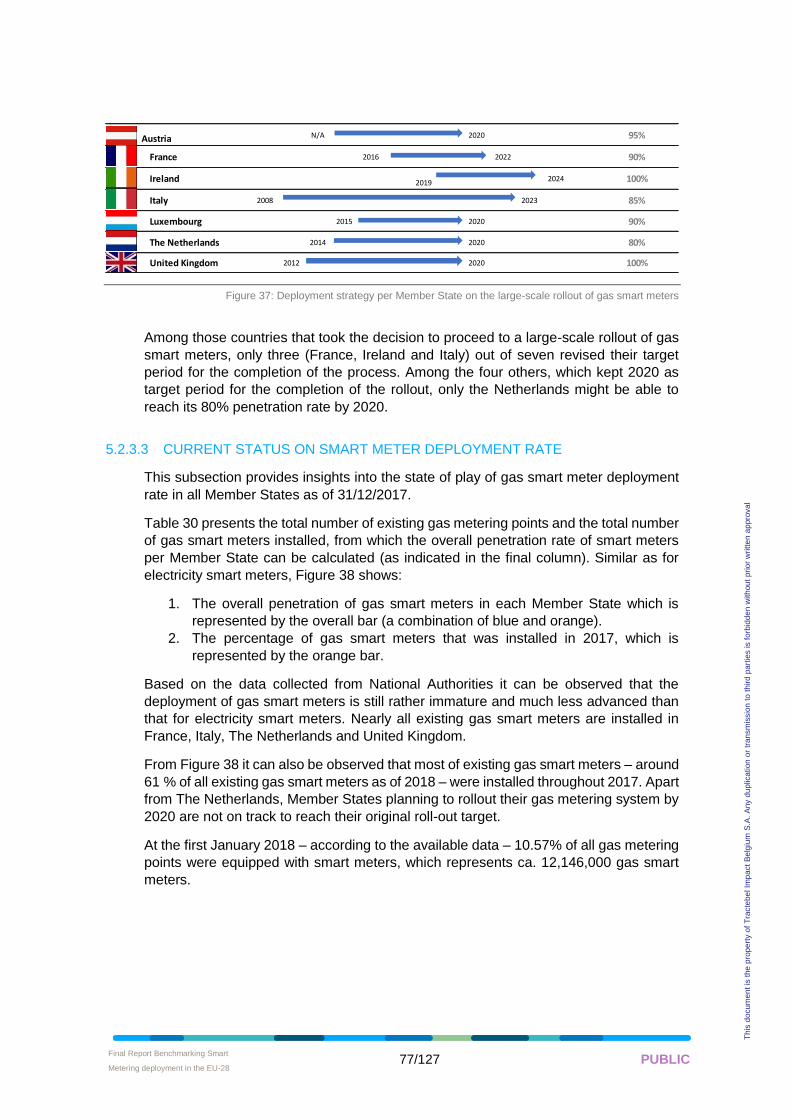
Final Report Benchmarking Smart
Metering deployment in the EU-28 • 77/127 PUBLIC
Th
is d
ocum
en
t is
the
pro
pe
rty o
f T
racte
be
l Im
pa
ct
Be
lgiu
m S
.A.
An
y d
up
lica
tion
or
tra
nsm
issio
n t
o t
hird
pa
rtie
s is f
orb
idd
en
with
ou
t p
rio
r w
ritte
n a
ppro
va
l
Figure 37: Deployment strategy per Member State on the large-scale rollout of gas smart meters
Among those countries that took the decision to proceed to a large-scale rollout of gas
smart meters, only three (France, Ireland and Italy) out of seven revised their target
period for the completion of the process. Among the four others, which kept 2020 as
target period for the completion of the rollout, only the Netherlands might be able to
reach its 80% penetration rate by 2020.
5.2.3.3 CURRENT STATUS ON SMART METER DEPLOYMENT RATE
This subsection provides insights into the state of play of gas smart meter deployment
rate in all Member States as of 31/12/2017.
Table 30 presents the total number of existing gas metering points and the total number
of gas smart meters installed, from which the overall penetration rate of smart meters
per Member State can be calculated (as indicated in the final column). Similar as for
electricity smart meters, Figure 38 shows:
1. The overall penetration of gas smart meters in each Member State which is
represented by the overall bar (a combination of blue and orange).
2. The percentage of gas smart meters that was installed in 2017, which is
represented by the orange bar.
Based on the data collected from National Authorities it can be observed that the
deployment of gas smart meters is still rather immature and much less advanced than
that for electricity smart meters. Nearly all existing gas smart meters are installed in
France, Italy, The Netherlands and United Kingdom.
From Figure 38 it can also be observed that most of existing gas smart meters – around
61 % of all existing gas smart meters as of 2018 – were installed throughout 2017. Apart
from The Netherlands, Member States planning to rollout their gas metering system by
2020 are not on track to reach their original roll-out target.
At the first January 2018 – according to the available data – 10.57% of all gas metering
points were equipped with smart meters, which represents ca. 12,146,000 gas smart
meters.
Austria N/A 2020 95%
France 2016 2022 90%
Ireland 20192024 100%
Italy 2008 2023 85%
Luxembourg 2015 2020 90%
The Netherlands 2014 2020 80%
United Kingdom 2012 2020 100%
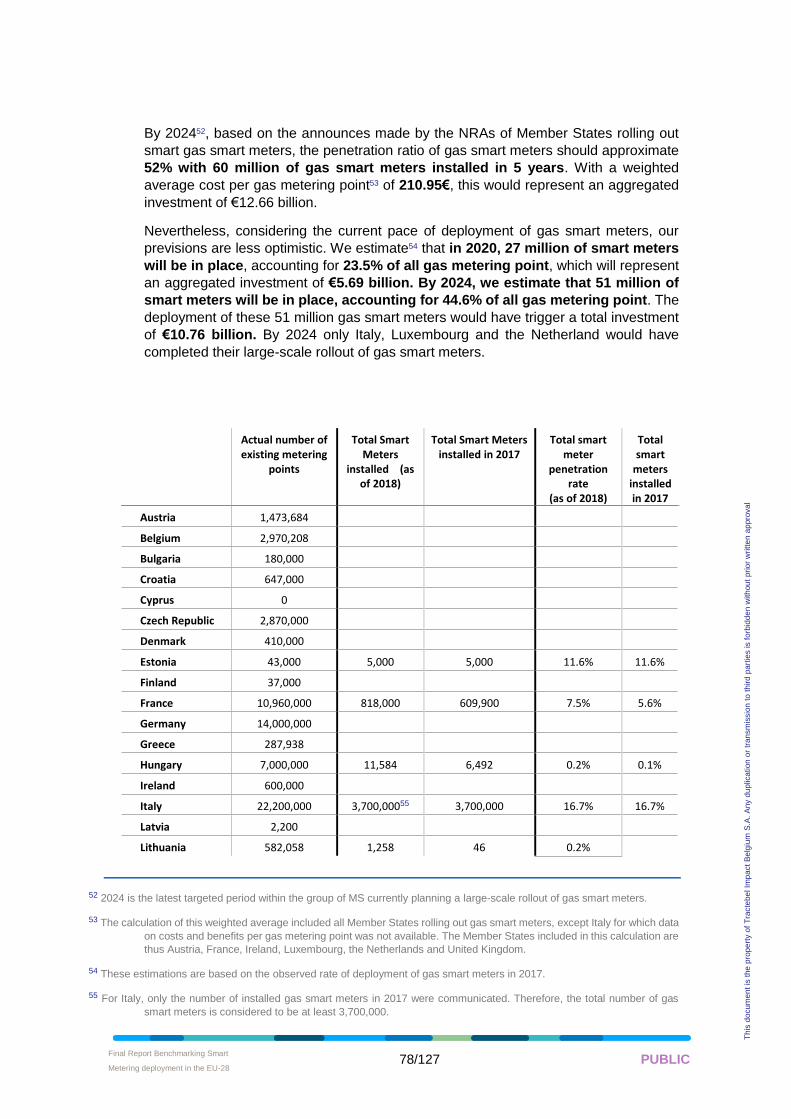
Final Report Benchmarking Smart
Metering deployment in the EU-28 • 78/127 PUBLIC
Th
is d
ocum
en
t is
the
pro
pe
rty o
f T
racte
be
l Im
pa
ct
Be
lgiu
m S
.A.
An
y d
up
lica
tion
or
tra
nsm
issio
n t
o t
hird
pa
rtie
s is f
orb
idd
en
with
ou
t p
rio
r w
ritte
n a
ppro
va
l
By 202452, based on the announces made by the NRAs of Member States rolling out
smart gas smart meters, the penetration ratio of gas smart meters should approximate
52% with 60 million of gas smart meters installed in 5 years. With a weighted
average cost per gas metering point53 of 210.95€, this would represent an aggregated
investment of €12.66 billion.
Nevertheless, considering the current pace of deployment of gas smart meters, our
previsions are less optimistic. We estimate54 that in 2020, 27 million of smart meters
will be in place, accounting for 23.5% of all gas metering point, which will represent
an aggregated investment of €5.69 billion. By 2024, we estimate that 51 million of
smart meters will be in place, accounting for 44.6% of all gas metering point. The
deployment of these 51 million gas smart meters would have trigger a total investment
of €10.76 billion. By 2024 only Italy, Luxembourg and the Netherland would have
completed their large-scale rollout of gas smart meters.
Actual number of existing metering
points
Total Smart Meters
installed (as of 2018)
Total Smart Meters installed in 2017
Total smart meter
penetration rate
(as of 2018)
Total smart
meters installed in 2017
Austria 1,473,684
Belgium 2,970,208
Bulgaria 180,000
Croatia 647,000
Cyprus 0
Czech Republic 2,870,000
Denmark 410,000
Estonia 43,000 5,000 5,000 11.6% 11.6%
Finland 37,000
France 10,960,000 818,000 609,900 7.5% 5.6%
Germany 14,000,000
Greece 287,938
Hungary 7,000,000 11,584 6,492 0.2% 0.1%
Ireland 600,000
Italy 22,200,000 3,700,00055 3,700,000 16.7% 16.7%
Latvia 2,200
Lithuania 582,058 1,258 46 0.2%
52 2024 is the latest targeted period within the group of MS currently planning a large-scale rollout of gas smart meters.
53 The calculation of this weighted average included all Member States rolling out gas smart meters, except Italy for which data
on costs and benefits per gas metering point was not available. The Member States included in this calculation are
thus Austria, France, Ireland, Luxembourg, the Netherlands and United Kingdom.
54 These estimations are based on the observed rate of deployment of gas smart meters in 2017.
55 For Italy, only the number of installed gas smart meters in 2017 were communicated. Therefore, the total number of gas
smart meters is considered to be at least 3,700,000.
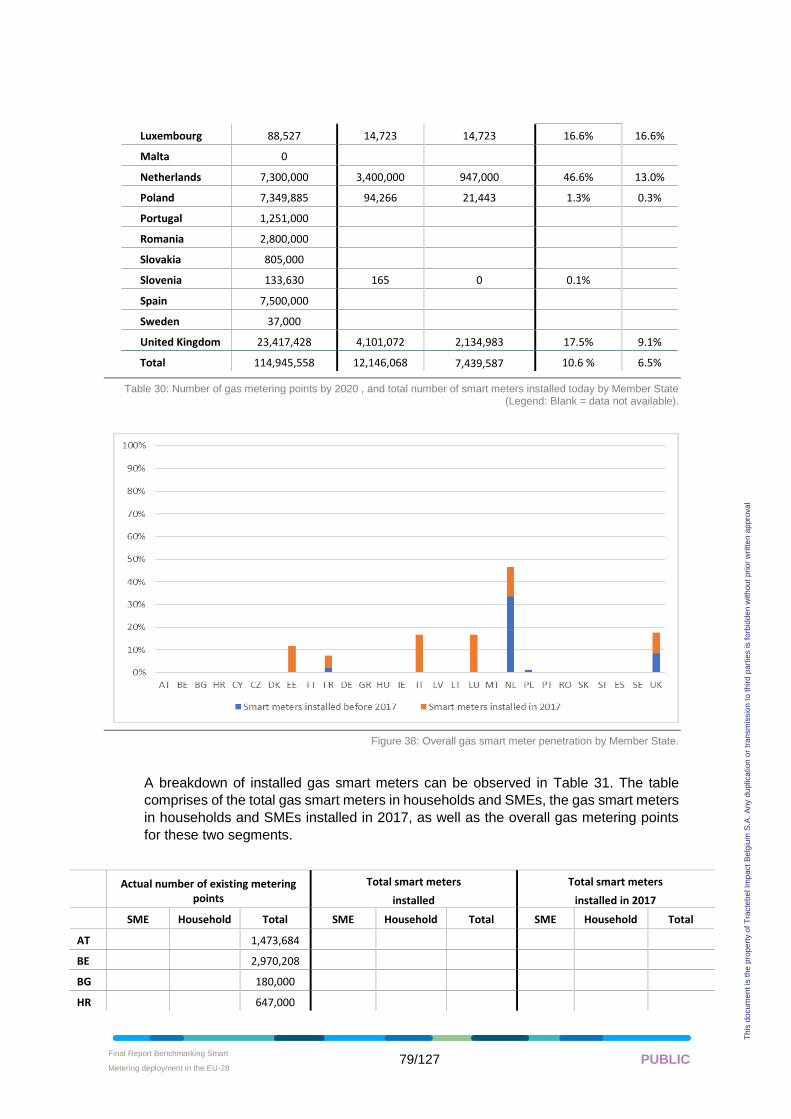
Final Report Benchmarking Smart
Metering deployment in the EU-28 • 79/127 PUBLIC
Th
is d
ocum
en
t is
the
pro
pe
rty o
f T
racte
be
l Im
pa
ct
Be
lgiu
m S
.A.
An
y d
up
lica
tion
or
tra
nsm
issio
n t
o t
hird
pa
rtie
s is f
orb
idd
en
with
ou
t p
rio
r w
ritte
n a
ppro
va
l
Luxembourg 88,527 14,723 14,723 16.6% 16.6%
Malta 0
Netherlands 7,300,000 3,400,000 947,000 46.6% 13.0%
Poland 7,349,885 94,266 21,443 1.3% 0.3%
Portugal 1,251,000
Romania 2,800,000
Slovakia 805,000
Slovenia 133,630 165 0 0.1%
Spain 7,500,000
Sweden 37,000
United Kingdom 23,417,428 4,101,072 2,134,983 17.5% 9.1%
Total 114,945,558 12,146,068 7,439,587 10.6 % 6.5%
Table 30: Number of gas metering points by 2020 , and total number of smart meters installed today by Member State (Legend: Blank = data not available).
Figure 38: Overall gas smart meter penetration by Member State.
A breakdown of installed gas smart meters can be observed in Table 31. The table
comprises of the total gas smart meters in households and SMEs, the gas smart meters
in households and SMEs installed in 2017, as well as the overall gas metering points
for these two segments.
Actual number of existing metering points
Total smart meters
installed
Total smart meters
installed in 2017
SME Household Total SME Household Total SME Household Total
AT 1,473,684
BE 2,970,208
BG 180,000
HR 647,000
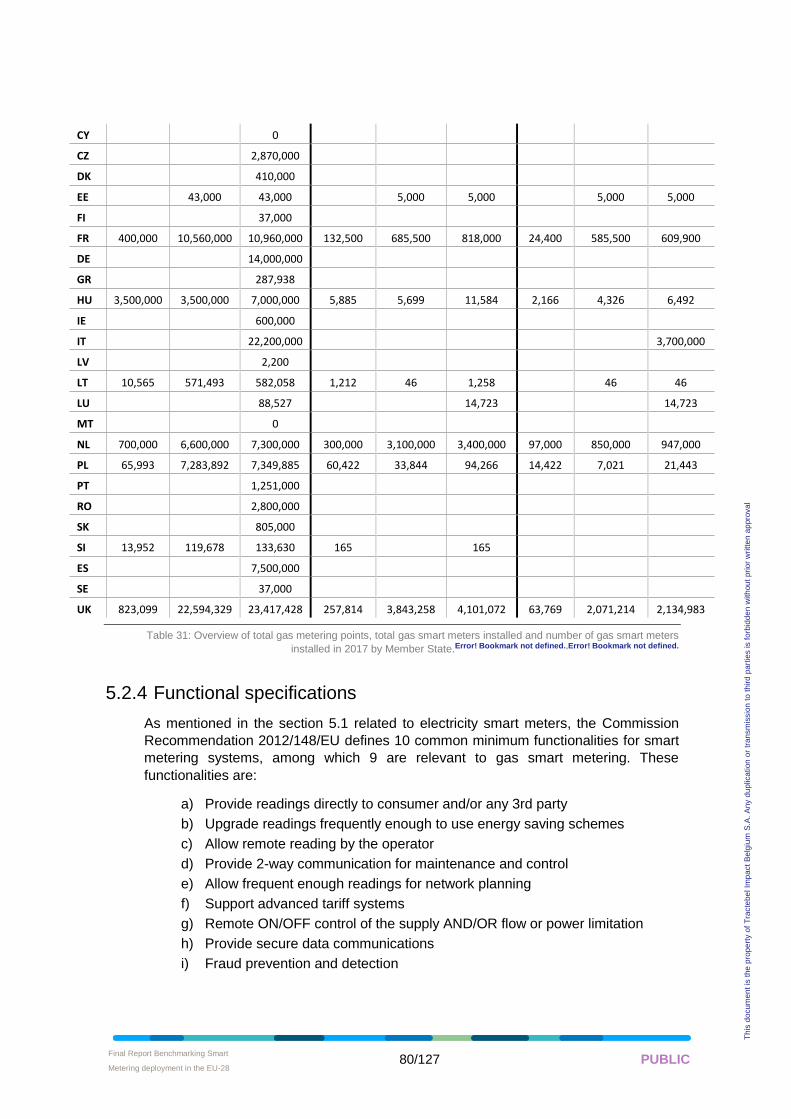
Final Report Benchmarking Smart
Metering deployment in the EU-28 • 80/127 PUBLIC
Th
is d
ocum
en
t is
the
pro
pe
rty o
f T
racte
be
l Im
pa
ct
Be
lgiu
m S
.A.
An
y d
up
lica
tion
or
tra
nsm
issio
n t
o t
hird
pa
rtie
s is f
orb
idd
en
with
ou
t p
rio
r w
ritte
n a
ppro
va
l
CY 0
CZ 2,870,000
DK 410,000
EE 43,000 43,000 5,000 5,000 5,000 5,000
FI 37,000
FR 400,000 10,560,000 10,960,000 132,500 685,500 818,000 24,400 585,500 609,900
DE 14,000,000
GR 287,938
HU 3,500,000 3,500,000 7,000,000 5,885 5,699 11,584 2,166 4,326 6,492
IE 600,000
IT 22,200,000 3,700,000
LV 2,200
LT 10,565 571,493 582,058 1,212 46 1,258 46 46
LU 88,527 14,723 14,723
MT 0
NL 700,000 6,600,000 7,300,000 300,000 3,100,000 3,400,000 97,000 850,000 947,000
PL 65,993 7,283,892 7,349,885 60,422 33,844 94,266 14,422 7,021 21,443
PT 1,251,000
RO 2,800,000
SK 805,000
SI 13,952 119,678 133,630 165 165
ES 7,500,000
SE 37,000
UK 823,099 22,594,329 23,417,428 257,814 3,843,258 4,101,072 63,769 2,071,214 2,134,983
Table 31: Overview of total gas metering points, total gas smart meters installed and number of gas smart meters
installed in 2017 by Member State.Error! Bookmark not defined.,Error! Bookmark not defined.
5.2.4 Functional specifications
As mentioned in the section 5.1 related to electricity smart meters, the Commission
Recommendation 2012/148/EU defines 10 common minimum functionalities for smart
metering systems, among which 9 are relevant to gas smart metering. These
functionalities are:
a) Provide readings directly to consumer and/or any 3rd party
b) Upgrade readings frequently enough to use energy saving schemes
c) Allow remote reading by the operator
d) Provide 2-way communication for maintenance and control
e) Allow frequent enough readings for network planning
f) Support advanced tariff systems
g) Remote ON/OFF control of the supply AND/OR flow or power limitation
h) Provide secure data communications
i) Fraud prevention and detection
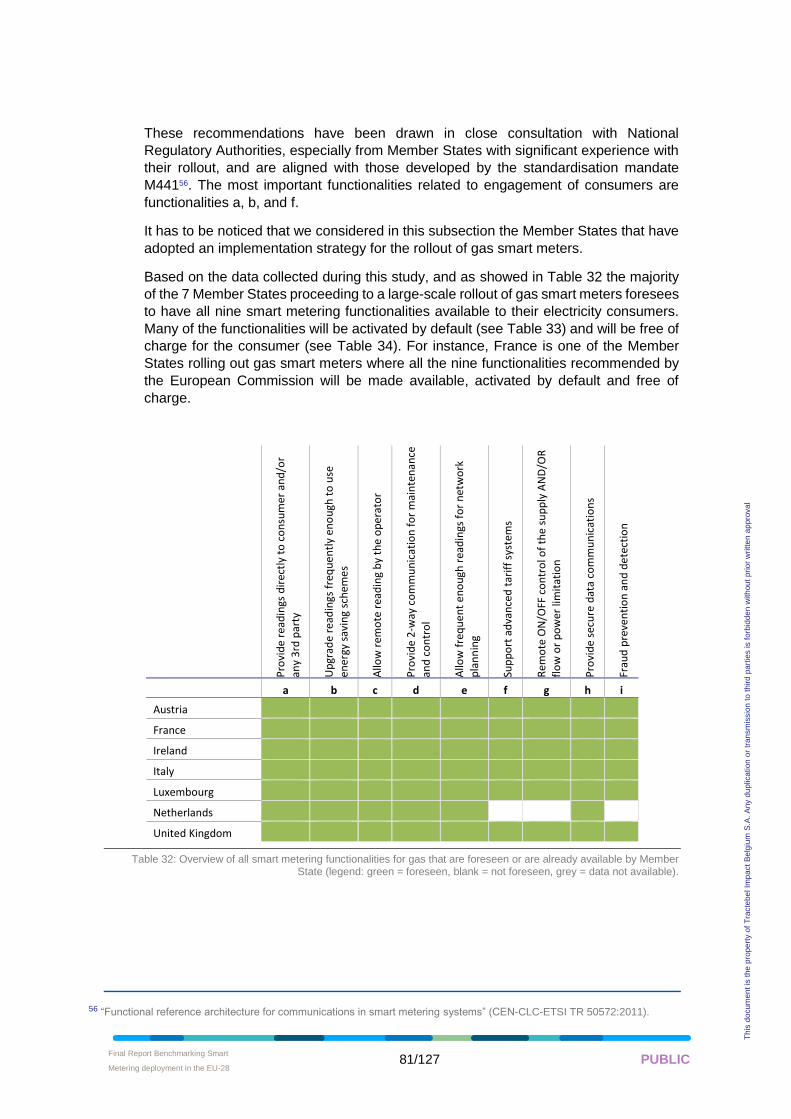
Final Report Benchmarking Smart
Metering deployment in the EU-28 • 81/127 PUBLIC
Th
is d
ocum
en
t is
the
pro
pe
rty o
f T
racte
be
l Im
pa
ct
Be
lgiu
m S
.A.
An
y d
up
lica
tion
or
tra
nsm
issio
n t
o t
hird
pa
rtie
s is f
orb
idd
en
with
ou
t p
rio
r w
ritte
n a
ppro
va
l
These recommendations have been drawn in close consultation with National
Regulatory Authorities, especially from Member States with significant experience with
their rollout, and are aligned with those developed by the standardisation mandate
M44156. The most important functionalities related to engagement of consumers are
functionalities a, b, and f.
It has to be noticed that we considered in this subsection the Member States that have
adopted an implementation strategy for the rollout of gas smart meters.
Based on the data collected during this study, and as showed in Table 32 the majority
of the 7 Member States proceeding to a large-scale rollout of gas smart meters foresees
to have all nine smart metering functionalities available to their electricity consumers.
Many of the functionalities will be activated by default (see Table 33) and will be free of
charge for the consumer (see Table 34). For instance, France is one of the Member
States rolling out gas smart meters where all the nine functionalities recommended by
the European Commission will be made available, activated by default and free of
charge.
Pro
vid
e re
adin
gs d
irec
tly
to c
on
sum
er a
nd
/or
any
3rd
par
ty
Up
grad
e re
adin
gs f
req
ue
ntl
y en
ou
gh t
o u
se
ener
gy s
avin
g sc
hem
es
Allo
w r
emo
te r
ead
ing
by
the
op
era
tor
Pro
vid
e 2
-way
co
mm
un
icat
ion
fo
r m
ain
ten
ance
and
co
ntr
ol
Allo
w f
req
ue
nt
en
ou
gh r
ead
ings
fo
r n
etw
ork
pla
nn
ing
Sup
po
rt a
dva
nce
d t
arif
f sy
stem
s
Rem
ote
ON
/OFF
co
ntr
ol o
f th
e su
pp
ly A
ND
/OR
fl
ow
or
po
wer
lim
itat
ion
Pro
vid
e se
cure
dat
a co
mm
un
icat
ion
s
Frau
d p
reve
nti
on
an
d d
ete
ctio
n
a b c d e f g h i
Austria
France
Ireland
Italy
Luxembourg
Netherlands
United Kingdom
Table 32: Overview of all smart metering functionalities for gas that are foreseen or are already available by Member State (legend: green = foreseen, blank = not foreseen, grey = data not available).
56 “Functional reference architecture for communications in smart metering systems” (CEN-CLC-ETSI TR 50572:2011).
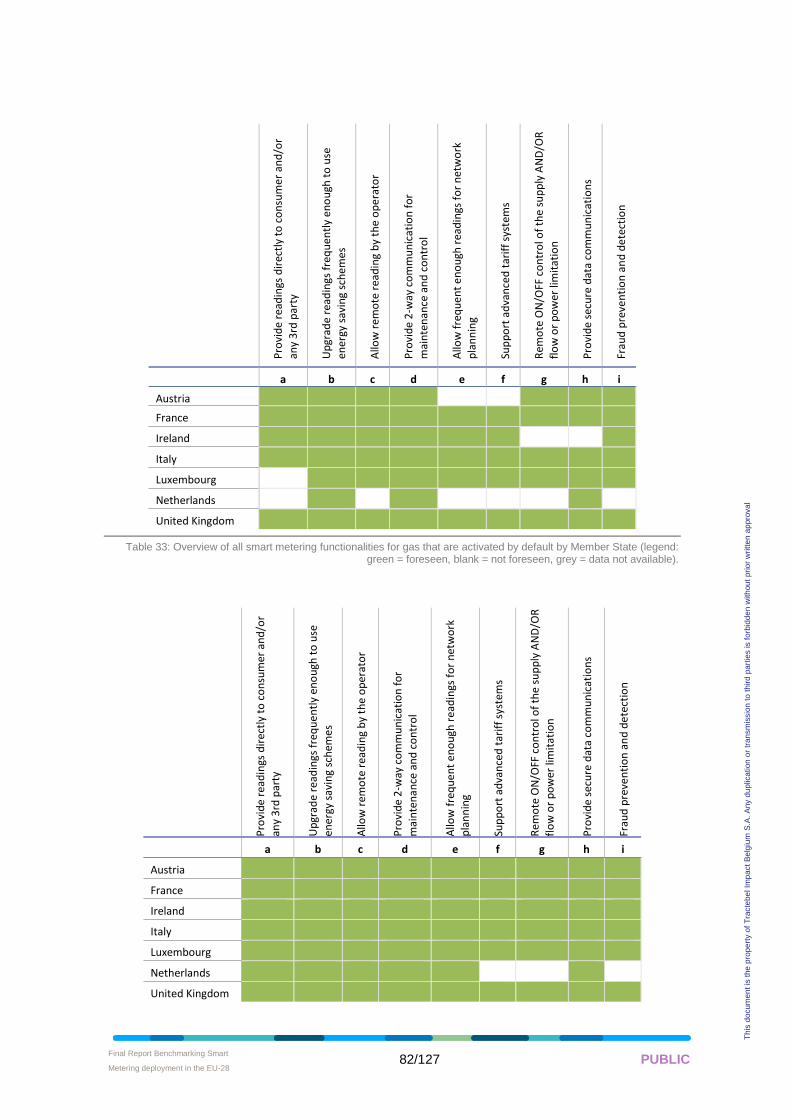
Final Report Benchmarking Smart
Metering deployment in the EU-28 • 82/127 PUBLIC
Th
is d
ocum
en
t is
the
pro
pe
rty o
f T
racte
be
l Im
pa
ct
Be
lgiu
m S
.A.
An
y d
up
lica
tion
or
tra
nsm
issio
n t
o t
hird
pa
rtie
s is f
orb
idd
en
with
ou
t p
rio
r w
ritte
n a
ppro
va
l
Pro
vid
e re
adin
gs d
irec
tly
to c
on
sum
er a
nd
/or
any
3rd
par
ty
Up
grad
e re
adin
gs f
req
ue
ntl
y en
ou
gh t
o u
se
ener
gy s
avin
g sc
hem
es
Allo
w r
emo
te r
ead
ing
by
the
op
era
tor
Pro
vid
e 2
-way
co
mm
un
icat
ion
fo
r
mai
nte
nan
ce a
nd
co
ntr
ol
Allo
w f
req
ue
nt
en
ou
gh r
ead
ings
fo
r n
etw
ork
p
lan
nin
g
Sup
po
rt a
dva
nce
d t
arif
f sy
stem
s
Rem
ote
ON
/OFF
co
ntr
ol o
f th
e su
pp
ly A
ND
/OR
flo
w o
r p
ow
er li
mit
atio
n
Pro
vid
e se
cure
dat
a co
mm
un
icat
ion
s
Frau
d p
reve
nti
on
an
d d
ete
ctio
n
a b c d e f g h i
Austria
France
Ireland
Italy
Luxembourg
Netherlands
United Kingdom
Table 33: Overview of all smart metering functionalities for gas that are activated by default by Member State (legend: green = foreseen, blank = not foreseen, grey = data not available).
Pro
vid
e re
adin
gs d
irec
tly
to c
on
sum
er a
nd
/or
any
3rd
par
ty
Up
grad
e re
adin
gs f
req
ue
ntl
y en
ou
gh t
o u
se
ener
gy s
avin
g sc
hem
es
Allo
w r
emo
te r
ead
ing
by
the
op
era
tor
Pro
vid
e 2
-way
co
mm
un
icat
ion
fo
r
mai
nte
nan
ce a
nd
co
ntr
ol
Allo
w f
req
ue
nt
en
ou
gh r
ead
ings
fo
r n
etw
ork
p
lan
nin
g
Sup
po
rt a
dva
nce
d t
arif
f sy
stem
s
Rem
ote
ON
/OFF
co
ntr
ol o
f th
e su
pp
ly A
ND
/OR
flo
w o
r p
ow
er li
mit
atio
n
Pro
vid
e se
cure
dat
a co
mm
un
icat
ion
s
Frau
d p
reve
nti
on
an
d d
ete
ctio
n
a b c d e f g h i
Austria
France
Ireland
Italy
Luxembourg
Netherlands
United Kingdom
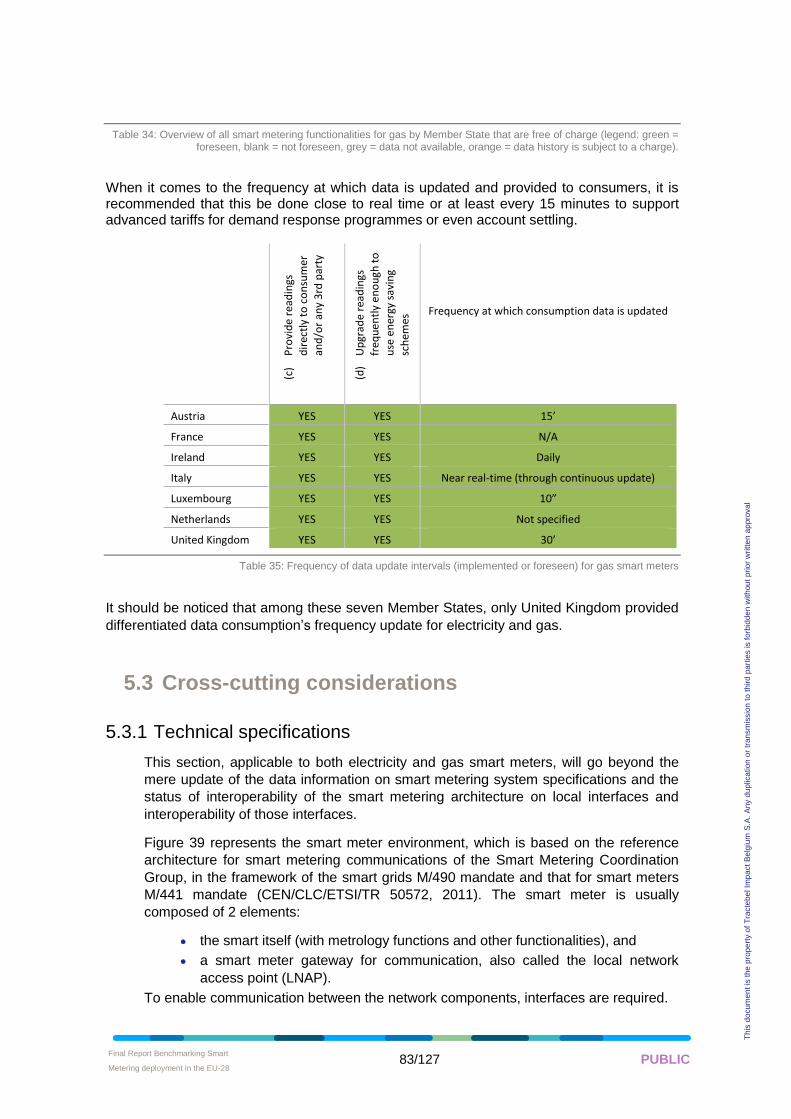
Final Report Benchmarking Smart
Metering deployment in the EU-28 • 83/127 PUBLIC
Th
is d
ocum
en
t is
the
pro
pe
rty o
f T
racte
be
l Im
pa
ct
Be
lgiu
m S
.A.
An
y d
up
lica
tion
or
tra
nsm
issio
n t
o t
hird
pa
rtie
s is f
orb
idd
en
with
ou
t p
rio
r w
ritte
n a
ppro
va
l
Table 34: Overview of all smart metering functionalities for gas by Member State that are free of charge (legend: green = foreseen, blank = not foreseen, grey = data not available, orange = data history is subject to a charge).
When it comes to the frequency at which data is updated and provided to consumers, it is recommended that this be done close to real time or at least every 15 minutes to support advanced tariffs for demand response programmes or even account settling.
(c)
Pro
vid
e re
adin
gs
dir
ectl
y to
co
nsu
mer
and
/or
any
3rd
par
ty
(d)
Up
grad
e re
adin
gs
freq
ue
ntl
y e
no
ugh
to
use
en
ergy
sav
ing
sch
emes
Frequency at which consumption data is updated
Austria YES YES 15’
France YES YES N/A
Ireland YES YES Daily
Italy YES YES Near real-time (through continuous update)
Luxembourg YES YES 10”
Netherlands YES YES Not specified
United Kingdom YES YES 30’
Table 35: Frequency of data update intervals (implemented or foreseen) for gas smart meters
It should be noticed that among these seven Member States, only United Kingdom provided
differentiated data consumption’s frequency update for electricity and gas.
5.3 Cross-cutting considerations
5.3.1 Technical specifications
This section, applicable to both electricity and gas smart meters, will go beyond the
mere update of the data information on smart metering system specifications and the
status of interoperability of the smart metering architecture on local interfaces and
interoperability of those interfaces.
Figure 39 represents the smart meter environment, which is based on the reference
architecture for smart metering communications of the Smart Metering Coordination
Group, in the framework of the smart grids M/490 mandate and that for smart meters
M/441 mandate (CEN/CLC/ETSI/TR 50572, 2011). The smart meter is usually
composed of 2 elements:
• the smart itself (with metrology functions and other functionalities), and
• a smart meter gateway for communication, also called the local network
access point (LNAP).
To enable communication between the network components, interfaces are required.
Final Report Benchmarking Smart
Metering deployment in the EU-28 • 84/127 PUBLIC
Th
is d
ocum
en
t is
the
pro
pe
rty o
f T
racte
be
l Im
pa
ct
Be
lgiu
m S
.A.
An
y d
up
lica
tion
or
tra
nsm
issio
n t
o t
hird
pa
rtie
s is f
orb
idd
en
with
ou
t p
rio
r w
ritte
n a
ppro
va
l
• The H1 interface connects the smart meter system to an external display, via
one-way communication. The external display is not uniquely designed. For
instance, information may be provided only visually, or be available for
downloading. The so-called « P1 » implemented in the Netherlands,
Luxemburg or Austria is one example of an H1 interface.
• The H2 interface connects the smart meter system with the Home Area
Network (HAN). The HAN interconnects smart home devices for energy
management purposes. The H2 provides a two-way communication, i.e. the
HAN can send information on individual devices back to the smart meter
system.
• Data from the smart meter is shared externally with the meter data
management system (a central communication system). This system
communicates with meters either directly through the Wide Area Network
(WAN) and enabled by the G1 interface, or via a data concentrator where
information from several meters in a neighborhood is concentrated
(Neighborhood Network Access Points, NNAP).
• The NNAP may also have an H3 interface to the HAN. It seems, however, that
H3 is currently not implemented or planned in Europe.
Note that the Meter Data Management System is represented in a very simplified way:
in practice, the way consumption data is collected, validated and stored is organized
differently. Some countries have opted for centralized systems where an independent
third party is responsible, other countries have opted for a decentralized system (where
DSOs or suppliers are responsible), or a combination. It provides validated historical
and usually non-validated near-real time consumption data that is used by different data
users for several purposes: DSOs and suppliers for traditional activities (for switching
and billing purposes for instance), suppliers and third parties for emerging energy and
flexibility services.
To this end, consumption data might be combined with wholesale market data, or
transmission and distribution grid data to deliver services to DSOs/TSOs. Finally,
suppliers and third parties may also have direct access to the smart meter (not shown
in Figure 39)
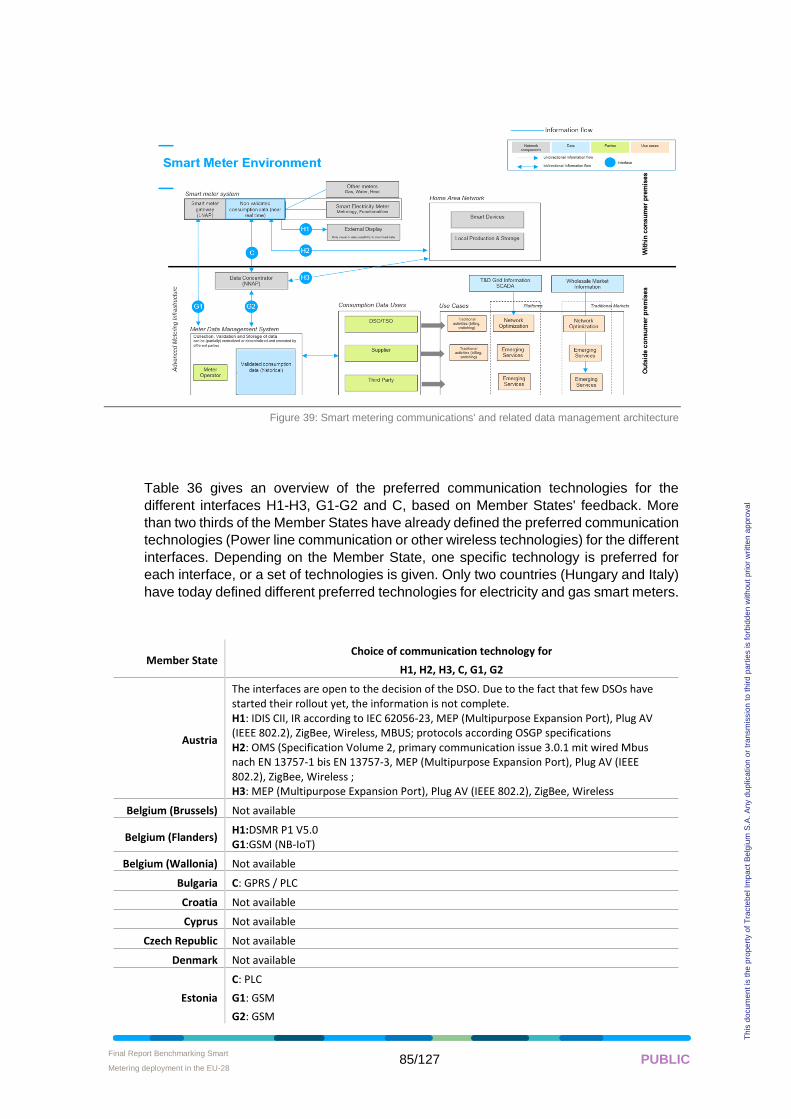
Final Report Benchmarking Smart
Metering deployment in the EU-28 • 85/127 PUBLIC
Th
is d
ocum
en
t is
the
pro
pe
rty o
f T
racte
be
l Im
pa
ct
Be
lgiu
m S
.A.
An
y d
up
lica
tion
or
tra
nsm
issio
n t
o t
hird
pa
rtie
s is f
orb
idd
en
with
ou
t p
rio
r w
ritte
n a
ppro
va
l
Figure 39: Smart metering communications' and related data management architecture
Table 36 gives an overview of the preferred communication technologies for the
different interfaces H1-H3, G1-G2 and C, based on Member States' feedback. More
than two thirds of the Member States have already defined the preferred communication
technologies (Power line communication or other wireless technologies) for the different
interfaces. Depending on the Member State, one specific technology is preferred for
each interface, or a set of technologies is given. Only two countries (Hungary and Italy)
have today defined different preferred technologies for electricity and gas smart meters.
Member State Choice of communication technology for
H1, H2, H3, C, G1, G2
Austria
The interfaces are open to the decision of the DSO. Due to the fact that few DSOs have started their rollout yet, the information is not complete. H1: IDIS CII, IR according to IEC 62056-23, MEP (Multipurpose Expansion Port), Plug AV (IEEE 802.2), ZigBee, Wireless, MBUS; protocols according OSGP specifications H2: OMS (Specification Volume 2, primary communication issue 3.0.1 mit wired Mbus nach EN 13757-1 bis EN 13757-3, MEP (Multipurpose Expansion Port), Plug AV (IEEE 802.2), ZigBee, Wireless ; H3: MEP (Multipurpose Expansion Port), Plug AV (IEEE 802.2), ZigBee, Wireless
Belgium (Brussels) Not available
Belgium (Flanders) H1:DSMR P1 V5.0 G1:GSM (NB-IoT)
Belgium (Wallonia) Not available
Bulgaria C: GPRS / PLC
Croatia Not available
Cyprus Not available
Czech Republic Not available
Denmark Not available
Estonia
C: PLC
G1: GSM
G2: GSM
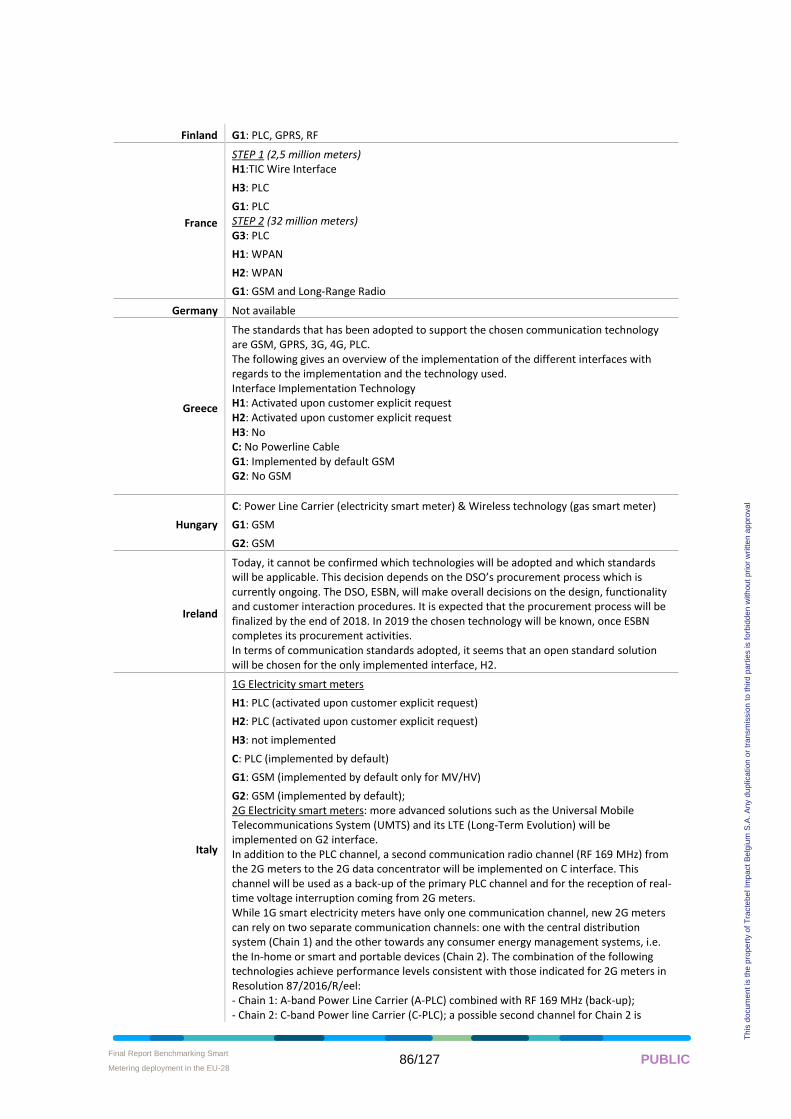
Final Report Benchmarking Smart
Metering deployment in the EU-28 • 86/127 PUBLIC
Th
is d
ocum
en
t is
the
pro
pe
rty o
f T
racte
be
l Im
pa
ct
Be
lgiu
m S
.A.
An
y d
up
lica
tion
or
tra
nsm
issio
n t
o t
hird
pa
rtie
s is f
orb
idd
en
with
ou
t p
rio
r w
ritte
n a
ppro
va
l
Finland G1: PLC, GPRS, RF
France
STEP 1 (2,5 million meters) H1:TIC Wire Interface
H3: PLC
G1: PLC STEP 2 (32 million meters) G3: PLC
H1: WPAN
H2: WPAN
G1: GSM and Long-Range Radio
Germany Not available
Greece
The standards that has been adopted to support the chosen communication technology are GSM, GPRS, 3G, 4G, PLC. The following gives an overview of the implementation of the different interfaces with regards to the implementation and the technology used. Interface Implementation Technology H1: Activated upon customer explicit request H2: Activated upon customer explicit request H3: No C: No Powerline Cable G1: Implemented by default GSM G2: No GSM
Hungary
C: Power Line Carrier (electricity smart meter) & Wireless technology (gas smart meter)
G1: GSM
G2: GSM
Ireland
Today, it cannot be confirmed which technologies will be adopted and which standards will be applicable. This decision depends on the DSO’s procurement process which is currently ongoing. The DSO, ESBN, will make overall decisions on the design, functionality and customer interaction procedures. It is expected that the procurement process will be finalized by the end of 2018. In 2019 the chosen technology will be known, once ESBN completes its procurement activities. In terms of communication standards adopted, it seems that an open standard solution will be chosen for the only implemented interface, H2.
Italy
1G Electricity smart meters
H1: PLC (activated upon customer explicit request)
H2: PLC (activated upon customer explicit request)
H3: not implemented
C: PLC (implemented by default)
G1: GSM (implemented by default only for MV/HV)
G2: GSM (implemented by default); 2G Electricity smart meters: more advanced solutions such as the Universal Mobile Telecommunications System (UMTS) and its LTE (Long-Term Evolution) will be implemented on G2 interface. In addition to the PLC channel, a second communication radio channel (RF 169 MHz) from the 2G meters to the 2G data concentrator will be implemented on C interface. This channel will be used as a back-up of the primary PLC channel and for the reception of real-time voltage interruption coming from 2G meters. While 1G smart electricity meters have only one communication channel, new 2G meters can rely on two separate communication channels: one with the central distribution system (Chain 1) and the other towards any consumer energy management systems, i.e. the In-home or smart and portable devices (Chain 2). The combination of the following technologies achieve performance levels consistent with those indicated for 2G meters in Resolution 87/2016/R/eel: - Chain 1: A-band Power Line Carrier (A-PLC) combined with RF 169 MHz (back-up); - Chain 2: C-band Power line Carrier (C-PLC); a possible second channel for Chain 2 is
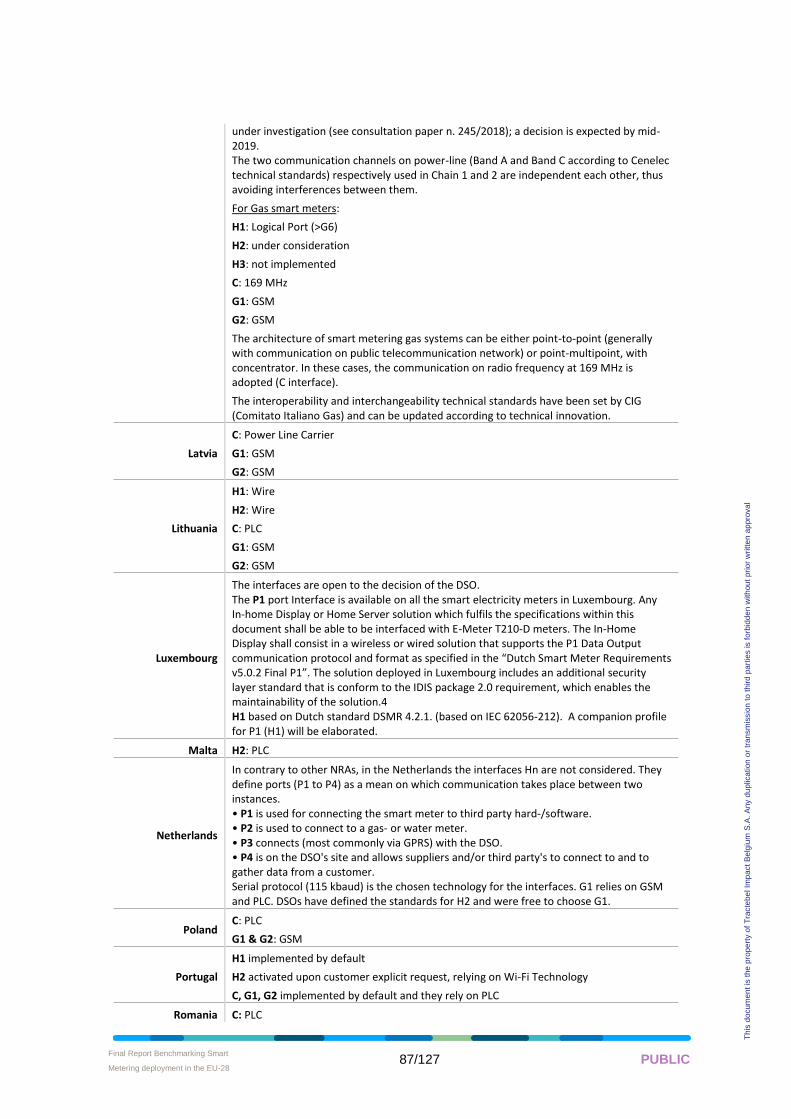
Final Report Benchmarking Smart
Metering deployment in the EU-28 • 87/127 PUBLIC
Th
is d
ocum
en
t is
the
pro
pe
rty o
f T
racte
be
l Im
pa
ct
Be
lgiu
m S
.A.
An
y d
up
lica
tion
or
tra
nsm
issio
n t
o t
hird
pa
rtie
s is f
orb
idd
en
with
ou
t p
rio
r w
ritte
n a
ppro
va
l
under investigation (see consultation paper n. 245/2018); a decision is expected by mid-2019. The two communication channels on power-line (Band A and Band C according to Cenelec technical standards) respectively used in Chain 1 and 2 are independent each other, thus avoiding interferences between them.
For Gas smart meters:
H1: Logical Port (>G6)
H2: under consideration
H3: not implemented
C: 169 MHz
G1: GSM
G2: GSM
The architecture of smart metering gas systems can be either point-to-point (generally with communication on public telecommunication network) or point-multipoint, with concentrator. In these cases, the communication on radio frequency at 169 MHz is adopted (C interface).
The interoperability and interchangeability technical standards have been set by CIG (Comitato Italiano Gas) and can be updated according to technical innovation.
Latvia
C: Power Line Carrier
G1: GSM
G2: GSM
Lithuania
H1: Wire
H2: Wire
C: PLC
G1: GSM
G2: GSM
Luxembourg
The interfaces are open to the decision of the DSO. The P1 port Interface is available on all the smart electricity meters in Luxembourg. Any In-home Display or Home Server solution which fulfils the specifications within this document shall be able to be interfaced with E-Meter T210-D meters. The In-Home Display shall consist in a wireless or wired solution that supports the P1 Data Output communication protocol and format as specified in the “Dutch Smart Meter Requirements v5.0.2 Final P1”. The solution deployed in Luxembourg includes an additional security layer standard that is conform to the IDIS package 2.0 requirement, which enables the maintainability of the solution.4 H1 based on Dutch standard DSMR 4.2.1. (based on IEC 62056-212). A companion profile for P1 (H1) will be elaborated.
Malta H2: PLC
Netherlands
In contrary to other NRAs, in the Netherlands the interfaces Hn are not considered. They define ports (P1 to P4) as a mean on which communication takes place between two instances. • P1 is used for connecting the smart meter to third party hard-/software. • P2 is used to connect to a gas- or water meter. • P3 connects (most commonly via GPRS) with the DSO. • P4 is on the DSO's site and allows suppliers and/or third party's to connect to and to gather data from a customer. Serial protocol (115 kbaud) is the chosen technology for the interfaces. G1 relies on GSM and PLC. DSOs have defined the standards for H2 and were free to choose G1.
Poland C: PLC
G1 & G2: GSM
Portugal
H1 implemented by default
H2 activated upon customer explicit request, relying on Wi-Fi Technology
C, G1, G2 implemented by default and they rely on PLC
Romania C: PLC
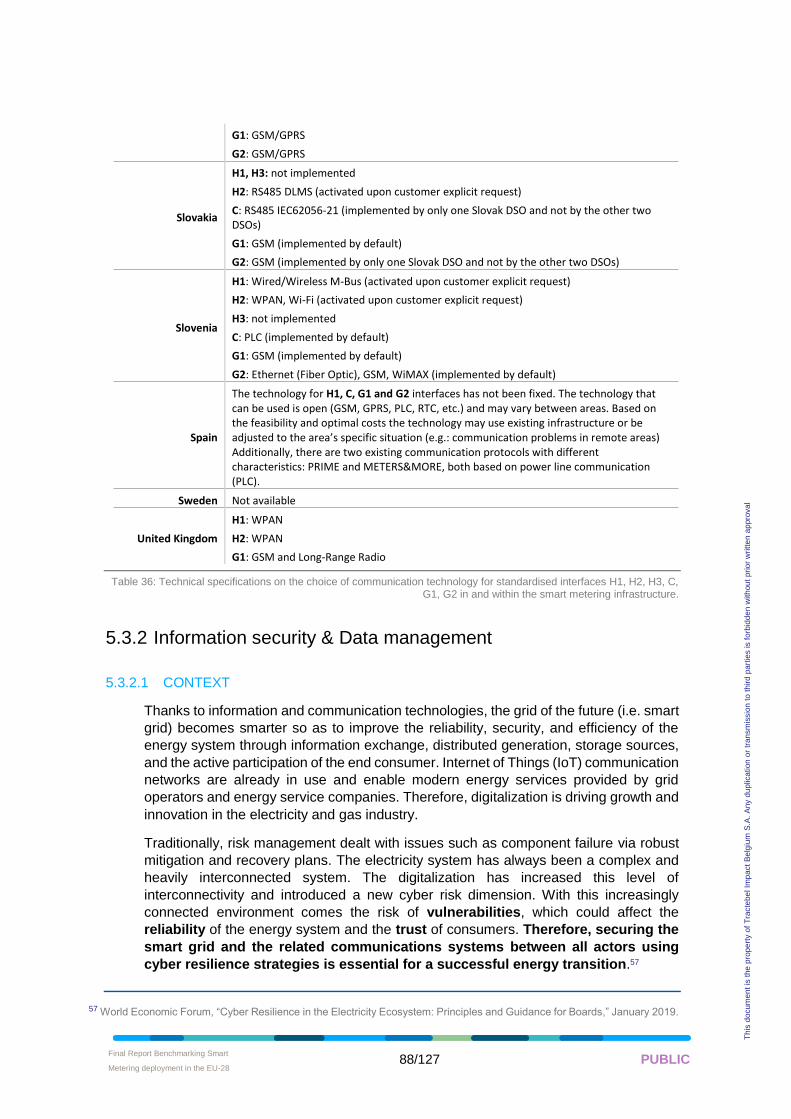
Final Report Benchmarking Smart
Metering deployment in the EU-28 • 88/127 PUBLIC
Th
is d
ocum
en
t is
the
pro
pe
rty o
f T
racte
be
l Im
pa
ct
Be
lgiu
m S
.A.
An
y d
up
lica
tion
or
tra
nsm
issio
n t
o t
hird
pa
rtie
s is f
orb
idd
en
with
ou
t p
rio
r w
ritte
n a
ppro
va
l
G1: GSM/GPRS
G2: GSM/GPRS
Slovakia
H1, H3: not implemented
H2: RS485 DLMS (activated upon customer explicit request)
C: RS485 IEC62056-21 (implemented by only one Slovak DSO and not by the other two DSOs)
G1: GSM (implemented by default)
G2: GSM (implemented by only one Slovak DSO and not by the other two DSOs)
Slovenia
H1: Wired/Wireless M-Bus (activated upon customer explicit request)
H2: WPAN, Wi-Fi (activated upon customer explicit request)
H3: not implemented
C: PLC (implemented by default)
G1: GSM (implemented by default)
G2: Ethernet (Fiber Optic), GSM, WiMAX (implemented by default)
Spain
The technology for H1, C, G1 and G2 interfaces has not been fixed. The technology that can be used is open (GSM, GPRS, PLC, RTC, etc.) and may vary between areas. Based on the feasibility and optimal costs the technology may use existing infrastructure or be adjusted to the area’s specific situation (e.g.: communication problems in remote areas) Additionally, there are two existing communication protocols with different characteristics: PRIME and METERS&MORE, both based on power line communication (PLC).
Sweden Not available
United Kingdom
H1: WPAN
H2: WPAN
G1: GSM and Long-Range Radio
Table 36: Technical specifications on the choice of communication technology for standardised interfaces H1, H2, H3, C, G1, G2 in and within the smart metering infrastructure.
5.3.2 Information security & Data management
5.3.2.1 CONTEXT
Thanks to information and communication technologies, the grid of the future (i.e. smart
grid) becomes smarter so as to improve the reliability, security, and efficiency of the
energy system through information exchange, distributed generation, storage sources,
and the active participation of the end consumer. Internet of Things (IoT) communication
networks are already in use and enable modern energy services provided by grid
operators and energy service companies. Therefore, digitalization is driving growth and
innovation in the electricity and gas industry.
Traditionally, risk management dealt with issues such as component failure via robust
mitigation and recovery plans. The electricity system has always been a complex and
heavily interconnected system. The digitalization has increased this level of
interconnectivity and introduced a new cyber risk dimension. With this increasingly
connected environment comes the risk of vulnerabilities, which could affect the
reliability of the energy system and the trust of consumers. Therefore, securing the
smart grid and the related communications systems between all actors using
cyber resilience strategies is essential for a successful energy transition.57
57 World Economic Forum, “Cyber Resilience in the Electricity Ecosystem: Principles and Guidance for Boards,” January 2019.
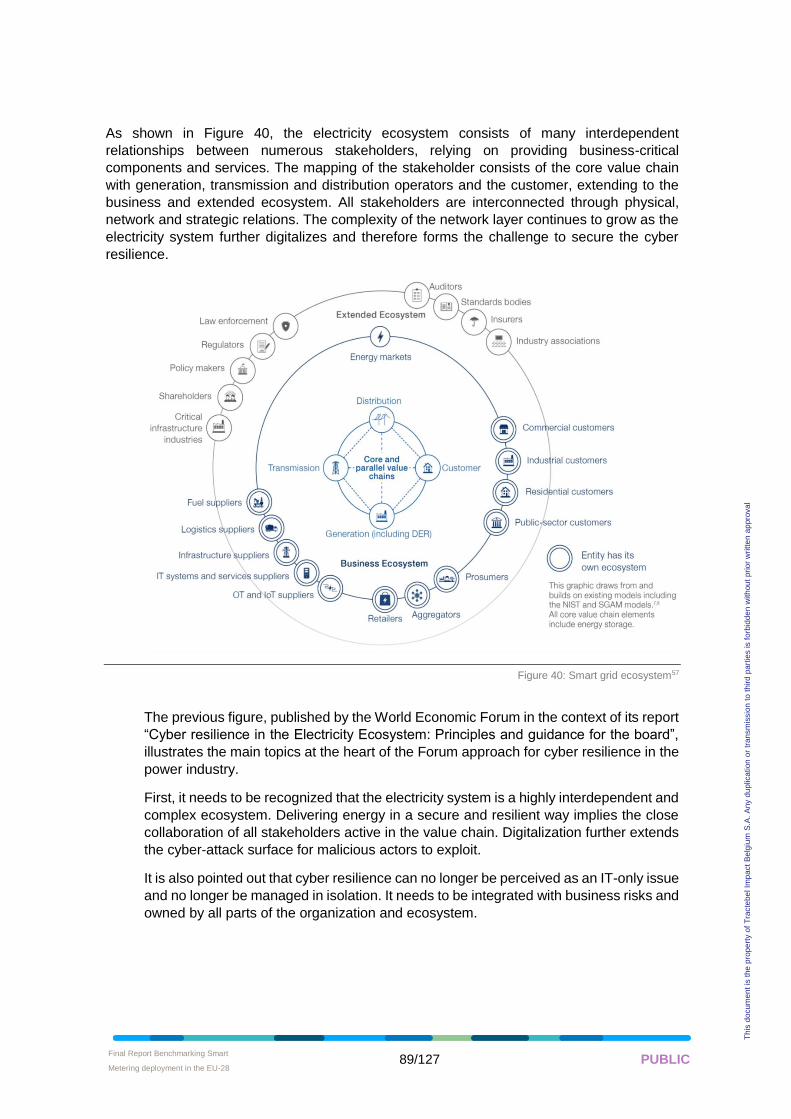
Final Report Benchmarking Smart
Metering deployment in the EU-28 • 89/127 PUBLIC
Th
is d
ocum
en
t is
the
pro
pe
rty o
f T
racte
be
l Im
pa
ct
Be
lgiu
m S
.A.
An
y d
up
lica
tion
or
tra
nsm
issio
n t
o t
hird
pa
rtie
s is f
orb
idd
en
with
ou
t p
rio
r w
ritte
n a
ppro
va
l
As shown in Figure 40, the electricity ecosystem consists of many interdependent
relationships between numerous stakeholders, relying on providing business-critical
components and services. The mapping of the stakeholder consists of the core value chain
with generation, transmission and distribution operators and the customer, extending to the
business and extended ecosystem. All stakeholders are interconnected through physical,
network and strategic relations. The complexity of the network layer continues to grow as the
electricity system further digitalizes and therefore forms the challenge to secure the cyber
resilience.
Figure 40: Smart grid ecosystem57
The previous figure, published by the World Economic Forum in the context of its report
“Cyber resilience in the Electricity Ecosystem: Principles and guidance for the board”,
illustrates the main topics at the heart of the Forum approach for cyber resilience in the
power industry.
First, it needs to be recognized that the electricity system is a highly interdependent and
complex ecosystem. Delivering energy in a secure and resilient way implies the close
collaboration of all stakeholders active in the value chain. Digitalization further extends
the cyber-attack surface for malicious actors to exploit.
It is also pointed out that cyber resilience can no longer be perceived as an IT-only issue
and no longer be managed in isolation. It needs to be integrated with business risks and
owned by all parts of the organization and ecosystem.
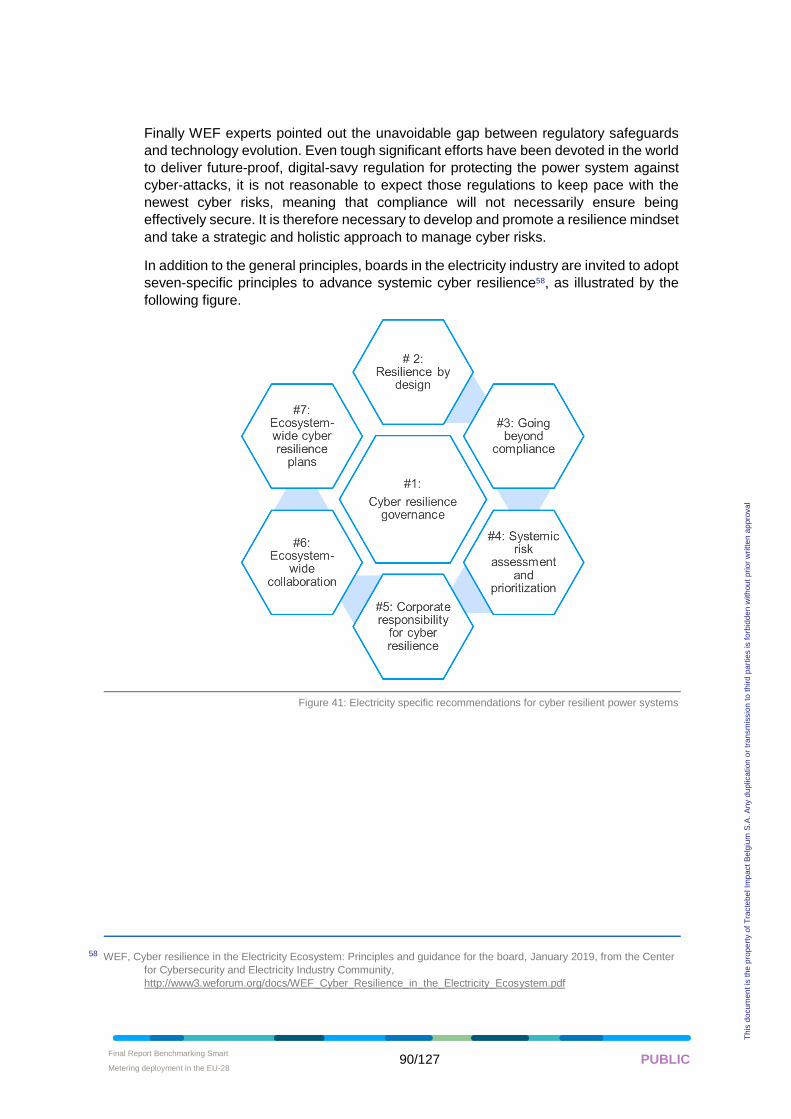
Final Report Benchmarking Smart
Metering deployment in the EU-28 • 90/127 PUBLIC
Th
is d
ocum
en
t is
the
pro
pe
rty o
f T
racte
be
l Im
pa
ct
Be
lgiu
m S
.A.
An
y d
up
lica
tion
or
tra
nsm
issio
n t
o t
hird
pa
rtie
s is f
orb
idd
en
with
ou
t p
rio
r w
ritte
n a
ppro
va
l
Finally WEF experts pointed out the unavoidable gap between regulatory safeguards
and technology evolution. Even tough significant efforts have been devoted in the world
to deliver future-proof, digital-savy regulation for protecting the power system against
cyber-attacks, it is not reasonable to expect those regulations to keep pace with the
newest cyber risks, meaning that compliance will not necessarily ensure being
effectively secure. It is therefore necessary to develop and promote a resilience mindset
and take a strategic and holistic approach to manage cyber risks.
In addition to the general principles, boards in the electricity industry are invited to adopt
seven-specific principles to advance systemic cyber resilience58, as illustrated by the
following figure.
Figure 41: Electricity specific recommendations for cyber resilient power systems
58 WEF, Cyber resilience in the Electricity Ecosystem: Principles and guidance for the board, January 2019, from the Center
for Cybersecurity and Electricity Industry Community,
http://www3.weforum.org/docs/WEF_Cyber_Resilience_in_the_Electricity_Ecosystem.pdf
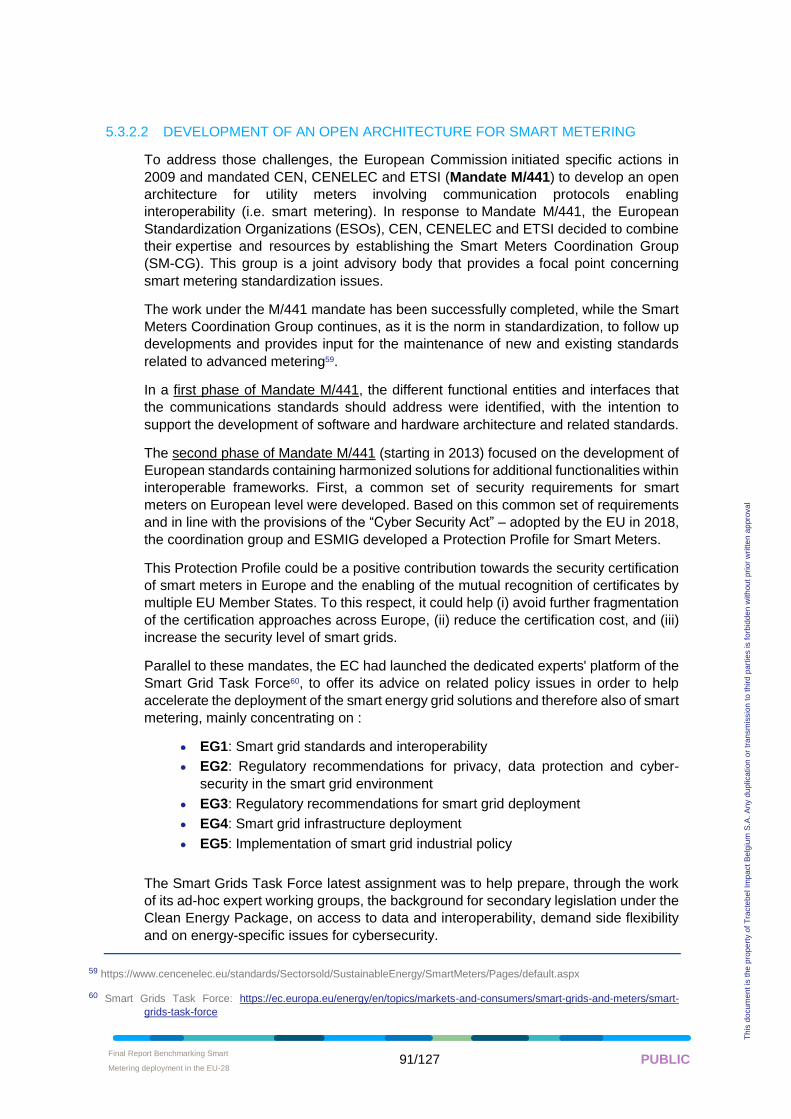
Final Report Benchmarking Smart
Metering deployment in the EU-28 • 91/127 PUBLIC
Th
is d
ocum
en
t is
the
pro
pe
rty o
f T
racte
be
l Im
pa
ct
Be
lgiu
m S
.A.
An
y d
up
lica
tion
or
tra
nsm
issio
n t
o t
hird
pa
rtie
s is f
orb
idd
en
with
ou
t p
rio
r w
ritte
n a
ppro
va
l
5.3.2.2 DEVELOPMENT OF AN OPEN ARCHITECTURE FOR SMART METERING
To address those challenges, the European Commission initiated specific actions in
2009 and mandated CEN, CENELEC and ETSI (Mandate M/441) to develop an open
architecture for utility meters involving communication protocols enabling
interoperability (i.e. smart metering). In response to Mandate M/441, the European
Standardization Organizations (ESOs), CEN, CENELEC and ETSI decided to combine
their expertise and resources by establishing the Smart Meters Coordination Group
(SM-CG). This group is a joint advisory body that provides a focal point concerning
smart metering standardization issues.
The work under the M/441 mandate has been successfully completed, while the Smart
Meters Coordination Group continues, as it is the norm in standardization, to follow up
developments and provides input for the maintenance of new and existing standards
related to advanced metering59.
In a first phase of Mandate M/441, the different functional entities and interfaces that
the communications standards should address were identified, with the intention to
support the development of software and hardware architecture and related standards.
The second phase of Mandate M/441 (starting in 2013) focused on the development of
European standards containing harmonized solutions for additional functionalities within
interoperable frameworks. First, a common set of security requirements for smart
meters on European level were developed. Based on this common set of requirements
and in line with the provisions of the “Cyber Security Act” – adopted by the EU in 2018,
the coordination group and ESMIG developed a Protection Profile for Smart Meters.
This Protection Profile could be a positive contribution towards the security certification
of smart meters in Europe and the enabling of the mutual recognition of certificates by
multiple EU Member States. To this respect, it could help (i) avoid further fragmentation
of the certification approaches across Europe, (ii) reduce the certification cost, and (iii)
increase the security level of smart grids.
Parallel to these mandates, the EC had launched the dedicated experts' platform of the
Smart Grid Task Force60, to offer its advice on related policy issues in order to help
accelerate the deployment of the smart energy grid solutions and therefore also of smart
metering, mainly concentrating on :
• EG1: Smart grid standards and interoperability
• EG2: Regulatory recommendations for privacy, data protection and cyber-
security in the smart grid environment
• EG3: Regulatory recommendations for smart grid deployment
• EG4: Smart grid infrastructure deployment
• EG5: Implementation of smart grid industrial policy
The Smart Grids Task Force latest assignment was to help prepare, through the work
of its ad-hoc expert working groups, the background for secondary legislation under the
Clean Energy Package, on access to data and interoperability, demand side flexibility
and on energy-specific issues for cybersecurity.
59 https://www.cencenelec.eu/standards/Sectorsold/SustainableEnergy/SmartMeters/Pages/default.aspx
60 Smart Grids Task Force: https://ec.europa.eu/energy/en/topics/markets-and-consumers/smart-grids-and-meters/smart-
grids-task-force
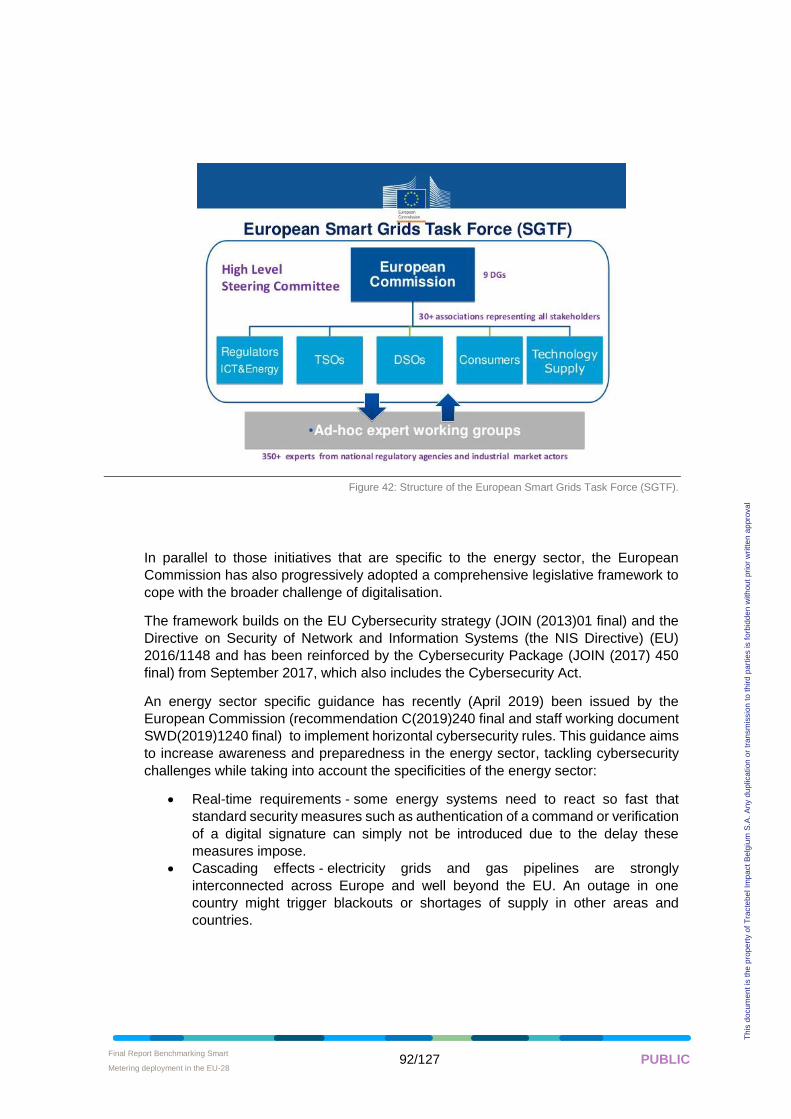
Final Report Benchmarking Smart
Metering deployment in the EU-28 • 92/127 PUBLIC
Th
is d
ocum
en
t is
the
pro
pe
rty o
f T
racte
be
l Im
pa
ct
Be
lgiu
m S
.A.
An
y d
up
lica
tion
or
tra
nsm
issio
n t
o t
hird
pa
rtie
s is f
orb
idd
en
with
ou
t p
rio
r w
ritte
n a
ppro
va
l
Figure 42: Structure of the European Smart Grids Task Force (SGTF).
In parallel to those initiatives that are specific to the energy sector, the European
Commission has also progressively adopted a comprehensive legislative framework to
cope with the broader challenge of digitalisation.
The framework builds on the EU Cybersecurity strategy (JOIN (2013)01 final) and the
Directive on Security of Network and Information Systems (the NIS Directive) (EU)
2016/1148 and has been reinforced by the Cybersecurity Package (JOIN (2017) 450
final) from September 2017, which also includes the Cybersecurity Act.
An energy sector specific guidance has recently (April 2019) been issued by the
European Commission (recommendation C(2019)240 final and staff working document
SWD(2019)1240 final) to implement horizontal cybersecurity rules. This guidance aims
to increase awareness and preparedness in the energy sector, tackling cybersecurity
challenges while taking into account the specificities of the energy sector:
• Real-time requirements - some energy systems need to react so fast that
standard security measures such as authentication of a command or verification
of a digital signature can simply not be introduced due to the delay these
measures impose.
• Cascading effects - electricity grids and gas pipelines are strongly
interconnected across Europe and well beyond the EU. An outage in one
country might trigger blackouts or shortages of supply in other areas and
countries.
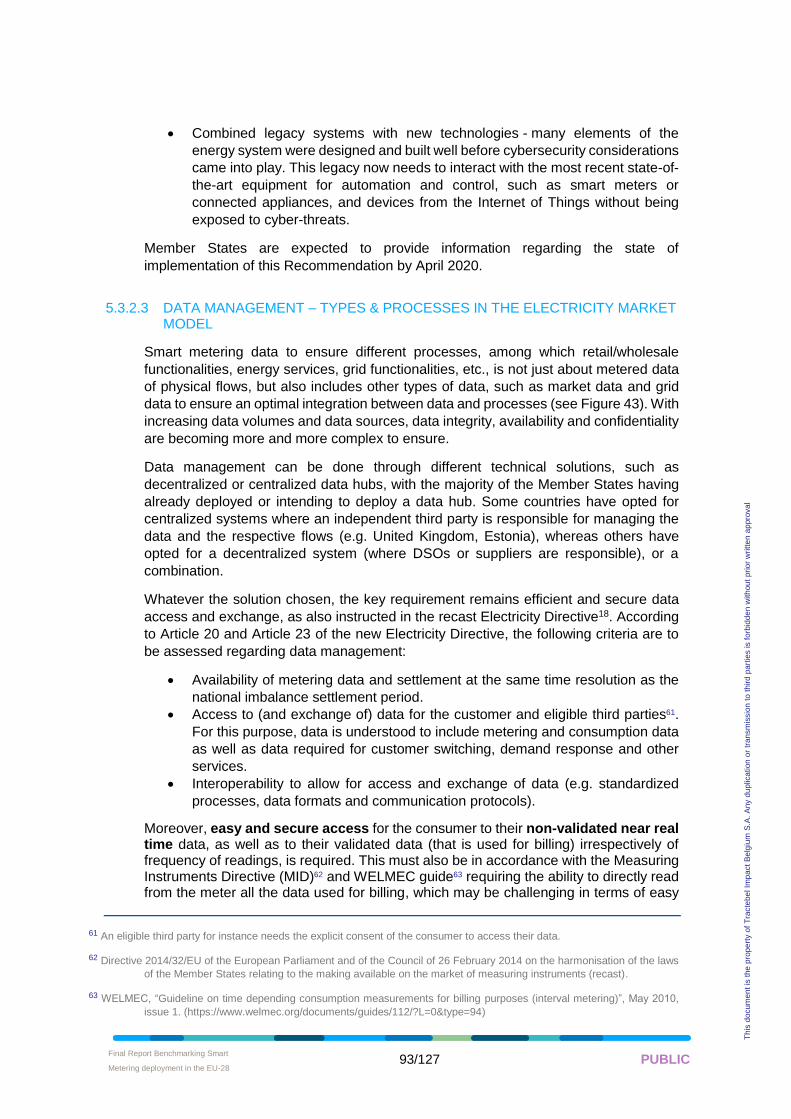
Final Report Benchmarking Smart
Metering deployment in the EU-28 • 93/127 PUBLIC
Th
is d
ocum
en
t is
the
pro
pe
rty o
f T
racte
be
l Im
pa
ct
Be
lgiu
m S
.A.
An
y d
up
lica
tion
or
tra
nsm
issio
n t
o t
hird
pa
rtie
s is f
orb
idd
en
with
ou
t p
rio
r w
ritte
n a
ppro
va
l
• Combined legacy systems with new technologies - many elements of the
energy system were designed and built well before cybersecurity considerations
came into play. This legacy now needs to interact with the most recent state-of-
the-art equipment for automation and control, such as smart meters or
connected appliances, and devices from the Internet of Things without being
exposed to cyber-threats.
Member States are expected to provide information regarding the state of
implementation of this Recommendation by April 2020.
5.3.2.3 DATA MANAGEMENT – TYPES & PROCESSES IN THE ELECTRICITY MARKET MODEL
Smart metering data to ensure different processes, among which retail/wholesale
functionalities, energy services, grid functionalities, etc., is not just about metered data
of physical flows, but also includes other types of data, such as market data and grid
data to ensure an optimal integration between data and processes (see Figure 43). With
increasing data volumes and data sources, data integrity, availability and confidentiality
are becoming more and more complex to ensure.
Data management can be done through different technical solutions, such as
decentralized or centralized data hubs, with the majority of the Member States having
already deployed or intending to deploy a data hub. Some countries have opted for
centralized systems where an independent third party is responsible for managing the
data and the respective flows (e.g. United Kingdom, Estonia), whereas others have
opted for a decentralized system (where DSOs or suppliers are responsible), or a
combination.
Whatever the solution chosen, the key requirement remains efficient and secure data
access and exchange, as also instructed in the recast Electricity Directive18. According
to Article 20 and Article 23 of the new Electricity Directive, the following criteria are to
be assessed regarding data management:
• Availability of metering data and settlement at the same time resolution as the
national imbalance settlement period.
• Access to (and exchange of) data for the customer and eligible third parties61.
For this purpose, data is understood to include metering and consumption data
as well as data required for customer switching, demand response and other
services.
• Interoperability to allow for access and exchange of data (e.g. standardized
processes, data formats and communication protocols).
Moreover, easy and secure access for the consumer to their non-validated near real time data, as well as to their validated data (that is used for billing) irrespectively of frequency of readings, is required. This must also be in accordance with the Measuring Instruments Directive (MID)62 and WELMEC guide63 requiring the ability to directly read from the meter all the data used for billing, which may be challenging in terms of easy
61 An eligible third party for instance needs the explicit consent of the consumer to access their data.
62 Directive 2014/32/EU of the European Parliament and of the Council of 26 February 2014 on the harmonisation of the laws
of the Member States relating to the making available on the market of measuring instruments (recast).
63 WELMEC, “Guideline on time depending consumption measurements for billing purposes (interval metering)”, May 2010,
issue 1. (https://www.welmec.org/documents/guides/112/?L=0&type=94)
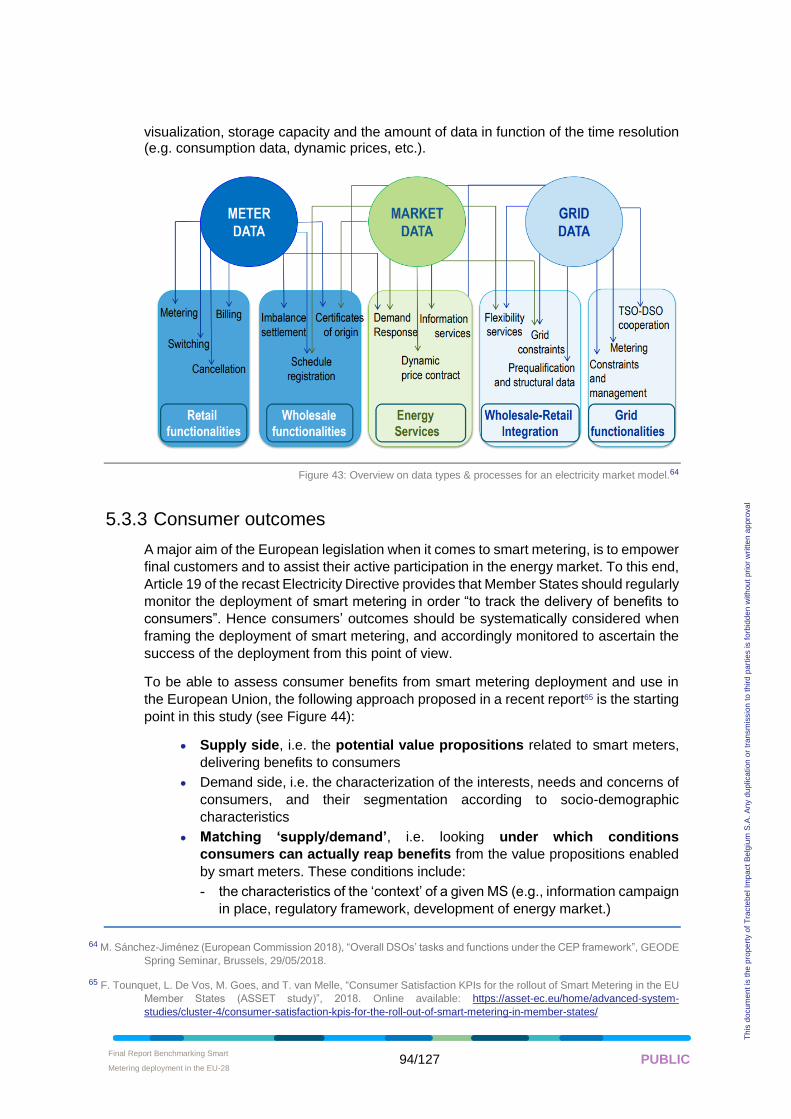
Final Report Benchmarking Smart
Metering deployment in the EU-28 • 94/127 PUBLIC
Th
is d
ocum
en
t is
the
pro
pe
rty o
f T
racte
be
l Im
pa
ct
Be
lgiu
m S
.A.
An
y d
up
lica
tion
or
tra
nsm
issio
n t
o t
hird
pa
rtie
s is f
orb
idd
en
with
ou
t p
rio
r w
ritte
n a
ppro
va
l
visualization, storage capacity and the amount of data in function of the time resolution (e.g. consumption data, dynamic prices, etc.).
Figure 43: Overview on data types & processes for an electricity market model.64
5.3.3 Consumer outcomes
A major aim of the European legislation when it comes to smart metering, is to empower
final customers and to assist their active participation in the energy market. To this end,
Article 19 of the recast Electricity Directive provides that Member States should regularly
monitor the deployment of smart metering in order “to track the delivery of benefits to
consumers”. Hence consumers’ outcomes should be systematically considered when
framing the deployment of smart metering, and accordingly monitored to ascertain the
success of the deployment from this point of view.
To be able to assess consumer benefits from smart metering deployment and use in
the European Union, the following approach proposed in a recent report65 is the starting
point in this study (see Figure 44):
• Supply side, i.e. the potential value propositions related to smart meters,
delivering benefits to consumers
• Demand side, i.e. the characterization of the interests, needs and concerns of
consumers, and their segmentation according to socio-demographic
characteristics
• Matching ‘supply/demand’, i.e. looking under which conditions
consumers can actually reap benefits from the value propositions enabled
by smart meters. These conditions include:
- the characteristics of the ‘context’ of a given MS (e.g., information campaign
in place, regulatory framework, development of energy market.)
64 M. Sánchez-Jiménez (European Commission 2018), “Overall DSOs’ tasks and functions under the CEP framework”, GEODE
Spring Seminar, Brussels, 29/05/2018.
65 F. Tounquet, L. De Vos, M. Goes, and T. van Melle, “Consumer Satisfaction KPIs for the rollout of Smart Metering in the EU
Member States (ASSET study)”, 2018. Online available: https://asset-ec.eu/home/advanced-system-
studies/cluster-4/consumer-satisfaction-kpis-for-the-roll-out-of-smart-metering-in-member-states/
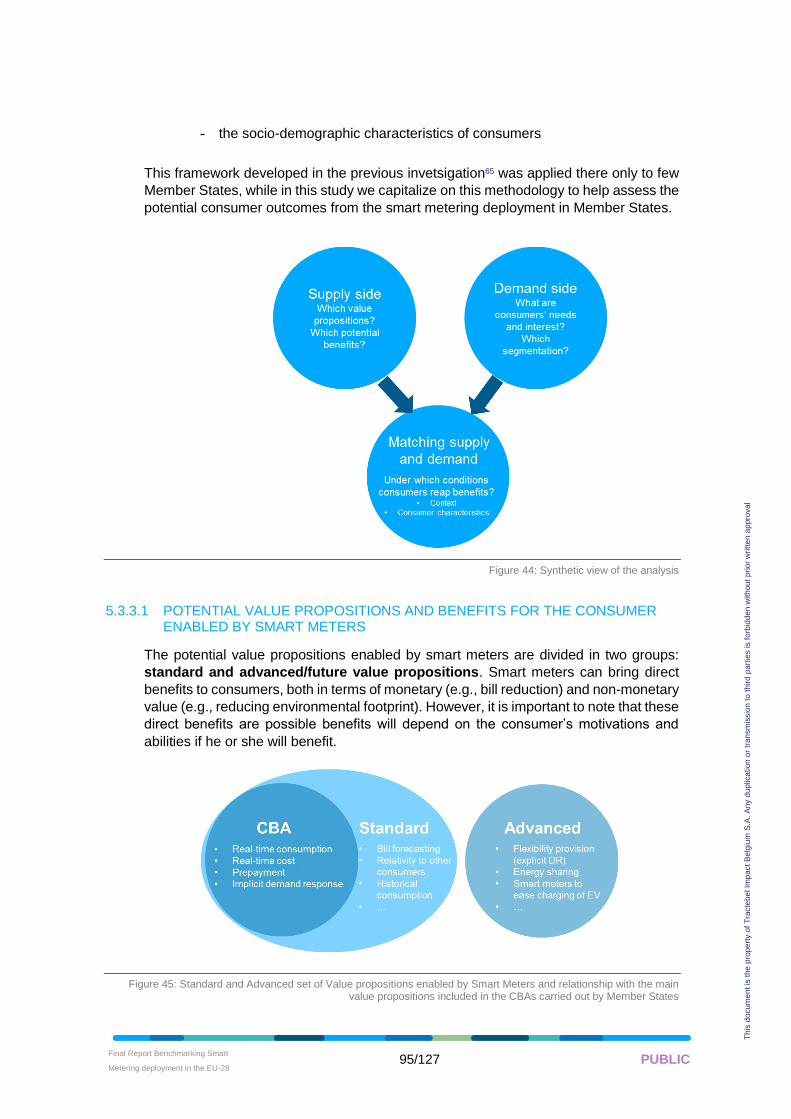
Final Report Benchmarking Smart
Metering deployment in the EU-28 • 95/127 PUBLIC
Th
is d
ocum
en
t is
the
pro
pe
rty o
f T
racte
be
l Im
pa
ct
Be
lgiu
m S
.A.
An
y d
up
lica
tion
or
tra
nsm
issio
n t
o t
hird
pa
rtie
s is f
orb
idd
en
with
ou
t p
rio
r w
ritte
n a
ppro
va
l
- the socio-demographic characteristics of consumers
This framework developed in the previous invetsigation65 was applied there only to few
Member States, while in this study we capitalize on this methodology to help assess the
potential consumer outcomes from the smart metering deployment in Member States.
Figure 44: Synthetic view of the analysis
5.3.3.1 POTENTIAL VALUE PROPOSITIONS AND BENEFITS FOR THE CONSUMER ENABLED BY SMART METERS
The potential value propositions enabled by smart meters are divided in two groups:
standard and advanced/future value propositions. Smart meters can bring direct
benefits to consumers, both in terms of monetary (e.g., bill reduction) and non-monetary
value (e.g., reducing environmental footprint). However, it is important to note that these
direct benefits are possible benefits will depend on the consumer’s motivations and
abilities if he or she will benefit.
Figure 45: Standard and Advanced set of Value propositions enabled by Smart Meters and relationship with the main value propositions included in the CBAs carried out by Member States
Final Report Benchmarking Smart
Metering deployment in the EU-28 • 96/127 PUBLIC
Th
is d
ocum
en
t is
the
pro
pe
rty o
f T
racte
be
l Im
pa
ct
Be
lgiu
m S
.A.
An
y d
up
lica
tion
or
tra
nsm
issio
n t
o t
hird
pa
rtie
s is f
orb
idd
en
with
ou
t p
rio
r w
ritte
n a
ppro
va
l
5.3.3.1.1 Standard value propositions
In the following we describe the set of most common value propositions enabled by
smart meters (herein defined as “standard’) and the associated benefits for end-
consumers (Figure 46). Each value proposition brings one or several benefits to the
consumers. Basically, all standard value propositions allow consumers to better
understand and control their energy consumption.
It is worth mentioning, that not all these “standard” value propositions have been
considered in the CBAs carried out by Member States. The CBAs have mainly focused
on real time consumption display, real-time cost display, prepayment and implicit
demand response.
The following standard value propositions are considered:
• Comparison with peer consumers refers to the possibility to leverage smart
meters’ data to allow consumers to compare their energy consumption with
comparable peers.
• Bill forecasting refers to the possibility to use historic smart meter
consumption data and on-going consumption level to forecast the amount of
the bill at the end of the month. This can help consumers to better understand
their bill and also energy consumption patterns.
• Real-time consumption relates to the possibility to make accessible to
consumers energy consumption data in real-time. This can help reducing the
energy consumption and the associated bill, and could increase consumers’
awareness over their energy consumption and possible actions to have it
under control.
• Real-time cost displayed on a digital application or IHD can help the consumer
reduce the electricity bill and also better understand the bill.
• Unusual usage alert: This service alerts the consumer when an unusual high
consumption occurs during a longer time period. This can help reduce the
energy consumption, and can also increase safety.
• Historical consumption overview can be helpful for comparing consumption
during specific periods, which can help consumers understand and reduce
their energy consumption.
• Real-time carbon impact: This value proposition consists in making the
energy consumption CO2 footprint, expressed in tCO2 eq., available to the
consumer, which helps understand the impact of their energy consumption on
the environment.
• Pre-payment capability to display the credit balance to consumers who take a
pay-as-you-go tariff.
• Different tariffs (implicit demand response): Consumers with a smart meter
and a time-of-use tariff can benefit from it as smart meters provide them with
better information and enable them to react accordingly and to reduce their
energy bill.
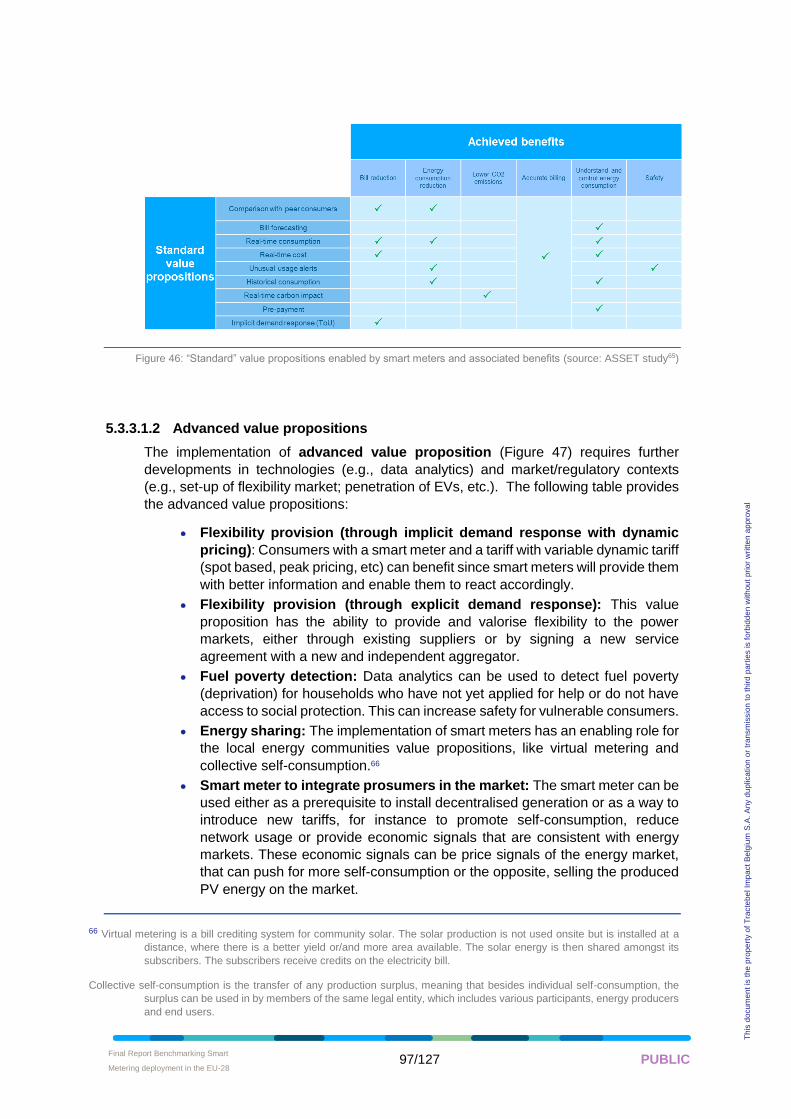
Final Report Benchmarking Smart
Metering deployment in the EU-28 • 97/127 PUBLIC
Th
is d
ocum
en
t is
the
pro
pe
rty o
f T
racte
be
l Im
pa
ct
Be
lgiu
m S
.A.
An
y d
up
lica
tion
or
tra
nsm
issio
n t
o t
hird
pa
rtie
s is f
orb
idd
en
with
ou
t p
rio
r w
ritte
n a
ppro
va
l
Figure 46: “Standard” value propositions enabled by smart meters and associated benefits (source: ASSET study65)
5.3.3.1.2 Advanced value propositions
The implementation of advanced value proposition (Figure 47) requires further
developments in technologies (e.g., data analytics) and market/regulatory contexts
(e.g., set-up of flexibility market; penetration of EVs, etc.). The following table provides
the advanced value propositions:
• Flexibility provision (through implicit demand response with dynamic
pricing): Consumers with a smart meter and a tariff with variable dynamic tariff
(spot based, peak pricing, etc) can benefit since smart meters will provide them
with better information and enable them to react accordingly.
• Flexibility provision (through explicit demand response): This value
proposition has the ability to provide and valorise flexibility to the power
markets, either through existing suppliers or by signing a new service
agreement with a new and independent aggregator.
• Fuel poverty detection: Data analytics can be used to detect fuel poverty
(deprivation) for households who have not yet applied for help or do not have
access to social protection. This can increase safety for vulnerable consumers.
• Energy sharing: The implementation of smart meters has an enabling role for
the local energy communities value propositions, like virtual metering and
collective self-consumption.66
• Smart meter to integrate prosumers in the market: The smart meter can be
used either as a prerequisite to install decentralised generation or as a way to
introduce new tariffs, for instance to promote self-consumption, reduce
network usage or provide economic signals that are consistent with energy
markets. These economic signals can be price signals of the energy market,
that can push for more self-consumption or the opposite, selling the produced
PV energy on the market.
66 Virtual metering is a bill crediting system for community solar. The solar production is not used onsite but is installed at a
distance, where there is a better yield or/and more area available. The solar energy is then shared amongst its
subscribers. The subscribers receive credits on the electricity bill.
Collective self-consumption is the transfer of any production surplus, meaning that besides individual self-consumption, the
surplus can be used in by members of the same legal entity, which includes various participants, energy producers
and end users.
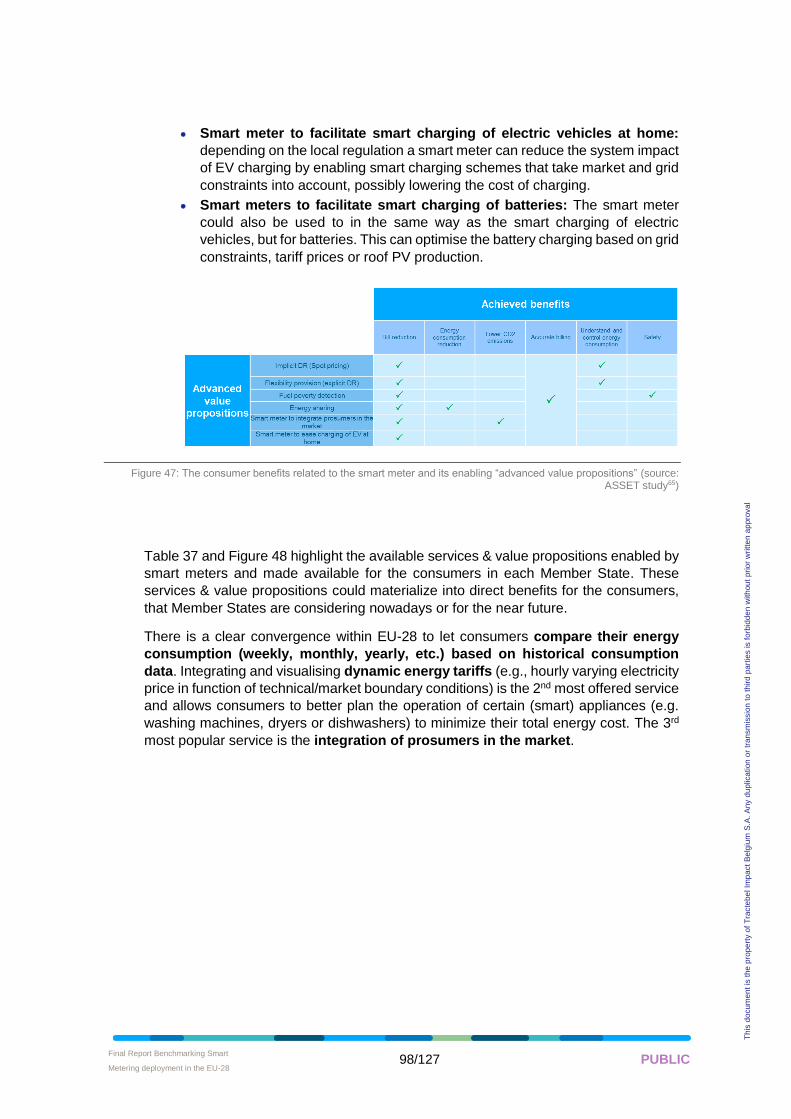
Final Report Benchmarking Smart
Metering deployment in the EU-28 • 98/127 PUBLIC
Th
is d
ocum
en
t is
the
pro
pe
rty o
f T
racte
be
l Im
pa
ct
Be
lgiu
m S
.A.
An
y d
up
lica
tion
or
tra
nsm
issio
n t
o t
hird
pa
rtie
s is f
orb
idd
en
with
ou
t p
rio
r w
ritte
n a
ppro
va
l
• Smart meter to facilitate smart charging of electric vehicles at home:
depending on the local regulation a smart meter can reduce the system impact
of EV charging by enabling smart charging schemes that take market and grid
constraints into account, possibly lowering the cost of charging.
• Smart meters to facilitate smart charging of batteries: The smart meter
could also be used to in the same way as the smart charging of electric
vehicles, but for batteries. This can optimise the battery charging based on grid
constraints, tariff prices or roof PV production.
Figure 47: The consumer benefits related to the smart meter and its enabling “advanced value propositions” (source: ASSET study65)
Table 37 and Figure 48 highlight the available services & value propositions enabled by
smart meters and made available for the consumers in each Member State. These
services & value propositions could materialize into direct benefits for the consumers,
that Member States are considering nowadays or for the near future.
There is a clear convergence within EU-28 to let consumers compare their energy
consumption (weekly, monthly, yearly, etc.) based on historical consumption
data. Integrating and visualising dynamic energy tariffs (e.g., hourly varying electricity
price in function of technical/market boundary conditions) is the 2nd most offered service
and allows consumers to better plan the operation of certain (smart) appliances (e.g.
washing machines, dryers or dishwashers) to minimize their total energy cost. The 3rd
most popular service is the integration of prosumers in the market.
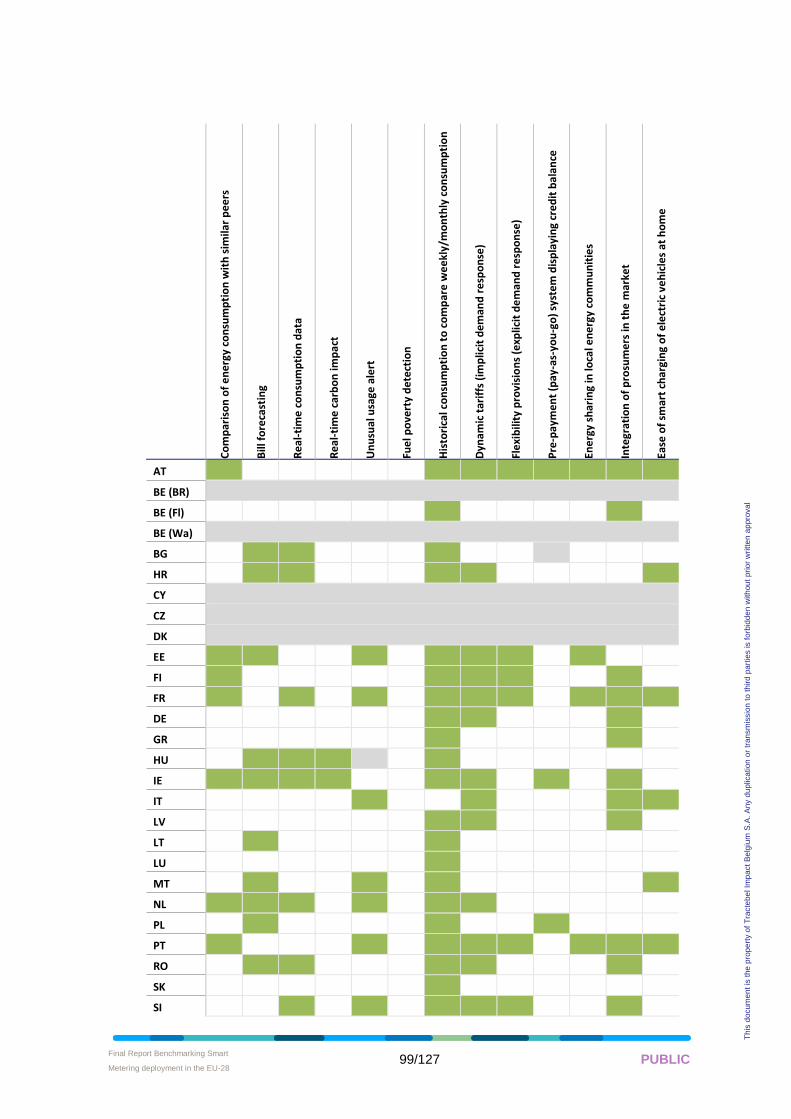
Final Report Benchmarking Smart
Metering deployment in the EU-28 • 99/127 PUBLIC
Th
is d
ocum
en
t is
the
pro
pe
rty o
f T
racte
be
l Im
pa
ct
Be
lgiu
m S
.A.
An
y d
up
lica
tion
or
tra
nsm
issio
n t
o t
hird
pa
rtie
s is f
orb
idd
en
with
ou
t p
rio
r w
ritte
n a
ppro
va
l
Co
mp
aris
on
of
en
erg
y co
nsu
mp
tio
n w
ith
sim
ilar
pe
ers
Bill
fo
reca
stin
g
Re
al-t
ime
co
nsu
mp
tio
n d
ata
Re
al-t
ime
car
bo
n im
pa
ct
Un
usu
al u
sage
ale
rt
Fue
l po
vert
y d
ete
ctio
n
His
tori
cal c
on
sum
pti
on
to
co
mp
are
we
ekl
y/m
on
thly
co
nsu
mp
tio
n
Dyn
amic
tar
iffs
(im
plic
it d
em
and
re
spo
nse
)
Fle
xib
ility
pro
visi
on
s (e
xplic
it d
em
and
re
spo
nse
)
Pre
-pay
me
nt
(pay
-as-
you
-go
) sy
ste
m d
isp
layi
ng
cre
dit
ba
lan
ce
Ene
rgy
shar
ing
in lo
cal e
ne
rgy
com
mu
nit
ies
Inte
grat
ion
of
pro
sum
ers
in t
he
mar
ket
Ease
of
smar
t ch
argi
ng
of
ele
ctri
c ve
hic
les
at h
om
e
AT
BE (BR)
BE (Fl)
BE (Wa)
BG
HR
CY
CZ
DK
EE
FI
FR
DE
GR
HU
IE
IT
LV
LT
LU
MT
NL
PL
PT
RO
SK
SI
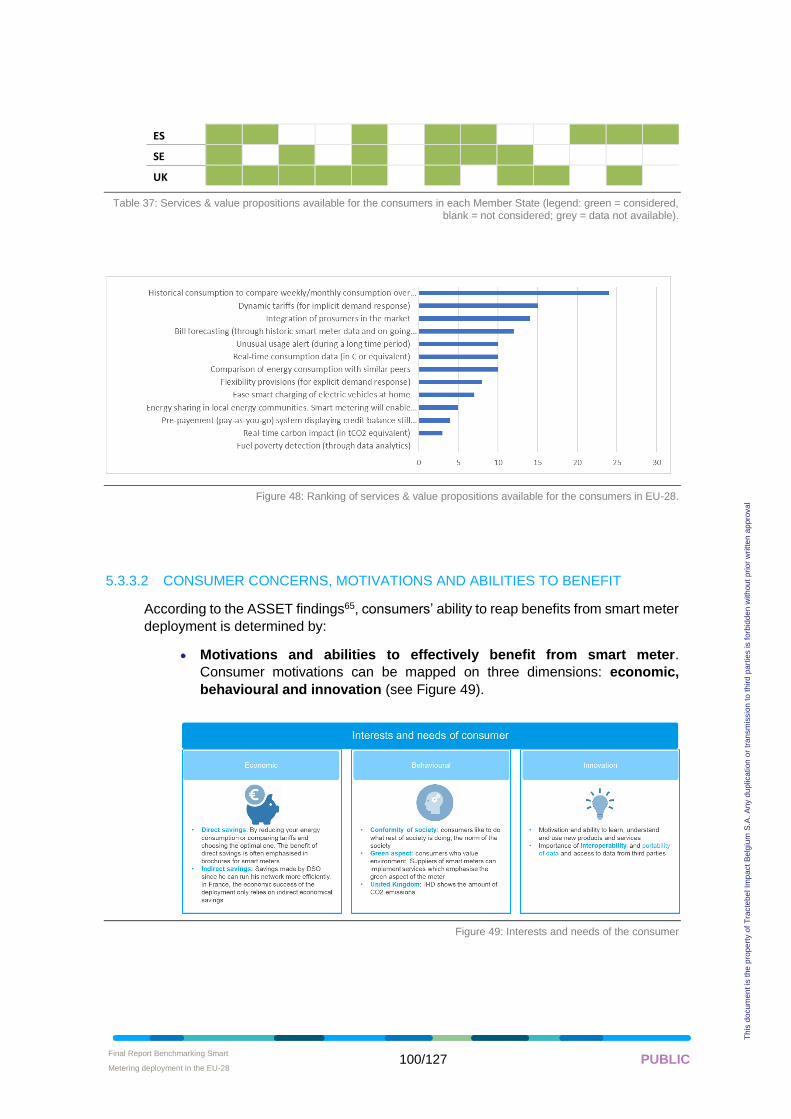
Final Report Benchmarking Smart
Metering deployment in the EU-28 • 100/127 PUBLIC
Th
is d
ocum
en
t is
the
pro
pe
rty o
f T
racte
be
l Im
pa
ct
Be
lgiu
m S
.A.
An
y d
up
lica
tion
or
tra
nsm
issio
n t
o t
hird
pa
rtie
s is f
orb
idd
en
with
ou
t p
rio
r w
ritte
n a
ppro
va
l
ES
SE
UK
Table 37: Services & value propositions available for the consumers in each Member State (legend: green = considered, blank = not considered; grey = data not available).
Figure 48: Ranking of services & value propositions available for the consumers in EU-28.
5.3.3.2 CONSUMER CONCERNS, MOTIVATIONS AND ABILITIES TO BENEFIT
According to the ASSET findings65, consumers’ ability to reap benefits from smart meter
deployment is determined by:
• Motivations and abilities to effectively benefit from smart meter.
Consumer motivations can be mapped on three dimensions: economic,
behavioural and innovation (see Figure 49).
Figure 49: Interests and needs of the consumer
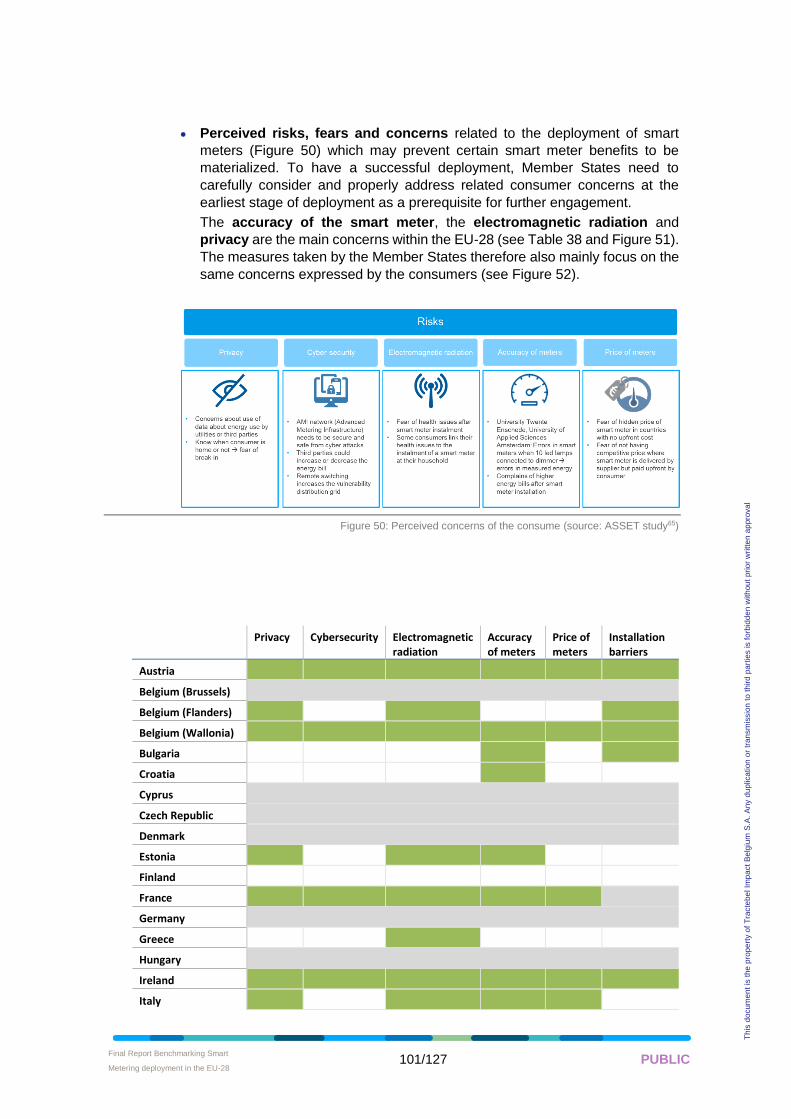
Final Report Benchmarking Smart
Metering deployment in the EU-28 • 101/127 PUBLIC
Th
is d
ocum
en
t is
the
pro
pe
rty o
f T
racte
be
l Im
pa
ct
Be
lgiu
m S
.A.
An
y d
up
lica
tion
or
tra
nsm
issio
n t
o t
hird
pa
rtie
s is f
orb
idd
en
with
ou
t p
rio
r w
ritte
n a
ppro
va
l
• Perceived risks, fears and concerns related to the deployment of smart
meters (Figure 50) which may prevent certain smart meter benefits to be
materialized. To have a successful deployment, Member States need to
carefully consider and properly address related consumer concerns at the
earliest stage of deployment as a prerequisite for further engagement.
The accuracy of the smart meter, the electromagnetic radiation and
privacy are the main concerns within the EU-28 (see Table 38 and Figure 51).
The measures taken by the Member States therefore also mainly focus on the
same concerns expressed by the consumers (see Figure 52).
Figure 50: Perceived concerns of the consume (source: ASSET study65)
Privacy Cybersecurity Electromagnetic radiation
Accuracy of meters
Price of meters
Installation barriers
Austria
Belgium (Brussels)
Belgium (Flanders)
Belgium (Wallonia)
Bulgaria
Croatia
Cyprus
Czech Republic
Denmark
Estonia
Finland
France
Germany
Greece
Hungary
Ireland
Italy
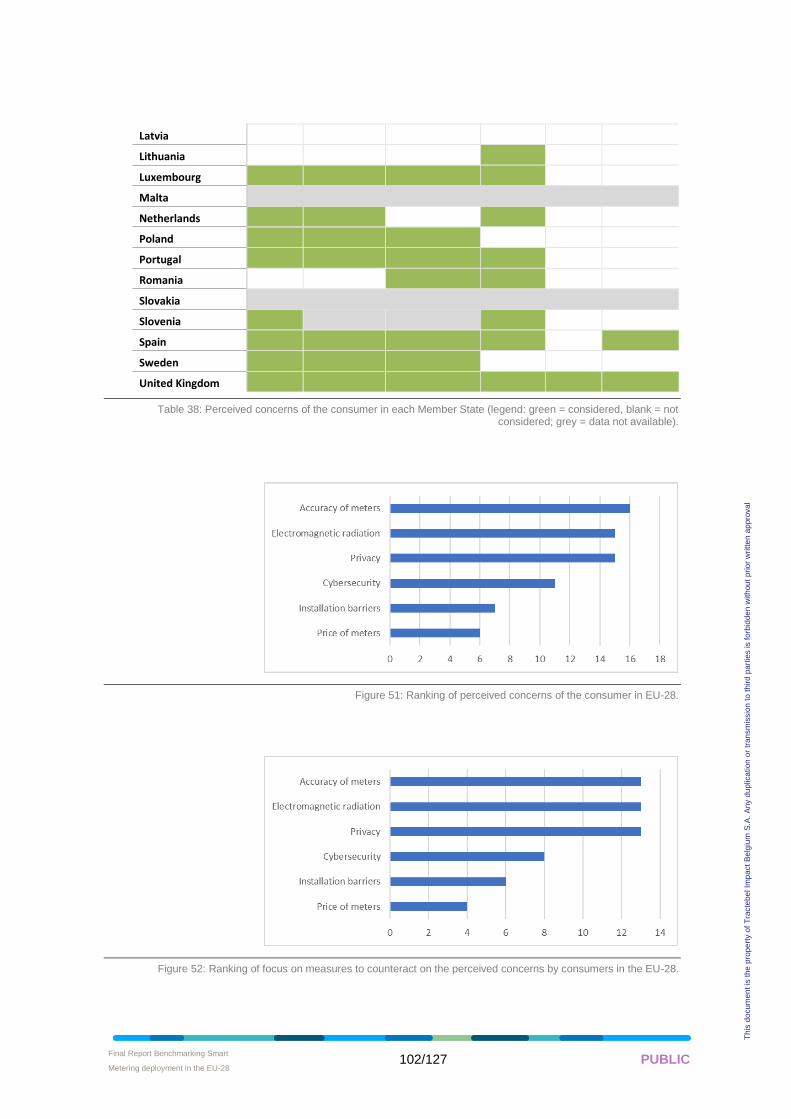
Final Report Benchmarking Smart
Metering deployment in the EU-28 • 102/127 PUBLIC
Th
is d
ocum
en
t is
the
pro
pe
rty o
f T
racte
be
l Im
pa
ct
Be
lgiu
m S
.A.
An
y d
up
lica
tion
or
tra
nsm
issio
n t
o t
hird
pa
rtie
s is f
orb
idd
en
with
ou
t p
rio
r w
ritte
n a
ppro
va
l
Latvia
Lithuania
Luxembourg
Malta
Netherlands
Poland
Portugal
Romania
Slovakia
Slovenia
Spain
Sweden
United Kingdom
Table 38: Perceived concerns of the consumer in each Member State (legend: green = considered, blank = not considered; grey = data not available).
Figure 51: Ranking of perceived concerns of the consumer in EU-28.
Figure 52: Ranking of focus on measures to counteract on the perceived concerns by consumers in the EU-28.
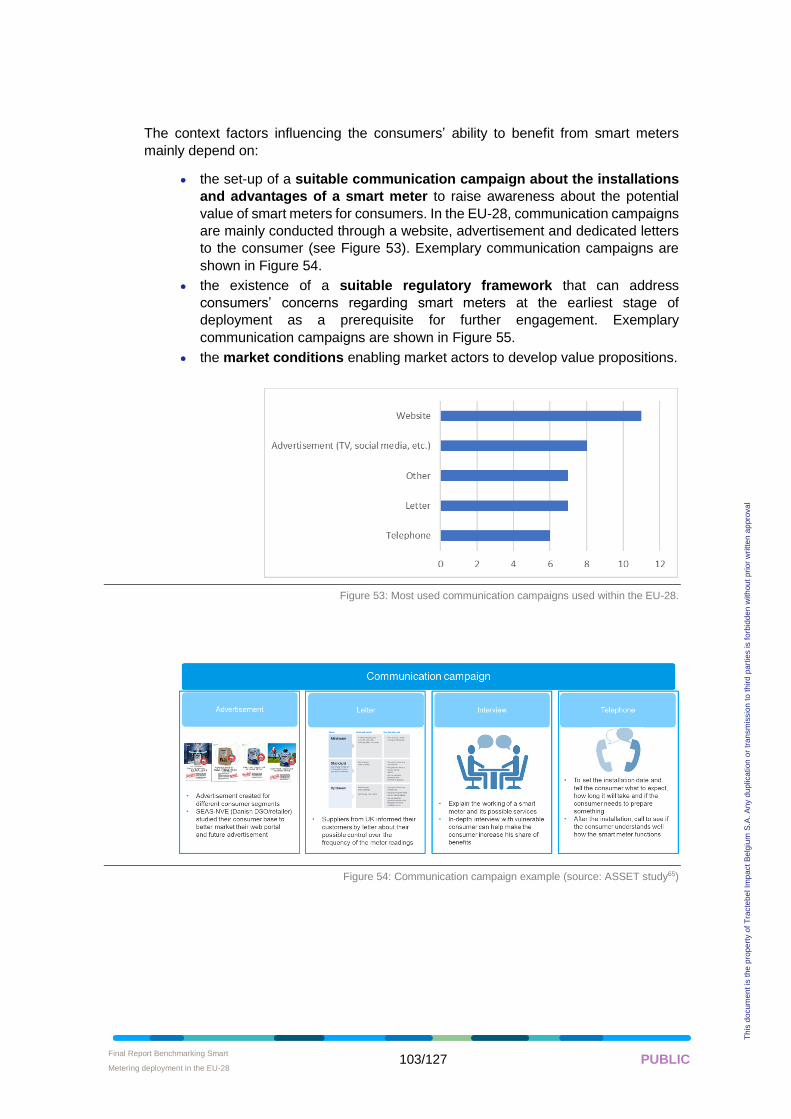
Final Report Benchmarking Smart
Metering deployment in the EU-28 • 103/127 PUBLIC
Th
is d
ocum
en
t is
the
pro
pe
rty o
f T
racte
be
l Im
pa
ct
Be
lgiu
m S
.A.
An
y d
up
lica
tion
or
tra
nsm
issio
n t
o t
hird
pa
rtie
s is f
orb
idd
en
with
ou
t p
rio
r w
ritte
n a
ppro
va
l
The context factors influencing the consumers’ ability to benefit from smart meters
mainly depend on:
• the set-up of a suitable communication campaign about the installations
and advantages of a smart meter to raise awareness about the potential
value of smart meters for consumers. In the EU-28, communication campaigns
are mainly conducted through a website, advertisement and dedicated letters
to the consumer (see Figure 53). Exemplary communication campaigns are
shown in Figure 54.
• the existence of a suitable regulatory framework that can address
consumers’ concerns regarding smart meters at the earliest stage of
deployment as a prerequisite for further engagement. Exemplary
communication campaigns are shown in Figure 55.
• the market conditions enabling market actors to develop value propositions.
Figure 53: Most used communication campaigns used within the EU-28.
Figure 54: Communication campaign example (source: ASSET study65)
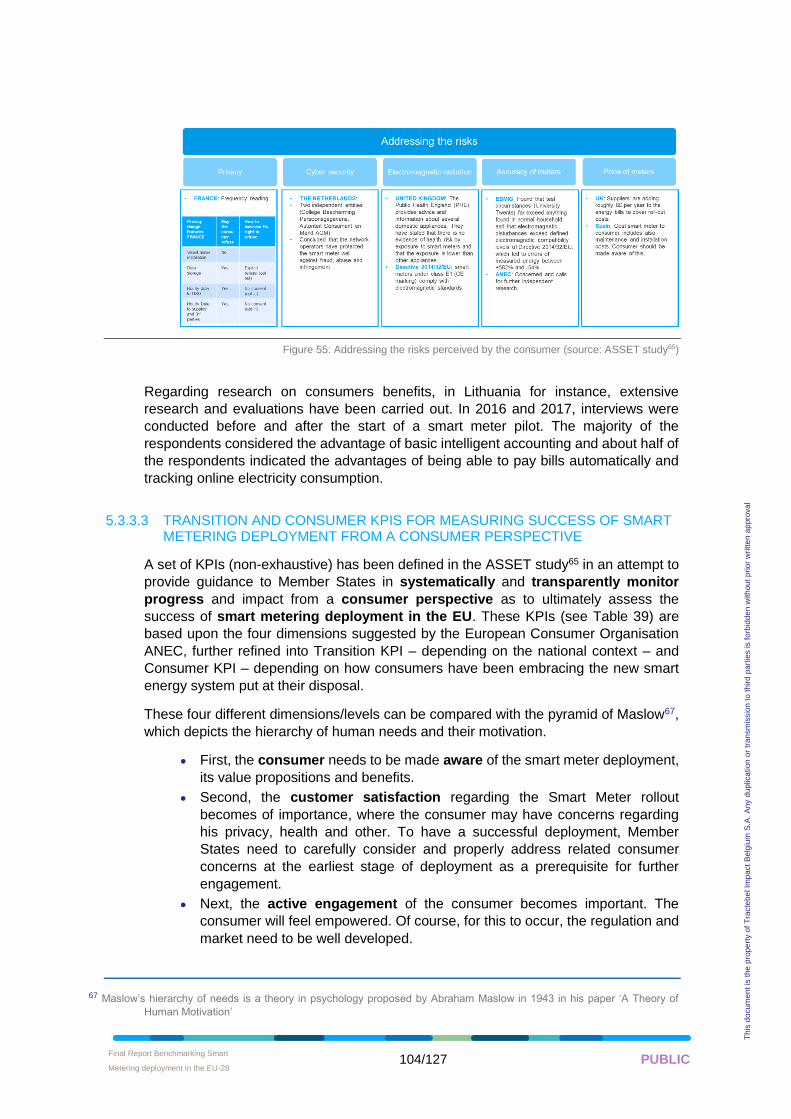
Final Report Benchmarking Smart
Metering deployment in the EU-28 • 104/127 PUBLIC
Th
is d
ocum
en
t is
the
pro
pe
rty o
f T
racte
be
l Im
pa
ct
Be
lgiu
m S
.A.
An
y d
up
lica
tion
or
tra
nsm
issio
n t
o t
hird
pa
rtie
s is f
orb
idd
en
with
ou
t p
rio
r w
ritte
n a
ppro
va
l
Figure 55: Addressing the risks perceived by the consumer (source: ASSET study65)
Regarding research on consumers benefits, in Lithuania for instance, extensive
research and evaluations have been carried out. In 2016 and 2017, interviews were
conducted before and after the start of a smart meter pilot. The majority of the
respondents considered the advantage of basic intelligent accounting and about half of
the respondents indicated the advantages of being able to pay bills automatically and
tracking online electricity consumption.
5.3.3.3 TRANSITION AND CONSUMER KPIS FOR MEASURING SUCCESS OF SMART METERING DEPLOYMENT FROM A CONSUMER PERSPECTIVE
A set of KPIs (non-exhaustive) has been defined in the ASSET study65 in an attempt to
provide guidance to Member States in systematically and transparently monitor
progress and impact from a consumer perspective as to ultimately assess the
success of smart metering deployment in the EU. These KPIs (see Table 39) are
based upon the four dimensions suggested by the European Consumer Organisation
ANEC, further refined into Transition KPI – depending on the national context – and
Consumer KPI – depending on how consumers have been embracing the new smart
energy system put at their disposal.
These four different dimensions/levels can be compared with the pyramid of Maslow67,
which depicts the hierarchy of human needs and their motivation.
• First, the consumer needs to be made aware of the smart meter deployment,
its value propositions and benefits.
• Second, the customer satisfaction regarding the Smart Meter rollout
becomes of importance, where the consumer may have concerns regarding
his privacy, health and other. To have a successful deployment, Member
States need to carefully consider and properly address related consumer
concerns at the earliest stage of deployment as a prerequisite for further
engagement.
• Next, the active engagement of the consumer becomes important. The
consumer will feel empowered. Of course, for this to occur, the regulation and
market need to be well developed.
67 Maslow’s hierarchy of needs is a theory in psychology proposed by Abraham Maslow in 1943 in his paper ‘A Theory of
Human Motivation’
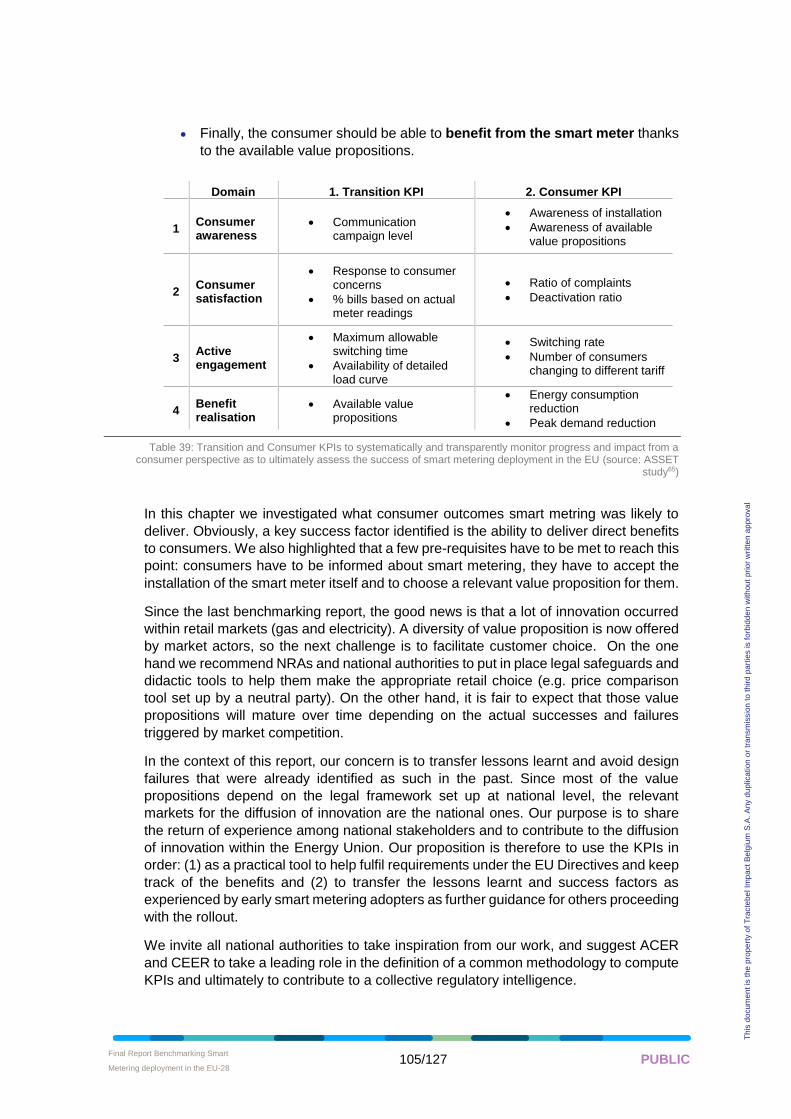
Final Report Benchmarking Smart
Metering deployment in the EU-28 • 105/127 PUBLIC
Th
is d
ocum
en
t is
the
pro
pe
rty o
f T
racte
be
l Im
pa
ct
Be
lgiu
m S
.A.
An
y d
up
lica
tion
or
tra
nsm
issio
n t
o t
hird
pa
rtie
s is f
orb
idd
en
with
ou
t p
rio
r w
ritte
n a
ppro
va
l
• Finally, the consumer should be able to benefit from the smart meter thanks
to the available value propositions.
Domain 1. Transition KPI 2. Consumer KPI
1 Consumer awareness
• Communication campaign level
• Awareness of installation
• Awareness of available value propositions
2 Consumer satisfaction
• Response to consumer concerns
• % bills based on actual meter readings
• Ratio of complaints
• Deactivation ratio
3 Active engagement
• Maximum allowable switching time
• Availability of detailed load curve
• Switching rate
• Number of consumers changing to different tariff
4 Benefit realisation
• Available value propositions
• Energy consumption reduction
• Peak demand reduction
Table 39: Transition and Consumer KPIs to systematically and transparently monitor progress and impact from a consumer perspective as to ultimately assess the success of smart metering deployment in the EU (source: ASSET
study65)
In this chapter we investigated what consumer outcomes smart metring was likely to
deliver. Obviously, a key success factor identified is the ability to deliver direct benefits
to consumers. We also highlighted that a few pre-requisites have to be met to reach this
point: consumers have to be informed about smart metering, they have to accept the
installation of the smart meter itself and to choose a relevant value proposition for them.
Since the last benchmarking report, the good news is that a lot of innovation occurred
within retail markets (gas and electricity). A diversity of value proposition is now offered
by market actors, so the next challenge is to facilitate customer choice. On the one
hand we recommend NRAs and national authorities to put in place legal safeguards and
didactic tools to help them make the appropriate retail choice (e.g. price comparison
tool set up by a neutral party). On the other hand, it is fair to expect that those value
propositions will mature over time depending on the actual successes and failures
triggered by market competition.
In the context of this report, our concern is to transfer lessons learnt and avoid design
failures that were already identified as such in the past. Since most of the value
propositions depend on the legal framework set up at national level, the relevant
markets for the diffusion of innovation are the national ones. Our purpose is to share
the return of experience among national stakeholders and to contribute to the diffusion
of innovation within the Energy Union. Our proposition is therefore to use the KPIs in
order: (1) as a practical tool to help fulfil requirements under the EU Directives and keep
track of the benefits and (2) to transfer the lessons learnt and success factors as
experienced by early smart metering adopters as further guidance for others proceeding
with the rollout.
We invite all national authorities to take inspiration from our work, and suggest ACER
and CEER to take a leading role in the definition of a common methodology to compute
KPIs and ultimately to contribute to a collective regulatory intelligence.
Final Report Benchmarking Smart
Metering deployment in the EU-28 • 106/127 PUBLIC
Th
is d
ocum
en
t is
the
pro
pe
rty o
f T
racte
be
l Im
pa
ct
Be
lgiu
m S
.A.
An
y d
up
lica
tion
or
tra
nsm
issio
n t
o t
hird
pa
rtie
s is f
orb
idd
en
with
ou
t p
rio
r w
ritte
n a
ppro
va
l
6 DEEP DIVES
The information collected at national level has been consolidated and is presented as
well as the findings out of our initial analysis (covering tasks 1 to 3). The consolidation
exercise will be further continued during the coming weeks for the remaining tasks.
This calls for two comments:
• Comparability issues will be dealt with, especially regarding the results of
the cost benefit assessments (task 2).
• The content of the most advanced tasks related to data management (task
6) and consumer outcomes (task 7) show a high variability from country
to country. Consolidating information might therefore not be the best way
to show the relevant results of our investigation, and we recommend to
add a few deep dives in the final report that focus on the most interesting
countries where there is already some activity regarding emerging
services from the deployment of smart meters.
Three smart meter case studies68 across Europe are described below to illustrate the
Smart meter advancements achieved so far:
• The roll out of the 2nd generation of smart meters in Italy;
• The digital transformation in Estonia;
• Advanced consumer services in The Netherlands.
6.1 Roll out of the 2nd generation of smart electricity meters in Italy
Italy is a frontrunner of smart metering deployment in the EU, as it was the first European
country to introduce a large-scale deployment of remotely-read, advanced electricity
meters for low-voltage end-users and is the world's first country in terms of number of
installed smart meters in operation (over 35 million).
As not fully compliant with the subsequent functional requirements by the EC, the first
generation (1G) of smart meters would not have allowed the development of additional
and advanced services (Table 40 and Figure 56). Therefore, Italy has introduced the
second generation (2G) of smart meters that are able to deliver near-real time
information to consumers and third parties of their choice via a separate communication
channel, and therefore making it possible to offer advanced and customer-centric
services, at the same cost of 1G smart meters. The 2G smart meter will introduce extra
benefits for the consumer and other market parties (Figure 56).
68 The country selection was the responsibility of the consortium partners and achieves a balance between the level of access
to information about the national deployment plan and the representativeness of contrasted implementation
strategies. It has come to our knowledge that the three selected countries have adopted a centralized data
management model, nevertheless it is not our intention to favour one model compared to another.
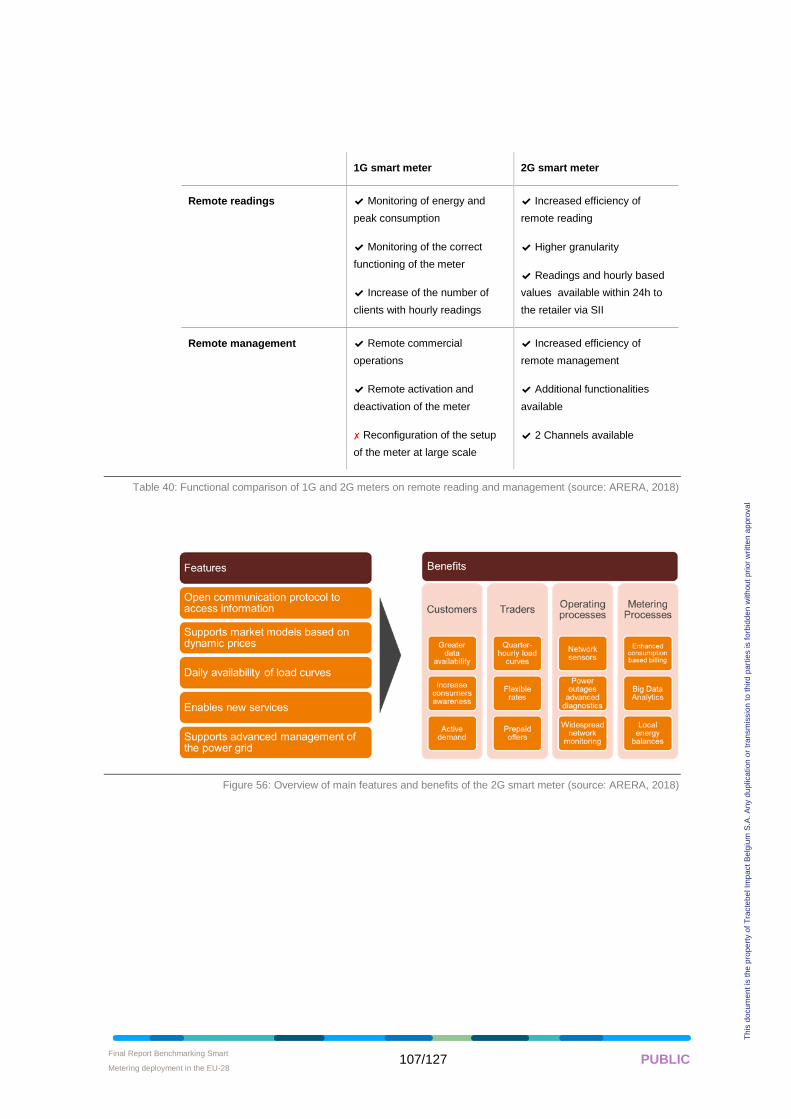
Final Report Benchmarking Smart
Metering deployment in the EU-28 • 107/127 PUBLIC
Th
is d
ocum
en
t is
the
pro
pe
rty o
f T
racte
be
l Im
pa
ct
Be
lgiu
m S
.A.
An
y d
up
lica
tion
or
tra
nsm
issio
n t
o t
hird
pa
rtie
s is f
orb
idd
en
with
ou
t p
rio
r w
ritte
n a
ppro
va
l
1G smart meter 2G smart meter
Remote readings ✔ Monitoring of energy and
peak consumption
✔ Monitoring of the correct
functioning of the meter
✔ Increase of the number of
clients with hourly readings
✔ Increased efficiency of
remote reading
✔ Higher granularity
✔ Readings and hourly based
values available within 24h to
the retailer via SII
Remote management ✔ Remote commercial
operations
✔ Remote activation and
deactivation of the meter
✘ Reconfiguration of the setup
of the meter at large scale
✔ Increased efficiency of
remote management
✔ Additional functionalities
available
✔ 2 Channels available
Table 40: Functional comparison of 1G and 2G meters on remote reading and management (source: ARERA, 2018)
Figure 56: Overview of main features and benefits of the 2G smart meter (source: ARERA, 2018)
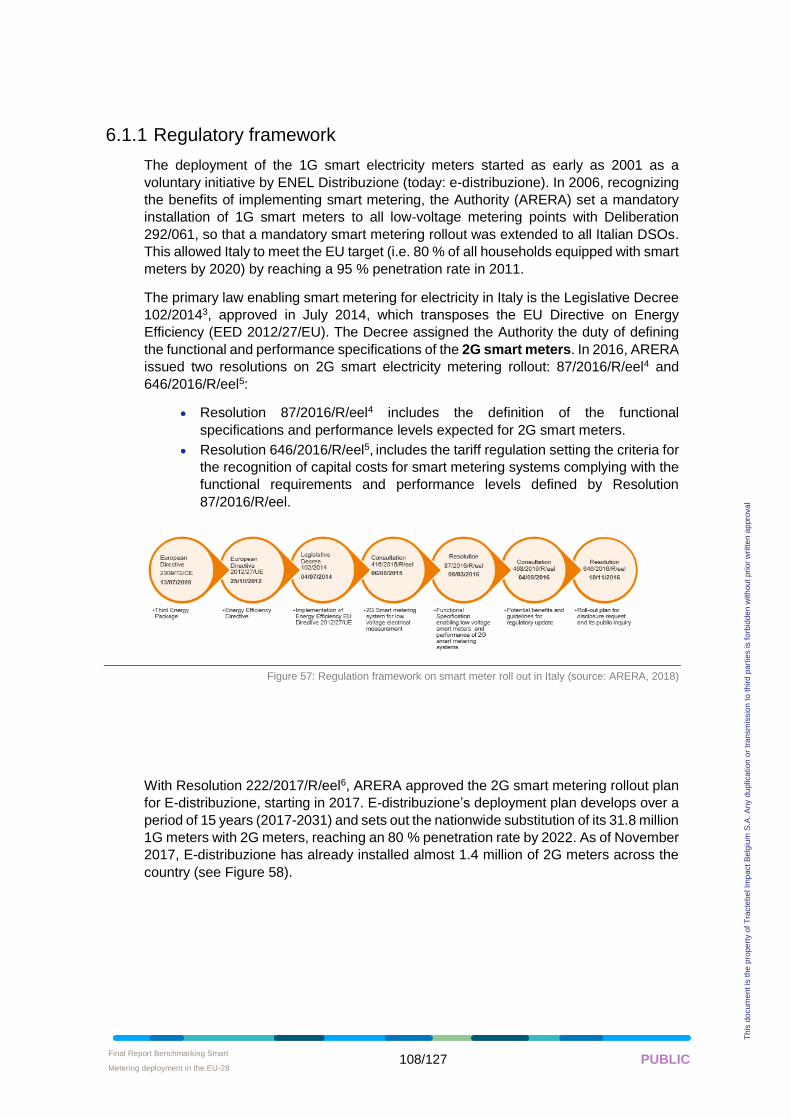
Final Report Benchmarking Smart
Metering deployment in the EU-28 • 108/127 PUBLIC
Th
is d
ocum
en
t is
the
pro
pe
rty o
f T
racte
be
l Im
pa
ct
Be
lgiu
m S
.A.
An
y d
up
lica
tion
or
tra
nsm
issio
n t
o t
hird
pa
rtie
s is f
orb
idd
en
with
ou
t p
rio
r w
ritte
n a
ppro
va
l
6.1.1 Regulatory framework
The deployment of the 1G smart electricity meters started as early as 2001 as a
voluntary initiative by ENEL Distribuzione (today: e-distribuzione). In 2006, recognizing
the benefits of implementing smart metering, the Authority (ARERA) set a mandatory
installation of 1G smart meters to all low-voltage metering points with Deliberation
292/061, so that a mandatory smart metering rollout was extended to all Italian DSOs.
This allowed Italy to meet the EU target (i.e. 80 % of all households equipped with smart
meters by 2020) by reaching a 95 % penetration rate in 2011.
The primary law enabling smart metering for electricity in Italy is the Legislative Decree
102/20143, approved in July 2014, which transposes the EU Directive on Energy
Efficiency (EED 2012/27/EU). The Decree assigned the Authority the duty of defining
the functional and performance specifications of the 2G smart meters. In 2016, ARERA
issued two resolutions on 2G smart electricity metering rollout: 87/2016/R/eel4 and
646/2016/R/eel5:
• Resolution 87/2016/R/eel4 includes the definition of the functional
specifications and performance levels expected for 2G smart meters.
• Resolution 646/2016/R/eel5, includes the tariff regulation setting the criteria for
the recognition of capital costs for smart metering systems complying with the
functional requirements and performance levels defined by Resolution
87/2016/R/eel.
Figure 57: Regulation framework on smart meter roll out in Italy (source: ARERA, 2018)
With Resolution 222/2017/R/eel6, ARERA approved the 2G smart metering rollout plan
for E-distribuzione, starting in 2017. E-distribuzione’s deployment plan develops over a
period of 15 years (2017-2031) and sets out the nationwide substitution of its 31.8 million
1G meters with 2G meters, reaching an 80 % penetration rate by 2022. As of November
2017, E-distribuzione has already installed almost 1.4 million of 2G meters across the
country (see Figure 58).
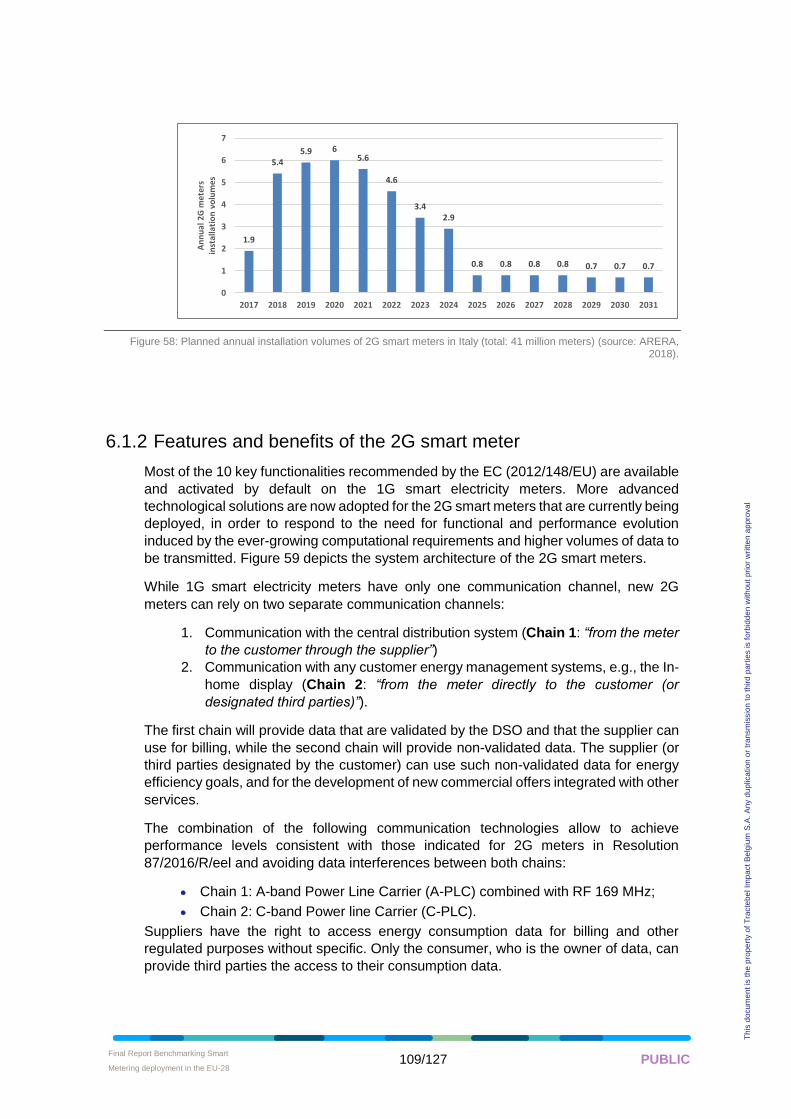
Final Report Benchmarking Smart
Metering deployment in the EU-28 • 109/127 PUBLIC
Th
is d
ocum
en
t is
the
pro
pe
rty o
f T
racte
be
l Im
pa
ct
Be
lgiu
m S
.A.
An
y d
up
lica
tion
or
tra
nsm
issio
n t
o t
hird
pa
rtie
s is f
orb
idd
en
with
ou
t p
rio
r w
ritte
n a
ppro
va
l
Figure 58: Planned annual installation volumes of 2G smart meters in Italy (total: 41 million meters) (source: ARERA, 2018).
6.1.2 Features and benefits of the 2G smart meter
Most of the 10 key functionalities recommended by the EC (2012/148/EU) are available
and activated by default on the 1G smart electricity meters. More advanced
technological solutions are now adopted for the 2G smart meters that are currently being
deployed, in order to respond to the need for functional and performance evolution
induced by the ever-growing computational requirements and higher volumes of data to
be transmitted. Figure 59 depicts the system architecture of the 2G smart meters.
While 1G smart electricity meters have only one communication channel, new 2G
meters can rely on two separate communication channels:
1. Communication with the central distribution system (Chain 1: “from the meter
to the customer through the supplier”)
2. Communication with any customer energy management systems, e.g., the In-
home display (Chain 2: “from the meter directly to the customer (or
designated third parties)”).
The first chain will provide data that are validated by the DSO and that the supplier can
use for billing, while the second chain will provide non-validated data. The supplier (or
third parties designated by the customer) can use such non-validated data for energy
efficiency goals, and for the development of new commercial offers integrated with other
services.
The combination of the following communication technologies allow to achieve
performance levels consistent with those indicated for 2G meters in Resolution
87/2016/R/eel and avoiding data interferences between both chains:
• Chain 1: A-band Power Line Carrier (A-PLC) combined with RF 169 MHz;
• Chain 2: C-band Power line Carrier (C-PLC).
Suppliers have the right to access energy consumption data for billing and other
regulated purposes without specific. Only the consumer, who is the owner of data, can
provide third parties the access to their consumption data.
1.9
5.45.9 6
5.6
4.6
3.42.9
0.8 0.8 0.8 0.8 0.7 0.7 0.7
0
1
2
3
4
5
6
7
2017 2018 2019 2020 2021 2022 2023 2024 2025 2026 2027 2028 2029 2030 2031
An
nu
al 2
G m
eter
sin
stal
lati
on
vo
lum
es
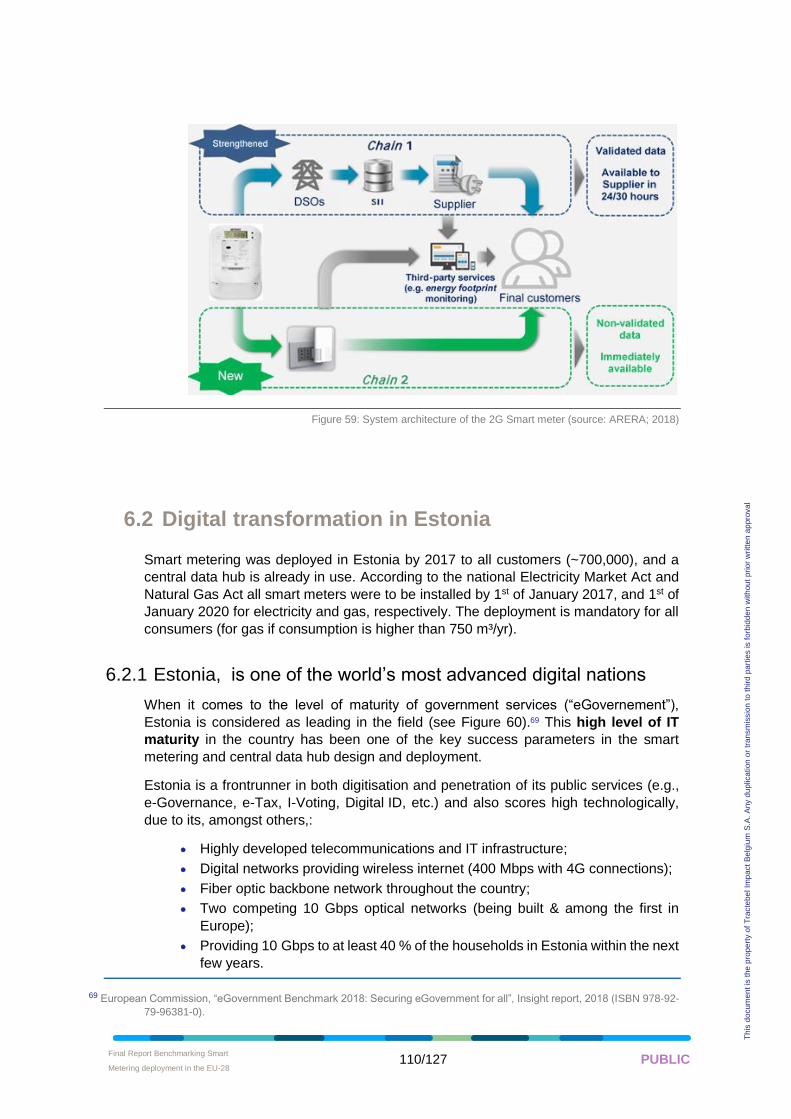
Final Report Benchmarking Smart
Metering deployment in the EU-28 • 110/127 PUBLIC
Th
is d
ocum
en
t is
the
pro
pe
rty o
f T
racte
be
l Im
pa
ct
Be
lgiu
m S
.A.
An
y d
up
lica
tion
or
tra
nsm
issio
n t
o t
hird
pa
rtie
s is f
orb
idd
en
with
ou
t p
rio
r w
ritte
n a
ppro
va
l
Figure 59: System architecture of the 2G Smart meter (source: ARERA; 2018)
6.2 Digital transformation in Estonia
Smart metering was deployed in Estonia by 2017 to all customers (~700,000), and a
central data hub is already in use. According to the national Electricity Market Act and
Natural Gas Act all smart meters were to be installed by 1st of January 2017, and 1st of
January 2020 for electricity and gas, respectively. The deployment is mandatory for all
consumers (for gas if consumption is higher than 750 m³/yr).
6.2.1 Estonia, is one of the world’s most advanced digital nations
When it comes to the level of maturity of government services (“eGovernement”),
Estonia is considered as leading in the field (see Figure 60).69 This high level of IT
maturity in the country has been one of the key success parameters in the smart
metering and central data hub design and deployment.
Estonia is a frontrunner in both digitisation and penetration of its public services (e.g.,
e-Governance, e-Tax, I-Voting, Digital ID, etc.) and also scores high technologically,
due to its, amongst others,:
• Highly developed telecommunications and IT infrastructure;
• Digital networks providing wireless internet (400 Mbps with 4G connections);
• Fiber optic backbone network throughout the country;
• Two competing 10 Gbps optical networks (being built & among the first in
Europe);
• Providing 10 Gbps to at least 40 % of the households in Estonia within the next
few years.
69 European Commission, “eGovernment Benchmark 2018: Securing eGovernment for all”, Insight report, 2018 (ISBN 978-92-
79-96381-0).
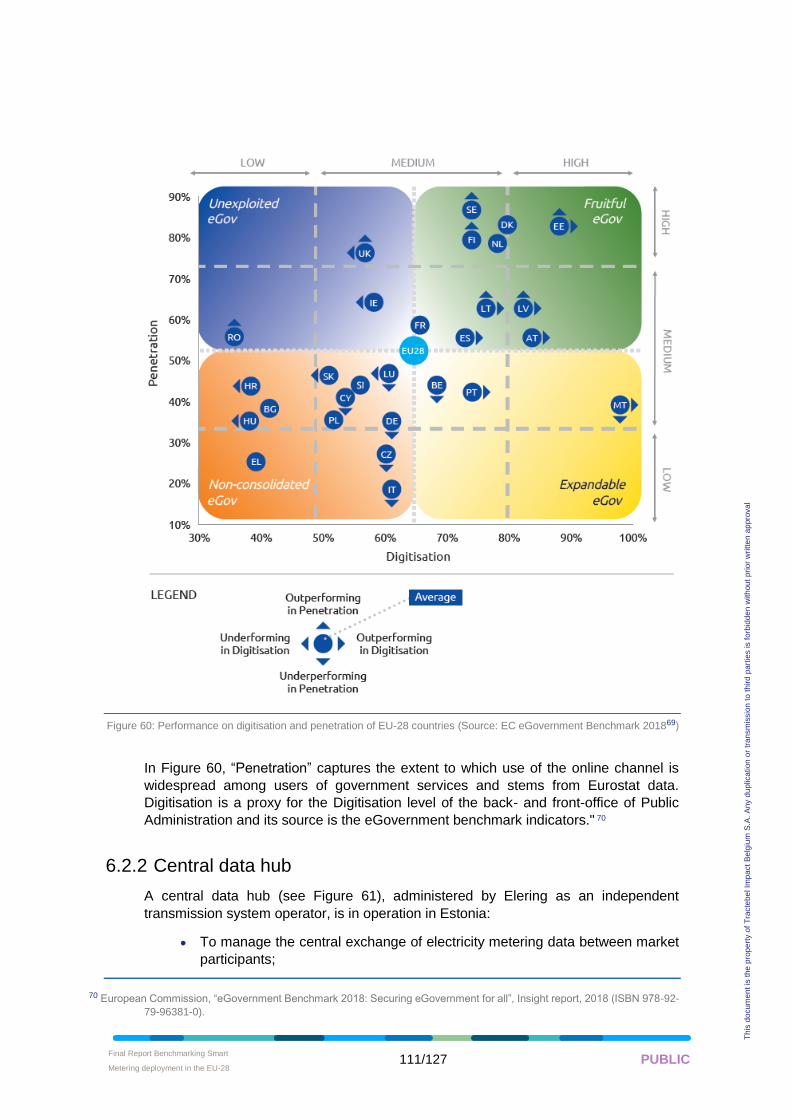
Final Report Benchmarking Smart
Metering deployment in the EU-28 • 111/127 PUBLIC
Th
is d
ocum
en
t is
the
pro
pe
rty o
f T
racte
be
l Im
pa
ct
Be
lgiu
m S
.A.
An
y d
up
lica
tion
or
tra
nsm
issio
n t
o t
hird
pa
rtie
s is f
orb
idd
en
with
ou
t p
rio
r w
ritte
n a
ppro
va
l
Figure 60: Performance on digitisation and penetration of EU-28 countries (Source: EC eGovernment Benchmark 201869)
In Figure 60, “Penetration” captures the extent to which use of the online channel is
widespread among users of government services and stems from Eurostat data.
Digitisation is a proxy for the Digitisation level of the back- and front-office of Public
Administration and its source is the eGovernment benchmark indicators." 70
6.2.2 Central data hub
A central data hub (see Figure 61), administered by Elering as an independent
transmission system operator, is in operation in Estonia:
• To manage the central exchange of electricity metering data between market
participants;
70 European Commission, “eGovernment Benchmark 2018: Securing eGovernment for all”, Insight report, 2018 (ISBN 978-92-
79-96381-0).
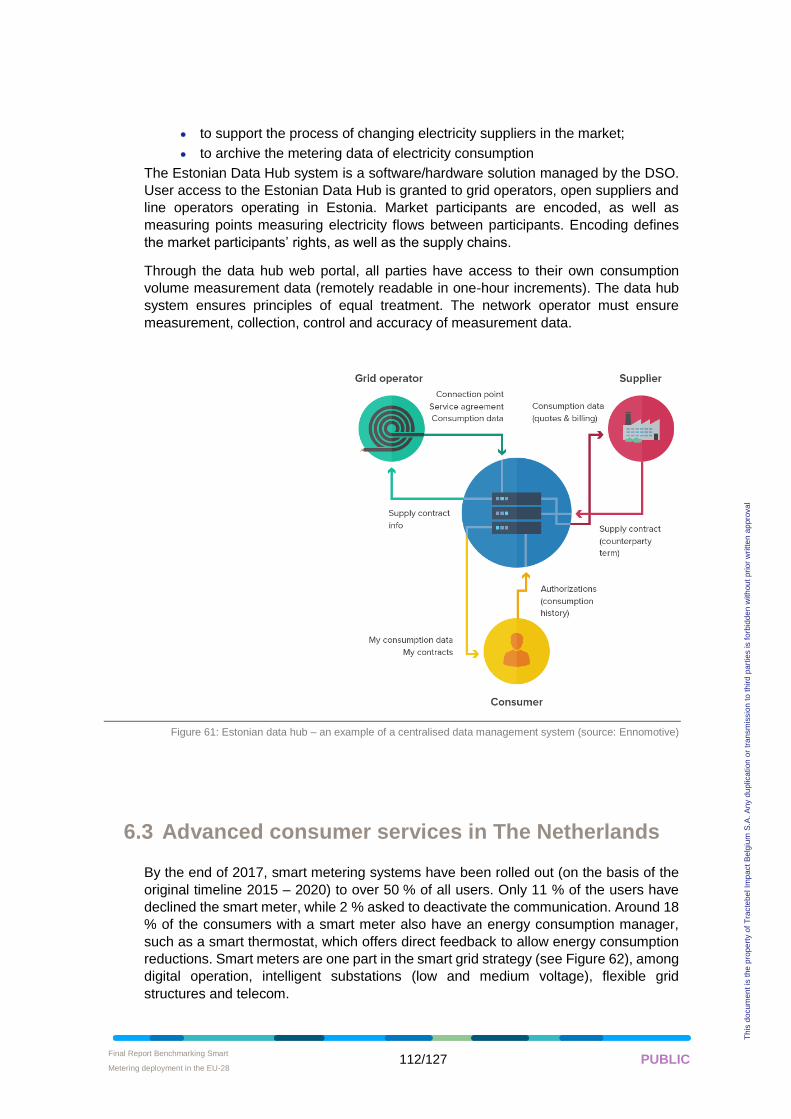
Final Report Benchmarking Smart
Metering deployment in the EU-28 • 112/127 PUBLIC
Th
is d
ocum
en
t is
the
pro
pe
rty o
f T
racte
be
l Im
pa
ct
Be
lgiu
m S
.A.
An
y d
up
lica
tion
or
tra
nsm
issio
n t
o t
hird
pa
rtie
s is f
orb
idd
en
with
ou
t p
rio
r w
ritte
n a
ppro
va
l
• to support the process of changing electricity suppliers in the market;
• to archive the metering data of electricity consumption
The Estonian Data Hub system is a software/hardware solution managed by the DSO.
User access to the Estonian Data Hub is granted to grid operators, open suppliers and
line operators operating in Estonia. Market participants are encoded, as well as
measuring points measuring electricity flows between participants. Encoding defines
the market participants’ rights, as well as the supply chains.
Through the data hub web portal, all parties have access to their own consumption
volume measurement data (remotely readable in one-hour increments). The data hub
system ensures principles of equal treatment. The network operator must ensure
measurement, collection, control and accuracy of measurement data.
Figure 61: Estonian data hub – an example of a centralised data management system (source: Ennomotive)
6.3 Advanced consumer services in The Netherlands
By the end of 2017, smart metering systems have been rolled out (on the basis of the
original timeline 2015 – 2020) to over 50 % of all users. Only 11 % of the users have
declined the smart meter, while 2 % asked to deactivate the communication. Around 18
% of the consumers with a smart meter also have an energy consumption manager,
such as a smart thermostat, which offers direct feedback to allow energy consumption
reductions. Smart meters are one part in the smart grid strategy (see Figure 62), among
digital operation, intelligent substations (low and medium voltage), flexible grid
structures and telecom.
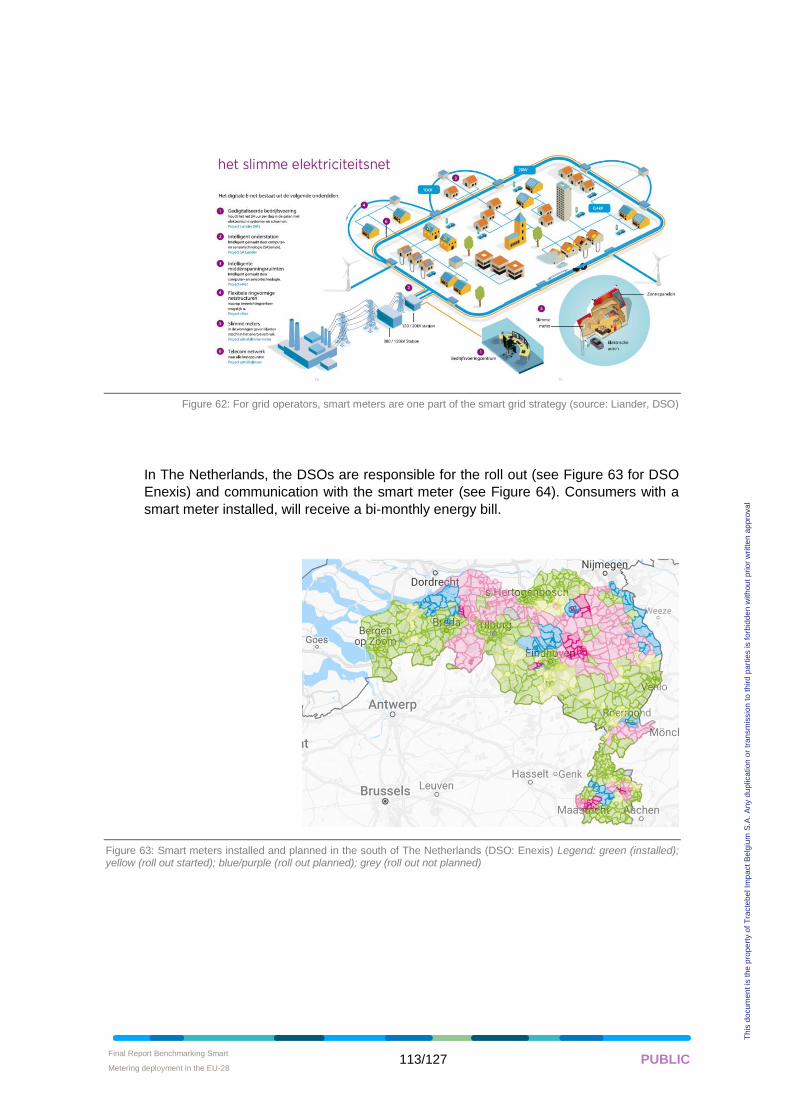
Final Report Benchmarking Smart
Metering deployment in the EU-28 • 113/127 PUBLIC
Th
is d
ocum
en
t is
the
pro
pe
rty o
f T
racte
be
l Im
pa
ct
Be
lgiu
m S
.A.
An
y d
up
lica
tion
or
tra
nsm
issio
n t
o t
hird
pa
rtie
s is f
orb
idd
en
with
ou
t p
rio
r w
ritte
n a
ppro
va
l
Figure 62: For grid operators, smart meters are one part of the smart grid strategy (source: Liander, DSO)
In The Netherlands, the DSOs are responsible for the roll out (see Figure 63 for DSO
Enexis) and communication with the smart meter (see Figure 64). Consumers with a
smart meter installed, will receive a bi-monthly energy bill.
Figure 63: Smart meters installed and planned in the south of The Netherlands (DSO: Enexis) Legend: green (installed); yellow (roll out started); blue/purple (roll out planned); grey (roll out not planned)
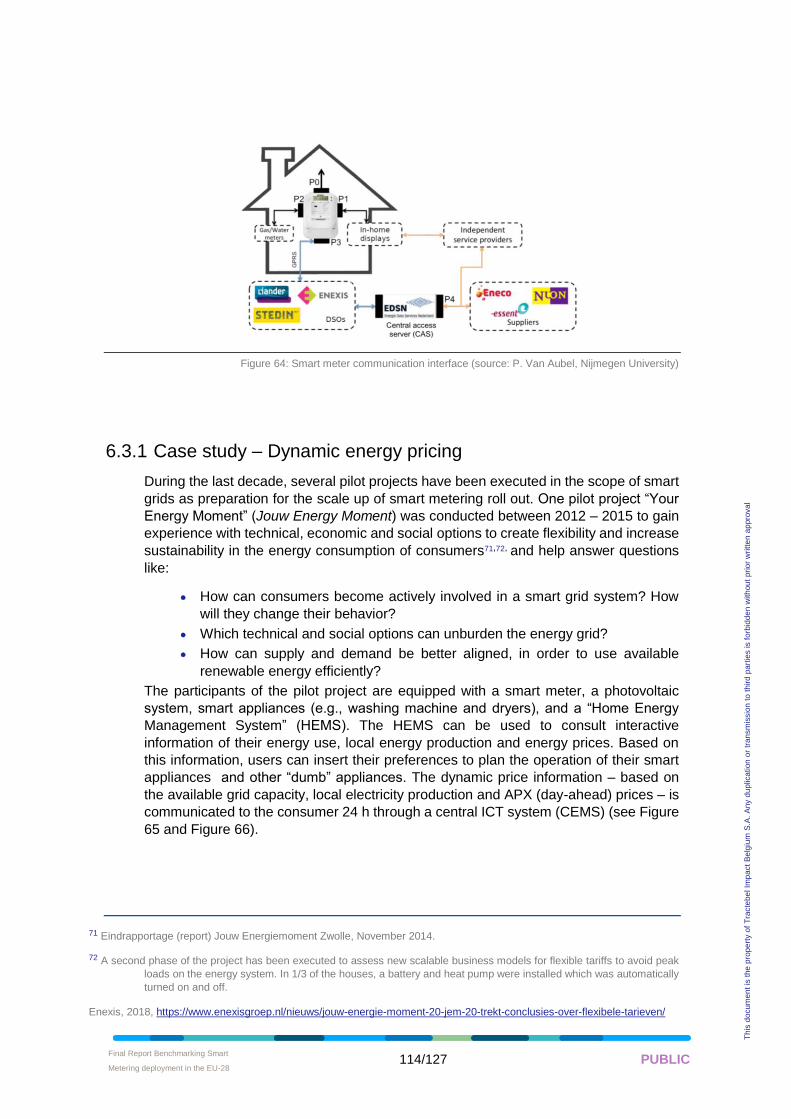
Final Report Benchmarking Smart
Metering deployment in the EU-28 • 114/127 PUBLIC
Th
is d
ocum
en
t is
the
pro
pe
rty o
f T
racte
be
l Im
pa
ct
Be
lgiu
m S
.A.
An
y d
up
lica
tion
or
tra
nsm
issio
n t
o t
hird
pa
rtie
s is f
orb
idd
en
with
ou
t p
rio
r w
ritte
n a
ppro
va
l
Figure 64: Smart meter communication interface (source: P. Van Aubel, Nijmegen University)
6.3.1 Case study – Dynamic energy pricing
During the last decade, several pilot projects have been executed in the scope of smart
grids as preparation for the scale up of smart metering roll out. One pilot project “Your
Energy Moment” (Jouw Energy Moment) was conducted between 2012 – 2015 to gain
experience with technical, economic and social options to create flexibility and increase
sustainability in the energy consumption of consumers71,72, and help answer questions
like:
• How can consumers become actively involved in a smart grid system? How
will they change their behavior?
• Which technical and social options can unburden the energy grid?
• How can supply and demand be better aligned, in order to use available
renewable energy efficiently?
The participants of the pilot project are equipped with a smart meter, a photovoltaic
system, smart appliances (e.g., washing machine and dryers), and a “Home Energy
Management System” (HEMS). The HEMS can be used to consult interactive
information of their energy use, local energy production and energy prices. Based on
this information, users can insert their preferences to plan the operation of their smart
appliances and other “dumb” appliances. The dynamic price information – based on
the available grid capacity, local electricity production and APX (day-ahead) prices – is
communicated to the consumer 24 h through a central ICT system (CEMS) (see Figure
65 and Figure 66).
71 Eindrapportage (report) Jouw Energiemoment Zwolle, November 2014.
72 A second phase of the project has been executed to assess new scalable business models for flexible tariffs to avoid peak
loads on the energy system. In 1/3 of the houses, a battery and heat pump were installed which was automatically
turned on and off.
Enexis, 2018, https://www.enexisgroep.nl/nieuws/jouw-energie-moment-20-jem-20-trekt-conclusies-over-flexibele-tarieven/
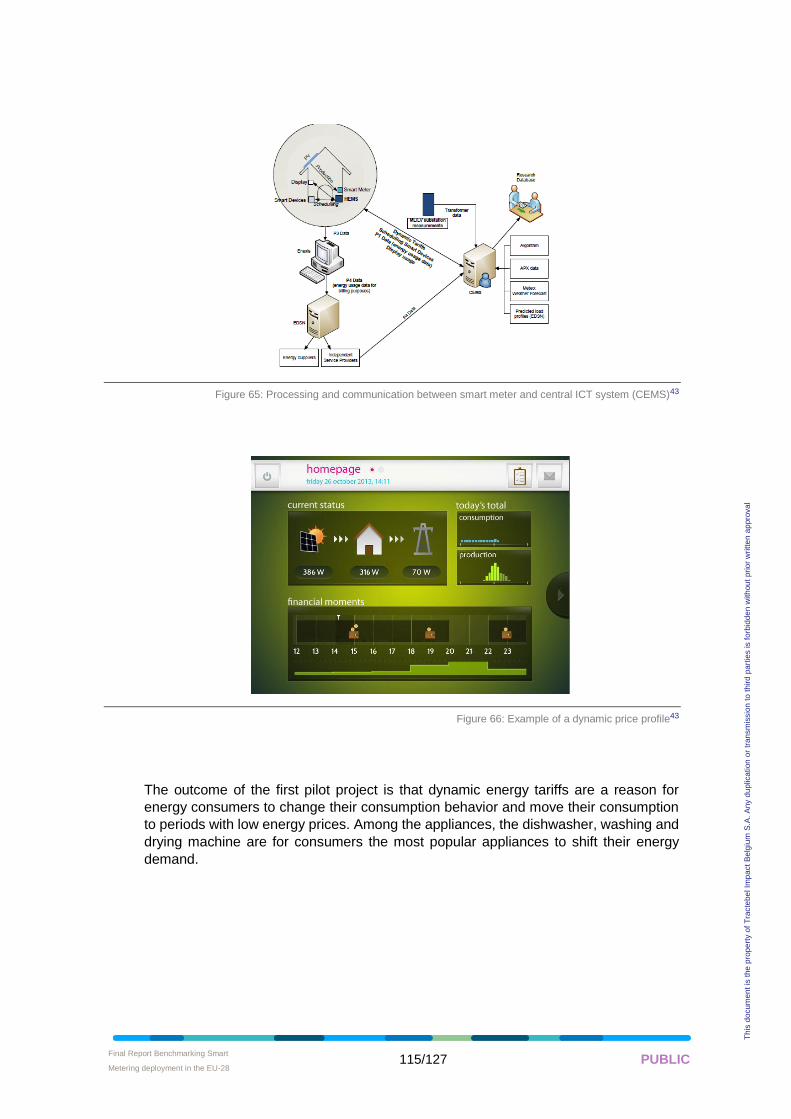
Final Report Benchmarking Smart
Metering deployment in the EU-28 • 115/127 PUBLIC
Th
is d
ocum
en
t is
the
pro
pe
rty o
f T
racte
be
l Im
pa
ct
Be
lgiu
m S
.A.
An
y d
up
lica
tion
or
tra
nsm
issio
n t
o t
hird
pa
rtie
s is f
orb
idd
en
with
ou
t p
rio
r w
ritte
n a
ppro
va
l
Figure 65: Processing and communication between smart meter and central ICT system (CEMS)43
Figure 66: Example of a dynamic price profile43
The outcome of the first pilot project is that dynamic energy tariffs are a reason for
energy consumers to change their consumption behavior and move their consumption
to periods with low energy prices. Among the appliances, the dishwasher, washing and
drying machine are for consumers the most popular appliances to shift their energy
demand.
Final Report Benchmarking Smart
Metering deployment in the EU-28 • 116/127 PUBLIC
Th
is d
ocum
en
t is
the
pro
pe
rty o
f T
racte
be
l Im
pa
ct
Be
lgiu
m S
.A.
An
y d
up
lica
tion
or
tra
nsm
issio
n t
o t
hird
pa
rtie
s is f
orb
idd
en
with
ou
t p
rio
r w
ritte
n a
ppro
va
l
7 RECOMMENDATIONS FOR NATIONAL AUTHORITIES
7.1 Purpose
In this chapter, we present a set of recommendations to national stakeholders, especially
lawmakers and regulatory agencies but also for industry and consumer representatives active
at European level. Our initial views were confronted with those of the relevant stakeholders,
to finally converge to the final recommendations. Those recommendations were elaborated
by analysing the extensive data received and consolidated as detailed previously in this
benchmarking report.
As explained in the introduction of this report, our goal is to assess smart metering deployment
in the light of the European legal framework. And it comes with a vision – as reflected in the
Clean Energy for all Europeans - and a target to reach – that is the 2030 climate goals - and
an ambition to realize – secure, clean and affordable energy for all Europeans. Our
recommendations have the ambition to serve that vision, but it is neither our purpose to
promote smart meters themselves nor to assess any form of legal compliance of national
authorities with respect to the European regulatory framework.
We first forget for a while our strict European mandate and take a look at smart metering as
an industrial opportunity, a trade gateway for growth and external sales of goods and services.
Then we go through each of the specific areas that have structured our analysis, from the legal
framework to consumer outcomes.
7.2 Recommendations
7.2.1 Global context
7.2.1.1 HIGH POTENTIAL FOR SMART METERING TECHNOLOGIES AND APPLICATIONS
The smart metering technologies and applications create a whole new range of
business models for all actors across the power and gas value chain. Given the scale
of the energy system, the potential market for these technologies and applications is
very large.
The stakeholders all recognise the disruptive impact of smart metering technologies and
applications on the energy system. The future energy system will look substantially
different from today, if there is a widespread implementation of these technologies and
applications.
The energy system will be more decarbonized, digitalized and decentralised. Energy
flows will be increasingly bidirectional, thereby making the notion of producers following
consumers less relevant. This will create a need for a higher level of engagement of the
end users, compared to the situation today.
Final Report Benchmarking Smart
Metering deployment in the EU-28 • 117/127 PUBLIC
Th
is d
ocum
en
t is
the
pro
pe
rty o
f T
racte
be
l Im
pa
ct
Be
lgiu
m S
.A.
An
y d
up
lica
tion
or
tra
nsm
issio
n t
o t
hird
pa
rtie
s is f
orb
idd
en
with
ou
t p
rio
r w
ritte
n a
ppro
va
l
7.2.1.2 SMART METERING ACTIVIES OUTSIDE EUROPE
Many innovative and mass-scale smart metering projects and commercial
implementations are taking place outside Europe. The Middle-East, Asia-Pacific, and
North-America are three key non-EU regions where a high level of activity is observed.
From a world trade perspective, several European companies are active in these non-
EU countries, especially for aspects that are not highly region-specific, such as ICT-
aspects. Non-EU companies are also very active in these regions, and they have the
advantage of operating in their domestic market.
Thus, the prospect of smart metering deployment should be considered globally, with
competition pressures from industrial actors that can rely on a strong domestic market.
Within such an environment, a substantial level of activity in the EU might effectively
support the EU industry, by creating a substantial domestic market for smart metering-
related goods and services.
This all points out to smart metering as an opportunity Europe should not miss. How
could we possibly sustain our leadership role in climate action if we are to rely on an
old-dated, non-digital metering layer in the Energy Union? The following page take a
deeper look to try an give a correct answer to this question.
7.2.2 Legal framework
Even though all MS have successfully transposed the smart metering related provisions
from the current EU legislation, the level of progress of the legal and regulatory
framework on this very subject shows a contrasted picture. Starting from the strict
transposition, national authorities have progressively and diversely adopted general
provisions related to the design of smart metering systems: allocation of roles and
responsibilities to the different actors, principles for funding and cost recovery,
eventually definition of a more advanced set of functionalities. These next steps are
usually focused on the actual implementation and transition towards the new metering
paradigm. Some key topics to consider are specific rules for the deployment modalities,
such as refusing the installation or allowing for the lesser use of metering data (opt out
and default provisions for data access), as well as for the implementation phase, such
as the definition of dedicated tariffs scheme for grid users equipped with smart meters.
From a service provider perspective, the regulatory framework for smart metering
applications is fragmented across the member states, e.g. the regulation concerning
access to consumer data. Due to this fragmentation, some economies of scale cannot
be achieved, which limits/slows down the upscaling of European companies that can
offer smart metering technologies/applications.
Simultaneously, the upscaling is taking place in some non-EU regions, which
accelerates the domestic players in those regions. Examples here are the initiatives
taken by cross-state ISOs in the USA to allow for residential demand response to
participate in the electricity markets. This allows for the industrialisation of
North-American demand response aggregators.
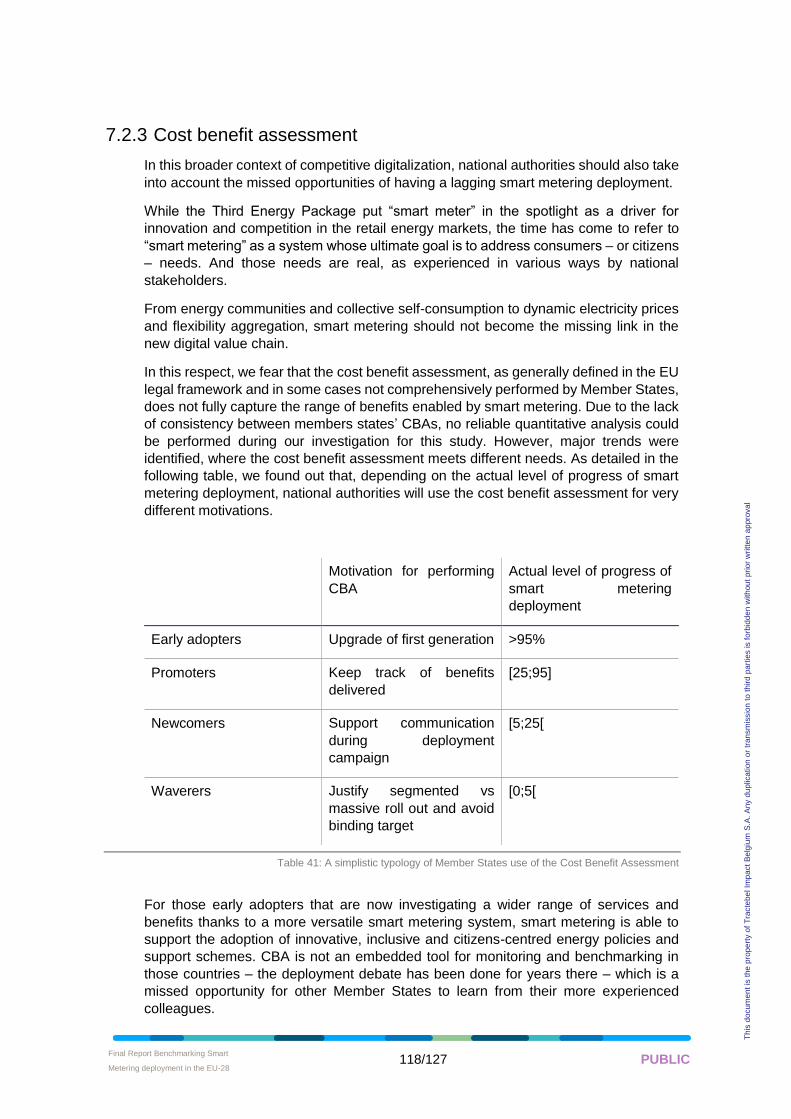
Final Report Benchmarking Smart
Metering deployment in the EU-28 • 118/127 PUBLIC
Th
is d
ocum
en
t is
the
pro
pe
rty o
f T
racte
be
l Im
pa
ct
Be
lgiu
m S
.A.
An
y d
up
lica
tion
or
tra
nsm
issio
n t
o t
hird
pa
rtie
s is f
orb
idd
en
with
ou
t p
rio
r w
ritte
n a
ppro
va
l
7.2.3 Cost benefit assessment
In this broader context of competitive digitalization, national authorities should also take
into account the missed opportunities of having a lagging smart metering deployment.
While the Third Energy Package put “smart meter” in the spotlight as a driver for
innovation and competition in the retail energy markets, the time has come to refer to
“smart metering” as a system whose ultimate goal is to address consumers – or citizens
– needs. And those needs are real, as experienced in various ways by national
stakeholders.
From energy communities and collective self-consumption to dynamic electricity prices
and flexibility aggregation, smart metering should not become the missing link in the
new digital value chain.
In this respect, we fear that the cost benefit assessment, as generally defined in the EU
legal framework and in some cases not comprehensively performed by Member States,
does not fully capture the range of benefits enabled by smart metering. Due to the lack
of consistency between members states’ CBAs, no reliable quantitative analysis could
be performed during our investigation for this study. However, major trends were
identified, where the cost benefit assessment meets different needs. As detailed in the
following table, we found out that, depending on the actual level of progress of smart
metering deployment, national authorities will use the cost benefit assessment for very
different motivations.
Motivation for performing
CBA
Actual level of progress of
smart metering
deployment
Early adopters Upgrade of first generation >95%
Promoters Keep track of benefits
delivered
[25;95]
Newcomers Support communication
during deployment
campaign
[5;25[
Waverers Justify segmented vs
massive roll out and avoid
binding target
[0;5[
Table 41: A simplistic typology of Member States use of the Cost Benefit Assessment
For those early adopters that are now investigating a wider range of services and
benefits thanks to a more versatile smart metering system, smart metering is able to
support the adoption of innovative, inclusive and citizens-centred energy policies and
support schemes. CBA is not an embedded tool for monitoring and benchmarking in
those countries – the deployment debate has been done for years there – which is a
missed opportunity for other Member States to learn from their more experienced
colleagues.
Final Report Benchmarking Smart
Metering deployment in the EU-28 • 119/127 PUBLIC
Th
is d
ocum
en
t is
the
pro
pe
rty o
f T
racte
be
l Im
pa
ct
Be
lgiu
m S
.A.
An
y d
up
lica
tion
or
tra
nsm
issio
n t
o t
hird
pa
rtie
s is f
orb
idd
en
with
ou
t p
rio
r w
ritte
n a
ppro
va
l
Promoters of smart metering system are using the CBA in the most interesting manner,
namely to keep track of benefits. However, as was mentioned by several stakeholders
during the course of this project, those countries using CBA as a monitoring tool and
making efforts for greater consumer engagement are also the ones that took the most
optimistic assumptions for computing smart metering benefits. In our opinion, using CBA
for reacting to a growing discrepancy between initial assumptions and actual realization
of benefits is perfectly fit, since it demonstrates accountability and transparency that are
prerequisites for consumers to trust smart metering.
For Member States that have less experience of large scale deployment of smart
metering systems, CBAs are used in much more conservative and less transparent way.
The economic assessment is not designed to be debated in public – due to its inner
complexity and somewhat conflicting objectives in certain cases. Our perception is that
national authorities, generally the regulatory authority in charge of setting and controlling
the grid tariffs that will be used in most countries to finance the deployment, have been
trying to build a solid business case based on value pockets located within the DSO
regulated perimeter of activities. While this approach is robust and reliable, since it is
based on partially controllable expenses, it is also conservative in that sense that it fails
to capture the potential for smart metering benefits for market participants, consumers
and the broader economy.
The new electricity Directive turns the Cost Benefit Assessment into a periodic process,
with the binding target of 80% (originally set in 2020 by the Third Energy Package)
becoming a moving – 7 years (from a positive cost-benefit assessment) – target. We
have identified lessons learned, return of experience from large scale deployment and
best practices that could lead a more favourable economic assessment of smart
metering deployment for those member states that are still assessing the economic
relevance of a digital (!) energy system. However, those authorities are accountable for
the costs they approve. It is therefore their duty to define a consistent vision for their
domestic energy system that support the Clean Energy Package and makes use of the
many degrees of freedom that national authorities have left at their disposal to sustain
a clean, affordable and secure energy for their citizens.
Our recommendation to those national authorities is to use the Cost Benefit Assessment
to investigate how to best meet consumer needs and monitor the actual delivery of
benefits, not to justify political choices.
7.2.4 State of play
Whilst the recast of the Electricity Directive has updated the required functionalities of
smart meters, a significant number of countries have already rolled out their metering
system. According to article 20 of the Directive, countries whose smart metering
systems do not meet the new requirements have up to 12 years to update their system.
Thus we can be concerned that a critical proportion of citizens from those countries may
be stuck for at least 12 years with outdated, limited-functionality smart meters. Indeed
the development of new businesses and services will be significantly slowed down if not
completely impeded thus precluding end-users to fully benefits from the grid
digitalisation. Hence, a national-scaled updating process of software and hardware
composing the smart metering systems will be required in those countries.
Final Report Benchmarking Smart
Metering deployment in the EU-28 • 120/127 PUBLIC
Th
is d
ocum
en
t is
the
pro
pe
rty o
f T
racte
be
l Im
pa
ct
Be
lgiu
m S
.A.
An
y d
up
lica
tion
or
tra
nsm
issio
n t
o t
hird
pa
rtie
s is f
orb
idd
en
with
ou
t p
rio
r w
ritte
n a
ppro
va
l
In the meantime one should consider that the countries which have already rolled out
their metering system are among the ones with the higher degree of acceptance of
smart meters and are also the ones who had best integrated the potential benefits of
smart metering system in their network development framework. Hence, whilst the
updating of the smart metering systems will require additional investment, which might
slower the process, the risk that those countries do not launch such update before 12
years is unlikely to realise.
Today, the main obstacle to the digitalisation of the European grid, taken as a whole, is
probably the limitation in the functionalities imposed by MS. Although EU manufacturers
claim to be able to deliver all functionalities, those are limited inconsistently across MS.
This choice, whatever the reason, and beyond the missed benefits for consumers,
engender undesired consequences for the European energy market.
First, those differences significantly impede the interoperability of smart metering
systems among MS which might create, or at least do not remove, barriers to entry in
national metering systems market. In such a configuration, where smart metering
systems must be differently adapted to each national market, we are short of reaching
an internal energy market. Then, the fact that European manufacturer are limited by
national constraint with regards to smart meter functionalities might also slower the pace
of improvement of smart metering systems, in terms of accuracy, safety and cost-
efficiency, as well as the development of related services. Considering the arising
competitive pressure for smart meter provision, particularly from the US and China, MS
and European institutions should be particularly cautious at ensuring that European
manufacturers will not be suffering from a significant competitive disadvantage in the
forthcoming years.
7.2.5 Functional and technical specifications
Smart metering business models rely heavily on communication functionality. There are
some barriers that are specifically related to the communication part in the business
models.
Gaps in standards and protocols – For upscaling smart energy grid solutions, it is
necessary to connect all types of appliances, such as cars or smart assets with all other
types of smart infrastructure, such as for instance (public) chargers. For smart charging
for instance, this includes roaming between different national and international
networks. On a local level, a standardised type of connection facilitates
interconnectivity, relevant for IT/OT integration. It is important that standards and
protocols are agreed upon that make these smart solutions possible across the entire
EU.
Final Report Benchmarking Smart
Metering deployment in the EU-28 • 121/127 PUBLIC
Th
is d
ocum
en
t is
the
pro
pe
rty o
f T
racte
be
l Im
pa
ct
Be
lgiu
m S
.A.
An
y d
up
lica
tion
or
tra
nsm
issio
n t
o t
hird
pa
rtie
s is f
orb
idd
en
with
ou
t p
rio
r w
ritte
n a
ppro
va
l
Economic lifetime mismatch between energy and ICT/Telecom – The economic
lifetime of ICT infrastructure and commercial telecommunications is very short
compared to the long lifespan of energy infrastructure. Telecom and ICT undergo rapid
innovation and development pressured by the public want for better, faster performance
and increased functionality. In order to keep tariffs low, the energy infrastructure has an
economic lifespan that range from decades to over half a century. While this already
proves a challenge to smart grid business cases and investments, there is a risk of
technology or supplier lock-in, when large parts of the consumer ICT and telecom
market and technology have moved away from the legacy technology.
Telecom frequencies are regularly reallocated – Related to the previously described
risk, most commercial telecom frequencies are periodically reallocated by means of a
government auction. For energy infrastructure such an auction may provide a risk of
losing connectivity, while not having earned back the smart grid investments. Some
market actors advocate the allocation of a dedicated band for utility communication, that
is exempted from the auctions and provides long-term investment stability. To
guarantee resilience, DSOs mention that it would be more efficient to have a specific
spectrum, and some countries are already allocating specific spectra (Poland and
Germany).
Leverage the synergies with the ICT Industry
Electricity and communication grids can be unified. The ICT industry is capable of
building a more flexible, less capital intensive layer on top of the physical grid
infrastructure, for instance by using broadband power lines. These are much more cost
effective than conventional telecommunication solutions as they use the grid
infrastructure itself to transfer communication signals on top of electricity flows.
Final Report Benchmarking Smart
Metering deployment in the EU-28 • 122/127 PUBLIC
Th
is d
ocum
en
t is
the
pro
pe
rty o
f T
racte
be
l Im
pa
ct
Be
lgiu
m S
.A.
An
y d
up
lica
tion
or
tra
nsm
issio
n t
o t
hird
pa
rtie
s is f
orb
idd
en
with
ou
t p
rio
r w
ritte
n a
ppro
va
l
7.2.6 Data management
7.2.6.1 GENERAL CONSIDERATIONS
The new Electricity Directive made access to data and exchange of data the cornerstone
of smart metering data management. Different technical solutions are used by MS, from
centralized data hub to decentralized system and, during the present investigation we
gathered evidences of efficient data management systems, considering cost efficiency
and data security, both in de-centralized and centralized environments. Assessing the
suitability and the best option for data management systems architectures is not an easy
task and, in any case, is not in the scope of this study. When designing their data
management system, MS must fully integrate considerations regarding the resilience of
the system to cyber-attack, black-out recovery capability as well as the feasibility of a
system replacement if better options can be considered. MS should also integrate
requirements stemming from the GDPR such as data minimisation, proportionality to
purpose and risk mitigation. Last but not least, MS should ensure an effective mitigation
of the market power de facto acquired by the data management responsible party.
Still, access to and exchange of data, where data is understood as metering and
consumption data as well as data required for customer switching, demand response
and other services, is the key for consumers and eligible 3rd parties to enjoy those
retail/wholesale functionalities and new energy services that are of interest and benefit
to them.
Thus, smart meters must be able to support the delivery of the full range of near real
time data as well as validated data of actual consumption/generation (even at frequent
intervals), in order to comply with the Measuring Instruments Directive (MID) and the
WELMEC guide. These require that customers are able to directly read data used for
billing from their smart meters data. Whilst new smart meters seem to be able to provide
all these data, it appears that not all installed smart meters in EU are able to do this for
the required data frequency (e.g. due to storage limitations, etc).
This calls for promptly implementable solutions without waiting for smart meters
upgrades. One possible option to investigate could be to use another channel than the
smart meter itself to provide feedback to consumers and inform them appropriately with
timely information.
In any case, parties responsible for smart meters deployment and/or data management
should focus on digitalisation of their systems. In that context, new services such as
price signal for switching or for flexibility provisions, have to be taken into account. With
regard to near real-time data provision and the tremendous amount of data that has to
be collected, data managing parties should not fixate on smart meter only but should
also consider cost effective channels that can complement each other to provide a
reliable and timely information to consumers. In conclusion, we do not favour one-
solution-fits-all approach for handling the data management challenges. Metrology
experts need to design flexible solutions that are cost effective and inclusive. Pioneers
should not be punished but practical accommodations need to be implemented that do
not jeopardize consumer’s trust: deploying smart meters should not prevent consumers
to use their metering data to check their consumption and the accuracy of their energy
bills.
Final Report Benchmarking Smart
Metering deployment in the EU-28 • 123/127 PUBLIC
Th
is d
ocum
en
t is
the
pro
pe
rty o
f T
racte
be
l Im
pa
ct
Be
lgiu
m S
.A.
An
y d
up
lica
tion
or
tra
nsm
issio
n t
o t
hird
pa
rtie
s is f
orb
idd
en
with
ou
t p
rio
r w
ritte
n a
ppro
va
l
Considering the accelerating pace of technological evolutions, the MID should be
adapted and become more inclusive of new realities where data are always moving
faster and the digitalisation is way more anchored in citizens' life that it was years ago
when the MID related provisions were last revised.
In the following paragraphs, we focus on two specific but promising advanced services
that have the potential to directly benefit consumers and therefore to promote smart
metering acceptance by its users, presenting services based market and grid drivers
respectively. In both cases, smart metering is a prerequisite in order to differentiate the
individual consumption profile that can be translated into direct monetary benefits.
Without smart metering, any effort to incentivize consumers to adopt a more favourable
behaviour will not induce direct benefits, but will rather be spread over the system users.
7.2.6.2 VARIABLE RETAIL ELECTRICITY PRICES
Various business models build on a lower energy bill for the electricity user by allowing
them to use the variable retail electricity prices. For instance, in advanced services like
smart charging, vehicle to grid and energy management systems, flexibility is used to
purchase electricity more cheaply by taking advantage of its wholesale price volatility.
Flexible tariffs are not always allowed or feasible for small end users – To protect
residential customers from price risk, some member states have taken specific
provisions that prevent consumers from fully benefitting from their active participation in
the electricity market. In those countries that have chosen to implement a form of price
regulation, it is not always allowed to charge flexible tariffs.
As also described in the report Regulatory Recommendations for the Deployment of
Flexibility73, the ability of consumers to offer their demand side flexibility to be used in
the capacity, forward, day ahead, intraday and balancing markets, is limited. Industrial
consumers and generators with their own bi-lateral power purchasing agreements can
participate. Smaller industrial, commercial or domestic consumer access to flexibility
services varies in Member States but tend to be limited. The result is that not all of the
demand side flexibility which could be provided by motivated and willing consumers is
accessed. This barrier makes it impossible to pass on the benefit of demand shifting to
the consumers.
To enable companies to use prosumers and electric vehicles to access the flexibility
market will require careful design of the flexibility market. A first step is to accept
flexibility as a resource in the full range of energy markets.
Smart meters are not installed – To confirm that demand shift has taken place, hourly
or even quarter-hourly metering must be in place at the end consumer. These costs
might be prohibitive for the entrepreneur to carry, while the benefits of the smart meters
are broader than for the specific business models. Different consumer products exist
that bypass the need for a smart meter, e.g. by offering a similar functionality as an
integrated or modular part of an energy management system.
73 Regulatory recommendations for the deployment of flexibility, EG3 Smart grid task force, European Commission, 2015.
Final Report Benchmarking Smart
Metering deployment in the EU-28 • 124/127 PUBLIC
Th
is d
ocum
en
t is
the
pro
pe
rty o
f T
racte
be
l Im
pa
ct
Be
lgiu
m S
.A.
An
y d
up
lica
tion
or
tra
nsm
issio
n t
o t
hird
pa
rtie
s is f
orb
idd
en
with
ou
t p
rio
r w
ritte
n a
ppro
va
l
Allocation does not take place based on smart meter data – For the supplier to be
rewarded for the demand shift, it must be possible to allocate it to that specific supplier.
At the moment, even while smart meters are installed, the allocation of hourly electricity
flows are still based on predefined synthetic load profiles. This means that individual
profiles are aggregated and can no longer be allocated to the BRP.
Aggregation for ancillary services – To be eligible for providing ancillary services,
TSOs often fix sources of a minimum size. This has historically grown as providers have
always been medium to large generators. They also demand regular test running of
specific installations. These requirements are impossible to meet with a portfolio of EVs
or smart prosumers.
7.2.6.3 CONGESTION MANAGEMENT USE
Electricity market is one possible value stream for active participation of consumers, but
it would also be possible to get value from flexibility put at DSOs disposal to alleviate
congestion and by reducing peak demand. The main difference with the previous is the
way demand side management is incentivised. For these “grid-focused” business
models the following additional barriers can be identified:
There is no remuneration for providing local flexibility products – For the business
model to work there must be a revenue stream that originates from DSOs. DSOs in turn
can finance these stream from lower investments. For a number of reasons these
revenues do not exist:
DSOs are not allowed to apply congestion management – In many countries DSOs
are obliged to always allow customers to use their full capacity, and make sure the grid
can facilitate this. Congestion management is considered a limitation on the freedom of
the end user to access the grid at any time. Similar consideration is that in many
countries DSOs are not allowed to diversify tariffs based on capacity requirements.
DSOs are not allowed to include costs related to congestion management in their
tariffs – As a rule, DSO tariffs are regulated. In many cases the tariff structure does not
allow including costs not related to physical infrastructure in their tariffs. This means
costs related to local flexibility and congestion management cannot be recuperated and
constitute a loss from the perspective of the DSO.
Net metering is a disincentive for prosumers to maximise true self consumption
– In many countries net metering is in place. This means that prosumers have no
incentive to use the electricity they produce simultaneous to their production. Abolishing
net metering would give an incentive for prosumers to shift their demand to moments of
production. This would provide an additional revenue for business models that are
based on increasing flexibility behind the meter. Self-consumption can be synergetic
with the needs of the DSOs – it can be combined, without additional costs, with
congestion management.
Supplier blocking aggregators from approaching their customers – Suppliers do
not like third party aggregators to change the demand behaviour of their consumers.
This might cause imbalance in their portfolio. For this reason, they are reluctant to allow
aggregators to approach their customers and supply them with the information that is
required to perform their operations.
Final Report Benchmarking Smart
Metering deployment in the EU-28 • 125/127 PUBLIC
Th
is d
ocum
en
t is
the
pro
pe
rty o
f T
racte
be
l Im
pa
ct
Be
lgiu
m S
.A.
An
y d
up
lica
tion
or
tra
nsm
issio
n t
o t
hird
pa
rtie
s is f
orb
idd
en
with
ou
t p
rio
r w
ritte
n a
ppro
va
l
Those two examples show that smart metering is a prerequisite to be able to provide
benefits and value to the end users. It also shows that the whole value chain has to
adjust to the new digital reality: from predefined (also called synthetic) to real load
profiles, from yearly net metering to incentives for real time self-consumption, the same
question comes again: what is the best balance between protecting the consumers and
providing them with appropriate incentives and economic signals?
7.2.7 Consumer satisfaction
In spite of all the efforts exerted by MS and NRA to turn out the smart metering
deployment into a social welfare enhancement, only an insufficient share of its potential
benefits will be realised if European consumers do not properly use their smart meters.
To make it happen, a process which informs customers about the smart meters
deployment, its value propositions and benefits, accurately addresses their concerns
and provides them with incentives to become active participants of energy markets has
to be implemented. MS have launched communication campaign about smart meters
roll-out, with more or less success. Opt-out and refusal rates, if the legal framework
allows this possibility and the information is monitored, provide useful insights into the
level of acceptance of smart metering. This kind of information is key to be able to
enhance consumer engagement initiatives.
The main concerns expressed by consumers, when it comes to smart meters being
installed in their premises, relate to electromagnetic radiation and the broader impact of
smart meters on health, and to data privacy. Regarding the first of these concerns, smart
meters – like any electronic device – have to comply with European safety and quality
standards and are subject to laboratory tests to demonstrate their compliance. But
information related to those tests (process and results) have not always been
appropriately communicated by grid operators, which constitutes a missing opportunity
to reassure consumers about the health effects of meters and to increase the
acceptance of these meters. With regards to consumers concerns relating to data
privacy, a focus on GDPR provisions - whose extensive communication campaign at
the Union scale has effectively comforted Europeans about protection of their data -
should be put forward when communicating about collection and management of smart
meters data.
Smart meters bring a wide range of value propositions for customers, creating stronger
incentives for demand-side efficiency, or enabling flexibility provision, energy sharing,
etc. Consumers just have to be accurately informed of all these possibilities to become
active participants in energy markets.
Hence there is a need for better communication campaigns and training of personnel to
properly inform customers on smart meters and their potential. The communications
should also be broader (multi-channel) and facilitated for the consumer and not time-
consuming. These are mandatory measures to lay the foundation for consumer’s trust
and acceptance of smart meters.
Final Report Benchmarking Smart
Metering deployment in the EU-28 • 126/127 PUBLIC
Th
is d
ocum
en
t is
the
pro
pe
rty o
f T
racte
be
l Im
pa
ct
Be
lgiu
m S
.A.
An
y d
up
lica
tion
or
tra
nsm
issio
n t
o t
hird
pa
rtie
s is f
orb
idd
en
with
ou
t p
rio
r w
ritte
n a
ppro
va
l
8 CONCLUSION
The European Commission presented in its 2014 benchmarking report the state of play
of smart metering deployment in the European Union. It provided an overview of the
national cost benefit analyses (CBA) that Member States (MS) were invited to conduct
following the adoption of the Electricity Directive 2009/72/EC and Gas Directive
2009/73/EC.
The present document constitutes an updated benchmarking report for smart metering
deployment in the EU-28. It has built upon the initial benchmarking report but it further
investigated areas of interest that have been demonstrated as key by MS that have
already experienced significant difficulties to make smart meter actually deliver the
business case, including direct benefits to the consumers.
This report also considered the latest policy initiatives undertaken by the European
Commission, especially the new provisions of the recast Electricity Directive that further
paves the way for smart metering, like, among other topics, system interoperability and
support of new services to deliver benefits and ultimately satisfaction to consumers.
Next to the reminder of the specific background of our report, the European regulatory
and legal framework related to smart metering has been presented in detail.
After this reminder on the European framework, the report presents how data was
collected and validated to feed the analysis and proceed with relevant
recommendations. Data was effectively collected and validated in each of the EU-28
member states, that allowed to have access to the most consistent and complete view
on smart metering in the EU-28 that was reasonably possible to achieve.
National regulatory authorities and energy ministries across the EU-28 have been
closely involved in the course of producing this benchmarking report. Comments and
expectations expressed during the initial 2014 benchmarking report have fed our
approach for stakeholders engagement from the very start of the project.
We committed to engage with national authorities and did actually embark them on our
benchmarking journey. From the initial questionnaire and additional Q&A that followed,
we engaged in bilateral activities to come with a refined overview of the country at hand,
using a country fiche put at NRA scrutiny, to later invite those national authorities and
other relevant stakeholders to a dedicated interactive seminar.
During this event, we tested our recommendations and gathered feedback and
comments on the consolidated data been shared. Finally this report will be put at their
disposal to further react and provide any final reaction before finalizing this report.
From the 2014 initial report, a mind shift progressively occurred. It was not about
economic assessment of a new (regulated) asset, it is now about defining a consistent
value chain to deliver benefit and usage to end consumers and citizens.
The analysis, made of a comprehensive data collection and consolidation exercise
throughout the EU-28, translated national insights into European-wide
recommendations to further strengthen the deployment of smart metering system at the
benefits of European consumers and citizens. Each of the specific area/domain of
knowledge has been analysed, summarized and finally assessed.

Final Report Benchmarking Smart
Metering deployment in the EU-28 • 127/127 PUBLIC
Th
is d
ocum
en
t is
the
pro
pe
rty o
f T
racte
be
l Im
pa
ct
Be
lgiu
m S
.A.
An
y d
up
lica
tion
or
tra
nsm
issio
n t
o t
hird
pa
rtie
s is f
orb
idd
en
with
ou
t p
rio
r w
ritte
n a
ppro
va
l
Our key message is that smart metering represents an opportunity Europe should not
miss. Smart metering should not become the missing link in the new digital value chain.
We also call National Authorities to embrace the opportunity offered by the Cost Benefit
Assessment as institutionalized in the European regulatory framework and implement
an efficient and consistent monitoring tool for smart metering deployment. Early
adopters of smart metering systems have gathered a precious return of experience, and
the smartest have learned from their mistakes. We believe it is now time for the rest of
the Energy Union to be even wiser and learn from the earlier mishaps and success
stories of others.

At the helm of the Energy Transition, Tractebel provides a full range of engineering and advisory servicesthroughout the life cycle of its clients’ projects, including design and project management. As one of the world’sleading engineering and advisory companies and with more than 150 years of experience, it's our mission toactively shape the world of tomorrow. With about 5,000 experts and presence in more than 70 countries, we areable to offer our customers multidisciplinary solutions in energy, water and urban.
TRACTEBEL IMPACTBoulevard Simón Bolívar 34-361000 - Brussels - BELGIUM
Frédéric TOUNQUETtel. +32 2 773 83 [email protected]