european travel & tourism - home | wttc · 2017-10-18 · working with governments and...
TRANSCRIPT
April 2015
1April 2015
European Travel & Tourism:Where are the greatest current and future investment needs?
A report prepared by Oxford Economics for the World Travel & Tourism Council
European Travel & Tourism:Where are the greatest current and future investment needs?
ForewordThe World Travel & Tourism Council (WTTC) is the global authority on the economic and social contribution of Travel & Tourism. It promotes sustainable growth for the sector, working with governments and international institutions to create jobs, to drive exports and to generate prosperity.
Members are the Chairs, Presidents and Chief Executives of the world’s leading, private sector Travel & Tourism businesses. These Members bring specialist knowledge to guide government policy and decision-making, raising awareness of the importance of the sector as an economic generator of wealth.
Understanding and addressing the challenges inhibiting the sustainable growth of our sector is paramount for all industry stakeholders. Together with our research partner, Oxford Economics, and to coincide with the 15th annual WTTC Global Summit in Madrid, Spain in April 2015, WTTC is pleased to have produced this report on Travel & Tourism investment in Europe. The report draws on data from WTTC’s annual Travel & Tourism Economic Impact Research 2015 and the World Economic Forum’s Travel & Tourism Competitiveness Report 20131 , and seeks to understand whether and where the region’s infrastructure and investment will constrain or support future industry growth.
WTTC has forecast that there will be €2.1 trillion worth of Travel & Tourism investment made in Europe over the next decade. However, with the sector forecast to grow as fast, or faster, than the economies overall in every major European region, and the lagging state of much infrastructure today, baseline growth forecasts for both investment and Travel & Tourism’s overall contribution to GDP may only be met with sufficient and effective investment to support this demand.
Given the diversity of Europe, there are disparities in the relative contributions of Travel & Tourism to economies as well as to the state of Travel & Tourism infrastructure in the region. As a result, some countries are much better placed than others to capitalise on forecasted demand. While a positive relationship exists between Travel & Tourism infrastructure and the contribution the sector makes to GDP, this report gives heed to the fact that government deficits, fiscal austerity and high competition for foreign direct investment requires future investments to be smart and well-targeted.
This need for smarter investments gives even more importance not only to opportunities for greater collaboration between public and private actors, but also to seeking cross-border cooperation and creative funding options. Breaking down barriers to infrastructure development through the right business, political and regulatory frameworks will help to ensure that Travel & Tourism in Europe maintains a strong and competitive position.
David ScowsillPresident & CEO
World Travel & Tourism Council
1 www.weforum.org/reports/travel-tourism-competitiveness-report-2013
Restoration of the Parthenon on Acropolis – Athens, Greece
European Travel & Tourism: Where are the greatest current and future investment needs? April 2015
6 7
Executive summary
1 How investment and infrastructure support Europe’s Travel & Tourism sector
1.1 The economic contribution of the Travel & Tourism sector to Europe’s economy
1.2 DefiningtheroleofinvestmentandinfrastructureinsupportingtheTravel&Tourismsector
1.3 The importance of investment to success in the Travel & Tourism sector
1.4 Infrastructurequalityandcapacitytodayarestronglyrelatedtohistoricalinvestmentspending
2 WhichEuropeancountrieshavethegreatestneedforcurrentandfutureinvestment?
2.1 AssessingthequalityandcapacityofEurope’sTravel&Tourisminfrastructure
2.2 AssessingobjectivesubcomponentsofthethreemajorWEFinfrastructurepillars
2.3 Whichcountrieshavethegreatestinfrastructureneedsbetween2015and2025?
3 TheoutlookforEuropeanTravel&Tourisminvestmentspending
3.1 Aregionalcomparisonofforecastedinvestmentspending
3.2 Sectoral composition of investment spend
4 Conclusion–puttingTravel&TourisminvestmentonEuropeangovernments’agendas
Eastern Europe
BelarusBulgariaCzech RepublicEstoniaHungaryLatviaLithuaniaMoldovaPolandRomaniaRussiaSlovakiaUkraine
Southern Europe
AlbaniaBosniaandHerzegovinaCroatiaCyprusGreeceItalyMacedoniaMaltaMontenegroPortugalSerbiaSloveniaSpainTurkey
Western & Northern Europe
AustriaBelgiumDenmarkFinlandFranceGermanyIcelandIrelandLuxembourgNetherlandsNorwaySwedenSwitzerlandUnitedKingdom
European Regional Groupings
Forthepurposesofthisreport,EuropeisdefinedaccordingtotheUNregionalclassifications*listedbelow.Countriesandsub-classificationsofcountriesinEurope.
* Cyprus and Turkey reclassified as Southern Europe for purposes of this report. In addition, Western European and Northern European countries have been grouped together, as they frequently represent a common narrative.
Contents
08
11
11
13
14
16
17
17
22
27
29
29
32
36
European Travel & Tourism: Where are the greatest current and future investment needs? April 2015
8 9
Executive summary TheTravel&TourismsectormakesasubstantialcontributiontoEuropeaneconomies.In2014,includingitsdirect,indirect,andinducedimpacts,Travel&Tourismsupported33.5millionjobsandmadenearly€1.6trillionincontributiontogrossdomesticproduct(GDP),or9.3%oftotalEuropeanGDP.By2025,theTravel&Tourismsector’stotaleconomiccontributionisexpectedtogrowto38millionjobsand€2.1trillionincontributionstoGDP(9.9%oftotalEuropeanGDP).Inaddition,Travel&TourismwillbeakeytorecoveryforcountrieshithardestbyrecessionandtheEurozonecrisis,includingGreece,Spain,andPortugal.
Thesector’sgrowingGDPandjobscontributiondependsonsupportiveinfrastructureandinvestment.Whileinvestmentmustbesmart,thereisastronghistoricallinkbetweenthemagnitudeofTravel&TourisminvestmentspendingandthequalityandcapacityofEuropeancountries’ Travel & Tourism infrastructure. The success and size of the economic contribution from Travel & Tourism is directly linked to the amount of investment in the sector.
Travel&Tourismisforecasttogrowasfast,ifnotfaster,thantheeconomyoverallineverymajorEuropeanregion,puttingpressureoninfrastructurecapabilitiesandincreasingtheneedforadditionalinfrastructureinvestment.Forexample,WesternandNorthernEuropeancountriesareexpectedtoexperienceaverageannualgrowthintheirTravel&Tourismsectorsof2.7%,comparedtowholeeconomygrowthof1.9%peryear.InEasternEurope,Travel&Tourismgrowthof3.3%isexpectedtomarginallyoutpaceeconomy-widegrowthof3.2%,whileSouthernEurope’sTravel&Tourismsectorgrowthof2.8%peryearwilloutpaceeconomy-widegrowthof2.6%.
Comparedtobaselineforecasts,however,poorexistinginfrastructurequalityandcapacityorinadequatefutureinvestmentcouldslowgrowthinTravel&TourismGDPandjobscontributionsbetween2015and2025.ThisreportshowsthatseveralcountriescouldfailtoachievebaselineforecastsforTravel&TourismGDPandjobs,andfallbehindinglobalcompetitivenessterms,duetolimitedinfrastructureandunderinvestmentrelativetoTravel&Tourism demand.
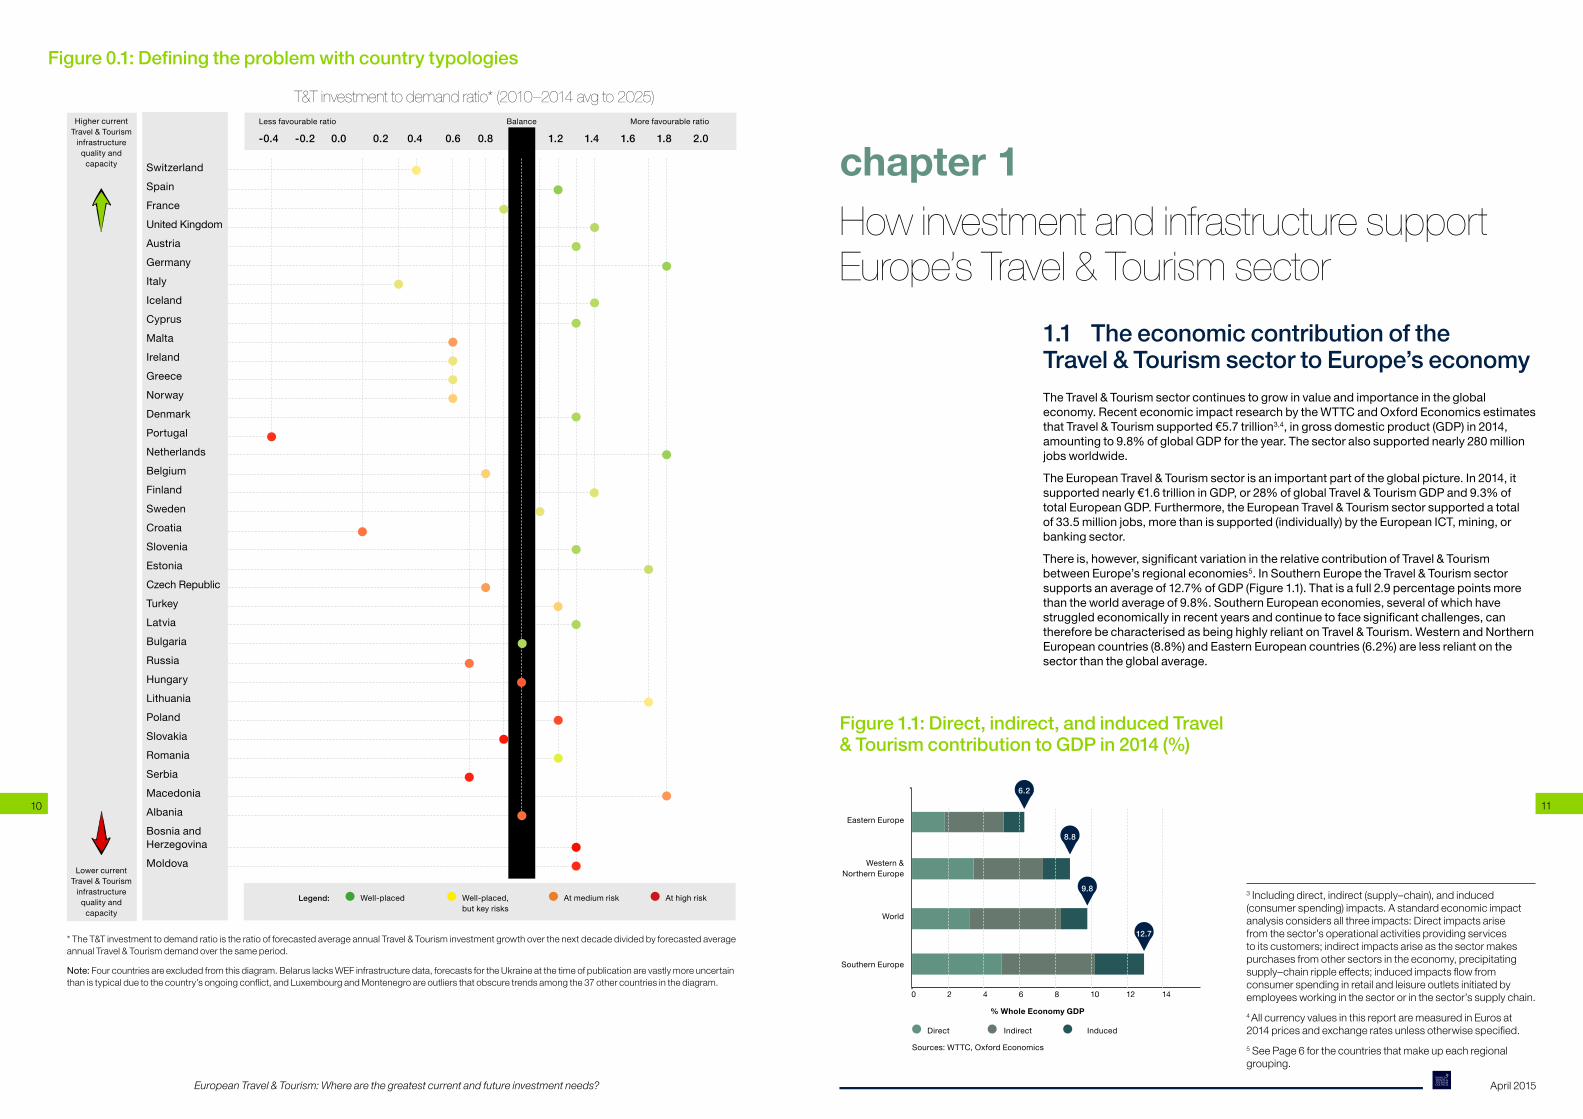
Thisreportusesthreecategoriestoidentifycountrytypologies,rangingfromthosethatareatriskoflosingTravel&Tourisminfrastructurecompetitivenessoverthenextdecade,tothosethatarewell-placedtobenefitfromforecastedinvestmentspendbetween2015and2025(Figure0.1):
• Well-placed:Thisgroupofcountries,exemplifiedbyAustria,GermanyandtheUnitedKingdom,hashighexistingqualityandcapacityofTravel&Tourisminfrastructurewhichtheyareexpectedtomaintainandimprovebetween2015and2025.Withinvestmentgrowthexpectedtooutpacedemandoverthatperiod,thesecountriesarewell-placedtocapturethefullbenefitsofforecastedTravel&Tourismdemand.
• Well-placed, but with key risks:France,Italy,Switzerland,Ireland,andGreeceareonesetofcountriesincludedinthiscategory.EachofthemhasexistingTravel&TourismqualityandcapacitythatisgreaterthantheEuropeanaverage.Yettheirstrongpositionsarelikelytodeterioratesomewhatoverthenextdecade,sinceTravel&TourismdemandgrowthisforecasttooutstripTravel&Tourisminvestmentgrowthovertheperiod.Similarly,DenmarkandFinlandhavebetterthanaverageTravel&Tourisminfrastructurequalityandcapacity;however,weakhistoricalinvestmentgrowthpresentsriskstotheforecastthatinvestmentgrowthwillexceeddemandgrowthinthenextdecade.SloveniaandLatviaarealso“wellplaced,withrisks”.Theirkeystrengthisthattheyareexpectedtoseeinvestmentgrowththatisstrongerthandemandgrowthoverthenextdecade;theirkeyriskistheirexistinginfrastructurequalityandcapacity,whichisbelowtheEuropeanaverage.
• At medium or high risk:ThiscategoryincludescountrieslikeAlbania,BosniaandHerzegovina,andMoldova,whichareconsideredtobeathighriskbecausetheyhavethepoorestexistinginfrastructurequalityandcapacityofthe41countriesanalysedinthisreport.Croatia,Serbia,andSlovakiaarealsoconsideredatrisk,becauseTravel&Tourisminvestmentgrowthisexpectedtolagbehinddemandgrowthoverthenextdecade,andtheirstartinginfrastructurequalityandcapacitytodayisaverage–inthecaseofCroatia–orlow–inthecaseofSerbiaandSlovakia.Portugal,havingrelativelystrongexistinginfrastructurecapabilities,isaspecialcase:becausedemandgrowthisexpectedtooutpaceinvestmentgrowthbysuchawidemargin,thecountryfacesariskthatitscurrentinfrastructurequalityandcapacitywilldegradeoverthenextdecade.UnlikeSpain,PortugaldidnothavethesamehighlevelofTravel&Tourisminvestmentintheperiodbeforetheglobalrecession.
FewcountriescanclaimahighrankingacrossallthreemajorTravel&Tourisminfrastructure‘pillars’analysedinthisreport,comprisingtourism,airtransportandgroundtransportinfrastructure. Southern and Eastern European countries tend to have weaker air transport capabilities,whileanumberofWesternandNorthernEuropeancountries–includingtheUK,GermanyandDenmark–needtoimprovetheirtourisminfrastructurebeforebeingranked‘bestinclass’forthatpillar.SeveralSouthernandEasternEuropeancountries,includingAlbania,Poland,Romania,andSerbia,fallshortonallthreeinfrastructurepillars.
The41Europeancountriesanalysedinthisreportareexpectedtoinvest€2.1trillioninTravel&Tourismbetween2015and2025.Thatis5%ofallforecastedEuropeaninvestmentovertheperiod.The14WesternandNorthernEuropeancountriesanalysedinthisreportwillcontributethelargestamount,at€1.3trillion,or62%oftheEuropeantotaland€210perforeignvisitoranddomesticresident.The14SouthernEuropeancountriesanalysedinthisreportwillcontribute€570billion,or27%oftheEuropeantotaland€100perforeignvisitoranddomesticresident.Andthe13EasternEuropeancountriesanalysedinthisreportwillcontributenearly€240billion,whichis11%oftheEuropeantotalandequivalenttoalittleover€50perforeignvisitoranddomesticresident.
FutureinvestmentintheEuropeanTravel&Tourismsectormustbesmart.Governmentdeficits,strainedcorporatebalancesheets,andstrongcompetitionamongmajorworldregionsforforeigndirectinvestmentmeanthatfutureinvestmentspendmustbewell-targeted.ArecentreportbytheEuropeanCourtofAuditors2highlightedthedangersofpoorlytargetedspending:of€460millioninCohesionpolicyfundsspenton20airportinfrastructureprojectsinEstonia,Italy,Greece,Poland,andSpain,28%wasdeemedtohavegonetoprojectsthatwere“notneededatall”.Sevenofthe20airportswhichreceivedfundingforexpansionprojectsareunprofitable,andwilllikelybeclosedintheabsenceofpermanentpublicfunding.Indicatively,onlyhalfoftheairportsanalysedhadmorepassengerspost-expansion,suggestingsignificantunderutilizationofthenewlybuiltinfrastructure.
GovernmentandfinancialsectorconstraintsonfundingsuggeststhatEuropeancountriesshouldseekopportunitiesforcross-bordercollaborationandcreativefundingoptions.Europe’srelativelysmallgeographicsizeandexistingintegrationmeanscrossborderTravel&Tourisminfrastructurecollaborationcanbeuniquelyeffective.ForEurope,smartinvestment,especiallyinperiodsoffiscalausterity,maycomeintheformofcreativefundingoptionslikepublicprivatepartnershipsorevencrowdfunding.
2 ‘EU-funded airport infrastructures: poor value for money’, (2014), European Court of Auditors, December.
Askøy Bridge – Bergen and Askøy, Norway
European Travel & Tourism: Where are the greatest current and future investment needs? April 2015
10 11
SwitzerlandSpainFranceUnitedKingdomAustriaGermanyItalyIcelandCyprusMaltaIrelandGreeceNorwayDenmarkPortugalNetherlandsBelgiumFinlandSwedenCroatiaSloveniaEstoniaCzech RepublicTurkeyLatviaBulgariaRussiaHungaryLithuaniaPolandSlovakiaRomaniaSerbiaMacedoniaAlbaniaBosnia and HerzegovinaMoldova
-0.4 -0.2 0.0 0.2 0.4 0.6 0.8 1.0 1.2 1.4 1.6 1.8 2.0BalanceLess favourable ratioHighercurrent
Travel & Tourism infrastructure
quality and capacity
More favourable ratio
Legend: Well-placed At medium riskWell-placed, but key risks
Athighrisk
* The T&T investment to demand ratio is the ratio of forecasted average annual Travel & Tourism investment growth over the next decade divided by forecasted average annual Travel & Tourism demand over the same period.
Note: Four countries are excluded from this diagram. Belarus lacks WEF infrastructure data, forecasts for the Ukraine at the time of publication are vastly more uncertain than is typical due to the country’s ongoing conflict, and Luxembourg and Montenegro are outliers that obscure trends among the 37 other countries in the diagram.
Lower current Travel & Tourism
infrastructure quality and
capacity
Figure 0.1: Defining the problem with country typologies
Direct
Eastern Europe
Western & Northern Europe
World
Southern Europe
0
Indirect Induced
% Whole Economy GDP
Sources:WTTC,OxfordEconomics
2 4 6 8 10 12 14
6.2
8.8
12.7
9.8
How investment and infrastructure support Europe’s Travel & Tourism sector
chapter 1
1.1 The economic contribution of the Travel & Tourism sector to Europe’s economyTheTravel&Tourismsectorcontinuestogrowinvalueandimportanceintheglobaleconomy.RecenteconomicimpactresearchbytheWTTCandOxfordEconomicsestimatesthatTravel&Tourismsupported€5.7trillion3,4,ingrossdomesticproduct(GDP)in2014,amountingto9.8%ofglobalGDPfortheyear.Thesectoralsosupportednearly280millionjobsworldwide.
TheEuropeanTravel&Tourismsectorisanimportantpartoftheglobalpicture.In2014,itsupportednearly€1.6trillioninGDP,or28%ofglobalTravel&TourismGDPand9.3%oftotalEuropeanGDP.Furthermore,theEuropeanTravel&Tourismsectorsupportedatotalof33.5millionjobs,morethanissupported(individually)bytheEuropeanICT,mining,orbankingsector.
Thereis,however,significantvariationintherelativecontributionofTravel&TourismbetweenEurope’sregionaleconomies5. In Southern Europe the Travel & Tourism sector supportsanaverageof12.7%ofGDP(Figure1.1).Thatisafull2.9percentagepointsmorethantheworldaverageof9.8%.SouthernEuropeaneconomies,severalofwhichhavestruggledeconomicallyinrecentyearsandcontinuetofacesignificantchallenges,canthereforebecharacterisedasbeinghighlyreliantonTravel&Tourism.WesternandNorthernEuropeancountries(8.8%)andEasternEuropeancountries(6.2%)arelessreliantonthesectorthantheglobalaverage.
Figure 1.1: Direct, indirect, and induced Travel & Tourism contribution to GDP in 2014 (%)
3 Including direct, indirect (supply–chain), and induced (consumer spending) impacts. A standard economic impact analysis considers all three impacts: Direct impacts arise from the sector’s operational activities providing services to its customers; indirect impacts arise as the sector makes purchases from other sectors in the economy, precipitating supply–chain ripple effects; induced impacts flow from consumer spending in retail and leisure outlets initiated by employees working in the sector or in the sector’s supply chain.4 All currency values in this report are measured in Euros at 2014 prices and exchange rates unless otherwise specified.5 See Page 6 for the countries that make up each regional grouping.
T&T investment to demand ratio* (2010–2014 avg to 2025)
European Travel & Tourism: Where are the greatest current and future investment needs? April 2015
12 13
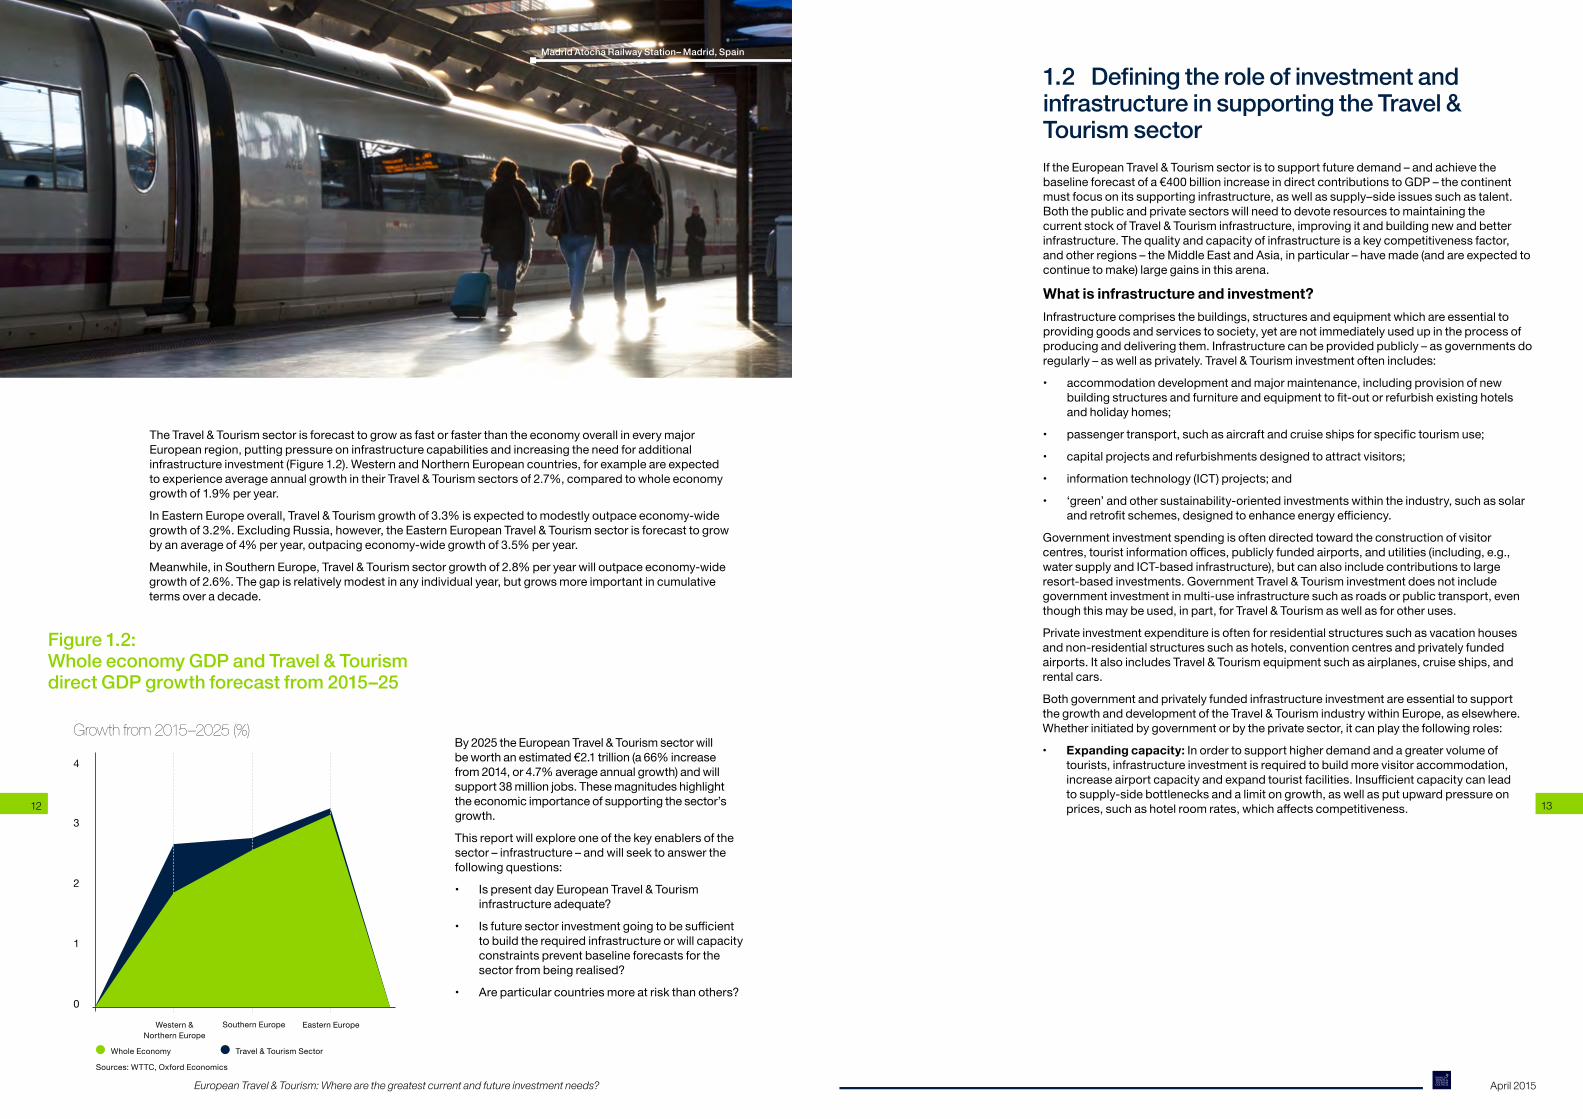
TheTravel&TourismsectorisforecasttogrowasfastorfasterthantheeconomyoverallineverymajorEuropeanregion,puttingpressureoninfrastructurecapabilitiesandincreasingtheneedforadditionalinfrastructureinvestment(Figure1.2).WesternandNorthernEuropeancountries,forexampleareexpectedtoexperienceaverageannualgrowthintheirTravel&Tourismsectorsof2.7%,comparedtowholeeconomygrowthof1.9%peryear.
InEasternEuropeoverall,Travel&Tourismgrowthof3.3%isexpectedtomodestlyoutpaceeconomy-widegrowthof3.2%.ExcludingRussia,however,theEasternEuropeanTravel&Tourismsectorisforecasttogrowbyanaverageof4%peryear,outpacingeconomy-widegrowthof3.5%peryear.
Meanwhile,inSouthernEurope,Travel&Tourismsectorgrowthof2.8%peryearwilloutpaceeconomy-widegrowthof2.6%.Thegapisrelativelymodestinanyindividualyear,butgrowsmoreimportantincumulativeterms over a decade.
Eastern EuropeWestern & Northern Europe
Southern Europe
0
1
2
3
4
Whole Economy Travel & Tourism Sector
Growth from 2015–2025 (%)
Sources:WTTC,OxfordEconomics
Figure 1.2: Whole economy GDP and Travel & Tourism direct GDP growth forecast from 2015–25
By2025theEuropeanTravel&Tourismsectorwillbeworthanestimated€2.1trillion(a66%increasefrom2014,or4.7%averageannualgrowth)andwillsupport38millionjobs.Thesemagnitudeshighlighttheeconomicimportanceofsupportingthesector’sgrowth.
This report will explore one of the key enablers of the sector – infrastructure – and will seek to answer the followingquestions:
• Is present day European Travel & Tourism infrastructureadequate?
• Isfuturesectorinvestmentgoingtobesufficientto build the required infrastructure or will capacity constraints prevent baseline forecasts for the sectorfrombeingrealised?
• Areparticularcountriesmoreatriskthanothers?
1.2 Defining the role of investment and infrastructure in supporting the Travel & Tourism sectorIf the European Travel & Tourism sector is to support future demand – and achieve the baselineforecastofa€400billionincreaseindirectcontributionstoGDP–thecontinentmustfocusonitssupportinginfrastructure,aswellassupply–sideissuessuchastalent.BoththepublicandprivatesectorswillneedtodevoteresourcestomaintainingthecurrentstockofTravel&Tourisminfrastructure,improvingitandbuildingnewandbetterinfrastructure.Thequalityandcapacityofinfrastructureisakeycompetitivenessfactor,andotherregions–theMiddleEastandAsia,inparticular–havemade(andareexpectedtocontinuetomake)largegainsinthisarena.
What is infrastructure and investment?Infrastructurecomprisesthebuildings,structuresandequipmentwhichareessentialtoprovidinggoodsandservicestosociety,yetarenotimmediatelyusedupintheprocessofproducinganddeliveringthem.Infrastructurecanbeprovidedpublicly–asgovernmentsdoregularly–aswellasprivately.Travel&Tourisminvestmentoftenincludes:
• accommodationdevelopmentandmajormaintenance,includingprovisionofnewbuildingstructuresandfurnitureandequipmenttofit-outorrefurbishexistinghotelsand holiday homes;
• passengertransport,suchasaircraftandcruiseshipsforspecifictourismuse;
• capitalprojectsandrefurbishmentsdesignedtoattractvisitors;
• informationtechnology(ICT)projects;and
• ‘green’andothersustainability-orientedinvestmentswithintheindustry,suchassolarandretrofitschemes,designedtoenhanceenergyefficiency.
Governmentinvestmentspendingisoftendirectedtowardtheconstructionofvisitorcentres,touristinformationoffices,publiclyfundedairports,andutilities(including,e.g.,watersupplyandICT-basedinfrastructure),butcanalsoincludecontributionstolargeresort-based investments. Government Travel & Tourism investment does not include governmentinvestmentinmulti-useinfrastructuresuchasroadsorpublictransport,eventhoughthismaybeused,inpart,forTravel&Tourismaswellasforotheruses.
Private investment expenditure is often for residential structures such as vacation houses andnon-residentialstructuressuchashotels,conventioncentresandprivatelyfundedairports.ItalsoincludesTravel&Tourismequipmentsuchasairplanes,cruiseships,andrental cars.
BothgovernmentandprivatelyfundedinfrastructureinvestmentareessentialtosupportthegrowthanddevelopmentoftheTravel&TourismindustrywithinEurope,aselsewhere.Whetherinitiatedbygovernmentorbytheprivatesector,itcanplaythefollowingroles:
• Expanding capacity:Inordertosupporthigherdemandandagreatervolumeoftourists,infrastructureinvestmentisrequiredtobuildmorevisitoraccommodation,increaseairportcapacityandexpandtouristfacilities.Insufficientcapacitycanleadtosupply-sidebottlenecksandalimitongrowth,aswellasputupwardpressureonprices,suchashotelroomrates,whichaffectscompetitiveness.
Madrid Atocha Railway Station– Madrid, Spain
European Travel & Tourism: Where are the greatest current and future investment needs? April 2015
14 15
• Maintaining and enhancing current infrastructure:Continuedinvestmentinexistinginfrastructureplaysacentralroleinmaintainingandimprovingitsfunctionalityandqualitythroughmajorrefurbishmentandupgrading.Capitalexpenditureonexistinginfrastructureisessentialforadaptinginfrastructuretoaccountfortheevolutioninconsumertastesovertime,suchasgrowingvisitordemandforWiFiservices,whilerefurbishmentsextendthelifeofexistinginfrastructureassets.
• Stimulating demand:Capitalexpenditureonnewvisitorattractionscangenerateadditionaldemandandhelpgainorretainmarketshareinthefaceofcompetition.Theseprojectsaimtoenhancetheappealofadestinationthroughimprovingitsoffering.Forexample,ahubairportcanputalocation–likeDubai–ontheTravel&Tourismmap,whichstimulatesdemandforTravel&Tourismserviceswellbeyondtheairport itself.
6 Four countries – Albania, Croatia, Malta, and Montenegro – have been removed from the figure. They are unique in that they are small economies with relatively undeveloped infrastructure, yet tourism impacts comprise exceptionally large shares of their GDP. They have been removed to avoid obscuring the relationship observed between infrastructure capability and Travel & Tourism impacts in the majority of European countries. These four countries comprise just 0.3% of the gross domestic product of the 41 countries comprising Europe in this report7 World Economic Forum, (2014), ‘Travel and Tourism Competitiveness Report 2013’. The WEF produces a Travel and Tourism competitiveness report every two years.8 The WEF composite infrastructure score is computed as the simple average of three key infrastructure pillars within the Travel and Tourism Competitiveness Report, including Tourism Infrastructure, Air Transport Infrastructure, and Ground Transport Infrastructure. Scores are ranked from 1-7 and are based on a WEF executive opinion survey.
1.3 The importance of investment to success in the Travel & Tourism sectorWhethertravellingforbusiness,visitingfriendsandfamily,orleisurepurposes,athomeorabroad,travellersdirectlyandindirectlyrelyonawiderangeofinfrastructure.Visitorstravelbyrail,road,airorsea;communicatebyphone,email,orinstantmessage;sleepinhotelsandotherformsofaccommodation;attendmeetingsandenjoyentertainmentoptionsthatwouldbeimpossiblewithoutsupportinginfrastructure,whetheritbearobustelectricalgridand water supply or a well-maintained road and airport network.
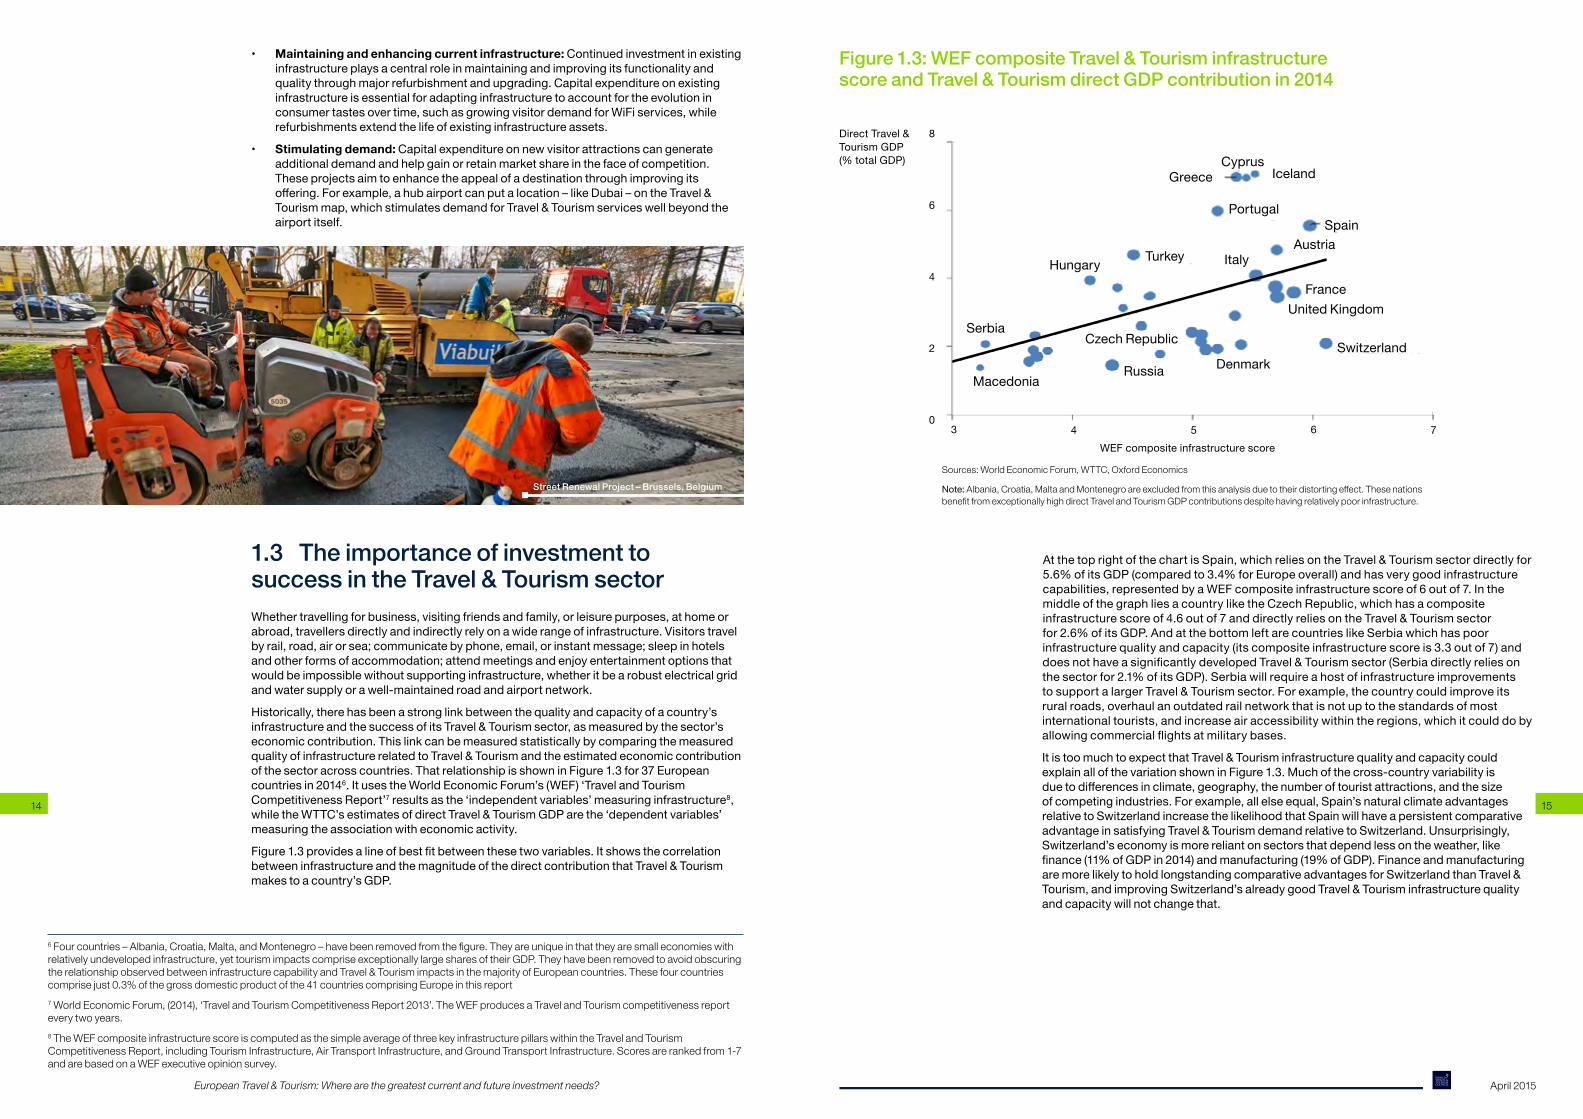
Historically,therehasbeenastronglinkbetweenthequalityandcapacityofacountry’sinfrastructureandthesuccessofitsTravel&Tourismsector,asmeasuredbythesector’seconomiccontribution.Thislinkcanbemeasuredstatisticallybycomparingthemeasuredquality of infrastructure related to Travel & Tourism and the estimated economic contribution ofthesectoracrosscountries.ThatrelationshipisshowninFigure1.3for37Europeancountriesin20146.ItusestheWorldEconomicForum’s(WEF)‘TravelandTourismCompetitiveness Report’7resultsasthe‘independentvariables’measuringinfrastructure8,while the WTTC’s estimates of direct Travel & Tourism GDP are the ‘dependent variables’ measuringtheassociationwitheconomicactivity.
Figure1.3providesalineofbestfitbetweenthesetwovariables.ItshowsthecorrelationbetweeninfrastructureandthemagnitudeofthedirectcontributionthatTravel&Tourismmakes to a country’s GDP.
AtthetoprightofthechartisSpain,whichreliesontheTravel&Tourismsectordirectlyfor5.6%ofitsGDP(comparedto3.4%forEuropeoverall)andhasverygoodinfrastructurecapabilities,representedbyaWEFcompositeinfrastructurescoreof6outof7.InthemiddleofthegraphliesacountryliketheCzechRepublic,whichhasacompositeinfrastructurescoreof4.6outof7anddirectlyreliesontheTravel&Tourismsectorfor2.6%ofitsGDP.AndatthebottomleftarecountrieslikeSerbiawhichhaspoorinfrastructurequalityandcapacity(itscompositeinfrastructurescoreis3.3outof7)anddoesnothaveasignificantlydevelopedTravel&Tourismsector(Serbiadirectlyreliesonthesectorfor2.1%ofitsGDP).SerbiawillrequireahostofinfrastructureimprovementstosupportalargerTravel&Tourismsector.Forexample,thecountrycouldimproveitsruralroads,overhaulanoutdatedrailnetworkthatisnotuptothestandardsofmostinternationaltourists,andincreaseairaccessibilitywithintheregions,whichitcoulddobyallowingcommercialflightsatmilitarybases.
It is too much to expect that Travel & Tourism infrastructure quality and capacity could explainallofthevariationshowninFigure1.3.Muchofthecross-countryvariabilityisduetodifferencesinclimate,geography,thenumberoftouristattractions,andthesizeofcompetingindustries.Forexample,allelseequal,Spain’snaturalclimateadvantagesrelative to Switzerland increase the likelihood that Spain will have a persistent comparative advantageinsatisfyingTravel&TourismdemandrelativetoSwitzerland.Unsurprisingly,Switzerland’seconomyismorereliantonsectorsthatdependlessontheweather,likefinance(11%ofGDPin2014)andmanufacturing(19%ofGDP).FinanceandmanufacturingaremorelikelytoholdlongstandingcomparativeadvantagesforSwitzerlandthanTravel&Tourism,andimprovingSwitzerland’salreadygoodTravel&Tourisminfrastructurequalityandcapacitywillnotchangethat.
Figure 1.3: WEF composite Travel & Tourism infrastructure score and Travel & Tourism direct GDP contribution in 2014
DenmarkRussia
Hungary
Czech RepublicSerbia
Macedonia
Switzerland
UnitedKingdomFrance
Spain
IcelandCyprus
Greece
Austria
Portugal
ItalyTurkey4
6
8
2
03 4 5 6 7
Direct Travel & Tourism GDP(%totalGDP)
WEFcompositeinfrastructurescore
Sources: World Economic Forum, WTTC, Oxford Economics
Note: Albania, Croatia, Malta and Montenegro are excluded from this analysis due to their distorting effect. These nations benefit from exceptionally high direct Travel and Tourism GDP contributions despite having relatively poor infrastructure.
Street Renewal Project – Brussels, Belgium
European Travel & Tourism: Where are the greatest current and future investment needs? April 2015
16 17
1.4 Infrastructure quality and capacity today are strongly related to historical investment spending
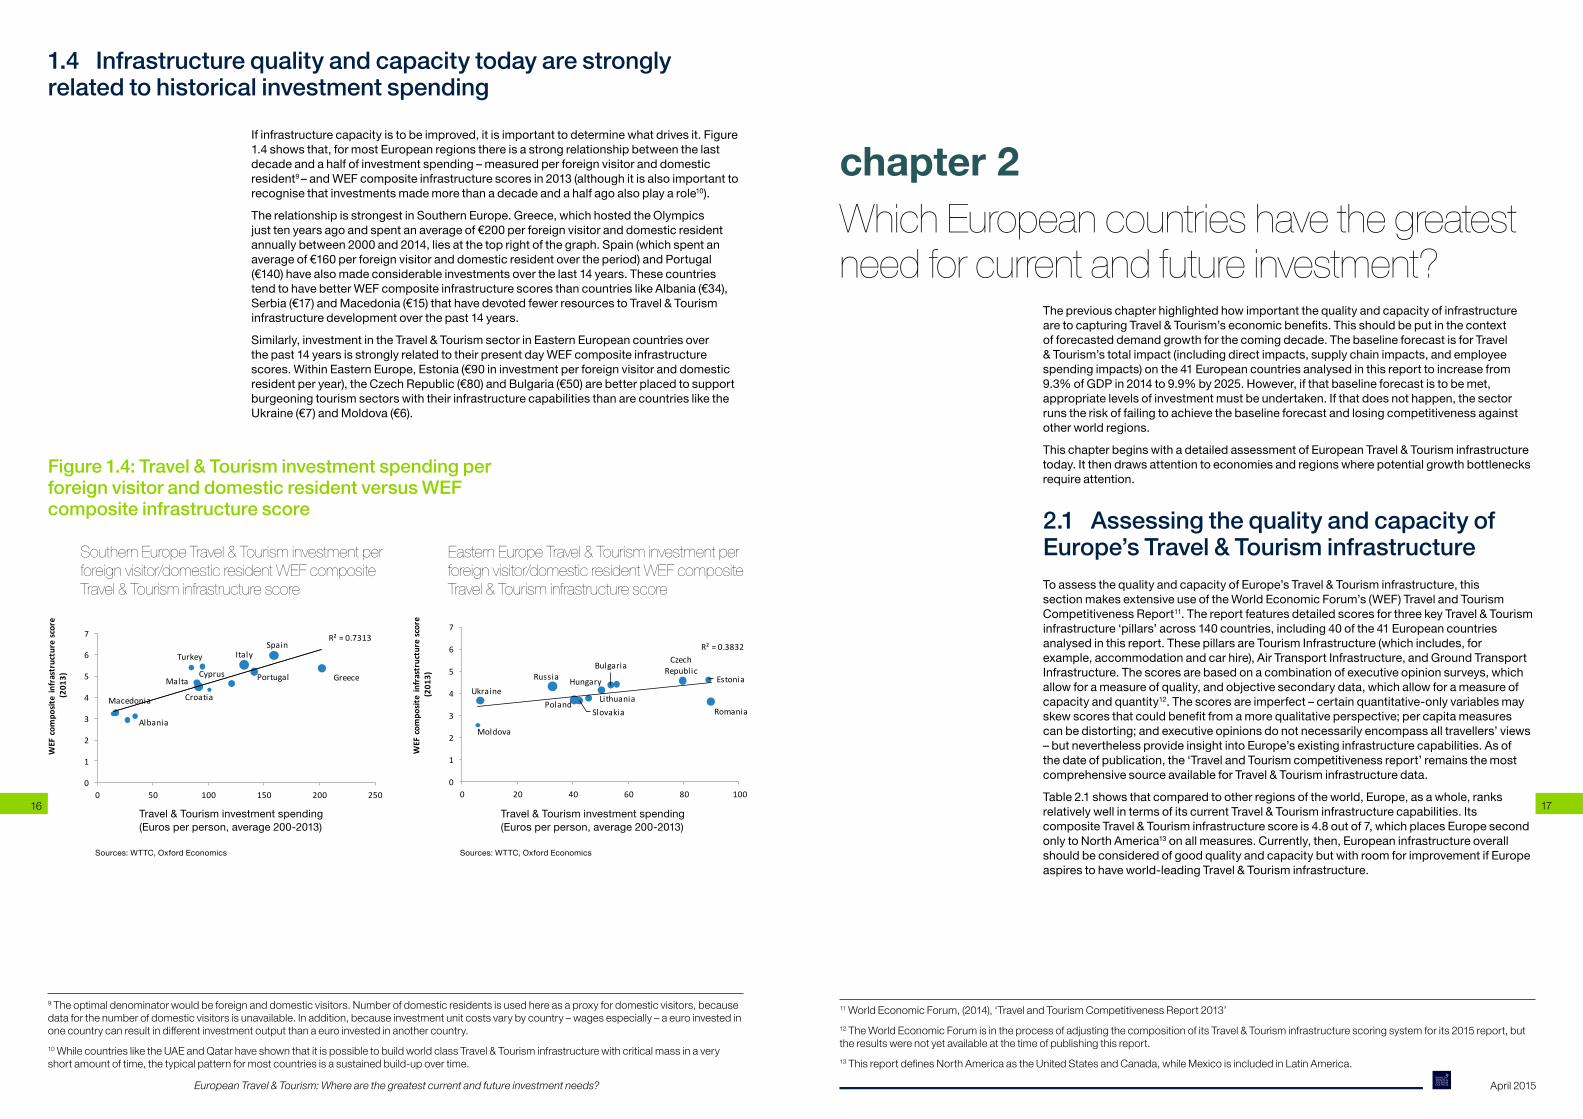
Ifinfrastructurecapacityistobeimproved,itisimportanttodeterminewhatdrivesit.Figure1.4showsthat,formostEuropeanregionsthereisastrongrelationshipbetweenthelastdecadeandahalfofinvestmentspending–measuredperforeignvisitoranddomesticresident9–andWEFcompositeinfrastructurescoresin2013(althoughitisalsoimportanttorecognisethatinvestmentsmademorethanadecadeandahalfagoalsoplayarole10).
TherelationshipisstrongestinSouthernEurope.Greece,whichhostedtheOlympicsjusttenyearsagoandspentanaverageof€200perforeignvisitoranddomesticresidentannuallybetween2000and2014,liesatthetoprightofthegraph.Spain(whichspentanaverageof€160perforeignvisitoranddomesticresidentovertheperiod)andPortugal(€140)havealsomadeconsiderableinvestmentsoverthelast14years.ThesecountriestendtohavebetterWEFcompositeinfrastructurescoresthancountrieslikeAlbania(€34),Serbia(€17)andMacedonia(€15)thathavedevotedfewerresourcestoTravel&Tourisminfrastructuredevelopmentoverthepast14years.
Similarly,investmentintheTravel&TourismsectorinEasternEuropeancountriesoverthepast14yearsisstronglyrelatedtotheirpresentdayWEFcompositeinfrastructurescores.WithinEasternEurope,Estonia(€90ininvestmentperforeignvisitoranddomesticresidentperyear),theCzechRepublic(€80)andBulgaria(€50)arebetterplacedtosupportburgeoningtourismsectorswiththeirinfrastructurecapabilitiesthanarecountriesliketheUkraine(€7)andMoldova(€6).
Figure 1.4: Travel & Tourism investment spending per foreign visitor and domestic resident versus WEF composite infrastructure score
BulgariaCzech
RepublicHungary
PolandRomaniaSlovakia
Moldova
Russia
UkraineEstonia
Lithuania
R² = 0.3832
0
1
2
3
4
5
6
7
0 20 40 60 80 100
WEF
com
posit
e in
fras
truc
ture
scor
e(2
013)
Travel & Tourism investment spending (Euros per person, average 2000-2013)
Eastern Europe Travel & Tourism investment per foreign visitor/domestic resident and WEF composite Travel & Tourism infrastructure score
Sources: WTTC, Oxford Economics
Greece
Italy
Portugal
Spain
Croatia
CyprusMalta
Albania
Macedonia
Turkey
R² = 0.7313
0
1
2
3
4
5
6
7
0 50 100 150 200 250
WEF
com
posit
e in
fras
truc
ture
scor
e(2
013)
Travel & Tourism investment spending (Euros per person, average 2000-2013)
Southern Europe Travel & Tourism investment per foreign visitor/domesticresident and WEF composite Travel & Tourism infrastructure score
Sources: WTTC, Oxford Economics
9 The optimal denominator would be foreign and domestic visitors. Number of domestic residents is used here as a proxy for domestic visitors, because data for the number of domestic visitors is unavailable. In addition, because investment unit costs vary by country – wages especially – a euro invested in one country can result in different investment output than a euro invested in another country. 10 While countries like the UAE and Qatar have shown that it is possible to build world class Travel & Tourism infrastructure with critical mass in a very short amount of time, the typical pattern for most countries is a sustained build-up over time.
11 World Economic Forum, (2014), ‘Travel and Tourism Competitiveness Report 2013’12 The World Economic Forum is in the process of adjusting the composition of its Travel & Tourism infrastructure scoring system for its 2015 report, but the results were not yet available at the time of publishing this report.13 This report defines North America as the United States and Canada, while Mexico is included in Latin America.
Which European countries have the greatest need for current and future investment?
ThepreviouschapterhighlightedhowimportantthequalityandcapacityofinfrastructurearetocapturingTravel&Tourism’seconomicbenefits.Thisshouldbeputinthecontextofforecasteddemandgrowthforthecomingdecade.ThebaselineforecastisforTravel&Tourism’stotalimpact(includingdirectimpacts,supplychainimpacts,andemployeespendingimpacts)onthe41Europeancountriesanalysedinthisreporttoincreasefrom9.3%ofGDPin2014to9.9%by2025.However,ifthatbaselineforecastistobemet,appropriatelevelsofinvestmentmustbeundertaken.Ifthatdoesnothappen,thesectorrunstheriskoffailingtoachievethebaselineforecastandlosingcompetitivenessagainstotherworldregions.
ThischapterbeginswithadetailedassessmentofEuropeanTravel&Tourisminfrastructuretoday.Itthendrawsattentiontoeconomiesandregionswherepotentialgrowthbottlenecksrequire attention.
2.1 Assessing the quality and capacity of Europe’s Travel & Tourism infrastructureToassessthequalityandcapacityofEurope’sTravel&Tourisminfrastructure,thissectionmakesextensiveuseoftheWorldEconomicForum’s(WEF)TravelandTourismCompetitiveness Report11. The report features detailed scores for three key Travel & Tourism infrastructure‘pillars’across140countries,including40ofthe41Europeancountriesanalysedinthisreport.ThesepillarsareTourismInfrastructure(whichincludes,forexample,accommodationandcarhire),AirTransportInfrastructure,andGroundTransportInfrastructure.Thescoresarebasedonacombinationofexecutiveopinionsurveys,whichallowforameasureofquality,andobjectivesecondarydata,whichallowforameasureofcapacity and quantity12. The scores are imperfect – certain quantitative-only variables may skewscoresthatcouldbenefitfromamorequalitativeperspective;percapitameasurescanbedistorting;andexecutiveopinionsdonotnecessarilyencompassalltravellers’views–butneverthelessprovideinsightintoEurope’sexistinginfrastructurecapabilities.Asofthedateofpublication,the‘TravelandTourismcompetitivenessreport’remainsthemostcomprehensive source available for Travel & Tourism infrastructure data.
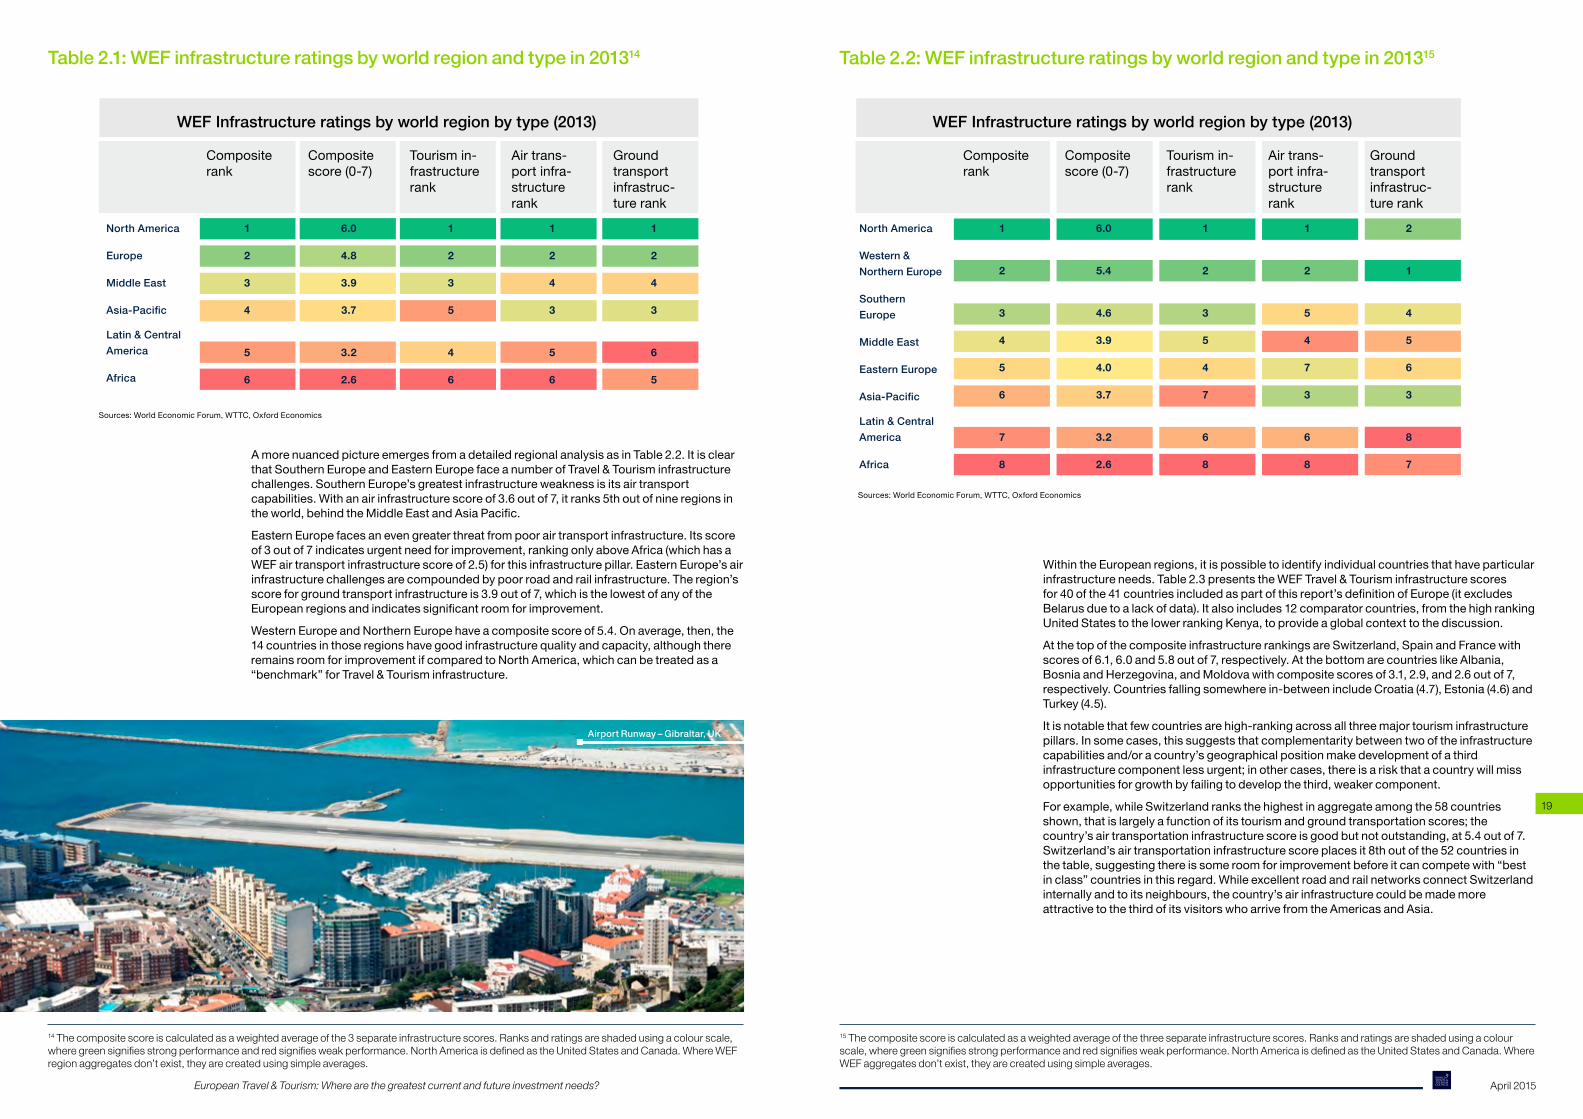
Table2.1showsthatcomparedtootherregionsoftheworld,Europe,asawhole,ranksrelatively well in terms of its current Travel & Tourism infrastructure capabilities. Its compositeTravel&Tourisminfrastructurescoreis4.8outof7,whichplacesEuropesecondonly to North America13onallmeasures.Currently,then,EuropeaninfrastructureoverallshouldbeconsideredofgoodqualityandcapacitybutwithroomforimprovementifEuropeaspirestohaveworld-leadingTravel&Tourisminfrastructure.
chapter 2
Travel&Tourisminvestmentspending(Eurosperperson,average200-2013)
Travel&Tourisminvestmentspending(Eurosperperson,average200-2013)
Sources:WTTC,OxfordEconomics Sources:WTTC,OxfordEconomics
Eastern Europe Travel & Tourism investment per foreign visitor/domestic resident WEF composite Travel & Tourism infrastructure score
Southern Europe Travel & Tourism investment per foreign visitor/domestic resident WEF composite Travel & Tourism infrastructure score
European Travel & Tourism: Where are the greatest current and future investment needs? April 2015
18 19
Table 2.1: WEF infrastructure ratings by world region and type in 201314
WEF Infrastructure ratings by world region by type (2013)
Composite rank
North America
Europe
Middle East
Asia-Pacific
Latin & Central America
Africa
1
2
3
4
5
6
6.0
4.8
3.9
3.7
3.2
2.6
1
2
3
5
4
6
1
2
4
3
5
6
1
2
4
3
6
5
Composite score(0-7)
Tourism in-frastructure rank
Air trans-port infra-structure rank
Ground transport infrastruc-ture rank
Sources:WorldEconomicForum,WTTC,OxfordEconomics
AmorenuancedpictureemergesfromadetailedregionalanalysisasinTable2.2.Itisclearthat Southern Europe and Eastern Europe face a number of Travel & Tourism infrastructure challenges.SouthernEurope’sgreatestinfrastructureweaknessisitsairtransportcapabilities.Withanairinfrastructurescoreof3.6outof7,itranks5thoutofnineregionsintheworld,behindtheMiddleEastandAsiaPacific.
EasternEuropefacesanevengreaterthreatfrompoorairtransportinfrastructure.Itsscoreof3outof7indicatesurgentneedforimprovement,rankingonlyaboveAfrica(whichhasaWEFairtransportinfrastructurescoreof2.5)forthisinfrastructurepillar.EasternEurope’sairinfrastructurechallengesarecompoundedbypoorroadandrailinfrastructure.Theregion’sscoreforgroundtransportinfrastructureis3.9outof7,whichisthelowestofanyoftheEuropeanregionsandindicatessignificantroomforimprovement.
WesternEuropeandNorthernEuropehaveacompositescoreof5.4.Onaverage,then,the14countriesinthoseregionshavegoodinfrastructurequalityandcapacity,althoughthereremainsroomforimprovementifcomparedtoNorthAmerica,whichcanbetreatedasa“benchmark”forTravel&Tourisminfrastructure.
14 The composite score is calculated as a weighted average of the 3 separate infrastructure scores. Ranks and ratings are shaded using a colour scale, where green signifies strong performance and red signifies weak performance. North America is defined as the United States and Canada. Where WEF region aggregates don’t exist, they are created using simple averages.
Table 2.2: WEF infrastructure ratings by world region and type in 201315
15 The composite score is calculated as a weighted average of the three separate infrastructure scores. Ranks and ratings are shaded using a colour scale, where green signifies strong performance and red signifies weak performance. North America is defined as the United States and Canada. Where WEF aggregates don’t exist, they are created using simple averages.
Sources:WorldEconomicForum,WTTC,OxfordEconomics
WEF Infrastructure ratings by world region by type (2013)
Composite rank
North America
Western & Northern Europe
Southern Europe
Middle East
Eastern Europe
Asia-Pacific
Latin & Central America
Africa
1
2
3
4
5
6
7
8
1
2
3
5
4
7
6
8
6.0
5.4
4.6
3.9
4.0
3.7
3.2
2.6
Composite score(0-7)
Tourism in-frastructure rank
Air trans-port infra-structure rank
Ground transport infrastruc-ture rank
1
2
5
4
7
3
6
8
2
1
4
5
6
3
8
7
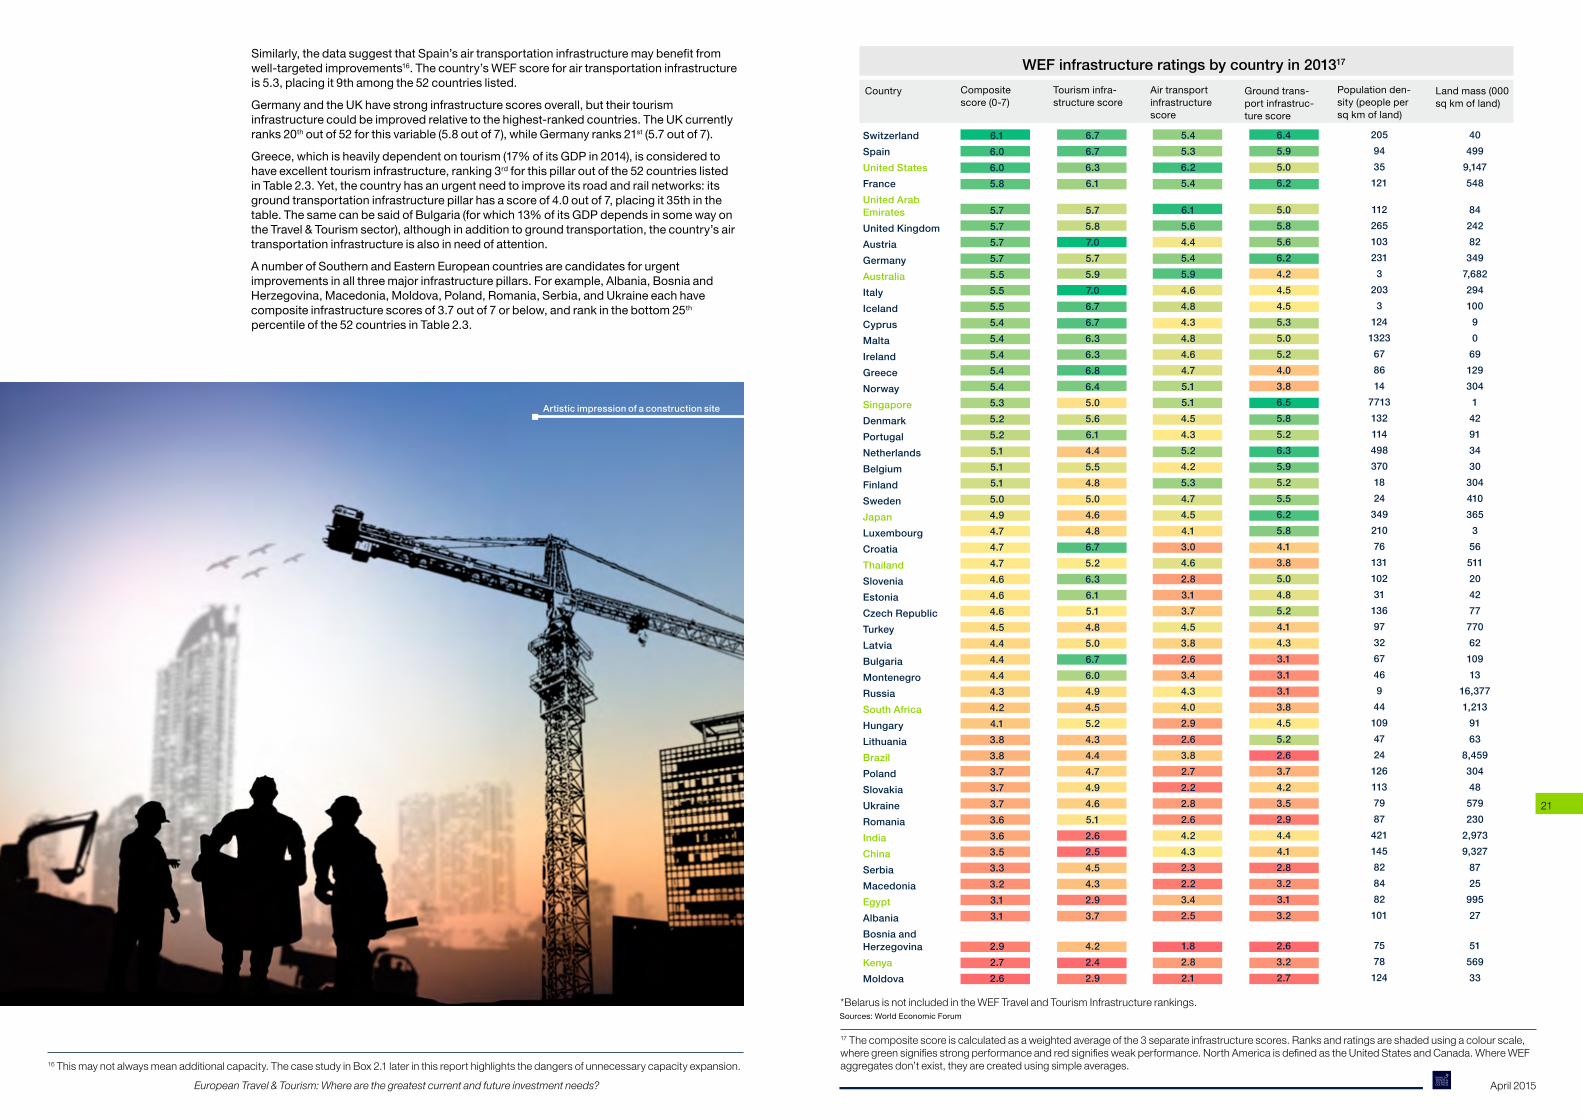
WithintheEuropeanregions,itispossibletoidentifyindividualcountriesthathaveparticularinfrastructureneeds.Table2.3presentstheWEFTravel&Tourisminfrastructurescoresfor40ofthe41countriesincludedaspartofthisreport’sdefinitionofEurope(itexcludesBelarusduetoalackofdata).Italsoincludes12comparatorcountries,fromthehighrankingUnitedStatestothelowerrankingKenya,toprovideaglobalcontexttothediscussion.
AtthetopofthecompositeinfrastructurerankingsareSwitzerland,SpainandFrancewithscoresof6.1,6.0and5.8outof7,respectively.AtthebottomarecountrieslikeAlbania,BosniaandHerzegovina,andMoldovawithcompositescoresof3.1,2.9,and2.6outof7,respectively.Countriesfallingsomewherein-betweenincludeCroatia(4.7),Estonia(4.6)andTurkey(4.5).
Itisnotablethatfewcountriesarehigh-rankingacrossallthreemajortourisminfrastructurepillars.Insomecases,thissuggeststhatcomplementaritybetweentwooftheinfrastructurecapabilitiesand/oracountry’sgeographicalpositionmakedevelopmentofathirdinfrastructurecomponentlessurgent;inothercases,thereisariskthatacountrywillmissopportunitiesforgrowthbyfailingtodevelopthethird,weakercomponent.
Forexample,whileSwitzerlandranksthehighestinaggregateamongthe58countriesshown,thatislargelyafunctionofitstourismandgroundtransportationscores;thecountry’sairtransportationinfrastructurescoreisgoodbutnotoutstanding,at5.4outof7.Switzerland’sairtransportationinfrastructurescoreplacesit8thoutofthe52countriesinthetable,suggestingthereissomeroomforimprovementbeforeitcancompetewith“bestinclass”countriesinthisregard.WhileexcellentroadandrailnetworksconnectSwitzerlandinternallyandtoitsneighbours,thecountry’sairinfrastructurecouldbemademoreattractive to the third of its visitors who arrive from the Americas and Asia.
Airport Runway – Gibraltar, UK
European Travel & Tourism: Where are the greatest current and future investment needs? April 2015
20 21
Similarly,thedatasuggestthatSpain’sairtransportationinfrastructuremaybenefitfromwell-targetedimprovements16.Thecountry’sWEFscoreforairtransportationinfrastructureis5.3,placingit9thamongthe52countrieslisted.
GermanyandtheUKhavestronginfrastructurescoresoverall,buttheirtourisminfrastructurecouldbeimprovedrelativetothehighest-rankedcountries.TheUKcurrentlyranks20thoutof52forthisvariable(5.8outof7),whileGermanyranks21st(5.7outof7).
Greece,whichisheavilydependentontourism(17%ofitsGDPin2014),isconsideredtohaveexcellenttourisminfrastructure,ranking3rdforthispillaroutofthe52countrieslistedinTable2.3.Yet,thecountryhasanurgentneedtoimproveitsroadandrailnetworks:itsgroundtransportationinfrastructurepillarhasascoreof4.0outof7,placingit35thinthetable.ThesamecanbesaidofBulgaria(forwhich13%ofitsGDPdependsinsomewayontheTravel&Tourismsector),althoughinadditiontogroundtransportation,thecountry’sairtransportation infrastructure is also in need of attention.
AnumberofSouthernandEasternEuropeancountriesarecandidatesforurgentimprovementsinallthreemajorinfrastructurepillars.Forexample,Albania,BosniaandHerzegovina,Macedonia,Moldova,Poland,Romania,Serbia,andUkraineeachhavecompositeinfrastructurescoresof3.7outof7orbelow,andrankinthebottom25th percentileofthe52countriesinTable2.3.
SwitzerlandSpainUnited StatesFranceUnited Arab EmiratesUnited KingdomAustriaGermanyAustraliaItalyIcelandCyprusMaltaIrelandGreeceNorwaySingaporeDenmarkPortugalNetherlandsBelgiumFinlandSwedenJapanLuxembourgCroatiaThailandSloveniaEstoniaCzech RepublicTurkeyLatviaBulgariaMontenegroRussiaSouth AfricaHungaryLithuaniaBrazilPolandSlovakiaUkraineRomaniaIndiaChinaSerbiaMacedoniaEgyptAlbaniaBosnia and HerzegovinaKenyaMoldova
6.16.06.05.8
5.75.75.75.75.55.55.55.45.45.45.45.45.35.25.25.15.15.15.04.94.74.74.74.64.64.64.54.44.44.44.34.24.13.83.83.73.73.73.63.63.53.33.23.13.1
2.92.72.6
6.76.76.36.1
5.75.87.05.75.97.06.76.76.36.36.86.45.05.66.14.45.54.85.04.64.86.75.26.36.15.14.85.06.76.04.94.55.24.34.44.74.94.65.12.62.54.54.32.93.7
4.22.42.9
5.45.36.25.4
6.15.64.45.45.94.64.84.34.84.64.75.15.14.54.35.24.25.34.74.54.13.04.62.83.13.74.53.82.63.44.34.02.92.63.82.72.22.82.64.24.32.32.23.42.5
1.82.82.1
6.45.95.06.2
5.05.85.66.24.24.54.55.35.05.24.03.86.55.85.26.35.95.25.56.25.84.13.85.04.85.24.14.33.13.13.13.84.55.22.63.74.23.52.94.44.12.83.23.13.2
2.63.22.7
40499
9,147548
8424282
3497,68229410090
69129304
142913430
304410365
3565112042777706210913
16,3771,213
9163
8,45930448579230
2,9739,327
8725
99527
5156933
2059435121
112265103231
3203
3124
1323678614
77131321144983701824
3492107613110231136973267469
4410947241261137987
421145828482101
7578124
WEF infrastructure ratings by country in 201317
Population den-sity(peoplepersqkmofland)
Landmass(000sqkmofland)
Composite score(0-7)
Country Tourism infra-structure score
Air transport infrastructure score
Ground trans-port infrastruc-ture score
Sources:WorldEconomicForum*Belarus is not included in the WEF Travel and Tourism Infrastructure rankings.
16 This may not always mean additional capacity. The case study in Box 2.1 later in this report highlights the dangers of unnecessary capacity expansion.
17 The composite score is calculated as a weighted average of the 3 separate infrastructure scores. Ranks and ratings are shaded using a colour scale, where green signifies strong performance and red signifies weak performance. North America is defined as the United States and Canada. Where WEF aggregates don’t exist, they are created using simple averages.
Artistic impression of a construction site
European Travel & Tourism: Where are the greatest current and future investment needs? April 2015
22 23
Box 2.1: Case study: The importance of smart investment
Not all investment expenditure results in improved infrastructure. Investment expenditure can be poorly targeted,subjecttopoliticalcorruption,orotherwisemisspent.Insuchcases,theresultinginfrastructureislikely to be poor value for money.
A recent analysis by the European Court of Auditors18suggeststhatpoorlytargetedinvestmentinairtransportinfrastructureisanimportantissueforanumberofEuropeancountries.Thereport,publishedinDecember2014,analysed€460millioninCohesionpolicyfunds(suchastheEuropeanRegionalDevelopmentFund)thatwerespenton20airportinfrastructureprojectsinEstonia,Italy,Greece,Poland,andSpain.Itfoundthatthefunding,whichwasspentbetween2000and2013,waspoorvalueformoneyoverall.
Overbuildingwasakeyreasonforthis.Justhalfoftheairportsanalysedincreasedpassengernumbersafterprojectcompletion,suggestingsignificantunderutilizationofthenewlybuiltinfrastructure.
Ahighrateoffailuretoachievefinancialsustainabilitywasanotherreasonforthereport’sconclusion.Sevenoutofthe20airportsanalysedareunprofitableandwilllikelybeclosediftheyarenotsupportedbyongoingpublicfunding.
TheEuropeanCourtofAuditorsreportconcludedthat28%oftheEUfundinganalysed,or€129million,wenttowardsprojectsthatwere“notneededatall”19.
Smartinvestments,then,mustbebasedonarealisticpossibilityofincreasingusernumbersandprofitability.ExamplesofmisplacedinvestmentintheEuropeanCourtofAuditors’reportoftenneglectedboth.Onesuchexample is Kastoria National Airport in Greece.
Anexampleofcost-ineffectivecapacityexpansion:KastoriaNationalAirportinGreece.
KastoriaNationalAirport,with5,300inpassengertrafficin2013,isoneofthesmallestairportsanalysedbytheEuropeanCourtofAuditorsreport.ThepotentialforairinfrastructurebottlenecksintheregionarelimitedbecausevirtuallyallresidentswithintheKastoriaAirport’scatchmentareahaveaccesstoanearbycompetingairportwithin50minutesbyroad,andtwoothercompetingairportscanbeaccessedwithintwohours’drive.
Withinthiscontext,thereportassesseswhetherarunwayexpansionproject,costing€16.5million(34%ofwhichwasEUfunded),wasgoodvalueformoney.Theassessmentnotesthattheexpandedrunwayhasneverbeenusedbythetypeofaircraftitwasbuiltforandtheairportoperatedatalossbetween2005and2012.Havinglost€275foreverypassengerusingtheairportoverthisperiod,thereportconcludesthattheexpandedrunway“cannotbeconsideredasaneffectiveuseofpublicfunds”20.
18 ‘EU-funded airport infrastructures: poor value for money’, (2014), European Court of Auditors, December. Quotes are from pages 14 and 66.19 Ibid. Page 14.20 Ibid. Page 27.
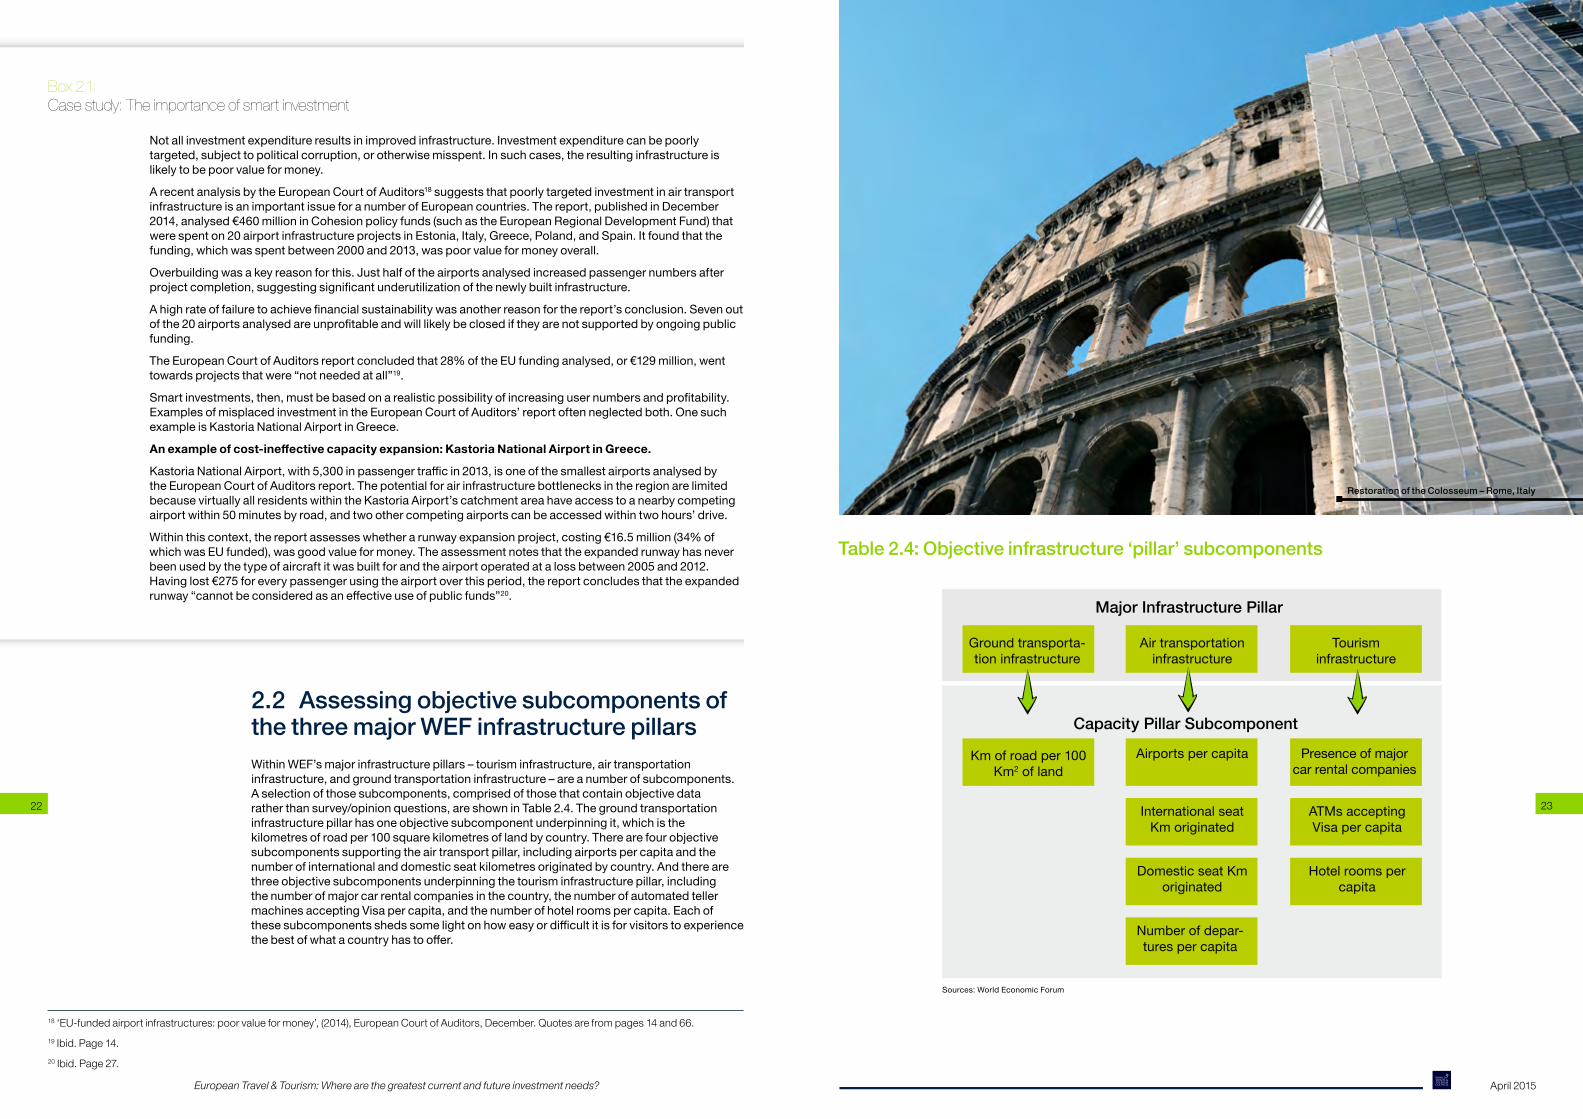
2.2 Assessing objective subcomponents of the three major WEF infrastructure pillarsWithinWEF’smajorinfrastructurepillars–tourisminfrastructure,airtransportationinfrastructure,andgroundtransportationinfrastructure–areanumberofsubcomponents.Aselectionofthosesubcomponents,comprisedofthosethatcontainobjectivedataratherthansurvey/opinionquestions,areshowninTable2.4.Thegroundtransportationinfrastructurepillarhasoneobjectivesubcomponentunderpinningit,whichisthekilometresofroadper100squarekilometresoflandbycountry.Therearefourobjectivesubcomponentssupportingtheairtransportpillar,includingairportspercapitaandthenumberofinternationalanddomesticseatkilometresoriginatedbycountry.Andtherearethreeobjectivesubcomponentsunderpinningthetourisminfrastructurepillar,includingthenumberofmajorcarrentalcompaniesinthecountry,thenumberofautomatedtellermachinesacceptingVisapercapita,andthenumberofhotelroomspercapita.Eachofthesesubcomponentsshedssomelightonhoweasyordifficultitisforvisitorstoexperiencethebestofwhatacountryhastooffer.
Table 2.4: Objective infrastructure ‘pillar’ subcomponents
Major Infrastructure Pillar
Capacity Pillar Subcomponent
Ground transporta-tion infrastructure
Kmofroadper100Km2 of land
Airports per capita
International seat Kmoriginated
Domestic seat Km originated
Number of depar-tures per capita
Air transportation infrastructure
Tourism infrastructure
Presenceofmajorcar rental companies
ATMsacceptingVisapercapita
Hotel rooms per capita
Sources:WorldEconomicForum
Restoration of the Colosseum – Rome, Italy
European Travel & Tourism: Where are the greatest current and future investment needs? April 2015
24 25
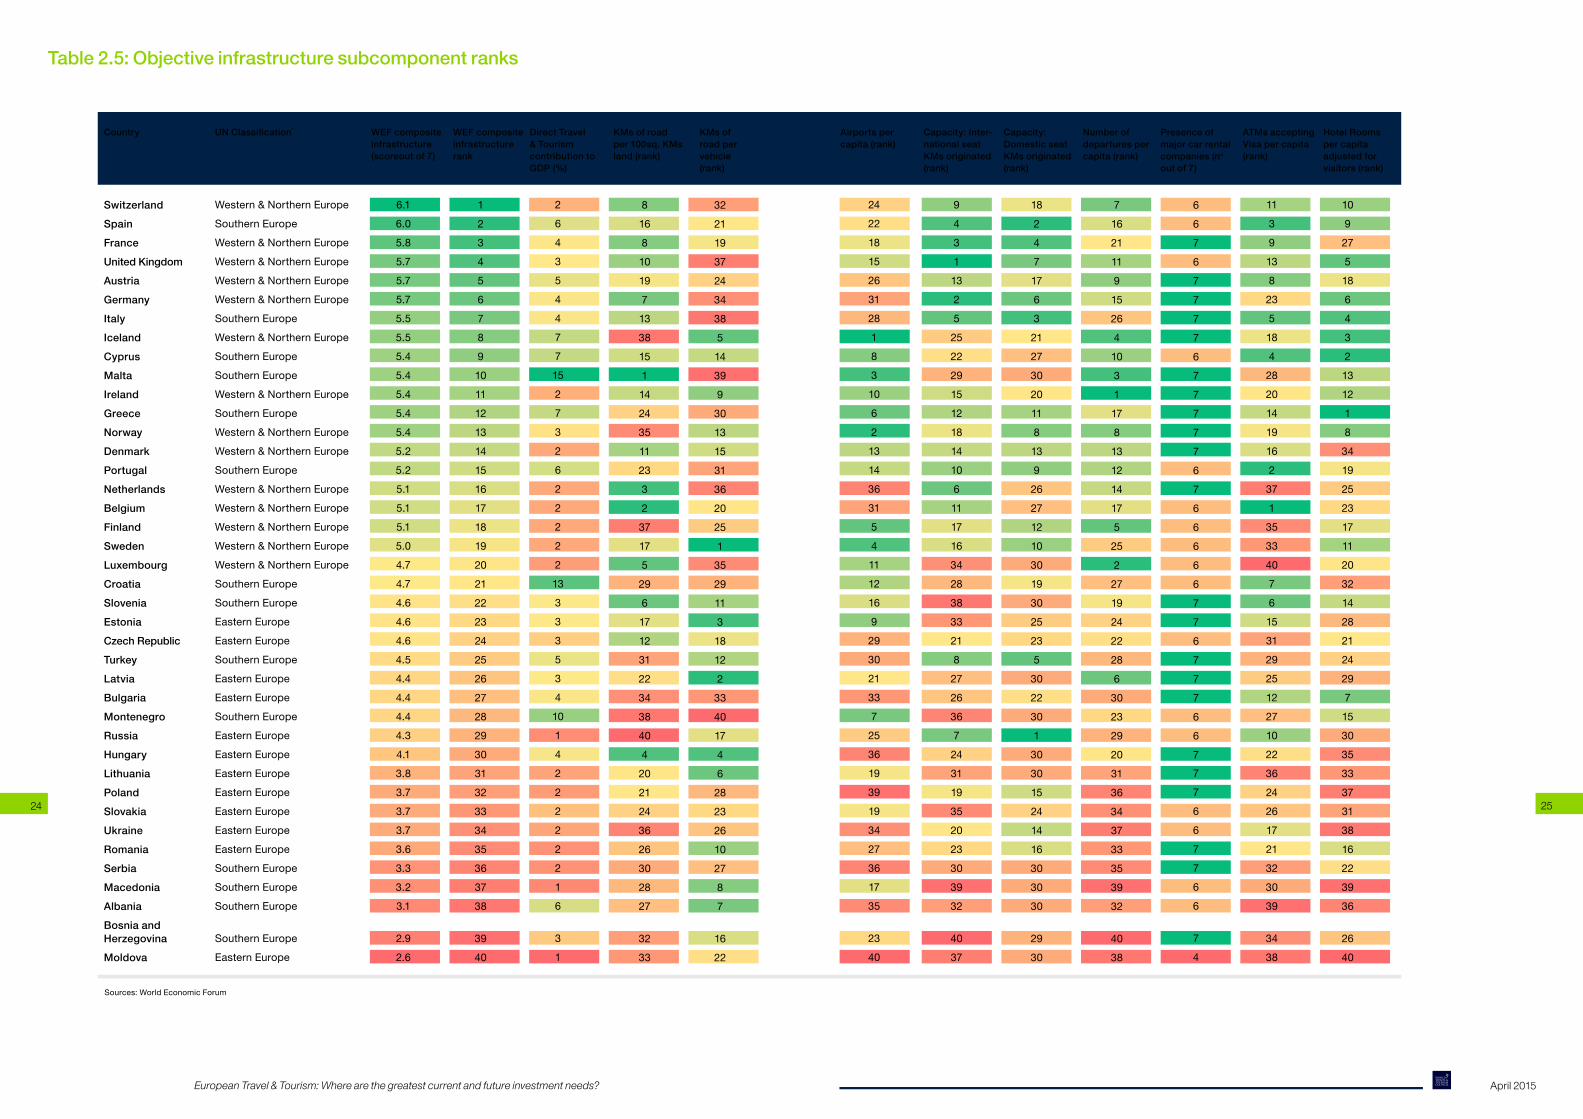
Table 2.5: Objective infrastructure subcomponent ranks
SwitzerlandSpainFranceUnited KingdomAustriaGermanyItalyIcelandCyprusMaltaIrelandGreeceNorwayDenmarkPortugalNetherlandsBelgiumFinlandSwedenLuxembourgCroatiaSloveniaEstoniaCzech RepublicTurkeyLatviaBulgariaMontenegroRussiaHungaryLithuaniaPolandSlovakiaUkraineRomaniaSerbiaMacedoniaAlbaniaBosnia and HerzegovinaMoldova
Western & Northern EuropeSouthern EuropeWestern & Northern EuropeWestern & Northern EuropeWestern & Northern EuropeWestern & Northern EuropeSouthern EuropeWestern & Northern EuropeSouthern EuropeSouthern EuropeWestern & Northern EuropeSouthern EuropeWestern & Northern EuropeWestern & Northern EuropeSouthern EuropeWestern & Northern EuropeWestern & Northern EuropeWestern & Northern EuropeWestern & Northern EuropeWestern & Northern EuropeSouthern EuropeSouthern EuropeEastern EuropeEastern EuropeSouthern EuropeEastern EuropeEastern EuropeSouthern EuropeEastern EuropeEastern EuropeEastern EuropeEastern EuropeEastern EuropeEastern EuropeEastern EuropeSouthern EuropeSouthern EuropeSouthern Europe Southern EuropeEastern Europe
6.16.05.85.75.75.75.55.55.45.45.45.45.45.25.25.15.15.15.04.74.74.64.64.64.54.44.44.44.34.13.83.73.73.73.63.33.23.1 2.92.6
9431132525222915121814106111716342838332182726367243119352023303932 4037
1234567891011121314151617181920212223242526272829303132333435363738 3940
1824717632127302011813926271210301930252353022301303015241416303030 2930
8168101971338151142435112332371752961712312234384042021243626302827 3233
7162111915264103117813121417525227192422286302329203136343733353932 4038
3221193724343851439930131531362025135291131812233401746282326102787 1622
66767777677777676666677677766777667766 74
2422181526312818310621314363154111216929302133725361939193427361735 2340
1139138235184282014191623713533407615312925122710223624261721323039 3438
1092751864321312183419252317112032142821242971530353337313816223936 2640
Country UN Classification* WEF composite infrastructure (scoreout of 7)
WEF composite infrastructure rank
KMs of road per 100sq. KMs land (rank)
KMs of road per vehicle (rank)
Airports per capita (rank)
Capacity: Inter-national seat KMs originated (rank)
Capacity: Domestic seat KMs originated (rank)
Number of departures per capita (rank)
Presence of major car rental companies (no out of 7)
ATMs accepting Visa per capita (rank)
Hotel Rooms per capita adjusted for visitors (rank)
26435447715273262222213333534101422222216 31
Direct Travel & Tourism contribution to GDP (%)
Sources:WorldEconomicForum
European Travel & Tourism: Where are the greatest current and future investment needs? April 2015
26 27
21 European Commission, (2012), ‘Measuring road congestion’.
Table2.5showsobjectivesubcomponentranksforeachofthe40countriesforwhichWEFdataareavailable.Anumberofinterestingpatternsareapparentwithinthetable.
First,thereisroomforimprovementevenforcountrieswithhighaveragesamongthethreemajorinfrastructurepillars.Forexample,FranceandAustria,whichbothrankhighlyoverallforTravel&Tourisminfrastructurequalityandcapacity,couldstandtoincreasethenumberofavailablehotels.TheUnitedKingdom,theNetherlands,Luxembourg,andGermanyareamongthecountriesthatwouldbenefitfromincreasedroadcapacity.Eachhasatleast60%morecarsperkilometreofroadcapacitythantheEuropeanaverage.Thiscausescongestion,bothin urban areas and on inter-urban links. A recent European Commission report21 found that these countries have a disproportionate number of inter-urban links where delays of over ten seconds per kilometre are common.
Second,evenamongcountrieswithpoorinfrastructurescoresoverall,thereareraysofhope.Russia–perhapsnotsurprisingforsuchalargecountry–showsanimpressiveabilitytoshuttlepeoplearounddomestically,andhasgreaterATMsaturationthantheUnitedKingdom.TheCzechRepublic’sroadnetworkismoreextensivethanthatinItalyorIrelandifmeasuredrelativetolandmass.AndvisitorstoBulgariaandMontenegroareunlikelytocomplainofashortageofhotelrooms,whichareadequatetoservicetheirdomesticandvisitingpopulations.Suchcountriescanbuildonthesesuccessestoimprovetheiroverallinfrastructure capabilities. A sustained focus on the weaker points of infrastructure over the nextdecade(andbeyond)isimperativeiftheyaretomeetthebaselineforecastsfor Travel & Tourism’s economic impacts discussed earlier in this report.
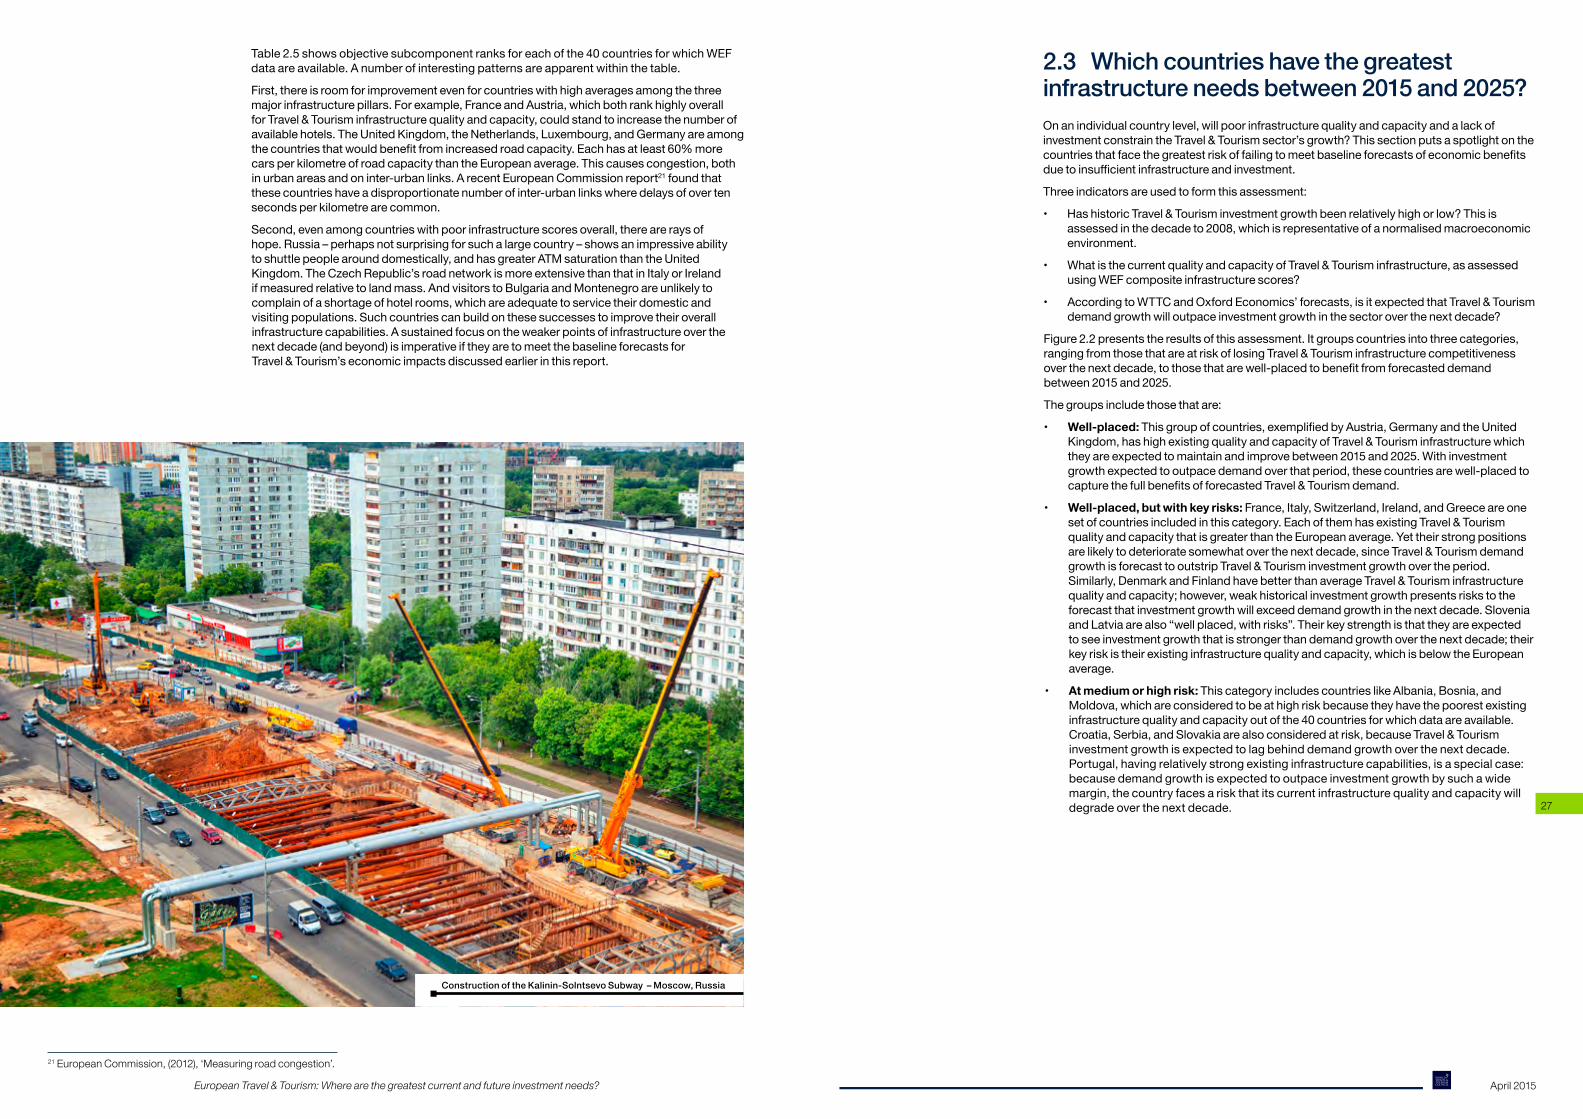
2.3 Which countries have the greatest infrastructure needs between 2015 and 2025?Onanindividualcountrylevel,willpoorinfrastructurequalityandcapacityandalackofinvestmentconstraintheTravel&Tourismsector’sgrowth?Thissectionputsaspotlightonthecountriesthatfacethegreatestriskoffailingtomeetbaselineforecastsofeconomicbenefitsduetoinsufficientinfrastructureandinvestment.
Threeindicatorsareusedtoformthisassessment:
• HashistoricTravel&Tourisminvestmentgrowthbeenrelativelyhighorlow?Thisisassessedinthedecadeto2008,whichisrepresentativeofanormalisedmacroeconomicenvironment.
• WhatisthecurrentqualityandcapacityofTravel&Tourisminfrastructure,asassessedusingWEFcompositeinfrastructurescores?
• AccordingtoWTTCandOxfordEconomics’forecasts,isitexpectedthatTravel&Tourismdemandgrowthwilloutpaceinvestmentgrowthinthesectoroverthenextdecade?
Figure2.2presentstheresultsofthisassessment.Itgroupscountriesintothreecategories,rangingfromthosethatareatriskoflosingTravel&Tourisminfrastructurecompetitivenessoverthenextdecade,tothosethatarewell-placedtobenefitfromforecasteddemandbetween2015and2025.
Thegroupsincludethosethatare:
• Well-placed:Thisgroupofcountries,exemplifiedbyAustria,GermanyandtheUnitedKingdom,hashighexistingqualityandcapacityofTravel&Tourisminfrastructurewhichtheyareexpectedtomaintainandimprovebetween2015and2025.Withinvestmentgrowthexpectedtooutpacedemandoverthatperiod,thesecountriesarewell-placedtocapturethefullbenefitsofforecastedTravel&Tourismdemand.
• Well-placed, but with key risks:France,Italy,Switzerland,Ireland,andGreeceareonesetofcountriesincludedinthiscategory.EachofthemhasexistingTravel&TourismqualityandcapacitythatisgreaterthantheEuropeanaverage.Yettheirstrongpositionsarelikelytodeterioratesomewhatoverthenextdecade,sinceTravel&TourismdemandgrowthisforecasttooutstripTravel&Tourisminvestmentgrowthovertheperiod.Similarly,DenmarkandFinlandhavebetterthanaverageTravel&Tourisminfrastructurequalityandcapacity;however,weakhistoricalinvestmentgrowthpresentsriskstotheforecastthatinvestmentgrowthwillexceeddemandgrowthinthenextdecade.SloveniaandLatviaarealso“wellplaced,withrisks”.Theirkeystrengthisthattheyareexpectedtoseeinvestmentgrowththatisstrongerthandemandgrowthoverthenextdecade;theirkeyriskistheirexistinginfrastructurequalityandcapacity,whichisbelowtheEuropeanaverage.
• At medium or high risk:ThiscategoryincludescountrieslikeAlbania,Bosnia,andMoldova,whichareconsideredtobeathighriskbecausetheyhavethepoorestexistinginfrastructurequalityandcapacityoutofthe40countriesforwhichdataareavailable.Croatia,Serbia,andSlovakiaarealsoconsideredatrisk,becauseTravel&Tourisminvestmentgrowthisexpectedtolagbehinddemandgrowthoverthenextdecade.Portugal,havingrelativelystrongexistinginfrastructurecapabilities,isaspecialcase:becausedemandgrowthisexpectedtooutpaceinvestmentgrowthbysuchawidemargin,thecountryfacesariskthatitscurrentinfrastructurequalityandcapacitywilldegradeoverthenextdecade.
Construction of the Kalinin-Solntsevo Subway – Moscow, Russia
European Travel & Tourism: Where are the greatest current and future investment needs? April 2015
28 29
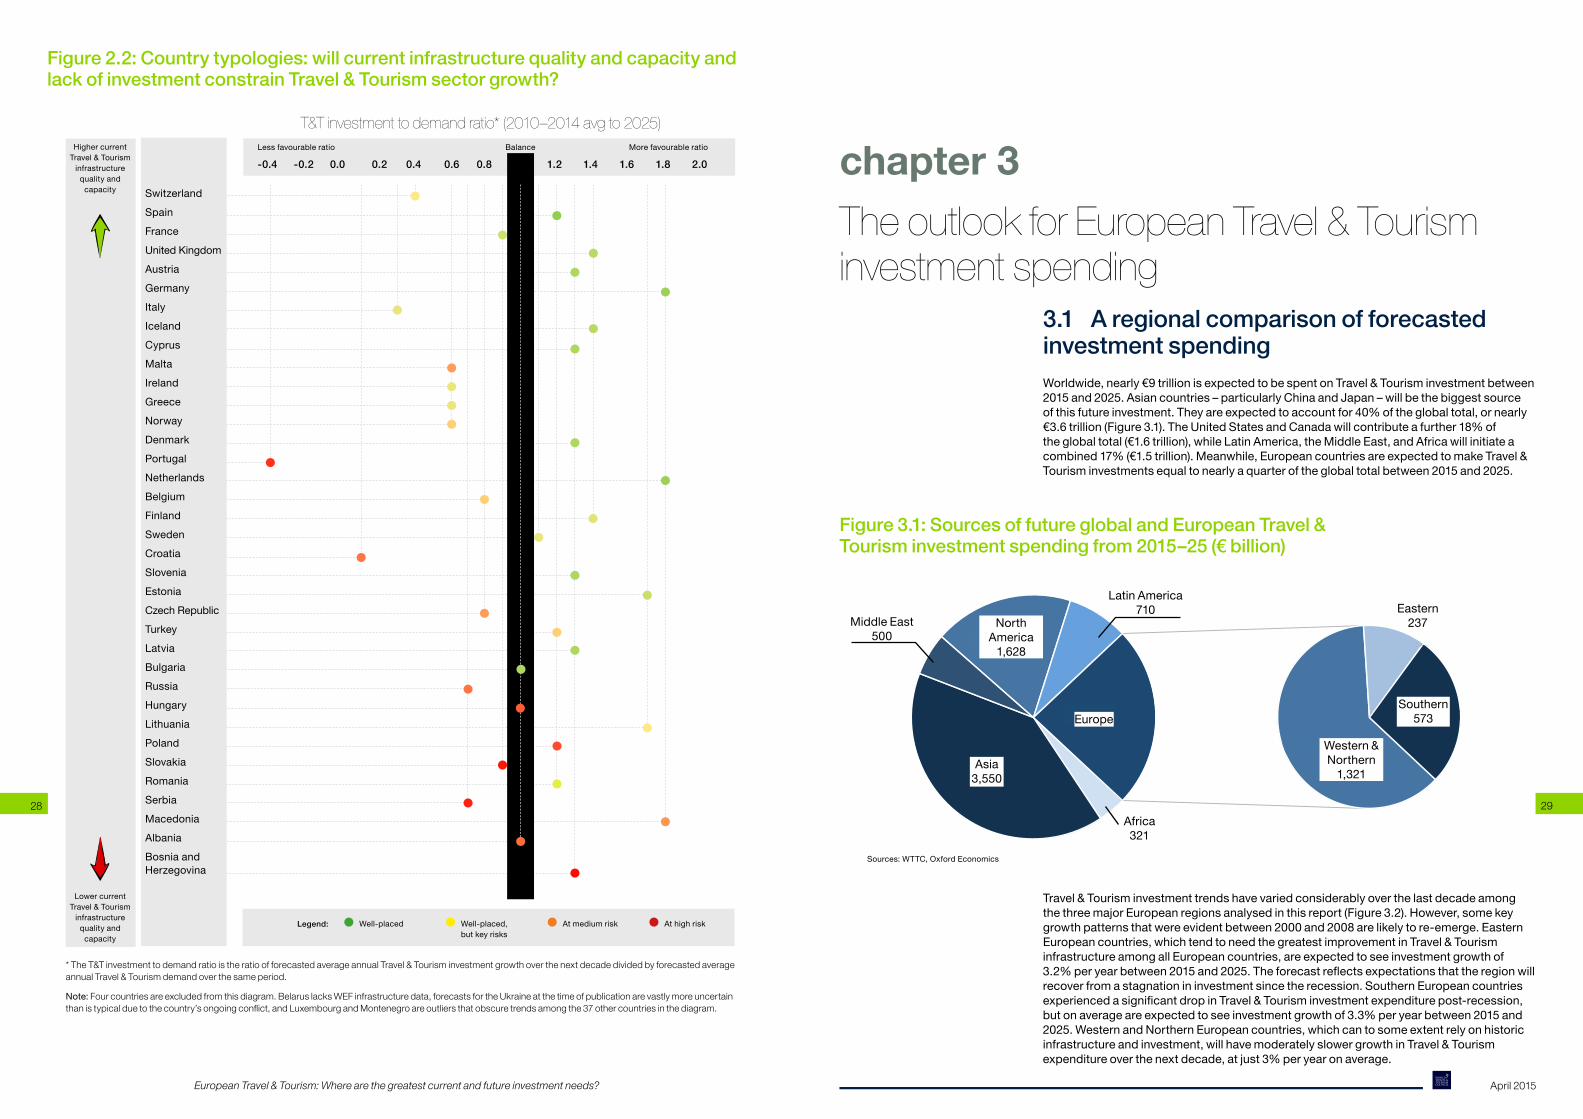
Figure 2.2: Country typologies: will current infrastructure quality and capacity and lack of investment constrain Travel & Tourism sector growth?
SwitzerlandSpainFranceUnitedKingdomAustriaGermanyItalyIcelandCyprusMaltaIrelandGreeceNorwayDenmarkPortugalNetherlandsBelgiumFinlandSwedenCroatiaSloveniaEstoniaCzech RepublicTurkeyLatviaBulgariaRussiaHungaryLithuaniaPolandSlovakiaRomaniaSerbiaMacedoniaAlbaniaBosnia and Herzegovina
-0.4 -0.2 0.0 0.2 0.4 0.6 0.8 1.0 1.2 1.4 1.6 1.8 2.0BalanceLess favourable ratioHighercurrent
Travel & Tourism infrastructure
quality and capacity
More favourable ratio
Legend: Well-placed At medium riskWell-placed, but key risks
Athighrisk
* The T&T investment to demand ratio is the ratio of forecasted average annual Travel & Tourism investment growth over the next decade divided by forecasted average annual Travel & Tourism demand over the same period.
Note: Four countries are excluded from this diagram. Belarus lacks WEF infrastructure data, forecasts for the Ukraine at the time of publication are vastly more uncertain than is typical due to the country’s ongoing conflict, and Luxembourg and Montenegro are outliers that obscure trends among the 37 other countries in the diagram.
Lower current Travel & Tourism
infrastructure quality and
capacity
The outlook for European Travel & Tourism investment spending
chapter 3
3.1 A regional comparison of forecasted investment spendingWorldwide,nearly€9trillionisexpectedtobespentonTravel&Tourisminvestmentbetween2015and2025.Asiancountries–particularlyChinaandJapan–willbethebiggestsourceofthisfutureinvestment.Theyareexpectedtoaccountfor40%oftheglobaltotal,ornearly€3.6trillion(Figure3.1).TheUnitedStatesandCanadawillcontributeafurther18%oftheglobaltotal(€1.6trillion),whileLatinAmerica,theMiddleEast,andAfricawillinitiateacombined17%(€1.5trillion).Meanwhile,EuropeancountriesareexpectedtomakeTravel&Tourisminvestmentsequaltonearlyaquarteroftheglobaltotalbetween2015and2025.
Figure 3.1: Sources of future global and European Travel & Tourism investment spending from 2015–25 (€ billion)
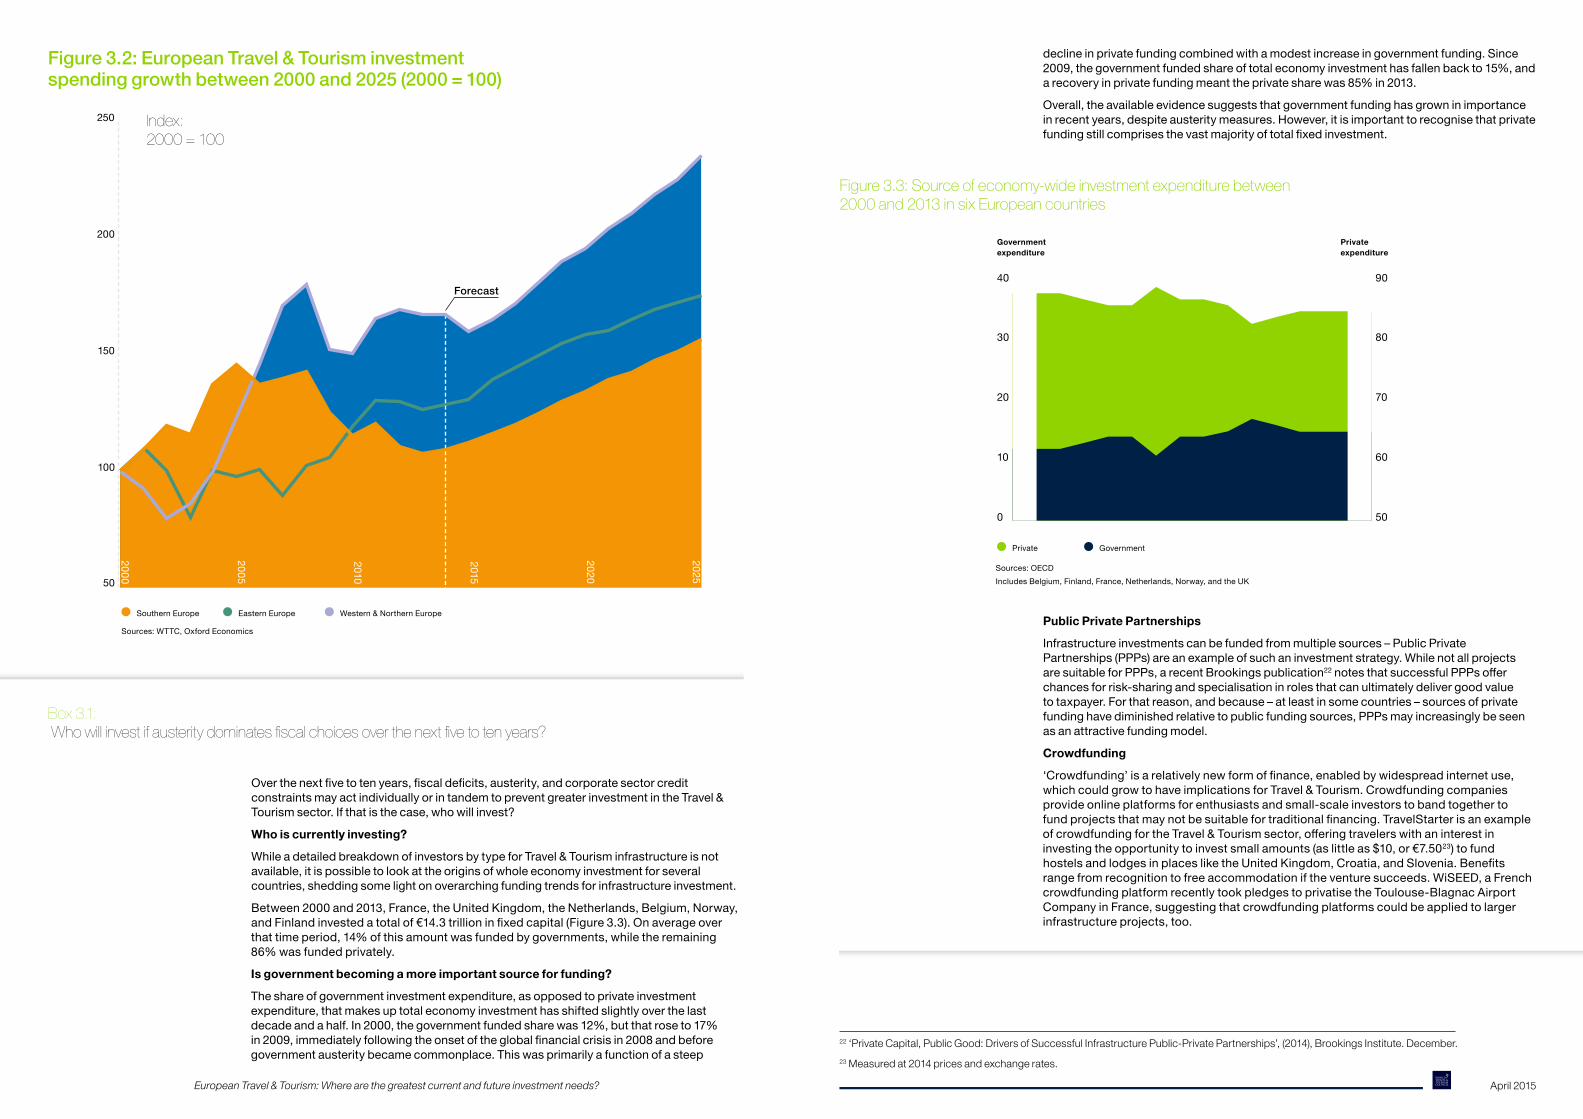
Travel&TourisminvestmenttrendshavevariedconsiderablyoverthelastdecadeamongthethreemajorEuropeanregionsanalysedinthisreport(Figure3.2).However,somekeygrowthpatternsthatwereevidentbetween2000and2008arelikelytore-emerge.EasternEuropeancountries,whichtendtoneedthegreatestimprovementinTravel&TourisminfrastructureamongallEuropeancountries,areexpectedtoseeinvestmentgrowthof3.2%peryearbetween2015and2025.Theforecastreflectsexpectationsthattheregionwillrecoverfromastagnationininvestmentsincetherecession.SouthernEuropeancountriesexperiencedasignificantdropinTravel&Tourisminvestmentexpenditurepost-recession,butonaverageareexpectedtoseeinvestmentgrowthof3.3%peryearbetween2015and2025.WesternandNorthernEuropeancountries,whichcantosomeextentrelyonhistoricinfrastructureandinvestment,willhavemoderatelyslowergrowthinTravel&Tourismexpenditureoverthenextdecade,atjust3%peryearonaverage.
T&T investment to demand ratio* (2010–2014 avg to 2025)
Africa, 321
Asia, 3,550
Middle East, 500
North America, 1,628
Latin America, 710
Western & Northern, 1,321
Eastern, 237
Southern, 573 Europe
Source: WTTC, Oxford Economics
Sources:WTTC,OxfordEconomics
Europe
Asia 3,550
Southern 573
Eastern 237
Africa 321
Western & Northern 1,321
North America 1,628
Middle East 500
Latin America 710
European Travel & Tourism: Where are the greatest current and future investment needs? April 2015
30 31
Figure 3.2: European Travel & Tourism investment spending growth between 2000 and 2025 (2000 = 100)
Box 3.1: Who will invest if austerity dominates fiscal choices over the next five to ten years?
Overthenextfivetotenyears,fiscaldeficits,austerity,andcorporatesectorcreditconstraintsmayactindividuallyorintandemtopreventgreaterinvestmentintheTravel&Tourismsector.Ifthatisthecase,whowillinvest?
Who is currently investing?
While a detailed breakdown of investors by type for Travel & Tourism infrastructure is not available,itispossibletolookattheoriginsofwholeeconomyinvestmentforseveralcountries,sheddingsomelightonoverarchingfundingtrendsforinfrastructureinvestment.
Between2000and2013,France,theUnitedKingdom,theNetherlands,Belgium,Norway,andFinlandinvestedatotalof€14.3trillioninfixedcapital(Figure3.3).Onaverageoverthattimeperiod,14%ofthisamountwasfundedbygovernments,whiletheremaining86%wasfundedprivately.
Is government becoming a more important source for funding?
Theshareofgovernmentinvestmentexpenditure,asopposedtoprivateinvestmentexpenditure,thatmakesuptotaleconomyinvestmenthasshiftedslightlyoverthelastdecadeandahalf.In2000,thegovernmentfundedsharewas12%,butthatroseto17%in2009,immediatelyfollowingtheonsetoftheglobalfinancialcrisisin2008andbeforegovernmentausteritybecamecommonplace.Thiswasprimarilyafunctionofasteep
declineinprivatefundingcombinedwithamodestincreaseingovernmentfunding.Since2009,thegovernmentfundedshareoftotaleconomyinvestmenthasfallenbackto15%,andarecoveryinprivatefundingmeanttheprivatesharewas85%in2013.
Overall,theavailableevidencesuggeststhatgovernmentfundinghasgrowninimportanceinrecentyears,despiteausteritymeasures.However,itisimportanttorecognisethatprivatefundingstillcomprisesthevastmajorityoftotalfixedinvestment.
Figure 3.3: Source of economy-wide investment expenditure between 2000 and 2013 in six European countries
0 50
10 60
20 70
30 80
40 90
Public Private Partnerships
Infrastructure investments can be funded from multiple sources – Public Private Partnerships(PPPs)areanexampleofsuchaninvestmentstrategy.WhilenotallprojectsaresuitableforPPPs,arecentBrookingspublication22notesthatsuccessfulPPPsofferchancesforrisk-sharingandspecialisationinrolesthatcanultimatelydelivergoodvaluetotaxpayer.Forthatreason,andbecause–atleastinsomecountries–sourcesofprivatefundinghavediminishedrelativetopublicfundingsources,PPPsmayincreasinglybeseenasanattractivefundingmodel.
Crowdfunding
‘Crowdfunding’isarelativelynewformoffinance,enabledbywidespreadinternetuse,whichcouldgrowtohaveimplicationsforTravel&Tourism.Crowdfundingcompaniesprovideonlineplatformsforenthusiastsandsmall-scaleinvestorstobandtogethertofundprojectsthatmaynotbesuitablefortraditionalfinancing.TravelStarterisanexampleofcrowdfundingfortheTravel&Tourismsector,offeringtravelerswithaninterestininvestingtheopportunitytoinvestsmallamounts(aslittleas$10,or€7.5023)tofundhostelsandlodgesinplacesliketheUnitedKingdom,Croatia,andSlovenia.Benefitsrangefromrecognitiontofreeaccommodationiftheventuresucceeds.WiSEED,aFrenchcrowdfundingplatformrecentlytookpledgestoprivatisetheToulouse-BlagnacAirportCompanyinFrance,suggestingthatcrowdfundingplatformscouldbeappliedtolargerinfrastructureprojects,too.
22 ‘Private Capital, Public Good: Drivers of Successful Infrastructure Public-Private Partnerships’, (2014), Brookings Institute. December.23 Measured at 2014 prices and exchange rates.
50
2000
2005
2010
2015
2020
2025
Forecast
Southern Europe Eastern Europe Western & Northern Europe
Sources:WTTC,OxfordEconomics
Index: 2000 = 100
100
150
200
250
Private Government
Government expenditure
Private expenditure
Sources:OECDIncludesBelgium,Finland,France,Netherlands,Norway,andtheUK
European Travel & Tourism: Where are the greatest current and future investment needs? April 2015
32 33
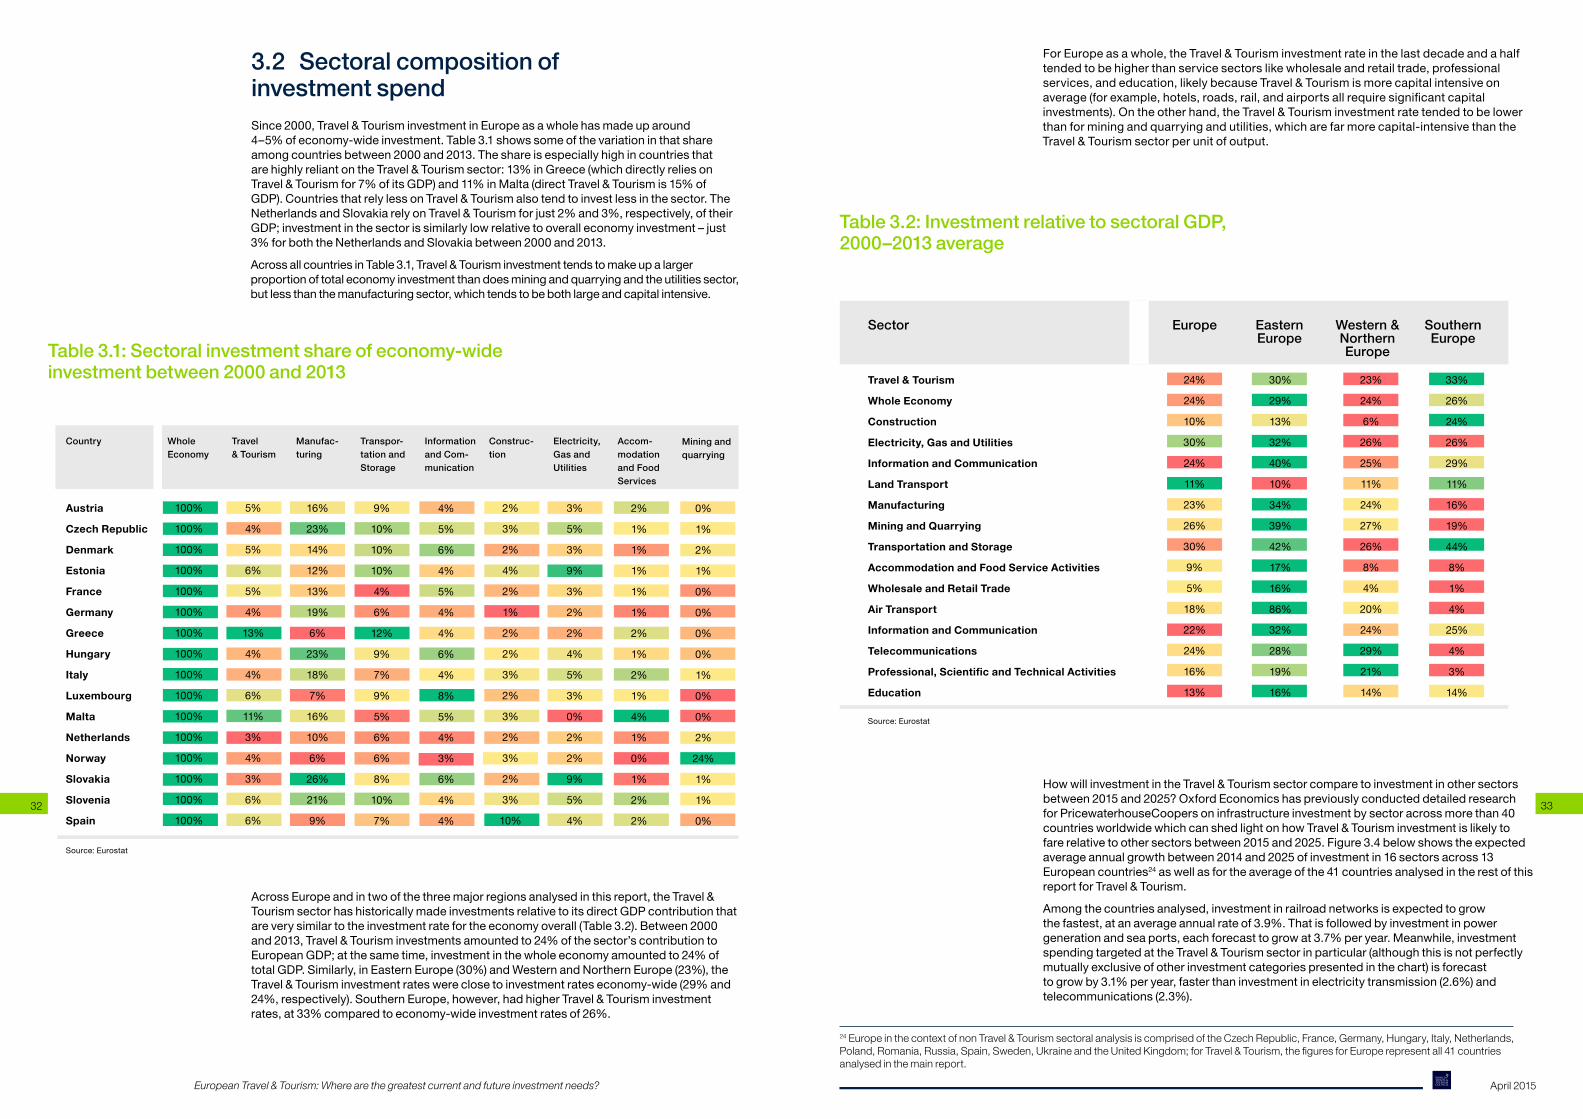
3.2 Sectoral composition of investment spendSince2000,Travel&TourisminvestmentinEuropeasawholehasmadeuparound4–5%ofeconomy-wideinvestment.Table3.1showssomeofthevariationinthatshareamongcountriesbetween2000and2013.TheshareisespeciallyhighincountriesthatarehighlyreliantontheTravel&Tourismsector:13%inGreece(whichdirectlyreliesonTravel&Tourismfor7%ofitsGDP)and11%inMalta(directTravel&Tourismis15%ofGDP).CountriesthatrelylessonTravel&Tourismalsotendtoinvestlessinthesector.TheNetherlandsandSlovakiarelyonTravel&Tourismforjust2%and3%,respectively,oftheirGDP;investmentinthesectorissimilarlylowrelativetooveralleconomyinvestment–just3%forboththeNetherlandsandSlovakiabetween2000and2013.
AcrossallcountriesinTable3.1,Travel&Tourisminvestmenttendstomakeupalargerproportionoftotaleconomyinvestmentthandoesminingandquarryingandtheutilitiessector,butlessthanthemanufacturingsector,whichtendstobebothlargeandcapitalintensive.
Table 3.1: Sectoral investment share of economy-wide investment between 2000 and 2013
ForEuropeasawhole,theTravel&Tourisminvestmentrateinthelastdecadeandahalftendedtobehigherthanservicesectorslikewholesaleandretailtrade,professionalservices,andeducation,likelybecauseTravel&Tourismismorecapitalintensiveonaverage(forexample,hotels,roads,rail,andairportsallrequiresignificantcapitalinvestments).Ontheotherhand,theTravel&Tourisminvestmentratetendedtobelowerthanforminingandquarryingandutilities,whicharefarmorecapital-intensivethantheTravel & Tourism sector per unit of output.
Table 3.2: Investment relative to sectoral GDP, 2000–2013 average
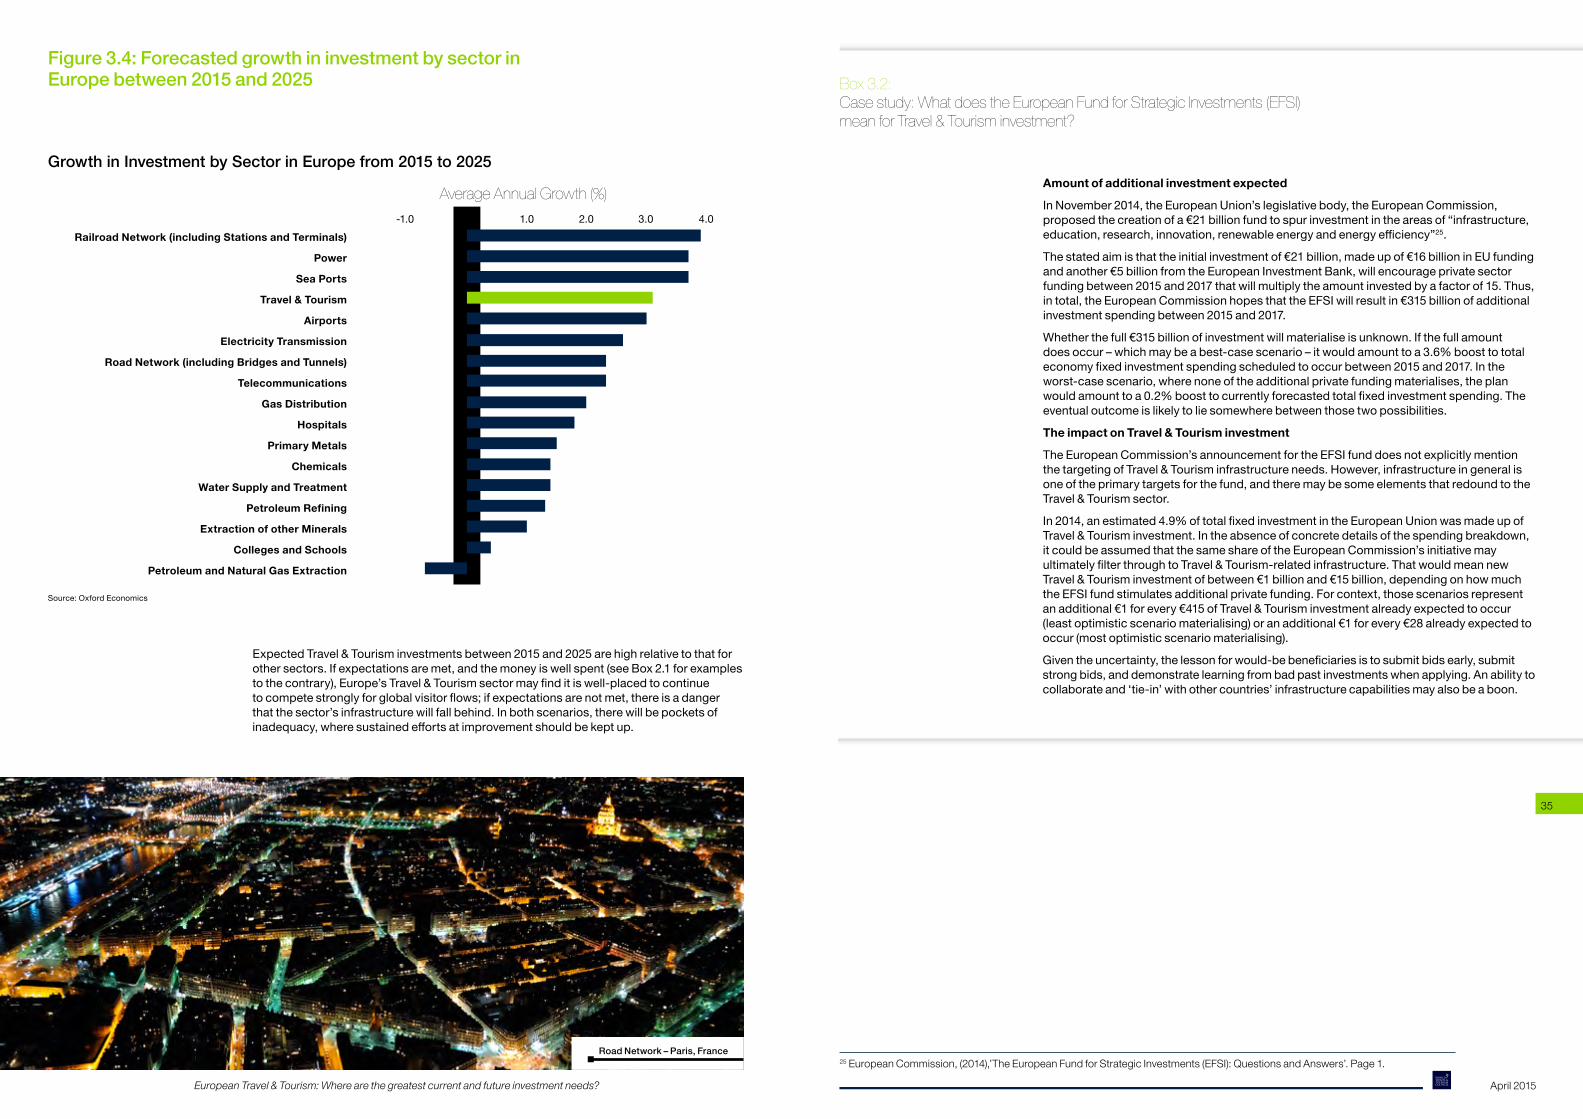
How will investment in the Travel & Tourism sector compare to investment in other sectors between2015and2025?OxfordEconomicshaspreviouslyconducteddetailedresearchforPricewaterhouseCoopersoninfrastructureinvestmentbysectoracrossmorethan40countriesworldwidewhichcanshedlightonhowTravel&Tourisminvestmentislikelytofarerelativetoothersectorsbetween2015and2025.Figure3.4belowshowstheexpectedaverageannualgrowthbetween2014and2025ofinvestmentin16sectorsacross13European countries24aswellasfortheaverageofthe41countriesanalysedintherestofthisreport for Travel & Tourism.
Amongthecountriesanalysed,investmentinrailroadnetworksisexpectedtogrowthefastest,atanaverageannualrateof3.9%.Thatisfollowedbyinvestmentinpowergenerationandseaports,eachforecasttogrowat3.7%peryear.Meanwhile,investmentspendingtargetedattheTravel&Tourismsectorinparticular(althoughthisisnotperfectlymutuallyexclusiveofotherinvestmentcategoriespresentedinthechart)isforecasttogrowby3.1%peryear,fasterthaninvestmentinelectricitytransmission(2.6%)andtelecommunications(2.3%).
24 Europe in the context of non Travel & Tourism sectoral analysis is comprised of the Czech Republic, France, Germany, Hungary, Italy, Netherlands, Poland, Romania, Russia, Spain, Sweden, Ukraine and the United Kingdom; for Travel & Tourism, the figures for Europe represent all 41 countries analysed in the main report.
AcrossEuropeandintwoofthethreemajorregionsanalysedinthisreport,theTravel&Tourism sector has historically made investments relative to its direct GDP contribution that areverysimilartotheinvestmentratefortheeconomyoverall(Table3.2).Between2000and2013,Travel&Tourisminvestmentsamountedto24%ofthesector’scontributiontoEuropeanGDP;atthesametime,investmentinthewholeeconomyamountedto24%oftotalGDP.Similarly,inEasternEurope(30%)andWesternandNorthernEurope(23%),theTravel&Tourisminvestmentrateswereclosetoinvestmentrateseconomy-wide(29%and24%,respectively).SouthernEurope,however,hadhigherTravel&Tourisminvestmentrates,at33%comparedtoeconomy-wideinvestmentratesof26%.
Travel & Tourism
Whole Economy
Construction
Electricity, Gas and Utilities
Information and Communication
Land Transport
Manufacturing
Mining and Quarrying
Transportation and Storage
Accommodation and Food Service Activities
Wholesale and Retail Trade
Air Transport
Information and Communication
Telecommunications
Professional,ScientificandTechnicalActivities
Education
24%
24%
10%
30%
24%
11%
23%
26%
30%
9%
5%
18%
22%
24%
16%
13%
23%
24%
6%
26%
25%
11%
24%
27%
26%
8%
4%
20%
24%
29%
21%
14%
30%
29%
13%
32%
40%
10%
34%
39%
42%
17%
16%
86%
32%
28%
19%
16%
33%
26%
24%
26%
29%
11%
16%
19%
44%
8%
1%
4%
25%
4%
3%
14%
Source:Eurostat
Sector Europe Eastern Europe
Southern Europe
Western & Northern Europe
Austria
Czech Republic
Denmark
Estonia
France
Germany
Greece
Hungary
Italy
Luxembourg
Malta
Netherlands
Norway
Slovakia
Slovenia
Spain
100%
100%
100%
100%
100%
100%
100%
100%
100%
100%
100%
100%
100%
100%
100%
100%
5%
4%
5%
6%
5%
4%
13%
4%
4%
6%
11%
3%
4%
3%
6%
6%
2%
3%
2%
4%
2%
1%
2%
2%
3%
2%
3%
2%
3%
2%
3%
10%
16%
23%
14%
12%
13%
19%
6%
23%
18%
7%
16%
10%
6%
26%
21%
9%
3%
5%
3%
9%
3%
2%
2%
4%
5%
3%
0%
2%
2%
9%
5%
4%
9%
10%
10%
10%
4%
6%
12%
9%
7%
9%
5%
6%
6%
8%
10%
7%
2%
1%
1%
1%
1%
1%
2%
1%
2%
1%
4%
1%
0%
1%
2%
2%
4%
5%
6%
4%
5%
4%
4%
6%
4%
8%
5%
4%
3%
6%
4%
4%
0%
1%
2%
1%
0%
0%
0%
0%
1%
0%
0%
2%
24%
1%
1%
0%
Country Whole Economy
Travel & Tourism
Manufac-turing
Transpor-tation and Storage
Information and Com-munication
Construc-tion
Electricity, Gas and Utilities
Accom-modation and Food Services
Mining and quarrying
Source:Eurostat
European Travel & Tourism: Where are the greatest current and future investment needs? April 2015
34 35
Figure 3.4: Forecasted growth in investment by sector in Europe between 2015 and 2025
ExpectedTravel&Tourisminvestmentsbetween2015and2025arehighrelativetothatforothersectors.Ifexpectationsaremet,andthemoneyiswellspent(seeBox2.1forexamplestothecontrary),Europe’sTravel&Tourismsectormayfinditiswell-placedtocontinuetocompetestronglyforglobalvisitorflows;ifexpectationsarenotmet,thereisadangerthatthesector’sinfrastructurewillfallbehind.Inbothscenarios,therewillbepocketsofinadequacy,wheresustainedeffortsatimprovementshouldbekeptup.
Box 3.2: Case study: What does the European Fund for Strategic Investments (EFSI) mean for Travel & Tourism investment?
Amount of additional investment expected
InNovember2014,theEuropeanUnion’slegislativebody,theEuropeanCommission,proposedthecreationofa€21billionfundtospurinvestmentintheareasof“infrastructure,education,research,innovation,renewableenergyandenergyefficiency”25.
Thestatedaimisthattheinitialinvestmentof€21billion,madeupof€16billioninEUfundingandanother€5billionfromtheEuropeanInvestmentBank,willencourageprivatesectorfundingbetween2015and2017thatwillmultiplytheamountinvestedbyafactorof15.Thus,intotal,theEuropeanCommissionhopesthattheEFSIwillresultin€315billionofadditionalinvestmentspendingbetween2015and2017.
Whetherthefull€315billionofinvestmentwillmaterialiseisunknown.Ifthefullamountdoesoccur–whichmaybeabest-casescenario–itwouldamounttoa3.6%boosttototaleconomyfixedinvestmentspendingscheduledtooccurbetween2015and2017.Intheworst-casescenario,wherenoneoftheadditionalprivatefundingmaterialises,theplanwouldamounttoa0.2%boosttocurrentlyforecastedtotalfixedinvestmentspending.Theeventual outcome is likely to lie somewhere between those two possibilities.
The impact on Travel & Tourism investment
TheEuropeanCommission’sannouncementfortheEFSIfunddoesnotexplicitlymentionthetargetingofTravel&Tourisminfrastructureneeds.However,infrastructureingeneralisoneoftheprimarytargetsforthefund,andtheremaybesomeelementsthatredoundtotheTravel & Tourism sector.
In2014,anestimated4.9%oftotalfixedinvestmentintheEuropeanUnionwasmadeupofTravel&Tourisminvestment.Intheabsenceofconcretedetailsofthespendingbreakdown,it could be assumed that the same share of the European Commission’s initiative may ultimatelyfilterthroughtoTravel&Tourism-relatedinfrastructure.ThatwouldmeannewTravel&Tourisminvestmentofbetween€1billionand€15billion,dependingonhowmuchtheEFSIfundstimulatesadditionalprivatefunding.Forcontext,thosescenariosrepresentanadditional€1forevery€415ofTravel&Tourisminvestmentalreadyexpectedtooccur(leastoptimisticscenariomaterialising)oranadditional€1forevery€28alreadyexpectedtooccur(mostoptimisticscenariomaterialising).
Giventheuncertainty,thelessonforwould-bebeneficiariesistosubmitbidsearly,submitstrongbids,anddemonstratelearningfrombadpastinvestmentswhenapplying.Anabilitytocollaborate and ‘tie-in’ with other countries’ infrastructure capabilities may also be a boon.
25 European Commission, (2014),’The European Fund for Strategic Investments (EFSI): Questions and Answers’. Page 1.
Railroad Network (including Stations and Terminals)
Power
Sea Ports
Travel & Tourism
Airports
Electricity Transmission
Road Network (including Bridges and Tunnels)
Telecommunications
Gas Distribution
Hospitals
Primary Metals
Chemicals
Water Supply and Treatment
PetroleumRefining
Extraction of other Minerals
Colleges and Schools
Petroleum and Natural Gas Extraction
-1.0 0.0 1.0 2.0 3.0 4.0
Average Annual Growth (%)
Source:OxfordEconomics
Growth in Investment by Sector in Europe from 2015 to 2025
Road Network – Paris, France
European Travel & Tourism: Where are the greatest current and future investment needs? April 2015
36 37
Putting Travel & Tourism investment on European governments’ agendas
The European Travel & Tourism sector is forecast to grow in importance over the next decade, according to the WTTC’s latest annual economic impact research
In2014,theTravel&Tourismsectorsupported33.5milliondirect,indirect,andinducedjobs(9.3%oftheEuropeantotal)andnearly€1.6trillioninGDP(9.3%ofEuropeanGDP).TheTravel&Tourismsector’stotaleconomiccontributionisexpectedtogrowto38millionjobs(10.4%ofEuropeanemployment)and€2.1trillioninGDPby2025(9.9%ofEuropeanGDP).Thisassumesthatsupply-sidecapacity,inareaslikeinfrastructureandtalent,doesnotactasaconstrainttotthesector’sgrowth.
Both industry and governments should therefore place Travel & Tourism investment high on their agendas, or risk failing to achieve the baseline forecast andresultingeconomicbenefits
ThestrongstatisticalrelationshipbetweenTravel&Tourisminfrastructurecapabilitiesand the sector’s economic impact means the issue warrants attention from both private andpublicinvestorsandpolicy-makers.Italsohighlightstheneedforbusiness-friendlypoliciesandlegislationintheTravel&Tourismsectortosupportandencourageinfrastructuredevelopment.Butanynewinfrastructuremustrepresenttherightsortofinvestmenttomeetspecificdemandrequirementsandaddressgaps,andnotbeinvestmentforthesakeofinvestment,giventhemoreconstrainedfinancialenvironmentand lessons from past ‘bad’ investments.
Travel & Tourism investment strategies must be evidence-based
ThisreportprovidesforecastsforTravel&Tourisminvestmentanddemandgrowth,providinganevidence-baseforindustryandgovernmentinvestmentstrategy,aswellasnational-leveltourismdevelopmentplansandoveralltourismstrategy.
This report highlights unique opportunities and challenges for three country typologies
• Well-placed:Austria,GermanyandtheUnitedKingdomshouldfocusonmaintainingandimprovingtheirexisting,high-qualityinfrastructure.AkeystrengthisthatTravel&TourisminvestmentgrowthisforecasttooutpaceTravel&Tourismdemandgrowthoverthenextdecade.
• Well-placed but with key risks:Denmark,Finland,France,Greece,Ireland,Italy,Latvia,Slovenia,andSwitzerlandshouldbewaryofcomplacencyandrelyingonexistinginfrastructurecapabilities.SeveralofthesecountriesriskTravel&TourisminvestmentgrowthinthenextdecadebeingoverwhelmedbygrowthinTravel&Tourismdemand.Othershavearecenthistory(inthedecadefrom1998to2008)ofdeclininginvestmentgrowth,presentingariskofreturningtopre-recessioninvestmentpatternsratherthanmeetingbaselineforecastsofinvestmentto2025.
• At medium or high risk:Albania,BosniaandHerzegovina,andMoldovaneedtoaddressurgentexistinginfrastructurequalityandcapacityissues.Croatia,Portugal,Serbia,andSlovakiaarelikelytoseeTravel&Tourismdemandgrowththatsignificantlyoutpaces investment in the sector over the next decade. Each of these countries is at riskoffailingtofullybenefitfromforecasteddemand.
conclusion
A focus on targeted, smart-investment will be critical to success
A recent report by the European Court of Auditors shows that additional capacity is not alwaysbebeneficial.Toavoidoverbuildingandensurehighreturnsandvalue-for-moneyinvestment,investmentstrategiesmustrealisticallyplantoincreasetherelevantuserbaseaftercompletionandthenachievefinancialsustainability.Well-targetedinvestmentsmayinvolveadditionalcapacity,buttheycanalsomaintainandexpandexistingcapacity,andencourageimprovementsinquality,competitiveness,productivityandsustainability.
Travel&Tourisminvestmentshouldbeongoingratherthanone-off
Travel&Tourismmarketsaredynamic,andtastesevolveovertimealongwithindividualdefinitionsofhomeversusluxurycomforts.ThiscallsforaconsistentandsustainedfocusonTravel&Tourisminvestmentacrosstimeinordertokeepupwithchangingmarketdemand characteristics.
Inperiodsofgovernmentandfinancialsectorfundingconstraints,investorsinthe Travel & Tourism sector should seek cross-border collaboration and creative funding options
Cross-borderTravel&TourisminfrastructurecollaborationcanbeuniquelyeffectiveonthecontinentbecauseofEurope’srelativelysmallgeographicsizeandexistingintegration.And,particularlyinperiodsoffiscalausterity,thoseengagedinTravel&Tourisminvestmentmaywishtoconsidercreativefundingoptionslikepublicprivatepartnershipsorcrowdfunding.
Cruise Ships in the Aegean Sea – Santorini, Greece
European Travel & Tourism: Where are the greatest current and future investment needs?
38
Sewage Treatment Plant – Wroclaw, Poland
European Travel & Tourism: Where are the greatest current and future investment needs?
40
The Harlequin Building65SouthwarkStreet
London,SE10HRUnitedKingdom
T.+44(0)2074818007F.+44(0)[email protected]
www.wttc.org