eurozone - area sistemi informativi - servizio di...
TRANSCRIPT

Eurozone: double crisis,
policy mistakes
and perspectives
Prof. Marcello Signorelli
(Università di Perugia, Dipartimento di Economia)
Università Roma Tre Roma, 20 aprile 2017

2

3

4
Preliminary discussion
Empirical evidence about Europe
in the global context
5
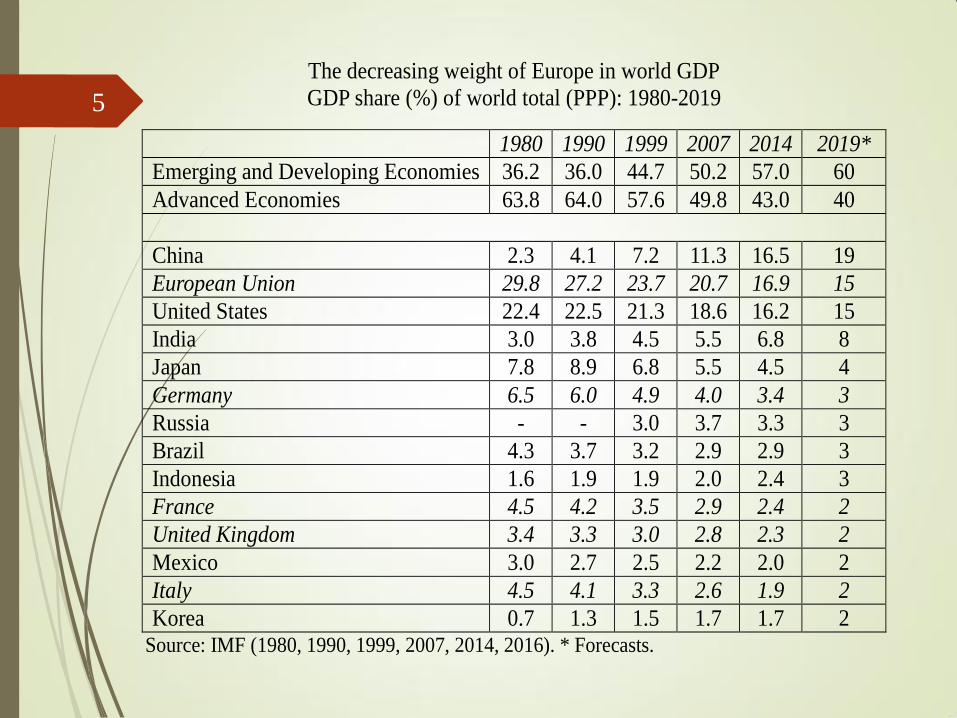
The decreasing weight of Europe in world GDP
GDP share (%) of world total (PPP): 1980-2019
1980 1990 1999 2007 2014 2019*
Emerging and Developing Economies 36.2 36.0 44.7 50.2 57.0 60
Advanced Economies 63.8 64.0 57.6 49.8 43.0 40
China 2.3 4.1 7.2 11.3 16.5 19
European Union 29.8 27.2 23.7 20.7 16.9 15
United States 22.4 22.5 21.3 18.6 16.2 15
India 3.0 3.8 4.5 5.5 6.8 8
Japan 7.8 8.9 6.8 5.5 4.5 4
Germany 6.5 6.0 4.9 4.0 3.4 3
Russia - - 3.0 3.7 3.3 3
Brazil 4.3 3.7 3.2 2.9 2.9 3
Indonesia 1.6 1.9 1.9 2.0 2.4 3
France 4.5 4.2 3.5 2.9 2.4 2
United Kingdom 3.4 3.3 3.0 2.8 2.3 2
Mexico 3.0 2.7 2.5 2.2 2.0 2
Italy 4.5 4.1 3.3 2.6 1.9 2
Korea 0.7 1.3 1.5 1.7 1.7 2 Source: IMF (1980, 1990, 1999, 2007, 2014, 2016). * Forecasts.

6
The long-run relative decline of European countries
GDP in PPP (US=100)
Countries
1870
GGDC
GK
1913
GGDC
GK
1950
GGDC
GK
1950
GGDC
EKS
1973
GGDC
EKS
2015
GGDC
EKS (p)
2015
Ranking
China 192.9 46.6 13.0 9.5 11.8 105.4 1
United States 100.0 100.0 100.0 100.0 100.0 100.0 2
India 137.1 39.0 15.3 10.3 9.0 34.9 3
Japan 25.8 13.8 11.1 11.3 36.0 26.8 4
Germany 73.3 45.9 17.4 18.6 29.1 21.2 5
USSR- Russia 85.0 44.9 35.0 35.0 42.8 19.2 6
Brazil 7.1 3.7 6.1 5.5 10.2 17.0 7
Indonesia 19.2 8.7 4.6 5.1 6.0 15.8 8
United Kingdom 101.8 43.4 23.9 24.0 19.3 14.7 9
France 73.3 27.9 15.1 15.3 19.6 14.6 10
Italy 42.5 18.5 11.3 12.2 17.8 12.0 11 Source: Maddison and Conference Board (2016).
Note: (p) = preliminary estimations. GK = The GDP_GK series is expressed in 1990 U.S. dollars and it is
converted at “Geary-Khamis” purchasing power parities (PPPs); EKS = the GDP_EKS series is expressed in
2014 US dollars and it is presented in 2014 PPPs, which are based on the World Bank/ICP 2011-round,
updated using the change in national GDP deflators relative to the United States.

7
The relative development levels: still a huge margin for convergence
per-capita GDP in PPP (US=100)
Country 1870
GK
1913
GK
1950
GK
1950
EKS
1973
EKS
1990
EKS
2015
EKS (p)
Ranking
2015
United States 100.0 100.0 100.0 100.0 100.0 100.0 100.0 1
Germany 75.2 68.8 40.6 41.4 78.2 79.1 84.6 2
United Kingdom 130.5 92.8 72.6 73.0 72.4 71.2 73.7 3
France 76.7 65.7 55.1 54.9 81.0 77.0 70.8 4
Japan 30.1 26.2 20.1 20.6 70.1 82.9 68.1 5
Italy 61.3 48.4 36.6 39.5 68.7 75.8 62.6 6
Russia- USSR 38.6 46.8 29.7 36.3 29.7 43.5 7
Brazil 29.2 33.2 17.5 20.8 20.9 19.1 26.5 8
China 21.7 10.4 4.7 2.6 2.8 4.6 24.8 9
India 21.8 12.7 6.5 4.4 3.5 3.8 9.9 10 Source: Maddison and Conference Board (2016).
Note: (p) = preliminary estimations. GK = The GDP_GK series is expressed in 1990 U.S. dollars and it is
converted at “Geary-Khamis” purchasing power parities (PPPs); EKS = the GDP_EKS series is expressed in
2014 US dollars and it is presented in 2014 PPPs, which are based on the World Bank/ICP 2011-round,
updated using the change in national GDP deflators relative to the United States.

8
Leading merchandise exporters and importers (2014)
in billion US$ and per cent share
(in parentheses, shares excluding intra-EU-28 trade)
Exporters Importers
China 2,342 12.4 (15.6) US 2,413 12.7 (16.0)
[Extra EU-28 exports] [2,262] (15.1) [Extra Eu-28 imports] [2,232] (14.8)
US 1,621 8.6 (10.8) China 1,959 10.3 (13.0)
Germany 1,508 8.0 Germany 1,216 6.4
Japan 684 3.6 (4.5) Japan 822 4.3 (5.4)
Netherlands 672 3.6 UK 684 3.6
France 583 3.1 France 678 3.6
Korea (South) 573 3.0 (3.8) Hong Kong 601 3.2 (4.0)
Italy 529 2.8 Netherlands 588 3.1
Hong Kong 524 2.8 (3.5) Korea (South) 526 2.8 (3.5)
UK 506 2.7 Canada
475 2.5 (3.1)
Russia 498 2.6 (3.3) Italy 472 2.5
Canada 475 2.5 (3.2) India 463 2.4 (3.1)
Belgium 471 2.5 Belgium 452 2.4
Singapore 410 2.2 (2.7) Mexico 412 2.2 (2.7)
Mexico 398 2.1 (2.6) Singapore 366 1.9 (2.4)
United Arab Emirates 360 1.9 (2.4) Spain 358 1.9
Saudi Arabia 354 1.9 (2.4) Russia
308 1.6 (2.0)
Spain 325 1.7 Chinese Taipei 274 1.4 (1.8)
India 322 1.7 (2.1) United Arab Emirates 262 1.4 (1.7)
Chinese Taipei 314 1.7 (2.1) Turkey 242 1.3 (1.6)
Australia 241 1.3 (1.6) Brazil 239 1.3 (1.6)
Switzerland 239 1.3 (1.6) Australia 237 1.2 (1.6)
Source: WTO Secretariat.

9
European integration
Widening process:
From 6 countries (1957) to 28 countries (2016); 27, after Brexit
Deepening process:
Customs Union, Competition policy, Common Agricultural Policy, Structural Funds, Single Market (1993: goods, services, capitals, people).
Maastricht Treaty (1992), leading to the European «Economic and Monetary Union» (EMU) in 1999 and the adoption of the euro in 2002.
o From 11 countries (1999) to 19 countries (2015).
o There has been a monetary union, but not really an economic union the original flaw of the
euro!

10
Was it worth to adopt the euro?
According to OCA theories, a monetary union is
convenient if the benefits are greater than the costs.
Microeconomic benefits:
Reduction of transaction costs and elimination of the exchange-rate risk (that causes uncertainty)
The benefits are relevant for highly integrated economies (high share of intra-EU trade)
o There might be macroeconomic benefits (non-OCA): interest rates (also on public debt), inflation, public deficit, public debt
Macroeconomic costs:
Loss of exchange-rate instrument and independent monetary policy.
They might be large if asymmetric shocks occur.

11
Thus we should consider two elements (see De Grauwe):
1) The probability of asymmetric shocks depends on the degree of symmetry (in productive structures, fiscal and institutional systems, etc.)
2) If they do occur, they could be compensated by the flexibility of markets (prices, wages, labor mobility)
Also a flexible public budget, better if centralized, could help in the adjustment (but the EU budget is just 1% of GDP).

12
The current Eurozone (19 countries) is hardly an OCA; probably also the original euro area (11 countries) was not an OCA.
The decision to start EMU was probably political.
Endogeneity of OCA’s criteria proposition:
The optimality of the currency union will be created over time, thanks to the adoption of the common currency, the increase in the intra-area trade, etc.
Moreover, the productive structures will probably become more similar (intra-industry trade)
o On the contrary, Krugman (1992) emphasizes concentration of production, increasing specialization, inter-industry trade, etc.
Remark: there is path-dependence also in this case; now the disintegration of the euro area will bear be too high costs
Even greater are the costs for euro-exit of individual countries: capitals’ flight, default risk, banks’ insolvency; and the gains from devaluations are limited to a short period (then a “vicious circle” between devaluations and inflation will materialize).

13
According to Optimum Currency Area (OCA) theories, real convergence (i.e. similarity in economic structures and development) is a pre-requisite to accomplish an effective monetary union.
On the contrary, in the Maastricht Treaty, EMU was viewed as an instrument to achieve “real” convergence (that would follow)
o i.e. “economic and social progress, a high level of employment, balanced and sustainable development” (Art. 2 of the Treaty).
Hence, the prerequisites concerned nominal convergence criteria: inflation rate, interest rate, exchange-rate, deficit/GDP ratio, debt/GDP ratio.
Without prior convergence, cross-country differences were (and are) present in the Eurozone. In particular, we can detect differences in:
business cycles (as shown by the output correlations)
economic growth (see sigma and beta convergence). o Some real convergence insured by the catching-up of the NMS of
Central and Eastern Europe; and also by the “doped” growth in Ireland and Spain (before the crises).
o Failure of Lisbon Agenda (2000) and the more recent “Europe 2020” plan (2010), because of limited funds.
There are also some macroeconomic imbalances (competitiveness, trade and BP).
14
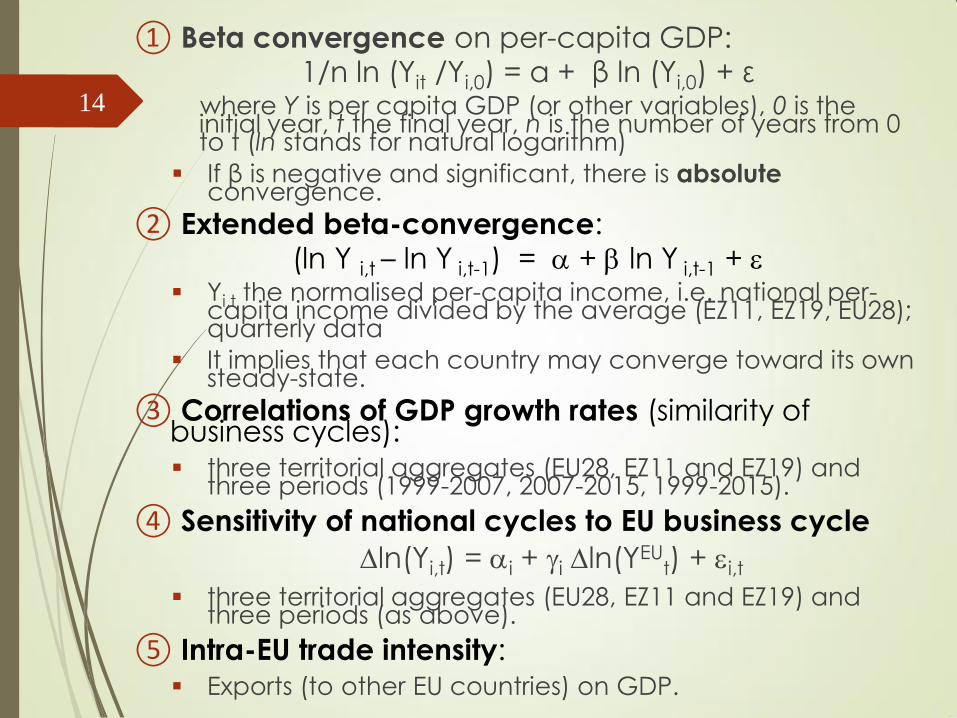
① Beta convergence on per-capita GDP: 1/n ln (Yit /Yi,0) = α + β ln (Yi,0) + ε
where Y is per capita GDP (or other variables), 0 is the initial year, t the final year, n is the number of years from 0 to t (ln stands for natural logarithm)
If β is negative and significant, there is absolute convergence.
② Extended beta-convergence: (ln Y i,t – ln Y i,t-1) = + ln Y i,t-1 +
Yi,t the normalised per-capita income, i.e. national per-capita income divided by the average (EZ11, EZ19, EU28); quarterly data
It implies that each country may converge toward its own steady-state.
③ Correlations of GDP growth rates (similarity of business cycles): three territorial aggregates (EU28, EZ11 and EZ19) and
three periods (1999-2007, 2007-2015, 1999-2015).
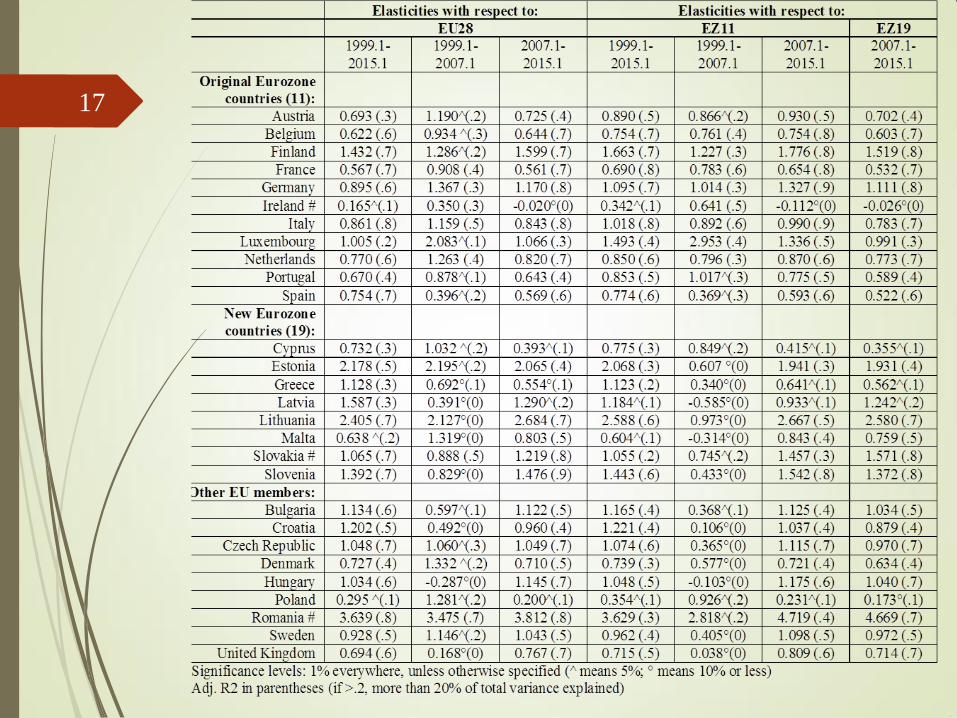
④ Sensitivity of national cycles to EU business cycle
ln(Yi,t) = i + i ln(YEUt) + i,t
three territorial aggregates (EU28, EZ11 and EZ19) and three periods (as above).
⑤ Intra-EU trade intensity: Exports (to other EU countries) on GDP.

15

16
17

18
Eurozone dual crisis
GDP and employment impacts
of the dual crisis and the wrong
policies
The perspectives of the
Eurozone

19
Real GDP growth in the Eurozone compared to the United States
five-years averages (1993-2007) and annual data (2008-2016)
-5
-4
-3
-2
-1
0
1
2
3
4
5Eurozone
United States
Source: our elaborations on Eurostat data
Note: Eurozone data include 17 countries out of 19 (i.e., Latvia and Lithuania are excluded)

20
The crises and the inadequate
policy response (1)
The dual crisis:
Global financial crisis Great Recession
policy response
The sovereign debt crisis.
Depth of the crisis in the Eurozone, especially in
Italy
Among 12 advanced economies that in 2008 began a systemic crisis,
only two (US and Germany) in 2013 recovered the pre-crisis levels.
Out of 100 crisis episodes in 150 years, the Italian crisis less severe only of
the Greek one (severity = depth + number of years to return to pre-crisis
levels)
See Reinhart and Rogoff, “Recovery from Financial Crises: Evidence from 100 Episodes”, American Economic Review, Papers and Proceedings, 2014.

21
The crises and the inadequate policy response (2)
Policy response: too little too late
Uncertain, delayed and inadequate
Lack of crisis-management instruments (hesitant introduction of “save-States” funds: EFSF, ESM, etc.)
Fiscal policy:
Fiscal consolidation for assisted countries (inspected by the Troika) and in general (new Stability Pact, Fiscal Compact, etc.). “self-defeating” austerity: Y Debt/GDP (or not decreasing).
22
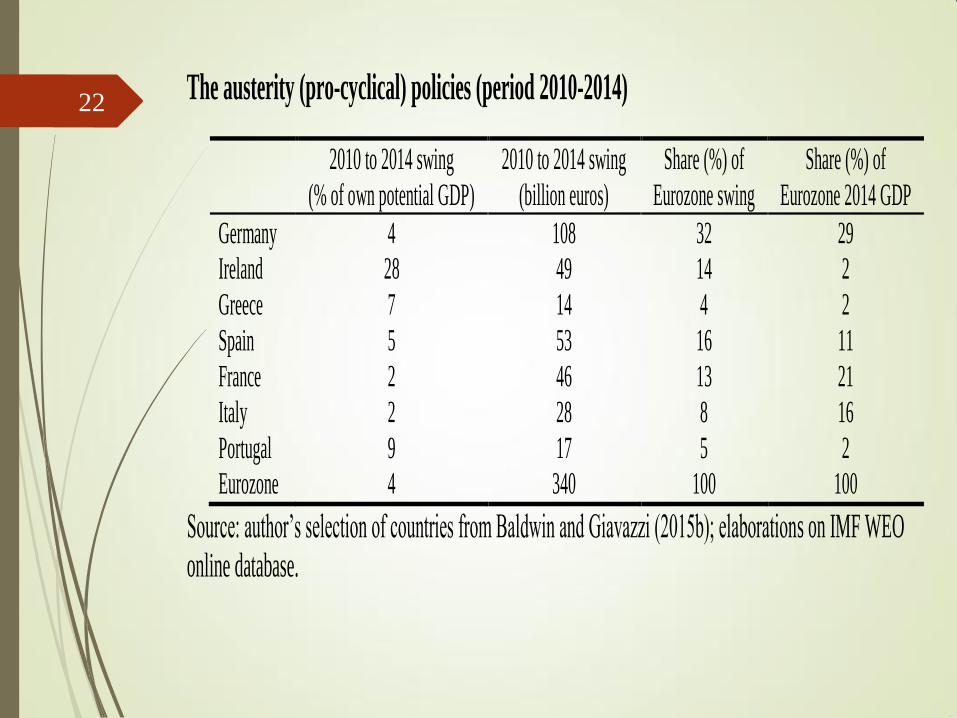
The austerity (pro-cyclical) policies (period 2010-2014)
2010 to 2014 swing
(% of own potential GDP)
2010 to 2014 swing
(billion euros)
Share (%) of
Eurozone swing
Share (%) of
Eurozone 2014 GDP
Germany 4 108 32 29
Ireland 28 49 14 2
Greece 7 14 4 2
Spain 5 53 16 11
France 2 46 13 21
Italy 2 28 8 16
Portugal 9 17 5 2
Eurozone 4 340 100 100
Source: author’s selection of countries from Baldwin and Giavazzi (2015b); elaborations on IMF WEO
online database.

23
Monetary policy and role of
aggregate demand (1)
Stagnation and its causes:
Wrong view about growth factors:
structural reforms are important only in
the long run. There is a problem of
aggregate demand.
Situation even more worrying in 2014-
2016 because of deflation.

24
Monetary policy and role of
aggregate demand (2)
Monetary policy (ECB, differently from FED):
Progressively accommodative, but 6 years to reach zero-rates (0,05% in November 2014, zero now).
Unconventional operations: SMP, LTRO, TLTRO, OMT, QE.
Monetary policy has been adequate to save the euro (OMT plan after 2012 Draghi’s statement: we shall save
euro whatever it takes) but not to support economic
growth.
More liquidity created by the ECB (also through the QE) does not necessarily mean more credit to the real
economy.
Now President Draghi is adopting assorted instruments
(zero rate on MROs; negative rate on overnight deposits;
QE extended in time and typology of bonds; TLTRO-2
with negative rates). But monetary policy is not enough.
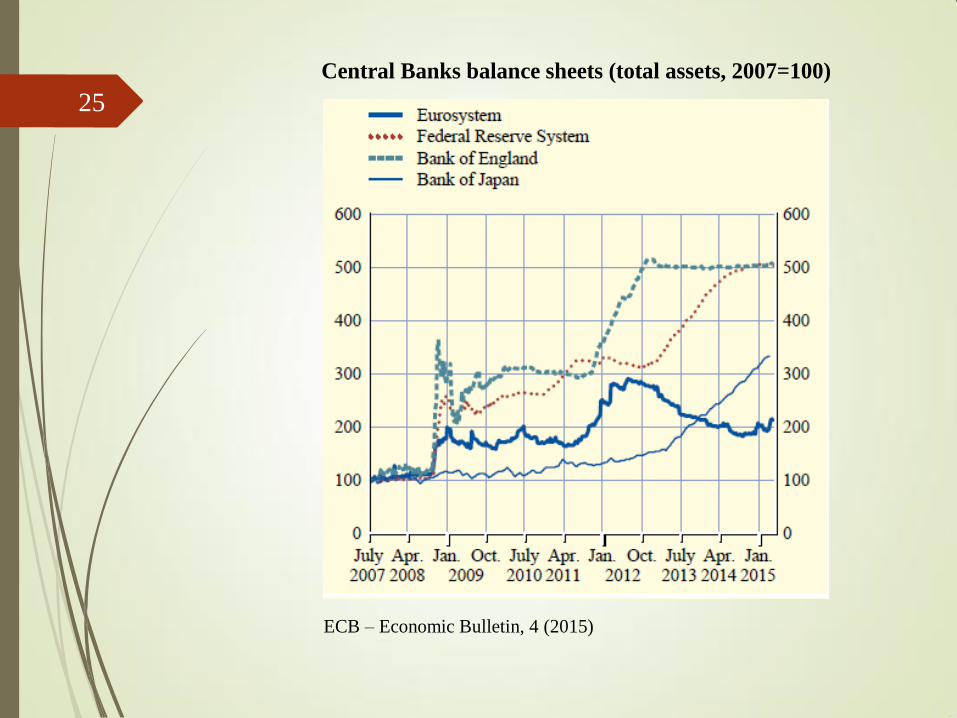
25
Central Banks balance sheets (total assets, 2007=100)
ECB – Economic Bulletin, 4 (2015)

26
Inflation rates (HICP)
2007 2008 2009 2010 2011 2012 2013 2014 2015
Germany 2.3 2.8 0.2 1.1 2.5 2.1 1.6 0.8 0.1
Ireland 2.9 3.1 -1.7 -1.6 1.2 1.9 0.5 0.3 0.0
Greece 3.0 4.2 1.3 4.7 3.1 1.0 -0.9 -1.4 -1.1
Spain 2.8 4.1 -0.2 2.0 3.0 2.4 1.5 -0.2 -0.6
France 1.6 3.2 0.1 1.7 2.3 2.2 1.0 0.6 0.1
Italy 2.0 3.5 0.8 1.6 2.9 3.3 1.2 0.2 0.1
Portugal 2.4 2.7 -0.9 1.4 3.6 2.8 0.4 -0.2 0.5
Eurozone 2.1 3.3 0.3 1.6 2.7 2.5 1.4 0.4 0.0
U.K. 2.3 3.6 2.2 3.3 4.5 2.8 2.6 1.5 0.0
EU 2.3 3.7 1.0 2.1 3.1 2.6 1.5 0.5 0.0
Source: Eurostat database

27
Inflation in the Eurozone compared to the United States
Source: our elaborations on Eurostat data (Harmonised Indices of Consumer Prices, HICP, all items)
Note: % annual rate of change calculated on monthly data (from January 1999 to February 2016)
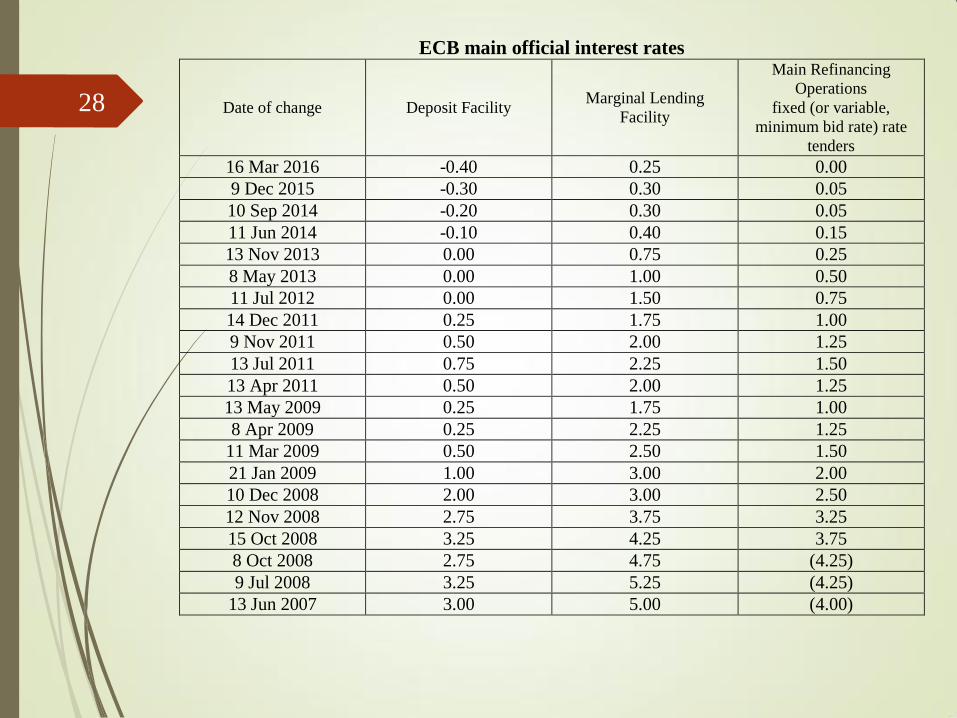
28
ECB main official interest rates
Date of change Deposit Facility Marginal Lending
Facility
Main Refinancing
Operations
fixed (or variable,
minimum bid rate) rate
tenders
16 Mar 2016 -0.40 0.25 0.00
9 Dec 2015 -0.30 0.30 0.05
10 Sep 2014 -0.20 0.30 0.05
11 Jun 2014 -0.10 0.40 0.15
13 Nov 2013 0.00 0.75 0.25
8 May 2013 0.00 1.00 0.50
11 Jul 2012 0.00 1.50 0.75
14 Dec 2011 0.25 1.75 1.00
9 Nov 2011 0.50 2.00 1.25
13 Jul 2011 0.75 2.25 1.50
13 Apr 2011 0.50 2.00 1.25
13 May 2009 0.25 1.75 1.00
8 Apr 2009 0.25 2.25 1.25
11 Mar 2009 0.50 2.50 1.50
21 Jan 2009 1.00 3.00 2.00
10 Dec 2008 2.00 3.00 2.50
12 Nov 2008 2.75 3.75 3.25
15 Oct 2008 3.25 4.25 3.75
8 Oct 2008 2.75 4.75 (4.25)
9 Jul 2008 3.25 5.25 (4.25)
13 Jun 2007 3.00 5.00 (4.00)

29
Key interest rate of ECB and FED (from January 1999 to April 2016)
Source: our elaborations on ECB and FED data.

30
Harmonised long-term interest rate for convergence assessment purposes (1993-2016)
0
2.5
5
7.5
10
12.5
15 Greece
Portugal
Spain
Ireland
Italy
France
Germany
Source: ECB, Monthly database, April, 2006.
Note: monthly data (period averages); percentages per annum; secondary market yields of
government bonds with maturities of close to ten years.
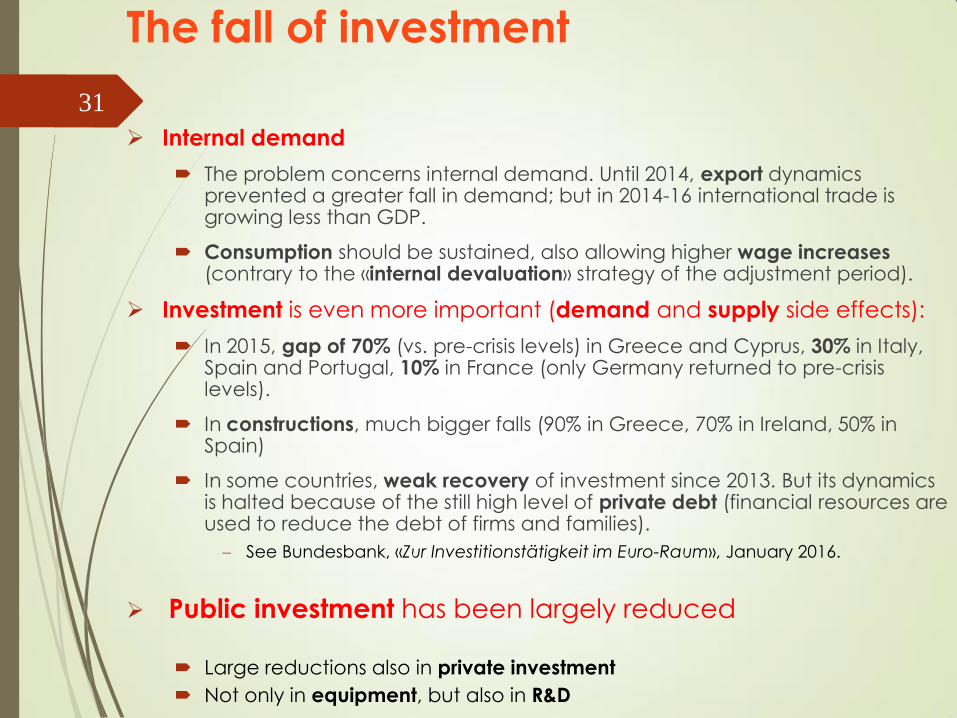
31
The fall of investment
Internal demand
The problem concerns internal demand. Until 2014, export dynamics prevented a greater fall in demand; but in 2014-16 international trade is growing less than GDP.
Consumption should be sustained, also allowing higher wage increases (contrary to the «internal devaluation» strategy of the adjustment period).
Investment is even more important (demand and supply side effects):
In 2015, gap of 70% (vs. pre-crisis levels) in Greece and Cyprus, 30% in Italy, Spain and Portugal, 10% in France (only Germany returned to pre-crisis levels).
In constructions, much bigger falls (90% in Greece, 70% in Ireland, 50% in Spain)
In some countries, weak recovery of investment since 2013. But its dynamics is halted because of the still high level of private debt (financial resources are used to reduce the debt of firms and families).
See Bundesbank, «Zur Investitionstätigkeit im Euro-Raum», January 2016.
Public investment has been largely reduced
Large reductions also in private investment
Not only in equipment, but also in R&D

32
Public Investment: percentage change on previous year (as percent of GDP in parenthesis)
2007 2008 2009 2010 2011 2012 2013 2014 2015
Germany 1.8
(1.9)
8.5
(2.1)
9.8
(2.4)
2.6
(2.3)
3.4
(2.3)
0.9
(2.3)
2.2
(2.2)
-0.1
(2.2)
3.6
(2.2)
Ireland 31.3
(4.6)
6.8
(5.2)
-35.8
(3.7)
-10.8
(3.3)
-25.6
(2.4)
-13.8
(2.0)
-7.4
(1.8)
21.2
(2.1)
-2.5
(1.8)
Greece -9.6
(4.9)
19.7
(5.6)
0.4
(5.7)
-38.6
(3.7)
-39.2
(2.4)
-5.5
(2.5)
29.2
(3.4)
5.5
(3.7)
3.4
(3.8)
Spain 13.5
(4.6)
4.1
(4.6)
7.1
(5.1)
-8.1
(4.7)
-21.8
(3.7)
-34.7
(2.5)
-12.1
(2.2)
-3.8
(2.1)
21.3
(2.5)
France 5.5
(3.9)
2.6
(3.9)
4.8
(4.3)
0.6
(4.1)
-1.6
(4.0)
3.6
(4.1)
-0.3
(4.0)
-5.8
(3.7)
-5.1
(3.4)
Italy 2.9
(2.9)
3.9
(3.0)
11.6
(3.4)
-13.7
(2.9)
-3.2
(2.8)
-8.8
(2.6)
-6.9
(2.4)
-4.1
(2.3)
1.0
(2.3)
Portugal 1.2
(3.2)
17.8
(3.7)
8.3
(4.1)
31.5
(5.3)
-35.2
(3.5)
-32.3
(2.5)
-11.0
(2.2)
-4.7
(2.0)
9.4
(2.2)
Eurozone 6.2
(3.2)
6.1
(3.3)
5.4
(3.6)
-4.1
(3.4)
-5.9
(3.1)
-5.9
(2.9)
-1.5
(2.8)
-2.1
(2.7)
2.4
(2.7)
United Kingdom 5.2
(2.6)
4.5
(3.1)
-3.6
(3.4)
3.2
(3.2)
-5.0
(3.0)
2.4
(2.8)
-5.5
(2.6)
14.2
(2.7)
11.8
(2.7)
EU 7.3
(3.2)
6.7
(3.4)
2.2
(3.7)
-1.3
(3.5)
-4.2
(3.3)
-4.4
(3.1)
-2.3
(3.0)
1.7
(2.9)
4.8
(2.9)
United States (2.4) (2.6) (2.6) (2.5) (2.3) (3.6) (3.3) (3.2) (3.4)
Japan (3.1) (3.0) (3.4) (3.3) (3.1) (3.1) (3.5) (3.5) (3.4)
Source: Eurostat database. Note: Gross fixed capital formation; percentage change on euro values.

33
recession duration and GDP gap
Gross domestic product at market prices (2005=100)
(adj, seasonally and by working days, but Ireland)
max. min. 2015Q3 date max. date min. recession
period (terms)
E.U. 108,1 102 109,8 2008Q1 2009Q2 5
Eurozone 107,8 101,7 107,4 2008Q1 2009Q2 5
Germany 109,2 101,6 115 2008Q1 2009Q1 4
Ireland 114,6 101 125,7 2007Q4 2009Q4 8
Greece 110,1 80 80,3 2007Q2 2013Q4 26
Spain 110 99,8 104,9 2008Q2 2013Q2 20
France 106 101,8 108,5 2008Q1 2009Q1 4
Italy 104,2 94 94,9 2008Q1 2014Q4 27
Portugal 105,2 95,1 98,4 2008Q1 2012Q4 19
U.K 106,7 .100,2 113,2 2008Q1 2009Q2 5

34
Export:
short and dim reduction, then sound recovery
Exports of goods and services (2005=100)
(adj, seasonally and by working days, but Ireland)
max. min. 2015Q3 date max. date min.
E.U. 120,5 101,9 140,3 2008Q2 2009Q2
Eurozone 119,8 100,8 140,1 2008Q2 2009Q2
Germany 127,9 104,6 153,4 2008Q1 2009Q2
Ireland 119,2 113,8 172,1 2007Q2 2009Q3
Greece 126,5 93,8 105 2008Q3 2009Q4
Spain 115,8 97,7 140,3 2008Q2 2009Q1
France 112,6 96,5 127,8 2008Q1 2009Q2
Italy 116,1 88,5 117,9 2008Q1 2009Q2
Portugal 125,5 102,7 151,7 2008Q1 2009Q1
U.K 114,5 100,7 124,9 2008Q2 2009Q2

35
Public expenditure:
reduction in the recession period only in the «Piigs»
Final consumption expenditure of general government (2005=100)
(adj, seasonally and by working days, but Ireland)
2008Q1 min. or 2015Q3 date min.
2009Q2
E.U. 105,4 108,8 113,5
Eurozone 105,8 109,4 113
Germany 104,6 108,9 119,4
Ireland 112,9 99,7 105,3 2013Q1
Greece 110,3 81,9 86,2 2014Q4
Spain 115,9 115,2 119 2013Q2
France 103,8 106,7 116,6
Italy 100,2 97,2 98,1 2014Q2
Portugal 100,3 92,4 92,8 2013Q3
U.K 104,1 106,4 114,8

36
Consumption of households:
large fall and faint recovery
Final consumption expenditure of households (2005=100)
(adj, seasonally and by working days, but Ireland)
max. min. 2015Q3 date max. date min.
E.U. : :
Eurozone : :
Germany 102,9 101,8 108,9 2009Q2 2010Q1
Ireland 120,6 102,3 110,1 2007Q4 2013Q2
Greece 110,9 80,8 82,1 2008Q2 2013Q1
Spain 108,9 93,4 98,2 2008Q1 2013Q2
France 105,7 104,9 110,2 2007Q4 2008Q4
Italy 102,8 94,2 95,9 2007Q2 2013Q2
Portugal 105,7 93,5 99,6 2008Q1 2013Q1
U.K 106,8 99,9 111,1 2007Q4 2010Q1

37
Fixed investment:
collapse (almost everywhere)
and pre-crisis levels far away
Gross fixed capital formation (2005=100)
(adj, seasonally and by working days, but Ireland)
max. min. 2015Q3 date max. date min.
E.U. 113,9 94,5 101,2 2008Q1 2013Q1
Eurozone 112,6 92,2 96,5 2008Q1 2013Q1
Germany 115,8 102 119,5 2008Q1 2009Q2
Ireland 117,3 55,6 103,4 2007Q1 2010Q3
Greece 154,8 42,5 42,5 2007Q3 2015Q3
Spain 113 71 79,6 2007Q4 2013Q2
France 113 99,5 102,8 2008Q1 2009Q3
Italy 106,1 72,5 73,1 2007Q1 2014Q3
Portugal 105,3 64,2 69,1 2008Q1 2013Q1
U.K 111,8 84,6 109,9 2007Q4 2009Q2

38
Potential growth rates and output gaps 2007 2008 2009 2010 2011 2012 2013 2014 2015 2016 2017
Germany 1.3
(1.8)
1.2
(1.7)
0.7
(-4.7)
1.0
(-1.8)
0.7
(1.1)
0.8
(0.8)
1.4
(-0.3)
1.5
(-0.2)
1.7
(-0.3)
1.9
(-0.6)
1.6
(-0.6)
Ireland 3.6
(5.2)
1.6
(1.4)
0.0
(-4.3)
0.2
(-4.1)
0.7
(-2.3)
1.3
(-3.4)
1.9
(-3.9)
3.1
(-1.9)
4.0
(1.6)
4.8
(1.7)
4.8
(0.6)
Greece 1.7
(5.6)
0.5
(4.7)
-0.6
(0.9)
-1.7 (-
3.0)
-2.8 (-
9.3)
-3.5
(-12.9)
-3.4
(-12.7)
-2.9
(-9.5)
-2.1
(-7.7)
-1.9
(-6.3)
-1.4
(-2.4)
Spain 3.7
(3.0)
2.8
(1.3)
1.0
(-3.3)
1.0
(-4.2)
0.4
(-5.5)
-0.6
(-7.5)
-0.8
(-8.3)
-0.3
(-6.7)
0.0
(-3.7)
0.4
(-1.5)
0.7
(0.3)
France 1.7
(2.9)
1.5
(1.6)
0.9
(-2.3)
1.1
(-1.4)
1.1
(-0.4)
0.9
(-1.2)
0.9
(-1.4)
0.9
(-2.1)
0.8
(-1.8)
1.0
(-1.5)
1.1
(-0.9)
Italy
0.9
(2.4)
0.2
(1.1)
-0.4
(-4.1)
-0.4
(-2.1)
0.1
(-1.6)
-1.1
(-3.4)
-0.8
(-4.3)
-0.7
(-3.9)
-0.3
(-2.9)
-0.2
(-1.6)
0.1
(-0.4)
Portugal
0.9
(0.9)
0.7
(0.4)
0.0
(-2.6)
0.1
(-0.8)
-0.5
(-2.2)
-1.2
(-5.0)
-1.0
(-5.1)
-0.5
(-3.8)
-0.1
(-2.3)
0.3
(-1.1)
0.6
(0.0)
U.K.
1.9
(2.3)
1.5
(0.3)
0.8
(-4.7)
1.0
(-4.2)
1.0
(-3.2)
1.0
(-3.1)
1.1
(-2.0)
1.3
(-0.6)
1.5
(0.2)
1.6
(0.3)
1.7
(0.5)
Source: EC, Spring 2016.
Note: output gap in parentheses; potential growth as percent change on previous year; output gap calculated as percent
of potential GDP.

39
Unemployment rates
minUR
(2007 or 2008) 2015
UR %
change* UR-gap**
Germany 7.4 4.6 -37.8 -2.8
Ireland 4.7 9.4 46.9 3.0
Greece 7.8 24.9 219.2 17.1
Spain 8.2 22.1 169.5 13.9
France 7.4 10.4 40.5 3.0
Italy 6.1 11.9 95.1 5.8
Portugal 8.8 12.6 43.2 3.8
Eurozone 7.5 10.9 45.3
3.4
U.K. 5.3 5.3 0.0 0.0
E.U. 7.0 9.4 34.3 2.4
Source: European Commission (European Economic Forecast, Spring 2016). Note: UR % change*= 100 [UR2015-minUR(2007, 2008)]/ minUR(2007, 2008); UR-gap**= UR2015- minUR(2007,
2008).

40
Long-term unemployment rates (as percent of labour force)
2007 2008 2009 2010 2011 2012 2013 2014 2015 LTUR
%
change*
LTUR-
gap**
Germany 4.9 3.9 3.5 3.3 2.8 2.4 2.3 2.2 2.0 -48.7 -1.9
Ireland 1.4 1.7 3.5 6.8 8.6 9.0 7.8 6.6 5.3 278.6 3.9
Greece 4.2 3.7 3.9 5.7 8.8 14.5 18.5 19.5 18.2 391.9 14.5
Spain 1.7 2.0 4.3 7.3 8.9 11.0 13.0 12.9 11.4 570.6 9.7
France 3.0 2.6 3.0 3.5 3.6 3.7 4.0 4.2 4.3 65.4 1.7
Italy 2.9 3.0 3.4 4.0 4.3 5.6 6.9 7.7 6.9 137.9 4.0
Portugal 3.8 3.6 4.2 5.7 6.2 7.7 9.3 8.4 7.2 100.0 3.6
Eurozone 3.2 2.9 3.3 4.3 4.6 5.2 5.9 6.0 5.5 89.7 2.6
U.K. 1.3 1.4 1.9 2.5 2.7 2.7 2.7 2.2 1.6 23.1 0.3
E.U. 3.0 2.6 2.9 3.8 4.1 4.6 5.1 5.0 4.5 73.1 1.9
Source: Eurostat database
Note: LTUR % change*= 100 [LTUR2015-minLTUR(2007, 2008)]/minLTUR(2007, 2008); LTUR-
gap**=LTUR2015- minLTUR(2007, 2008).
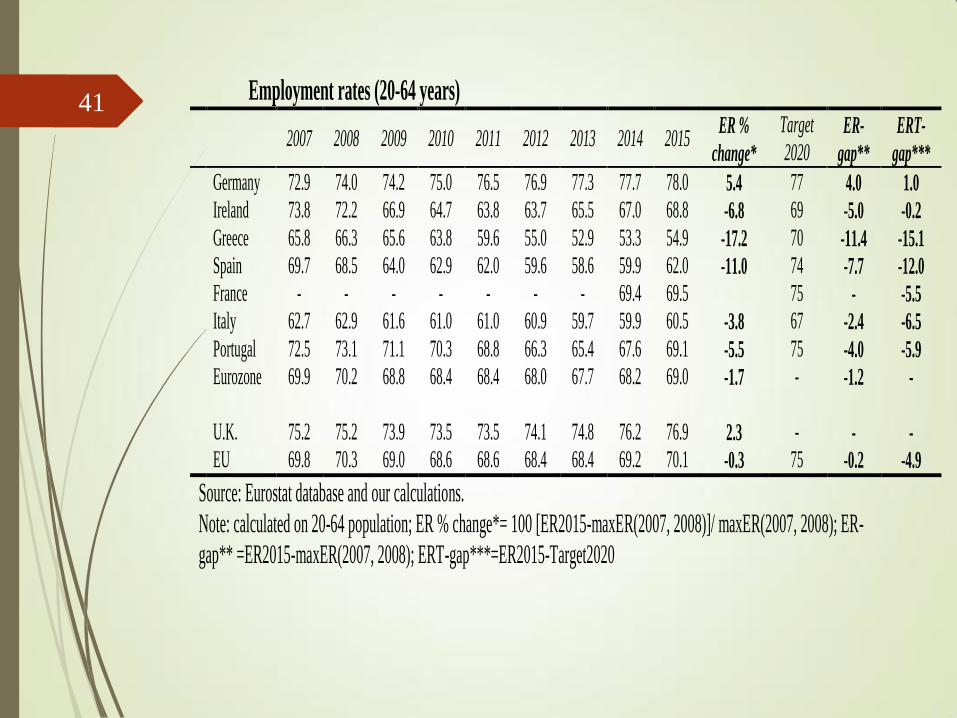
41
Employment rates (20-64 years)
2007 2008 2009 2010 2011 2012 2013 2014 2015
ER %
change*
Target
2020 ER-
gap**
ERT-
gap***
Germany 72.9 74.0 74.2 75.0 76.5 76.9 77.3 77.7 78.0 5.4 77 4.0 1.0
Ireland 73.8 72.2 66.9 64.7 63.8 63.7 65.5 67.0 68.8 -6.8 69 -5.0 -0.2
Greece 65.8 66.3 65.6 63.8 59.6 55.0 52.9 53.3 54.9 -17.2 70 -11.4 -15.1
Spain 69.7 68.5 64.0 62.9 62.0 59.6 58.6 59.9 62.0 -11.0 74 -7.7 -12.0
France - - - - - - - 69.4 69.5 75 - -5.5
Italy 62.7 62.9 61.6 61.0 61.0 60.9 59.7 59.9 60.5 -3.8 67 -2.4 -6.5
Portugal 72.5 73.1 71.1 70.3 68.8 66.3 65.4 67.6 69.1 -5.5 75 -4.0 -5.9
Eurozone 69.9 70.2 68.8 68.4 68.4 68.0 67.7 68.2 69.0 -1.7 - -1.2 -
U.K. 75.2 75.2 73.9 73.5 73.5 74.1 74.8 76.2 76.9 2.3 - - -
EU 69.8 70.3 69.0 68.6 68.6 68.4 68.4 69.2 70.1 -0.3 75 -0.2 -4.9
Source: Eurostat database and our calculations.
Note: calculated on 20-64 population; ER % change*= 100 [ER2015-maxER(2007, 2008)]/ maxER(2007, 2008); ER-
gap** =ER2015-maxER(2007, 2008); ERT-gap***=ER2015-Target2020

42
Youth unemployment rates (15-24)
2007 2008 2009 2010 2011 2012 2013 2014 2015
Germany 11.9 10.6 11.2 9.8 8.5 8.0 7.8 7.7 7.2
Ireland 9.1 13.3 24.0 27.6 29.1 30.4 26.8 23.9 20.9
Greece 22.7 21.9 25.7 33.0 44.7 55.3 58.3 52.4 49.8
Spain 18.1 24.5 37.7 41.5 46.2 52.9 55.5 53.2 48.3
France 18.8 18.3 22.9 22.5 21.9 23.6 24.0 24.2 24.7
Italy 20.4 21.2 25.3 27.9 29.2 35.3 40.0 42.7 40.3
Portugal 16.7 16.7 20.3 22.8 30.3 37.9 38.1 34.8 32.0
Eurozone 15.0 15.5 20.0 20.9 21.2 23.4 24.2 23.8 22.4
United Kingdom 14.3 15.0 19.1 19.9 21.3 21.2 20.7 16.9 14.6
EU 15.5 15.6 19.9 21.0 21.7 23.2 23.6 22.2 20.4
Source: Eurostat database
Note: calculated on 15-24 labour force (employment plus unemployment).

43
NEET indicator (15-24)
2007 2008 2009 2010 2011 2012 2013 2014 2015
Germany 8.9 8.4 8.8 8.3 7.5 7.1 6.3 6.4 6.2
Ireland 10.8 15.0 18.6 19.2 18.8 18.7 16.1 15.2 14.3
Greece 11.3 11.4 12.4 14.8 17.4 20.2 20.4 19.1 17.2
Spain 12.0 14.3 18.1 17.8 18.2 18.6 18.6 17.1 15.6
France 10.7 10.5 12.7 12.7 12.3 12.5 11.2 11.4 11.9
Italy 16.1 16.6 17.6 19.0 19.7 21.0 22.2 22.1 21.4
Portugal 11.2 10.2 11.2 11.4 12.6 13.9 14.1 12.3 11.3
Eurozone (17) 10.8 11.0 12.5 12.7 12.7 13.1 12.9 12.6 12.3
United Kingdom 11.9 12.1 13.2 13.6 14.2 13.9 13.2 11.9 11.1
EU 11.0 10.9 12.4 12.8 12.9 13.2 13.0 12.5 12.0
Source: Eurostat database
Note: calculated on 15-24 population

44
Investment and monetary policy
Three levels of intervention to relaunch investment: 1. EU: better use of structural funds for investment (transport,
communication, Digital Agenda), R&D, human capital (Europe 2020).
2. National: concerning public investment, more space is needed in national budgets, through either a “golden rule” or even greater flexibility in the GSP rules.
3. As for private investments, ensure that liquidity, created by the ECB, really flows to production and to the real economy.
Are innovative instruments of monetary policy enough?
NO
Helicopter money? Political, legal and technical problems.
More important is to solve the problems of the banking systems (NPLs, etc.), complete the Banking Union (with the European Deposit Insurance Scheme), etc.
It is crucial to realize a strong expansion of public investment in the Eurozone (5% of GDP in three years)
The “Juncker plan” is too slow in the implementation and too limited in available resources
There should be a greater involvement of the European Investment Bank (its bonds might be issued on a large scale and purchased by the ECB) and /or the issue of Eurobond for public investments.

45
Investment and needed reforms at
national and community levels
Investment: selection and planning
Which investment? Rather than big projects, for instance on colossal public works, many “micro” investment projects, e.g. in urban areas, are more important for social well-being.
For example: local transport, school building and social housing, energy efficiency, environmental protection, health, tourism, sports infrastructure, museums and cultural resources, social welfare, and many others.
Reforms in the EU Governance
Go over the “incomplete” monetary union, to guarantee euro’s survival in the long run. Favour “real convergence” among States.
Different proposals: Fiscal Union, Eurozone budget, Finance Minister, etc.: but with adequate resources!

46
The need for innovative policies and further
integration: a real “economic and monetary” union leading to a future
political union?
Policies to sustain economic growth and the role of aggregate demand
The need to sustain private and public investments: beyond the Juncker plan
Eurozone’s budget and Finance Minister, and the need for radical reforms in EU governance
Monetary union, economic union and political union
… the impact of the Brexit? It could be an opportunity for the Eurozone …

47
Central (or federal) level public expenses versus regional (or country) level public expenses in some federal unions/countries (2013)
Source: our elaboration on IMF database.
