eurozone crisis: it’s about public debts, not ... · pdf filecorrectly interpreting the...
TRANSCRIPT

Eurozone Crisis: It’s About Public Debts, not Competitiveness1
Charles Wyplosz The Graduate Institute, Geneva, and CEPR
First draft: August 27, 2012
1. Introduction Correctly interpreting the Eurozone sovereign debt crisis is important. It is an important historical natural experiment, one of those events that may eventually change our theories. In addition, solving the crisis requires having first reach a diagnosis. Finally, in the longer run, measures will have to be adopted to try and avoid another crisis of the same type. Surprisingly, perhaps, the diagnosis is not yet agreed upon. In fact, the official interpretation, backed by some academic research, is likely to be severely mistaken. This paper is an attempt at correcting the mistake. The European Commission has drawn a long list of reasons for the Eurozone crisis but has sought to put competitiveness at or near the top of its analyses: “While fiscal imbalances are at the forefront of the current policy debate, they are by no means the only area where policy action is needed. Recent developments have highlighted the urgent need for some euro-area Member States to restore their external balances and to improve their competitiveness.” Quarterly Report on the Euro Area 10(3), P.21-22 “Changes in the external balance ahead of the crisis went along with increases in government debt during the crisis. The exclusive focus on fiscal developments did not capture the mounting risks for public finances, inter alia because revenue windfalls embellished the actual budgetary stance.” Buti and Larch (2010) Some academics have also developed this view: “The competitiveness of these countries was severely eroded in the process, since their wages and prices rose excessively over the period. To come out of the crisis, the GIPS now need to depreciate in real terms, i.e. reduce wages and prices relative to their trading partners, a painful process that requires harsh austerity programs, straining the social fabric and causing significant political strife.” 1 This paper was supported by a PEGGED grant from the European Commission. I thank Sergio Sola for research assistance.
2
Sinn (2011) This may seem strange, and indeed it is. To the naked eye, the crisis has hit countries with large public deficits and debts. It also happens that these countries have undergone increasingly large current account deficits. Another feature of these countries has been their inflation rates, which have exceeded those in the rest of the Eurozone. This has led to the following narrative. High inflation coupled with a common currency has made some countries uncompetitive, which has led to external deficits. They now face the need to bring their inflation rates below those of the rest of the Eurozone, which most likely requires slow growth. Slow growth, in turn, will deteriorate already unsustainable budget deficits. Markets have rightly concluded that the situation is not manageable, hence the crisis. The structural weakness is the absence of exchange rates. This narrative combines two analytical limitations. First, it does not explain why inflation has been higher in some countries than in others; in essence inflation is taken as exogenous, which is not very convincing. A complete analysis must include an explanation of inflation differentials. Second, it confuses simultaneity and causality. The fact that inflation, current account deficits and budget deficits increased in some countries does not tell us anything about whether inflation caused external and/or budget deficits, or the other way round, or whether some additional exogenous evolution affected all these variables simultaneously. Once this view is accepted, two policy conclusions follow. First, these countries have to claw back competitiveness the hard way, by slashing labor costs. Second and somewhat controversially, given the size of the gap, some countries will not to be able to ever recover competitiveness, or not for a very long time, so they would be better off leaving the Euro Area and depreciating their new currencies. The first prescription accepts prolonged social misery, the second one advocates actions certain to provoke a deep turmoil with incalculable consequences. Such drastic policy implications run against the salt of economics as a field designed to improve welfare. Of course, tough adjustment is sometimes unavoidable but one would expect that such policy prescriptions be based on actively investigated evidence, not superficial observations. This paper argues that inflation differentials were the predicted manifestation of the Walters critique.2 Low real interest rates, in turn, encouraged a credit boom in some countries, which boosted private spending, a first source of current account deficits. The credit boom was predictably followed by a burst and the need to bail out banks, which led to large public debt increases. In the other countries, budget deficits emerged, largely in an exogenous fashion. The end result everywhere was the perception that public debts had become unsustainable. The absence of a reliable lender of last resorts convinced markets that some countries were likely to default, hence the sovereign debt crisis. Lebrun and Perez (2011) study the pattern of real unit labor costs and find that fluctuations tend to be reversed, with a five-year half life. Their interpretation is different as they link statistically rising real unit labor costs and increases in the capital-labor ratio, i.e. to borrowing and investment by firms. Mallariopoulos (2010) 2 For an evaluation of the Walters critique, see Mongelli and Wyplosz (2009).

3
looks at various indicators of competitiveness and concludes that real effective exchange rates overstate the loss of competitiveness of Greece after it adopted the euro. Section 2 lays out the fact and informally deals with the identification question: what is exogenous and what is endogenous? Section 3 follows up with causality question. Given the short period since the creation of the euro, formal causality tests are impossible. The paper therefore looks at indirect evidence. Section 4 draws the implications of accepting one diagnosis over the other. The conclusion briefly recap the main results. 2. The facts It is probably fair to assert that the overwhelming view that some euro area countries face a serious loss of competitiveness is entirely and uniquely based on one version or another of Figure 1 below. The figure displays unit labor costs U = WL/Y, where W is compensation per employee, L the number of employees and Y is real GDP. It shows a widening gap until 2009, the year when crisis pressure built up (indicated by the vertical line). This figure has led to an almost universal conclusion that the crisis has been caused by a loss of competitiveness in the Southern Euro Area countries. Is this diagnosis as compelling as it looks? Figure 1. Unit labor costs in Germany and in the crisis countries (Index: 1999 =100)
Source: AMECO on line. European Commission A direct comparison of nominal labor costs is justified under two assumptions. The first one is that we have a single good market and separate labor markets. The other implicit assumption is that we do not need to be concerned with exchange rates because all wages and GDPs are in euros in these countries. Put differently, within the Single Market and with a Single Currency, labor costs are directly comparable and offer a clear picture of the evolution of national competitiveness. The first assumption is only superficially reasonable. It is true that labor market

4
institutions are deeply national, involving domestic trade unions and wage bargaining processes driven by domestic factors, both economic and political. Yet, wage bargaining is known to be deeply related to economic conditions in general (see, e.g. Mortensen and Pissarides, 1994). This has been shown to imply, among many other things, that goods market integration has effects on labor markets, even if the overall impact depends on a myriad of factors, as surveyed in Bertola (2009), which also looks at the various effects of adopting a common currency. The effects may also change over time as national labor market institutions endogenously respond to changing conditions, see e.g. Calmfors (2001). These considerations suggest that the co-movements apparent in Figure 1 are not necessarily exogenous and need to be explained. I return to this issue below in Section xx (maybe link to CA, surely to Walters critique). They also provide some clues to the rapid reversal observed after 2009. The second assumption is clearly unacceptable. It implicitly amounts to claiming that the Euro Area countries only compete with each other. While intra-Euro Area trade often represents the largest part of overall trade, individual countries have different specializations and trade with different parts of the world. It also ignores the fact that the evolution of the nontraded good sector, where much of wage slippages have occurred, has little to say about external competitiveness. These two arguments suggest that nominal labor costs tells us very little about external competitiveness. Ideally, we would like to look at each country real effective exchange rate (REER) measured by comparing the domestic traded good price index and an index of average traded good prices in the partners countries converted in domestic currency when these countries are not part of the Euro Area. Lack of internationally comparable traded good price data precludes the use of such a REER, unfortunately. This paper therefore sticks with nominal labor costs but relies on a REER that compares each country’s costs to average costs in its partner countries, including those outside of the Euro Area. Figure 2 accordingly presents for each country the REER based on nominal unit labor costs EU/U* where E is the effective exchange rate of a country, U its nominal labor costs and U* the average unit labor costs in partner countries, using the same geometric weighting schemes for E and U*.3 The leftmost chart presents REERs of the crisis countries while the rightmost chart presents those from the largest remaining countries using the same scale for comparison purposes. Figure 2 seems to confirm the evidence suggested by Figure 1. An important gap emerges after 1999 between the crisis countries and Germany. Yet, the figure suggests that REERs have depreciated considerably after 2009 and are almost back to where they were in 1999. The reversal suggests that labor markets are considerably more responsive that hitherto believed and that exit from the Euro Area is hardly warranted any more. The figure also suggest that Germany is an outlier, relative to both crisis and non-crisis countries, perhaps with the exception of Austria. Yet, this presentation of REERs is potentially misleading too. By normalizing all
3 The partner countries are the 35 other industrialized countries in a sample that includes the 27 EU countries, Australia, Canada, Japan, Mexico, New Zealand, Norway, Switzerland, Turkey and the US. Double export weights. (AMECO code: XUNRQ.) A similar

5
REERs to be 100 in 1999, the year when the euro was created, it implicitly assumes that all exchange rates were then in equilibrium. Casual evidence is that some countries (Portugal is a case in point, as is Greece when it joined in 2001) adopted undervalued conversion rates while Germany accepted an overvalued exchange rate. If that assessment is correct, we should expect real appreciation for the former countries and a real depreciation in Germany. Figure 2. Relative Unit Labor Costs (Index: 1999 = 100)
Source: AMECO on line. European Commission This is exactly what happened as seen in Figure 3, which uses the same data as Figure 2, but normalizes the REERs by setting them at 100 over the whole period 1995-2012 when the data is available. Crucially, the figure shows that by 2012 the REERs of Greece and Ireland are below their sample averages and that no REER index is higher than 105, except for Italy at 106. Of course, some countries my have had overvalued exchange rates during the whole period, so this no proof that no exchange rate remains overvalued. Just looking at data cannot provide an answer to that question. But this is also true about world famous Figure 1, which suffers from the additional implicit and arbitrary assumptions mentioned above. The impression conveyed by Figure 3 may be misleading but, in this respect, Figure 1 is much more so. Any attempt at deciding whether a country has an over or undervalued currency inevitably requires estimating the equilibrium exchange rate. This is done formally in Section 4. In this section, an informal attempt is made using the assumption of purchasing power parity (PPP). PPP is a controversial concept but massive research efforts have led to the consensus view surveyed in Taylor and Taylor (2004): PPP does not hold in the short run but cannot be rejected in the long run, at least for countries at similar stages of development. The estimate by Frankel and Rose (1996) that the half-life of deviations from PPP last about four years has also well survived considerable subsequent work. The Southern Euro Area countries may well started out less developed than the core countries so PPP may not hold too well. In that case, there would be even less of a case for overvaluation, an issue to which I return in Section 4.

6
Figure 3. Relative Unit Labor Costs (Index: 1995-2012 = 100)
Source: Same data as Figure 2. The 18 year-long sample period used to normalize the REERs in Figure 3 may be seen as somewhat short. An alternative dataset provides REERs for Euro Area countries dating back to 1960, but they compare each country to a narrower sample of countries, namely the 15 first EU member countries. The left-hand chart in Figure 4 shows the implied overvaluation in 2009, the right-hand chart does the same for 2012, comparing the index in each year to the sample average of 100 meant to capture the equilibrium REER under the PPP assumption. The data suggests some overvaluation for the crisis countries (and the Netherlands) in 2009. The right-hand chart suggests that this overvaluation has been more than corrected by 2012 for Greece and Ireland, and partly corrected for Portugal and Spain, with no improvement for Italy. According to this analysis, no country has an overvaluation that exceeds 10%, a relatively mild magnitude. It also implies that Germany undervaluation has increased between 2009 and 2012. Figure 4. Deviations of REER from average over 1960-2012
Note: REER based on nominal unit labor costs relative to 15 EU countries Source: AMECO on line. European Commission

7
3. Sources of misalignments and the asymmetry problem The previous section has shown that the massive loss of competitiveness in the crisis countries, when properly measured by the REER and compared to its long-run equilibrium rather than to an economically arbitrary base year, is vastly overblown and largely corrected by 2012. But the evolution of the REER measured by relative unit labor costs may be the outcome of diverse economic events such as real wages, employment and growth, the nominal exchange rate and prices. This section briefly looks at a decomposition of the change in REERs between 1999 and 2009. The REER used so far is EU/U* the ratio of domestic nominal unit labor costs U to the average of foreign labor costs U* converted into the same currency via the nominal effective exchange rate E. Denoting u = U/P and u* = U*/P*, respectively, the real domestic and foreign labor costs, the REER can be written as:
.
Table 1 provides a decomposition of the change in the REER into changes of u/u* and of EP/P*. Then the change of relative prices EP/P* – another popular REER measure – is decomposed into changes in the nominal exchange rate E and in P/P*, i.e. relative inflation rates. With the exception of Ireland and Finland and in a smaller way Italy, relative real unit labor costs have not drifted very significantly and do not explain much of the REER appreciation where it occurred. Since u represents the labor share of income, the view that labor costs have been allowed to mushroom after adoption of the euro in countries like Greece or Portugal is simply not borne out by the data. Except for Ireland, wherever competitiveness has been hurt, the main cause of increase in the REER is an appreciation of the GDP deflator based real effective exchange rate EP/P*. Table 1 .Decomposition of increase in REER, 1999-2009 (percent)
Notes: u/u* is the ratio of domestic and foreign real unit labor costs WL/PY (code
€
EUU *
=uu*
EPP *
8
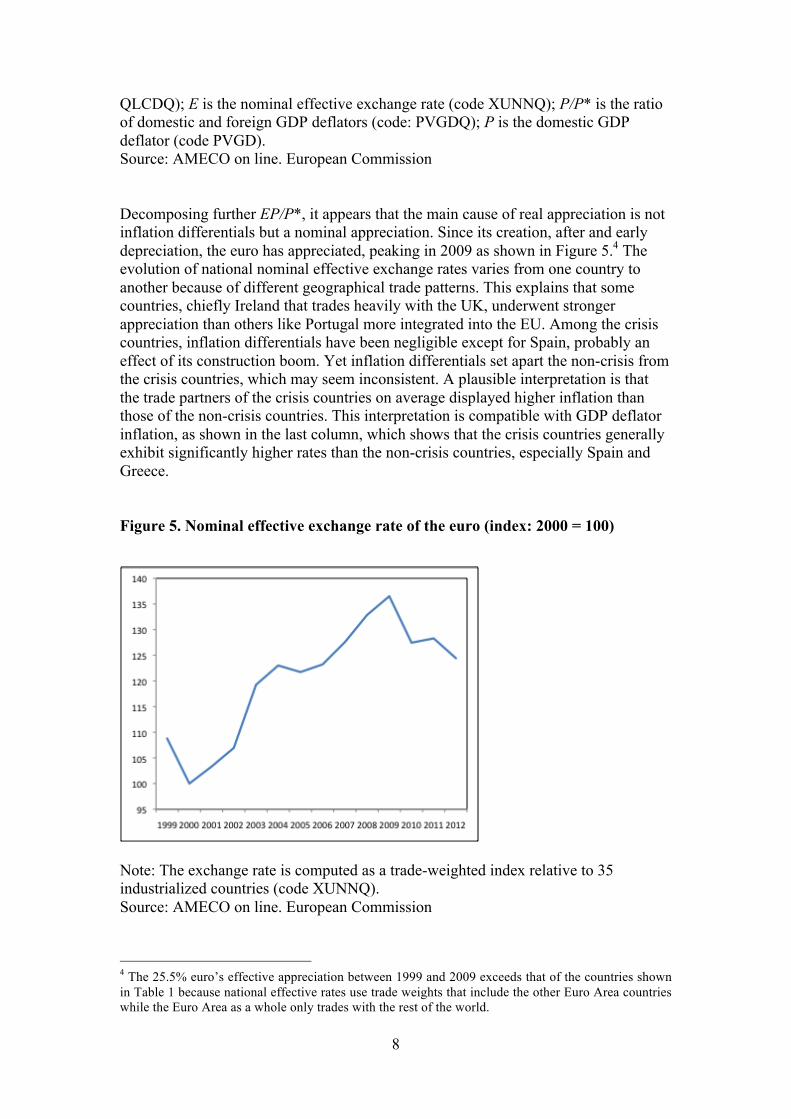
QLCDQ); E is the nominal effective exchange rate (code XUNNQ); P/P* is the ratio of domestic and foreign GDP deflators (code: PVGDQ); P is the domestic GDP deflator (code PVGD). Source: AMECO on line. European Commission Decomposing further EP/P*, it appears that the main cause of real appreciation is not inflation differentials but a nominal appreciation. Since its creation, after and early depreciation, the euro has appreciated, peaking in 2009 as shown in Figure 5.4 The evolution of national nominal effective exchange rates varies from one country to another because of different geographical trade patterns. This explains that some countries, chiefly Ireland that trades heavily with the UK, underwent stronger appreciation than others like Portugal more integrated into the EU. Among the crisis countries, inflation differentials have been negligible except for Spain, probably an effect of its construction boom. Yet inflation differentials set apart the non-crisis from the crisis countries, which may seem inconsistent. A plausible interpretation is that the trade partners of the crisis countries on average displayed higher inflation than those of the non-crisis countries. This interpretation is compatible with GDP deflator inflation, as shown in the last column, which shows that the crisis countries generally exhibit significantly higher rates than the non-crisis countries, especially Spain and Greece. Figure 5. Nominal effective exchange rate of the euro (index: 2000 = 100)
Note: The exchange rate is computed as a trade-weighted index relative to 35 industrialized countries (code XUNNQ). Source: AMECO on line. European Commission
4 The 25.5% euro’s effective appreciation between 1999 and 2009 exceeds that of the countries shown in Table 1 because national effective rates use trade weights that include the other Euro Area countries while the Euro Area as a whole only trades with the rest of the world.

9
Finally, Table 1 shows that Germany is a clear outlier on every single dimension of this decomposition. This is one additional reason behind the popular view that the crisis countries have suffered massive competitiveness loss. The fact is that Germany achieved a large gain in competitiveness since euro creation. Given the size of its economy, it cannot fail to have an effect on all other Euro Area countries. Does it mean that the Euro Area has a “German problem”? One benefit of economic integration is that it enhances competition, not just in the goods and financial markets but among the economic systems broadly defined to include wage and price setting institutions. In that sense, the fact that the largest economy is virtuous is a positive development. It puts pressure on all other countries to follow suite and contain their own costs. At the same time, the situation is asymmetric. Consider a two-country monetary union with similar sized economies, where one country is reducing its labor costs, but not the other one. This is a classis asymmetric shock as discussed in the Optimum Currency Area literature. If each country had its currency, the virtuous country would see its exchange rate appreciate, so that its efforts would accrue in the form of improved terms of trade (and other domestic effects like low real interest rates and higher employment), with no effect on the other country, at least to a first degree of approximation. If they share the same currency, the common exchange rate appreciates, but less. This means that the non-virtuous country’s external competitiveness is eroded while the virtuous country enjoys a competitiveness advantage. Strong demand for the virtuous country production translates into a current account surplus and eventually inflation. Over time inflation will produce the same real exchange appreciation as in the absence of the common currency. If this country is willing to tolerate a higher inflation rate, it has nothing to do, just wait and rip the benefits from its virtue. The other country sees its current account worsen and faces low demand, hence a contractionary effect. If the situation lasts, i.e. is inflation rises slowly in the virtuous country, the other country’ external debt rises and its public finances deteriorate as growth slows down. This can become a crisis. The asymmetry means that the onus of action is on the country that has not reduced its production costs. This country has not done anything wrong, simply it shares its currency with a highly virtuous country. This non-cooperative outcome is undesirable for both countries: inflation in the virtuous country, a risk of crisis in the other country. The asymmetry problem has been well known for a long time. During the Bretton Woods conference, Keynes famously wanted the IMF rules to be symmetric in the fixed exchange rate system. He lost. The IMF developed its assistance program that imposes conditions on the non-virtuous countries, none on the virtuous countries. At least, the Bretton Woods agreement allowed the non-virtuous countries to depreciate. The current situation in the Euro Area bears more than a resemblance to the Bretton Woods agreements, including conditional loans from the European Financial Stability Facility (EFSF) and its successor the European Stability Mechanism (ESM), with important differences. One obvious difference is that depreciations are not possible within the Euro Area, so the non-virtuous countries face a much steeper hurdle. Another difference is that the link between private and public debts is now much tighter than in Keynes’ times, and both debts have grown considerably. This makes the situation considerably more crisis-prone and the costs of the asymmetry much larger. The third major difference is that Euro Area countries do not have access to a

10
lender of last resort. Even though the ECB will be drawn eventually into playing this role, the delay is costly. Finally, most Euro Area countries have no room left for fiscal policy actions. At the cost of oversimplification, this section has shown that competitiveness losses occur when the euro appreciation is not offset by a reduction in labor costs. Put differently, countries that did not cut relative labor costs in the face of a strong appreciation of the euro – or in the case of Spain, did not cut enough labor costs in the face of a very strong appreciation – are those that suffered competitive losses. Since 2009, the combination of relative labor cost reductions and a weaker euro explain why competitiveness is nearly reestablished. The adjustment process, however, has been highly asymmetric, involving large increases in unemployment in the crisis countries while Germany enjoys some of its best years. 4. Equilibrium exchange rates
As already noted, the above reasoning assumes that PPP is a valid assumption for the long run. The most common reason why long run PPP fails is the Balassa-Samuelson effect. Then, instead of remaining constant in the long run, the real exchange rate appreciates when an economy catches up. The phenomenon involves large productivity gains in the traded good sector, which allows for higher real wages in that sector while keeping labor costs and competitiveness intact. In the nontraded sector real wages grow too for various reasons,5 so labor costs increase in that sector, hence in the aggregate. The Balassa-Samuelson hypothesis might explain why labor cost increases have occurred in Southern Europe, which is often seen as economically lagging Northern Europe. An important implication of the hypothesis is that rising aggregate labor cost increases represent an equilibrium phenomenon, not a loss of international competitiveness. It must also be noted that the Balassa-Samuelson hypothesis has nothing to say about current account imbalances. Indeed, as a microeconomic phenomenon, it cannot help understand current account balances, the difference between domestic production of and spending on traded goods. The Balassa-Samuelson hypothesis could provide an interpretation for labor cost increases until the start of the crisis, see Figure 3. Under this interpretation, the post-crisis decline in labor costs would not be seen as a return to equilibrium but as a temporary phenomenon – the impact of a growing recession – that will be reversed once the crisis is over. Many papers have tested the presence of a Balassa-Samuelson effect. The starting point is to build the measure that identifies the Balassa-Samuelson effect. As shown
by De Gregorio et al. (1994), this is ratio
€
πT π N
π *T π *Nof a country’s productivities in
the traded (πT) and nontraded (πN) good sectors relative to the same ratio in trading partner countries. The foreign productivity measures are built as geometrically weighted averages of individual countries, using trade weights. The data are from the
5 Labor market equilibrium, trade union pressure and equity considerations.

11
OECD STAN database. Productivity is measured as value added per hour of work. The traded good sector includes xxx The changes in the national traded to nontraded sector productivity ratios since the creation of the euro are reported in Table 2. Greece, Ireland and Portugal are indeed among the Euro Area countries where relative productivity has increased fastest. On the other hand, Spain and Italy are among the countries with the lowest changes. This either suggests that the Balassa-Samuelson effect is not relevant for this group of Euro Area countries or that it is only relevant for a subset of countries. In that latter case, it is disquieting that the first group of countries that were affected by the crisis – Greece, Ireland and Portugal – are precisely those where productivity changes have been supportive of a Balassa-Samuelson effect. An indication is provided by the correlation between the changes in the ratios and their initial levels. Over the long period 1970-2007, among the countries shown in Table 2, the correlation is -0.91, which indicated that changes have be largest where the initial ratios where lowest, precisely what is expected under the Balassa-Samuelson hypothesis. However, over the period 1998-2007, the ratio is only -0.19. This suggests that, in some countries at least, changes in the productivity ratio may be related to other reasons than catch-up in the traded good sector. Table 2. Change in Relative productivities (πT/πN)
Source: STAN database, OECD. We test formally for the presence of a Balassa-Samuelson effect, following the approach proposed by Ricci et al. (2008). Available data cover 18 developed countries over the period 1977-2007.6 The (log of the) real exchange rate, defined as relative labor costs – as shown in Figure 2 – is regressed on the log of the ratio of
domestic to foreign relative productivities
€
πT π N
π *T π *N and a number of control
6 Australia, Austria, Belgium, Denmark, Finland, France, Germany, Greece, Ireland, Italy, Japan, Korea, Netherlands, Portugal, Spain, Sweden, UK and the US.

12
variables proposed by Ricci et al. (2008). The results are presented in Table 3. The two first column show OLS estimates while the last two columns show results obtained with DOLS (Dynamic OLS). The Balassa-Samuelson term is never significant, neither for the whole sample not for the Euro Area countries alone. Table 3. Estimation of the real effective exchange rate
(1977-2007, 17 OECD countries)
Note: Robust standard errors in brackets. *** p<0.01, ** p<0.05, * p<0.1 Source: OECD and AMECO on line. These results confirm that the Balassa-Samuelson effect has not been a statistically significant driver of real exchange rates. This implies that the real appreciations that preceded the Eurozone crisis were not, in general, equilibrium changes. Under this view, the rapid post-crisis depreciations are not temporary. Importantly, it means that labor adjustments are possible within the Eurozone, at least under crisis conditions. 5. Simultaneity and causality
The analysis so far has looked at competitiveness from the viewpoint of relative unit labor costs. Proponents of the overvaluation view bring to bear some additional evidence, however. They note the simultaneity of REER appreciation and deepening current account deficits in the years leading to the crisis, which is visible from Figure 2 and Figure 6. The partial correlation between these two variables is highly significantly negative.7 7 Although highly significant, in a panel estimate over 1995-2012 for the eleven Euro Area countries displayed in previous figures the partial ∂(CA/GDP)/(∂REER/REER) = -3.62 is small; it implies that a 10% real depreciation is associated with a deterioration of the ratio of current account to GDP of less

13
Figure 6. Current accounts (% OF GDP)
Source: AMECO on line. European Commission The simultaneity of current account imbalances and changes in competitiveness in Euro Area countries cannot be declared causal, as is well known. Both developments could be caused a common third factor or could be occurring simultaneously for unrelated reasons. The issue must be treated explicitly. Unfortunately, causality tests are generally weak and, in the case at hand, the horizon – the first eight years of the euro – is far too short. We simply cannot hope to be able to formally study the causal link between current accounts and competitiveness since the creation of the euro. The only possible approach must be indirect, testing implications of possible causality assumptions. The deterioration of current account positions in the crisis countries is undeniable. Then issue is whether this is the outcome of an exogenous competitiveness loss or whether other exogenous disturbances have both hurt competitiveness and worsened the current account. A roundabout approach to causality is to bring in more information to bear. In particular, the evolution of output may help to identify the nature of the shock. Large general equilibrium models may provide indications of how shocks are transmitted to output, the current account and the real exchange rate. An intuitive shortcut is to use the elegant graphical analysis from Dornbush (1980). It emphasizes the two-way link between the current account and output and their joint determination as shown in Figure 7. The upward schedule shows a first relationship between aggregate income Y and total national spending A(Y). Under the assumption that the propensity to spend is less than unity, an increase in income leads to higher national net saving, i.e. the current account. The identifying assumption is that net saving is independent of the real exchange rate. The downward sloping schedule also represents the current account, than 0.4 percentage points.

14
now defined as net exports, the difference between exports X and imports M broadly defined. An increase in income raises spending and therefore imports, hence the negative slope of the schedule. Importantly, both exports and imports depend on the real exchange rate; under generally accepted assumptions – for example, the Marshall-Lerner condition – a real appreciation reduces exports and increases imports. Start from point A, representing the situation before adoption of the euro, the question is what could have provoked the subsequent divergence in current accounts. This framework suggests three possible exogenous shocks. The first one is that labor costs have been allowed to rise, for instance through generous pay increases in the public sector. The identifying assumption implies that the Net Export schedule is the only one to move down. An adverse competitiveness shock takes the economy to point B. The second shock of interest is an exogenous increase in domestic demand A(Y), for instance because cheap credit becomes abundant and demand for credit is next fueled by an asset bubble. If competitiveness is unchanged, the net export schedule remains unchanged and it is the Net Saving schedule that shifts downward; the economy moves from point A to point C. The analysis can be enriched by assuming a Phillips curve mechanism, so that the positive output gap produced by the exogenous demand shock results into rising labor costs and a competitiveness loss. In that case the Net Export schedule shifts downward, bringing the economy from A to D. Figure 7 .The Dornbusch model
Current account X(Y*, REER) – M(Y, REER) Y – A(Y) A B C
D Output The third shock is an exogenous decline in foreign demand. This is captured by a downward shift in the Net Export schedule and the economy moves to point B. Graphically this resembles the first case, that of a competitiveness loss. A Phillips curve effect would result in an improvement in competitiveness, with a partially

15
offsetting upward shift of the Net Export schedule. This analysis provides a way to (informally) test which shock occurred. The test consists in checking which correlation occurs, if any: Competitiveness shock: cov (CA, REER) < 0, cov (CA, Y) > 0, cov (REER, Y) < 0. Domestic demand shock: cov (CA, REER) < 0, cov (CA, Y) ≤ 0, cov (REER, Y) ≥ 0. Foreign demand shock: cov (CA, REER) > 0, cov (CA, Y) > 0, cov (REER, Y) > 0. Table 4 shows how these variables have changed over the period 1999-2009, from the creation of the euro to the dawn of the crisis. For each country, the table displays the average current account balance, the average output gap (deviation from trend GDP) and the total change in relative unit labor costs as displayed in Figure 2. The countries are listed in order of declining average output gap. The last row shows sample correlations among the three variables.8 Overall, the Dornbusch “test” suggests that exogenous demand shocks prevailed. Table 4. The Dornbusch test
Source: AMECO on line. European Commission Focusing on the crisis countries, the case of a domestic demand shock is strong: we observe large current deficits, sizeable positive output gaps and REER appreciation. The exception is Italy where the average output gap is positive but small and the current account deficit is small as well while competitiveness has been seriously eroded; this can be the result of various combinations of shocks, for example an adverse competitiveness shock and a positive foreign demand shock.
8 A longer sample period would have allowed a VAR investigation.

16
As for the non-crisis countries, the situation is varied. Germany’s sharp competitiveness gains are associated with large current surpluses but GDP has been mostly on trend. One possible interpretation is that Germany faced a combination of favorable competitiveness (the effect of labor market reforms and of explicit wage moderation in the early 2000s) and adverse demand shocks (e.g. fiscal retrenchment). Austria displays a similar pattern. The pattern observed in Belgium, Finland and the Netherlands corresponds to a positive external demand shock. The important result of this section is that the most convincing explanation of the crisis that occurred after 2009 is a domestic demand shock. This shock, in turn, may have different causes. In Greece and Portugal fiscal policy has been mostly easy during this period. Ireland and Spain have undergone a credit boom and housing price bubble; when the bubble burst, both countries have had to bail banks out. In all these cases, the real exchange rate appreciation and the current deficits appear as consequences of these shocks, not as autonomous shocks as often asserted.9 6. Policy implications
Causality is not just an important analytical issue. It matters for policy since good policies are directly shaped by an accurate diagnosis. The exogenous labor cost shock assumption lies behind the programs applied to the crisis countries. The view that current account deficits have played a causal role has led to the Excessive Imbalance Procedure (IEP) adopted in 2011. This procedure involves score cards that examine competitiveness and the current account. While these measures can be seen as indicators, or symptoms of exogenous shocks, care will be needed when interpreting them. Setting targets for endogenous variables is self-defeating and possibly counter-productive unless the sources of the imbalance have been identified and policies designed accordingly. In the present situation, the conclusion that the source of the crisis is a domestic demand shock suggests that taming demand is enough to reverse the competitiveness and external imbalance problems. Indeed, as the crisis countries have entered into a protracted recession, competitiveness has been about restored (Figure 1) and the current deficits are fast disappearing (Figure 6). The reduction in relative labor costs additionally undermines the frequently held view that wage stickiness is so pervasive that the crisis countries may be better off leaving the Euro Area. 7. Conclusion This paper has shown that many popular views about the Euro Area crisis are myths unsubstantiated by the evidence. It implies that many policies adopted as conditions for the bailouts are misguided. The evidence provided here combines a formal analysis of competitiveness and a careful and systematic look at widely available evidence. As always when dealing with causality, definitive conclusions are hard to
9 Another interpretation considers that the exogenous shock has been capital flows that triggered domestic borrowing and spending (Sinn, 2012). Regarding the effects, this is equivalent to a domestic demand shock. This is again a causality issue. However, capital flows are normally understood to be endogenous. Why, for example, would capital have flowed to Spain and not Germany?

17
come by. At the very least, this paper can be seen as seriously challenging what has emerged as the conventional wisdom.

18
References Bertola, Giuseppe (2008) Labour Markets in EMU - What has Changed and What Needs to Change”, Economic Papers 338, European Commission. Buti, Marco and Martin Larch (2010) “The Commission proposals for stronger EU economic governance: A comprehensive response to the lessons of the Great Recession”, VoxEU, 14 October 2010. Calmfors, Lars (2001) “Wages and Wage-Bargaining Institutions in the EMU – A Survey of the Issues”, Empirica 38(4): 325-351. De Gregorio, Jose, Alberto Giovannini and Holger Wolf (1994) “International Evidence on Tradables and Nontradables Inflation”, European Economic Review 38: 1225-1224. Dornbsuch, Rudiger (1980) Open Economy Macroeconomics, Basic Books. Frankel, Jeffrey and Andrew Rose (1996) “A Panel Project on Purchasing Power Parity: Mean Reversion Within and Between Countries”, Journal of International Economics 40(1-2): 209-224. Lebrun, Igor and Esther Perez (2011) “Real Unit Labor Costs Differentials in EMU: How Big, How Benign and How Reversible?”, Working Paper 11/09, International Monetary Fund. Mallariopoulos, Dimitri (2010) “How Much did Competitiveness of the Greek Economy Decline Since EMU Entry?”, Economy and Markets 5(4), Eurobank EFG. Mongelli, Francesco Paolo and Charles Wyplosz (2009) “The Euro at Ten: Unfulfilled Threats and Unexpected Challenges”, in: Bartosz Mackowiak, Francesco Paolo Mongelli, Gilles Noblet and Frank Smets (eds), The Euro at Ten – Lessons and Challenges, European Central Bank, 2009. Mortensen, Dale T. and Christopher A. Pissarides (1994) “Job Creation and Job Destruction in the Theory of Unemployment”, The Review of Economic Studies 61(3): 397-415. Ricci, Luca Antonio, Gian Maria Milesi-Ferretti and Jaewoo Lee (2008) “Real Exchange Rates and Fundamentals: A Cross-Country Perspective”, Working Paper 08/13, International Monetary Fund. Sinn, Hans-Werner (2011) “Euro crisis due to structural imbalances”, CESifo, August. http://www.cesifo-group.de/portal/page/portal/ifoHome/e-pr/e1pz/_generic_press_item_detail?p_itemid=16367563. Taylor, Alan and Mark Taylor (2004) “The Purchasing Power Parity Debate”, Journal of Economic Perspectives 18 (4): 135–158.