eurozsecurities rottnest conference 2011 - ahgir.com.au · eurozsecurities rottnest island...
TRANSCRIPT

Euroz Securities Rottnest Island Conference 2011

AHG delivers record result for 1H2011
• Solid performance, despite increased interest rates, higher company tax rate and soft results in Queensland
• Revenue increase of 5.1%¹ to $1,689m
EBITDA i i t 3 9%• EBITDA margin increase to 3.9%
• Group profit after tax of $29.6m, 103.3% pcp¹
• Earnings per share of 13.1 cents, 12.7 cents pcp¹
• Interim Dividend of 7 0 cents per share (fully• Interim Dividend of 7.0 cents per share (fully franked)
• Net Interest expense increase of 50% pcp2
¹ excluding profit on the sale of carsales.com shares recorded in 1H2010 of $4.92m (net).

Solid group performance¹ since listing
48.5
55.1
50
60 NPAT ($m)4000
Revenue ($m)
20 2
29.6
23.7
42.2
28.7 29.630
40
50
2232
1703
3415
30733240
16892000
2500
3000
3500
9.5
20.2
11.3
18.2
0
10
20
679
1389
856
1703 1601 1607 1689
500
1000
1500
01H06 FY06 1H07 FY07 1H08 FY08 1H09 FY09 1H10 FY10 1H11
01H06 FY06 1H07 FY07 1H08 FY08 1H09 FY09 1H10 FY10 1H11
115 8 116 0
EBITDA ($m) Basic EPS (cents per share)
70.3
115.8
101.1
116.0
65.980
100
120
16.6
20
25.3
21.724.3
150
200
250
20
25
30
sue (m
)
25.1
52.7
26.9
55.850.4
57.9
20
40
60
6.88.5
12.4
9.5
12.7 13.1
50
100
150
5
10
15
# shares on iss
3
01H06 FY06 1H07 FY07 1H08 FY08 1H09 FY09 1H10 FY10 1H11
00
1H06 FY06 1H07 FY07 1H08 FY08 1H09 FY09 1H10 FY10 1H11
¹ Continuing operations

1H2011 group performance ‐ summary
1H2010 1H2011 % pcp$m $m
p p
105.11,689.31,607.0¹Revenue
113.8
108.2
,
65.9
3.9
,
57.9¹
3.6¹
EBITDA
EBITDA Margin (%)
114.0
88.2
56.6
29.6
49.7¹
33.6
EBIT
Statutory NPAT
103.3
103.2
29.6
13.1
28.7¹
12.7¹
NPAT
Basic EPS (cents per share)
86.0
100.0
4.4
7.0
5.8¹
7.0
Interest Cover
Interim Dividend (cents per share)
4
¹ excluding profit on the sale of carsales.com shares recorded in 1H2010 of $4.92m (net).

Capital Management
30.06.09$m
31.12.10$m
30.06.10$m
[314 68303 37
Total Debt
Current* 358 83 [314.68
(305.95)
8 73
303.37
(295.21)
8 16
Current
Less, finance co. floorplan loans*
Sh t T D bt ( l fl l )
358.83
(349.94)
8 89 8.73
(43.24)
8.16
(64.98)
Short Term Debt (excl floorplan)
Less Cash
8.89
(76.78)
(34.51)
135.53
(56.82)
86.64
Net Current Cash Position (excl floorplan)
Non Current Debt
(67.89)
98.28
101.0229.82Net Debt (excl floorplan)
NOTES:
30.39
* Includes $20m cash offset (Jun 09) / $25m cash offset (June & December 10)Undrawn Bill Facility at 31 December 2010 - $14mFloorplan headroom at 31 December 2010 - $133m (subject to inventory levels)
5

Capital Management
Net Debt Position – June to December 2010
Net Working Capitalto Support Capex
19,844
Net DebtPosition Dec 2010
101,016100,000
110,000
OtherProperty12,203
80,000
90,000
Purchase Castle HillProperty25,950
60 000
70,000
80,000
$'00
0
Purchase FerntreeGully Toyota12,630
50,000
60,000
Net DebtPosition June 2010
30,38930,000
40,000
6
20,000

Automotive Retail – 1H2011 Result
1H2010¹$m
1H2011$m
% pcp
104 91407 7
Automotive
Revenue 1 476 2 104.9
115.1
109 8
1407.7
42.9
3 05
Revenue
EBITDA
EBITDA M i
1,476.2
49.4
3 4 109.8
105.2
3.05
31.2
EBITDA Margin
Segment Result (NPBT)
3.4
32.8
7
¹ excluding profit on the sale of carsales.com shares recorded in 1H2010 of $4.92m (net).

Logistics – 1H2011 Result
1H2010$m
1H2011$m
% pcp
106 9213 1
Logistics
Revenue 199 3
Logistics
Revenue 106.9
109.8
102 7
213.1
16.5
7 7
Revenue
EBITDA
EBITDA M i (%)
199.3
15.0
7 5
Revenue
EBITDA
EBITDA M i (%) 102.7
110.5
7.7
11.0
EBITDA Margin (%)
Segment Result (NPBT)
7.5
9.9
EBITDA Margin (%)
Segment Result (NPBT)
8

Logistics – 1H2011 Segment Result
1H2010 1H2011 % pcp1H2010$m
1H2011$m
% pcp
117 186 2
Revenue
& C ld S 100.9
112.2
117.1
99.2
86.2
113.1
Transport & Cold Storage
Other
10.7 124.08.7
EBITDA
Transport & Cold Storage
5.7 90.56.3Other
9

Interest rate increases 1H2010 vs 1H2011
90 day BBSW
5 0000
5.5000
1H2011
4.5000
5.0000
4.0000
1H2010
3.5000
3.0000
eb‐09
pr‐09
un‐09
ug‐09
ct‐09
ec‐09
eb‐10
pr‐10
un‐10
ug‐10
ct‐10
ec‐10
10
Fe Ap Ju Au Oc
De Fe Ap Ju Au Oc
De

Higher interest rates and increased borrowings
Higher averageinterest rates
3,023
Net interestexpense Dec 2010
12,842
14,000
Hi h
12,000
Higher averageborrowings due to increase in inventory and corporate
borrowings1,25410,000
$'00
0
Net interestexpense Dec 2009
8,565
8,000
11
6,000

Automotive Retail
Positive key indicators forPositive key indicators for 2011
12
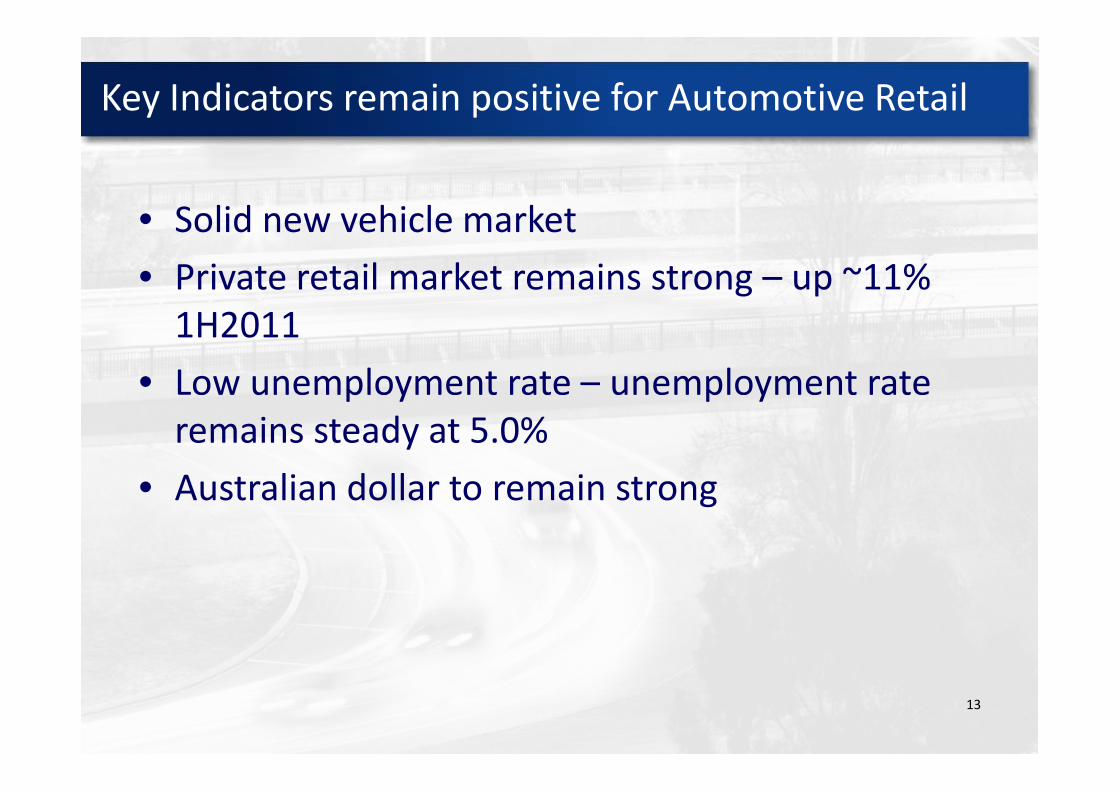
Key Indicators remain positive for Automotive Retail
• Solid new vehicle market• Solid new vehicle market
• Private retail market remains strong – up ~11% 1H2011
• Low unemployment rate – unemployment rate p y p yremains steady at 5.0%
• Australian dollar to remain strong• Australian dollar to remain strong
13

Solid new vehicle market
1,000,000 – 1,040,000 new vehicle sales forecast for CY11¹ ²
1,000,000
600,000
800,000
400,000
0
200,000
0
1996 1997 1998 1999 2000 2001 2002 2003 2004 2005 2006 2007 2008 2009 2010 2011F¹ 2011F²
¹ AutoTeam Australia December 2010
² Manufacturer Forecast
14

Retail sales remain strong
Australian New Vehicle Sales¹
CY20098mths to28.2.11 % pcp% pcpCY2010
8mths to28.2.11CY2009 28.2.11
110 3308 966114 2484 155423 779 280 147
% pcpCY2010 28.2.11
110.3
96.1
308,966
268,773
114.2
103.7
Private
Business
484,155
430,042
423,779
414,761
280,147
279,623
99.4
107.2
39,785
38,130
105.6
149.6
Government
Rental
63,477
57,900
60,096
38,692
40,039
35,564
15
¹ Federal Chamber of Automotive Industries VFacts National Reports

Automotive outlookAutomotive outlook
16

Interest costs managed through strong inventory management
June 2010$
June 2009$
June 2008$
Dec 2010$$m$m$m $m
3,414.9 3,239.9Revenue¹ 3,073.1 1,689.3,
444.9
48
,
449.9
51
Total Group Inventory
Days Supply
,
387.4
46
,
411.8
4448 51y pp y 46 44
60
Inventory/Days Supply
40
50450
Days
$m
30
350
#
17
¹ Continuing operations
20250
June 2008 June 2009 June 2010 Dec 2010
Total Group Inventory Days Supply

Automotive retail’s growth opportunities
• Queensland operations expected to benefit from:‐th i d d d i f t t i b ilt d hi l l t/d d• the increased demand as infrastructure is rebuilt and vehicles lost/damaged are replaced
• key management changes
• Castle Hill, Sydney Property• 4 new dealership sites planned
• Ferntree Gully Toyota, Victoria• Settled November 2010• Integration progressing• Integration progressing
• Acquisition Opportunities
18

Logistics outlookLogistics outlook
19

Solid Logistics result to continue
• Increased contribution from Melbourne/BrisbaneRand Transport
• Increased contribution from Melbourne/Brisbane facility expansions
• Further increases to cold storage facilities planned• Further increases to cold storage facilities planned ‐ Adelaide 5k pallets ‐ 2011 Perth 10k pallets 2012‐ Perth 10k pallets ‐ 2012
KTM
• Performance to remain solid on the back of stable exchange rate
Amcap
g
k20
• Continues to maintain a strong market position

Rand Transport
• Purpose built distribution centres in each mainland stated llSydney, NSW 24,000 pallets
Melbourne, Vic 19,000 palletsB i b Qld 12 000 llBrisbane, Qld 12,000 palletsPerth, WA 10,000 pallets*Ad l id SA 1 000 ll t *Adelaide, SA 1,000 pallets** Development planned for Adelaide in 2011 and Perth in 2012
• Temperature controlled facilities with large cross docking• Temperature controlled facilities, with large cross docking capabilities for LTL (less than trailer load) freight
• Strategically located close to rail heads and major DC’sStrategically located close to rail heads and major DC s• Existing fleet in excess of 520 dedicated to transporting
refrigerated product
21
g p• Dual rail providers allows for extra capacity, peak planning and
spread of loading

Rand’s state‐of‐the‐art technology
• Purpose‐written software keeping the business at the forefront of technologygy
• 3G and satellite tracking enabling continuous monitoring, geo‐fencing, tracking and temperature monitoring (and immediate operator intervention)
• Warehouse management system ‐ traceability from Goods Receipt to Goods DeliveryGoods Delivery
• RF inwards scanning and picking with the ability to handle shipping compliance requirements. Fully integrated to the freight management p q y g g gsystem
• Freight management system with ready access to freight information d i d POD d i F ll i d i h hand associated POD documentation. Fully integrated with warehouse
management system
• Interactive web site ‐ allows customer Login facilitiesInteractive web site allows customer Login facilities22

Rand has invested in new equipment and facilities
23

Positive group outlook
• Acquisition and greenfield opportunities
• Rand contribution to increase following expansion of cold store facilities
• Amcap to continue to maintain a strong market position
• Stable exchange rate expected to lead to improved KTM fperformance
• Solid Automotive performances from WA and NSW with Queensland to benefit from greater demand for vehiclesQueensland to benefit from greater demand for vehicles
• VSE / GTB not expected to recover until FY2012
• Strong management and resilient business model to continue to• Strong management and resilient business model to continue to deliver solid financial results
• Maintain strong business practices• Maintain strong business practices24

Positive economic outlook
• “...the medium term outlook is broadly unchanged ... with strong growth in mining investment and higher commodity prices boosting national income and demand”¹.
• Low unemployment – unemployment rate remains p y p ysteady at 5.0%
• Australian Dollar to remain strongAustralian Dollar to remain strong
• Interest rates expected to rise in the future
25¹ RBA Statement on Monetary Policy February 2011

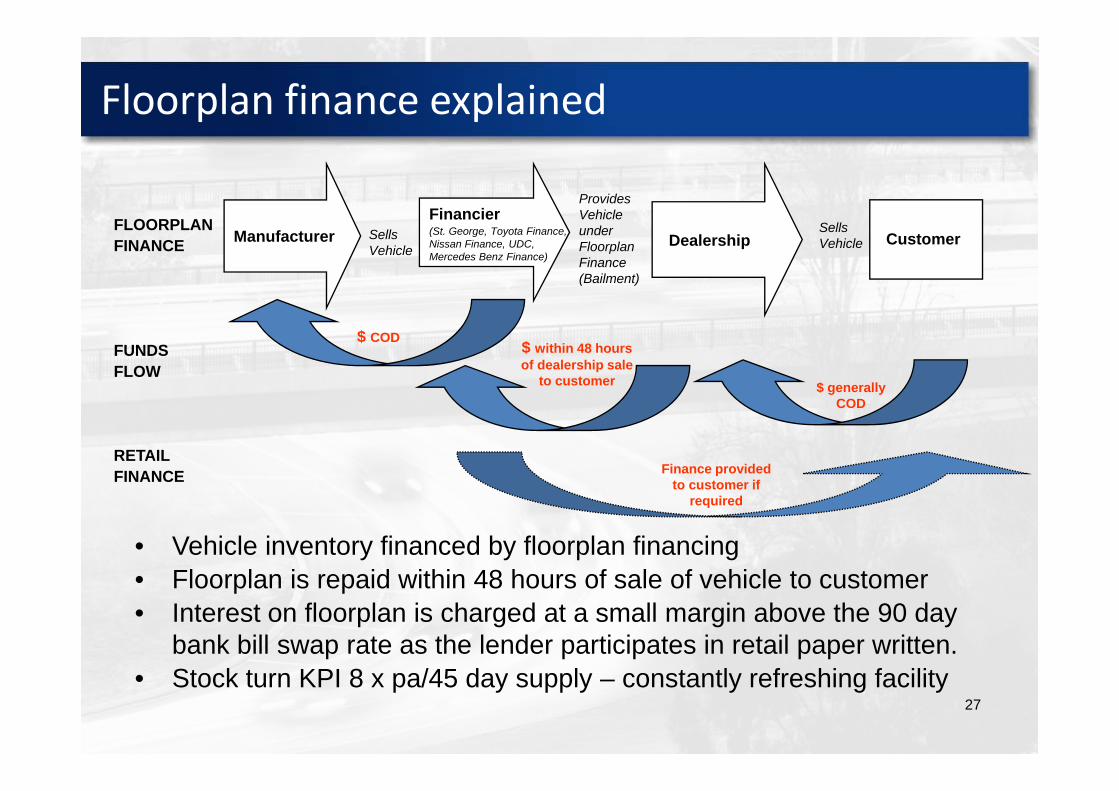
Floorplan finance explained
FinancierProvides Vehicle
ManufacturerFinancier(St. George, Toyota Finance, Nissan Finance, UDC, Mercedes Benz Finance)
Dealership CustomerSellsVehicle
SellsVehicle
FLOORPLANFINANCE
Vehicle under Floorplan Finance (Bailment)
$ generally
$ within 48 hours of dealership sale
to customer
$ CODFUNDS FLOW
COD
RETAILFINANCE Finance provided
to customer if
• Vehicle inventory financed by floorplan financingFloorplan is repaid within 48 hours of sale of vehicle to customer
to customer if required
• Floorplan is repaid within 48 hours of sale of vehicle to customer• Interest on floorplan is charged at a small margin above the 90 day
bank bill swap rate as the lender participates in retail paper written.
27• Stock turn KPI 8 x pa/45 day supply – constantly refreshing facility