eva (economic value added) analysis - …. cpfl piratininga 15. energisa sergipe 16. energisa...
TRANSCRIPT
EVA (Economic Value Added) analysis
February, 2018
Brazilian Electricity Sector2011 - 2016 Executive Summary

2© 2018 KPMG Auditores Independentes, a Brazilian entity and a member firm of the KPMG network of independent member firms affiliated with KPMG International Cooperative (“KPMG International”), a Swiss entity. All rights reserved.
KPMG & Instituto Acende Brasil: EVA (Economic Value Added) analysis - Brazilian Electricity Sector
Disclaimer The information contained herein is of a general nature
and based on authorities that are subject to change. Applicability of the information to specific situations
should be determined through consultation with your financial, regulatory or tax advisers.
KPMG shall have no liability, and shall pursue all available legal and equitable remedies against the recipient, for the unauthorized use or distribution of this report.
The information contained herein were based on information provided by Bloomberg, Capital IQ, ANEEL, ABRAGE, ABRATE, ABRADEE, Factiva, EMIS, company reports and news clips, and KPMG did not verify independently any public information or any information provided to it, in the course of the work. KPMG does not express its opinion as to the accuracy of the information mentioned previously, and notes that any mistake, change or modification of such information could impact significantly its analysis.
During the course of our work, we carried out analysis procedures whenever necessary. However, we emphasize that our work did not constitute an audit of the financial statements or of any other information and should not be interpreted as such.
Any changes in the information provided to KPMG may impact the results of this report. KPMG assumes no responsibility for updating, reviewing or amending this report, as a result of the disclosure of any information subsequent to the date of the issuance of this report.
There is no guarantee that the assumptions, estimates, projections, preliminary or final results, or that the conclusions used or presented in this report will be effectively achieved or verified, partially or completely. KPMG takes no responsibility related to such changes.
Neither KPMG nor its Representatives declare, guarantee or express their opinion, explicitly or implicitly, as to the precision, integrity, or feasibility of any projections or the assumptions they were based on. This report was prepared based on economic, market and other conditions applicable on the date of its issuance. Therefore, the conclusions herein presented are subject to variations related to a variety of factors.
This report does not address personal or specific interests. Thus, the results of analysis that might be performed by third parties might differ from the results of our analysis, and this will not characterize a deficiency in the work performed.
Although the work in which this report was based on was performed by KPMG under technical orientation and independently, the analysis of the different factors that characterize this report, is subjective in nature, such that an analysis performed by other professionals, may express points of view different from those presented by KPMG.
This report may not be released to third parties, copied, published, be used in anyway, nor be filed, included or referred to, partially or completely, in any document without the prior consent of KPMG.

Contents1. Objective
2. EVA: conceptual overview
3. Selected companies
4. Methodology and assumptions
5. Preliminary EVA results (2011-2016)
6. Conclusions and recommendations
7. Appendix

Objective

5© 2018 KPMG Auditores Independentes, a Brazilian entity and a member firm of the KPMG network of independent member firms affiliated with KPMG International Cooperative (“KPMG International”), a Swiss entity. All rights reserved.
KPMG & Instituto Acende Brasil: EVA (Economic Value Added) analysis - Brazilian Electricity Sector
Study objectiveThe objective of this study is to analyze the EVA of the electricity sector in Brazil from 2011 to 2016 and provide insights about the performance of the electricity business segments (generation, transmission and distribution).

EVA: conceptual overview
7© 2018 KPMG Auditores Independentes, a Brazilian entity and a member firm of the KPMG network of independent member firms affiliated with KPMG International Cooperative (“KPMG International”), a Swiss entity. All rights reserved.
KPMG & Instituto Acende Brasil: EVA (Economic Value Added) analysis - Brazilian Electricity Sector
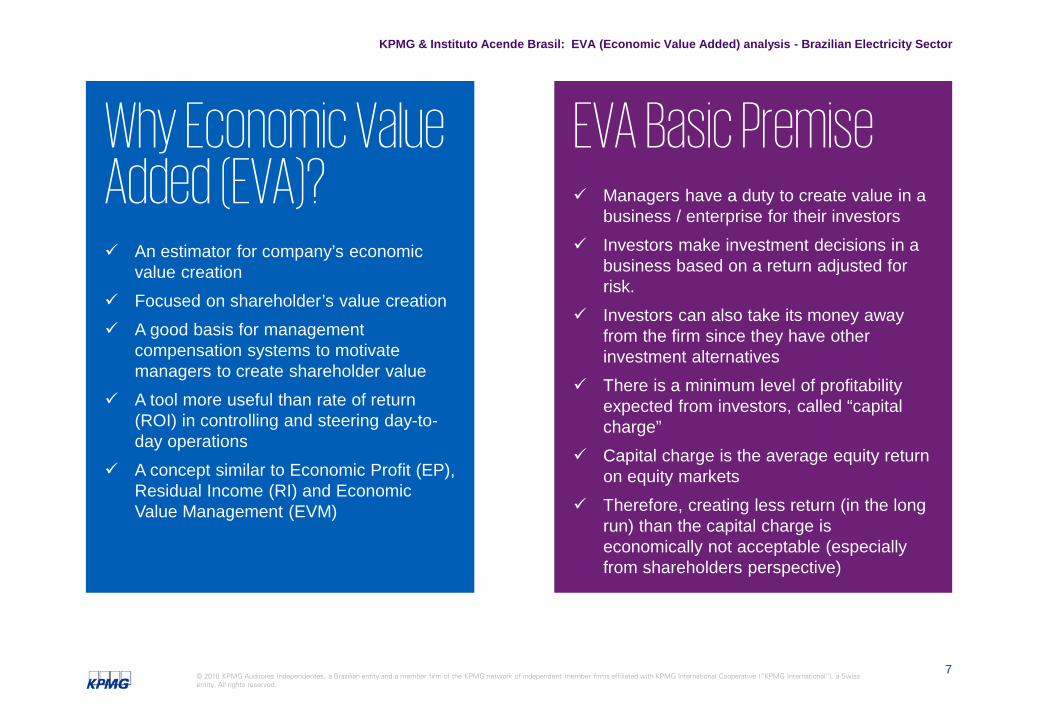
Why Economic Value Added (EVA)? An estimator for company’s economic
value creation Focused on shareholder’s value creation A good basis for management
compensation systems to motivate managers to create shareholder value
A tool more useful than rate of return (ROI) in controlling and steering day-to-day operations
A concept similar to Economic Profit (EP), Residual Income (RI) and Economic Value Management (EVM)
EVA Basic Premise Managers have a duty to create value in a
business / enterprise for their investors Investors make investment decisions in a
business based on a return adjusted for risk.
Investors can also take its money away from the firm since they have other investment alternatives
There is a minimum level of profitability expected from investors, called “capital charge”
Capital charge is the average equity return on equity markets
Therefore, creating less return (in the long run) than the capital charge is economically not acceptable (especially from shareholders perspective)

8© 2018 KPMG Auditores Independentes, a Brazilian entity and a member firm of the KPMG network of independent member firms affiliated with KPMG International Cooperative (“KPMG International”), a Swiss entity. All rights reserved.
KPMG & Instituto Acende Brasil: EVA (Economic Value Added) analysis - Brazilian Electricity Sector
What is needed to calculate the EVA?The following information is required for a company’s EVA calculation: Income Statement Balance Sheet
STEPS:1. Calculate Net Operating Profit After Tax (NOPAT)2. Identify company’s Capital (C)3. Determine a reasonable Capital Cost Rate (CCR)4. Calculate company’s Economic Value Added (EVA)

9© 2018 KPMG Auditores Independentes, a Brazilian entity and a member firm of the KPMG network of independent member firms affiliated with KPMG International Cooperative (“KPMG International”), a Swiss entity. All rights reserved.
KPMG & Instituto Acende Brasil: EVA (Economic Value Added) analysis - Brazilian Electricity Sector
EVA Calculation StepsSTEP1: Calculating NOPAT STEP2: Identify company´s capital
EXAMPLE - CONCEPTUAL
10© 2018 KPMG Auditores Independentes, a Brazilian entity and a member firm of the KPMG network of independent member firms affiliated with KPMG International Cooperative (“KPMG International”), a Swiss entity. All rights reserved.
KPMG & Instituto Acende Brasil: EVA (Economic Value Added) analysis - Brazilian Electricity Sector
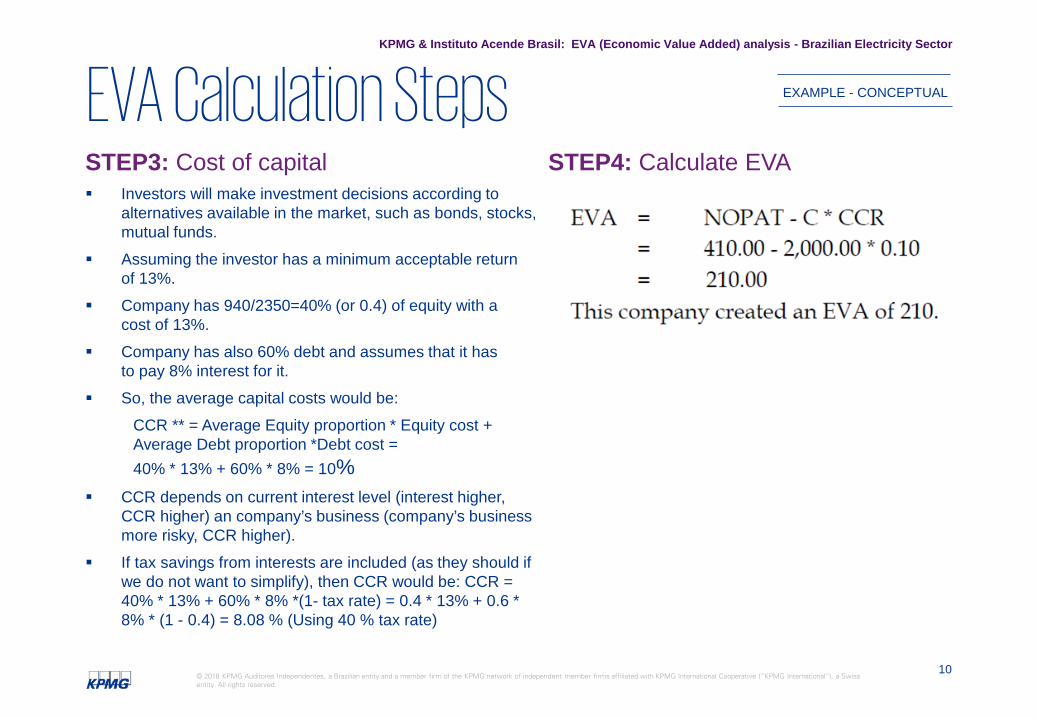
STEP3: Cost of capital Investors will make investment decisions according to
alternatives available in the market, such as bonds, stocks, mutual funds.
Assuming the investor has a minimum acceptable returnof 13%.
Company has 940/2350=40% (or 0.4) of equity with acost of 13%.
Company has also 60% debt and assumes that it hasto pay 8% interest for it.
So, the average capital costs would be:CCR ** = Average Equity proportion * Equity cost + Average Debt proportion *Debt cost = 40% * 13% + 60% * 8% = 10%
CCR depends on current interest level (interest higher, CCR higher) an company’s business (company’s business more risky, CCR higher).
If tax savings from interests are included (as they should if we do not want to simplify), then CCR would be: CCR = 40% * 13% + 60% * 8% *(1- tax rate) = 0.4 * 13% + 0.6 * 8% * (1 - 0.4) = 8.08 % (Using 40 % tax rate)
STEP4: Calculate EVA
EXAMPLE - CONCEPTUALEVA Calculation Steps

Selected companies

12© 2018 KPMG Auditores Independentes, a Brazilian entity and a member firm of the KPMG network of independent member firms affiliated with KPMG International Cooperative (“KPMG International”), a Swiss entity. All rights reserved.
KPMG & Instituto Acende Brasil: EVA (Economic Value Added) analysis - Brazilian Electricity Sector
Selected companies• We analyzed 52 Brazilian companies from
the electricity sector in the generation, transmission and distribution segments.
• Of this sample, 36 companies were selected for the EVA calculation. Sixteen companies were excluded from this study because they did not have sufficient financial information or/and it was not possible to segregate electricity sector activities financial data from the company’s other activities (i.e. oil & gas).

13© 2018 KPMG Auditores Independentes, a Brazilian entity and a member firm of the KPMG network of independent member firms affiliated with KPMG International Cooperative (“KPMG International”), a Swiss entity. All rights reserved.
KPMG & Instituto Acende Brasil: EVA (Economic Value Added) analysis - Brazilian Electricity Sector
Source: ANEEL, ABRAGE, ABRATE, ABRADEE, Capital IQ, Factiva, EMIS, company reports, news clips, KPMG analysis
Generation1. Eletrobras Chesf
2. Eletrobras Furnas
3. Eletrobras Eletronorte
4. Itaipu
5. Engie Brasil Energia
6. Santo Antônio Energia
7. AES Tietê
8. Duke Energy, Geração Paranapanema
9. Cesp
10. Emae
11. CTEE
Generation & Transmission1. Eletrobras GT(*)
2. Cemig GT (*)
3. Copel GT (*)
Transmission1. Isa CTEEP
2. Alupar
3. Taesa
Distribution1. AES Eletropaulo
2. CPFL Paulista
3. Celpa
4. Cemar
5. Light
6. Coelba
7. Celesc
8. Elektro
9. Celg
10. Celpe
(*) Eletrobras, Cemig and Copel do not segregate, in their balance sheet, results
from generation and transmission.
11. Coelce
12. Ampla
13. EDP Bandeirante
14. CPFL Piratininga
15. EnergisaSergipe
16. EnergisaParaíba
17. EnergisaBorborema
18. Energisa MG
19. Energisa Nova Friburgo
Number of companies selected
Type 2011 2012 2013 2014 2015 2016Generation 10 11 11 11 11 10 Transmission 3 3 3 3 3 3 Distribution 19 19 19 19 19 18 Generation & transmission 3 3 3 3 3 2 Total 35 36 36 36 36 33
Selected companies for EVA calculation

14© 2018 KPMG Auditores Independentes, a Brazilian entity and a member firm of the KPMG network of independent member firms affiliated with KPMG International Cooperative (“KPMG International”), a Swiss entity. All rights reserved.
KPMG & Instituto Acende Brasil: EVA (Economic Value Added) analysis - Brazilian Electricity Sector
Comparable companies(excluded companies)
Source: ANEEL, ABRAGE, ABRATE, ABRADEE, Capital IQ, Factiva, EMIS, company reports, news clips, KPMG analysis
Generation Norte Energia (Belo Monte)
Petrobrás
Rio Paraná Energia
Energia Sustentável do Brasil (Jirau)
Eletrobrás Termonuclear
Companhia Hidrelétrica Teles Pires
Amazonas Geração e Transmissão de Energia
Eletrosul
Distribution Caiuá
Vale Paranapanema
Nacional
Bragantina
Força e luz do oeste
Energisa Tocantins
Energisa Mato Grosso do Sul
Energisa Mato Grosso
Although these companies were selected as comparable, they were notincluded in the EVA calculation due to lack of financial information. Regarding Petrobras, it was not possible to segregate electricity sector activities financial data from the company’s other activities (i.e. oil & gas).
Methodology and assumptions

16© 2018 KPMG Auditores Independentes, a Brazilian entity and a member firm of the KPMG network of independent member firms affiliated with KPMG International Cooperative (“KPMG International”), a Swiss entity. All rights reserved.
KPMG & Instituto Acende Brasil: EVA (Economic Value Added) analysis - Brazilian Electricity Sector
EVA calculation
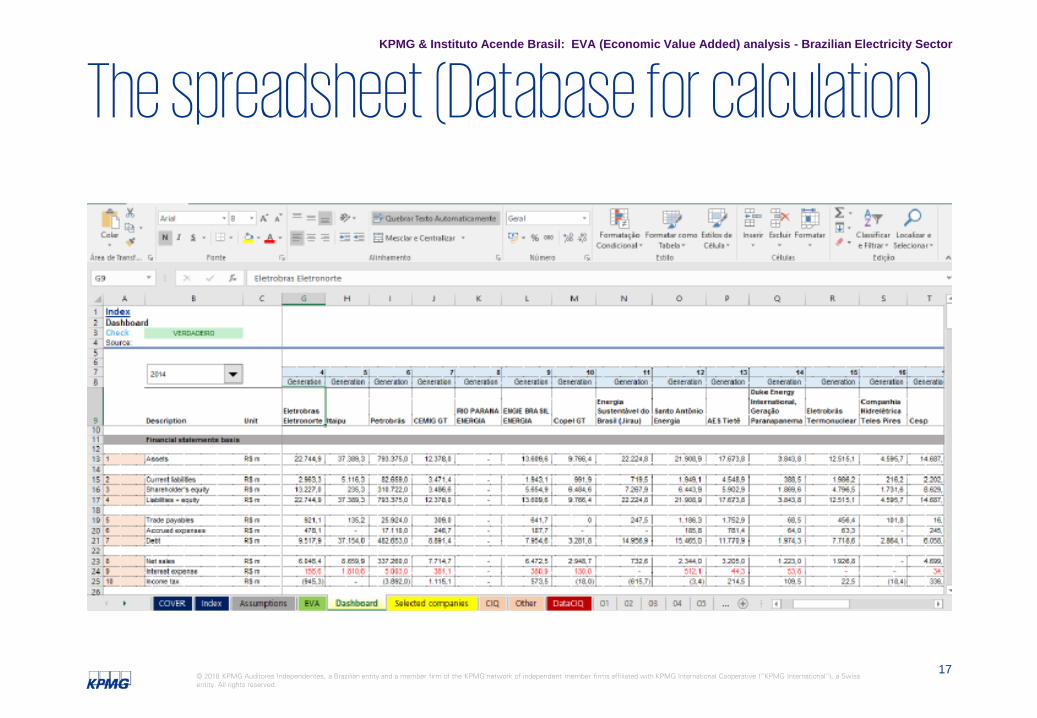
1. Calculate Net Operating Profit After Tax (NOPAT)KPMG compiled data from financial statements of selected industry companies (included in the previous section)
2. Identify company’s Capital (C)KPMG compiled data from financial statements of selected industry companies (included in the previous section)
3. Determine a reasonable Capital Cost Rate (CCR)KPMG calculated the cost of capital using the CAPM methodology
17© 2018 KPMG Auditores Independentes, a Brazilian entity and a member firm of the KPMG network of independent member firms affiliated with KPMG International Cooperative (“KPMG International”), a Swiss entity. All rights reserved.
KPMG & Instituto Acende Brasil: EVA (Economic Value Added) analysis - Brazilian Electricity Sector
The spreadsheet (Database for calculation)
18© 2018 KPMG Auditores Independentes, a Brazilian entity and a member firm of the KPMG network of independent member firms affiliated with KPMG International Cooperative (“KPMG International”), a Swiss entity. All rights reserved.
KPMG & Instituto Acende Brasil: EVA (Economic Value Added) analysis - Brazilian Electricity Sector
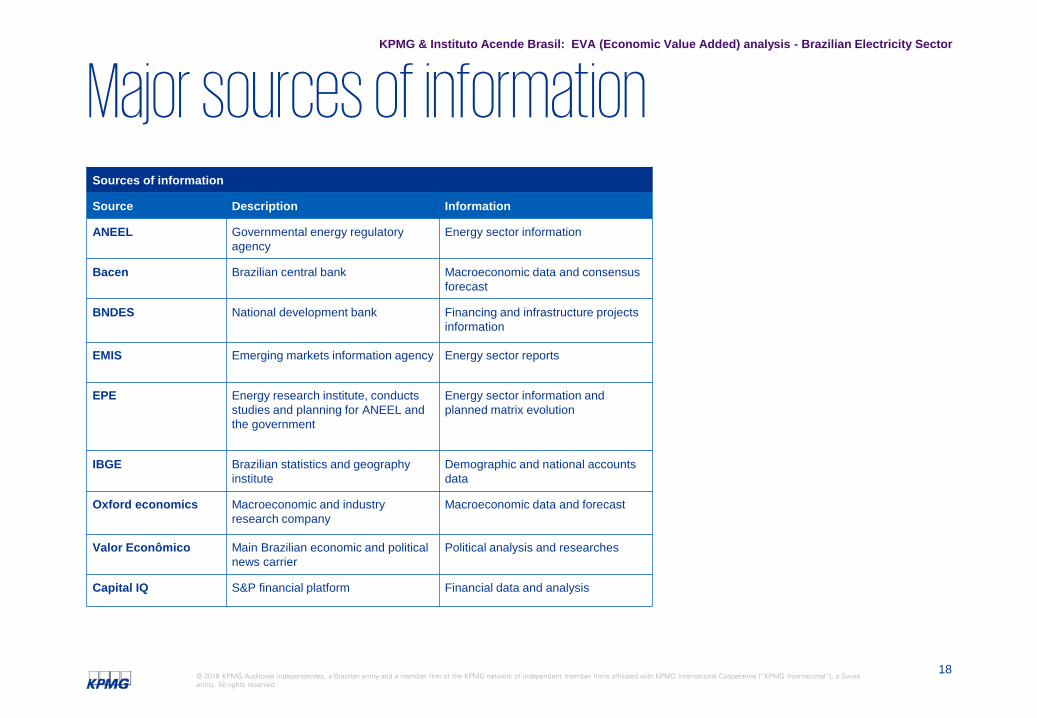
Major sources of informationSources of information
Source Description Information
ANEEL Governmental energy regulatoryagency
Energy sector information
Bacen Brazilian central bank Macroeconomic data and consensusforecast
BNDES National development bank Financing and infrastructure projectsinformation
EMIS Emerging markets information agency Energy sector reports
EPE Energy research institute, conductsstudies and planning for ANEEL and the government
Energy sector information and planned matrix evolution
IBGE Brazilian statistics and geography institute
Demographic and national accounts data
Oxford economics Macroeconomic and industry research company
Macroeconomic data and forecast
Valor Econômico Main Brazilian economic and political news carrier
Political analysis and researches
Capital IQ S&P financial platform Financial data and analysis

19© 2018 KPMG Auditores Independentes, a Brazilian entity and a member firm of the KPMG network of independent member firms affiliated with KPMG International Cooperative (“KPMG International”), a Swiss entity. All rights reserved.
KPMG & Instituto Acende Brasil: EVA (Economic Value Added) analysis - Brazilian Electricity Sector
Assumptions for the calculations
As the industry´s participants are not all listed companies, it is not possible to determine their market value indicators and MVA.
NOPAT was calculated based on the information gathered from financial statements.
Cost of equity was determined using the CAPM model.
A distinct cost of equity was used for the three segments of the market evaluated: Generation, Transmission and Distribution
Risk-free rate for each year was determined as the average yield of Brazilian government bonds.
Beta coefficient for each year is calculated for the electricity sector using a sample of Brazilian companies market indices.
For each year, expected market return is calculated using compounded annual growth rate of comparable companies of KPMG´s database

20© 2018 KPMG Auditores Independentes, a Brazilian entity and a member firm of the KPMG network of independent member firms affiliated with KPMG International Cooperative (“KPMG International”), a Swiss entity. All rights reserved.
KPMG & Instituto Acende Brasil: EVA (Economic Value Added) analysis - Brazilian Electricity Sector
Discount Rate MethodologyDiscount Rate Establishing the discount rate is a fundamental stage of the
economic valuation. This single factor reflects aspects of a subjective nature, varying from one investor to another, such as opportunity cost and individual perception of investment risk.
WACC (Weighted Average Cost of Capital) The cost of capital for the Company was calculated using
the WACC methodology. WACC takes into consideration various financing components, including debt, cost of equity and hybrid bonds used by companies to finance its cash needs. It is calculated according to the following formula:
CAPM (Capital Asset Pricing Model
The cost of equity for the Company was calculated using the CAPM methodology. Using the CAPM methodology, the cost of equity is calculated according to the following formula:
E/(D+E)*Ke+(D/(D+E)*Kd = WACCWeighted Average Cost of Capital
D/(D+E)
Kd * (1-t)
E/(D+E)
Ke=
*
+
*
Rf
ß* (ERP)
CRP
+
+
(1+Ia)÷
(1+Ibr)x
[((Rf+(β*Rm)+CRP+Rs)+1)/(1+Ia)]*(1+Ibr)-1 = KeCost of Equity
=
Rs+
Rf = Average risk-free returnβ = Beta - specific risk coefficient ERP = Market risk premiumCRP = Country riskRs = Size premiumIa = Long-term inflation in the United StatesIbr = Long-term inflation in BrazilD = Total debtE = Total equityt = Tax rateKd = Cost of debtKe = Cost of equity
21© 2018 KPMG Auditores Independentes, a Brazilian entity and a member firm of the KPMG network of independent member firms affiliated with KPMG International Cooperative (“KPMG International”), a Swiss entity. All rights reserved.
KPMG & Instituto Acende Brasil: EVA (Economic Value Added) analysis - Brazilian Electricity Sector
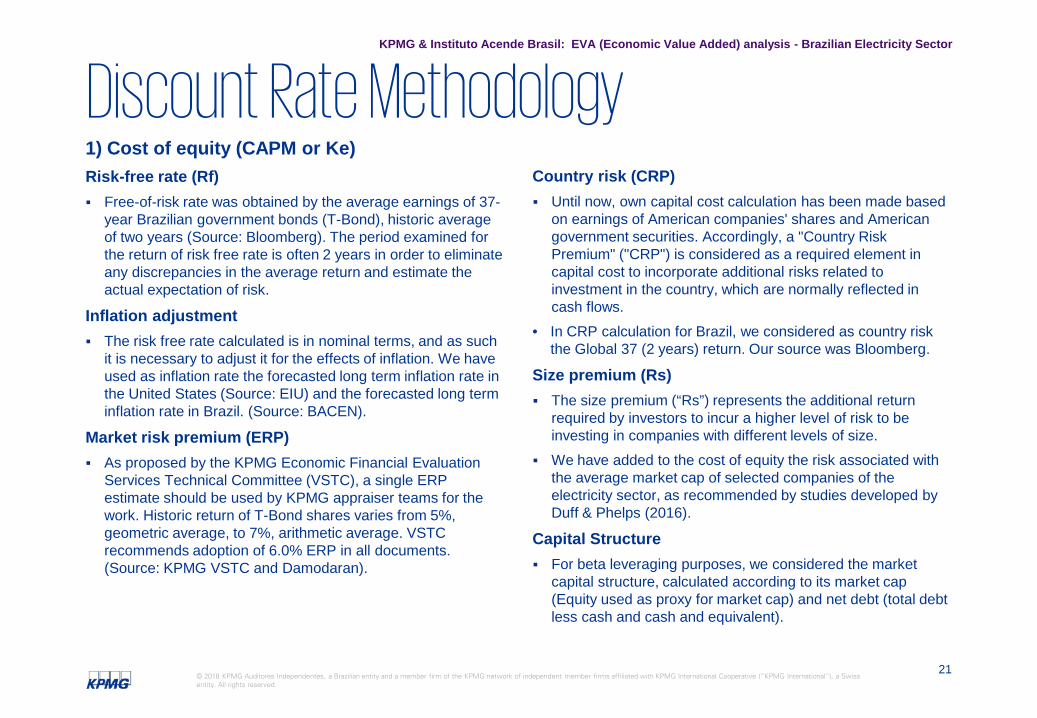
1) Cost of equity (CAPM or Ke)Risk-free rate (Rf) Free-of-risk rate was obtained by the average earnings of 37-
year Brazilian government bonds (T-Bond), historic average of two years (Source: Bloomberg). The period examined for the return of risk free rate is often 2 years in order to eliminate any discrepancies in the average return and estimate the actual expectation of risk.
Inflation adjustment The risk free rate calculated is in nominal terms, and as such
it is necessary to adjust it for the effects of inflation. We have used as inflation rate the forecasted long term inflation rate in the United States (Source: EIU) and the forecasted long term inflation rate in Brazil. (Source: BACEN).
Market risk premium (ERP) As proposed by the KPMG Economic Financial Evaluation
Services Technical Committee (VSTC), a single ERP estimate should be used by KPMG appraiser teams for the work. Historic return of T-Bond shares varies from 5%, geometric average, to 7%, arithmetic average. VSTC recommends adoption of 6.0% ERP in all documents. (Source: KPMG VSTC and Damodaran).
Country risk (CRP) Until now, own capital cost calculation has been made based
on earnings of American companies' shares and American government securities. Accordingly, a "Country Risk Premium" ("CRP") is considered as a required element in capital cost to incorporate additional risks related to investment in the country, which are normally reflected in cash flows.
• In CRP calculation for Brazil, we considered as country risk the Global 37 (2 years) return. Our source was Bloomberg.
Size premium (Rs) The size premium (“Rs”) represents the additional return
required by investors to incur a higher level of risk to be investing in companies with different levels of size.
We have added to the cost of equity the risk associated with the average market cap of selected companies of the electricity sector, as recommended by studies developed by Duff & Phelps (2016).
Capital Structure For beta leveraging purposes, we considered the market
capital structure, calculated according to its market cap (Equity used as proxy for market cap) and net debt (total debt less cash and cash and equivalent).
Discount Rate Methodology

22© 2018 KPMG Auditores Independentes, a Brazilian entity and a member firm of the KPMG network of independent member firms affiliated with KPMG International Cooperative (“KPMG International”), a Swiss entity. All rights reserved.
KPMG & Instituto Acende Brasil: EVA (Economic Value Added) analysis - Brazilian Electricity Sector
2) Cost of debt (Kd) The cost of debt was estimated as the average of comparable
companies Cost of Debt (after tax), provided by Bloomberg.
3) Beta Beta is the specific coefficient of risk of the shares of a company in
relation to a market index that adequately represents the stock market as a whole.
In the case of valuation of companies whose shares are listed and with expressive trading on stock exchanges, the Beta of the share can be calculated by the correlation of its daily returns in relation to the market index.
The effect of taxes from the country where the companies are located, and sector debt, are excluded from the average Beta, and the unleveraged Beta is obtained.
The unleveraged beta of the industry is re-leveraged according to: (i) capital structure of the evaluated Company; and (ii) the effective income tax rate.
The standard practice in the market is to consider global comparable companies in order to calculate the average Beta for the sector since we consider that the portfolio is globally diversified with no barriers to global investment. The comparable companies provided by Bloomberg which we used to calculate the average Beta for the sector.
Discount Rate Methodology

Preliminary EVA results (2011-2016)

24© 2018 KPMG Auditores Independentes, a Brazilian entity and a member firm of the KPMG network of independent member firms affiliated with KPMG International Cooperative (“KPMG International”), a Swiss entity. All rights reserved.
KPMG & Instituto Acende Brasil: EVA (Economic Value Added) analysis - Brazilian Electricity Sector
Source: ANEEL, ABRAGE, ABRATE, ABRADEE, Capital IQ, Factiva, EMIS, company reports, news clips, KPMG analysis
Results Summary – Base and Sensitivity
Consolidated EVA (Base): - R$ 103,5 BiConsolidated EVA (Sensitivity – without Eletrobras): - R$ 10,9 Bi
4,5 1,6
-4,8 -6,2 -7,6
1,6
-16,2 -15,5
-33,2 -27,5
-34,6
23,5
-40,0
-30,0
-20,0
-10,0
-
10,0
20,0
30,0
2011 2012 2013 2014 2015 2016
EVA (R$ Bi)
Sensitivity Base Case
In the sensitivity analysis we excluded Eletrobras and its subsidiaries, since in 2016 the company received non-recurring revenues that generated a 675% increase in NOPAT from 2015 to 2016.
Conclusions and Recommendations
26© 2018 KPMG Auditores Independentes, a Brazilian entity and a member firm of the KPMG network of independent member firms affiliated with KPMG International Cooperative (“KPMG International”), a Swiss entity. All rights reserved.
KPMG & Instituto Acende Brasil: EVA (Economic Value Added) analysis - Brazilian Electricity Sector
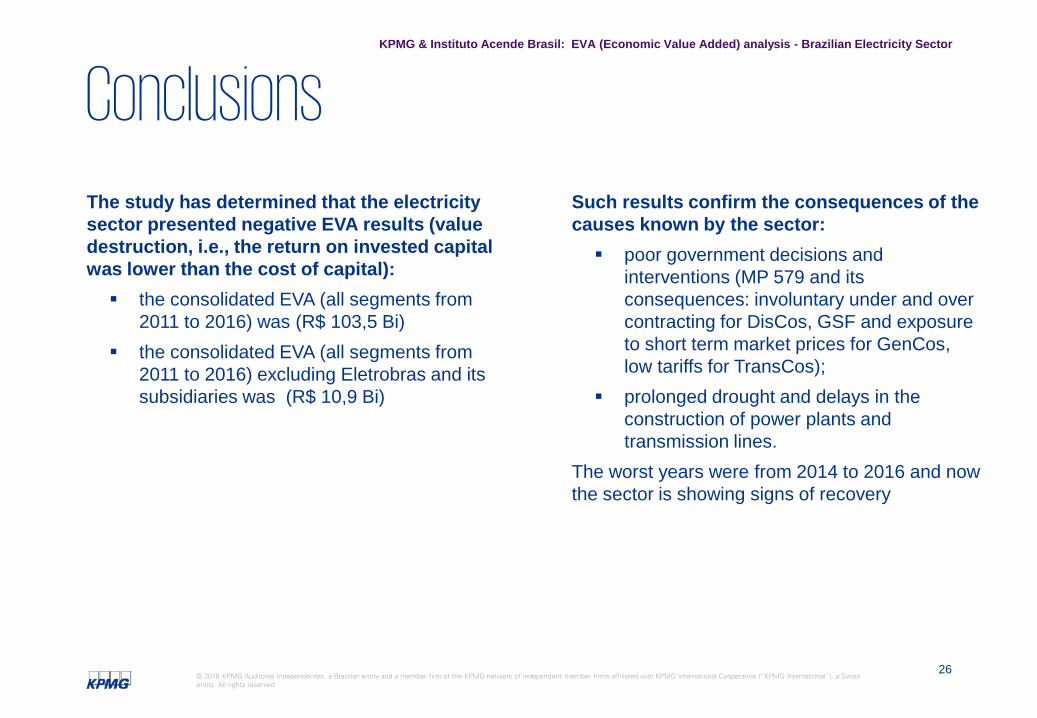
The study has determined that the electricity sector presented negative EVA results (value destruction, i.e., the return on invested capital was lower than the cost of capital): the consolidated EVA (all segments from
2011 to 2016) was (R$ 103,5 Bi) the consolidated EVA (all segments from
2011 to 2016) excluding Eletrobras and its subsidiaries was (R$ 10,9 Bi)
ConclusionsSuch results confirm the consequences of the causes known by the sector: poor government decisions and
interventions (MP 579 and its consequences: involuntary under and over contracting for DisCos, GSF and exposure to short term market prices for GenCos, low tariffs for TransCos);
prolonged drought and delays in the construction of power plants and transmission lines.
The worst years were from 2014 to 2016 and now the sector is showing signs of recovery

27© 2018 KPMG Auditores Independentes, a Brazilian entity and a member firm of the KPMG network of independent member firms affiliated with KPMG International Cooperative (“KPMG International”), a Swiss entity. All rights reserved.
KPMG & Instituto Acende Brasil: EVA (Economic Value Added) analysis - Brazilian Electricity Sector
Recommendations
Avoid government intervention Increase predictability and allow sector to
produce positive (or at least close to zero) EVAs
Express “real world” conditions in the WACC calculation

© 2018 KPMG Auditores Independentes, a Brazilian entity and a member firm of the KPMG network of independent member firms affiliated with KPMG International Cooperative (“KPMG International”), a Swiss entity. All rights reserved.
The KPMG name and logo are registered trademarks or trademarks of KPMG International.
/kpmgbrasil
www.kpmg.com.br
www.acendebrasil.com.br
Thank you