eval soil test reports eastern region...
TRANSCRIPT

Interpreting Soil Test Reports and F tili S O tiFertilizer Source Options
Eastern Extension Agent Training, September 25, 2006September 25, 2006
by Clain Jones, Extension Soil Fertility Specialistl i j@ d 406 994 60 [email protected]; 406 994-6076

Your QuestionsYour Questions
• How do I interpret a Soil Test Report?• What are fertilizer options for small grains?What are fertilizer options for small grains?• What info exists on ESN (Environmentally
Sound Nitrogen) and is it worthwhile?Sound Nitrogen) and is it worthwhile?• How are urea applications managed
diff tl th i it tdifferently than ammonium nitrate applications?

What should you first look for on a il ?soil test report?
• Depth – should have at least a 0-6 in. section• Nitrate-N – Is it in lb/ac or ppm? If in ppm, you pp pp y
need to convert to lb/ac: 2 x ppm x depth/6 in. and add up separate depths.
• Is phosphorus measured as Olsen P or Bray P? (MSU guidelines are for Olsen P and there are
t d i b t th 2)not good conversions between the 2).


What else should I look for?“Good”
TestGood range Possible problem
Soil pH 6-8 Low-poor nodulation; High-can indicate high Na.
Organic Matter (O M )
2-8% Low-poor water holding capacity, low nutrient release; High-Cu deficiency salts if from manure
Soil pH 6-8 p ; g gEither high or low-can tie up P
(O.M.) release; High Cu deficiency, salts if from manure
“EC” or salts < 4 mmho/cm Poor water uptake, decreased yields
Nitrate-N 10-100 ppm Low-chlorosis; High-’burn’ if hot, dryNitrate N 10 100 ppm Low chlorosis; High burn if hot, dry
Olsen Phosphorus (P)
16-60 ppm Low-poor energy storage, root growthHigh-possible Zn deficiency or P losses
Potassium (K) 250-700 ppm
Low-chlorosis, short internodesHigh-possible Ca deficiency
Zinc (Zn) > 0 5 ppm Low-stunted growth interveinal chlorosisZinc (Zn) > 0.5 ppm Low stunted growth, interveinal chlorosis

Any red flagsAny red flags here?

What else do you see on soil test
reports?

Fertilizer RecommendationsFertilizer Recommendations• Use EB 161. Point out ‘Guidelines’
• Nitrogen: Need yield potential. Spring wheat – 3.3 lb N/buWinter wheat – 2 6 lb N/buWinter wheat 2.6 lb N/buMalt barley – 1.2 lb N/buGrass – 25 lb N/ton
• Fertilizer N = Available N (from table)- spring soil N (lb N/ac) (-25 lb N/ac if fall soil N)- 10 lb N/ac if previous crop was an annual legume, 40 lb N/ac if previous crop was alfalfa- 20 lb N/ac if > 3% O.M.+ 10 lb N/ac per 1000 lb of residue/ac if N will be topdressed on+ 10 lb N/ac per 1000 lb of residue/ac if N will be topdressed on stubble (up to 40 lb N/ac)

How estimate straw residue?How estimate straw residue?
• Need previous yield (bu/ac) and test weightNeed previous yield (bu/ac) and test weight (lb/bu)
• Grain yield (lb/ac) = Yield x test weight• Grain yield (lb/ac) = Yield x test weight• Straw yield (lb/ac) = Grain yield x 1.67 (ww)
G i i ld 1 33 ( )Grain yield x 1.33 (sw)• Residue = straw yield – straw baled
Need help? Call or email meNeed help? Call or email me.

Questions for you:Questions for you:
• Why might more N be needed this comingWhy might more N be needed this coming year in recrop areas that received good moisture in ’06?moisture in 06?
• Why might less N be needed this coming year for crops being seeded into fallowyear for crops being seeded into fallow that received good moisture?

QUESTIONS?

What else should you and the grower consider in selecting Ngrower consider in selecting N
rate?• Cost of fertilizer• Expected price/bu• Expected size of
discounts
Spring Wheat - Medium Yield Potential
$160$180 60
Yi ldProfit
$80$100$120$140$ 60
venu
e/A
cre
30
40
50
(Bu/
Acr
e)
Yield
$0$20$40$60$80
Net
Rev
0
10
20
Yie
ld Assumes:
$4.00/bu, $0.35/lb N$
0 30 60 90 120
150
180
210
240
270
300
330
Total Available N
http://www.montana.edu/extensionecon/software/FertilizerCostBenefit.xls

Phosphorus and Potassium Fertilization Strategies
1. Sufficiency Approach – Do you want to apply i i t i i i ld i t
Phosphorus and Potassium Fertilization Strategies
minimum necessary to maximize yield in most years? If so, use Table 18 (P) and Table 19 (K).
2 Maintenance Approach Do you want to replace2. Maintenance Approach – Do you want to replace the nutrients removed at harvest? If so, use Table 21.
3. Build Approach – Do you want to build your soil P and K, to minimize yield losses and save on f tili i f t ? If dd t ffertilizer in future years? If so, add amounts from 1 and 2.
What might grower’s answer depend upon?
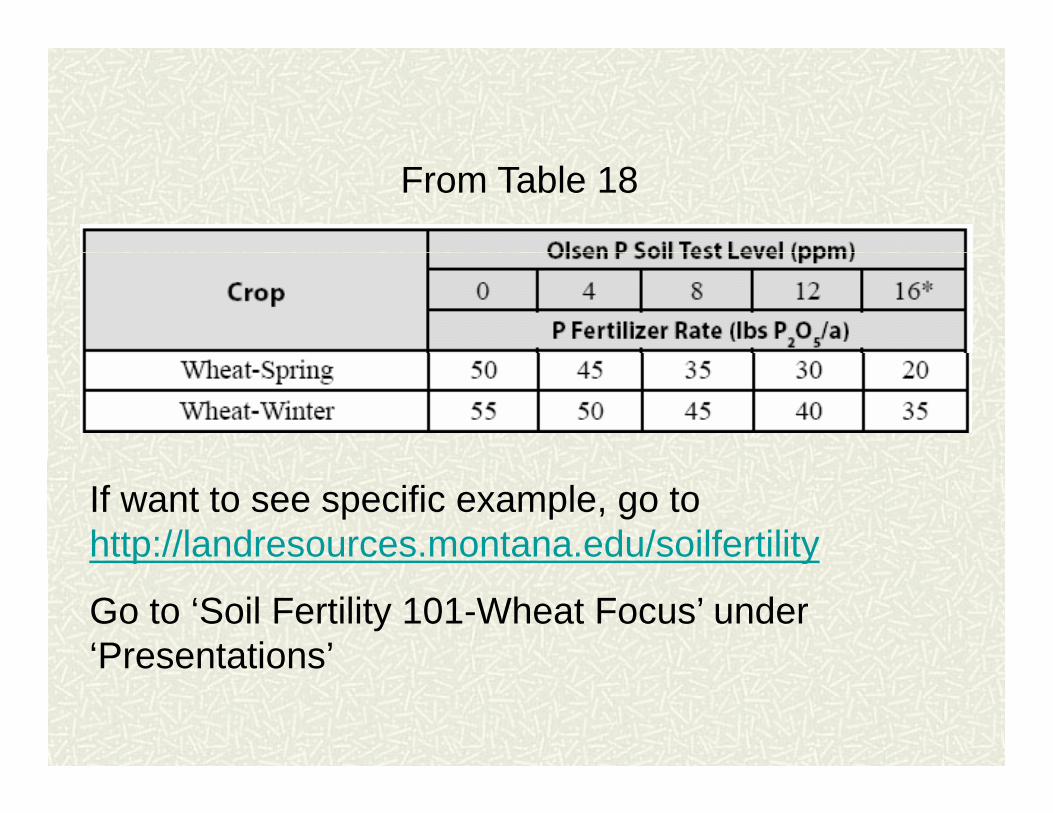
From Table 18
If want to see specific example, go to http://landresources.montana.edu/soilfertilityp y
Go to ‘Soil Fertility 101-Wheat Focus’ under ‘Presentations’Presentations

QUESTIONS?

N Source OptionsN Source Options• Urea (46-0-0)( )• UAN liquid (28-0-0)• Anhydrous ammonia (82-0-0)y ( )• Ammonium nitrate (limited supplies)• Ammonium sulfate (21-0-0-24). Expensive per lb
of N, but S can increase protein, esp. in dry years.
• CRNs Controlled release nitrogen such as• CRNs - Controlled release nitrogen, such as ESN.
• Urease inhibitors –Applied to urea to decreaseUrease inhibitors Applied to urea to decrease volatilization, such as Agrotain.

Controlled Release NControlled Release N• Made with polymer coatings to:p y g
–Decrease leaching–Decrease volatilizationEx: In 124 studies ESN increased corn yield anEx: In 124 studies, ESN increased corn yield an average of 7 bu/ac over urea (Blaylock and Tindall, 2006). Increase likely due to decreased volatilization.
ESN Cost? $50 -$70 more per ton. Net economic gain on corn (mainly Midwest)
Worth of CRNs and Agrotain on small grains and forages in Montana? Not enough research yet to say, but benefits likely less due to smaller revenues here yand less potential for volatilization.

Differences between urea and ammonium nitrateammonium nitrate
• Urea is more damaging to seed germinationImplications: 1. MSU recommends < 30 lb N/ac of AN with seed, but < 15 lb N/ac of UR (crop dependent).2 Recommend a spreader (or wider spreader) so that more UR can2. Recommend a spreader (or wider spreader) so that more UR can be placed near seed.
• Urea has higher potential to volatilizeImplications:1. Urea application should be done during period with cool
temperatures, especially when on moist, sandy soils with residue.2 Urea should be irrigated (>0 5 inches) or tilled in if possible2. Urea should be irrigated (>0.5 inches) or tilled in if possible.
• Urea is not immediately available for plant uptakeImplication: For same effect urea needs to be applied earlier inImplication: For same effect, urea needs to be applied earlier in season, especially if Fall soil test N levels are low (<20-30 lb N/ac).

P Source optionsP Source options•Monoammonium P (MAP) ( )•Diammonium P (DAP) •Liquids (generally more expensive than MAP and DAP)
Generally no yield differences between sources. Exception: Liquids produce higher yields on highly calcareous soils (> 20% CaCO3)
Placement: Need roughly 3 times more P if broadcast than ifPlacement: Need roughly 3 times more P if broadcast than if placed near the seed at Olsen P levels < 8 ppm, and 2 times more P when Olsen P = 8-12 ppm. MSU guidelines assume P will be banded with the seedP will be banded with the seed.

Conclusions
• Given some criteria, soil test reports can be quickly evaluated for potential problems.
• N, P, and K recommendations can be made by , , yknowing how to use EB 161 AND giving the grower some options (e.g. sufficiency vs. build)g p ( g y )
• Different N and P sources generally don’t produce large yield differences. However, goodproduce large yield differences. However, good management of volatile N sources can reduce yield losses in some situations. y

QUESTIONS?QUESTIONS?For more information on N cycling, fertilizer sources, placement and timing see:placement and timing see: http://landresources.montana.edu/nm
For more information on urea volatilization andFor more information on urea volatilization and management, see: http://www.oznet.ksu.edu/library/crpsl2/NCR326.pdfp y p p
MSU Soil Fertility webpage: http://landresources montana edu/soilfertilityhttp://landresources.montana.edu/soilfertility