evaluate the effect of turbine period of … · evaluate the effect of turbine period of vibration...
TRANSCRIPT

Applied Physical Sciences Corp.
475 Bridge Street, Suite 100, Groton, CT 06340
(860) 448-3253 · www.aphysci.com
EVALUATE THE EFFECT OF TURBINE PERIOD OF VIBRATION REQUIREMENTS ON STRUCTURAL DESIGN PARAMETERS: TECHNICAL REPORT OF FINDINGS
Report Number: M10PC00066-8
September 1, 2010
Report Authors:
Brian Petersen
Marty Pollack
Benjamin Connell
David Greeley
Dwight Davis
Charles Slavik
Benjamin Goldman
Presented to: Lori Medley Department of the Interior, Bureau of Ocean Energy Management, Regulation, and Enforcement, Engineering & Research Branch 381 Elden Street MS-4021 Herndon, VA 20170
Contract Name: Evaluate the Effect of Turbine Period of Vibration Requirements on Structural Design Parameters
Contact Number: M10PC00066
Disclaimer: This report has been reviewed by the Bureau of Ocean Energy Management, Regulation, and Enforcement and approved for publication. Approval does not signify that the contents necessarily reflect the views and policies of the Bureau, nor does mention of trade names or commercial products constitute endorsement or recommendation for use.

EVALUATE THE EFFECT OF TURBINE PERIOD OF VIBRATION REQUIREMENTS ON STRUCTURAL DESIGN PARAMETERS
Page 2 of 129
TABLE OF CONTENTS
Executive Summary........................................................................................................................ 7
Introduction................................................................................................................................... 10
State of the Art .............................................................................................................................. 10
Reference Offshore Wind Turbine................................................................................................ 14
Wind Turbine Blade Properties ................................................................................................ 17
Canonical Wind Turbine Site.................................................................................................... 18
Structural Dynamics Model .......................................................................................................... 20
Support Structure Lateral Vibrations ........................................................................................ 21
Support Structure Torsional Vibrations .................................................................................... 26
Coupling Degrees of Freedom.................................................................................................. 29
Blade Vibrations ....................................................................................................................... 30
Support Structure Static Deflections......................................................................................... 32
Support Structure Frequency Response Functions ................................................................... 34
Blade Frequency Response Functions ...................................................................................... 37
AeroElastic Modeling ................................................................................................................... 39
Low Fidelity Model .................................................................................................................. 40
High Fidelity Model.................................................................................................................. 41
External Forcing Mechanisms ...................................................................................................... 42
Aerodynamic Loading .............................................................................................................. 43
Turbine Imbalances................................................................................................................... 47
Vortex-Induced Loading........................................................................................................... 54
Ocean Current Loading............................................................................................................. 56
Ocean Wave Loading................................................................................................................ 57
Gearbox Excitations.................................................................................................................. 66
Aerodynamic Unsteadiness....................................................................................................... 67
Structural Mechanics Modeling.................................................................................................... 75
Limit State Evaluation .................................................................................................................. 83
Design Sensitivity Studies ............................................................................................................ 91
Foundation Properties ............................................................................................................... 92
Rotor-Nacelle Assembly (RNA) Inertia ................................................................................... 94
Support Structure Effective Stiffness........................................................................................ 96
Water Depth .............................................................................................................................. 97
Aerodynamic Damping............................................................................................................. 98
Structural Damping................................................................................................................... 99
Hydrodynamic Added Mass ................................................................................................... 100
Synthesizing Analyses ................................................................................................................ 100
Vibration Mitigation And Resonance Avoidance Techniques ................................................... 103
Controllable Speed Turbines................................................................................................... 103
Breakwaters............................................................................................................................. 104
3P Mitigation Techniques ....................................................................................................... 111

EVALUATE THE EFFECT OF TURBINE PERIOD OF VIBRATION REQUIREMENTS ON STRUCTURAL DESIGN PARAMETERS
Page 3 of 129
Advanced Turbine Designs......................................................................................................... 112
Vertical Axis Wind Turbines .................................................................................................. 112
Gearbox-less Wind Turbines .................................................................................................. 114
Floating Wind Turbines .......................................................................................................... 121
References................................................................................................................................... 128
EVALUATE THE EFFECT OF TURBINE PERIOD OF VIBRATION REQUIREMENTS ON STRUCTURAL DESIGN PARAMETERS
Page 4 of 129
LIST OF FIGURES
Figure 1: Structural Design Regimes for Offshore Wind Turbines.............................................. 11
Figure 2: Sparse (left) and dense (right) Campbell diagrams for a representative offshore wind
turbine design................................................................................................................................ 12
Figure 3: Approach for synthesizing analyses for the purposes of this effort. ............................. 13
Figure 4: Coordinate Systems and Terminology for Support Structure Vibration Model .......... 16
Figure 5: Distributed blade properties for canonical 5MW offshore wind turbine. ..................... 18
Figure 6: Soil subgrade modulus for estimation of “p-y” curve characteristics [4]...................... 19
Figure 7: Structural Dynamics Beam Model for Wind Turbine Support Structure with Lumped
Parameter Treatment of Foundation and Fluid-Structure Interaction........................................... 20
Figure 8: Verification of Lateral Support Structure Mode Shapes against Canonical Cantilever
Beam Solution [2] ......................................................................................................................... 25
Figure 9: Verification of Torsional Support Structure Mode Shapes against Canonical Fixed-
Free Shaft Solution [2].................................................................................................................. 28
Figure 10: Static Surge Deflection of Support Structure due to Steady Turbine Drag................. 33
Figure 11: Static Sway Deflection of Support Structure due to Generator Power-Takeoff ......... 34
Figure 12: Lateral Surge Dynamic Amplification ........................................................................ 35
Figure 13: Lowest Lateral Surge Mode Shapes............................................................................ 37
Figure 14: Dynamic amplification of flapwise blade motion at r/R=0.2...................................... 38
Figure 15: Dynamic amplification of edgewise blade motion at r/R=0.2. ................................... 39
Figure 16: Important Forcing Mechanisms Acting on Wind Turbine System ............................. 43
Figure 17: Computed axial inflow velocities for NREL 5MW turbine. ....................................... 44
Figure 18: Blade section lift coefficient as a function of radius, r/R, for different harmonics of
rotor rate. The lift coefficients are defined in terms of the local section chord and inflow
velocity.......................................................................................................................................... 46
Figure 19: Depiction of static and dynamic imbalance of the wind turbine. Static imbalance
relates to the center of mass not being coincident with the center of rotation in the plane of the
disk. Dynamic imbalance comes from angular momentum vector not being aligned with the axis
of rotation due to blade centers of mass not being in a plane perpendicular to the axis of rotation.
....................................................................................................................................................... 48
Figure 20: Magnitude of the force and moment due to static imbalance vs the blade mass error
ratio for the 5MW reference wind turbine. ................................................................................... 49
Figure 21: Magnitude of the 1P moment at the top of the tower due to dynamic imbalance, as a
function of the angle ..................................................................................................................... 51
Figure 22: Outline of net 1P tower loading due to steady blade load........................................... 51
Figure 23: Diagram of the steady blade forcing components, as they change direction through the
cycle of rotation. ........................................................................................................................... 52
Figure 24: 1P force and moment magnitude as a function of the pitch error in aerodynamic
imbalance. Considering one of three blades to have positive pitch error and one to have negative
pitch error...................................................................................................................................... 54

EVALUATE THE EFFECT OF TURBINE PERIOD OF VIBRATION REQUIREMENTS ON STRUCTURAL DESIGN PARAMETERS
Page 5 of 129
Figure 25: Sectional lift and drag natural frequencies as a function of height on the tower, based
on linearly tapered tower diameter and logarithmic wind profile................................................. 55
Figure 26: Steady drag, and unsteady lift and drag as a function of height on the tower for the
tapered tower diameter in a logarithmic boundary layer. ............................................................. 56
Figure 27: Wave climate data from NOAA METOC buoy near Block Island............................. 58
Figure 28: Wave climate data from NOAA METOC buoy near Block Island............................. 59
Figure 29: Comparison between in situ ocean wave spectra measurements and JONSWAP wave
spectrum (black curve) at a significant waveheight 1.0 meter and a peak frequency of 0.2 Hz. 61
Figure 30: Comparison between design wave spectra. ................................................................. 62
Figure 31: Unsteady wave loading on tower for different design wave conditions. .................... 64
Figure 32: Pile response (displacement and bending moment) at the mudline under linear wave
forcing. .......................................................................................................................................... 65
Figure 33: Mudline pile response spectra (displacement and bending moment) under linear wave
forcing for design wave conditions 1-4. ....................................................................................... 66
Figure 34: Wind spectral density function for the design conditions of the notional 5MW
offshore wind turbine. ................................................................................................................... 69
Figure 35: The Sears gusting problem for a wind turbine. ........................................................... 70
Figure 36: Decomposing the wind turbine gust problem to vertical and horizontal components
incident on the blade. .................................................................................................................... 70
Figure 37: Unsteady loading transmitted to RNA due to blade forcing from wind gusts. ........... 72
Figure 38: Blade forcing spectra due to gusts for the operating condition of the wind turbine. .. 73
Figure 39: Mudline displacement and bending moment due to unsteady wind forcing on the
tower. ............................................................................................................................................ 74
Figure 40: Mudline displacement and bending moment response spectra due to unsteady wind
forcing on the tower in the system’s design condition. ................................................................ 75
Figure 41: Fundamental natural mode displacement, bending moment, and shear force response
of support structure to harmonic loading at the RNA................................................................... 77
Figure 42: Fourth natural mode displacement, bending moment, and shear force response of
support structure to harmonic loading at the RNA. ...................................................................... 78
Figure 43: Typical structural design of wind turbine blades includes internal stiffeners that run
along the blade span [1]. ............................................................................................................... 81
Figure 44: Differential element of pile for analyzing 2D stress state in cross section of beam.
Note that the thickness of the pile has been increased for clarity. ................................................ 82
Figure 45: Stress distribution around the circumference of the pile at the mudline for static RNA
loading in operating condition. ..................................................................................................... 83
Figure 46: Strategy for Generalized Fatigue Life Assessment ..................................................... 86
Figure 47: Fatigue life estimation for 3P aerodynamic forcing. ................................................... 87
Figure 48: Fatigue life estimation for 6P aerodynamic forcing. ................................................... 88
Figure 49: Fatigue life estimation for incident wave loading. ...................................................... 89
Figure 50: Fatigue life estimation for unsteady moments due to turbine imbalances. ................. 90
Figure 51: Fatigue life estimation for unsteady blade forcing due to wind gusts......................... 91
Figure 52: Influence of Soil Stiffness on Support Structure Lateral Dynamics ........................... 93

EVALUATE THE EFFECT OF TURBINE PERIOD OF VIBRATION REQUIREMENTS ON STRUCTURAL DESIGN PARAMETERS
Page 6 of 129
Figure 53: Influence of Foundation Scour Depth on Support Structure Lateral Dynamics ......... 94
Figure 54: RNA mass design sensitivity study. ............................................................................ 95
Figure 55: Second moment of area design sensitivity study......................................................... 96
Figure 56: RNA support structure height sensitivity study. ......................................................... 97
Figure 57: Water depth sensitivity study. ..................................................................................... 98
Figure 58: Aerodynamic damping sensitivity study. .................................................................... 99
Figure 59: Structural damping sensitivity study. ........................................................................ 100
Figure 60: Incident wave pattern. ............................................................................................... 107
Figure 61: Diffracted wave pattern. ............................................................................................ 108
Figure 62: Total wave pattern (incident plus diffracted by breakwater) and optimal location of
pile............................................................................................................................................... 109
Figure 63: Diffracted incident wave velocities in a long-crested 4 second wave....................... 110
Figure 64: Diffracted incident wave velocities in a long-crested 10 second wave..................... 111
Figure 65: Typical wind turbine power takeoff configuration.................................................... 114
Figure 66: Typical gearbox failure. [22]..................................................................................... 115
Figure 67: The major components of a magnetic gear. .............................................................. 117
Figure 68: Magnetic gear block diagram showing contra-rotating concept. When both the outer
rotor and the pole-pieces rotate with the same speed in opposite directions, the resulting gear
ratio is doubled. [26] ................................................................................................................... 118
Figure 69: Comparison between Mechanical Planetary Gear and Magnetic Gear ..................... 121
Figure 70: Drawing indicating the key mechanical components of the floating wind turbine
system. ........................................................................................................................................ 122
Figure 71: Three categories of floating platforms. ..................................................................... 123
Figure 72: Depiction of the real system and simple lumped parameter models for the fixed and
floating turbines. ......................................................................................................................... 124
Figure 73 - Time history of the RNA displacement (normalized by the initial displacement) for
the free response with quadratic initial displacement of the support structure........................... 125
LIST OF TABLES
Table 1: Principal Characteristics NREL 5-MW Reference Offshore Wind Turbine ................. 14
Table 2: RNA Inertial Characteristics NREL 5-MW Reference Offshore Wind Turbine .......... 17
Table 3: Turbine Characteristics for NREL 5-MW Reference Offshore Wind Turbine ............. 18
Table 4: Summary of Aerodynamic Forcing Transmitted Through RNA at Turbine Design
Condition....................................................................................................................................... 46
Table 5: Design Wave Characteristics.......................................................................................... 58
Table 6: RMS Mudline Bending Moment for Wave Frequencies between 0.2 and 0.3 Hz ........ 66
Table 7: Breakwater Configurations Analyzed........................................................................... 106
Table 8: Comparison of Three Common Wind Turbine Generator Systems [8]........................ 116

EVALUATE THE EFFECT OF TURBINE PERIOD OF VIBRATION REQUIREMENTS ON STRUCTURAL DESIGN PARAMETERS
Page 7 of 129
EXECUTIVE SUMMARY
Coincidence of structural resonances with wind turbine dynamic forces can lead to large amplitude stresses
and subsequent accelerated fatigue. For this reason, the wind turbine rotor blades and support structure are
designed to avoid resonance coincidence. In particular, the current practice is to design the wind turbine
support structure such that the tower fundamental resonance does not coincide with the fundamental
rotational (1P) and blade passing (3P for three-bladed turbines) frequencies of the rotor. These forcing
frequencies are dominant vibration sources and are associated with rotor imbalance and non-uniform flow
over the blades as they rotate. This design practice is reflected in the wind turbine period of vibration
requirements, adherence to which results in systems with fundamental support structure bending frequencies
in the frequency band between 1P and 3P. This resonance avoidance approach has significant consequences
for the structural design of offshore wind turbines and can result in wind turbines with large diameter piles.
In this effort, Applied Physical Sciences determined the impact of period of vibration requirements on the
structural design of offshore wind turbines; identified and evaluated potential vulnerabilities in this design
approach; performed a tradeoff study of potential resonance avoidance and vibration mitigation techniques
for offshore wind turbines; and assessed the impact that advanced and novel design concepts have on the
structural design and dynamic response of offshore wind turbines. In order to accomplish these objectives,
APS leveraged a deep physics-based understanding of the underlying structural dynamic, aerodynamic,
hydrodynamic, and rotating machinery processes required for the analysis of offshore wind turbines. To that
end, a suite of computational tools was developed and assembled to perform design sensitivity studies that
informed the selection and analysis of alternate vibration mitigation and resonance avoidance strategies.
Key conclusions from this study include:
• For the 5MW NREL reference wind turbine, the interaction of higher frequency resonances with
sources other than 1P and 3P, identified early on as a potential vulnerability in the soft-stiff design
approach, do not contribute significantly to the wind turbine support structure fatigue damage
accumulation. Only those sources that interact with the fundamental support structure bending
mode contribute to the support structure fatigue damage accumulation.
• As a result, ambient sources such as wind gusts and ocean wave loading, which are processes with
energy at that important support structure natural frequency, are extremely important contributors to
the fatigue damage of the 5MW NREL reference wind turbine. Properly characterizing wind and
wave climate at potential sites is therefore extremely important when performing fatigue life
assessment during the design of offshore wind turbines.
• Aerodynamic damping, an aeroelastic effect that mitigates blade and global support structure

EVALUATE THE EFFECT OF TURBINE PERIOD OF VIBRATION REQUIREMENTS ON STRUCTURAL DESIGN PARAMETERS
Page 8 of 129
vibrations, is a dominant dissipative mechanism for the fundamental support structure bending mode
in offshore wind turbine systems, serving to reduce vibration levels and increase fatigue life. The
effectiveness of the aerodynamic damping is maximized with light nacelles and turbines and/or by
designing the wind turbine system to be soft (with care not to align the fundamental mode with
important ambient sources). It should also be noted that the aerodynamic damping effect is
significantly diminished in parked operation.
It is interesting to note that while the reference wind turbine as defined by NREL does technically
adhere to the “soft-stiff” design philosophy, the fundamental support structure resonance of
approximately 0.25Hz is still very near the operating 1P frequency of the turbine (~0.2Hz). That the
unsteady 1P loading due to turbine imbalances was deemed important despite the fact that the
NREL turbine adheres to the “soft-stiff” design methodology suggests that designers should not
only consider discrete coincidence of 1P and 3P with the fundamental support structure resonance
but should also acknowledge the fact that the dynamic amplification associated with the fundamental
resonance has finite bandwidth. In addition, researches should be cognizant that the results of
studies performed on the NREL turbine, particular with respect to the dynamic interaction of forces
with 3P, may not be representative of turbines with resonant frequencies appearing elsewhere in the
1P-3P bandwidth.
The accuracy of predicted aerodynamic blade load amplitudes and system resonant frequencies is
limited. The blade load amplitudes are time dependent on the inflow characteristics, which are
themselves time dependent. The resonant frequencies are sensitive to the soil and foundation
characteristics, which are also time dependent (e.g. scouring effects). Scouring and reduction in
foundation integrity over time are especially problematic because they reduce the fundamental
structural resonance of the support structure, aligning that resonance more closely to the lower
frequencies at which much of the broadband wave and gust energy is contained or align this
resonance more closely with 1P.
In addition to these insights, several vibration mitigation and resonance avoidance strategies are evaluated,
and alternate designs are assessed on the basis of their impact on the structural design of offshore wind
turbines and their effect on the period of vibration requirements. The following conclusions are noted:
Breakwaters and magnetic gears are promising technical solutions for improving the fatigue life of
offshore wind turbines. Properly designed and situated breakwaters can be used to reduce wave
loading on piles. However, these structures must be relatively large to accomplish this reduction, and
therefore a more thorough cost-benefit analysis needs to be performed to assess the full metric of
considerations. Magnetic gears offer a potential solution to wind turbine gearbox reliability concerns

EVALUATE THE EFFECT OF TURBINE PERIOD OF VIBRATION REQUIREMENTS ON STRUCTURAL DESIGN PARAMETERS
Page 9 of 129
and offer potential weight reduction relative to systems utilizing traditional mechanical gears; they
also offer higher efficiency speed conversion than mechanical systems and have inherent overload
protection. However, these systems have only been tested at small scale and need additional
technical development to be feasible for MW-scale offshore wind turbine applications.
Vertical axis turbines were researched thoroughly by Sandia for onshore application; few onshore
installations exist, as there are significant blade vibration concerns and their aerodynamic efficiency is
often surpassed by horizontal axis turbines. However, these systems have several technical merits
offshore, particularly for floating wind turbines, where the center of gravity of the system is an
important design consideration.
Like magnetic gears, wind turbines that utilize direct-drive systems have the potential for reduced
reliability issues. However, all else equal, the generator and gear weight for direct-drive systems has
been shown in the literature to exceed the weight for both mechanical gearboxes and conceptual
magnetic gear designs. There are several approaches to reducing the weight of direct-drive systems,
which is essential from a dynamic standpoint to maximize the effect of aerodynamic damping as well
as from a practical standpoint, as larger more massive nacelle components are more difficult to
transport install. However, some of these techniques, such as smaller diameter higher speed turbines,
result in other potential dynamic issues which the designer must consider. Assuming these concerns
are addressed, direct-drive systems and magnetic gears are both good candidates for solving the
gearbox reliability problem in offshore wind turbines.
Other novel wind turbine concepts, such as floating systems and jacketed foundations, have a
completely different set of period of vibration requirements compared to traditional pile-mounted
systems. In particular, floating systems have an additional set of resonances associated with the rigid
body seakeeping modes of the floating platform that must be considered in the design process.

EVALUATE THE EFFECT OF TURBINE PERIOD OF VIBRATION REQUIREMENTS ON STRUCTURAL DESIGN PARAMETERS
Page 10 of 129
INTRODUCTION
This is the final report for the project entitled “Evaluate the Effect of Turbine Period of Vibration
Requirements on Structural Design Parameters.” This work is sponsored by the Department of the Interior,
Bureau of Ocean Energy Management, Regulation, and Enforcement (BOEMRE) Engineering & Research
Branch under contract no. M10PC00066. This project is a study of resonance coincidence and its impact on
the structural design characteristics of offshore wind turbines. Focus areas are accelerated fatigue resulting
from resonance coincidence and an assessment of strategies to avoid resonance coincidence and minimize its
consequences.
This report provides an overview of project analysis, results, conclusions, and recommendations for follow-
on work. This report details the completion of the following Phase I effort tasks:
1. Compile/assess requirements 2. Evaluate forcing mechanisms 3. Evaluate dominant resonances 4. Assess limit states 5. Tradeoff study of resonance avoidance concepts 6. Assess the impact of advanced turbine designs
STATE OF THE ART
Coincidence of structural resonances with wind turbine dynamic forces can lead to large amplitude stresses
and subsequent accelerated fatigue. For this reason, the wind turbine rotor blades and support structure are
designed to avoid resonance coincidence. In particular, the current practice is to design the wind turbine
support structure such that the tower fundamental resonance does not coincide with the fundamental
rotational (1P) and blade passing (3P for three-bladed turbines) frequencies of the rotor. These forcing
frequencies are dominant vibration sources and are associated with rotor imbalance and non-uniform flow
over the blades as they rotate. This design practice is reflected in the wind turbine period of vibration
requirements.
The state of the art approach for avoiding resonance coincidence is to position the fundamental resonance
such that it does not coincide with those dominant sources over the operating speed range of the wind
turbine. This can be achieved by positioning the resonance frequency below both forcing functions (i.e.
“soft-soft”), between both forcing functions (i.e. “soft-stiff”), or above both forcing functions (“stiff-stiff”).
A resonance diagram, such as the one shown in Figure 1, is often used to visualize the important system
resonances and forcing mechanisms germane to the offshore wind turbine system.

EVALUATE THE EFFECT OF TURBINE PERIOD OF VIBRATION REQUIREMENTS ON STRUCTURAL DESIGN PARAMETERS
Page 11 of 129
0 0.1 0.2 0.3 0.4 0.5 0.6 0.7 0.8
Frequency, Hz
Rotor Rate, 1P
Blade Passing Rate, 3P
Sea State 9 Waves
Sea State 6 Waves
Sea State 3 Waves
Unsteady Wind
Soft-StiffSoft-Soft Stiff-Stiff
Figure 1: Structural Design Regimes for Offshore Wind Turbines
For offshore wind turbines, resonance avoidance is often achieved by using the “soft-stiff” design approach,
ensuring that the tower fundamental resonance frequency lies in the frequency band between the rotor and
blade passing rates over the operating speed of the turbine. This approach requires a very stiff foundation
and has major implications for the structural design characteristics of the wind turbine. It is also sensitive to
the levels of damping in the design and requires soil characteristics within a particular range, limiting potential
sites for offshore wind turbine installation and introducing an implicit reliance on static soil properties to
achieve resonance avoidance. In addition, the “soft-stiff” design philosophy does not explicitly treat higher
structural modes of the wind turbine’s components. This is best understood by considering the differences
between sparse and dense Campbell diagrams, shown in Figure 2. The Campbell diagram is a classical way of
representing the dynamics of rotary machinery; it shows the relationship between forcing mechanisms, as a
function of the rotation rate of the system, relative to important system resonances over the system’s
operating range. Resonance coincidence is represented by a system forcing mechanism crossing a resonance
line.
The plot on the left in Figure 2 is a sparse Campbell diagram, showing the rotation rate (1P) and blade-
passing rate (3P) over the operating range of the turbine. Note that many important source frequencies occur
at multiples of the rotor rate, and are denoted as NP, where N is an integer multiple. Thus, 6P represents a

EVALUATE THE EFFECT OF TURBINE PERIOD OF VIBRATION REQUIREMENTS ON STRUCTURAL DESIGN PARAMETERS
Page 12 of 129
frequency six times the rotor rate; this convention is used throughout this study. The operating range of the
turbine is represented by the vertical black lines, with a cut-in speed of 6.9 RPM, a design speed of 12.1 RPM.
As can be seen, between the cut-in speed and 15 RPM, 1P and 3P do not cross the support structure’s
fundamental resonance, which is approximately 0.35 Hz. Note also that the support structure fundamental
mode is between 1P and 3P throughout the operating range shown, which is consistent with a “soft-stiff”
offshore wind turbine design, as has been previously discussed.
Now, consider the plot on the right in Figure 2. This is a dense Campbell diagram, complete with resonances
for higher modes of the support structure and additional component degrees-of-freedom. Also included are
harmonics of the 1P and 3P source mechanisms. This dense Campbell diagram shows resonance coincidence
among several sources and resonances above the cut-in speed, which implies the potential for large
displacement responses. It should be noted that some of these coincidences are with high frequency
resonances, which have the potential to contribute rapidly to the cumulative fatigue damage of the wind
turbine system. In additional, even if resonance avoidance is formally achieved, there still may be dynamic
amplification of the system’s structural vibrations in off-resonance conditions that can be important for the
limit state assessment. This suggests the need for modeling the interactions among all resonances and forcing
mechanisms explicitly and not relying on a resonance avoidance strategy that only treats the 1P and 3P
sources and their interaction with the fundamental support structure resonance [6].
0 5 10 150
0.5
1
1.5
2
2.5
3
Rotor Speed (RPM)
Fre
quen
cy,
Hz
0 5 10 150
0.5
1
1.5
2
2.5
3
Rotor Speed (RPM)
1.5
2
2.5
Fre
quen
cy,
Hz
1P
2P
3P
6P
Support Structure Lateral Mode 1
Drivetrain Torsional Mode 1
Blade Flapwise Mode 1
Blade Edgewise Mode 1
Blade Flapwise Mode 2
Support Structure Lateral Mode 2
Figure 2: Sparse (left) and dense (right) Campbell diagrams for a representative offshore wind turbine design.
EVALUATE THE EFFECT OF TURBINE PERIOD OF VIBRATION REQUIREMENTS ON STRUCTURAL DESIGN PARAMETERS
Page 13 of 129
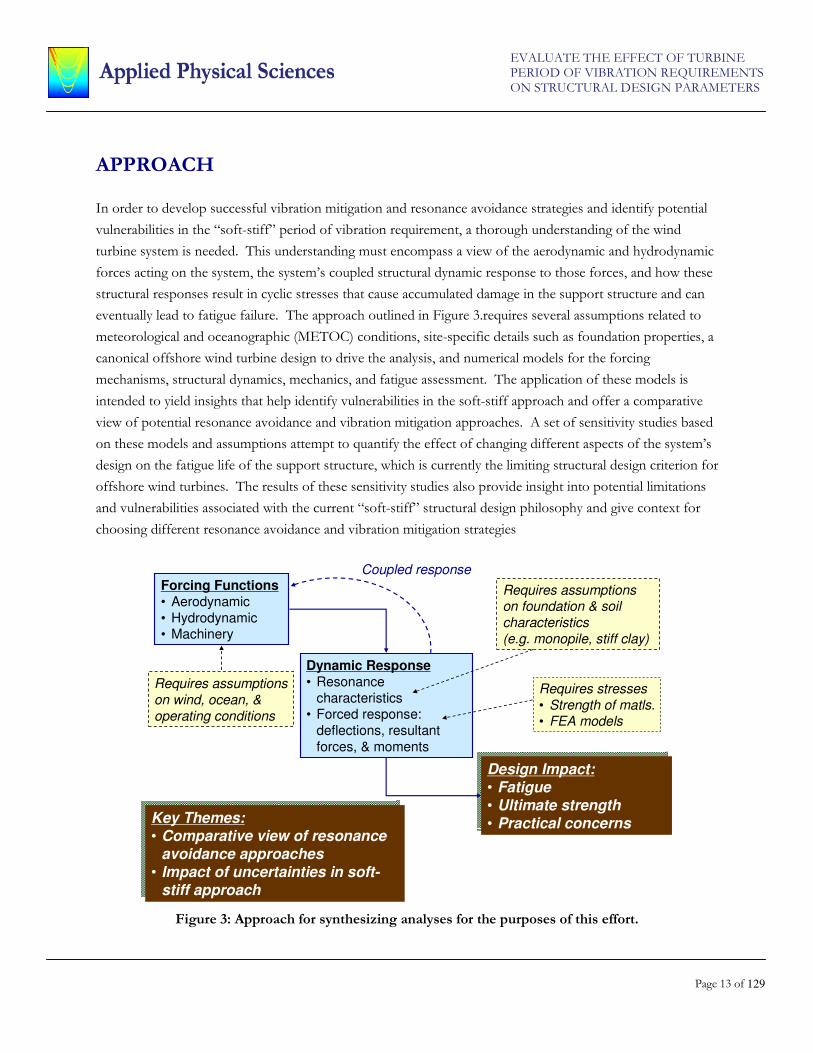
APPROACH
In order to develop successful vibration mitigation and resonance avoidance strategies and identify potential
vulnerabilities in the “soft-stiff” period of vibration requirement, a thorough understanding of the wind
turbine system is needed. This understanding must encompass a view of the aerodynamic and hydrodynamic
forces acting on the system, the system’s coupled structural dynamic response to those forces, and how these
structural responses result in cyclic stresses that cause accumulated damage in the support structure and can
eventually lead to fatigue failure. The approach outlined in Figure 3.requires several assumptions related to
meteorological and oceanographic (METOC) conditions, site-specific details such as foundation properties, a
canonical offshore wind turbine design to drive the analysis, and numerical models for the forcing
mechanisms, structural dynamics, mechanics, and fatigue assessment. The application of these models is
intended to yield insights that help identify vulnerabilities in the soft-stiff approach and offer a comparative
view of potential resonance avoidance and vibration mitigation approaches. A set of sensitivity studies based
on these models and assumptions attempt to quantify the effect of changing different aspects of the system’s
design on the fatigue life of the support structure, which is currently the limiting structural design criterion for
offshore wind turbines. The results of these sensitivity studies also provide insight into potential limitations
and vulnerabilities associated with the current “soft-stiff” structural design philosophy and give context for
choosing different resonance avoidance and vibration mitigation strategies
Forcing Functions
• Aerodynamic
• Hydrodynamic• Machinery
Dynamic Response
• Resonance
characteristics• Forced response:
deflections, resultant
forces, & moments
Design Impact:• Fatigue• Ultimate strength• Practical concerns
Design Impact:• Fatigue• Ultimate strength• Practical concerns
Requires assumptions
on wind, ocean, &
operating conditions
Requires assumptionson foundation & soil
characteristics
(e.g. monopile, stiff clay)
Coupled response
Requires stresses
• Strength of matls.• FEA models
Key Themes: • Comparative view of resonance
avoidance approaches• Impact of uncertainties in soft-
stiff approach
Key Themes: • Comparative view of resonance
avoidance approaches• Impact of uncertainties in soft-
stiff approach
Figure 3: Approach for synthesizing analyses for the purposes of this effort.

EVALUATE THE EFFECT OF TURBINE PERIOD OF VIBRATION REQUIREMENTS ON STRUCTURAL DESIGN PARAMETERS
Page 14 of 129
While several design tools for wind turbine systems are available, including the NREL simulation tool FAST
[10], the approach for this project was to leverage and tailor APS’ existing physics-based computational
models and corporate experience in structural dynamics, fluid structure interaction, and vibration control for
the analysis efforts required to successfully realize alternative vibration mitigation and resonance avoidance
strategies for offshore wind turbines. The primary motivation for this approach is that many of the vibration
mitigation and resonance avoidance strategies identified in the proposal and kickoff meeting, such as designs
leveraging vertical-axis turbine or jacketed foundations, cannot be explored using FAST and other tools
which are designed for the analysis of more conventional offshore wind turbine systems. In addition, FAST
is inherently a time-domain simulation tool, but many of the objectives of this current effort can be
successfully addressed using linearized frequency domain models. These frequency domain models offer
insight into the relevant physics that can easily be overlooked when analyzing time domain results from
simulation. Finally, one of the important deliverables for this current task is to assess shortcomings of the
“soft-stiff” design methodology. In order to adequately do that, it is important to be keenly aware of the
physics relevant to the wind turbine system – its design, operation, and failure mechanisms. Formulating
analysis tools from first principles is an effective way of ascertaining the weaknesses in the current approach.
It should be noted that wherever possible, results from the models and computational tools APS developed
for this effort are benchmarked against results from FAST and other published data to ensure consistency
and identify and understand inconsistencies.
REFERENCE OFFSHORE WIND TURBINE
In order to organize and focus the analysis to be performed in this project, a reference offshore wind turbine
that adheres to the “soft-stiff” design methodology was identified. For this project, the 5-MW NREL
offshore wind turbine design [1] is used as a reference. The principal characteristics of this turbine design are
shown in Table 1. Note that all values are taken or derived from [1] unless otherwise noted. Figure 4
delineates the different structural portions of the offshore wind turbine referenced in Table 1.
Table 1: Principal Characteristics NREL 5-MW Reference Offshore Wind Turbine
Description Symbol Value Tower Length (m) Lt 87.6 Support Structure Material - Steel Steel Young’s Modulus (GPa) E 210 Steel Shear Modulus (GPa) G 80.8 Steel Density (kg/m3) ρ 8500 Support Structure Damping Ratio ζ 0.01 [6] Foundation Depth (m) Lf 25 Water Depth (m) Lw 15 Pile Length (m) Lp 40 Support Structure Length (m) L 128

EVALUATE THE EFFECT OF TURBINE PERIOD OF VIBRATION REQUIREMENTS ON STRUCTURAL DESIGN PARAMETERS
Page 15 of 129
Tower Diameter (m) D At RNA D1 3.87 At Pile D2 6 Tower Thickness (m) At RNA t1 0.025 At Pile t2 0.035 Pile Diameter (m) Dp 6 [6] Pile Thickness (m) tp 0.06 [6] Wind Speed (m/s) Design V 11.4 Cut-In Vlow 3 Cut-Out Vhigh 25 Rotor Speed (rad/s) Design Ω 1.27 Cut-In Ωlow 0.72 Rotor Diameter (m) Dr 126 Rotor and Hub Mass (tonne) mr 110 Hub Mass (tonne) 56 Blade Mass (tonne) 18 Tower Mass (tonne) mt 347 Pile Mass (tonne) mp 663 Nacelle Mass (tonne) mn 240 Rotor-Nacelle Assembly Mass (tonne) mRNA 350
There are three relevant coordinate systems for the reference offshore wind turbine; two are shown in Figure
4. The first, the RNA coordinate system, has an origin at the junction between the centerline of the tower
and the RNA. The second coordinate system is the reference against which displacements of the support
structure are referenced and has an origin at the extreme pile depth on the pile centerline. The third
coordinate system, which is not shown in Figure 4, has its origin at the rotor hub in the plane of the rotor;
this coordinate system is denoted with the subscript “turbine.”

EVALUATE THE EFFECT OF TURBINE PERIOD OF VIBRATION REQUIREMENTS ON STRUCTURAL DESIGN PARAMETERS
Page 16 of 129
xRNA
zRNA
yRNA
xs
zs
ys
Pile
Tower
Foundation
Penetration Depth
Rotor-Nacelle
Assem
bly (RNA)
Support S
tructu
re
xRNA
zRNA
yRNA
xs
zs
ys
Pile
Tower
Foundation
Penetration Depth
Rotor-Nacelle
Assem
bly (RNA)
Support S
tructu
re
Figure 4: Coordinate Systems and Terminology for Support Structure Vibration Model
For all coordinate systems, the following directionality definitions apply:
• x is defined as the horizontal coordinate aligned with the wind direction, with positive x into the wind. Motions in the x-direction are referred to as “surge” and deflections of the support structure in the x-direction are referred to as w.
• y is defined as the horizontal coordinate normal to the wind direction motion, with positive y defined such that the cross product of x and y is consistent with z up. Motions in the y-direction are referred to as “sway” and deflections of the support structure in the y direction are referred to as u.
• z is defined as the vertical coordinate, with positive z up. Motions in the z direction are referred to as “heave.”
• Rotations about the x axis are referred to as “roll.”
• Rotations about the y axis are referred to as “pitch.”
• Rotations about the z axis are referred to as “yaw” and deflections of the support structure about the z-axis are referred to as θ.
It should be noted that these coordinate systems are consistent with those defined in the FAST
documentation [10].

EVALUATE THE EFFECT OF TURBINE PERIOD OF VIBRATION REQUIREMENTS ON STRUCTURAL DESIGN PARAMETERS
Page 17 of 129
With these coordinate systems defined, it is possible to define the inertial properties of the RNA for the 5-
MW reference offshore wind turbine; the inertial properties relevant to the derivation of the structural
dynamics model are given in Table 2.
Table 2: RNA Inertial Characteristics NREL 5-MW Reference Offshore Wind Turbine
Description Symbol Value RNA Mass Moment of Inertia (tonne-m2) About RNA x-axis JxRNA 3.6e4 About RNA y-axis JyRNA 2.0e4 About RNA z-axis JzRNA 2.3e4 Rotor & Hub Mass Moment of Inertia (tonne-m2) About turbine x-axis Jturbine 3.5e4 RNA Mass Centroid (m) x-axis component in RNA frame CGxRNA 0.3 z-axis component in RNA frame CGzRNA 1.6
The identification of a reference wind turbine design serves as the basis for all analyses involving the potential
vulnerabilities of the “soft-stiff” period of vibration design methodology and is the benchmark against which
the proposed vibration mitigation and resonance avoidance strategies are evaluated.
Wind Turbine Blade Properties
The canonical 5MW offshore wind turbine blades are defined in [1]. The principal characteristics of the
turbine itself are duplicated in Table 1. The characteristics of the turbine blades themselves vary significantly
over the diameter, in part to attain aerodynamic twist. Near the hub, the turbine blade is essentially cylindrical
and therefore develops no lift. The blade gradually fairs into a more traditional foil section, with the precise
foil sections defined in [1]. The structural bending rigidity for the flapwise and edgewise modes, the torsional
rigidity, and the blade mass per unit length are shown in Figure 5 as a function of radius. The blade material
is a uni-directional fiber-reinforced plastic composite.

EVALUATE THE EFFECT OF TURBINE PERIOD OF VIBRATION REQUIREMENTS ON STRUCTURAL DESIGN PARAMETERS
Page 18 of 129
Table 3: Turbine Characteristics for NREL 5-MW Reference Offshore Wind Turbine
Description Symbol Value Turbine Diameter, m D 126 Rotor and Hub Mass Moment of Inertia (tonne-m2) About turbine x-axis Jturbine 3.5e4 Blade Mass, tonne Tonne 18
0 0.1 0.2 0.3 0.4 0.5 0.6 0.7 0.8 0.9 10
1
2
3
4
5
6
Non-dimensional radius, r/R
Mass Density, tonne/m
Flapwise Stiffness, 1010
N-m2
Edgewise Stiffness, 1010
N-m2
Torsional Stiffness, 1010
N-m2
Figure 5: Distributed blade properties for canonical 5MW offshore wind turbine.
A coordinate system has been assumed that passes through the quarter-chord location and is aligned with the
local blade section nose-tail line. Thus, the vibrations along the radius are referenced from a local-coordinate
system that explicitly accounts for aerodynamic twist and blade skew.
Canonical Wind Turbine Site
The site for the notional 5MW NREL wind turbine assumed for this report is in the Block Island Sound.
NOAA maintains a METOC buoy (Station 44017 at 40.7N 72.1W) that records wind and wave conditions
near Block Island. Notional soil properties are also needed to model the structural dynamics of the offshore
wind turbine system accurately. Off the eastern coast of the United States, the soil is typically sandy with
porosity varying between 30% and 60% and densities between 1.7 and 2.3 tonne/m3 [8]. Soil in Block Island

EVALUATE THE EFFECT OF TURBINE PERIOD OF VIBRATION REQUIREMENTS ON STRUCTURAL DESIGN PARAMETERS
Page 19 of 129
Sound can be classified as “silty sand” with an angle of internal friction of approximately 35 degrees and a
density of 1.8 tonne/m3 [8]. According to Figure 6, the soil subgrade modulus, related to the resistance of the
soil against lateral loading, is roughly k=20 MPa/m.
Figure 6: Soil subgrade modulus for estimation of “p-y” curve characteristics [4].
The DNV standard [5] outlines the procedure for estimating the ultimate soil strength in static lateral loading
as well as the construction of the non-linear “p-y” curve, which effectively describes the reaction force per
unit length p provided by the soil as a pile displaces the soil a lateral distance y as a function of depth below
the mudline. DNV gives the following equation for the non-linear “p-y” curve:
0.9 tanh0.9
u
u
k zp p y
p
=
Here, p is the non-linear relationship between lateral motion of a pile and reaction force provided by the soil
per unit length of the pile, pu is the ultimate lateral strength of the soil per unit length, z is the distance along
the pile, with the origin at the mudline and positive into the earth, and y is the lateral coordinate (either x or y
in the reference wind turbine coordinate systems). This equation can be linearized about the equilibrium
condition of the pile to arrive at an effective linear stiffness coefficient as follows:
dpk z
dy=

EVALUATE THE EFFECT OF TURBINE PERIOD OF VIBRATION REQUIREMENTS ON STRUCTURAL DESIGN PARAMETERS
Page 20 of 129
This shows that the spring coefficient (per unit length of the pile) is a linear function of depth.
STRUCTURAL DYNAMICS MODEL
A structural dynamics model of the support structure was implemented and tested. The model includes
support structure lateral bending and torsional degrees of freedom and blade edgewise, flapwise, and torsion
degrees of freedom. The modeling philosophy is consistent with the approach shown in Figure 7, with the
lateral degrees of freedom modeled as a continuous beam element with appropriate boundary conditions and
the tower torsional degree of freedom modeled with a continuous shaft element; external forces due to
vibrations of the support structure, such as hydrodynamic added mass and damping effects, are included as
linear lumped parameters distributed along the length of the beam/shaft. The blade structural dynamics
model was then explicitly coupled to the support structure response model by introduction of appropriately
matched boundary conditions at the RNA.
Figure 7: Structural Dynamics Beam Model for Wind Turbine Support Structure with Lumped Parameter Treatment of Foundation and Fluid-Structure Interaction
The model was implemented in Matlab and verified against analytic solutions for canonical problems. The
vibrations were assumed to be harmonic in time and the spatial solution was obtained via a pseudo-spectral
discretization. Support structure, blade, and coupled mode shapes and frequency response functions were
generated for the lateral and torsional degrees of freedom. These were used to gain insight into the vibrations
of the wind turbine system, to perform design sensitivity studies, and to understand potential shortcomings
associated with the current “soft-stiff” structural design methodology. The support structure has additional
degrees of freedom that are important for accurately modeling the relevant structural dynamics for an

EVALUATE THE EFFECT OF TURBINE PERIOD OF VIBRATION REQUIREMENTS ON STRUCTURAL DESIGN PARAMETERS
Page 21 of 129
offshore wind turbine; these include the rigid body motions of the nacelle independent of the tower and the
rotor independent of the nacelle. In the derivations that follow, perfect fixity among the tower, rotor, and
nacelle is assumed. However, particularly for yaw of the RNA about the tower, this is not a good assumption
because the yaw control mechanism introduces dissipative and elastic effects. Other degrees-of-freedom that
should be included in the structural dynamics model are surge and roll of the rotor relative to the nacelle due
to elastic and dissipative effects in the drive-train. Follow-on work could involve implementing these degrees
of freedom to improve the fidelity of the structural dynamics model; however, for the purposes of this study,
which is used for sensitivity purposes, only support structure and blade bending and torsion degrees of
freedom are considered.
Support Structure Lateral Vibrations
The lateral support structure vibrations were modeled using a beam element with appropriate boundary
conditions at the foundation and RNA. The governing equation for the lateral motion of the support
structure is the dynamic Euler-Bernoulli beam equation:
2 2 2
2 2 20
w w wE I A P f
z z t z zρ
∂ ∂ ∂ ∂ ∂ + + − =
∂ ∂ ∂ ∂ ∂
Here, w is the lateral deflection of the beam in the x-direction relative to the origin of the support structure
coordinate system, E is the Young’s modulus of the constitutive tower material, I is the second moment of
area of the tower cross section, ρ is the mass density of the constitutive tower material, A is the cross-
sectional area of the tower, P represents tower axial compressive loading due to the RNA mass as well as the
mass distribution of the support structure along its length, and f represents forcing on the tower. All variables
are understood to be functions of the vertical position along the tower length, z, and time, t.
The Euler-Bernoulli beam equation is fourth-order in space and second-order in time and thus is subject to
four spatial boundary conditions and two initial conditions. The boundary conditions impose a shear force
and bending moment at the tower’s extremities consistent with the dynamics at the foundation and RNA.
For any position along the tower, the shear force and bending moment can be expressed as a function of the
tower displacement as follows:
Shear Force Bending Moment
2
2
wE I
z z
∂ ∂
∂ ∂
2
2
wE I
z
∂
∂
Specifically, at the tower’s foundation, the soil imparts a shear force resisting the tower’s motions. This force

EVALUATE THE EFFECT OF TURBINE PERIOD OF VIBRATION REQUIREMENTS ON STRUCTURAL DESIGN PARAMETERS
Page 22 of 129
is comprised of an elastic component, equal to the product of the soil stiffness ksoil and the tower
displacement, and a damping component equal to the product of the soil dashpot coefficient bsoil and the
tower velocity. Mathematically:
2
2
0s
soil soil
z
w wE I k w b
z z t=
∂ ∂ ∂ = +
∂ ∂ ∂
It is assumed that the bending moment tends to zero at the foundation:
2
2
0
0
sz
wE I
z=
∂=
∂
At the RNA, the shear force is due to the turbine’s aerodynamic effects as well as the inertia of the RNA.
The shear force can be expressed as:
2 2
2 2
s
aero RNA
z L
w w wE I b m
z z t t=
∂ ∂ ∂ ∂= − +
∂ ∂ ∂ ∂
Here, L represents the tower length, baero is the aerodynamic dashpot coefficient for linear motion of the rotor
parallel to the rotor axis, and mRNA is the mass of the RNA. The negative sign on the right hand side results
from the chosen sign convention for shear forces and bending moments along the tower length.
There is also a bending moment at the RNA; this is due to the rotational inertia of the RNA:
2 3
2 2
s
RNA
z L
w wE I Jy
z t z=
∂ ∂= −
∂ ∂ ∂
Here, JyRNA is the mass moment of inertia of the RNA about the yRNA-axis.
It should be noted that the tower has two lateral degrees of freedom in which it can vibrate: in a direction
parallel to the wind and in a direction normal to the wind. The foregoing discussion assumed surge lateral
motions into the wind. For the sway lateral vibration degree of freedom, the governing equation and
foundation boundary conditions are identical; however, to first order, aeroelastic effects are negligible, and
thus baero is zero in the boundary condition expression for the shear force at the RNA. In addition, the mass
moment of inertia of the RNA appearing in the bending moment boundary condition should be computed
about the xRNA-axis.

EVALUATE THE EFFECT OF TURBINE PERIOD OF VIBRATION REQUIREMENTS ON STRUCTURAL DESIGN PARAMETERS
Page 23 of 129
The tower is also subject to forces along its length that result from its vibrations. These are accounted for by
the term f in the dynamic Euler-Bernoulli equation. The forces are due to the elasticity and damping of the
foundation soil and the added mass and viscous damping of the water on the submerged portion of the pile.
The function f can be expressed as follows:
2
2
0soil soil s f
a D f s f w
wb k w z L
tf
w wm C L z L L
t t
∂ + ≤ < ∂
= ∂ ∂ + ≤ < + ∂ ∂
Here, bsoil and ksoil are as defined previously, ma is the added mass per unit length of the submerged portion of
the support structure, and CD is a linearized drag coefficient for the submerged portion of the support
structure. The function f is defined separately over two different portions of the support, defined by the
depth of the pile penetration (or the foundation length) Lf and the depth of the submerged portion of the
tower above the seabed Lw, in order to represent appropriately the different forcing mechanisms acting on
different portions of the tower.
The tower is also subject to external forcing mechanisms, such as those resulting from wave and water
current loading, aerodynamic excitation from the velocity deficit seen by the blades as they pass by the tower,
spatial and temporal fluctuations in the wind field encountered by the turbine, and vortex shedding off the
tower and turbine blades.
A solution of the following form was assumed:
( ) ( ) , i tw z t W z e ω= ℜ
Here, w represents the lateral displacement of the tower as a function of time and position z along the tower’s
length, W is an unknown function of z only, and the complex exponential term is an assumed harmonic time-
dependence of the vibrations. This expression was substituted into the governing equation and the boundary
conditions for the tower lateral motions. Chebyshev differentiation matrices were used to approximate the
spatial derivatives and the governing equation and boundary conditions were expressed as a set of linear
equations specifying the lateral deflection of the tower at Chebyshev nodes along its length; this is commonly
referred to as a pseudo-spectral solution method. The time-dependent complex exponential term is a factor
common to all terms in each equation and thus was dropped from the formulation.
The assumption of a harmonic response is consistent with a frequency-domain solution and allows structural
damping to be accounted for using hysteretic damping model, which is preferred to viscous damping for

EVALUATE THE EFFECT OF TURBINE PERIOD OF VIBRATION REQUIREMENTS ON STRUCTURAL DESIGN PARAMETERS
Page 24 of 129
quantifying dissipative effects in built-up steel structures. In order to include the hysteretic damping, a
complex stiffness modulus E* is used in lieu of the Young’s Modulus E in the governing Euler-Bernoulli
beam equation. The complex modulus E* can be written as follows:
( )* 1E E iη= +
Here, η is a structural loss factor (multiplied by the imaginary constant i to account for the fact the structural
damping is in phase with the velocity of the structure’s vibrations but proportional to its displacement) and E
is the real value of Young’s Modulus, as given above. Many references, including [1] and [6], recommend
treating the structural damping by use of a constant non-dimensional damping ratio ζ, which is the level of
damping relative to critical damping, for all normal modes of tower deflection. A typical value is ζ=0.01. For
lightly-damped structures, η is twice ζ at the natural frequency.
An eigen-decomposition was performed on the set of linear equations defining the deflection of the beam, W.
This decomposition results in a collection of normal modes and natural frequencies. Each normal mode is
characterized by the oscillation of the entire system at a discrete natural frequency; the mode shapes are
linearly independent, which implies that if the support structure is displaced in one of the mode shapes, no
displacements occur in the others. The lowest natural frequency, also called the fundamental resonance, and
its placement relative to the major turbine excitation forces at the rotor rate and the blade passing rate, is the
basis for the “soft-stiff” structural design philosophy.
In order to verify that the model was implemented correctly, it was modified slightly to solve a canonical
problem for which the answer is known analytically. The mode shapes and natural frequencies for a uniform
cantilevered beam were estimated using the following governing equation, which is the Euler-Bernoulli beam
equation without the external forcing and pre-compression terms and uniform structural properties along its
length:
4 2
4 20
w wE I A
z tρ
∂ ∂+ =
∂ ∂
For a cantilevered beam, the appropriate boundary conditions are zero shear and bending moment at the top
of the beam and zero slope and displacement at the bottom of the beam. These conditions can be written as
follows:

EVALUATE THE EFFECT OF TURBINE PERIOD OF VIBRATION REQUIREMENTS ON STRUCTURAL DESIGN PARAMETERS
Page 25 of 129
Bottom of Beam Top of Beam
[ ]0
0sz
w=
=
3
30
sz L
wE I
z=
∂=
∂
0
0
sz
w
z =
∂ = ∂
2
20
sz L
wE I
z=
∂=
∂
The same solution technique described above was used to solve this canonical problem. The mode shapes
and natural frequencies resulting from the eigen-analysis correlate extremely well with analytic solutions given
in [2]. Figure 8 shows a qualitative comparison of the first five calculated mode shapes against the analytic
mode shapes for a cantilevered beam. The calculated natural frequencies for the first five modes matched
those predicted by theory within 0.01%.
Analytic
Numerical
-1 0 10
0.25
0.5
0.75
1Mode 1
No
n-D
imen
sio
nal
Len
gth
, x
/L
-1 0 1
Mode 2
-1 0 1
Mode 3
Non-Dimensional Lateral Deflection, w/wmax
-1 0 1
Mode 4
-1 0 1
Mode 5
Figure 8: Verification of Lateral Support Structure Mode Shapes against Canonical Cantilever Beam Solution [2]

EVALUATE THE EFFECT OF TURBINE PERIOD OF VIBRATION REQUIREMENTS ON STRUCTURAL DESIGN PARAMETERS
Page 26 of 129
Support Structure Torsional Vibrations
The torsional support structure vibrations were modeled using a shaft element with appropriate boundary
conditions at the foundation and RNA. The governing equation for the torsional motion of the support
structure is the shaft equation:
2
22 0Js G I M
t z z
θ θ∂ ∂ ∂ − − =
∂ ∂ ∂
Here, θ is the torsional deflection of the shaft, G is the shear modulus of the constitutive support structure
material, I is the second moment of area of the support structure cross section (note, the factor of two is the
conversion from area moment of inertia to polar moment of inertia and relies on a planar symmetric cross-
section), Js is the polar mass moment of inertia of the support structure about its centerline per unit length,
and M represents external torques on the support structure. All variables are understood to be functions of
the vertical position along the support structure length, z, and time, t.
The shaft equation is second-order in space and second-order in time, and thus is subject to two spatial
boundary conditions and two initial conditions. The boundary conditions impose a torque or displacement at
the support structure’s extremities consistent with the dynamics at the foundation and RNA. For any
position along the support structure, the torque can be expressed as a function of the torsional displacement
as follows:
2G Iz
θ∂
∂
Specifically, at the RNA, the boundary condition accounts for torque due to the inertia of the RNA. The
boundary condition at the RNA can be expressed as:
2
22
s
RNA
z L
G I Jzz t
θ θ
=
∂ ∂ = − ∂ ∂
Here, L represents the tower length, JzRNA is the mass moment of inertia of the RNA about the shaft
centerline. The negative sign on the right hand side is a result of the chosen sign convention for torques
along the tower length. Note that there is also an aerodynamic effect that dissipates torsional motion of the
wind turbine.
At the tower’s foundation, the soil imparts a dissipative torque suppressing the support structure’s torsional

EVALUATE THE EFFECT OF TURBINE PERIOD OF VIBRATION REQUIREMENTS ON STRUCTURAL DESIGN PARAMETERS
Page 27 of 129
vibrations. According to [5], the effect of this dissipation can be adequately modeled by truncating the shaft
at 1/3 the penetration depth of the pile beneath the mudline and using a clamped boundary condition at this
location. This is likely an excellent model for the lower frequency vibratory modes, but may neglect
important effects for higher frequency modes where nodes approach the mudline.
23
0s fz L
θ<
=
Here, Lf is the penetration depth of the pile, and the support structure can be truncated below 1/3 this depth.
A solution of the following form was assumed:
( ) ( ) , i tz t z e ωθ = ℜ Θ
Here, θ represents the torsional displacement of the tower as a function of time and position z along the
tower’s length, Θ is an unknown function of z only, and the complex exponential term is an assumed
harmonic time-dependence of the vibrations. The solution technique is identical to that described for the
lateral vibrations.
As with the lateral structural dynamics formulation, the assumption of a frequency-domain solution allows
the structural damping to be treated with a hysteretic damping model. Its effect is incorporated by including
a structural loss factor in the shear modulus used in the governing shaft equation as follows:
( )* 1G G iη= +
Here, η is a structural loss factor (multiplied by the imaginary constant i to account for the fact the structural
damping is in phase with the velocity of the tower vibrations but proportional to the tower’s torsional
displacement). Similar to the formulation for the lateral vibrations, the value of η is set based on values of
non-dimensional damping coefficient ζ found in the literature (typically ζ=0.01).
The tower is also subject to torques along its length that result from torsional vibrations. These are
accounted for by the term M in the shaft equation. In addition, other external mechanisms can excite torque,
such as spatial fluctuations in the wind field near the turbine and vortex shedding phenomena along the
support structure length.
In order to verify that the model was implemented correctly, it was modified slightly to solve a canonical
problem for which the answer is known analytically. The mode shapes and natural frequencies for a fixed-
free uniform shaft were estimated. The governing equation is the same as the shaft equation previously

EVALUATE THE EFFECT OF TURBINE PERIOD OF VIBRATION REQUIREMENTS ON STRUCTURAL DESIGN PARAMETERS
Page 28 of 129
given. For a fixed-free beam, the appropriate boundary conditions are zero displacement at the fixed end and
zero torque at the free end. These conditions can be written as follows:
Bottom of Shaft Top of Shaft
[ ]0
0sz
θ=
= 0
sz L
G Iz
θ
=
∂ = ∂
The same solution technique described above was used to solve this canonical problem. The mode shapes
and natural frequencies resulting from the eigen-analysis correlate extremely well with analytic solutions given
in [2]. Figure 8 shows a qualitative comparison of the first five calculated mode shapes against the analytic
mode shapes for a fixed-free shaft. The calculated natural frequencies for the first five modes matched those
predicted by theory within 0.01%.
Analytic
Numerical
-1 0 10
0.25
0.5
0.75
1Mode 1
Non
-Dim
ensi
onal
Len
gth
, (x
- 2
⋅xp/3
)/L
-1 0 1
Mode 2
-1 0 1
Mode 3
Non-Dimensional Torsional Deflection, θ/θmax
-1 0 1
Mode 4
-1 0 1
Mode 5
Figure 9: Verification of Torsional Support Structure Mode Shapes against Canonical Fixed-Free Shaft Solution [2]

EVALUATE THE EFFECT OF TURBINE PERIOD OF VIBRATION REQUIREMENTS ON STRUCTURAL DESIGN PARAMETERS
Page 29 of 129
Coupling Degrees of Freedom
The lateral and torsional degrees of freedom of the offshore wind turbine support structure are coupled:
torsional motion results in a gyroscopic precession effect causing lateral surge motions of the support
structure and vice versa. This gyroscopic effect is due to the changes in the rotor’s angular momentum vector
as the support structure vibrates with θ or w motions.
This gyroscopic effect can be expressed by modifying the appropriate boundary conditions at the RNA for
the w and θ degrees of freedom. The bending moment boundary condition at the RNA for the w lateral
degree of freedom should be expressed as follows to account for the gyroscopic coupling:
( )2 3
2 2
1
2s
RNA turbine
z L
w wE I Jy J
z t z t
θ
=
∂ ∂ ∂= − + Ω
∂ ∂ ∂ ∂
Note that this is the similar to the bending moment boundary condition given before for w, except for the
additional term on the right-hand side that defines the coupling. Here, Jturbine is the mass moment of inertia of
the rotor about an xturbine, and Ω is the rotational speed of the rotor.
Similarly, the following modified expression is valid for the torsional boundary condition at the interface
between the RNA and tower (again, note the similarity between this boundary condition and the one
previously given for the torsional degree of freedom at the RNA):
( )2 2
2
12
2s
RNA turbine
z L
wG I Jz J
z t t z
θ θ
=
∂ ∂ ∂ = − − Ω ∂ ∂ ∂ ∂
In addition, there is also coupling between the degrees of freedom due to the fact that the center of gravity of
the RNA is not located at the interface between the tower and nacelle. For example, torsional motions of the
tower excite lateral vibrations in the u-direction due to the fact that the w-component of the RNA’s gravity
centroid is not aligned with the vertical centerline of the support structure.
Boundary conditions at the RNA for the support structure degrees of freedom must be modified to account
for this coupling. Only linear terms in the Euler rigid body equations of motion are retained for the coupling
effects. The equations are presented without details; reviewers are referred to [4] for more details.

EVALUATE THE EFFECT OF TURBINE PERIOD OF VIBRATION REQUIREMENTS ON STRUCTURAL DESIGN PARAMETERS
Page 30 of 129
Boundary Conditions for w Surge Lateral Vibrations
Shear
2 2 3
2 2 2
s
aero RNA RNA RNA
z L
w w w wE I b m m CGz
z z t t t x=
∂ ∂ ∂ ∂ ∂= − + +
∂ ∂ ∂ ∂ ∂ ∂
Bending ( )2 3 2
2 2 2
1
2s
RNA turbine RNA RNA
z L
w w wE I Jy J m CGz
z t z t t
θ
=
∂ ∂ ∂ ∂= − + Ω +
∂ ∂ ∂ ∂ ∂
Boundary Conditions for u Sway Lateral Vibrations
Shear
2 2 2 3
2 2 2 2
s
RNA RNA RNA RNA
z L
u u uE I m m CGx CGx
z z t t t x
θ
=
∂ ∂ ∂ ∂ ∂= − − −
∂ ∂ ∂ ∂ ∂ ∂
Bending
2 3 2
2 2 2
s
RNA RNA RNA
z L
u u uE I Jx m CGz
z t z t=
∂ ∂ ∂= − −
∂ ∂ ∂ ∂
Boundary Conditions for θ Yaw Torsional Vibrations
Torque ( )2 2 2
2 22
s
RNA turbine RNA RNA
z L
w uG I Jz J m CGx
z t t z t
θ θ
=
∂ ∂ ∂ ∂ = − + − Ω + ∂ ∂ ∂ ∂ ∂
Blade Vibrations
The bending blade vibrations were modeled using a beam element with appropriate boundary conditions at
the root and tip. The governing equation for the edgewise and flapwise bending motion of the blades is the
dynamic Euler-Bernoulli beam equation:
2 22
2 2 20b b bw w w
E I A P fr r t r r
ρ ∂ ∂ ∂∂ ∂
+ + − = ∂ ∂ ∂ ∂ ∂
Here, wb is the edgewise or flapwise deflection of the blade, E is the Young’s modulus of the constitutive
blade material, I is the second moment of area of the blade cross section (about an axis consistent with the
mode being analyzed), ρ is the mass density of the constitutive blade material, A is the cross-sectional area of
the blade, P represents tower axial tensile loading due to the centrifugal forcing on the blade as the turbine
rotates, and f represents forcing on the blades. All variables are understood to be functions of the radial
position along the blade, r, and time, t.
The Euler-Bernoulli beam equation is fourth-order in space and second-order in time and thus is subject to
four spatial boundary conditions and two initial conditions. The boundary conditions impose a shear force

EVALUATE THE EFFECT OF TURBINE PERIOD OF VIBRATION REQUIREMENTS ON STRUCTURAL DESIGN PARAMETERS
Page 31 of 129
and bending moment at the blade’s extremities consistent with the dynamics at the foundation and RNA.
For any position along the blade, the shear force and bending moment can be expressed as a function of the
blade displacement as follows:
Shear Force Bending Moment
2
2
bwE I
r r
∂∂
∂
2
2
bwE I
r
∂
∂
The derivation for the blade bending vibrations to this point has been identical to the derivation for the
support structure vibrations. The boundary conditions at the tip of the blade impose zero shear force and
zero bending moment, corresponding to free end boundary conditions. At the root, there are nuances in the
application of the boundary conditions owing to way the blades are loaded and the way the vibrations on
individual blades constructively and destructively interfere at the hub.
If a stationary spatially non-uniform flow field is considered, there is a fixed phase relationship between the
unsteady forcing experienced by each blade due to the non-uniformity sampled by the rotor rate; this is
discussed more in the “Aerodynamic Loading” section of this report. For a three-bladed turbine with
perfectly-balanced (inertially and aerodynamically) blades, there is no net forcing on the hub at the rotor
frequency due to the phase relationship of the forcing on the individual blades (a proof for this is given in the
“Turbine Imbalances” section of this report). The only forcing on the hub occurs at multiples of the blade
passing rate (e.g., 3P, 6P, etc.). Thus, while the blades themselves are vibrating at 1P and multiples thereof
due to the spatial non-uniformities, loading is only transmitted to the hub, RNA, and support structure at 3P
and multiples thereof. Therefore, to consider 1P, 2P, 4P, 5P, etc. forcing on the blades, the boundary
condition at the hub for a single blade can be considered cantilevered (zero displacement and zero slope)
because there is not net force to the RNA and the blades are decoupled from the tower. For multiples of the
blade-passing frequency, the blades and support structure responds as a coupled system. At the root, which
is the interface between the two components, the appropriate boundary conditions are equal displacement
and equal and opposite shear force or bending moment, depending on whether the flapwise or edgewise
mode is being considered. This is also the hub boundary condition that is used for other loading cases, such
as imbalanced loading on the blades that result from nonstationary spatial turbulence, aerodynamic turbine
imbalance (i.e., variations in pitch among the blades), and gusting. In these cases, the response of the entire
system (blades and support structure) occurs at the frequency of excitation (e.g., the gust frequency).
The external forcing on the blades is distributed over the radius and is included in the term f in the Euler-
Bernoulli equation. In addition to external forcing, there is also aerodynamic damping that results from
motion of the blade foil sections. This damping mechanism is discussed in the “Aeroelastic Effects” section
of this report.

EVALUATE THE EFFECT OF TURBINE PERIOD OF VIBRATION REQUIREMENTS ON STRUCTURAL DESIGN PARAMETERS
Page 32 of 129
A solution of the following form was assumed:
( ) ( ) , i t
b bw r t W r e ω= ℜ
Here, wb represents the bending displacement of the blades as a function of time and position r along the
tower’s length, Wb is an unknown function of r only, and the complex exponential term is an assumed
harmonic time-dependence of the vibrations. This expression was substituted into the governing equation
and the boundary conditions for the tower lateral motions. Chebyshev differentiation matrices were used to
approximate the spatial derivatives and the governing equation and boundary conditions were expressed as a
set of linear equations specifying the lateral deflection of the tower at Chebyshev nodes along its length; this
is commonly referred to as a pseudo-spectral solution method. The time-dependent complex exponential
term is a factor common to all terms in each equation and thus was dropped from the formulation.
The assumption of a harmonic response is consistent with a frequency-domain solution and allows structural
damping to be accounted for using hysteretic damping model, which is preferred to viscous damping for
quantifying dissipative effects in built-up steel structures. In order to include the hysteretic damping, a
complex stiffness modulus E* is used in lieu of the Young’s Modulus E in the governing Euler-Bernoulli
beam equation. The complex modulus E* can be written as follows:
( )* 1E E iη= +
Here, η is a structural loss factor (multiplied by the imaginary constant i to account for the fact the structural
damping is in phase with the velocity of the structure’s vibrations but proportional to its displacement) and E
is the real value of Young’s Modulus, as given above. Many references, including [1] and [6], recommend
treating the structural damping by use of a constant non-dimensional damping ratio ζ, which is the level of
damping relative to critical damping, for all normal modes of tower deflection. For blades, a typical value is
ζ=0.025. For lightly-damped structures, η is twice ζ at the natural frequency.
Support Structure Static Deflections
Steady forces on the rotor result in static deflections of the support structure. These static deflections cause
pre-stresses in the support that can reduce the fatigue life of the offshore wind turbine, particularly for tensile
and shear stresses.
The most obvious static deflection is due to the steady drag force exerted on the wind turbine as it operates.
For the 5-MW reference wind turbine design, the steady drag is roughly 800 kN in the design condition. This
drag must be reacted against with an equal and opposite shear force at the RNA end of the support structure,

EVALUATE THE EFFECT OF TURBINE PERIOD OF VIBRATION REQUIREMENTS ON STRUCTURAL DESIGN PARAMETERS
Page 33 of 129
which causes static lateral w deflection. The frequency-domain structural dynamics model was used at zero-
frequency to calculate the static response; the shear force boundary condition was modified to account for
the steady drag on the turbine. The deflection shown in Figure 10 was obtained for w displacement under
steady drag loading. If a uniform effective cantilever beam the length of the entire support structure is
assumed, this deflection at the RNA corresponds to a constant cross-sectional area moment of inertia of
approximately 3.2 m4; this is between the minimum tower area moment of inertia (at the RNA) of 0.56 m4
and the maximum pile area moment of inertia of 4.9 m4.
-0.1 0 0.1 0.2 0.3 0.4 0.5 0.6 0.7 0.8 0.90
20
40
60
80
100
120
140
Hei
ght
Ab
ov
e E
xtr
eme
Pil
e P
enet
rati
on
, z
(m
)
Lateral Support Structure Deflection, w (m)
Figure 10: Static Surge Deflection of Support Structure due to Steady Turbine Drag
Another important static deflection is due to the bending moment exerted on the RNA as the generator
absorbs energy from the spinning turbine. According to Newton’s third law, the tower must exert an equal
and opposite reaction on the RNA so that it remains in equilibrium. This tower torque is incorporated into
the u deflection bending moment boundary condition and was estimated based on the reference wind turbine
rated power and speed and a generator conversion efficiency of 90%, resulting in a moment of approximately
3.5 MN-m. The u deflection is shown below in Figure 11. As can be seen, the static w deflection due to
steady aerodynamic drag is significantly larger than the u deflection due to generator torque.

EVALUATE THE EFFECT OF TURBINE PERIOD OF VIBRATION REQUIREMENTS ON STRUCTURAL DESIGN PARAMETERS
Page 34 of 129
-0.01 0 0.01 0.02 0.03 0.04 0.05 0.06 0.070
20
40
60
80
100
120
140
Hei
ght
Ab
ov
e E
xtr
eme
Pil
e P
enet
rati
on
, z
(m
)
Lateral Support Structure Deflection, u (m)
Figure 11: Static Sway Deflection of Support Structure due to Generator Power-Takeoff
Support Structure Frequency Response Functions
Essential to our approach to identifying vulnerabilities in the “soft-stiff” design methodology and evaluating
alternative resonance avoidance and vibration mitigation strategies is the use of frequency-response functions
to benchmark important aspects of the wind turbine system’s structural dynamics. A frequency-response
function is a way of relating some input (such as lateral load applied by the turbine on the nacelle to the
tower) to some response of the system (such as the deflection of the support structure at the RNA or the
dynamic stresses developed at the mudline due to that applied load). Frequency-response functions allow
important system resonances to be quickly identified.
For example, consider Figure 12 which shows the dynamic amplification factor for the surge motion of the
RNA due to a force applied laterally at the turbine. The dynamic amplification factor is the ratio of the
response of the system to a load applied at different frequencies relative to the static response of the system
under the same magnitude load. Peaks in the dynamic amplification curve represent support structure surge
resonances.

EVALUATE THE EFFECT OF TURBINE PERIOD OF VIBRATION REQUIREMENTS ON STRUCTURAL DESIGN PARAMETERS
Page 35 of 129
10-2
10-1
100
101
10-4
10-3
10-2
10-1
100
101
Frequency, Hz.
RN
A D
yn
amic
Su
rge
Am
pli
fica
tion
, w
/wst
ati
c
Figure 12: Lateral Surge Dynamic Amplification
The first three surge natural frequencies of the support structure are 0.23 Hz, 1.5 Hz, and 6.4 Hz. It can be
observed that below the fundamental resonance at 0.23 Hz, the dynamic response asymptotes to the static
response under an applied load. This has important ramifications on the fatigue life of the offshore wind
turbine system because many important ambient forcing mechanisms, such as unsteady wind and wave
loading, are prevalent at low frequency. It should also be noted that the amplification associated with the
fundamental mode is approximately eight times the static response, with the dynamic amplification decreasing
with increasing discrete natural frequency; however, these amplification factors must be correlated with the
system’s important forcing mechanisms across frequency before drawing any conclusions regarding the
importance of the different modes. In addition, as has been previously noted, the influence of different
system structural modes on fatigue life is a function of both frequency and stress amplitude.
While these results cannot, at this early stage in the project, be used to assess the importance of different
aspects of the structural dynamics to the design of the wind turbine system and the vulnerabilities of the soft-
stiff design approach, they can be benchmarked against other results in the literature to ensure consistency.
The DOWEC report [6] reports the first two surge support structure natural frequencies as 0.242 Hz and
1.429 Hz. These correlate well with the values calculated here using the structural dynamics models
EVALUATE THE EFFECT OF TURBINE PERIOD OF VIBRATION REQUIREMENTS ON STRUCTURAL DESIGN PARAMETERS
Page 36 of 129
formulated specifically for the purposes of this effort, representing deviations of 3.6% and 7.8% relative to
the DOWEC reported values. However, perfect correlation is not expected among these frequency
estimates: the wind turbine analyzed in [6] is very similar to the reference system being explored for this
project, but there are some important differences. These differences mainly pertain to the properties and
treatment of the foundation: in this report, the pile-soil interaction is explicitly treated using linearized spring
and damper elements, while in the DOWEC report the support structure was truncated at the mudline and a
single spring-dashpot element is used to model the pile-soil interaction. In addition, the DOWEC report
assumes stratified soil with alternating layers of clay and soil, while the current study presumes sandy soil
consistent with properties off the coast of Block Island, Rhode Island.
It should be noted that the lumped single spring-dashpot foundation model used in the DOWEC report is
tuned to match the fundamental support structure mode that would be obtained with a higher-fidelity model
of the foundation, such as the one employed in this study. However, for higher frequency modes, the
assumption of constant properties for the spring-dashpot at the mudline becomes questionable as deflections
and nodes in the mode shape approach the mudline and extend into the foundation.
This effect can be easily seen by considering Figure 13, which shows the first three mode shapes for the surge
deflection of the support structure. These correspond to the three resonances shown in the dynamic
amplification plot; the motion of the support structure is nearly 90 degrees out of phase with the load at the
RNA (consistent with resonance conditions). The motion of the pile beneath the mudline (for non-
dimensional lengths below approximately 0.2) for the higher frequency modes, which is not captured by the
truncated pile approach, is likely the reason why the percent difference between the second natural frequency
reported here and in the DOWEC report is more than double the deviation for the fundamental mode.

EVALUATE THE EFFECT OF TURBINE PERIOD OF VIBRATION REQUIREMENTS ON STRUCTURAL DESIGN PARAMETERS
Page 37 of 129
-1 0 10
0.25
0.5
0.75
1Mode 1
No
n-D
imen
sio
nal
Len
gth
, z/
L
-1 0 1
Mode 2
Non-Dimensional Lateral Deflection, w/wmax
-1 0 1
Mode 3
Figure 13: Lowest Lateral Surge Mode Shapes
It is interesting to compare these mode shapes with those of the simple cantilevered beam shown in Figure 8.
Note that for modes two and three in Figure 13, there is little motion at the RNA, whereas the simple
cantilevered beam undergoes its maximum excursion at that same position. This effect is due to the inertia of
the RNA; as the frequency of the forcing applied to the RNA increases, the RNA is less prone to high
amplitude oscillations because of its large inertia resisting acceleration. This has two important effects: at
high frequency, the support structure limits to a fixed-fixed beam, which has implications for the stresses
developed in the structure due to high frequency excitations; the second is that the wind turbine experiences
small surge velocities, which implies little damping due to aerodynamic effects. This insight has ramifications
for the resonant properties of the direct-drive concept, which the literature suggests can be dramatically
heavier than an otherwise equivalent mechanical gearbox system; direct-drive concepts that modify the design
of the turbine and thus have total RNA mass near that of RNAs with traditional geared systems will not
suffer from a reduction in aerodynamic damping, although there may be additional dynamic concerns
depending on how the weight reduction is accomplished.
Blade Frequency Response Functions
The blade structural dynamics model was used with cantilevered boundary conditions and benchmarked

EVALUATE THE EFFECT OF TURBINE PERIOD OF VIBRATION REQUIREMENTS ON STRUCTURAL DESIGN PARAMETERS
Page 38 of 129
against the edgewise, flapwise, and torsional natural frequencies published in the literature for the 5MW
offshore wind turbine. The dynamic amplification of the flapwise blade motion under uniform spanwise
loading along non-dimensional radii from 0.2 to 1.0 is shown in Figure 14 at a non-dimensional blade radius
of 0.2. There are a few interesting things to note about this plot. The fundamental natural flapwise frequency
is approximately 0.7Hz, which correlates very well with the published fundamental frequency of 0.69Hz
found in [1]. The other interesting thing to note is that the aerodynamic damping is especially important for
suppressing the blade vibrations, especially at low frequency; at high frequency, the circulation is not able to
set up before flow reversal and the aerodynamic damping effect is reduced.
10-2
10-1
100
101
10-1
100
101
102
Frequency, Hz
Bla
de
Moti
on
Dy
nam
ic A
mpli
fica
tio
n a
t r/
R=
0.2 With Aerodynamic Damping
No Aerodynamic Damping
Figure 14: Dynamic amplification of flapwise blade motion at r/R=0.2.
Similarly, Figure 15 shows the edgewise dynamic amplification factor at the non-dimensional radius of 0.2 for
the same loading profile used in generating the flapwise DAF curve shown above. Note again that the
fundamental frequency, at this case approximate 1.1 Hz, closely correlates with data in the literature [1] for
the fundamental edgewise frequency.

EVALUATE THE EFFECT OF TURBINE PERIOD OF VIBRATION REQUIREMENTS ON STRUCTURAL DESIGN PARAMETERS
Page 39 of 129
10-2
10-1
100
101
10-1
100
101
102
Frequency, Hz
Bla
de
Moti
on
Dy
nam
ic A
mpli
fica
tio
n a
t r/
R=
0.2
Figure 15: Dynamic amplification of edgewise blade motion at r/R=0.2.
AEROELASTIC MODELING
As the wind turbine support structure vibrates in the x-direction, the wind turbine interacts with the air which
results in damping of the system’s vibrations. This aerodynamic damping effect is part of an important
physical phenomenon for wind turbines called aeroelasticity; essentially, the vibrations of the offshore wind
turbine components are strongly coupled to the system’s aerodynamic mechanisms. This effect is extremely
important because it introduces damping to the lightly damped wind turbine system and dissipates the
structural vibrations of the support structure. Van der Tempel has found that the calculated fatigue life for an
offshore wind turbine is reduced by as much as 50% if the aerodynamic damping mechanism is not included
in the formulation.
Both high and low fidelity approximations are made to the aeroelastic damping effect. The low-fidelity model
relied on a streamline analysis to estimate the damping coefficient due to rigid body turbine surge; this
analysis presumes quasi-steady aerodynamics, an assumption that is not appropriate for high frequency
oscillations of the turbine disk into and out of the axial velocity field. In addition, this approach is not
extensible to rigid body motions of the turbine disk other than those in the direction of the axial flow and
cannot be used to estimate the aeroelastic for blade vibrations.

EVALUATE THE EFFECT OF TURBINE PERIOD OF VIBRATION REQUIREMENTS ON STRUCTURAL DESIGN PARAMETERS
Page 40 of 129
Low Fidelity Model
It should be noted that the analysis presented here presumes the wind turbine is not in a stalled condition and
is rotating with constant speed and fixed pitch. It should also be noted that for turbine motions caused by
high frequency lateral vibrations, the aerodynamic damping model presented here is likely inappropriate, as it
is a quasi-steady model and does not include the unsteady effects that dominate the aerodynamic
performance of the turbine at high frequency. Furthermore, the following derivation is only valid for surge
oscillations of the turbine into and out of the wind. There is also an aerodynamic damping effect caused by
pitching and yawing of the rotor as the support structure vibrates; this effect cannot be modeled by the
simple actuator disk formulation presented below.
Consider the following equation, which is based on a momentum analysis of the air flow through an actuator
disk representing the wind turbine [3]:
( )( )20.5 4 1F A V a aρ= −
Here, F is the axial force or drag (in the x-direction) exerted on the turbine as it operates, A is the area swept
by the wind turbine blades, ρ is the density of air, V is the undisturbed free-stream velocity of the air far from
the turbine, and a is the induction factor of the turbine, defined as follows:
turbineV V
aV
−=
Here, Vturbine is the velocity of the air as it passes through the turbine disk (the area A swept by the blades as
they rotate). For a well-designed wind turbine, the value of a approaches 1/3, which is the Lanchester-Betz
limit at which the energy absorbed from the wind by the turbine is maximized.
Differentiating the axial force with respect to the airflow velocity gives an expression that can be used to
estimate the increase or decrease in the axial force as the airflow velocity slightly increases or decreases.
Vibrations of the wind turbine support structure cause the harmonic increases and decreases in the relative
velocity between the turbine and air, resulting in a drag force as described; this force can be estimated by
multiplying the velocity of the tower vibrations in the w-direction at the RNA by the following expression:
( )( )4 1aero
dFb A V a a
dVρ≈ = −
Assuming the 5-MW reference offshore wind turbine operates at the Betz limit at the design condition, the
aerodynamic damping coefficient can be written as:

EVALUATE THE EFFECT OF TURBINE PERIOD OF VIBRATION REQUIREMENTS ON STRUCTURAL DESIGN PARAMETERS
Page 41 of 129
150 tonnesaero
b =
Note that this dashpot coefficient, when converted to a non-dimensional damping coefficient for the
fundamental lateral mode, represents approximately 4.5% critical damping of the tower lateral motions. This
value, while higher than the values used in some studies, is within the range recommended by Van der
Tempel [3].
High Fidelity Model
A more rigorous approach that addresses these shortcomings is the Theodorsen method, which is an
analytical solution of a 2D airfoil section undergoing periodic heaving and/or pitching motions in a uniform
flow. The approach permits separation of the circulatory and non-circulatory (i.e., inertial) portions of the
flow and is a common method employed in aeroelastic problems. In the current case, the heaving and
pitching motions of the foil result from motions of the turbine disk or blades caused by structural dynamic
responses of the support structure and blades. Note that this approach does not include spanwise circulatory
interactions.
Considering a 2D blade section at some position along the blade span and assuming flapwise and torsional
vibratory motions of the blade, the harmonic lift per unit length exerted on the blade due to the vibration is:
( )2 2
2
2 22 4 2 2
16 2
b b b b bb
w wL c V c VcC k V c
t t t t t
θ θ θπ πρ ρ θ
∂ ∂ ∂ ∂ ∂ = + + + + +
∂ ∂ ∂ ∂ ∂
Here, ρ is the density of air, c is the chord length of the section of the blade in question, wb is the flapwise
deflection of the blade due to its vibration, θb is the torsional vibration of the blade, V is the local inflow
velocity, and C(k) is the Theodorsen function, which is defined in terms of Bessel functions and models the
unsteady circulatory effects. The Theodorsen function is defined in [19] and is a function of the reduced
frequency of oscillation:
2
ck
V
ω=
Similarly, there is an aeroelastic torsional moment response that can be expressed as:
2 23
2 28 16 3
128
b b bw
M c V ct t t
θ θπρ
∂ ∂ ∂= − + +
∂ ∂ ∂

EVALUATE THE EFFECT OF TURBINE PERIOD OF VIBRATION REQUIREMENTS ON STRUCTURAL DESIGN PARAMETERS
Page 42 of 129
There are a few interesting things to note about these results. The first is that these aeroelastic effects
provide damping, as evidenced by the fact that they arise due to the vertical and torsional motion of the blade
and act opposite these motions. The most interesting thing to note, however, is that these forces are coupled
to both blade degrees of freedom. The implications of this are discussed [18]; the relevant conclusions are
replicated here:
“The flap motion induces inertia forces and changes in the aerodynamic forces, both circulatory and
non-circulatory. These motion-induced forces can cause twisting moment. The twisting moment at a
blade section depends on these induced forces as well as the relative locations of the section center
of mass and the aerodynamic center with respect to the shear center. The elastic twist caused by this
twisting moment introduces a change in the aerodynamic angle of attack and hence, a change in the
aerodynamic flap force f. The phasing between f and w, under certain operating conditions, may be
such that the motion-induced force f performs work on the blade, thereby pumping energy from the
wind into the blade. This continuous pumping of energy leads to growing oscillatory motion of the
blade and eventually to structural failure. This is an example of pitch-flap flutter instability, involving
aeroelastic interactions between pitch and flap degrees of freedom.”
In addition to aeroelastic effects for blade vibrations, there are also aerodynamic interactions for rigid body
motions of the tower. As previously discussed, the aeroelastic forcing due to surge motions of the turbine
results in damping of the support structure vibrations; this damping mechanism was modeled using a quasi-
static assumption. Here, the aeroelastic effects were resolved using the unsteady Theordorsen approach used
for the vibratory motions of the blades.
EXTERNAL FORCING MECHANISMS
There are several external forcing mechanisms acting on the offshore wind turbine system that can excite
vibration and lead the system to accelerated failure. The major mechanisms are shown below in Figure 16.
These include the important 1P and 3P loadings, which results from the turbine rotational imbalance and
structural and aerodynamic asymmetry in the blades and the unsteady blade loading due to spatial variation in
the axial inflow, respectively. Other discrete forcing mechanisms include vortex shedding off the tower, pile,
and blades, and higher harmonics of 3P from aerodynamic unsteadiness. Finally, there are broadband sources
including from incident wave action on the pile and aerodynamic turbulence.

EVALUATE THE EFFECT OF TURBINE PERIOD OF VIBRATION REQUIREMENTS ON STRUCTURAL DESIGN PARAMETERS
Page 43 of 129
Steady and unsteady
wind: temporal and
spatial turbulence and
atmospheric
boundary layer
Ocean current
Ocean waves: slam impacts
and orbital velocity effects
Turbine rotational
imbalance load
Unsteady blade loading due
to spatial variation in inflow
Pile vortex shedding
Tower vortex shedding
Steady and unsteady
wind: temporal and
spatial turbulence and
atmospheric
boundary layer
Ocean current
Ocean waves: slam impacts
and orbital velocity effects
Turbine rotational
imbalance load
Unsteady blade loading due
to spatial variation in inflow
Pile vortex shedding
Tower vortex shedding
Figure 16: Important Forcing Mechanisms Acting on Wind Turbine System
Aerodynamic Loading
A major source of deterministic unsteady loading on a horizontal axis wind turbine (HAWT) is caused by the
rotating blades interacting with the non-uniform flow velocities around the tower. In a downstream
arrangement this effect is especially bad, where the blades actually pass through the low-velocity wake behind
the (usually circular) tower. The upstream configuration, where the blades are ahead of the tower relative to
the wind direction, has a much less severe problem, but the basic problem of the blades interacting with the
tower is still present. Modern HAWT designs further attempt to mitigate this problem by tilting the shaft
axis of the wind turbine and putting a cone angle on the blades so as to get the blades further away from the
tower when the blades are in the 6 o’clock position, but this blade-tower interaction is still present.
In order to make quantitative estimates of this source of unsteady loading, there are two distinct tasks:
• Estimating the velocity field caused by the tower that the blades rotate through
• Computing the unsteady loads on the blades due to their interaction with this velocity field

EVALUATE THE EFFECT OF TURBINE PERIOD OF VIBRATION REQUIREMENTS ON STRUCTURAL DESIGN PARAMETERS
Page 44 of 129
For the current work, a basic logarithmic velocity profile for the earth’s boundary layer is considered (Van der
Tempel). The influence of the (circular cross section) tower on the velocity field seen by the blades is
computed using the approach outlined in the AeroDyn Theory Manual (2005), which describes the
aerodynamic routines incorporated into the NREL FAST code. The influence of the tower is considered in
2D planes parallel to the ground, and the expressions used reflect the fact that the flow around the circular
cross section of the tower doesn’t look too much like a potential flow – it has a sizeable wake behind it,
described by the 2D drag coefficient. The parameters used for the turbine axis tilt, cone angle, and overhang
of the rotor in front of the tower are taken from the NREL 5MW design study.
The velocity field seen by blade sections at the 20%, 40%, 60%, 80%, and 100% of tip radius positions on the
blade were computed at 1-degree increments of rotation angle, and axial inflow velocity (normalized by the
wind velocity at the nacelle height) for each radius and angular position is shown in Figure 17, below. The
theta = 0 deg position for the blades is with the blades in upright vertical position, and the theta = 180 deg
position is with the blades pointing straight down. In addition to the considerable variation in inflow velocity
on such a huge turbine caused by the planetary boundary layer, there is obviously a considerable inflow
velocity reduction at the theta = 180 deg position caused by the blockage of the tower. This inflow velocity
reduction gives rise to considerable unsteady forces on the wind turbine blades.
0 60 120 180 240 300 3600.7
0.8
0.9
1
1.1
Angular Position of Blade, degrees
No
rmal
ized
Ax
ial
Vel
oci
ty,
V ax/V
RN
A
r/R = 0.2
r/R = 0.4
r/R = 0.6
r/R = 0.8
r/R = 1.0
Figure 17: Computed axial inflow velocities for NREL 5MW turbine.

EVALUATE THE EFFECT OF TURBINE PERIOD OF VIBRATION REQUIREMENTS ON STRUCTURAL DESIGN PARAMETERS
Page 45 of 129
Now that we have constructed a realistic inflow velocity field that the turbine blades “see” as they rotate, we
can proceed to compute the unsteady forces on the blades caused by operation in this circumferentially non-
uniform inflow field. There are two main approaches to this computation:
The unsteady loads can be computed in the time domain: at each angular position of the blade, the inflow
velocities are computed from Figure 17 and the aerodynamic response is computed, with due allowance for
the unsteady nature of the flow around the blade. This is the approach used in NREL’s FAST code, and it
does allow for time-domain non-linearities in the blade response to be computed. However, the current
FAST code only handles straight, unswept blades, so that the influence of blade skew or sweep on unsteady
forces cannot be examined.
The unsteady loads can be computed in the spatial frequency domain. In using this technique, the inflow
field at each radius is expressed as a Fourier series in rotation angle, and the unsteady loads on the blade are
computed for each Fourier component. This assumes that the blade response to the non-uniform inflow
field is linear, so that linear superposition holds. This is a realistic assumption unless the blade is approaching
stall. This approach has been widely used in the marine propeller field for computing unsteady forces on
propellers, and one of its advantages is that the influence of blade skew or sweep on unsteady loads can be
easily determined.
For the calculations presented here, we have chosen to use the frequency domain approach, since we have
existing, well-validated computer codes for this purpose from our work in the marine propeller field. The
approach we have used is the unsteady lifting line theory developed by Brown (1964) and subsequently
extended and validated by Greeley (1980, 1987). This code includes the unsteady interactions between blade
sections, so it is a considerable improvement over the use of strip theory alone, which is often used for this
purpose. In using this code, the computed inflow field (Figure 17) is expressed as a Fourier series in rotation
angle at each radius, and the code computes the unsteady lift coefficient for each harmonic of the inflow
(here, up to the 36th harmonic) at each of 18 radial stations along the blade at which the analysis is done.
These harmonic unsteady loads can then be summed up to give the total unsteady force on the blades as a
function of time or rotation angle.
If we are interested in only the net unsteady loads applied to the nacelle by the rotor, and we assume that the
blades are identical and evenly spaced, then the net unsteady forces only occur at the blade passing frequency
(3P for a 3-bladed turbine), and all of the harmonics of this fundamental frequency. This means that only
certain harmonics of the inflow field lead to net unsteady forces and moments on the turbine hub. On the
other hand, if we are concerned about the unsteady forces acting on each blade, and want to compute the blade
vibrations resulting from these unsteady forces, then all of the harmonics of the unsteady loading are
important.

EVALUATE THE EFFECT OF TURBINE PERIOD OF VIBRATION REQUIREMENTS ON STRUCTURAL DESIGN PARAMETERS
Page 46 of 129
In addition to the unsteady loads acting on the blades, there are time-mean forces and moments acting on the
turbine rotor hub. The obvious forces are the steady thrust and torque acting on the rotor, due to the average
(0th harmonic) inflow field. In addition, there are time mean vertical and lateral forces and moments acting
on the turbine rotor hub caused by the 1st harmonic of the inflow variations. These loads may seem counter-
intuitive, but they are real and can easily be derived with some trigonometry. In the case of the wind turbine,
there are considerable 1st harmonic inflow fluctuations from the operation in the planetary boundary layer, so
these forces and moments can be quite large.
Table 4: Summary of Aerodynamic Forcing Transmitted Through RNA at Turbine Design Condition
0P 3P 6P Fx, N 8.0e5 5.3e3 2.6e3
Fy, N 3.3e3 1.1e3 4.5e2
Fz, N 3.3e3 4.1e2 1.2e2
Mx, N-m 4.3e6 3.0e4 1.5e4
My, N-m 1.0e6 2.9e5 1.0e5
Mz, N-m 1.0e6 1.4e5 2.4e4
0.2 0.3 0.4 0.5 0.6 0.7 0.8 0.9 110
-8
10-6
10-4
10-2
100
102
Non-dimensional Blade Radius, r/R
Non
-dim
ensi
on
al L
ift
Coef
fici
ent,
CL
0P
1P
2P
3P
4P
5P
Figure 18: Blade section lift coefficient as a function of radius, r/R, for different harmonics of rotor rate. The lift coefficients are defined in terms of the local
section chord and inflow velocity.

EVALUATE THE EFFECT OF TURBINE PERIOD OF VIBRATION REQUIREMENTS ON STRUCTURAL DESIGN PARAMETERS
Page 47 of 129
Turbine Imbalances
A perfectly 120-degree symmetric 3-bladed turbine experiences blade rate or 3P forcing as the lowest
frequency aerodynamic forcing from the blades to the nacelle. This can be shown by considering the linear
combination of the three blades forcing for the 1P or rotor rate component. The appropriate phase shifts of
the forcing are given by
,0)2/3)(cos()2/1)(sin(
)2/3)(cos()2/1)(sin()sin(
)3/4sin()cos()3/4cos()sin(
)3/2sin()cos()3/2cos()sin()sin(
)3/4sin()3/2sin()sin(
))3/2(sin())3/(sin()sin(
1111
111111
1111
111111
111111
11111111
=−+−+
+−+=
++
++=
++++=
++++
tFtF
tFtFtF
tFtF
tFtFtF
tFtFtF
TtFTtFtF
ωω
ωωω
πωπω
πωπωω
πωπωω
ωωω
so that the sum contribution to the nacelle is zero. Likewise, for the second mode we have
.0)2/3)(cos()2/1)(sin(
)2/3)(cos()2/1)(sin()sin(
)3/8sin()cos()3/8cos()sin(
)3/4sin()cos()3/4cos()sin()sin(
)3/8sin()3/4sin()sin(
))3/2(sin())3/(sin()sin(
2222
222222
2222
222222
222222
12212222
=+−+
−+−+=
++
++=
++++=
++++
tFtF
tFtFtF
tFtF
tFtFtF
tFtFtF
TtFTtFtF
ωω
ωωω
πωπω
πωπωω
πωπωω
ωωω
The phase shifts for the third mode show up as multiples of 2π, and this is the first aerodynamic mode to
force the nacelle for a perfectly symmetric blade system. There are, however, breaks to the symmetry that
result in lower frequency forcing, and we consider these here. These breaks in symmetry are turbine rotational
imbalances, which we analyze both in terms of a mass imbalance and an aerodynamic imbalance.

EVALUATE THE EFFECT OF TURBINE PERIOD OF VIBRATION REQUIREMENTS ON STRUCTURAL DESIGN PARAMETERS
Page 48 of 129
Axis of
rotationAngular
momentum
Axis ofrotation
Angular
momentum
Blade cm
Blade cm
Blade cm
Overall cm
Center of
rotation
Static Imbalance Dynamic Imbalance
Time 1 Time 2
Figure 19: Depiction of static and dynamic imbalance of the wind turbine. Static imbalance relates to the center of mass not being coincident with the center of rotation in the plane of the disk. Dynamic imbalance comes from angular momentum vector not being aligned with the axis of rotation due to
blade centers of mass not being in a plane perpendicular to the axis of rotation.
Mass imbalances of the blades contribute to 1P forcing both from static imbalance and dynamic imbalance.
Static imbalance is easily understood as a difference between the center of mass and center of rotation of the
turbine in the plane of the disk. As the turbine rotates, the center of mass makes a cyclical path, with
associated accelerations in the plane of the disk, as shown in Figure 19. The accelerations are provided by
forcing from the nacelle, such that the loads to the nacelle are given by
,)cos(33
)sin(33
2
2
tmrzmF
tmrymF
cmcmz
cmcmy
ΩΩ=−=
ΩΩ=−=
where m is the mass of a single blade.
Static mass imbalance are represented by one blade having a reference mass, one blade having a slightly larger
mass, and one blade having a slightly lesser mass, thus shifting the center of mass from the disk center (as in
Kooijman et al, 2003). If we consider the case where the blade with reference mass is vertical, then the center
of mass is given by

EVALUATE THE EFFECT OF TURBINE PERIOD OF VIBRATION REQUIREMENTS ON STRUCTURAL DESIGN PARAMETERS
Page 49 of 129
( )
( ),'
')3/()'()'()0(
0)3/()'()'(
033
033
023
023
0
021
021
0
mmrr
mmrmrmmrmmrmy
mrmmrmmmrz
cm
cm
cm
=
=−−++=
=−−+−=
where r0 is the radius of the blade center of mass and m’ is the blade mass imperfection. The magnitude of
the vertical and lateral loads due to the static mass imbalance is
2
0
2'33 Ω=Ω= mrmrF cmStatIbl
The static imbalance force magnitude for the reference 5MW wind turbine with blade mass of 18,000kg,
blade radial center of mass of 21.975m, and design rotation rate of 1.27rad/s is plotted against the blade mass
error ratio in Figure 20. The plot shows that for a 0.5% error in the blade mass (corresponding to 90kg) the
static imbalance force is about 6kN.
The blade disk is 5m forward of the tower center, so that the forces associated with the static imbalance
impart a moment to the top of the tower. This moment is about the z-axis for the y-directed force, and about
the y-axis for the z-directed force. The moment magnitude as a function of the blade mass error ratio is
plotted in Figure 20, and is close to 30kNm for a 0.5% error in blade mass.
Figure 20: Magnitude of the force and moment due to static imbalance vs the blade mass error ratio for the 5MW reference wind turbine.
Dynamic imbalance is associated with a change in the direction of the angular momentum when the turbine
rotates. Such a situation arises when the axis of rotation of the turbine is not coincident with a principal axis
of the turbine mass distribution (Crandall et al, 1968, p. 222). For our three-bladed wind turbine, this occurs

EVALUATE THE EFFECT OF TURBINE PERIOD OF VIBRATION REQUIREMENTS ON STRUCTURAL DESIGN PARAMETERS
Page 50 of 129
when the plane formed by the centers of mass of the three blades is not normal to the axis of rotation. This is
illustrated in Figure 19, where the cone-angle for each blade in a conical arrangement is not exactly equal. The
associated oscillation of the angular momentum direction requires torque to achieve the angular acceleration.
The increase in angular momentum in the vertical direction depicted in Figure 19 requires a torque in the
vertical direction. Likewise, the lateral increase in angular momentum requires a horizontal cross-stream
torque. Thus, a dynamic imbalance contributes to 1P forcing in the torsional and streamwise modes of the
tower. For a small angle θ between the angular momentum vector (disk normal) and the axis of rotation, the
relevant cross term moment of inertia is given by
θ2
02/3 mrICross =
when each blade has a mass m centered at radius r0. The cyclical torque in the y and z directions is given by
(Crandall et al, 1968, p. 223)
θτ2
0
222/3 mrICrossDynIbl Ω=Ω=
so that
.)cos(2/3
)sin(2/3
2
0
2
2
0
2
tmr
tmr
z
y
ΩΩ=
ΩΩ=
θτ
θτ
The magnitude of the y and z moment at the top of the tower due to dynamic imbalance for the reference
5MW turbine is plotted in Figure 21, using a blade mass of 18,000kg, centered at 21.975m from the axis of
rotation, and a rotation rate of 1.27rad/s. The plot indicates a 200kNm moment for a 0.5 degree angle
between the angular momentum vector and axis of rotation.

EVALUATE THE EFFECT OF TURBINE PERIOD OF VIBRATION REQUIREMENTS ON STRUCTURAL DESIGN PARAMETERS
Page 51 of 129
Figure 21: Magnitude of the 1P moment at the top of the tower due to dynamic imbalance, as a function of the angle
Aerodynamic imbalance results from blades having slight geometric differences which affect the aerodynamic
loading. Differences in the loading of the blades break the symmetry and result in 1P loading to the tower.
The primary mechanism for 1P aerodynamic loading to the tower is through the differences in the steady
loading to each blade. The 1P loading to each blade is equivalent to first order, as the change to the angle of
attack due to variation of the inflow around the cycle is independent of the blade geometry. This concept is
outlined in Figure 22.
Static pitch variation
between blades
Steady Blade Load Different for Each BladeNet 1P Loading
Cyclic Change to Blade
Location and Orientation
1P Blade Load Same for Each Blade
(Same Change to Angle
of Attack)
No Net 1P LoadingLoading Between Blades
Cancels
Figure 22: Outline of net 1P tower loading due to steady blade load.

EVALUATE THE EFFECT OF TURBINE PERIOD OF VIBRATION REQUIREMENTS ON STRUCTURAL DESIGN PARAMETERS
Page 52 of 129
x
y
z
θ θ θ θ = Ω Ω Ω Ω t
FS, MS
FC, MC
FX, MX
x
y
z
x
y
z
θ θ θ θ = Ω Ω Ω Ω t
FS, MS
FC, MC
FX, MX
Figure 23: Diagram of the steady blade forcing components, as they change direction through the cycle of rotation.
To determine how differences in the steady blade loading among the three blades affects 1P loading to the
tower, we consider the loading on a rotating blade as depicted in Figure 23. The steady blade loading is
defined in the blade reference frame, which rotates about the hub at the rotor rate. The resulting 1P loading
to the tower is due to the change in the blade orientation, and the cyclical path of the aerodynamic center of
the blade. The force and moments to the tower are given by
321 XXXX FFFF ++=
ACCXACCXACCXX RFMRFMRFMM 332211 −+−+−=
( ) ( ) ( ) ( ) ( ) ( )3
4sin3
4cos3
2sin3
2cossincos 332211ππππ +Ω++Ω++Ω++Ω+Ω+Ω= tFtFtFtFtFtFF CSCSCSY
( ) ( ) ( ) ( ) ( ) ( )( ) ( ) ( )
34sin
32sinsin
34sin
34cos
32sin
32cossincos
321
332211
ππ
ππππ
+Ω++Ω+Ω+
+Ω++Ω++Ω++Ω+Ω+Ω=
tRFtRFtRF
tMtMtMtMtMtMM
ACXACXACX
CSCSCSY
( ) ( ) ( ) ( ) ( ) ( )3
4cos3
4sin3
2cos3
2sincossin 332211ππππ +Ω++Ω−+Ω++Ω−Ω+Ω−= tFtFtFtFtFtFF CSCSCSZ
( ) ( ) ( ) ( ) ( ) ( )( ) ( ) ( ) ,
34cos
32coscos
34cos
34sin
32cos
32sincossin
321
332211
ππ
ππππ
+Ω++Ω+Ω+
+Ω++Ω−+Ω++Ω−Ω+Ω−=
tRFtRFtRF
tMtMtMtMtMtMM
ACXACXACX
CSCSCSZ
where 1,2, and 3 refer to the three blades. From the above, we see that the forces and moments in the y and z
directions have unsteady components oscillating at 1P. When the aerodynamic loads are equivalent for each
blade these loads cancel, but they have net 1P values when there is aerodynamic imbalance.
The steady loads on the turbine blades as a linear function of pitch about the design point were predicted.
These are given by

EVALUATE THE EFFECT OF TURBINE PERIOD OF VIBRATION REQUIREMENTS ON STRUCTURAL DESIGN PARAMETERS
Page 53 of 129
deg/380.1420.4
deg/171.8362.1
deg/475.1544.2
NeNeF
NeNeF
NeNeF
C
S
X
+−=
−=
−=
.deg/553.7702.1
deg/430.1457.1
deg/455.6653.1
NmeNmeM
NmeNmeM
NmeNmeM
C
S
X
+−=
+−=
+−=
These expressions allow us to quantify the aerodynamic imbalance associated with small pitch errors between
the blades.
Aerodynamic imbalance is implemented as one of the three blades being at a slightly higher pitch and one of
the three blades being at a slightly lower pitch (as in Kooijman et al, 2003). If the pitch perturbation
magnitudes are the same, the resultant 1P y and z forces are
( ) ( ) ( ) ( ) ( ) ( )( ) ( ) ( ) ( )
( ) ( )tFtF
tFFtFF
tFFtFFtFtFF
CS
CCSS
CCSSCSY
Ω∆+Ω∆−=
+Ω∆−++Ω∆−+
+Ω∆+++Ω∆++Ω+Ω=
cos3sin3
34sin
34cos
32sin
32cossincos
ππ
ππ
( ) ( ) ( ) ( ) ( ) ( )( ) ( ) ( ) ( )
( ) ( ) ,sin3cos3
34cos
34sin
32cos
32sincossin
tFtF
tFFtFF
tFFtFFtFtFF
CS
CCSS
CCSSCSZ
Ω∆−Ω∆−=
+Ω∆−++Ω∆−−
+Ω∆+++Ω∆+−Ω+Ω−=
ππ
ππ
and the 1P y and z moments are
( ) ( ) ( ) ( ) ( ) ( )( ) ( ) ( ) ( )
( ) ( ) ( ) ( ) ( )( ) ( ) ( )tRFtMtM
tRFFtRFFtRF
tMMtMM
tMMtMMtMtMM
ACXCS
ACXXACXXACX
CCSS
CCSSCSY
Ω∆+Ω∆+Ω∆−=
+Ω∆−++Ω∆++Ω+
+Ω∆−++Ω∆−+
+Ω∆+++Ω∆++Ω+Ω=
cos3cos3sin3
34sin
32sinsin
34sin
34cos
32sin
32cossincos
ππ
ππ
ππ
( ) ( ) ( ) ( ) ( ) ( )( ) ( ) ( ) ( )
( ) ( ) ( ) ( ) ( )( ) ( ) ( ) .sin3sin3cos3
34cos
32coscos
34cos
34sin
32cos
32sincossin
tRFtMtM
tRFFtRFFtRF
tMMtMM
tMMtMMtMtMM
ACXS
ACXXACXXACX
CCSS
CCSSCSZ
Ω∆−Ω∆−Ω∆−=
+Ω∆−++Ω∆++Ω+
+Ω∆−++Ω∆−−
+Ω∆+++Ω∆+−Ω+Ω−=
ππ
ππ
ππ
For a pitch perturbation of +/-0.5 degree (as in Kooijman et al, 2003), and a radius of the aerodynamic center
RAC of 37.5m, these values for the 5MW reference turbine are

EVALUATE THE EFFECT OF TURBINE PERIOD OF VIBRATION REQUIREMENTS ON STRUCTURAL DESIGN PARAMETERS
Page 54 of 129
( ) ( )( ) ( )tNtNF
tNtNF
Z
Y
Ω−Ω=
Ω+Ω=
sin1550cos4.75
cos1550sin4.75
( ) ( )( ) ( ) .sin446.8cos413.1
cos446.8sin413.1
tNmetNmeM
tNmetNmeM
Z
Y
Ω−Ω−=
Ω+Ω−=
The linearized magnitude of the 1P tower loading due to aerodynamic imbalance is plotted as a function of
the pitch error in Figure 24, again considering one blade to have positive pitch error and one to have negative
pitch error.
Figure 24: 1P force and moment magnitude as a function of the pitch error in aerodynamic imbalance. Considering one of three blades to have positive pitch error and one to have negative
pitch error.
Vortex-Induced Loading
Steady wind flow incident on the tower results in drag from separated flow, and generate an unsteady vortex
wake behind the tower. Associated with the periodic vortex shedding is unsteady loading in both the drag and
lift directions. Considering the unsteady loading to be harmonic, the sectional (2D) drag and lift loads to the
tower can be modeled as
( )
.)sin(
)2sin('
2
21
2
21
tDCUF
tCCDUF
SLL
SDDD
ωρ
φωρ
=
++=
Vortices of alternating sign shed alternately from either side of the cylindrical section, and the associated lift
force oscillates at the frequency of the cycle, the Strouhal frequency. The unsteady component of the drag
force oscillates at twice the Strouhal frequency, as shedding from either side influences the drag in the same
way. For the Reynolds number of the tower diameter section, 64/Re eUD == υ , the shedding frequency

EVALUATE THE EFFECT OF TURBINE PERIOD OF VIBRATION REQUIREMENTS ON STRUCTURAL DESIGN PARAMETERS
Page 55 of 129
for a cylindrical section is defined by a Strouhal number of 2.0/ == UfDSt . Considering a tower diameter
that varies linearly from 6m at the pile to 3.87m at the RNA, and a logarithmic wind profile defined by
)05.0/ln(/52.1)( mzsmzU = , we plot in Figure 25 the natural sectional Strouhal frequency for the lift
and drag loading on the tower.
Figure 25: Sectional lift and drag natural frequencies as a function of height on the tower, based on linearly tapered tower diameter and logarithmic wind profile.
The variation of the natural sectional vortex shedding frequency with height on the tower is due to both the
change in the diameter and the wind boundary layer profile. Past studies have examined the three-dimensional
effects of varying the natural sectional shedding frequency along a cylinder length, both through cylinder
taper and shear flow (eg Maull and Young, 1973), and have discovered complex three-dimensional shedding
phenomena involving distinct spanwise cells with uniform shedding frequency. We bound the present
problem by considering coherence of the shedding frequency along the length.
The steady and unsteady drag and lift are plotted as a function of tower height in Figure 26. For the purposes
of these predictions we used the linear tower taper and logarithmic wind profile, with forcing coefficients
appropriate for the Reynolds number, CD=0.7, CL=0.3, C’D=0.03. Integrating these curves to the tower
height of 87.6m we can get the total force and center of effort. These are
NF SteadyX 500,17= centered at 47m up from the pile
NF UnsteadyY 480,7= at ~0.45Hz centered at 47m up from the pile
NF UnsteadyX 748= at ~0.9Hz centered at 47m up from the pile.

EVALUATE THE EFFECT OF TURBINE PERIOD OF VIBRATION REQUIREMENTS ON STRUCTURAL DESIGN PARAMETERS
Page 56 of 129
Figure 26: Steady drag, and unsteady lift and drag as a function of height on the tower for the tapered tower diameter in a logarithmic boundary layer.
Ocean Current Loading
Water currents can act on and cause deflections of the wind turbine pile. These currents are typically caused
by storm surge and atmospheric pressure variations, but can also result from momentum transfer from
waves, particularly nearshore. While there is some unsteadiness associated with ocean currents, DNV
recommends they be modeled statically as the time-scales over which the ocean current changes are
significantly longer than the relevant time-scales for the offshore wind turbine system structural responses.
The DNV standard recommends a 1/7th power law decay of the ocean current as follows:
1
7
0.01current
h zU U
h
− =
Here, U represents the predominant wind speed, h is the water depth, and z is the distance below the free
surface (positive downward). Resolving this steady forcing on the pile, the total static stress developed at the

EVALUATE THE EFFECT OF TURBINE PERIOD OF VIBRATION REQUIREMENTS ON STRUCTURAL DESIGN PARAMETERS
Page 57 of 129
mudline of the pile is on the order of 104 Pa and has a negligible impact on the structural limit state
assessment.
Ocean Wave Loading
Incident ocean waves induce unsteady loads on the underwater portion of the pile and can excite the wind
turbine system. The frequency content of ocean waves is generally lower than the rotor frequency and spans
a finite bandwidth. Support structures with low fundamental structural frequencies are typically employed in
land-band installations because they require smaller diameter towers with lower section modulus; this results
in a cheaper and more easily constructible wind turbine system. However, because of the low frequency
ambient wave and gust forcing, these softer support structures generally cannot be used for offshore wind
turbine installations; as such, the interaction between the system structural dynamics and the incident wave
forcing is extremely important in understanding limitations of the current soft-stiff design methodology.
The wave loading on the wind turbine support structure is site dependent due to the variability in ocean wave
climates at different geographical locations. The site for the notional 5MW NREL wind turbine assumed for
this report is in the Block Island Sound. NOAA maintains a METOC buoy (Station 44017 at 40.7N 72.1W)
that records wind and wave conditions near Block Island. The scatterplot in Figure 27 shows data collected
hourly throughout 2008 at this wave buoy location; specifically, the figure shows the correlation between peak
wave frequency (that is, the component of the wave system with the most wave energy associated with it) and
significant waveheight. There are a few things to note. The wave systems characterized by lower peak
frequency tend to support larger waves. In addition, there is an envelope defining the maximum waveheight
that can be supported at a given frequency. For the wind turbine system dynamics, it is clear that the wave
action is unlikely to excite the blade resonances owing to the fundamental edgewise and flapwise frequencies
being much above the modal frequencies associated with wave loading. However, it should be noted that
there are conditions at the notional wind turbine site where the peak frequency coincides with the
fundamental support structure resonance (~0.25 Hz). Thus, in such conditions, broadband wave action has
the possibility to excite the support structure into dynamically-amplified vibrations that result in accumulated
fatigue damage. Assuming these wave conditions are typical of potential offshore sites being considered off
the Atlantic coast, this suggests the possibility of resonance coincidence between the fundamental support
structure mode and the ocean wave forcing.

EVALUATE THE EFFECT OF TURBINE PERIOD OF VIBRATION REQUIREMENTS ON STRUCTURAL DESIGN PARAMETERS
Page 58 of 129
0.05 0.1 0.15 0.2 0.25 0.3 0.35 0.40
1
2
3
4
5
6
Modal Frequency, Hz
Sig
nif
ican
t W
aveh
eig
ht,
m
Figure 27: Wave climate data from NOAA METOC buoy near Block Island.
It is important to know how often wave conditions may excite the wind turbine support structure into a state
of resonance. The histograms in Figure 28 show the probability of the wave system being characterized by a
given significant waveheight of peak frequency. This plot shows that approximately 15% of the time at the
notional wind turbine site, the peak frequency of the wave field is between 0.2 and 0.3 Hz. In order to help
understand the dynamic response of the structure in such conditions, a set of design waves can be
constructed. These design waves represent single-component harmonic wave trains that can be thought of as
characteristic of the entire stochastic wave field. For the purposes of the analysis here, Table 5: Design Wave
Characteristics details this set of design wave characteristics. Typically, NATO sea states are used to
characterize ocean conditions; however, for this particular nearshore application, the open water sea state
definitions used by NATO are not applicable as they tend to correspond to sea conditions with lower
frequencies than those seen at the notional offshore wind turbine site. As such, a set of design wave
conditions are used instead.
Table 5: Design Wave Characteristics
Condition Significant
Waveheight, m Peak Wave
Frequency, Hz. 1 1.0 0.25 2 1.5 0.2

EVALUATE THE EFFECT OF TURBINE PERIOD OF VIBRATION REQUIREMENTS ON STRUCTURAL DESIGN PARAMETERS
Page 59 of 129
3 1.75 0.15 4 2.0 0.1
0 2 4 60
0.02
0.04
0.06
0.08
0.1
0.12
0.14
0.16
0.18
0.2
Significant Waveheight, m
0 0.1 0.2 0.3 0.40
0.05
0.1
0.15
0.2
0.25
Modal Frequency, Hz
Figure 28: Wave climate data from NOAA METOC buoy near Block Island.
Coincidence between the support structure fundamental frequency and the peak frequency of the wave
system is not the only way wave action can excite wind turbine support structure resonances. Ocean wave
systems are broadband in nature, which implies that there is energy in the wave system distributed over a
range of frequencies. Thus, even for wave conditions with a peak frequency off the support structure
resonant frequency, there still may be components of the wave system that can act to excite resonance. The
frequency-dependent ambient wave forcing can be characterized by an ocean wave spectrum. The DNV
standard [18] recommends the JONSWAP wave spectrum for modeling incident waves for analyses involving
offshore wind turbine structures. The JONSWAP spectrum, the functional form of which is reproduced
below, is appropriate for littoral environments and conditions with limited fetch, such as shallow- to
moderate-depth offshore environments. In this equation, ω is the wave angular frequency, ωp is the peak
angular frequency, α is the generalized Philips’ constant, g is the acceleration due to gravity, and γ(ω) is the
frequency-dependent peak-enhancement factor. The variables ωp, α, and γ(ω) are defined in more detail in the
DNV standard.

EVALUATE THE EFFECT OF TURBINE PERIOD OF VIBRATION REQUIREMENTS ON STRUCTURAL DESIGN PARAMETERS
Page 60 of 129
( )( )
4524
2 54
p
JONSWAP
gS e
ω
ωα γ ωω
π ω
−
=
The ocean wave spectrum defines how energy is distributed among individual wave components at different
frequencies in a wave field. The value of ωp is a function of both of the fetch and wind speed, and there exist
empirical formula relating these variables to waveheights. Writing the JONSWAP spectrum as a function of
peak wave frequency and significant waveheight, HM0, results in a more convenient form:
( )( )
45
40
5
0.21p
M p
JONSWAP
HS e
ω
ωω γ ωω
ω
−
=
There are a few interesting things to note about the ocean wave spectrum. The first is the correlation
between the frequency distribution specified by the spectrum and that actually observed in situ. The NOAA
wave buoy data was processed to construct measured ocean wave spectra. Figure 29 below shows a
comparison between the JONSWAP wave spectrum for a waveheight of 1.0 meter and a peak frequency of
0.2 Hz with several wave spectra observed at the notional wind turbine site that match these gross wave
characteristics (black curve). It can be seen that the JONSWAP spectrum characterizes the different
observed conditions quite well; discrepancies are mainly seen at lower frequencies, which are likely due to
swell from remote storms. A bimodal wave spectrum, such as the Ochi-Hubble spectrum, may be better
suited in a situation such as this.

EVALUATE THE EFFECT OF TURBINE PERIOD OF VIBRATION REQUIREMENTS ON STRUCTURAL DESIGN PARAMETERS
Page 61 of 129
0 0.05 0.1 0.15 0.2 0.25 0.3 0.35 0.4 0.45 0.50
0.1
0.2
0.3
0.4
0.5
0.6
0.7
0.8
0.9
1
Frequency, Hz
Wav
e S
pec
tral
Den
sity
, m
2/H
z
Figure 29: Comparison between in situ ocean wave spectra measurements and JONSWAP wave spectrum (black curve) at a significant waveheight 1.0 meter and a
peak frequency of 0.2 Hz.
Figure 30 shows the shape of the wave spectral density for four different wave conditions, corresponding to
the design wave cases in Table 5. Note that even for wave conditions where the peak wave frequency is off
the structural resonance (e.g., Design Wave 3 has a peak frequency of 0.15 Hz, which is significantly less than
the support structure fundamental frequency of 0.25 Hz), there is still wave energy in the ocean wavefield
near the resonant frequency due to the broadband nature of the ocean waves.

EVALUATE THE EFFECT OF TURBINE PERIOD OF VIBRATION REQUIREMENTS ON STRUCTURAL DESIGN PARAMETERS
Page 62 of 129
0 0.05 0.1 0.15 0.2 0.25 0.3 0.35 0.4 0.45 0.50
1
2
3
4
5
6
7
8
Frequency, Hz
Wav
e S
pec
tral
Den
sity
, m
2/H
z
Design Wave 1
Design Wave 2
Design Wave 3
Design Wave 4
Figure 30: Comparison between design wave spectra.
The interaction between the orbital wave action and the submerged portion of the support structure has been
modeled using the Morison equation. The Morison equation is a semi-empirical equation for the inline force
on a body in oscillatory flow. It is the sum of two force components: an inertia force in phase with the local
flow acceleration, and a drag force proportional to the signed square of the instantaneous flow velocity. The
inertia force is of the functional form as found in potential flow theory, while the drag force has the form as
found for a body placed in a steady flow. It can be expressed as follows:
2i
d
m d
FF
f C d C u u dAρ
ρ α= ∇ +
This expression results in a shear force distribution along the length of the submerged portion of the pile, and
is included as an external forcing mechanism in the structural dynamics model. The non-linear drag term was
linearized assuming equal energy dissipation per cycle. This formulation for the wave forcing captures the
depth attenuation of the wave forcing and takes into consideration the shape of the structure below the
waterline. The Morison equation has two major components: Fi is the inertia term, and Fd is the drag term.
In the inertia component, ρ is the density of the fluid, Cm=(1+Ca) is the inertia coefficient comprised of a

EVALUATE THE EFFECT OF TURBINE PERIOD OF VIBRATION REQUIREMENTS ON STRUCTURAL DESIGN PARAMETERS
Page 63 of 129
Froude-Krylov contribution and a hydrodynamic mass contribution (the Ca term is the added mass
coefficient), α is the wave orbital acceleration, and d∇ is a differential support structure submerged volume
along the structure’s length. The drag component consists of a 2D drag coefficient, Cd, the depth-dependent
orbital velocity induced by the incident wave, u, and the differential projected area of the support structure in
a direction normal to the flow fluctuation per unit length, dA [31, 14]. Note that Ca and Cd are a function of
Keulegan-Carpenter number (KC=2πA/d), and to a lesser extent, Reynolds number, and are typically
determined via experiments. For large offshore wind turbine piles and typical ocean wave conditions,
Keulegan-Carpenter numbers are generally low (between 1 and 6) and, due to the low viscosity of water,
Reynolds numbers are large (~106). In this limit, the added mass coefficient is not the constant expected
from classical inviscid hydrodynamic theory because circulation sets up around the circular cross-sections of
the pile; Ca actually takes the following functional form with respect to KC number [20]:
21 0.2 , 2
0.2, 2
a
a
C KC KC
C KC
≈ − <
≈ >
The drag coefficient can be parameterized as [20]:
312 21
2 2 246.53 3 0.2 3 , 2
0.2 , 2
d
d
D f D f D fC KC
KC
C KC KC
ν ν ν
− − − ≈ + − <
≈ >
Note that, because of the attenuation of velocity and acceleration with depth, the added mass and drag
coefficients are also a function of depth for a given wave condition.
Under the assumption of linear Airy gravity waves in moderate to shallow depth water, the magnitude and
horizontal particle orbital velocity and acceleration associated with the wave disturbance can be written as
(note that the particle velocity and acceleration are out of phase by 90 degrees):
( )( )( )
( )( )( )
2
cosh
sinh
cosh
sinh
w
w
k h zu A
kh
k h zA
kh
ω
α ω
−=
−=
Here, ω is the wave angular frequency, A is the amplitude of the wave component, h is the water depth (taken
as 15m corresponding to a notional site in the Block Island sound), zw is the water depth (zero at the free
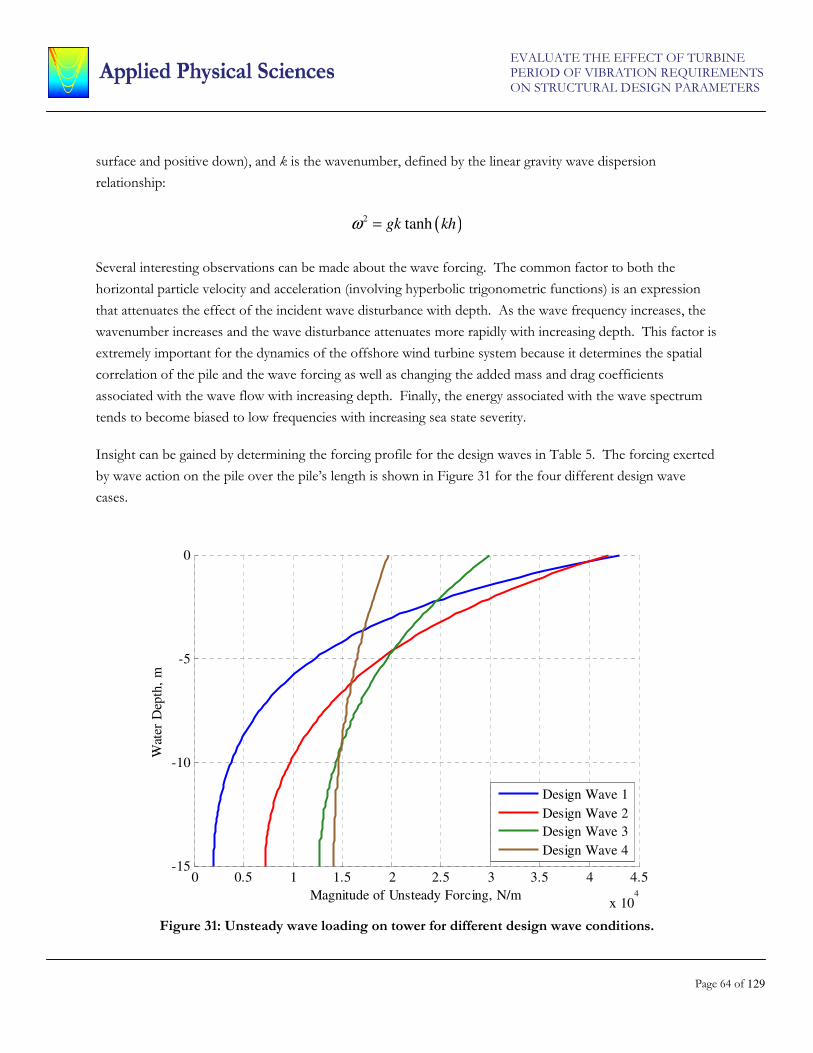
EVALUATE THE EFFECT OF TURBINE PERIOD OF VIBRATION REQUIREMENTS ON STRUCTURAL DESIGN PARAMETERS
Page 64 of 129
surface and positive down), and k is the wavenumber, defined by the linear gravity wave dispersion
relationship:
( )2 tanhgk khω =
Several interesting observations can be made about the wave forcing. The common factor to both the
horizontal particle velocity and acceleration (involving hyperbolic trigonometric functions) is an expression
that attenuates the effect of the incident wave disturbance with depth. As the wave frequency increases, the
wavenumber increases and the wave disturbance attenuates more rapidly with increasing depth. This factor is
extremely important for the dynamics of the offshore wind turbine system because it determines the spatial
correlation of the pile and the wave forcing as well as changing the added mass and drag coefficients
associated with the wave flow with increasing depth. Finally, the energy associated with the wave spectrum
tends to become biased to low frequencies with increasing sea state severity.
Insight can be gained by determining the forcing profile for the design waves in Table 5. The forcing exerted
by wave action on the pile over the pile’s length is shown in Figure 31 for the four different design wave
cases.
0 0.5 1 1.5 2 2.5 3 3.5 4 4.5
x 104
-15
-10
-5
0
Wat
er D
epth
, m
Magnitude of Unsteady Forcing, N/m
Design Wave 1
Design Wave 2
Design Wave 3
Design Wave 4
Figure 31: Unsteady wave loading on tower for different design wave conditions.

EVALUATE THE EFFECT OF TURBINE PERIOD OF VIBRATION REQUIREMENTS ON STRUCTURAL DESIGN PARAMETERS
Page 65 of 129
Note that while the actual excitation is broadband in nature, these simplified wave-structure interaction
problems demonstrate the fundamental mechanisms nicely. With decreasing wave frequency (the frequency
is increasing as the design wave number increases, as per Table 5), the magnitude of the unsteady forcing at
the free surface decreases owing to the reduction in wave particle velocity (proportional to frequency) and
acceleration (proportional to frequency squared). These differences are somewhat mitigated by the increase
in significant wave amplitude as the wave frequency decreases; however, the inertial effects dominate the
unsteady wave loading on the pile, and the magnitude of these decrease only linearly with decreasing wave
amplitude while they decrease quadratically with decreasing frequency. In addition, because the low
frequency waves are longer than high frequency waves, their disturbance attenuates less rapidly with depth
than do the high frequency waves; as a result, the lower frequency waves apply lower magnitude shear forcing
to the pile, but do so over a longer coherence length.
If the added mass and damping coefficients are assumed constant with respect to KC number, a transfer
function between wave frequency and support structure dynamic amplification can be generated. Taking
Ca=0.2 and Cd=1.2 (consistent with the high KC limit of approximately 6 for ocean wave action at the free
surface), and including the effects of depth attenuation, the transfer functions in Figure 32 are generated.
10-2
10-1
100
10-5
10-4
10-3
10-2
Frequency, Hz
Dis
pla
cem
ent
Norm
aliz
ed b
y W
ave
Am
pli
tud
e
10-2
10-1
100
105
106
107
108
Frequency, Hz
Ben
din
g M
om
ent
Norm
aliz
ed b
y W
ave
Am
pli
tud
e, N
-m/m
Figure 32: Pile response (displacement and bending moment) at the mudline under linear wave forcing.

EVALUATE THE EFFECT OF TURBINE PERIOD OF VIBRATION REQUIREMENTS ON STRUCTURAL DESIGN PARAMETERS
Page 66 of 129
Convolving these transfer functions with the wave spectra shown in Figure 30, response spectra are derived
for the four design wave sea conditions. These results are shown in Figure 32 below. By integrating these
response spectra, estimates for the root-mean square values of mudline bending moment can be obtained for
each of the design wave conditions for the important frequency range between 0.2 and 0.3Hz, which are near
the fundamental support structure resonance. These results are shown below in Table 6.
Table 6: RMS Mudline Bending Moment for Wave Frequencies between 0.2 and 0.3 Hz Condition Bending Moment, MN-m
1 2.2 2 2.4 3 1.6 4 0.9
0.1 0.2 0.3 0.4 0.50
1
2
3
4
5
6x 10
-6
Frequency, Hz
Tow
er D
isp
lace
men
t R
espon
se S
pec
trum
(m/m
)2(m
2/H
z)
0.1 0.2 0.3 0.4 0.50
2
4
6
8
10
12
14
16x 10
13
Frequency, Hz
Ben
din
g M
om
ent
Res
pon
se S
pec
tru
m
(N-m
/m)2
(m2/H
z)
Design Wave 1
Design Wave 2
Design Wave 3
Design Wave 4
0.1 0.2 0.3 0.4 0.50
1
2
3
4
5
6x 10
-6
Frequency, Hz
Tow
er D
isp
lace
men
t R
espon
se S
pec
trum
(m/m
)2(m
2/H
z)
0.1 0.2 0.3 0.4 0.50
2
4
6
8
10
12
14
16x 10
13
Frequency, Hz
Ben
din
g M
om
ent
Res
pon
se S
pec
tru
m
(N-m
/m)2
(m2/H
z)
Design Wave 1
Design Wave 2
Design Wave 3
Design Wave 4
Figure 33: Mudline pile response spectra (displacement and bending moment) under linear wave forcing for design wave conditions 1-4.
Gearbox Excitations
Unsteady torque and forces are generated by the gears and the bearings in the gearbox. Misalignment
of the shaft will also influence the forces and torque. The time dependent torques and forces generated by the
gears are due to geometric imperfections in the profiles of the gear teeth as well as time dependence of the

EVALUATE THE EFFECT OF TURBINE PERIOD OF VIBRATION REQUIREMENTS ON STRUCTURAL DESIGN PARAMETERS
Page 67 of 129
gear mesh stiffness. Friction between the gear teeth and backlash during rotation of the gears also
contributes to unsteady load generation.
The frequency content of the unsteady forces and torque from the gears is dominant at the mesh passing
harmonic frequencies and its harmonics. The mesh passing frequency is dependent on the number of gear
teeth as well as the rotational speed of the gears. The generation of harmonics is associated with the
nonlinearity of the force generation process. For situations where deviations in tooth properties are localized
to a single or multiple teeth, unsteady loads are also generated at multiples of the shaft rotational frequency.
There will also be frequency content at frequencies associated with defects in the bearings and with shaft
misalignment.
The amplitudes of the unsteady forces and torques due to the gears depend on the details of the geometry of
the gear teeth, their material properties, the details of the tooth profile deviations, and the architecture of the
gearbox. Similarly, the amplitudes of forces due to the bearings depend on the bearing characteristics (e.g.
stiffness, damping) as well as the details of any bearing defects (e.g. location, type).
The frequency dependence of the unsteady forces depends on the contact ratio of the gears (i.e. average
number of teeth in contact) and their mesh transfer function. The reference NREL 5MW offshore wind
turbine system being considered in this study has a “typical multiple-stage gearbox” with a rated generator
speed of 1170 RPM and a gearbox ratio of 97:1 [1]. Without more details on the gearbox arrangement, it is
not possible to determine exactly what the frequency content of the unsteady loading is; nonetheless, it can be
said with some certitude that this unsteady loading occurs at frequencies much above the first several support
structure resonant frequencies. The unsteady loading due to the gearbox is more likely to be important for
the dynamics of the turbine shaft and bearings owing to the higher natural frequencies associated with these
degrees of freedom. These modes are not explicitly included in the current structural dynamics model, and
may be explored in a future phase as warranted.
Aerodynamic Unsteadiness
The wind field near the turbine has both spatial and temporal unsteadiness that can affect that loads on the
blades. In general, the temporal unsteadiness occurs due to changes in wind velocity about the mean,
commonly referred to as gusts. The relevant response frequency for forcing on the blades and RNA is the
gust frequency, which is typically between 1 second and 1 minute for offshore sites according to Van der
Tempel. The spatial unsteadiness occurs due to correlated turbulence effects that change the velocity of the
wind as sampled by the turbine blades; assuming quasi-steady spatial turbulence (i.e., long correlation time
scales for spatial inhomogenieties in the flow field, which is consistent with Figure 2.38 in Van der Tempel)
the relevant frequencies for the blade forcing due to aerodynamic spatial turbulence are multiples of rotor

EVALUATE THE EFFECT OF TURBINE PERIOD OF VIBRATION REQUIREMENTS ON STRUCTURAL DESIGN PARAMETERS
Page 68 of 129
rate, while these blade forces are correlated by the hub and cancel for all harmonics but multiples of blade
passing rate. As discussed in the section “Aerodynamic Loading,” this effect is identical to that seen in the
case of unsteady loading on the blades and RNA due to inhomogenities in the axial velocity field due to the
tower blockage and the earth’s boundary layer. Because the spatial turbulence tends to have low wavenumber
content than the sampled velocity field including the velocity deficit due to the tower, the magnitude of the
aerodynamic forcing on the blades due to spatial effects can be bounded by considering the results presented
in “Aerodynamic Loading,” which considered an axial flow distribution with very high wavenumber content
due to the tower blockage effect. In addition, as is developed in the “Limit State Assessment” section, these
high frequency forcing mechanisms tend to have smaller impact on the fatigue limit state of the wind turbine
system compared to lower forcing mechanisms which interact with the fundamental support structure
resonance. As such, only the temporal aerodynamic unsteady effects, which are associated with loading on
both the blades and support structure at the gust frequency, are considered here.
The temporal turbulence is a broadband process in frequency. The Kaimal wind spectrum is recommended
by DNV [18, 19] to characterize the temporal fluctuations in the wind field. The Kaimal spectrum has the
following form, where σv is the standard deviation of the wind speed and is typically defined by the
turbulence intensity I=σv/U10=12% (as per Germanischer-Lloyd), Lv=340 m is a length-scale for wind
measurements 60 m above sea level, and U10 is the mean wind speed 10 meters above the water surface.
( )
2
10
5
3
10
1
k
Kaimal
L
US f
f L
U
σ
=
+
For the design wind speed of the notional 5MW offshore wind turbine (11.4m/s), and assuming a turbulence
intensity of 12%, the Kaimal wind spectrum takes the form shown in Figure 34. Note the significant dropoff
in wave spectral density with increasing frequency. Most of the wind energy is biased to low frequencies.

EVALUATE THE EFFECT OF TURBINE PERIOD OF VIBRATION REQUIREMENTS ON STRUCTURAL DESIGN PARAMETERS
Page 69 of 129
10-3
10-2
10-1
100
10-2
10-1
100
101
102
103
Frequency, Hz
Win
d S
pec
tral
Den
sity
, (m
/s)2
/Hz
Figure 34: Wind spectral density function for the design conditions of the notional 5MW offshore wind turbine.
A method similar to the Theodorsen method outlined in the “Aeroelastic Modeling” section of this report
can be used to quantify the loading on the blades that is transmitted to the support structure at the gust
frequency. Specifically, the approach assumes a perturbation in the inflow velocity due to changes in the axial
velocity instead of due to foil motions from structural vibrations of the blades or support structure.
Consider Figure 35, which shows the components of the inflow velocity to the blade section. The total static
inflow velocity is due to a tangential velocity, ωr, from the rotation of the blade and an axial velocity, VA, due
to ambient winds. A gust introduces another component to the axial velocity, denoted here with a tilde. This
increase in axial velocity changes both the magnitude and angle of the resulting inflow velocity. These effects
can be mimicked by a vertical and horizontal perturbation to the resolved velocity field, as shown in Figure
36.

EVALUATE THE EFFECT OF TURBINE PERIOD OF VIBRATION REQUIREMENTS ON STRUCTURAL DESIGN PARAMETERS
Page 70 of 129
Figure 35: The Sears gusting problem for a wind turbine.
vV
hV
Figure 36: Decomposing the wind turbine gust problem to vertical and horizontal components incident on the blade.
Note that a perturbation to the axial velocity, denoted VA with a tilde, by means of gusts causes an increase in
the magnitude of the inflow to the blade and changes the effective angle-of-attack. Note that the angles
shown in Figure 35 can be related to the velocities as follows:
( )
( )
tan
tan
A
A A
r
V
r
V V
ωθ
ωθ
=
=+

EVALUATE THE EFFECT OF TURBINE PERIOD OF VIBRATION REQUIREMENTS ON STRUCTURAL DESIGN PARAMETERS
Page 71 of 129
The increase in magnitude of inflow is given by:
( )
( ) ( )
22
2 2
A
A A
V V r
V V V r
ω
ω
= +
= + +
The change of the inflow velocity vector due to gusts can be decomposed into components parallel and
perpendicular to the undisturbed flow. These represent horizontal and vertical gusts incident on the foil, as
follows:
( )
( )
cos
sin
h
v
V V V
V V
θ θ
θ θ
= − −
= −
Taking a Taylor expansion of these velocities about a gust velocity of zero, the following expressions are
obtained:
A Ah
Av
V VV
V
rVV
V
ω
=
= −
The unsteady lift on a blade section generated by harmonic variation in the axial velocity can be calculated
using an expression similar to Theodorsen’s heaving and pitching foil solution. As with the approach
discussed in the “Aeroelastic Modeling” section of this report, the gust solution given here neglects spanwise
circulation interactions; however, it does capture the relevant unsteadiness for the forcing on a foil section.
The equation for lift per unit span for the gust problem is:
( ) ( )( ) ( ) ( ) ( ) ( ) ( )( ) 2
0 1 0 1 14
h h v vL cV V J k iJ k V V C k J k iJ k iJ k c V
ππ ρ α α ρ ω = − + − − + +
The variables are identical as those discussed in the “Aeroelastic Modeling” section; the only additional
variables are the Bessel functions of the first kind J0 and J1, which like the Theodorsen function are a
function of reduced frequency k, and α, which is the angle between the mean steady inflow and the nose-tail
line of the blade section.
Evaluating this expression for the 5MW canonical offshore wind turbine system operating at its design

EVALUATE THE EFFECT OF TURBINE PERIOD OF VIBRATION REQUIREMENTS ON STRUCTURAL DESIGN PARAMETERS
Page 72 of 129
condition of 11.4 m/s rated wind speed at the RNA and 12.1 RPM rotor rate, Figure 37 can be obtained.
This figure shows the net forcing integrated over the wind turbine blades and transmitted to the RNA for a
1m/s gust. The forces are normalized by the steady drag. At low frequency, these values can be compared to
the aerodynamic damping value of 150 tonne/s derived using simplifying assumptions such as a low
frequency quasi-static response; in this case, the aerodynamic damping mechanism is equivalent to the
mechanism that results in an increase in force on the blades due to gusting. For a 1 m/s gust, the simplified
damping analysis suggests that the force is approximately 150kN, which is approximately 18.8% the steady
drag; this compares well to the low frequency limit of approximately 11% via this more sophisticated analysis,
as demonstrated in Figure 37.
0 0.1 0.2 0.3 0.4 0.5 0.6 0.7 0.8 0.9 10.06
0.065
0.07
0.075
0.08
0.085
0.09
0.095
0.1
0.105
0.11
Frequency, Hz
Unst
ead
y F
orc
e on
RN
A d
ue
to 1
m/s
Win
d G
ust
Norm
aliz
ed b
y S
tead
y T
urb
ine
Dra
g
Figure 37: Unsteady loading transmitted to RNA due to blade forcing from wind gusts.
Convolving this transfer function with the canonical Kaimal wind spectrum for the operating condition of
the turbine, the following wind forcing spectra is obtained. Note that, for a frequency band between 0.2 Hz
and 0.3 Hz, the forcing spectrum can be integrated to give a RMS gust force in this condition at these
important frequencies of approximately 9400 N. Because of the proximity of this forcing to the fundamental
support structure natural mode, this forcing mechanism is very important for the overall system fatigue
assessment, as is discussed in the “Limit State Evaluation” section of this report.

EVALUATE THE EFFECT OF TURBINE PERIOD OF VIBRATION REQUIREMENTS ON STRUCTURAL DESIGN PARAMETERS
Page 73 of 129
10-2
10-1
100
107
108
109
1010
1011
1012
Frequency, Hz
Win
d F
orc
ing S
pec
trum
, N
2/H
z
Figure 38: Blade forcing spectra due to gusts for the operating condition of the wind turbine.
In addition to the blades, the tower itself is subject to unsteady forcing due to gusts. At low frequencies, a
quasi-static assumption can be utilized to estimate the forcing on the tower. Linearizing the drag equation
(identical to the drag component of the Morison equation discussed in the “Wave Loading” section of this
report) about the operating RNA wind velocity of 11.4m/s for small gust perturbations, an estimate for the
distributed loading on the tower can be obtained. Applying this load to the structural dynamics model for the
support structure results in the transfer function plots shown in Figure 39.

EVALUATE THE EFFECT OF TURBINE PERIOD OF VIBRATION REQUIREMENTS ON STRUCTURAL DESIGN PARAMETERS
Page 74 of 129
10-2
10-1
100
10-6
10-5
10-4
10-3
Frequency, Hz
Dis
pla
cem
ent
No
rmal
ized
by
1m
/s o
f G
ust
Lo
adin
g o
n T
ow
er,
m/(
m/s
)
10-2
10-1
100
103
104
105
106
107
Frequency, Hz
Ben
din
g M
om
ent
No
rmal
ized
by
1m
/s o
f G
ust
Lo
adin
g o
n T
ow
er,
N-m
/(m
/s)
Figure 39: Mudline displacement and bending moment due to unsteady wind forcing on the tower.
Convolving these transfer functions with the Kaimal wind spectrum at the wind turbine’s operating
condition, response spectra can be had. These spectra, shown in Figure 40, represent the frequency content
in the support structure stresses and motions at the mudline due to harmonic gust loading on the tower in the
system’s operating condition. Integrating these spectra between 0.2 and 0.3 Hz, RMS stress values can be
estimated; this frequency band is important because it brackets the fundamental support structure natural
frequency, the importance of which is discussed in the “Limit State Assessment” section of this report. The
RMS stress value for the design wind spectrum is approximately 105 Pa, which is more than an order of
magnitude smaller than the RMS stress induced by wave forcing.

EVALUATE THE EFFECT OF TURBINE PERIOD OF VIBRATION REQUIREMENTS ON STRUCTURAL DESIGN PARAMETERS
Page 75 of 129
10-2
10-1
100
10-13
10-12
10-11
10-10
10-9
10-8
10-7
Frequency, Hz
Dis
pla
cem
ent
Res
po
nse
Spec
tru
m f
or
1m
/s W
ind G
ust
Lo
adin
g o
n T
ow
er,
m2/H
z
10-2
10-1
100
106
107
108
109
1010
1011
1012
Frequency, Hz
Ben
din
g M
om
ent
Res
po
nse
Spec
tru
m f
or
1m
/s W
ind G
ust
Lo
adin
g o
n T
ow
er,
(N-m
)2/H
z
Figure 40: Mudline displacement and bending moment response spectra due to unsteady wind forcing on the tower in the system’s design condition.
STRUCTURAL MECHANICS MODELING
In order to evaluate the fatigue limit state of the components of the offshore wind turbine system, it is
necessary to have estimates of the vibration-induced stress levels these components experience during
operation. Using the results from the frequency-domain coupled-structural dynamics analysis for the support
structure and turbine blades, a strength-of-materials approach has been developed to predict the harmonic
reaction stresses resulting from structural vibrations. This strength-of-materials approach uses the bending
moments, shear forces, and shear torques that result from the structural vibrations and includes the influence
of hoop stresses that result from axisymmetric loading of the pile due water and foundation pressures. It
does not treat the influence of detailed aspects of the structural components, such as stress concentrations
due to flanges, fasteners (e.g., bolts), and welds; while they might be significant for the stress evaluation in the
design of an actual offshore wind turbine system, quantifying these effects requires complete structural design
details which are not readily available for the canonical 5MW reference NREL wind turbine design used as
the basis for this analysis. In addition, it is expected that the approach taken here is sufficient for performing
the relative performance comparisons necessary for evaluating the merits of different vibration mitigation and
resonance avoidance strategies, which is the purpose of this effort.

EVALUATE THE EFFECT OF TURBINE PERIOD OF VIBRATION REQUIREMENTS ON STRUCTURAL DESIGN PARAMETERS
Page 76 of 129
The structural dynamics models use Euler-Bernoulli beams to approximate the harmonic response of the
support structure and turbine blades. The stresses are resolved in sections of the beam: for the support
structure, this implies 2D sections along the beam length in the lateral plane, and for the blades, it implies 2D
foil sections from hub to tip along the span.
In the beam sections, three mechanisms contribute to the stress levels: bending moment, shear force, and
shear torque. The bending moment and shear force are due to the deflection of the beam laterally, while the
shear torque is due to torsional deflections. As previously developed, the bending moment, shear force, and
shear torque can be related to the lateral and angular displacement of the beam as follows:
Shear Force Bending Moment Torque
2
2
wF E I
z z
∂ ∂=
∂ ∂
2
2
wM E I
z
∂=
∂ 2G I
z
θτ
∂=
∂
Note that there are two components to the bending moment and shear force corresponding to the support
structure's two independent lateral degrees freedom (surge and sway). The stresses resulting from these
orthogonal components can be linearly superimposed to determine combined loading of the beam cross
section. For example, consider the following figure, which show the different internal reactions that arise in
the support structure in its fundamental mode due to loading at the RNA. There are a few things to note
here. First, the highest values of shear force and bending moment are present in the foundation of the
support structure; this is consistent with the conclusions in Van der Tempel's dissertation, which claims that
the fatigue limit state for the support structure occurs at the mudline. The present calculations seem to
corroborate this claim, as the bending moment (which dominates the stress calculation, as is discussed
shortly) peaks at the mudline, which for the 5MW NREL reference turbine is located 25m along the length.
A qualitative assessment of these results show the expected relationship between shear stress and bending
moment (F=dM/dz), lending confidence that the structural dynamics model has been implemented
consistently.
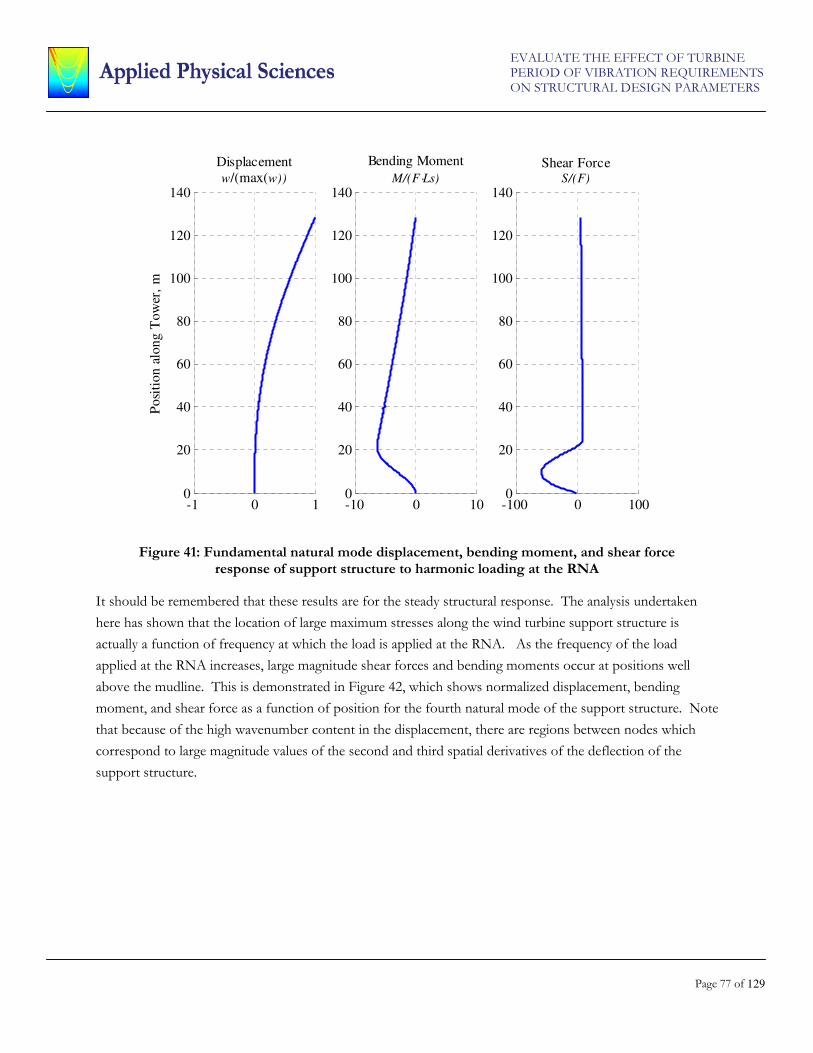
EVALUATE THE EFFECT OF TURBINE PERIOD OF VIBRATION REQUIREMENTS ON STRUCTURAL DESIGN PARAMETERS
Page 77 of 129
-1 0 10
20
40
60
80
100
120
140
Displacement
w/(max(w))
Po
siti
on
alo
ng T
ow
er,
m
-10 0 100
20
40
60
80
100
120
140
Bending Moment
M/(F⋅Ls)
-100 0 1000
20
40
60
80
100
120
140
Shear ForceS/(F)
Figure 41: Fundamental natural mode displacement, bending moment, and shear force response of support structure to harmonic loading at the RNA
It should be remembered that these results are for the steady structural response. The analysis undertaken
here has shown that the location of large maximum stresses along the wind turbine support structure is
actually a function of frequency at which the load is applied at the RNA. As the frequency of the load
applied at the RNA increases, large magnitude shear forces and bending moments occur at positions well
above the mudline. This is demonstrated in Figure 42, which shows normalized displacement, bending
moment, and shear force as a function of position for the fourth natural mode of the support structure. Note
that because of the high wavenumber content in the displacement, there are regions between nodes which
correspond to large magnitude values of the second and third spatial derivatives of the deflection of the
support structure.

EVALUATE THE EFFECT OF TURBINE PERIOD OF VIBRATION REQUIREMENTS ON STRUCTURAL DESIGN PARAMETERS
Page 78 of 129
-1 0 10
20
40
60
80
100
120
140
Displacement
w/(max(w))
Po
siti
on
alo
ng T
ow
er,
m
-0.5 0 0.50
20
40
60
80
100
120
140
Bending Moment
M/(F⋅Ls)
-5 0 50
20
40
60
80
100
120
140
Shear ForceS/(F)
Figure 42: Fourth natural mode displacement, bending moment, and shear force response of support structure to harmonic loading at the RNA.
Strength-of-materials equations are used to calculate the stress in the 2D beam sections from the bending
moment, shear stress, and shear torque. The support structure is considered first. The support structure has
an annular cross section of radius R and thickness t, which is naturally parameterized in cylindrical
coordinates. The following relationships relate the Cartesian coordinates to the cylindrical coordinates used
in the strength-of-materials formulation:
( )
( )
cos
sin
x R
y R
ϑ
ϑ
=
=
The bending moment causes stresses normal to the plane of the beam section. These stresses are maximized
at the extreme fibers, and vary linearly to a value of zero at the section's neutral axis, which is along the y-axis
for bending moments resulting from support structure surge and along the x-axis for bending moments
resulting from support structure sway. Because the diameter of the support structure is significantly larger
than the thickness, the thin-walled assumption has been utilized. Under this assumption, the magnitude of
the normal stresses resulting from surge beam bending can be calculated as follows:

EVALUATE THE EFFECT OF TURBINE PERIOD OF VIBRATION REQUIREMENTS ON STRUCTURAL DESIGN PARAMETERS
Page 79 of 129
y
zz
M x
Iσ =
Here, σzz is the magnitude of the normal stress, My is the magnitude of the surge bending moment, x is the
distance from the neutral axis (y-axis) to the point on the annulus in question, and I is the section moment of
area of the entire section about the neutral axis. In cylindrical coordinates using the thin-walled assumption,
this equation reduces to:
( )
3
2
cosy
zz
I R t
M
R t
π
ϑσ
π
=
=
Here, R is the radius of the cylinder cross sectional annulus, t is the thickness of the section. This stress can
be linearly imposed with the stress resulting from sway bending, which can be found using an identical
derivation to the one above for stress from surge bending. The total normal stress due to beam bending is
thus:
( ) ( )
2
cos siny x
zz
M M
R t
ϑ ϑσ
π
+=
The bending moments My and Mx are determined from the deflections of the support structure for a
particular loading case using the equations for shear moment in an Euler-Bernoulli beam reproduced above.
The lateral deflections in the beam cause shear forces which result in shear stresses in the plane of the cross
section. The general expression for shear in a beam section is:
z
F Q
I bϑσ =
Here, σzθ is the shear stress in the theta direction (tangential to the section), F is the shear force, Q is the
statical first moment of area (the first moment of area above the line through the point in question and
parallel to the neutral axis) about the neutral axis, I is the second moment of area of the entire section about
the neutral axis, and b is the “width” of the section (perpendicular to the applied shear and parallel to the
neutral axis) at the point in question. For an annulus, the shear stress is always oriented tangential to the
section; thus, it can be said to “flow” around the section. Under the assumption of a thin-walled cylindrical
beam, the shear stress equation for shear forces resulting from surge is:

EVALUATE THE EFFECT OF TURBINE PERIOD OF VIBRATION REQUIREMENTS ON STRUCTURAL DESIGN PARAMETERS
Page 80 of 129
( )cos
x
z
F
Rtϑ
ϑσ
π=
The equation for the component of σzθ resulting from sway motion is identical, save that sin(θ) is used instead
of cos(θ). Thus, the total shear stress resulting from beam bending is:
( ) ( )cos sin
x y
z
F F
Rtϑ
ϑ ϑσ
π
+=
It should be noted that the above derivation assumes constant shear stress across the thickness (in the radial
direction) at a given angular position on the section. This is a valid assumption for thin-walled annuli. It has
also been assumed that the radial shear stress is zero, which is true due to the complementary property of
shear and the fact that the vertical shear stress on the inner and outer faces of the annulus must be zero. The
complementary property of shear also implies that there is a vertical (z-directed, forming a loop with σzθ) shear
component σθz equal in magnitude to σzθ. This component of shear is due to the gradient of bending stress σzz
along the theta direction. For a differential portion of the beam sectional area to be in equilibrium, σθz must
be balanced by σzθ.
The torsional deflection of the support structure also results in shear flow directed along the annulus in the
theta direction. Under the assumption of a thin annulus, its magnitude is equal to:
24
z z
T
Rtϑ ϑσ σ
π= =
Here, T is the torsional moment for the beam section in question. This component linearly superimposes
with the shear stress components due to beam bending.
There are a few things to note about the strength-of-materials approach outlined here. First, it is based on
equations common to structural statics. However, at any instance in time, these equations are valid for
dynamic problems assuming the inertial forces germane to the problem are included as body forces. The
structural dynamics model returns harmonic frequency-domain responses for the bending moments, shear
forces, and shear torques; in order to use these frequency-domain results with a strength-of-materials
approach for determining stresses, the stresses components must be treated as phasors (consistent with the
complex values returned from the structural dynamics model). This correctly captures the complex
interactions among the different components due to both magnitude and phase differences among the
various contributors to the overall stress at a given frequency.
The approach for determining the stresses in blade sections is qualitatively similar to the approach presented

EVALUATE THE EFFECT OF TURBINE PERIOD OF VIBRATION REQUIREMENTS ON STRUCTURAL DESIGN PARAMETERS
Page 81 of 129
above for support structure stresses. The same types of loading result in stresses (bending moments, shear
forces, shear torques), and they result from edgewise, flapwise, and torsional vibratioms. Cylindrical
coordinates are still used, but the process is somewhat more complicated due to the fact that the the sections
are no longer simple circular annuli but instead are more complicated foil sections, as shown in Figure 43.
Thus, both R and t are functions of theta for the blade stress evaluation. In addition, the thin-walled
assumption is only valid for portions of the foil near the leading edge, as the overall sectional thickness
rapidly decreases relative to the structural thickness towards the trailing edge. Finally, there is typically
internal structural reinforcement, as shown in the figure below. This has implications for the shear flow due
to shear force and torsion. Shigley recommends that the shear flow be divided into loops in situations such
as this, so that the one loop encompasses the leading edge and the other includes the trailing edge, and the
loops share a common edge along the internal stiffeners. This is the approach that has been implemented for
resolving the stresses induced in the blades.
Figure 43: Typical structural design of wind turbine blades includes internal stiffeners that run along the blade span [1].
The stress components resulting from the strength-of-materials analysis must be transformed to an effective
Von Mises Stress for use in the fatigue assessment. In order to accomplish this, a 2D differential element in a
z- θ “plane” (constant radius) was constructed, and the appropriate stresses are drawn on the faces of this
element, as shown in Figure 44 below.

EVALUATE THE EFFECT OF TURBINE PERIOD OF VIBRATION REQUIREMENTS ON STRUCTURAL DESIGN PARAMETERS
Page 82 of 129
Figure 44: Differential element of pile for analyzing 2D stress state in cross section of beam. Note that the thickness of the pile has been increased for clarity.
The 2D stress state can be described completely using the stress tensor as follows:
0
z
z zz
ϑ
ϑ
σ
σ σ
The two eigenvectors of this stress tensor represent the principal lines through a point on the annulus (again,
assumed to have infinitesimal thickness owing to the thin-walled assumption) of the cross section. These
principal lines represent directions along which there are no shear stresses for the point in question; the
values of the normal stresses acting on these lines are the eigenvalues of the stress tensor and are denoted σ1
and σ2, with σ1>σ2.
The principal stresses are used to calculate the Von Mises Stress, which is used directly in the fatigue life
estimation. The Von Mises stress is an equivalent tensile stress, and a material is said to start yielding when
its von Mises stress exceeds tensile yield strength of the material. The von Mises stress is used to predict
yielding of materials under any loading condition from results of simple uniaxial tensile tests, on which the
fatigue life estimates are based. The Mises stress for a 2D stress state can be calculated as follows:
( )2 2 2
1 2 1 2
1
2eσ σ σ σ σ = − + +
Figure 45 shows the Von Mises stress induced by static turbine loading to the support structure at the RNA
in its design operating condition in the plane of the mudline as a function of theta. In addition to the Mises
stress, the different components of the overall stress are plotted as well. There are a few things to note.

EVALUATE THE EFFECT OF TURBINE PERIOD OF VIBRATION REQUIREMENTS ON STRUCTURAL DESIGN PARAMETERS
Page 83 of 129
First, the bending stresses dominate the shear stresses in their overall contribution to the Mises stress. This
was expected, as traditional beams resist loading via bending stresses, with shear stresses playing a secondary
role. Another thing to note is that because the deflection in the x-direction (surge) are significantly larger
than deflections in the roll direction (due to the large steady drag on the turbine), the maximum stress values
tend towards θ=0 and θ =180 degrees. This is because these are the locations where the normal stresses (σzz)
due to bending about the y-axis (i.e., those resulting from surge) occur.
0 60 120 180 240 300 360-5
-4
-3
-2
-1
0
1
2
3
4
5x 10
7
Angle, degrees
Sta
tic
Str
ess,
Pa
σθz
σzz
σe
Figure 45: Stress distribution around the circumference of the pile at the mudline for static RNA loading in operating condition.
LIMIT STATE EVALUATION
In offshore wind turbines, deformations and stresses due to cyclic loading can lead to the initiating of cracks
and subsequent failures due to fatigue. The amplitudes of those stresses and deformations are maximized if
resonances coincide with forcing frequencies, due to the relatively large dynamics amplification factors
associated with lightly damped structures. The lifetime of the components depends on both the amplitudes
and frequencies of the vibrations. Thus, one must be very cautious when neglecting forcing mechanisms in a
fatigue life assessment on the basis that its contribution is of small amplitude. Because the fatigue damage is
proportional to both frequency and amplitude, high frequency forcing mechanisms may result in significant

EVALUATE THE EFFECT OF TURBINE PERIOD OF VIBRATION REQUIREMENTS ON STRUCTURAL DESIGN PARAMETERS
Page 84 of 129
fatigue damage even if they are well isolated from structural resonances and contribute little to the overall
forcing on the structure.
There is evidence in the literature that suggests some ambiguity in design standards and disagreements among
experts regarding best practices for fatigue life assessment. Van der Tempel notes: “So far the industry has
not reached consensus on the details of fatigue analysis of support structures for offshore wind turbines.
Design standards only give directions that can be interpreted in various ways.”
The analysis performed here is based on an understanding of classical fatigue analysis methods and the DNV
design guidelines. The classical methods estimate the number of cycles to failure, N, is based on an S-N
curve which correlates the cycles to failure with the stress range, S. The stress variation (i.e. alternating value)
is generally the most significant parameter. The mean stress generally has a second order impact, with it
potentially extending the fatigue life if it is compressive and reducing the fatigue life if it is tensile. Important
static stresses for the offshore wind turbine support structure result from steady aerodynamic loads on the
turbine (including drag), steady drag on the tower and pile due to wind and water current, and compressive
stresses due to the RNA mass and integrated support structure weight. For the blades, the static stresses
result from the centrifugal force due to the turbine rotation and the steady aerodynamic loads. There are
often other factors that effect the fatigue life of structural components, including factors to correct the S-N
curve for surface finish, temperature, shape, and subjection to corrosive environments (such as seawater).
Compared to the classical methods, the method outlined in the DNV standard appears to include a large
factor of safety to account for many of these additional factors that modify the S-N curve instead of explicitly
addressing them. The standard does include a factor to reduce the fatigue life for cases with static tensile
loads and does specify separate parameters for components fully immersed in seawater.
The number of cycles to failure for an offshore wind turbine component can be defined as follows:
( ) ( )10 10 10log log log 2
k
e
ref
tN a m
tσ
= +
Here, log10(a) is the intercept of the log10(N) axis by the S-N curve, N is the number of cycles the wind
turbine component can withstand until fatigue failure, m is the slope of the logarithmic SN curve, σe is the
Von Mises stress defined above, t is the thickness of the section at the point in question in mm, tref is a
reference thickness defined to be 32 mm, and k is a scale exponent.
For a point at the mudline, the following values are valid for the support structure fatigue life estimation:

EVALUATE THE EFFECT OF TURBINE PERIOD OF VIBRATION REQUIREMENTS ON STRUCTURAL DESIGN PARAMETERS
Page 85 of 129
( )10log 11.7
3
0.25
a
m
k
=
=
=
Since the total stress in a structural component may be the result of a superposition of many forcing
mechanisms occurring over a broad range of frequencies, a cumulative damage rule is used to integrate the
fatigue effects of those load components. A typical approach is the Miner rule, which sets the cumulative
fatigue damage, D, equal to the sum of the ratio of the number of stress variations, ni, for a given stress range
to the allowable cycles for that stress range, Ni. Failure is predicted to occur if the cumulative damage
criterion exceeds unity.
i
i
nD
N=∑
This equation was used in conjunction with the results from the structural dynamics and forcing results to
estimate how changing the magnitude and frequency of the forcing applied to the system affects the fatigue
life of the support structure at the mudline. The process is depicted in Figure 46. Specifically, these studies
approximate the value N in the Miner’s cumulative damage equation as a function of frequency and force
magnitude for the different relevant forcing mechanisms discussed in this report. The values of fatigue life
shown in this section are not the values that should be expected for the actual system, but instead represent
the life that could be expected under idealized loading at a given frequency and magnitude applied to system
consistently over a sufficient duration. Similarly, the fatigue life estimates for different forcing mechanisms
(or the same mechanism at different frequencies) cannot be added together to estimate the fatigue life under
composite loading because of the non-linear nature of the S-N transfer function between stress and fatigue
life. To obtain the actual fatigue life of the system, the stress cycles used in the Miner sum need to be
formulated as peak-to-peak values (and thus, accounts for the broadband nature of the total stress response
spectrum), which is not a straightforward in the frequency domain (see, for example, Van der Tempel). In
addition, doing a more detailed fatigue life assessment would require a very well-defined wind and wave
climate for the site. While some of this data is available for the canonical 5MW wind turbine site, the
objectives of the current study (e.g., understanding the system’s sensitivities to different forcing mechanisms)
can be effectively achieved using the approach outlined above. In addition, this approach offers insight about
which mechanisms are most important for the fatigue life of the system that a more detailed integrated
approach (i.e., evaluating the actual fatigue life) would not necessarily provide.

EVALUATE THE EFFECT OF TURBINE PERIOD OF VIBRATION REQUIREMENTS ON STRUCTURAL DESIGN PARAMETERS
Page 86 of 129
( )F ω
( )σ ω
nD
N=∑
ωContours of Fatigue Life
Soft-Stiff Design
Fatigue Life Estimation
Figure 46: Strategy for Generalized Fatigue Life Assessment
Consider Figure 47, which shows the fatigue life estimation for the 3P aerodynamic forcing mechanism
discussed in this report. The frequencies shown bracket 3P for rotor rates between 0.1Hz and 0.33Hz, which
spans the operating conditions of the reference 5MW turbine. The magnitude of the force applied to the
support structure at the RNA was varied from half to ten times the 3P value predicted due to the atmospheric
boundary layer and tower blockage. As can be seen, over the entirety of the range of frequencies shown, the
fatigue life under idealized loading for the case of F/F3P=1 is essentially infinite for design purposes. At
lower frequencies and the largest forcing magnitude, the dynamic amplification associated with fundamental
support structure resonance (~0.25 Hz) can be seen reducing the fatigue life to values more meaningful to the
designer. However, as this represents a large deviation (five times) from the actual predicted magnitude of
the 3P forcing, the aerodynamic unsteady loading due to spatial non-uniformities is not a significant factor for
the fatigue life assessment for this particular offshore wind turbine design.

EVALUATE THE EFFECT OF TURBINE PERIOD OF VIBRATION REQUIREMENTS ON STRUCTURAL DESIGN PARAMETERS
Page 87 of 129
0.3 0.4 0.5 0.6 0.7 0.8 0.9 110
0
101
102
103
104
105
106
Frequency, Hz
Fat
igu
e L
ife,
Yea
rs
F/F3P
=0.5
F/F3P
=1.0
F/F3P
=2.0
F/F3P
=5.0
F/F3P
=10.0
Figure 47: Fatigue life estimation for 3P aerodynamic forcing.
Similarly, Figure 48 shows the fatigue life estimation of the support structure at the mudline under idealized
6P aerodynamic forcing. As with the 3P forcing, the range of frequencies shown in the figure are
commensurate with rotor rates between 0.1 and 0.33 Hz. The second support structure resonant frequency
(~1.7 Hz.) is evident as a large reduction in the predicted life. However, the values calculated suggest that,
like the 3P forcing, the 6P aerodynamic loading are not important for the overall fatigue life determination for
the canonical wind turbine system.

EVALUATE THE EFFECT OF TURBINE PERIOD OF VIBRATION REQUIREMENTS ON STRUCTURAL DESIGN PARAMETERS
Page 88 of 129
0.6 0.8 1 1.2 1.4 1.6 1.8 210
0
101
102
103
104
105
106
Frequency, Hz
Fat
igu
e L
ife,
Yea
rs
F/F6P
=0.5
F/F6P
=1.0
F/F6P
=2.0
F/F6P
=5.0
F/F6P
=10.0
Figure 48: Fatigue life estimation for 6P aerodynamic forcing.
On the other hand, consider Figure 49, which shows the fatigue life estimate under idealized wave loading.
The frequency range is restricted to bracket where wave energy is observed in the spectra shown in Figure 30.
Waveheights between 0.25m and 2.0m were considered, and the wind turbine was subjected to single-
component incident waves at the frequencies and waveheights shown in the legend. There are several
interesting things to note. First, the minimum fatigue life values under this idealized wave forcing are
significantly smaller than those seen for either the 3P or 6P aerodynamic loading. This implies that the wave
action has a bigger overall impact on the fatigue life assessment than the aerodynamic unsteadiness. Another
thing to note is that there is a strong bias in the fatigue life near approximately 0.25 Hz, which represents the
fundamental structural resonance. It should be noted that while 3P and 6P aerodynamic forcing occur at
discrete frequencies for a given rotor speed, and despite the fact that the fatigue assessment performed here
assumes incident wave forcing at a discrete frequency, in reality, wave action is a broadband process. Thus,
even when the sea is characterized by a wave frequency well below the support structure fundamental
frequency, there is still likely wave energy at the fundamental system resonance (this is demonstrated nicely in
Figure 33. As noted in the “Ocean Wave Forcing” section, about 15% of the time the wave climate at the
canonical wind turbine site can be characterized by a peak frequency that coincides with the fundamental
structural resonance. The broadband nature of wave forcing, and its importance for the wind turbine
system’s fatigue life, has dramatic implications for assessing the vulnerabilities of the period of vibration

EVALUATE THE EFFECT OF TURBINE PERIOD OF VIBRATION REQUIREMENTS ON STRUCTURAL DESIGN PARAMETERS
Page 89 of 129
requirement and for evaluating potential vibration mitigation and resonance avoidance strategies. These are
discussed in the “Synthesizing Analyses” section of this report. One additional thing to note is that the
fatigue life under idealized wave loading decreases rapidly at low frequencies despite the fact that the support
structure is stiffness dominated at these frequencies; the reason for this is two-fold. First, lower frequency
incident waves are typically associated with smaller magnitude unsteady forcing (as discussed in the “Ocean
Wave Forcing” section. Second, as the frequency of the applied force decreases, the duration to failure for a
given number of cycles exceeds rapidly.
0.05 0.1 0.15 0.2 0.25 0.3 0.35 0.4 0.45 0.510
0
101
102
103
104
105
106
Frequency, Hz
Fat
igu
e L
ife,
Yea
rs
H=0.25m
H=0.5m
H=0.75m
H=1.0m
H=2.0m
Figure 49: Fatigue life estimation for incident wave loading.
Figure 50 shows the fatigue life estimate under idealized bending moments applied at the RNA. The
frequencies shown correspond to the range of operating rotor rate. The magnitudes are commensurate with
those estimated in the “Turbine Imbalances” sections of this report, which tended to vary between 50kN-m
and 1000kN-m. The actual value is very much dependent on the nature of the imbalance and the phasing
between the different components of the imbalance. Nonetheless, it is clear that under the right
circumstances, with large imbalances (e.g., a 2% static mass imbalance) or the correct phasing between more
modest magnitudes of the different imbalances so that they are additive, the moments associated with these
imbalances are important for the fatigue life assessment.

EVALUATE THE EFFECT OF TURBINE PERIOD OF VIBRATION REQUIREMENTS ON STRUCTURAL DESIGN PARAMETERS
Page 90 of 129
0.1 0.15 0.2 0.25 0.3 0.35 0.4 0.45 0.510
0
101
102
103
104
105
106
Frequency, Hz
Fat
igu
e L
ife,
Yea
rs
M=100kN-m
M=200kN-m
M=500kN-m
M=1000kN-m
Figure 50: Fatigue life estimation for unsteady moments due to turbine imbalances.
Finally, the sensitivity of the support structure fatigue life under wind gusting was also evaluated. Both the
forcing on the blades and the forcing on the tower due to gusts were assessed, consistent with the discussion
in the “Aerodynamic Unsteadiness” section of this report. Figure 51 shows the fatigue life of the support
structure at the mudline under ideal loading of the blades by harmonic gusts at the turbine’s operating
condition. These contours of fatigue life are based on the estimated RMS forcing on the blades due to gusts
between frequencies bounding the support structure fundamental frequency; the constant magnitude force
over the frequencies shown in for the baseline case in Figure 51 is 9400N. It is clear that, depending on the
exact magnitude of the gusting, gust forcing on the blades can be an important mechanism for the fatigue life
evaluation of the support structure. A similar analysis performed for the gust forcing on the tower suggests
that this mechanism is of lesser importance than gust forcing on the blades and wave forcing on the pile.
However, unsteady vortex loading due to steady wind over the tower, which is applied to the tower similar to
the way unsteady gust loads are, can be problematic if the shedding process locks-in to the fundamental
structural frequency. This is discussed in the “Vortex Loading” section of this report; the situation is slightly
complicated by the pulsing flow due to the blade passing and the fact that the Strouhal number varies along
the length of the tower due to the changing tower diameter and atmospheric boundary layer effects (the
Strouhal frequency is equal to the fundamental support structure frequency about 10 meters above the free

EVALUATE THE EFFECT OF TURBINE PERIOD OF VIBRATION REQUIREMENTS ON STRUCTURAL DESIGN PARAMETERS
Page 91 of 129
surface). At the turbine design condition, and under the assumption of locked-in vortex shedding occurring
coherently in space, the fatigue life under this idealized loading is approximately 120 years. It should be noted
that this forcing mechanism results in unsteady lift on the tower that causes sway motions of the tower; the
1P loading, gust loading, and wave loading (assuming the gusts and waves are aligned with the steady wind,
which is a good assumption to first order) all act to cause tower surge primarily. Thus, in a more thorough
fatigue life assessment, the vortex shedding stresses would not add to the other important system stresses as
the same circumferential location on the tower.
0.2 0.22 0.24 0.26 0.28 0.310
0
101
102
103
104
105
106
Frequency, Hz
Fat
igu
e L
ife,
Yea
rs
F/FG
=0.5
F/FG
=1.0
F/FG
=2.0
F/FG
=5.0
Figure 51: Fatigue life estimation for unsteady blade forcing due to wind gusts.
DESIGN SENSITIVITY STUDIES
A set of design sensitivity studies was performed in order to determine which aspects of the wind turbine
system’s design are important for its structural integrity. These sensitivity studies attempt to quantify the
effect of changing different aspects of the system’s design on the fatigue life of the support structure, which is
currently the limiting structural design criterion for offshore wind turbines. The results of these sensitivity
studies also provide insight into potential limitations and vulnerabilities associated with the current “soft-
stiff” structural design philosophy and give context for choosing different resonance avoidance and vibration
mitigation strategies to evaluate throughout the remainder of this effort. The following sensitivity studies are

EVALUATE THE EFFECT OF TURBINE PERIOD OF VIBRATION REQUIREMENTS ON STRUCTURAL DESIGN PARAMETERS
Page 92 of 129
detailed in this report:
• Foundation properties
• Rotor-nacelle assembly (RNA) inertia
• Support structure effective stiffness (length and structural rigidity)
• Water depth
• Hydrodynamic added mass
• Aerodynamic damping
• Structural damping
Foundation Properties
One of the potential vulnerabilities with the current “soft-stiff” structural design methodology is that it
requires soil characteristics within a particular range, limiting potential sites for offshore wind turbine
installation and introducing an implicit reliance on static soil properties to achieve resonance avoidance.
Unfortunately, the properties of soil are not static and are subject to degradation over time. There are two
main phenomena that contribute to a reduction in foundation integrity over time: structural or cyclic
shakedown of the soil and pile scouring.
Cyclic lateral loading on piles in sand results in an increase in deflection, rotation and moment when
compared with the same pile-soil model under static loading. This is due to a decrease of the soil stiffness
and strength that is dependent on the magnitude of the lateral loading on the soil, the number of cycles, and
the character of the cycles (i.e., is the loading completely reversed). This effect is called structural shakedown.
For cyclically-loaded pile in an elastic-plastic soil, permanent deflections build up with an increasing number
of load cycles as residual stresses develop during load removal. DNV [4] and other regulatory agencies
recommend a modification to the standard static soil p-y curve to account for cases where the loading is
applied cyclically; this essentially results in a reduction in the effective soil stiffness. A more rigorous
treatment of the degradation of soils under cyclic lateral loading is the DSPY method [5], which is a
cumulative damage technique that accounts for magnitude, character, and number of cycles of the load.
The other phenomenon that contributes to the degradation of foundation integrity is scouring around the
pile. For installations without scour protections, which can be expensive, the scour depth near the pile can
attain values more than double the pile diameter. Scour reduces the fixity of the foundation and essentially
increases the unrestrained support structure length, which decreases the fundamental lateral natural
frequency.
The effects of both scour and shakedown are considered in this sensitivity study. The sensitivity of the
structural dynamics to scour is modeled by reducing the penetration depth of the foundation incrementally up
through 2.5 times the pile diameter. Shakedown is modeled by systematically varying the soil stiffness; this

EVALUATE THE EFFECT OF TURBINE PERIOD OF VIBRATION REQUIREMENTS ON STRUCTURAL DESIGN PARAMETERS
Page 93 of 129
also gives an indication as to the importance of siting offshore wind turbines in locations with particular soil
characteristics.
Figure 52 shows the dynamic amplification for three different foundations: the baseline design, the baseline
design installed in soil with half the baseline subgrade modulus, and the design sited in soil with twice the
baseline subgrade modulus. The former condition is consistent with “loose” sand (as designated by DNV),
while the former can be classified as “dense” to “very dense” sand, which is typical off the eastern coast of
Florida. It is clear from this figure that the stiffer subgrade modulus effectively decreases length of support
structure, increasing support structure stiffness and resulting in a higher fundamental resonant frequency. At
higher frequencies, foundation properties decouple from the RNA, resulting in little change in the resonant
frequency. Thus, foundation properties are unlikely to affect placement of higher frequency resonances.
10-2
10-1
100
101
10-4
10-3
10-2
10-1
100
101
Frequency, Hz.
RN
A D
yn
amic
Su
rge
Am
pli
fica
tion
, w
/wst
ati
c
Baseline
1/2 Subgrade Modulus
Twice Subgrade Modulus
Figure 52: Influence of Soil Stiffness on Support Structure Lateral Dynamics
Figure 53 shows the dynamic amplification for three different scour depths: the baseline design with no
scour, the baseline design with a pile diameter of scour depth, and the baseline design with 2.5 pile diameters
of scour depth. Interestingly, for the extreme latter case, there is no resonance near the baseline fundamental
mode; this situation occurs because the stiffness of the support structure is significantly greater than the
integrated stiffness of foundation, and thus the support structure is undergoing rigid body rotation about its

EVALUATE THE EFFECT OF TURBINE PERIOD OF VIBRATION REQUIREMENTS ON STRUCTURAL DESIGN PARAMETERS
Page 94 of 129
base. In all likelihood, the wind turbine system would fail before reaching such an extreme state, emphasizing
the need for scour mitigation for large diameter piles installed in regions with high current. Similar to the
case above, increasing the scour depth increases the effective length of the support structure, making it softer
and resulting in a lower fundamental frequency. As with the soil stiffness sensitivity study, this effect more or
less is decoupled from RNA motions in higher frequency modes.
10-2
10-1
100
101
10-4
10-3
10-2
10-1
100
101
Frequency, Hz.
RN
A D
yn
amic
Su
rge
Am
pli
fica
tion
, w
/wst
ati
c
Baseline
6m (1.0 Dp) Scour Depth
15m (2.5 Dp) Scour Depth
Figure 53: Influence of Foundation Scour Depth on Support Structure Lateral Dynamics
Rotor-Nacelle Assembly (RNA) Inertia
A sensitivity study was performed to look at how the support structure mudline bending stress due to
harmonic loading at the RNA changes as the RNA mass is changed. The results are shown in Figure 54. As
expected, increasing the mass of the RNA results in lower system natural frequencies. By increasing the RNA
mass and decreasing the system fundamental frequency, the fundamental system resonance becomes more
aligned with the peak energies in the broadband sources (wind and waves), which tend to be biased to lower
frequencies. Because these broadband sources are very important for the fatigue life of the system, as
discussed in the “Limit State Analysis” section of this report, moving towards design with more massive
RNAs may impact the structural design requirements negatively (i.e., necessitating stiffer support structures
which tend to be larger and more expensive). Another interesting observation is that the systems with more
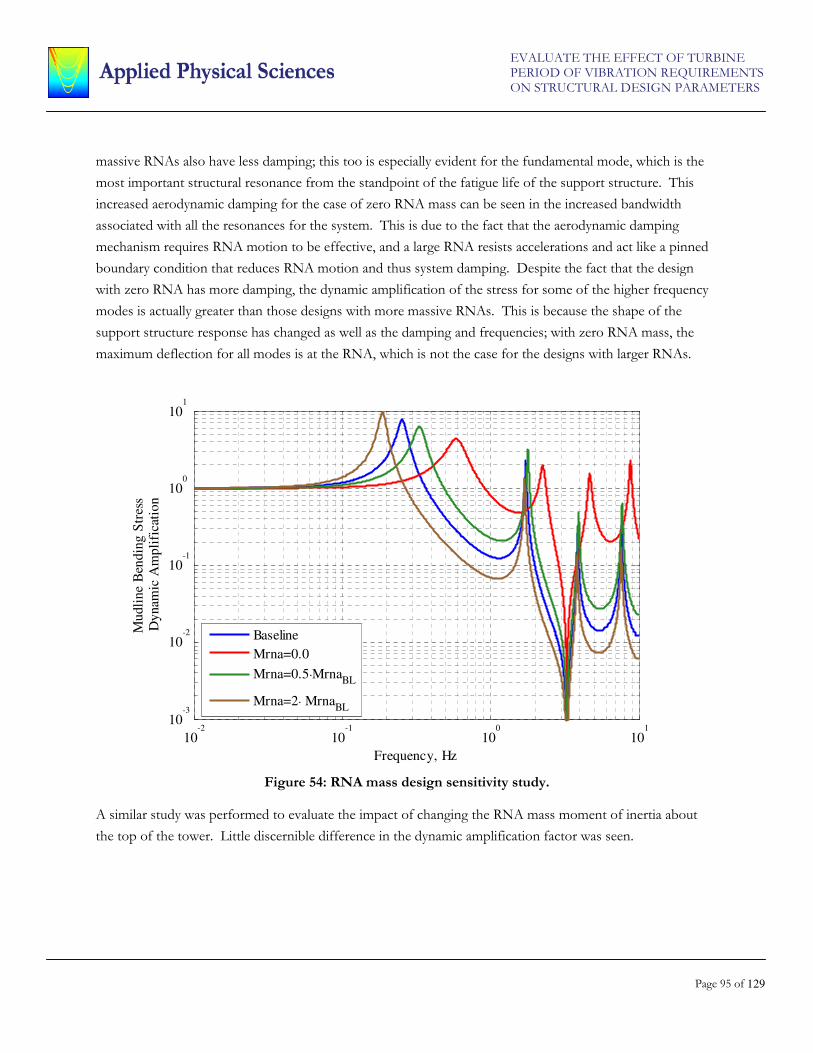
EVALUATE THE EFFECT OF TURBINE PERIOD OF VIBRATION REQUIREMENTS ON STRUCTURAL DESIGN PARAMETERS
Page 95 of 129
massive RNAs also have less damping; this too is especially evident for the fundamental mode, which is the
most important structural resonance from the standpoint of the fatigue life of the support structure. This
increased aerodynamic damping for the case of zero RNA mass can be seen in the increased bandwidth
associated with all the resonances for the system. This is due to the fact that the aerodynamic damping
mechanism requires RNA motion to be effective, and a large RNA resists accelerations and act like a pinned
boundary condition that reduces RNA motion and thus system damping. Despite the fact that the design
with zero RNA has more damping, the dynamic amplification of the stress for some of the higher frequency
modes is actually greater than those designs with more massive RNAs. This is because the shape of the
support structure response has changed as well as the damping and frequencies; with zero RNA mass, the
maximum deflection for all modes is at the RNA, which is not the case for the designs with larger RNAs.
10-2
10-1
100
101
10-3
10-2
10-1
100
101
Frequency, Hz
Mu
dli
ne
Ben
din
g S
tres
sD
ynam
ic A
mp
lifi
cati
on
Baseline
Mrna=0.0
Mrna=0.5⋅MrnaBL
Mrna=2⋅ MrnaBL
Figure 54: RNA mass design sensitivity study.
A similar study was performed to evaluate the impact of changing the RNA mass moment of inertia about
the top of the tower. Little discernible difference in the dynamic amplification factor was seen.
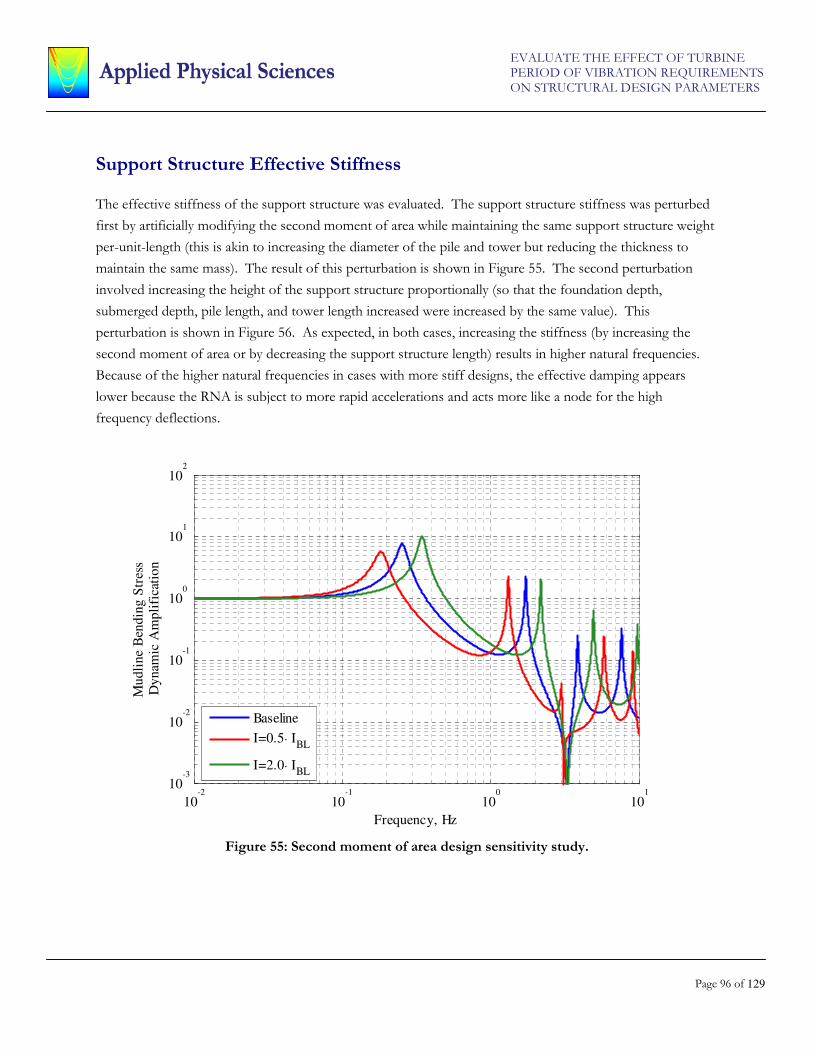
EVALUATE THE EFFECT OF TURBINE PERIOD OF VIBRATION REQUIREMENTS ON STRUCTURAL DESIGN PARAMETERS
Page 96 of 129
Support Structure Effective Stiffness
The effective stiffness of the support structure was evaluated. The support structure stiffness was perturbed
first by artificially modifying the second moment of area while maintaining the same support structure weight
per-unit-length (this is akin to increasing the diameter of the pile and tower but reducing the thickness to
maintain the same mass). The result of this perturbation is shown in Figure 55. The second perturbation
involved increasing the height of the support structure proportionally (so that the foundation depth,
submerged depth, pile length, and tower length increased were increased by the same value). This
perturbation is shown in Figure 56. As expected, in both cases, increasing the stiffness (by increasing the
second moment of area or by decreasing the support structure length) results in higher natural frequencies.
Because of the higher natural frequencies in cases with more stiff designs, the effective damping appears
lower because the RNA is subject to more rapid accelerations and acts more like a node for the high
frequency deflections.
10-2
10-1
100
101
10-3
10-2
10-1
100
101
102
Frequency, Hz
Mu
dli
ne
Ben
din
g S
tres
sD
ynam
ic A
mp
lifi
cati
on
Baseline
I=0.5⋅ IBL
I=2.0⋅ IBL
Figure 55: Second moment of area design sensitivity study.

EVALUATE THE EFFECT OF TURBINE PERIOD OF VIBRATION REQUIREMENTS ON STRUCTURAL DESIGN PARAMETERS
Page 97 of 129
10-2
10-1
100
101
10-3
10-2
10-1
100
101
102
Frequency, Hz
Mu
dli
ne
Ben
din
g S
tres
sD
ynam
ic A
mp
lifi
cati
on
Baseline
L=0.75⋅ LBL
L=2.0⋅ LBL
Figure 56: RNA support structure height sensitivity study.
Water Depth
As wind turbines move farther offshore to take advantage of larger wind resources, they are also being
installed in deeper water. A study was performed to assess the impact of increasing the water depth. The
support structure pile length was increased, but the foundation depth and tower height were maintained. The
results are shown in Figure 57. As can be seen, little change in the bending stress at the fundamental support
structure resonance results from changes in depth. For increases in water depth, there are some implications
for the higher system modes; however, from a fatigue standpoint, these modes have diminished importance
relative to the fundamental mode, as discussed in the “Limit State Assessment” section of this report.

EVALUATE THE EFFECT OF TURBINE PERIOD OF VIBRATION REQUIREMENTS ON STRUCTURAL DESIGN PARAMETERS
Page 98 of 129
10-2
10-1
100
101
10-3
10-2
10-1
100
101
102
Frequency, Hz
Mu
dli
ne
Ben
din
g S
tres
sD
ynam
ic A
mp
lifi
cati
on
Baseline
Lp=0.75⋅ LpBL
Lp=2.0⋅ LpBL
Figure 57: Water depth sensitivity study.
Aerodynamic Damping
The aerodynamic damping coefficient was artificially modified to understand how the bending stress changes
with changing aerodynamic damping. Aerodynamic damping has been found to be extremely important for
the fundamental mode, and much less important for the higher system modes, as demonstrated in Figure 58.
The reason for this is that at higher frequencies, the RNA mass acts like a node so there is little aerodynamic
damping in those modes. This is less of an issue for the fundamental support structure mode, where the
accelerations of the RNA are smaller and there are still motions of the turbine (which result in aerodynamic
damping effects). As expected, increasing the damping decreases the amplification of the bending stress at
the fundamental resonance.

EVALUATE THE EFFECT OF TURBINE PERIOD OF VIBRATION REQUIREMENTS ON STRUCTURAL DESIGN PARAMETERS
Page 99 of 129
10-2
10-1
100
101
10-3
10-2
10-1
100
101
102
Frequency, Hz
Mu
dli
ne
Ben
din
g S
tres
sD
ynam
ic A
mp
lifi
cati
on
Baseline
Baero=0.0
Baero=0.5⋅ BaeroBL
Baero=2⋅ BaeroBL
Figure 58: Aerodynamic damping sensitivity study.
Structural Damping
The structural damping coefficient was artificially modified to understand how the bending stress changes
with changing structural damping. This study is very similar to the one detailed above for aerodynamic
damping. In contrast to the aerodynamic damping, the structural damping mechanism is less important for
the fundamental mode, and more important for suppressing higher frequency system modes for reasons
already emphasized in the above discussion in the aerodynamic damping section. Because the fundamental
mode dominates the fatigue assessment, the results of this sensitivity study suggests that there is likely little
benefit to increasing the structural damping for fatigue purposes.

EVALUATE THE EFFECT OF TURBINE PERIOD OF VIBRATION REQUIREMENTS ON STRUCTURAL DESIGN PARAMETERS
Page 100 of 129
10-2
10-1
100
101
10-3
10-2
10-1
100
101
102
Frequency, Hz
Mu
dli
ne
Ben
din
g S
tres
sD
ynam
ic A
mp
lifi
cati
on
Baseline
Bstruct=0.0
Bstruct=0.5⋅ BstructBL
Bstruct=2⋅ BstructBL
Figure 59: Structural damping sensitivity study.
Hydrodynamic Added Mass
A systematic study was performed to determine the impact of modifying the hydrodynamic added mass; this
could be accomplished by adding fins to the submerged portion of the pile, for instance. No discernible
difference in the mudline bending dynamic amplification was seen by doubling and halving the added mass
coefficient.
SYNTHESIZING ANALYSES
Key observations extracted from the sensitivity studies and fatigue life assessments are summarized below.
The excitation of the fundamental resonant mode of the system dominates the response of the
system and its subsequent fatigue life. This is clearly demonstrated by the support structure dynamic
amplification factors shown throughout this report.
Because of the importance of the fundamental resonance, those forcing mechanism with energy at or
near (either discretely or in a broadband sense) the fundamental support structure resonance are

EVALUATE THE EFFECT OF TURBINE PERIOD OF VIBRATION REQUIREMENTS ON STRUCTURAL DESIGN PARAMETERS
Page 101 of 129
most important for the calculation of the fatigue damage. These include turbine imbalances (which
occur at 1P, below the fundamental resonant frequency in the nominal operating condition a
properly designed “soft-stiff” wind turbine system), wind gust forcing on the turbine, and wave
forcing on the pile. The last two of these are broadband sources and depend on the wave and wind
climate. Forcing due to aerodynamic spatial inhomogenities, such as the atmospheric boundary layer
and the tower blockage effect, tend to have reduced importance for the fatigue calculation owing to
the high frequencies at which they act (3P, 6P, and other multiples of blade passing, all of which are
much higher than the fundamental support structure mode) and the fact that their magnitudes are
more modest relative to other significant forcing mechanisms. The fact that the 3P loading is not
significant also can be attributed to the fact that the reference offshore wind turbine is designed such
that the fundamental structural frequency is detuned from 3P in accordance with the “soft-stiff”
design methodology.
It is interesting to note that while the reference wind turbine as defined by NREL does technically
adhere to the “soft-stiff” design philosophy, the fundamental support structure resonance of
approximately 0.25Hz is still very near the operating 1P frequency of the turbine (~0.2Hz). Other
offshore wind turbine systems in the literature, such as the 80 Horns Rev turbines off the West coast
of Denmark, have higher fundamental support structure natural frequencies (~0.5Hz) than does the
reference NREL turbine, and thus the significance of the 1P loading for these designs may be
somewhat reduced. These higher frequencies may be a result of the stiffer soil properties in the
North Sea; they also may be a product of larger diameter piles. In any event, these higher frequency
turbine support structures are approximately four times stiffer than the NREL reference turbine and
as a result are more representative of a soft-stiff design (i.e., isolated in frequency from both 1P and
3P). That the unsteady 1P loading due to turbine imbalances was deemed important despite the fact
that the NREL turbine adheres to the “soft-stiff” design methodology suggests that designers should
not only consider discrete coincidence of 1P and 3P with the fundamental support structure
resonance but should also acknowledge the fact that the dynamic amplification associated with the
fundamental resonance has finite bandwidth. Even those systems with 1P and 3P away from
resonance can still be excited in the fundamental mode.
Because the fatigue life evaluation is highly dependent on broadband sources such as gusts and water
waves, characterizing these forcing mechanisms correctly is extremely important in a thorough
fatigue life investigation. This requires careful site-dependent METOC measurements and analysis.
This is complicated because the support structure fundamental frequency is typically above the
frequencies of the wind and wave spectra at which the peak spectral energy occurs. Thus, not only
must the wind and wave climate be properly defined, but for design purposes the wave and wind
spectral tails must be properly parameterized.

EVALUATE THE EFFECT OF TURBINE PERIOD OF VIBRATION REQUIREMENTS ON STRUCTURAL DESIGN PARAMETERS
Page 102 of 129
Aerodynamic damping is a dominant damping mechanism for the fundamental mode of the support
structure, where the RNA has significant motion. However it is a minor contributor to the damping
of higher modes of vibration, where the RNA acts as a pinned support to the tower. For those
higher modes, the structural damping dominates. Because of the importance of the fundamental
mode in the fatigue life assessment, strategies that rely on increasing the aerodynamic damping are
viable. Such design strategies include reduced RNA mass for a given support structure stiffness and
reduced support structure stiffness for a given RNA mass. However, both these change the system
resonance, and there's clearly a tradeoff among different competing factors: proximity to the
fundamental resonance; proximity to energy concentration of broadband forcing (wind and waves);
and level of aerodynamic damping. In addition, the aerodynamic damping is not present during
parked operations of the turbine, and this vulnerability should be considered as well.
The accuracy of predicted aerodynamic blade load amplitudes and system resonant frequencies is
limited. The blade load amplitudes are time dependent on the inflow characteristics, which are time
dependent. The resonant frequencies are sensitive to the soil and foundations characteristics, which
are also time dependent (e.g. scouring effects). Scouring and reduction in foundation integrity over
time are especially problematic because they reduce the fundamental structural resonance of the
support structure, aligning that resonance more closely to the lower frequencies at which much of the
broadband wave and gust energy is contained. The resonant characteristics are best determined by
controlled vibrations tests after system installation. The major value of analysis is in identifying the
critical parameters governing system performance (e.g. parametric studies) and assessing alternative
resonance avoidance strategies.
The frequency bandwidth of the turbine blade forces (1P, 3P) is considerable, as determined by the
wind speed operating range of the system. When coupled with the presence of multiple system
resonances, the time dependence of their frequencies, and the uncertainties in the predictions this
causes the operating box within the Campbell diagram to become very small.
The dominant bending stresses in the support tower occur near the mudline, which is close to the
support location, for the fundamental tower mode. However the high stress locations, and potential
fatigue failure locations, move to alternate locations along the tower for higher frequency modes, for
which the bending wavelengths reduce and the nodes distribute along the tower. The significance of
this depends on the contribution level of these higher modes. Its significance is diminished by
increased damping of those higher frequency modes.
The sensitivity studies illustrate trends which make physical sense. For example, an increase in RNA
mass reduces the fundamental resonant frequency of the tower. This may prove to be a concern
EVALUATE THE EFFECT OF TURBINE PERIOD OF VIBRATION REQUIREMENTS ON STRUCTURAL DESIGN PARAMETERS
Page 103 of 129
with direct-drive turbine designs, which all else being equal have heavier nacelle assemblies. There
are approaches for reducing the overall system weight in direct-drive designs; these designs will not
suffer from reduced aerodynamic damping. However, they must be carefully assessed to ensure that
no other structural dynamic vulnerabilities are introduced.
VIBRATION MITIGATION AND RESONANCE AVOIDANCE
TECHNIQUES
Several vibration mitigation and resonance avoidance techniques have been identified. The most promising
of these were selected, on the basis of the insights from the analysis detailed in the preceeding sections of this
paper, and were analyzed in more detail to understand and quantify their impact on the structural design of
the offshore wind turbine support structure and the period of vibration requirements. Specifically, the
following techniques are considered:
• Controllable speed turbines
• Breakwaters
• 3P mitigation techniques
Controllable Speed Turbines
A controllable speed turbine can be used to enable detuning of dominant discrete frequency forcing functions
from lightly damped resonances of the system. This is a classic approach that is often used in rotating
machinery noise and vibration control (e.g. centrifugal pumps). For the wind turbine, the dominant discrete
frequency forcing function is at the turbine fundamental rotational frequency and potentially its blade passing
frequency. A controllable speed turbine enables detuning of the dominant forcing functions from problem
structural resonances, even if the resonance frequencies shift over time due to changes in soil or foundation
characteristics (e.g. scouring). This is accomplished by adjusting the speed of the turbine through variable
pitch airfoils, such that turbine forcing functions are offset from frequencies corresponding to problem
resonances over the operating range of inflow conditions. Sensors embedded in the wind turbine condition
monitoring system are used to identify the dominant resonance frequencies as a function of time. Such a
controllable speed capability relaxes the constraint of maintaining a fixed resonance frequency between
dominant forcing function frequencies over the operating range of the turbine, as discussed with the
Campbell diagram.
One problem sometimes encountered with variable speed machinery is the coincidence of multiple forcing
function frequencies with multiple resonance frequencies of the system. Detuning one particular set of
forcing functions and resonances can lead to a tuning in of a different set. For wind turbines, this potential
concern is mitigated by the limited number of low frequency resonances of concern. It is also mitigated when

EVALUATE THE EFFECT OF TURBINE PERIOD OF VIBRATION REQUIREMENTS ON STRUCTURAL DESIGN PARAMETERS
Page 104 of 129
the dominant discrete forcing function is limited to the rotational frequency and possibly a few harmonics.
Optimized damping of the wind turbine structure further minimizes any potential concerns from excitation
of higher frequency resonances.
The degree of speed control required for detuning from a resonance is dependent on the damping level of the
resonance and the degree of amplitude reduction required. For lightly damped resonances, where the
resonance bandwidth is small, the degree of detuning required for a given amplitude reduction is minimized.
It is also important to consider whether any system changes, such as those due to foundation degradation or
scouring, result in resonance coincidence, as these changes can be compensated for by using controllable
speed. Controllable speed turbine detuning addresses the issue of resonance coincidence with discrete
frequency forcing functions. However it does not mitigate the concern with excitation of lightly damped
resonances by forcing functions such as breaking waves and turbulent air gusts which have a broader range of
frequency content than tonal sources such as rotation and blade passing. Those issues require different
mitigation approaches.
It should be noted that many large modern wind turbines already use controllable speed for power
conditioning purposes and to maximize aerodynamic performance. Thus, the infrastructure is already present
to use this technology to detune problem resonances from excitations. However, this may be accomplished
at the loss of aerodynamic performance, as the turbine may be required to operate off its ideal speed to
decouple 1P or 3P from important natural modes.
Breakwaters
This study has identified the importance of broadband forcing mechanisms in determining the overall fatigue
life of offshore wind turbines. One forcing mechanism traditional land-based wind turbines are not subject
to is ocean wave loading. Based on fatigue life estimates, ocean wave loading and wave pile interactions are
large contributors to the overall fatigue damage accumulation for offshore wind turbine systems. It is
therefore important to understand potential ways to mitigate the forces resulting from the wave pile
interaction.
One way to reduce the net wave loading on the pile is to install a breakwater near the pile. Breakwaters are
commonly installed offshore in coastal areas to protect sensitive coastlines from erosion. The presence of the
breakwater diffracts the incident wave, redistributing the energy spatially in the wavefield. This redistribution
of energy in the wavefield suggests that there are locations downstream of the breakwater with lower wave
amplitudes than would occur if the breakwater were not present. Because of the locally lower amplitude
waves, the velocities and accelerations in the water column (i.e., vertically from the free surface to the water
bottom) have the potential to be significantly lower than they would be without the breakwater present. As

EVALUATE THE EFFECT OF TURBINE PERIOD OF VIBRATION REQUIREMENTS ON STRUCTURAL DESIGN PARAMETERS
Page 105 of 129
discussed in the “Wave Forcing” section of this report, the wave particle accelerations and velocities
determine the overall force imparted on the pile via the Morison equation. A reduction in velocity and
acceleration applies a reduction in overall wave loading. Breakwaters also have the potential for steepening
the wave in certain locations, which can lead to wave breaking and energy dissipation.
For wind farms, it is clearly advantageous to minimize the overall dimensions of the breakwater to reduce
overall installation costs. It is also important to understand how to place the breakwater to maximize its
benefits and to realize that the performance of a breakwater with a given configuration will depend on the
water depth, wave frequency, and breakwater configuration.
In order to evaluate the effectiveness of mitigating different breakwater configurations and assess the
potential reduction in overall forcing from waves due to the presence of the breakwater, the linear
hydrodynamic seakeeping tool AEGIR was used to do a parametric study. AEGIR is a medium fidelity
numerical code for simulating the three-dimensional flow around a body operating on a free surface at zero,
low and high speed. It was originally developed by Kring (1999) who integrated the work of Kring (1994),
Maniar (1995) and Danmeier (1999) into a Rankine panel method to simulate seakeeping problems in the
time domain. Over the last decade it has been extended to model steady flows around the hulls of sailing
yachts and multi-hull vessels (Kring et al, 2004) (Stern et al, 2006), to simulate the seakeeping of multi-body
configurations (Peltzer et al, 2008), to perform multi-disciplinary dynamic simulations of high-speed craft
(Hall et al, 2009) and used to predict the hydrodynamics for multivariate design optimization of high-speed
multi-hulls. The code includes options for either linear or nonlinear treatment of the free surface boundary
conditions. It has an integrated set of computational geometry algorithms for automating discretization of
surfaces on the body and free surface as part of code execution and includes the functionality to directly read
files in the native Rhinoceros format, providing the capability to quickly set up analyses of new concepts
given a CAD representation. The integrated NURBS-based geometry capability is a key element to enhancing
the utility of the AEGIR for concept design studies and hullform design optimization. It has been
extensively validated for a variety of problems of interest to the US Department of Defense and industry and
is developed on an ongoing basis.
AEGIR makes a number of assumptions, which have varying degrees of applicability for this problem:
• The fluid can be treated as irrotational and inviscid, and therefore can be modeled using potential flow. Thus, no fluid separation effects are included, which depending on the breakwater configuration may not be appropriate in the region just downstream of the breakwater. However, this area of separated flow is likely not a good place to position the pile, as there is likely significant unsteadiness in this region that can excite pile vibrations. Outside this region, the likely placement of the pile, the assumptions of irrotational, inviscid flow are appropriate.
• The free surface boundary conditions can be linearized about the design waterline. This is appropriate for small amplitude waves and does not correctly capture wave runup effects along the

EVALUATE THE EFFECT OF TURBINE PERIOD OF VIBRATION REQUIREMENTS ON STRUCTURAL DESIGN PARAMETERS
Page 106 of 129
pile. Thus, it should be expected that near the waterline, the velocities predicted in large amplitude waves may not be accurate.
• The incident wave field can be modeled using finite-depth linear incident waves. As a result, only waves with small heights relative to their lengths are validly represented.
To assess the potential benefits of using breakwaters to mitigate wave forcing on piles, a set of simulations
was performed in AEGIR to understand how the pile configuration affects the diffraction pattern and what
reduction in overall velocities at the pile can be expected as a result in the breakwater. The specific cases
analyzed are shown in Table 7. Because linear potential flow is being used, it is possible to normalized by a
meter amplitude wave and assume the results scale linearly with amplitude. Waves with periods of 4 seconds
and 10 seconds are considered; the 4 second wave coincides with the support structure later natural
frequency, which was shown to be the most important resonance to avoid in the interest of avoiding fatigue
damage accumulation. As a result, the breakwater design was optimized for the 4 second wave frequency.
The 10 second wave case is included to determine the effectiveness of the breakwater treatment in longer
incident waves and assess whether the performance for incident waves other than the optimal case suffers
from a significant increase in wave velocities and accelerations. Long-crested, single component waves
propagating perpendicular to the breakwater are assumed. While not truly representative of the short-crested,
broadband nature of real ocean systems, this assumption can be justified by the linearity assumption, which
suggests that the short crested case can be generated from a summation of long-crested, narrow-band waves.
The water depth is 15m, consistent with the depth used throughout this report and representative of
bathymetry in the Block Island Sound.
Table 7: Breakwater Configurations Analyzed
Case Breakwater
Height, m
Breakwater
Width, m
Separation of Pile
and Breakwater, m
1 5 12 6
2 10 12 6
3 12.5 12 6
4 10 6 6
5 10 12 12
6 10 12 3
7 12.5 150 12
Consider the three figures, which show an AEGIR simulation of the Case 3 breakwater configuration in a 4
second undisturbed incident wave. The extent of the breakwater is outlined in black, and the simulation
employed symmetry so that the results should be considered mirrored about the bottom edge of the domain.
The long-crested, monochromatic nature of the undisturbed incident wave is obvious. A meter amplitude
wave is used, consistent with the linear assumption. The breakwater interacts with the incident wave and
diffracts it; the presence of the wave redistributes energy in the wave field. The diffracted wave pattern is

EVALUATE THE EFFECT OF TURBINE PERIOD OF VIBRATION REQUIREMENTS ON STRUCTURAL DESIGN PARAMETERS
Page 107 of 129
shown in the second plot; the diffracted wave is 90 degrees out of phase with the incident wave on the
symmetry plane (i.e., the centerplane of the breakwater). The sum of the undisturbed incident and the
diffracted wave patterns is shown in the final figure; this is the actual wave field that would be expected
downstream of the breakwater in the vicinity of the pile. It is clear that the introduction of the diffracted
wave pattern increases the overall wave elevation in some locations downstream of the breakwater and
decreases it in other relative to the undisturbed case. It is advantageous to place the pile in a location where
the overall net wave elevation is reduced relative to the undisturbed incident wave case; this will ensure that
the fluid velocities and accelerations, which the force on the pile is proportional to, are reduced relative to the
case if the breakwater were not present. A position in the diffracted wave field that satisfies this condition
was chosen, and it is called out in the final figure.
Figure 60: Incident wave pattern.

EVALUATE THE EFFECT OF TURBINE PERIOD OF VIBRATION REQUIREMENTS ON STRUCTURAL DESIGN PARAMETERS
Page 108 of 129
Figure 61: Diffracted wave pattern.

EVALUATE THE EFFECT OF TURBINE PERIOD OF VIBRATION REQUIREMENTS ON STRUCTURAL DESIGN PARAMETERS
Page 109 of 129
Figure 62: Total wave pattern (incident plus diffracted by breakwater) and optimal location of pile.
Figure 63 shows the magnitude of the fluid velocities at this position as a function of depth in the water
column relative to the undisturbed wave velocity at that point for Cases 1 and 3. Note that there is
approximately a 20% reduction in velocity, which implies a 20% reduction in acceleration (due to the linearity
of the problem) throughout the depth for Case 3; Case 1 is very similar to the undisturbed case, which
suggests no reduction in velocity and that this breakwater configuration is not effective. This is because the
disturbance associated with the incident wave attenuates with depth; for short waves with lower periods, this
attenuation with depth occurs more rapidly. Thus, the shallower breakwater (Case 1) does not influence the
fluid velocities of the overall wave system because the overall disturbance at that depth due to the incident
wave is small; the breakwater must interact with the incident wave to be effective, and therefore the Case 1
configuration is not effective for the 4 second wave. This suggests that the breakwater will need to be quite
near the free surface to be effective at diffracting waves with frequencies near the fundamental support
structure natural frequency. A cost-benefit analysis needs to be performed to determine whether it is more
cost-effective to install a tall breakwater to mitigate the wave loads on the pile or to design the pile more

EVALUATE THE EFFECT OF TURBINE PERIOD OF VIBRATION REQUIREMENTS ON STRUCTURAL DESIGN PARAMETERS
Page 110 of 129
robustly without a breakwater so as to withstand the wave loads.
0 0.1 0.2 0.3 0.4 0.5 0.6 0.7 0.8 0.9 1-14
-12
-10
-8
-6
-4
-2
Velocity (m/s)
Dep
th (
m)
Incident Wave
Shallow Breakwater, 5m
Deep Breakwater, 12.5m
Figure 63: Diffracted incident wave velocities in a long-crested 4 second wave.
Figure 64 shows the magnitude of the fluid velocities at the pile position as a function of depth in the water
column relative to the undisturbed wave velocity at that point for Case 3. Note that even though the pile
placement was optimized for a 4 second wave, there is still an overall reduction in fluid velocities when the
system is subject to a 10 second wave.

EVALUATE THE EFFECT OF TURBINE PERIOD OF VIBRATION REQUIREMENTS ON STRUCTURAL DESIGN PARAMETERS
Page 111 of 129
0.35 0.4 0.45 0.5 0.55 0.6 0.65 0.7 0.75 0.8 0.85-14
-12
-10
-8
-6
-4
-2
Velocity (m/s)
Hei
gh
t (m
)
Incident Wave
Shallow Breakwater, 5m
Figure 64: Diffracted incident wave velocities in a long-crested 10 second wave.
3P Mitigation Techniques
Although not explicitly addressed in detail here due to assumptions related to the reference wind turbine
design, some wind turbine designs may benefit from mitigation of interactions among the fundamental
support structure resonance and the 3P forcing mechanism. For this particularly reference wind turbine, the
fundamental frequency (0.25 Hz.) is biased to the low frequency range of the soft-stiff regime. As a result,
interactions with the 1P forcing mechanisms, characterized by mass and aerodynamic imbalances, are most
important for this wind turbine. However, many wind turbines are more representative of the soft-stiff ideal
and have fundamental frequencies near 0.5 Hz; examples include the 80 Horns Rev turbines off the West
coast of Denmark. For turbines with natural frequencies nearer 3P than 1P, it is likely that the 3P forcing
mechanisms are more important for the fatigue life damage assessment than has been concluded here for the
NREL 5MW machine.
Several techniques may be used to mitigate 3P excitation of the wind turbine system. In general, these
techniques reduce the spatial and temporal coherence among the blades and the tower, which reduces the
aerodynamic discontinuity experience by the blades as the pass the tower. This discontinuity is the main
cause of the 3P loading (the other significant contributor being the earth’s boundary layer).

EVALUATE THE EFFECT OF TURBINE PERIOD OF VIBRATION REQUIREMENTS ON STRUCTURAL DESIGN PARAMETERS
Page 112 of 129
These strategies include:
• Skewing wind turbine blades.
• Using a space-truss support structure in way of the blades.
• Employing controllable pitch systems.
ADVANCED TURBINE DESIGNS
Many new advanced turbine designs have been introduced to improve upon the current designs considered
for offshore application – namely, horizontal axis wind turbines mounted to piles. These advanced designs
have the potential to significantly change the structural dynamic response of the system and the specific
period of vibration requirements that ought to be applied when assessing these designs. The following
advanced designs are analyzed:
• Vertical axis wind turbines
• Gearbox-less wind turbines
• Floating wind turbines
• Jacketed structures
• Multi-stage and shrouded designs
Vertical Axis Wind Turbines
Vertical axis wind turbines are a relatively established technology that orients the blade axis vertically as
opposed to horizontally. These turbine designs were explored extensively by SANDIA during the latter
portion of the 20th century. A literature search reveals some interesting insights about the relative merits of
vertical axis designs relative to horizontal axis designs. A 1996 paper by Dale Berg at Sandia compares
VAWT technology with HAWT technology. It concludes that the VAWT is inherently more difficult to
understand and model, both for aerodynamics and structures. It notes that few new companies have elected
to pursue the more complicated technology associated with VAWT as a result of this fact. Perhaps most
importantly, the paper’s authors observe that unsteady loads on the blades of VAWT are larger than on the
blades of HAWT, so take considerably more attention to predict these unsteady loads, doing very complete
evaluation of fatigue strength of the blades, and having an adequate database for the fatigue properties of
candidate materials. Several SANDIA reports corroborate this fact, and indicate that the design of vertical
axis systems is complicated but not impossible. The reason for this is the principle of operation of a vertical
wind turbine. As the blades of a VAWT spin, the effective angle of attack of the flow over the blade fully
reverses over a full rotation. As a result, the forces on the blades arising from the rotation (a component of
which maintains the angular momentum of the blades) are fully-reversed during a cycle. Contrast this with
the horizontal axis wind turbine, which experiences aerodynamic unsteadiness at 3P due to aerodynamic
inhomogeneities in the flow field resulting from the tower blockage effect and the earth’s boundary layer.

EVALUATE THE EFFECT OF TURBINE PERIOD OF VIBRATION REQUIREMENTS ON STRUCTURAL DESIGN PARAMETERS
Page 113 of 129
The unsteady loading due to 3P is a small perturbation about large steady aerodynamic forces exerted on the
blades.
As a general rule, VAWTs produce somewhat less power per unit swept area than HAWT’s, especially at
lower wind speeds. This is an important point, because the Earth’s atmospheric boundary layer retards the
overall velocity of the wind near As a result, these systems tend to be more expensive considering life-cycle
costs than comparable HAWTs. Additoinally, the vertical axis systems require guy wires, which increase their
overall footprint and installation costs.
Much of the preceding research and conclusions are based on analysis of land-based wind turbines. There
are, however, some potential advantages for sea-based VAWTs (particularly on floating platforms). These
include:
• The oceanic boundary layer is thinner, so the difficulty building tall VAWT is less of an issue offshore.
• VAWT’s have efficiencies more comparable to HAWT’s at higher wind speeds over water due to the reduced turbulence in the atmospheric boundary layer over water than over land. As a result, the benefit of being higher (as in the case of a horizontal wind turbine) is less pronounced over water.
• Footprint size is not as problematic an issue at sea, so the need for additional mooring to provide the function of guy cables on land is not a problem at sea.
• The VAWT has a lower center of gravity and smaller overturning moment than an equivalent horizontal axis wind turbine, so are more suitable for floating offshore turbines which must be statically stable (thus requiring lower CG) and counteract the overturning moment with hydrostatic restoring and mooring.
• The VAWT generator is at the bottom, simplifying maintenance and allowing the use of big, heavy generators if necessary without the static and dynamic drawbacks that large nacelles on horizontal axis systems are associated with.
• VAWT’s are inherently omni-directional and do not need to be aligned with the predominant wind direction, which is required of horizontal axis systems.
For land-based applications, much of the federal research money has gone into very large, utility-sized wind
turbines where the ability of HAWT machines to get way above the earth and into higher wind speeds will
make any economic analysis favor HAWT machines. So federal funding for VAWT research essentially
ended after the Sandia 34-m Darrieus demonstrator. Thus, despite the factors enumerated above which
seems to suggest that this technology may be promising for application offshore, especially floating
applications, the marketplace (what vendors are offering, what has been proven in service, what do customers
feel comfortable with, what will insurance companies insure, what can be certified by a regulatory agency,
etc.) may be much more important drivers than technical merit and may interfere with wide-scale adoption of
vertical axis systems for application offshore.

EVALUATE THE EFFECT OF TURBINE PERIOD OF VIBRATION REQUIREMENTS ON STRUCTURAL DESIGN PARAMETERS
Page 114 of 129
Gearbox-less Wind Turbines
Most wind turbines incorporate a mechanical gearbox in line with the electric generator to accept the slow-
speed/high-torque power delivered from the blades/hub and convert it to high-speed/low-torque power
presented to the electric generator, Figure 65. High speed (>1000 rpm) generators can then be used that are
relatively light weight and small.
Electric
GeneratorGearbox
Connection
for Blades
Hub
Figure 65: Typical wind turbine power takeoff configuration.
The gearbox of a wind turbine is subjected to stochastically varying loads due to the wind speed fluctuations
and has been identified in a number of studies as a reliability issue. A failure of this single component can
cause significant downtime for replacement or repair, Figure 66. A recent survey of the reliability of wind
power systems in Sweden, Germany and Finland [21] found the gearbox to be the most problematic
component because downtime per failure is high compared to other components. Reliability data for large
wind turbines (>1000 kW) show trends toward higher, ever increasing failure rate when compared to smaller
turbine designs [21], reportedly because of the higher stresses from the wind loading of the larger blades. For
a typical turbine, 20% of the downtime is caused by gearbox failures and the average gearbox failure requires
an average of more than 250 hours to repair. Similar studies of UK offshore wind turbines conclude that the
gearbox is one of the largest sources of unplanned maintenance downtime. To address this situation, some
turbine manufacturers have been moving to direct-drive systems where a low-speed/high-torque electric
generator is used to eliminate the need for the mechanical gearbox entirely. While this may seem an elegant
solution to the gearbox problem, direct-drive wind turbines have heavier nacelle generator plus gearbox
weights relative to traditional mechanical gearboxes. As wind turbine economics continually pushes their
design toward systems with larger mega-watt ratings, lifting direct-drive components high into the air for
assembly is now approaching technical and economical feasibility limits. A recent paper [22] reported that a
direct-drive system for a 1.5 MW wind turbine was about 20 tons heavier in the towerhead components than
a geared design. As noted in the analysis detailed in the preceding sections, increase in overall weight of the

EVALUATE THE EFFECT OF TURBINE PERIOD OF VIBRATION REQUIREMENTS ON STRUCTURAL DESIGN PARAMETERS
Page 115 of 129
RNA decreases the fundamental natural frequency and tends to reduce the overall damping of that mode due
to aeroelastic effects. In addition, the direct-drive system is more expensive due to the cost of the larger
generator and supporting components. There is, however, evidence in the literature, particularly that
provided by turbine manufacturers, that other changes to the wind turbine itself can be made to help offset
the increased weight of the direct-drive system. One such technique utilizes higher speed, smaller diameter
turbines; if the weight penalty associated with moving to direct-drive is minimal, then there is no structural
dynamic penalty as the aerodynamic damping is still effective. However, there must be a careful assessment
of whether the changes made to the system introduce new structural dynamic vulnerabilities. For example,
using higher speed rotors results in higher tip velocities, and lighter turbine blades come with vibration
challenges as well.
For a given rotor imbalance, the higher RPM will lead to higher rotational force levels. The higher RPM also
positions the rotational and blade passing forces higher in frequency over the operating range. This may have
ramifications to the soft-stiff structural design strategy.
Higher tip velocities will aggravate blade passing forces, and generate higher turbulent flow forces over the
blades, potentially leading to increased noise. The lighter blades will result in higher blade vibration responses
to rotational forces off resonance. There are noise and vibration mitigation strategies which could address
these concerns, but their ramifications to the integrated structural design of the offshore wind turbine of must
be addressed.
Figure 66: Typical gearbox failure. [22]
An emerging and novel technology that might achieve the important benefits of direct-drive systems without
incurring any of the potential weight and cost penalties is the magnetic gearbox. Recent application of high
power density permanent magnets (PM) to an innovative magnetic circuit topology has resulted in magnetic

EVALUATE THE EFFECT OF TURBINE PERIOD OF VIBRATION REQUIREMENTS ON STRUCTURAL DESIGN PARAMETERS
Page 116 of 129
gearbox designs that represent a revolutionary development (Figure 66, [23 & 24]). The new magnetic
gearbox utilizes magnetic poles instead of gear teeth so there is no metal-to-metal contacting parts within the
gearbox. A number designs have been presented in the literature and demonstrate successful operating scale-
size machines. While additional development and testing is required before a full-size magnetic gearbox can
be used to replace mechanical gearboxes for wind turbine applications, such a replacement has a number of
very compelling features.
Table 1 provides a comparison of the diameters, weights, costs and losses of three commonly used wind
turbine systems [27]: (1) the doubly-fed induction generator with three-stage mechanical gearbox (IG-3G),
(2) the direct-drive synchronous generator which has no gearbox (DD-SG), (3) and the direct-drive
permanent magnet generator, which also has no gearbox (DD-PMG). All three systems were set to the same
rating: a 3 MW/15 rpm wind turbine with a rated wind speed of 12 m/s. Table 8 shows that while direct-
drive systems have no gearbox penalty (weight, cost or losses), they are significantly larger in diameter (6
times), 4.6 to 8.6 times heavier, have about the same losses and are 6% to 13% more costly than the standard
geared system in column 2 (the induction generator with 3-stage gearbox, IG-3G). The fact that the IG-3G is
the lightest and lowest cost system and because it can be built from standard components of copper and iron
explains why it is the most widely used commercial system. It is interesting to note that of the total system
losses for the IG-3G (763 MWh), 533 MWh or almost 70% are losses due to the gearbox indicating that
gearbox efficiency is also an important issue for geared systems.
Table 8: Comparison of Three Common Wind Turbine Generator Systems [8] Characteristic IG-3G DD-SG DD-PMG Rated Grid Power, MW 3 3 3 Rated Wind Speed, m/s 12 12 12 Rated Speed, RPM 15 15 15 Stator Diameter, m 0.84 5.0 5.0 Total System Weight, tonne 5.25 45.1 24.1 Total Cost 1870 2117 1982 Total Losses, MWh 763 739 513

EVALUATE THE EFFECT OF TURBINE PERIOD OF VIBRATION REQUIREMENTS ON STRUCTURAL DESIGN PARAMETERS
Page 117 of 129
Figure 67: The major components of a magnetic gear.
A transition from traditional mechanical gearboxes to magnetic gearboxes could potentially result in the
following benefits:
• Substantially Improved Reliability and Reduced Maintenance. Because of the elimination of
contacting gear teeth there is no frictional contact losses, no mechanical fatigue and no wear or wear
particles to contaminate the magnetic gear. The magnetic gear has the ability to operate in harsh
environments with exposure to the weather, dust, sand, spray and other contaminants as well as in
high pressure/temperature conditions or even fully immersed in fluid.
• Overload Protection. Overload protection and precise peak torque transmission control is achieved
because magnetic gearboxes which exceed their torque rating during transient overloads, such as
wind gusts, slip poles without any gear damage instead of breaking or damaging gear teeth and
causing a gearbox failure.
• Increased Efficiency. A well designed magnetic gearbox system has a potential efficiency of
>97%, while no mechanical gearbox can approach such efficiency due to inherent frictional losses.
The new magnetic gearboxes represent a significant increase in torque-density over previous
magnetic gears, because all poles are engaged at all times instead of only a pair of poles producing
torque. Torque-density ratings are as large as two and three stage mechanical gearboxes are possible.
• No Lubrication Required. There is no gear lubrication required and no concerns for foreign
contaminants. The elimination of large lubricated gears means elimination of the separate lube oil
system with pumps, purifiers, filters, strainers, heat exchangers and coolers, piping, valves, storage

EVALUATE THE EFFECT OF TURBINE PERIOD OF VIBRATION REQUIREMENTS ON STRUCTURAL DESIGN PARAMETERS
Page 118 of 129
tanks, etc. This represents a large towerhead weight savings.
• Improved Acoustics. The mechanical gearbox is a significant contributor to the acoustic output of
a wind turbine system which is becoming an issue for locating in urban areas. Magnetic gearboxes
have a very low acoustic signature compared with mechanical gearboxes because of elimination of
mechanical contacts which produce vibrations and noise. Physical isolation between the input and
output shafts also provide enhanced mitigation of vibration and noise transmission throughout the
wind turbine components and towerhead platform.
• Potential for Integration with Electric Generator. When integrated with the design of a
permanent magnet generator [25] the integrated generator-magnetic gearbox offers a significant
increase in torque density over conventionally-geared systems.
The new magnetic gearbox consists of three components: an inner high speed permanent magnet rotor, a ring
of steel pole pieces and an outer ring containing magnets attached to the inner bore. Typically two of these
three components are allowed to rotate while the third is fixed. If the inner rotor and steel pole-pieces rotate
and the outer magnet ring is fixed the two rotary members move in the same direction but at different speeds
related by the gear ratio. Alternately, if the inner rotor and outer magnet rings rotate while the steel pole-
pieces are fixed the rotating members rotate in opposite directions again at speeds related by the gear ratio. It
is also possible to allow all three members to rotate (contra-rotating mode) with an approximate doubling of
the gear ratio and the ability of the magnetic gear to accept two inputs to deliver to the load, [26].
Figure 68: Magnetic gear block diagram showing contra-rotating concept. When both the outer rotor and the pole-pieces rotate with the same speed in opposite directions, the resulting gear ratio is
doubled. [26]
The steel pole-pieces located between the inner and outer magnet arrays modulate the magnetic field
produced by both sets of permanent magnets. The modulation of the fields by the steel pole-pieces produces
a dominant field harmonic in each air gap having exactly the same number of poles as that air gap’s magnet
array with the result that torque transmission and gearing is produced. With the outer magnet array fixed and

EVALUATE THE EFFECT OF TURBINE PERIOD OF VIBRATION REQUIREMENTS ON STRUCTURAL DESIGN PARAMETERS
Page 119 of 129
the steel pole-pieces moving the gear ratio is given by
1 2
1
p pGr p
+=
Here, p1 and p2 are the inner and outer magnet array pole-pair numbers. The corresponding speed
relationship is:
12 Gr
ωω =
The number of steel pole pieces is determined by n5=p1+p2. As an example, a magnetic gearbox with p1=4,
p2=23, and n5=27 provides a gear ratio of 6.75 and develops a torque density of 0.85 ft-lbf/in^3 and a
magnetic shear stress of more than 10psi; a large value considering that most electric motors have a torque
density in the vicinity of 0.17 ft-lbf/in^3 and a shear stress near 2psi. Alternatively, with the steel pole-pieces
held fixed while the outer magnet array rotates, the gear ratio is
25.75
1
pGr p
= =
In this case, the outer magnet array rotates in the opposite direction to the inner rotor.
In the third mode of operation it is possible to design the gearbox to allow all three members to rotate, which
can result in a near doubling of the gear ratio and in which the gear can accept two inputs, Figure 5. In this
case we can define three gear ratios which relate the rotational speeds of the three gearbox components (1=
inner rotor, 2= outer rotor, and 3= steel pole-pieces):
1 1 3; ; ;1 2 32 3 2
G G Gω ω ω
ω ω ω= = =
In this case, the magnetic gearbox operates as a speed-summing or torque-summing device, where the three
speeds are related by:
( )1 01 1 2 1 3G Gω ω ω+ ⋅ − + ⋅ =
The three torques and three powers of the rotating components also relate as:
01 1 2 2 3 3T T Tω ω ω⋅ + ⋅ + ⋅ =
01 2 3T T T+ + =

EVALUATE THE EFFECT OF TURBINE PERIOD OF VIBRATION REQUIREMENTS ON STRUCTURAL DESIGN PARAMETERS
Page 120 of 129
In this mode the magnetic gearbox behaves as a mechanical planetary gear, where the inner rotor corresponds
to the central spur gear, the outer rotor to the ring gear, the steel pole-pieces to the carrier of the planetary
gears. The magnetic pole-pairs and steel pole-pieces correspond to the teeth of the corresponding
components of the mechanical planetary gear.
Magnetic gearboxes may be considered replacements for a variety of different mechanical gear sets. It is
useful to make a specific comparison and identify the benefits of a magnetic gearbox with an example of a
common mechanical gearbox used in wind turbines, the planetary gear. Planetary gearboxes typically consist
of a housing, an input shaft, output shaft, one or more ring gears, one or more central spur gears, and one or
more sets of planetary gears. A typical single stage planetary gearbox, left in Figure 6, has at least six
simultaneous gear meshes, three planetary gears each meshing with the ring gear on the outer diameter and
the sun gear on the inner diameter. The gears require lubrication, and the input and output shafts must exit
the gearbox housing thereby requiring the use of dynamic seals to keep the lubrication inside the gearbox and
keep dirt and debris from leaking into the gears. In some applications a pressure compensation device is
required within the gearbox.
The magnetic gearbox consists of three concentric, non-contacting elements, illustration on the right in
Figure 69. Since the magnetic gearbox has no mechanical interfaces, compared to at least six in the planetary
gear, its elements do not contact each other and there is no need for lubrication because there is no friction
between the gear elements. In fact, the magnetic gearbox can be exposed to or immersed in fluids in its
operating environment because the concentric rings that form the gearbox system are solid bodies and, when
packaged in a suitable housing, such as Inconel, can operate under harsh environmental conditions without
the need for pressure compensation or additional protection. Examples of such applications include external
marine propulsion systems and down-hole drilling operations, where pressures and temperatures can reach
more than 175 o C and 20,000psi.
It is also recognized that the concentric magnetic gear utilizes all of its magnetic poles simultaneously to
transmit torque while any mechanical gear system is limited to point-to-point contact between only one input
gear tooth and approximately one output gear tooth at any instant of time.

EVALUATE THE EFFECT OF TURBINE PERIOD OF VIBRATION REQUIREMENTS ON STRUCTURAL DESIGN PARAMETERS
Page 121 of 129
Ring gear
Input or output shaft
Spur gear
Planetary gears
Planetary Gear
Magnetic Gear
Three concentricnon-contacting elements
Figure 69: Comparison between Mechanical Planetary Gear and Magnetic Gear
An additional benefit of magnetic gearboxes is operating temperature range. Mechanical planetary gearboxes
are limited to an operating temperature compatible with whatever elastomer is used as part of the gearbox
shaft seal. Since a magnetic gearbox requires no seals their operational temperature is limited by the
maximum operating temperature of the material selected for the magnets. For Samarium-Cobalt magnets this
operating temperature is greater than 250 degrees Celsius making the magnetic gearbox capable of operation
in the most extreme temperature environments.
At this point in their development there has been no significant downside or physical limitation identified for
magnetic gearboxes. At this time magnetic gearboxes transmitting about 20 hp at several hundred rpm have
been constructed, tested and published in the open literature; however there is anecdotal information about
several hundred hp units that have been or are being developed. The limitations of magnetic gearboxes are
those shared with their near-cousins, the permanent magnet motor/generator; these are concerns about
heating and temperature control, torque-density, maximum efficiency and acoustics. APS believes that a well-
designed magnetic gearbox can optimize all of these characteristics while delivering a product that satisfies the
mechanical gearbox reliability issue posed at the beginning of this paper.
Magnetic gearbox technology appears poised to make substantial contributions to many industrial and
military applications including wind power generation. The unique and substantial benefits of magnetic
gearboxes are compelling. However additional development and testing investments is required before they
can be applied at the torque and power ratings of today’s wind turbines.
Floating Wind Turbines
Although there are not yet any domestic offshore turbines, the aspirations for U.S. wind power are
sufficiently high to project this to be a major industry. The Department of Energy (DOE) issued a report in

EVALUATE THE EFFECT OF TURBINE PERIOD OF VIBRATION REQUIREMENTS ON STRUCTURAL DESIGN PARAMETERS
Page 122 of 129
2008 analyzing the potential for building wind power to 20% of the total domestic power production by
2030, which would represent continued rapid growth of wind capacity (DOE, 2008). Wind energy business
ventures see improved economics for larger turbines in strong wind locations close to centers of high
consumption. Options for such installations on land are decreasing with increasing capacity, while there is
considerable fertile ground off the U.S. coast. While the U.S. industry is just now beginning to tap these
resources in the shallower waters amenable to bottom-mounted turbine towers, it is clear that realizing
offshore wind potential in the U.S. requires deep-water installations. To achieve the desired capacity, the
trajectory for offshore wind development is toward waters deeper than 30m, where 90% of the U.S. offshore
wind resource is located (MMS, 2006). This requires moving from bottom-mounted towers to moored
floating platforms.
The imminence of the floating turbine era is becoming apparent, as the Norwegian HyWind 2.3MW floating
turbine began operation within the past year. Blue H, a European company which in 2007 installed a large-
scale prototype floating turbine platform off the coast of Italy, has already submitted applications with the
BOEMRE and Army Corps of Engineers for development of a floating wind turbine network south of
Rhode Island. In order to regulate and develop standards for the deep water wind turbine industry, an
understanding of the system of a floating wind turbine platform must be well established. The key
components of the system are diagrammed in Figure 70. We briefly consider in the following discussion how
the system differs from that of a fixed-turbine installation in terms of the natural modes and period of
vibration requirements.
RNA
Support Tower
Floating Platform
Mooring Cables
Anchors
Wind
Ocean Waves
Figure 70: Drawing indicating the key mechanical components of the floating wind turbine system.

EVALUATE THE EFFECT OF TURBINE PERIOD OF VIBRATION REQUIREMENTS ON STRUCTURAL DESIGN PARAMETERS
Page 123 of 129
The regulator’s system understanding comes in part from established research and design standards for
offshore oil platforms and fixed-tower wind turbines. The coupling of these systems, however, creates a
unique dynamic system requiring analysis to identify potential vulnerabilities. In addition, there is a range of
floating platform design approaches which can be pursued, representing different systems. This is evidenced
by differences between the deep spar design of the HyWind turbine which had to be assembled in deep water
with floating assets, and the tension-leg platform (TLP) of the Blue H prototype which could be constructed
with land-based assets and towed to its deep-water deployment location. The three primary floating platform
configurations in use in the offshore oil industry which are considered viable options for wind turbines are
spar platforms, barge platforms, and tension-leg platforms, as outlined in Figure 71 with listed characteristics.
Each of these has unique advantages and disadvantages in terms of economics and risk. It can be anticipated
that if one of these designs is shown to be clearly economically superior for all installations, then investor
pressures dictate this to be the prevalent design.
Tension-leg PlatformSpar Platform Barge Platform
• Stability through mass distribution
- Stable in unmoored configuration- Little wave response
• Catenary mooring
- Easy/cheap to set
- Larger footprint/drift
• Assembled on-site
- Spar too deep to tow vertically- Large crane expenses
• Stability through buoyancy
- Ship stability paradigm- Largest wave response
• Catenary mooring
- Easy/cheap to set
- Larger footprint/drift
• Assembled on land
- Minimize cost of assembly• Towed to location
• Stability through mooring lines
- More stable platform- Least wave response
• Tensioned mooring
- Large vertical tension on anchor
- Expensive anchor installation
• Assembled on land- Minimize cost of assembly
• Towed to location
Figure 71: Three categories of floating platforms.
We consider the differences in the natural responses of the floating turbine compared to the fixed turbine
through consideration of the simple lumped parameter models depicted in Figure 72. For this comparison,
we consider the fixed turbine as a beam with a mass at the upper end connected to a fixed boundary at the

EVALUATE THE EFFECT OF TURBINE PERIOD OF VIBRATION REQUIREMENTS ON STRUCTURAL DESIGN PARAMETERS
Page 124 of 129
lower end (ocean bottom) through a torsional spring. The floating turbine is considerer as a beam with a mass
at the upper end connected to a mass at the lower end (representing the platform) which is connected to a
fixed boundary through torsional and horizontal springs, representing the platform hydrostatic restoring and
mooring cable constraints.
mmm1m1
m2m2
Fixed Turbine Floating Turbine
Figure 72: Depiction of the real system and simple lumped parameter models for the fixed and floating turbines.
A sample calculation was performed to highlight the differences between the fixed and floating turbine
system natural frequencies. We consider the reference 5MW offshore fixed turbine with 130m total tower and
pile length, and a spar platform floating turbine with the 88m tower mounted to an 18m diameter spar buoy
with 48m draft (as in Slavounos et al, 2007). Simulating the two systems, each with the same tower height
above the ocean surface and RNA mass properties, we find significantly different natural response modes.
With the RNA support structure set with a quadratic initial displacement, the free structural response is
simulated in the time domain. The time histories of the RNA displacement (normalized by the initial
displacement) are plotted in Figure 73, showing the significant difference in the dominant response
frequencies. While the fixed turbine is dominated by the fundamental structural mode at 0.22Hz, the floating
turbine displays a strong response at a higher structural fundamental frequency of 0.54Hz and a low
frequency platform response of 0.06Hz. The shifting of the important resonant frequencies in the floating
configuration to both higher and lower values than that of the fixed turbine structure, indicates the need to
revisit the period of vibration requirements for floating turbine configurations. While a full assessment of the
floating system is beyond the scope of the present work, the initial analysis and simulation indicates the
importance of further investigating these systems.

EVALUATE THE EFFECT OF TURBINE PERIOD OF VIBRATION REQUIREMENTS ON STRUCTURAL DESIGN PARAMETERS
Page 125 of 129
Figure 73 - Time history of the RNA displacement (normalized by the initial displacement) for the free response with quadratic initial displacement of the support structure.
CONCLUSIONS AND RECOMMENDATIONS FOR FUTURE
WORK
The Phase I effort for the project entitled “Evaluate the Effect of Turbine Period of Vibration Requirements
on Structural Design Parameters” examined resonance coincidence and its impact on the structural design
characteristics of offshore wind turbines. Focus areas included accelerated fatigue resulting from resonance
coincidence and an assessment of strategies to avoid resonance coincidence and minimize its consequences.
An analysis capability and a set of appropriate computational tools for offshore wind turbines was developed
and utilized to gain a deep physics-based understanding of offshore wind turbine systems: their excitation by
intrinsic and external forcing mechanisms, their structural dynamic response to these excitations, how that
response results in large amplitude stresses in the system, and how those stresses are compounded to cause
accumulative fatigue damage for the system. A series of sensitivity studies were performed to evaluate what
design tradeoffs can be made and understand what impact they have on the performance, reliability, and
structural integrity of the system. From these sensitivity studies, a set of insights were developed that guided
the selection of a limited number of potential vibration mitigation and resonance avoidance strategies. These
insights also informed the analysis of the design impact of advanced turbine concepts. Several promising
technologies were assessed, including magnetic gears to reduce gearbox maintenance and nacelle weight,
breakwaters to mitigate wave forcing and pile excitation, vertical axis systems, and floating wind turbine
systems.

EVALUATE THE EFFECT OF TURBINE PERIOD OF VIBRATION REQUIREMENTS ON STRUCTURAL DESIGN PARAMETERS
Page 126 of 129
As a result of this Phase I effort, APS has roadmapped several potential areas that would benefit from
additional analysis and follow-on efforts. These topics are related and extend the Phase I effort, providing
BOEMRE with additional guidance on period of vibration requirements for emergent concepts, pursuing
industry partnerships to promote the vibration mitigation and resonance avoidance strategies identified as
promising in this report, and providing BOEMRE with additional capabilities and tools to best ensure that
wind farms are appropriately designed, sited, and operated to avoid structural failures and safety risks.
Specifically, APS has identified the following potential follow-on efforts, which may be pursued independent
of one another but are not mutually exclusive in terms of potential benefit to BOEMRE:
• Develop industry partnerships to ensure a more thorough investigation of promising vibration
mitigation and resonance avoidance strategies and novel technologies for application to offshore
wind turbines. This effort may identify potential non-technical issues and perform cost-benefit
assessments of the different proposed technologies. It also may identify the need for further
technological development and roadmap these developments through detailed design, testing, and
implementation. Candidate promising technologies may include magnetic gears and cost-benefit
analyses of breakwaters.
• More thoroughly validate the suite of wind turbine related computational models and tools APS has
leveraged for this project and exploit the benefits of existing wind turbine tools such as the FAST
suite by integration of APS improvements and insights into existing models. This provides
BOEMRE increased confidence that the models used for the design and analysis of wind turbines
appropriately capture the relevant physical mechanisms at play. These tools can also be used to
support those involved in standards-compliance and can be used to supplement FAST components
such as AeroDyn and Modes.
• Define a reference offshore wind turbine more representative of the soft-stiff design methodology
than the 5MW NREL reference turbine, which has been found to be biased toward the low-
frequency limit of the soft-stiff regime and may be an inappropriate reference for some studies.
Repeat period of vibration assessment for this new more representative reference turbine to see if 3P
interactions become important (they were found unimportant for the NREL turbine due to the
proximity of 1P and the fundamental structural resonance of that turbine). This effort would be
expedited by the already-existing set of tools APS developed and used during the Phase I effort.
Identify potential methods for mitigating 3P interactions, to include but not limited to including
blade skew and using space-truss support structures in way of the blades.
• Investigate period of vibration requirements for emerging offshore wind turbine platforms, such as
floating turbines or jacketed foundations. This task would also be expedited by the already-existing

EVALUATE THE EFFECT OF TURBINE PERIOD OF VIBRATION REQUIREMENTS ON STRUCTURAL DESIGN PARAMETERS
Page 127 of 129
APS toolkit and would provide BOEMRE insights into the structural response and design of these
systems before the technology has matured to the point of being established.

EVALUATE THE EFFECT OF TURBINE PERIOD OF VIBRATION REQUIREMENTS ON STRUCTURAL DESIGN PARAMETERS
Page 128 of 129
REFERENCES
[1] Jonkman J., Butterfield S., and Musial W, and Scott G, “Definition of a 5-MW Reference Wind
Turbine of Offshore System Development,” NREL/TP-500-38060, Golden, CO: National Renewable
Energy Laboratory, 2007.
[2] Rao, S. Mechanical Vibrations. Addison-Wesley, MA, 1995.
[3] Tempel, J. van der. Design of Support Structures for Offshore Wind Turbines. PhD thesis, DUWIND,
Delft University of Technology, 2006. ISBN 90-76468-11-7.
[4] Det Norske Veritas. Design of Offshore Wind Turbine Structures.
http://webshop.dnv.com/global/category.asp?c0=2624, 2008. DNV-OS-J101. Accessed October,
2009.
[5] Triantafyllou M., Hover F. “Maneuvering and Control of Marine Vehicles.” MIT Course Notes: 2003.
Available: http://ocw.mit.edu/NR/rdonlyres/Mechanical-Engineering/2-154Fall-2004/81B49FC4-
BD56-470B-9BB6-AAC958B4FEFE/0/1349_notes.pdf
[6] Krolis V., Tempel J van der, Vries W. “Evaluation of foundation design for monopile support
structures for offshore wind turbines.” Conference paper: 2007 European Offshore Wind Conference
and Exhibition.
[7] Kooijman H., Lindenburg C., Winkelaar D., Hooft, E. van der. “Aero-elastic modelling of the
DOWEC 6 MWpre-design in PHATAS.” DOWEC-F1W2-HJK-01-046/9. September 2003.
[8] Podeszwa E., Kelly Joanne. “Environmental Database for Shallow-Water Operational Strategic Sites
Throughout the World.” Internal Report. NUWC-NPT Technical Document 11019. September
1995.
[9] Jonkman, J. M.; Buhl Jr., M. L. "FAST User's Guide," NREL/EL-500-29798. Golden, Colorado:
National Renewable Energy Laboratory, 2005.
[10] Moriarty, P.J. and Hansen, A.C., “AeroDyn Theory Manual”, NREL/EL-500-36881, December 2005.
[11] Brown, N.A., “Periodic Propeller Forces in Non-Uniform Flow”, MIT Department of Naval
Architecture and Marine Engineering Report 64-7, June 1964 (Ph.D. thesis)
[12] Greeley, D.S., “Implementation and Improvement of Unsteady Propeller Lifting Line Theory”,

EVALUATE THE EFFECT OF TURBINE PERIOD OF VIBRATION REQUIREMENTS ON STRUCTURAL DESIGN PARAMETERS
Page 129 of 129
unpublished Bolt Beranek and Newman document, 1980.
[13] Greeley, D.S. and Bahlavouni, A., “Documentation for AARC Unsteady Lifting Line Propeller Analysis
Programs”, Atlantic Applied Research Corporation Report No. 044, March 1987.
[14] Jonkman, J., Butterfield, S., Musial, W., and Scott, G., “Definition of a 5-MW Reference Wind Turbine
for Offshore System Development”, NREL Technical Report NREL/TP-500-38060, February 2009.
[15] Preliminary Structural Design of Composite Blades for Two- and Three-Blade Rotors. G. Bir and P.
Migliore. September 2004. NREL/TP-500-31486.
[16] Crandall, S.H., Karnopp, D.C., Kurtz, E.F., and Pridmore-Brown, D.C. Dynamics of Mechanical and
Electromechanical Systems. Krieger, Malabar, FL, 1968.
[17] Maull, D.J., and Young, R.A. Vortex shedding from bluff bodies in a shear flow. Journal of Fluid
Mechanics, 60(2): 401-409, 1973.
[18] Aeroelastic Instabilities of Large Offshore and Onshore Wind Turbines. Gunjit Bir and Jason
Jonkman. Available: http://iopscience.iop.org/1742-
6596/75/1/012069/pdf/jpconf7_75_012069.pdf?ejredirect=migration
[19] Bisplinghoff, R.L., Ashley, H. and Halfman, H., Aeroelasticity. Dover Science, 1996
[20] R. Boyle, et. al., “Global Trends in Sustainable Energy Investment 2008”, United Nations Environment
Programme and New Energy Finance Ltd., 2008.
[21] Johan Ribrant and Lina M. Bertling, “Survey of Failures in Wind Power Systems with Focus on
Swedish Wind Power Plants During 1997-2005”, IEEE Trans. on Energy Conversion, Vol. 22, March
2007, pp. 167-173.
[22] Richard Dupuis, “Oil Debris Monitoring for Mitigating Revenue and Cost Risks Associated with
Gearbox Unreliability”, 7th World Wind Energy Conference (WWEC 2008), Kingston, Ontario, June
2008.
[23] K. Atallah and D. Howe, “A Novel High-Performance Magnetic Gear”, IEEE Trans. on Magnetics,
Vol. 37, No. 4, July 2001, pp. 2844-2846 and P.O. Rasmussen, T.O. Anderson, F.T. Joergensen, and O.
Nielsen, “Development of a high-performance magnetic gear”, IEEE Trans. on Industry Applications,
Vol. 41, No. 3, May/June 2005, pp. 764-770

EVALUATE THE EFFECT OF TURBINE PERIOD OF VIBRATION REQUIREMENTS ON STRUCTURAL DESIGN PARAMETERS
Page 130 of 129
[24] Nicolas W. Frank and Hamid A. Toliyat, “Gearing Ratios of a Magnetic Gear for Wind Turbines”,
IEEE Paper ID 978-1-4244-4252-2/09, 2009, pp. 1224-1230.
[25] Linni Jian, K.T. Chau, and J.Z. Jiang, “A Magnetic-Geared Outer Rotor Permanent Magnet Brushless
Machine for Wind Power Generation”, IEEE Trans. on Industry Applications, Vol. 45, May/June
2009, pp. 954-962.
[26] L. Shah, A. Cruden, and B.W. Williams, “A Magnetic Gearbox for Application with a Contra-Rotating
Tidal Turbine”, IEEE PEDS 2007, pp. 989-993.