evaluating biodegradable containers as alternatives to
TRANSCRIPT
Graduate Theses, Dissertations, and Problem Reports
2013
Evaluating Biodegradable Containers as Alternatives to Plastic Evaluating Biodegradable Containers as Alternatives to Plastic
Pots Pots
Renee L. Conneway West Virginia University
Follow this and additional works at: https://researchrepository.wvu.edu/etd
Recommended Citation Recommended Citation Conneway, Renee L., "Evaluating Biodegradable Containers as Alternatives to Plastic Pots" (2013). Graduate Theses, Dissertations, and Problem Reports. 541. https://researchrepository.wvu.edu/etd/541
This Thesis is protected by copyright and/or related rights. It has been brought to you by the The Research Repository @ WVU with permission from the rights-holder(s). You are free to use this Thesis in any way that is permitted by the copyright and related rights legislation that applies to your use. For other uses you must obtain permission from the rights-holder(s) directly, unless additional rights are indicated by a Creative Commons license in the record and/ or on the work itself. This Thesis has been accepted for inclusion in WVU Graduate Theses, Dissertations, and Problem Reports collection by an authorized administrator of The Research Repository @ WVU. For more information, please contact [email protected].

Evaluating Biodegradable Containers as Alternatives to Plastic Pots
Renee L. Conneway
Thesis submitted to the Davis College of Agriculture, Natural Resources, and Design
at West Virginia University
in partial fulfillment of the requirements for the degree of
Master of Science in Horticulture
Sven Verlinden, Ph.D., Chair Nicole Waterland, Ph.D.
James Kotcon, Ph.D.
Division of Plant and Soil Sciences
Morgantown, West Virginia 2013
Keywords: Sustainability, Horticulture, Greenhouse Production, Container Growing, Biopots.
ABSTRACT
Evaluating Biodegradable Containers as Alternatives to Plastic Pots
Renee L. Conneway
Marked improvements in the sustainability of the horticulture industry have occurred over the last few decades. Movement towards better management practices in areas such as pesticide (IPM), fertilizer application and water usage characterizes today’s industry. However, several obstacles have to be overcome for true long-term sustainability of the ornamental horticulture industry. One of these obstacles is the abundant use of plastics in the horticulture industry. This research focused on reducing the industry’s plastic waste stream by evaluating the effects of biodegradable pots on plant growth parameters and substrate chemistry, as well as characteristics of biodegradable pots such as strength and algal/fungal growth. Plastic pots have become an industry standard, but do have two important limitations. The container walls are impermeable; therefore when the roots contact the surface, they tend to circle the container. Circling of roots in turn results in poor landscape establishment. The other limitation to plastic is the issue of proper disposal. While plastics represent only 7% of the waste stream by weight, they take up 20% of the waste stream by volume. Recycling of horticultural products such as plastic containers is further complicated by contamination, such as dirt residue, grease, vegetation, moisture, pesticide contamination, and ultraviolet light degradation. In 2009, the EPA found that nationwide, only 7.1% of 29 million tons of plastic was recycled. An alternative to plastic pots is biodegradable pots. Biopots are defined as pots not made from petroleum, that degrade rapidly. Despite their potential as a sustainable alternative to plastic pots, recent studies focusing on the water use of biopots have found that some biodegradable containers require more frequent irrigation and can be significantly weaker than plastic pots, especially when wet. We investigated plant growth, watering frequency, pot strength, pot algal growth, denesting times, and percent degradation of biodegradable pots. Few differences were observed in plant growth. Wood fiber, peat, and manure pots showed lower pot strength, higher amounts of algal growth, and required a higher watering frequency compared to the control plastic pot in all trials. Peat pots required significantly more time to denest, and manure pots showed higher degradation in the field compared to all other pots. All pots studied were capable of producing a marketable plant. These results suggest that biodegradable pots do show potential as replacements for plastic pots, but factors such as pot strength, algal growth, and ease of denesting will be important to their adoption by the industry.

i
Acknowledgments
I owe gratitude to many people who were instrumental in helping me complete this project. I give a huge thank you to Dr. Sven Verlinden for supporting me throughout my undergraduate years, encouraging me to become a McNair Scholar, writing countless recommendations, and for being a supportive listener during some challenging times. But, most of all, I credit Dr. Verlinden with being the sole person to convince me to become a graduate student! Thank you for choosing me for this project, and for helping me every step of the way. I’m grateful for my committee members, Dr. Nicole Waterland and Dr. James Kotcon. Thank you both for always having the time to answer my questions and for supporting me throughout my research. I am thankful for all the student workers, greenhouse staff, and friends that put in countless hours assisting with my research. Thanks to Lauren Hutzell, Whitney Garton, Alisha Shiffer, Bev Schell, Gerardo Aguilera, Sue Myers, Allen Davis, and Milly Mullins. Additional thanks to my girlfriend, Kayla Show, for providing much needed encouragement throughout the thesis writing process, and listening with the utmost attention as I practiced my defense countless times. I would also like to show appreciation to Amber Hines, Denny Smith, and Dan Robison for their encouraging words, and allowing me to take the much needed time to finish my thesis and defense.

ii
Table of Contents
Abstract Acknowledgments i List of Tables iii List of Figures iv Chapter 1 – Introduction and Literature Review 1 History of the Industry 1 Insect and Weed Control 4 Fertilizers 6 Irrigation 7 Traditional Containers 9 Biodegradable Containers 11 Overview and Goal 14 Objectives 15 Chapter 2 – Evaluating the Potential Use of Biopots for Greenhouse Production 16 Summary 16 Background 16 Materials and Methods 19 Plant Growth Results 25 Substrate Results 28 Watering Frequency 31 Algal Growth 33 Container Strength 34 Conclusion 35 Chapter 3 – Evaluating the Performance of Biodegradable Pots in a Landscape Setting 66 Summary 66 Background 67 Materials and Methods 69 Plant Performance 73 Pot Performance 75 Conclusion 80 Addendum – Evaluating the Denesting Times of Biodegradable Pots 90 Background 90 Materials and Methods 90 Results and Discussion 91 Conclusion 92 Bibliography 94
iii
List of Tables
Table 2.1 Container types and manufacturers of pots used in this experiment 38 Table 2.2 Final plant growth of Impatiens spp. ‘Sunpatiens Compact’ grown in a
a greenhouse for five weeks in 2011 using biodegradable pots 42 Table 2.3 Final plant growth of Lavendula angustifolia ‘Elegans Ice’ grown in a
greenhouse for ten weeks in 2011 using biodegradable pots. 43 Table 2.4 Final plant growth of Impatiens spp. ‘Sunpatiens Compact’ grown in a
greenhouse for six weeks in 2012 using biodegradable pots. 44 Table 2.5 Final plant growth of Lavendula angustifolia ‘Elegans Ice’ grown in a
greenhouse for twelve weeks in 2012 using biodegradable pots 45 Table 2.6 Leachate pH of media in biodegradable pots used to grow Impatiens spp.
‘Sunpatiens Compact’ in 2011. 46 Table 2.7 Leachate pH of media in biodegradable pots used to grow Lavendula
angustifolia ‘Elegans Ice’ in 2011 47 Table 2.8 Leachate pH of media in biodegradable pots used to grow Impatiens spp.
‘Sunpatiens Compact’ in 2012. 48 Table 2.9 Leachate pH of media in biodegradable pots used to grow Lavendula
angustifolia ‘Elegans Ice’ in 2012 49 Table 2.10 Leachate EC (mS/cm) of media in biodegradable pots used to grow
Impatiens spp. ‘Sunpatiens Compact’ in 2011 54 Table 2.11 Leachate EC (mS/cm) of media in biodegradable pots used to grow
Lavendula angustifolia ‘Elegans Ice’ in 2011 55 Table 2.12 Leachate EC (mS/cm) of media in biodegradable pots used to grow
Impatiens spp. ‘Sunpatiens Compact’ in 2012 56 Table 2.13 Leachate EC (mS/cm) of media in biodegradable pots used to grow
Lavendula angustifolia ‘Elegans Ice’ in 2012 57 Table 2.14 Pot characteristics of biodegradable containers used to grow
Impatiens spp. ‘Sunpatiens Compact’ in 2011 62 Table 2.15 Pot characteristics of biodegradable containers used to grow Lavendula
angustifolia ‘Elegans Ice’ in 2011 63 Table 2.16 Pot characteristics of biodegradable containers used to grow Impatiens spp.
‘Sunpatiens Compact’ in 2012 64 Table 2.17 Pot characteristics of biodegradable containers used to grow Lavendula
angustifolia ‘Elegans Ice’ in 2012 65 Table 3.1 Container types and manufacturers of pots used in this experiment 83 Table 3.2 Final plant growth of Lantana camara ‘Luscious Citrus’ and pot degradation
of biopots after one growing season (15 weeks) in the landscape in 2011 84

iv
List of Tables Table 3.3 Final plant growth of Cleome hassleriana ‘Seniorita Rosalita’ and pot
degradation of biopots after one growing season (15 weeks) in the landscape in 2011 85
Table 3.4 Final plant growth of Impatiens spp. ‘Sunpatiens Compact’ and pot degradation of biopots after one growing season (15 weeks) in the landscape in 2011 86
Table 3.5 Final plant growth of Lantana camara ‘Luscious Citrus’ and pot degradation of biopots after one growing season (15 weeks) in the landscape in 2012 87
Table 3.6 Final plant growth of Cleome hassleriana ‘Seniorita Rosalita’ and pot degradation of biopots after one growing season (15 weeks) in the landscape in 2012 88
Table 3.7 Final plant growth of Impatiens spp. ‘Sunpatiens Compact’ and pot degradation of biopots after one growing season (15 weeks) in the landscape in 2012 89
Table 4.1 Average denesting time required for biodegradable pots 93

v
List of Figures
Figure 2.1 Containers used for this study 37 Figure 2.2 Experimental design of the greenhouse experiment 39 Figure 2.3 Photographs depicting visual ratings of Lavendula angustifolia
‘Elegans Ice’ in 2011 40 Figure 2.4 Leachate pH of media in biodegradable pots used to grow Impatiens spp.
‘Sunpatiens Compact’ in 2011 50 Figure 2.5 Leachate pH of media in biodegradable pots used to grow Lavendula
angustifolia ‘Elegans Ice’ in 2011 51 Figure 2.6 Leachate pH of media in biodegradable pots used to grow Impatiens spp. ‘ Sunpatiens Compact’ in 2012 52 Figure 2.7 Leachate pH of media in biodegradable pots used to grow Lavendula
angustifolia ‘Elegans Ice’ in 2012 53 Figure 2.8 Leachate EC of media in biodegradable pots used to grow Impatiens spp.
‘Sunpatiens Compact’ in 2011 58 Figure 2.9 Leachate EC of media in biodegradable pots used to grow Lavendula
angustifolia ‘Elegans Ice’ in 2011 59 Figure 2.10 Leachate EC of media in biodegradable pots used to grow Impatiens spp. ‘Sunpatiens Compact’ in 2012 60 Figure 2.11 Leachate EC of media in biodegradable pots used to grow Lavendula
angustifolia ‘Elegans Ice’ in 2012 61 Figure 3.1 Monthly mean temperatures at the Morgantown, WV site for the 2011
and 2012 growing seasons 81 Figure 3.2 Monthly mean precipitation at the Morgantown, WV site for the 2011
and 2012 growing seasons 82

1
Chapter 1: Introduction and Literature Review As consumers exhibit more environmental awareness, industries are pushed to make their
products environmentally friendly and sustainable. Sustainability can be broadly defined as
meeting the needs of the present without compromising the needs of the future (Spiertz, 2008).
There are several factors that contribute to the sustainability of the horticulture industry,
including effective insect control, fertilization, water usage, planting media, container selection,
plant selection, and plastic recycling programs. Great strides have been made in the last few
decades to improve the sustainability of the horticulture industry, including the adoption of
Integrated Pest Management (IPM), the use of slow release fertilizers, and drip irrigation.
Despite these improvements several obstacles still need to be overcome for true sustainability. In
order to fully understand the improvements that have been made over the last fifty years, it is
important to understand the history of the industry and the changes that have occurred.
History of the Industry The early history of the horticulture industry began with the first settlers of the
Massachusetts Bay Colony in 1630 (Davidson et al., 2000). Records show that settlers not only
planted fruit trees for their own benefit, but also grew fruit trees to trade (Davidson et al., 2000).
Nearly a century later, in 1720, the first greenhouse with glass on all sides was built by
Bostonian Andrew Faneuil, and records show that he used it to grow fruit. In 1737, Linnaean
Botanical Gardens, also referred to as Prince Nursery, was begun by the Prince family in
Flushing, New York, and is considered the first commercial nursery in North America
(Higginbotham, 1990). The nursery produced grafted apple, pear, and cherry trees that stocked
most orchards in the surrounding areas. The outbreak of the American Revolution slowed the
growth of the Horticulture industry significantly. Both sides however viewed Prince Nursery as

2
important, and the facility was spared and even protected at times. Still, the war negatively
impacted the demand for products, and the nursery had to sell over 10,000 cherry trees for barrel
making (Higginbotham, 1990). After the war, other nurseries began to develop in both New
York and New Jersey, and several more greenhouses were built in the Boston area. Most
products were sold locally due to limited transportation, but the completion of the Erie Canal in
1824 helped to spur growth of the Horticulture industry by providing easy transportation to the
Western frontier (Higginbotham, 1990).
By 1850, New York had become the nursery center of the nation, and Boston the center
of greenhouse vegetable production (Davidson et al., 2000). The industry continued to grow until
demand was again dampened, this time due to the Civil War. After the war ended, demand
increased, and the country saw a time of development and the expansion of the railroad system.
By 1869, the railroad allowed plant stock to be transported long distances, and led to the start of
many new businesses (Davidson et al., 2000; Higginbotham, 1990). In addition, the federal
government mandated in 1873 that new prairie homes should have 40 acres of timber trees, thus
boosting the demand for nursery stock (Higginbotham, 1990).
Key organizations were formed that would help the industry to further grow and promote
best management practices. The American Association of Nurserymen (AAN) was created in
1876, and the American Society for Horticultural Science in 1903 (Janick, 2007). Up to this
point, the industry had seen many boom and bust cycles. Many nurseries would overproduce
stock and undercut other businesses, thus driving prices down, until a drought or bad winter
reduced the surplus and the market again stabilized. The AAN was essential during this time in
encouraging growers to manage professionally, adhere to profitable pricing strategies, and also

3
lobbied the railroad for lower freight rates, all of which resulted in a stabilization of the industry
by the early 1900’s (Higginbotham, 1990).
The early 1900’s were marked by the introduction of detrimental diseases to the industry,
such as peach yellows, white pine blister rust, and chestnut blight (Higginbotham, 1990). To
combat this, the government passed the first national Plant Quarantine Act in 1912, which
prohibited certain plants from being imported into the country (Davidson et al., 2000). Seven
years later, Quarantine 37 was instituted, and severely restricted an even larger list of essential
plants from entering the country (Higginbotham, 1990; Davidson et al., 2000). These bans
increased the demand for US seedlings and stock, and coupled with the Parcel Post Act of 1912,
the industry experienced a temporary boom. Retail outlets were created, mail order companies
were started, and technical innovations, such as tractors, were adopted (Higginbotham, 1990;
Davidson et al., 2000).
The stock market crash and subsequent depression caused prices to fall and demand to
drop, but a garden club movement of the 1930’s introduced landscaping and ornamentals to the
middle class. The industry began a slow switch from fruit tree production to its current day
ornamental plant production (Davidson et al., 2000).
Major changes to the industry occurred with World War II. The war caused a lack of
labor, and the industry began experimenting with alternative workers such as prisoners, Mexican
immigrants, teenagers, and women (Higginbotham, 1990). After the war, the housing market
boomed, and the demand again escalated, pushing the growing/production process to become
more streamlined and efficient (Chappell, 2012). This new approach in growing led to the
eventual adoption of insecticidal and herbicidal controls, inorganic fertilization regimes,

4
mechanical innovations, advancements in both technology and transportation, and the
introduction of container growing.
Insect and Weed Control
Various forms of pesticides have been in use since the beginning of agriculture. The
Romans were known to use sulfur to combat insects and salt to control weeds (Bohmont, 1983;
National Research Council, 2000). In the United States, insect control mainly depended on
picking or washing off the insects until the mid-1800’s, when botanicals like pyrethrum became
available. Research on the structure and synthesis of botanical insecticides began in the 1920’s,
and by the 1930’s the discovery of synthetic organic insecticides had become a major scientific
goal (Casida and Quistand, 1998). In 1939, Paul Muller discovered the insecticidal properties of
dichlorodiphenyl trichloroethane, now known as DDT (Carson, 1962; Ignacimuthu and Jayaraj,
2005; National Research Council, 2000). Soon after the discovery of DDT, hundreds of synthetic
pesticides and herbicides became available on the market during and after World War II
(Bohmont, 1983). World War II fostered an era of acceptance for these newfound chemical
controls, as immediate remedies were needed during wartime and the cultural and biological
control methods of the time required patience and adaptability (McWilliams, 2008). DDT
especially was held in high esteem, mostly for its broad spectrum activity against insect pests of
agriculture and human health (Delaplane, 1996). One magazine article printed in 1945 even
regarded DDT as the “…war’s greatest contribution to the future health of the world” (Simmons,
1945).
During this time, pesticides were considered to pose little long term environmental
dangers. Fish kills during the 1940-50’s were regarded as either “misuse or unavoidable side
effects of pest control” (Casida and Quistand, 1998). The dangers of using DDT and other broad
5
spectrum pesticides became apparent in the 1960-1970’s with increasing insect resistance,
unintended devastation of natural enemies, and surging secondary pests (National Research
Council, 2000). In 1962, the book “Silent Spring” by Rachel Carson fueled public concern and
caused the word “pesticide” to become stigmatized (Casida and Quistand, 1998; Higginbotham,
1990). The Environmental Protection Agency (EPA) was created in 1970, and in 1973, cancelled
the registration for DDT and it was promptly removed from the market (Mullen et al., 2005;
Higginbotham, 1990).
The overuse of broad spectrum pesticides and subsequent consequences spawned the
development and implementation of Integrated Pest Management (IPM) (Delaplane, 1996). The
framework for the development of IPM comes from the 1959 article entitled “The Integrated
Control Concept” by Stern et, al. (1959). Up to this point, there had been no universal threshold
levels established to determine when appropriate controls should be applied. Stern et al., (1959)
used the Economic Injury Level (EIL) and the Economic Threshold (ET) to “develop constructs
for sensible integration of chemical and biological controls.” Other improvements included
enhanced selective toxicity of chemicals, a more careful study of the environmental impacts, and
a shift from persistent to degradable substances (Casida and Quistand, 1998). By the end of the
1980’s, IPM was seen as a potential method to reduce the use of chemicals (Davidson et al.,
2000). Modern day IPM integrates cultural, biological, and chemical controls by using various
concepts, such as identifying economic thresholds, utilizing natural enemies, and using selective
pesticides when necessary (Mullen et al., 2005). A clear movement towards judicious application
of pesticides and herbicides is now apparent in the ornamental horticulture industry of the 21st
century.

6
Fertilizers
Much like pesticides, natural organic fertilizers have also been in use since the beginning
of agriculture about 10,000 years ago. Early Neolithic farmers cultivated their fields repeatedly,
thus depleting the nutrients, but once they learned to keep cattle and sheep, they began enriching
the soil with manure (McNeill and Winiwarter, 2004). The need for additional fertilization did
not come about until the growth of urban life over the past 5000 years. With the growth of
urbanization, produce was shipped from fields to cities, and subsequently, nutrients were
transported off the farm, and inevitably wind up in the waste stream to the ocean (McNeill and
Winiwarter, 2004). Population growth in the mid-18th century put pressures on the food supplies
that led to new theories about soil fertilization, such as Justus von Liebig’s idea that nitrogen,
phosphorus, and potassium are required for plant growth (McNeill and Winiwarter, 2004).
Beginning in the 1830’s, demand for nutrients was very high. Horse manure was shipped by boat
to New York City, as well as guano from Chile and Peru, rock phosphate, superphosphate,
fishmeal, and potash (Mikkelsen and Bruulsema, 2005). The Morrill Act of 1862, which
established land grant colleges, and the Hatch Act of 1887 that provided research facilities, led to
many rapid advances in fertilizer research.
Undoubtedly, the biggest breakthrough to occur in the fertiliizer industry was the work
of Fritz Haber and Carl Bosch. Haber and Bosch found a way to synthesize ammonia from the
air, thus making nitrogenous fertilizer a fairly cheap commodity (McNeill and Winiwarter,
2004). At first, most of the new NH3 was used for explosives during World War I (Mikkelsen
and Bruulsema, 2005). It was not until the 1950’s that inorganic nitrogenous fertilizer gained
popularity. Today, inorganic fertilizer is the top choice for fertility improvements in ornamental
horticulture. Inorganic fertilizers are most commonly applied either by a slow-release granular

7
application, or a continuous liquid feed, sometimes referred to as fertigation (Poincelot, 2004).
Slow release application reduces the frequency of application, but is more expensive. Therefore,
fertigation is more commonly used, especially in the greenhouse setting. Inorganic fertilizer is
relatively inexpensive when compared to its impact on increasing the yield of field crops, and
has therefore often been misused and over-applied (Goulding et al., 2008).
This has resulted in environmental concerns, particularly concerning non-point source
pollution of surface and ground water. These environmental concerns have led to a recent
interest in returning to earlier fertilization practices, such as an improved utilization of animal
manures, the use of recycled municipal products, application of compost, and cover cropping
(Mikkelsen and Bruulsema, 2005). Similar to the IPM method that has been developed for pest
control, Best Management Practices (BMPs) are slowly being developed for nutrient control.
BMPs can include structural, vegetative, or cultural methods (Veith, 2002).
Irrigation
The history of irrigation parallels that of agriculture itself. Many of the early civilizations
around the world were known to use surface irrigation (Fereres et al., 2003). With this type of
irrigation, the water is uncontrolled, and moves by gravity. Though it is not particularly efficient,
this method was used for thousands of years, and is still greatly used around the world today
(Fereres et al., 2003). In the U.S. however, population growth and subsequent increased demand
for food have resulted in a greater need for irrigation. Today, water usage has become a great
concern for the horticulture industry, especially in states such as California, North Carolina,
Florida, Oregon, and Texas, where laws and regulations limit water consumption (Beeson et al.,
2004). In some areas of Florida, regulations over the past 12 years have decreased water usage
allotment by as much as 40% (Beeson et al., 2004). This trend will undoubtedly extend to states
8
other than the ones mentioned above in the future. These changes have driven the horticulture
industry to begin to use water conserving irrigation, especially in states with limited water
sources or access to water sources.
Greenhouses have made comparatively greater strides in reducing water usage than
nurseries. Although overhead spray irrigation is still a common irrigation practice, more modern
systems such as trickle or drip irrigation and subirrigation are routinely used in the greenhouse
setting and have the potential to significantly reduce water use in this branch of ornamental
horticulture (Poincelot, 2004). Trickle (drip) irrigation supplies water directly to the soil media
via small emitters at a slow rate (Poincelot, 2004). Trickle irrigation allows the media adequate
time to absorb water, making it a very effective system, with nearly 90% water use efficiency
(Poincelot, 2004).
Nursery operations currently have several irrigation options, including overhead
sprinklers, trickle and spray irrigation, and spray stakes or emitters. Overhead sprinklers are the
most common system used for irrigating containers less than 5 gallons (Davidson et al., 2000).
However, depending on the size and placement of containers, as much as 80% of water applied
can be lost (Davidson et al., 2000; Beeson, 2006). Modern day irrigation practices have begun to
reduce runoff and water overuse by increasing efficiency and reducing the number of irrigation
applications (Beeson et al., 2004). In nurseries, this has been accomplished by optimizing plant
spacing, precision spray nozzles, and reducing applications by monitoring plant water use. One
way this has been accomplished is by applying irrigation based on plant demand, otherwise
known as the Daily Water Usage (DWU), which is the combined loss of water from substrate
evaporation and plant transpiration (Warsaw et al., 2009). One common way to determine DWU
is by using soil moisture sensors that record the water lost over a known interval of time

9
(Warsaw et al., 2009). The DWU is calculated and water is applied to replenish the lost water. A
current drawback to using this type of irrigation is that the DWU of a plant must be known or
determined (Warsaw et al., 2009). Complexity, accuracy, and cost all currently limit the use of
DWU on a routine basis (S. Verlinden, personal communication). With no additional sources of
water available, and having reached the peak of irrigation application efficiency with current
technology, it seems likely that the industry will move towards using soil sensors and DWU for
future irrigation systems.
Containers One of the most significant changes to the industry was the introduction of containers for
growing purposes. Prior to this period, plants were grown in the ground and balled-and-
burlapped for transportation and sale. The introduction of containers in the 1950’s streamlined
the growing process, allowed for automation, prolonged plant life, and allowed growers to use
land that was otherwise unsuitable for production (Chappell, 2012). Coupled with the
development of the National Highway system, shipping of horticultural products became much
easier and led to further expansion of the industry. At first, clay containers were used, but soon
these were found to be too heavy and were easily broken. The industry then moved towards
using recycled restaurant food cans. The downsides to these food cans though were sharp edges
and potential rusting (Chappell, 2012; Higginbotham, 1990). Soon, custom metal containers that
could be easily stacked and stored and that were coated with rust resistant paint became available
to the industry.
In the 1960’s, plastic pots were introduced and quickly became an economical and
industry standard that still exists today. These petroleum-based plastic containers have become
the packaging of choice because of their durability, and their flexibility to be made into virtually

10
any size, shape, or color (Evans et al., 2010). Plastic containers are easily stacked and stored, and
can withstand greenhouse automation, transportation, and marketing. Plants grown in plastic
containers are typically easy to remove from the pot, and still look aesthetically pleasing once
purchased by the consumer (Evans and Hensley, 2004).
Plastic containers, however, have two significant limitations. The container walls are
impermeable, so when the roots contact the surface, they tend to circle the container (Evans and
Karcher, 2004). Root circling can be detrimental to a plant for numerous reasons, including
girdling of the stem, failing to adequately anchor plants once planted, restricting the uptake of
water, and decreasing nutrient absorption (Appleton, 1989). The other limitation to plastic is the
issue of proper disposal (Evans and Karcher, 2004). In 1993, Garthe and Kowal found that of the
542 million pounds of plastic used in agriculture annually, 320 million pounds, or 59%, was
attributed to plant containers (Garthe and Kowal, 1993). While agricultural plastic only
contributes about 1% to the total plastic waste stream in the US, the amount of waste is still
significant and could be improved upon (Garthe and Kowal, 1993; EPA, 2010).
Two solutions to reduce plastic waste have been proposed, but both have limitations in
the agriculture industry. One solution is to reuse plastic containers within the greenhouse and
nursery setting, but the cost of cleaning and sterilizing often hinders this process. An additional
obstacle to this solution is that containers are typically are taken home and disposed of by the
consumer, and are often not returned to the greenhouse.
The second solution to reducing plastic waste is recycling. Recycling not only reduces
waste, but by reusing the materials collected, it is possible to cut down on energy and fossil fuel
consumption. Recycling programs have grown considerably over the last ten years, and for
certain products, the recycling rates are higher. For instance, in 2009, the buyback battery

11
program netted a 95.7% recycling rate for car batteries, and similar soda can recycling programs
have resulted in 1 in every 2 soda cans (50.7%) being recycled (EPA, 2010). However, no
national buyback program for agricultural plastic has been introduced. The EPA found that
nationwide, only 7.1% of over 29 million tons of plastic was recycled in 2009 (EPA, 2010).
Recycling of horticulture products is further complicated by contamination, such as dirt residue,
grease, vegetation, moisture, and pesticide contamination (Garthe and Kowal, 1993). Also, when
plants are grown in a nursery or greenhouse setting and exposed to extreme heat and light
conditions, this can cause UV light degradation, which can further reduce recyclability.
Since recycling options for containers are limited and reuse is not always feasible, the
industry needs to move in a different direction to reduce plastic use and become more
sustainable. One possible solution is the use of biodegradable containers, or “biopots.”
Biodegradable Containers
Biopots are containers not produced from petroleum that degrade rapidly (Evans et al.,
2010). “Rapidly” could be defined as one plant season, or several years, depending on the type of
pots being used. Biopots can be plantable or compostable. Plantable biopots are designed to be
left intact on the rootball, and allow the roots to grow through the container walls. Compostable
biopots are designed to be removed before planting, broken down, and composted (Evans et al.,
2010).
Biopots can be made from a variety of different materials, including but not limited to,
peat, paper, coconut fiber, rice hulls, poultry feathers, rice straw, dairy manure, and bio plastics
(Evans et al., 2010). Not only do biopots reduce energy consumption, but plantable biopots can
also reduce transplant shock and the need for disposal (Evans and Karcher, 2004). Particular

12
biopots also have specific added benefits. Coir pots, for example, are made from the fiber of
coconut husks and show resistance to bacterial and fungal growth (Tejano, 1985). Another
example is the Soilwrap container, marketed by Ball Horticultural company. The Soilwrap is a
bottomless wraparound PHA bioplastic “sleeve” consisting of Mirel, a material made from
biopolymers produced by microbes that is touted as easy to transport and store (Mohan, 2010).
According to Ball Horticulture, 2.5 times more assembled Soilwrap containers can fit on a pallet
compared to traditional plastic pots of the same size (Mohan, 2010). Cowpots, made of 100%
renewable cow manure, boast a 12-week bench life before decomposition (Cowpots, 2010).
Other pots are made from plant by-products. For example, the Solid Rice Hull and Slotted Rice
Hull pots produced by Summit Plastic are made from sustainable rice hull fibers, a renewable
resource (Belliveau, 2009). Jiffy and Fertil pots look and feel very similar, but where Jiffy is
mostly a peat-based pot, Fertil pots are composed primarily of spruce wood fibers (Fertil,
Boulogne Billancourt, France, 2011). Straw pots, produced from natural ingredients including
straw, coconut fiber, and a natural latex adhesive, are suggested to biodegrade in three to six
months (Van de Wetering, 2008). OP47 pots, or bioplastic wheat pots, are made from
biopolymers and look and feel very similar to traditional plastic, but are compostable in
appropriate conditions (Belliveau, 2009). Clearly, the biodegradable and plantable pots are
publicized as superior to plastic pots for a number of reasons. However, independent verification
of claims made by companies producing these pots has been limited to a few studies.
A recent study by Hall et al., (2010) showed that consumers “like” the look of rice hull
and straw pots, and “rice hull likers” responded that only 16.5% of the buying decision was
dictated by price. This implies that certain consumers are willing to pay a higher price for an
environmentally friendly plant container (Hall et al., 2010).

13
If consumers are willing to buy plants in biopots, than why are producers not willing to
use them? This could be because the range of concerns with biopots is nearly as long as the list
of possible materials used. Concerns range from bench life, to water wicking, to overall
aesthetics. This, combined with a lack of research, leaves many large greenhouse and nursery
operations leery about trying these relatively new products.
Most biopot research has studied the water use of specific biopots. Evans and Karcher
(2004) found that plants in peat and feather fiber biopots required more frequent irrigation and
more water overall when compared to plants grown in plastic pots. This is believed to be
attributed to a faster rate of evaporation through container walls (Evans and Hensley, 2004).
Feather fiber pots were found to wick less water than peat, probably because feathers are
hydrophobic, whereas peat is hydrophilic (Evans and Karcher, 2004). Some biopots perform
better than others. For instance, a recent study found that rice hull containers performed better
than other biopots when it came to frequency of irrigation needed, and bioplastic pots were equal
to plastic in regard to water use (Evans et al., 2010).
Another issue that biopots face is their aesthetics once they reach the consumer. Research
has shown that certain biopots are more susceptible to algae and fungal growth, which could
greatly affect the purchase of these products. Wood fiber and peat pots have the highest
probability of algae growth, followed by manures, paper, and rice straw (Evans et al., 2010).
One of the greatest issues facing biopots, undoubtedly fueling the reluctance of growers
to switch, is the uncertainty as to whether biopots could endure the production process in the
greenhouse and hold up during the marketing to consumer. Research has tested the wet and dry
vertical strengths and found that some pots, such as rice hull and manures, have high dry vertical
14
strengths, sometimes even higher than plastic. But, the wet strength of biopots was found to be
lower than the dry strength (Evans et al., 2010). In fact, wood fiber, peat, and manure pots had
such low wet vertical strengths, that manual handling was found to be difficult (Evans et al.,
2010). For the most part, it appears that pots that are able to absorb water into the container wall
have a significantly lower wet vertical strength (Evans et al., 2010). In addition to concerns about
durability there is also apprehension as to how well biopots could be integrated into modern day
mechanized operations. Little is known about the compatibility of the products with various
machines, and whether the pots can withstand such manipulation. Information currently available
is again based on manufacturers’ claims with little to no independent research.
Overview and Goal
In the past several decades, great strides towards increased sustainability in the
ornamental horticulture industry have been made. However, significant gaps in the knowledge
still remain, including the effects of biopots on plant growth, and their suitability to be used in
varying environments.
The goal of this research is to further improve the sustainability of ornamental
horticulture by evaluating the performance of various biodegradable pots as a potential
alternative for a traditional petroleum-based plastic pot in the greenhouse and landscape settings.

15
Objectives
• Evaluate the effects of biodegradable pots on plant growth in a greenhouse and landscape setting.
• Determine the effects of biodegradable pots on substrate chemistry, such as EC and pH.
• Evaluate the physical characteristics of pots, by evaluating the algal and fungal growth, as well as pot strength at the conclusion of 6-week and 12-week trials.
• Evaluate the percent degradation of pots in a landscape setting.
• Investigate the watering frequency requirements of biodegradable pots 6-week and 12-week trials.
• Evaluate the ease of denesting for biodegradable pots.

16
Chapter Two: Evaluating the Potential Use of Biopots for Greenhouse Production
Note: This work is part of a multi-institutional research initiative with additional trials conducted at
research facilities associated with the University of Arkansas, University of Kentucky, and University of
Illinois. For this thesis chapter, only work conducted at West Virginia University is reported. The final
publication to be submitted for peer review will include results from all four locations.
Summary As consumers exhibit more and environmental awareness, the horticulture industry is
pushed to make their products more environmentally friendly and sustainable. Recent
introductions of several new biodegradable containers to the market have led to research
investigating biodegradable containers as a potential alternative to petroleum-based plastic
containers. This research examines the growth and performance of Impatiens spp. ‘Sunpatiens
Compact’ and Lavendula angustifolia ‘Elegans Ice’ grown in a greenhouse for six and twelve
weeks, respectively, in nine biodegradable containers. Results showed very few significant
differences in plant growth and performance between pot types. Subtle and small differences
were observed in irrigation frequency. Marked and large differences were recorded in algal
growth, punch strength, and tensile strength upon conclusion of the experiments. Factors such as
cost, algal growth, pot strength, and perhaps ease of handling will likely play a greater role than
plant performance in the industry’s future decisions whether or not to embrace these
biodegradable pots as alternatives to petroleum-based plastic containers.
Background
Biodegradable containers, also referred to as biopots, are containers not produced from
petroleum derivatives that degrade rapidly in the landscape or in composting facilities (Evans et

17
al., 2010). “Rapidly” could be defined as degrading in as little as one season, or multiple years,
depending on the type of biopot. Plantable biopots need to degrade within one to two seasons, as
they are designed to be left intact on the rootball, and allow the roots to grow through the
container walls into the soil after planting. Compostable biopots, on the other hand, are designed
to be removed before planting, and may take several years to degrade in a composting facility
(Evans et al., 2010).
Biopots can be made from a variety of different organic materials, and in some instances,
can not only reduce energy consumption in manufacturing, but can also reduce transplant shock
and the need for disposal (Evans and Karcher, 2004). Particular biopots have specific added
benefits, such as the resistance to bacterial and fungal growth of coconut fibers used to make coir
pots (Tejano, 1985). In addition, some pots have visual appeal and evoke environmental
awareness in consumers.
A recent study by Hall (2010) showed that consumers “like” the look of rice hull and
straw pots, and “rice hull likers” responded that only 16.5% of the buying decision was dictated
by price. This implies that certain consumers are willing to pay a higher price for an
environmentally friendly plant container (Hall, 2010). If consumers are willing to buy plants in
biopots, than why has adoption by the horticultural industry been slow? This could be because
of the large array of concerns that have been reported, ranging from bench life, to water wicking,
to overall aesthetics. In addition, the lack of standardization of new pot introductions to the
market has led to problems introducing containers into mechanized operations. This has left
many greenhouse operations leery about trying these relatively new products.

18
Most biopot research to date has studied the water use, aesthetics, and pot strength of
specific biopots. Evans and Karcher (2004) found that plants in peat and feather fiber biopots
required more frequent irrigation and more water overall when compared to plants grown in
plastic pots. This was thought be attributed to a faster rate of evaporation through container walls
(Evans and Hensley, 2004). However, some biopots perform better than others. For instance, a
recent study found that rice hull containers performed better than other biopots when it came to
frequency of irrigation needed, and pots made from wheat-starch polylactic acid (PLA)
bioplastic, were equal to plastic in water use (Evans et al., 2010).
Another issue that biopots face is aesthetics during marketing. Research has shown that
certain biopots are more susceptible to algal and fungal growth, which could greatly affect the
purchase of these products. In those studies, no algal growth occurred on plastic, PLA bioplastic,
coir, or rice hull containers. Wood fiber and peat pots showed the highest probability of algal
growth, followed by manure, paper, and rice straw pots (Evans et al., 2010).
One of the greatest issues facing biopots, undoubtedly fueling the reluctance of growers
to switch, is the uncertainty as to whether biopots could endure the production process in the
greenhouse and hold up during the marketing to consumer. Research has tested the wet and dry
vertical strengths and found that some pots, such as rice hull and manure, have high dry vertical
strengths, sometimes even higher than plastic. Predictably, the wet strength of biopots was found
to be lower than the dry strength (Evans et al., 2010). In fact, wood fiber, peat, and manure pots
had such low wet vertical strengths, that manual handling was difficult and damaged the
containers (Evans et al., 2010).
19
In addition to concerns about durability there is also industry apprehension related to how
well biopots could be integrated into modern day mechanized operations (Dr. Sven Verlinden,
personal communication). Little is known about the compatibility of the products with various
machines, and whether the pots can withstand such manipulation. Information currently available
is based on manufacturer’s claims with little to no independent research.
In order to provide the greenhouse industry with independent and verifiable information
on biopot performance in greenhouse settings, this study evaluated the effect of nine biopots and
a plastic control on overall plant growth, plant quality, and pot performance. The work presented
here expanded on the research of Evans et al. (2010), by investigating recent market
introductions of several new biopots, and two different crop lengths (6-week and 12-week). The
objectives of this experiment were to evaluate biodegradable pots and their effects on plant
growth parameters, and to investigate container performance in a greenhouse setting, including
algal/fungal growth, water usage, and container strength.
Materials and Methods
Location
The experiments described below were conducted at the West Virginia University
greenhouses in Morgantown, WV. Plants were grown under double polyethylene plastic cover
in a standard gutter-connected Quonset type structure. Sensors were placed near the plants to
measure day and night temperatures (Watchdog Model 125, Spectrum Technologies, Aurora,
IL). Container strength and algal growth (see below) were assessed at the University of
Arkansas, Fayetteville, AR.

20
Environment
The median greenhouse temperature over the course of the 2011 experiment was 22.5°C,
while the 2012 median was 25.6°C. In the 2011 experiment, a high of 51.2/31.1°C (D/N) was
recorded on June 9, 2011 and July 12, 2011, respectively. A low of 19.1/10.6°C (D/N) was
recorded on May 19, 2011 and May 5, 2011, respectively. In the 2012 experiment, a high of
49.6/33.6°C (D/N) was recorded on July 7, 2012 and June 29, 2012, respectively. A low of
20.9/13.2°C (D/N) was recorded on June 16, 2012 and June 26, 2012, respectively. The 2012
season had numerous days of excessive heat, and the NOAA National Climatic Data Center
(NCDC) reports that 2012 was the nationally ranked record warmest summer, and on a statewide
basis, temperatures were much above normal for West Virginia (NOAA, NCDC, 2012).
Pots
Nine types of biopots were evaluated for their performance in a greenhouse setting
compared to a control plastic pot (Figure 2.1). These pots were either purchased or accepted as
donations from their respective manufacturers (Table 2.1). Pot materials included coir (Coir),
composted manure fiber (Cowpot), spruce wood fiber (Fertil), peat (Jiffy), rice hulls (Net and
Solid Rice Pot), rice straw (Straw), and bioplastic pots made from polylactic acid (PLA)
(TerraShell/OP47) and polyhydroxyalkanoate (PHA) bioplastic (Soilwrap). Pots will hereafter be
referred to by their material composition.
Plant Material
The plant material used included Impatiens spp. ‘Sunpatiens Compact’ and Lavendula
angustifolia ‘Elegans Ice,’ purchased in 84-cell plug trays. After greenhouse acclimation (one
week), plants were transplanted to 60-cell trays, until ready to be used in the experiment.

21
Sunpatiens was selected as a high water requiring, short crop time (6-week) species, and was
pinched prior to planting to encourage branching and uniformity. Lavender was selected as a low
water requiring, extended crop time (12-week) species. These selections were made to test water
use and pot performance under different growing conditions and duration. Performance of pots
and plants growth was assessed separately for each species and experiment. Both crops were
planted in the respective biopots listed above using approximately 80 grams of Fafard 2®
(Conrad Fafard Inc., Agawam, MA) media in each pot to ensure uniformity among treatments.
Experimental Design
Two concurrent experiments, one with the short term crop and one with the long term
crop (see above) were performed. In each experiment, six pots of the same biopot type placed in
a tray were one replicate. Each biopot was represented by three trays in a completely randomized
design, for a total of thirty trays (10 pot types x three replicates) in each experiment (Figure 2.2).
Trays were placed tightly together in three rows of ten trays and each tray was randomly
arranged on the bench. Pots in each tray were labeled from left to right, ABCDEF and assigned a
number corresponding to its location on the table. For example, 5A would refer to a pot in the
lower left corner of a tray positioned in the second column and second row of plants. A one-
plant-wide guard row of the same species was placed around the perimeter to reduce border
effects in the experiment (Figure 2.2).
These above described experiments were performed twice, once in the spring of 2011 and
again in the spring of 2012. The 2011 trial was initiated on May 2, 2011, and concluded for the
sunpatiens on June 6 and the lavender on July 4, 2011. The 2012 trial was initiated on May 15,
2012, and concluded on June 26 for the sunpatiens and August 4, 2012 for the lavender.

22
Irrigation and Fertilization
A soil moisture probe (SM 100 Waterscout, Spectrum Techonologies, IL.) was used to
measure the volumetric water content of the media twice daily at approximately 8-9 AM and
again between 2-4 PM. The two visually driest pots in every tray were checked with the probe,
and the tray was watered when at least one pot of lavender had a soil moisture at or below 20%
volumetric water content (VWC) and sunpatiens at or below 40% VWC. These moisture levels
were chosen based on species specific needs and visual assessment of plant condition (Dole and
Wilkins, 2005; Hanks, 1995). Upon reaching the predetermined VWC, plants were watered in
excess of capacity and allowed to drain. Plants were fertilized at every watering with 150 ppm N
for lavender and 250 ppm N for sunpatiens from a 20-10-20 fertilizer (Scotts, Marysville, OH).
Watering frequency was recorded for each type of biopot throughout the experiment.
Measurements
Pot performance was analyzed by plant-related measurements such as plant growth
(height and width), shoot dry weight, leaf area, and a visual ranking of quality. Additional
measurements included biweekly EC/pH measurement, container puncture strength, and
container algal/fungal growth at the beginning and end of the experiments.
Height and width growth measurements were taken in each experiment at week 0, 3, and
5 or 6 for sunpatiens, in 2011 and 2012 respectively and week 0, 6, and 10 or 12 for ;avender, in
2011 and 2012, respectively. Height was measured from the media line to the tallest point of the
plant, and width measurements were taken in East-West and North-South directions and then
averaged.

23
At the end of the experiment (week 5 or 6 for sunpatiens and week 10 or 12 for lavender),
plants were severed at the base and immediately weighed to collect fresh weight data. Next, the
leaves were stripped from the plant and used to measure leaf area with a leaf area meter (LI-3100
Area Meter, Li-cor, Lincoln, NE). After the leaf area measurements, all plant parts were
collected and placed into paper bags, labeled, and dried in a drying room at 46° C. After two
weeks, the samples were removed from the drying rooms and immediately weighed for dry
weight determination.
At the conclusion of each experiment, plants were photographed and assigned a
numerical value indicating overall quality. Quality scores ranged from 1-5. A score of “1”
represented a plant that was completely dead, with no green growth apparent, while “2”
represented plants that still had some green growth but were of very poor quality. Scores of “3”
were given to plants of fair quality, such as plants stunted in growth, or with noticeable insect
damage. Good quality marketable plants with open flowers and limited insect damage and
blemishes were scored a “4”, and plants that were considered excellent quality, with little to no
insect damage, and adequate size with several open flowers, were scored a “5” (Figure 2.3).
Biweekly EC/pH measurements were taken using the pour thru method (Cavins et al.,
2005). Plants were watered to saturation one hour in advance of EC/pH measurements and
allowed to drain. Containers to catch leachate were placed in groups of six and each tray was
placed on the containers so that each pot corresponded to a container. Eighty ml of additional
water was added and allowed to drain for 5 minutes. Leachate was collected and measured using
an EC/pH meter (Ultrameter 6P, Myron L Company, Lincoln, NE).

24
After harvesting the plants for fresh and dry weight determination, the pots were dried
for one week at room temperature, and the media was carefully removed. The pots were then
placed in individually labeled plastic bags and tied off so that air was left in the bag to cushion
and protect the pots during shipping. Pots were shipped to the University of Arkansas (Dr. Mike
Evans’ laboratory) where they were tested for container strength and algal/fungal growth.
Specifically, the pots were analyzed for wet and dry strengths using a TAXT 21 Texture
Analyzer (Texture Technologies, Scarsdale, NY). The pressure required to crush each pot
vertically and laterally was recorded, as was the pressure required to punch through the container
wall (Evans et al., 2010). Algal/fungal growth was quantified by cutting sections of discoloration
using a box cutter, and running the samples through a leaf area meter to get an overall area of
algal coverage.
Statistical Analysis
Data were analyzed separately by species and year (2011 and 2012) due to differences in
experimental protocol, such as duration of the experiments between species, and also
environmental differences between years. Meaningful and direct comparisons between 2011 and
2012 can only be made on a limited basis, as experiments were ended early in 2011 due to the
flowering of plants (sunpatiens) and excessive heat in July (lavender).
Prior to analysis using Sigma Plot (Systat Software, Inc, San Jose, CA), pseudo-
replication resulting from data obtained from individual pots was averaged to produce three
measurements (one per tray) for each experiment. The data were tested for homogeneity of
variances using Bartlett’s Test, and for normality using the Shapiro-Wilk test.

25
Plant growth measurements, such as fresh weight, dry weight, leaf area, ranking, and
final width and final height were analyzed by year and species using a series of One Way
Analysis of Variances (ANOVAs). If pot type effects (treatment) were found, pairwise multiple
comparisons were made using the Holm-Sidak method.
Pot measurements, such as punch strength, tensile strength, algal growth, and watering
frequency were analyzed by year and species using ANOVA, and pairwise multiple comparisons
were made when indicated using the Holm-Sidak method.
EC and pH were assessed per year and species using a One-Way ANOVA with repeated
measures to show difference between weeks, and by a Two-Way ANOVA to show interactions
between pot type and week. Pairwise multiple comparisons of weeks were made using the
Holm-Sidak method. Pairwise multiple comparisons of the interaction of pot type by week were
made using the Tukey’s Standardized Range Test.
Results and Discussion
Plant Growth
When we compared plant growth among the nine biopots studied, no significant
differences were observed in any of the plant growth measurements we employed (fresh weight,
dry weight, final width, final height, or final leaf area) in 2011 for sunpatiens or lavender (Table
2.2 and 2.3). The ANOVA on visual ranking measurements of lavender did show significant
differences among treatments in 2011. However, those differences could not be resolved with a
separation of means test (Tukey’s or Holms-Sidak).

26
Significant differences in plant growth parameters were observed in the 2012 growing
season (Tables 2.4 and 2.5). For the short term sunpatiens trial, these differences were in fresh
weight (P<0.001) and dry weight (P<0.001) of plants, as well as the final height (P=0.015).
PHA bioplastic pots produced plants with fresh weights that were significantly higher than coir,
wood pulp, peat, slotted and solid rice hull, and straw. However, dry weights of PHA bioplastic
pots was greater than that of coir, straw and slotted rice hull. For final heights, differences
occurred only between the plant heights of the manure and coir pots. On average, manure pot
plants measured 18.5 cm, whereas plants in coir pots averaged 14.9 cm at the end of the
experiment. Despite these differences in fresh weight, dry weight, and final height, in most
instances no significant differences were observed between control plastic pots and
biodegradable pots. The only exception here is the underperformance of straw and slotted rice
hull pots compared to control plastic pots in dry weight in 2012.
Lavender in 2012 showed significant differences in final width (P=0.021). Differences
were observed between the solid rice hull plants, averaging 16.5 cm wide, and the plants in coir
and peat pots, with widths averaging 13 cm and 12.9 cm, respectively. In 2012, the final height
of lavender and the final leaf area of sunpatiens showed significant treatment effects in the
Analysis of Variance (P=0.039 and 0.040, respectively), but these differences again could not be
resolved by a separation of means test.
Overall, few differences were observed in measurements relating to plant growth in
sunpatiens and lavender. The observation that there were no significant differences in plant
growth and development measurements, for either species in 2011, yet slight differences in 2012,
could be attributed to somewhat different durations of the experiments and environmental
factors. Additionally, some of the differences in plant measurements between pot types in the
27
2012 short term experiment are not observed in the 2012 long term experiment. This suggests
that the differences observed in the 2012 sunpatiens plant growth could be plant specific, or that
given a longer production time, differences in plant growth among the pot types eventually
disappear.
These results are similar to those reported by several other studies. In an experiment by
Evans and Hensley (2004), all plants were watered as needed, and no significant differences
were found in dry shoot weights of Vinca or Impatiens grown in plastic or peat pots.
Significantly higher shoot weights were observed in plants grown in feather fiber pots, but the
author attributed this increased growth to additional nitrogen availability from the container
walls (Evans and Hensley, 2004).
A more recent study expanded on the work of Evans and Hensley, and evaluated the plant
growth of seven biopots, using three different irrigation methods. Their results also indicated that
plants grown in biopots were of equal size and quality as those grown in conventional plastic
containers within each of the irrigation types tested (Koeser et al., 2013b). In short, very few
differences have been observed in previous studies and our work corroborates these
observations.
In light of this, it is important to note that visual ranking was conducted for both seasons
of lavender crops, and no differences were apparent among pot types. Despite the fact that some
differences did occur between the four experiments, the data suggests that most biodegradable
pots are capable of producing marketable crops that are comparable in size and appearance to the
same species of crop grown in a traditional plastic pot.
28
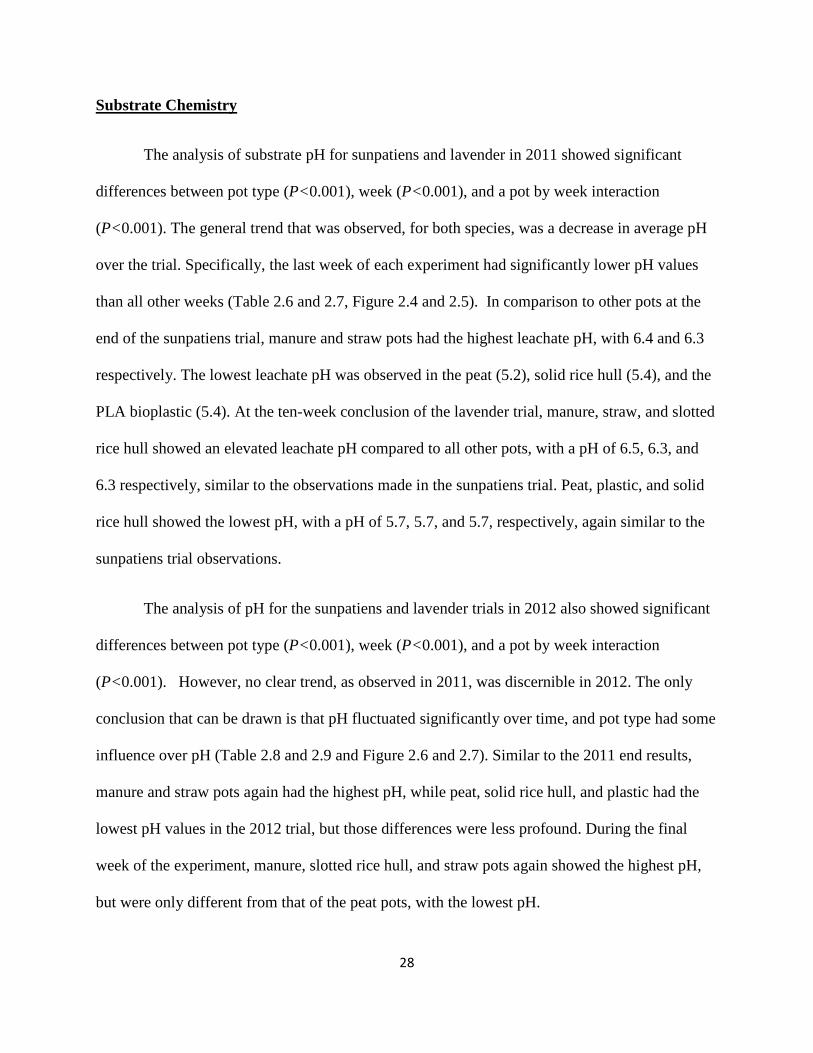
Substrate Chemistry
The analysis of substrate pH for sunpatiens and lavender in 2011 showed significant
differences between pot type (P<0.001), week (P<0.001), and a pot by week interaction
(P<0.001). The general trend that was observed, for both species, was a decrease in average pH
over the trial. Specifically, the last week of each experiment had significantly lower pH values
than all other weeks (Table 2.6 and 2.7, Figure 2.4 and 2.5). In comparison to other pots at the
end of the sunpatiens trial, manure and straw pots had the highest leachate pH, with 6.4 and 6.3
respectively. The lowest leachate pH was observed in the peat (5.2), solid rice hull (5.4), and the
PLA bioplastic (5.4). At the ten-week conclusion of the lavender trial, manure, straw, and slotted
rice hull showed an elevated leachate pH compared to all other pots, with a pH of 6.5, 6.3, and
6.3 respectively, similar to the observations made in the sunpatiens trial. Peat, plastic, and solid
rice hull showed the lowest pH, with a pH of 5.7, 5.7, and 5.7, respectively, again similar to the
sunpatiens trial observations.
The analysis of pH for the sunpatiens and lavender trials in 2012 also showed significant
differences between pot type (P<0.001), week (P<0.001), and a pot by week interaction
(P<0.001). However, no clear trend, as observed in 2011, was discernible in 2012. The only
conclusion that can be drawn is that pH fluctuated significantly over time, and pot type had some
influence over pH (Table 2.8 and 2.9 and Figure 2.6 and 2.7). Similar to the 2011 end results,
manure and straw pots again had the highest pH, while peat, solid rice hull, and plastic had the
lowest pH values in the 2012 trial, but those differences were less profound. During the final
week of the experiment, manure, slotted rice hull, and straw pots again showed the highest pH,
but were only different from that of the peat pots, with the lowest pH.

29
In all four experiments, leachate pH of the manure, straw, and slotted rice hull treatments
was elevated, especially early on in the experiments. Leaching of pot material from the
composted cow manure pots (a neutral pH material) could have led to an elevated pH during the
initial stages of the experiment. However, it is unclear why the straw and slotted rice hull pots
showed elevated pH readings in our study, but one could speculate that pot composting due to
the addition of fertilizer could lead to higher leachate pH readings. Again, when pH readings are
compared to the 2012 plant growth results, no pattern is discernible between pH and plant
growth.
The pH range recommendation for sunpatiens is between 5.8 to 6.3, while lavender
prefers a slightly more alkaline range of 6.0 to 8.0 (Ball, 1998). In the 2011 sunpatiens trial, all
pots had leachate pH above the recommended range during Week 0 or Week 2, and by the final
week of the experiment, wood fiber, peat, PLA bioplastic, plastic, and solid rice hull had fallen
below the recommended range. A similar drop below the recommended range was also observed
during the final week of the 2011 lavender trial. However, these changes in pH likely did not
affect plant growth, as no significant differences were apparent in the 2011 plant growth data,
and no pattern was discernible when plant growth differences in 2012 were compared to pH
measurements.
In conclusion, some differences were observed in pH between pot types over the course
of the experiments. Leachate pH did fluctuate outside of the recommended range, however these
pH readings did not significantly impact plant growth and development. The use of some pots,
such as composted manure, straw, and slotted rice hull, should be accompanied with a cautionary
note that the use of these pots may contribute to higher media PH than plastic pots, while the use
of peat pots can lead to a slightly lower media pH.
30
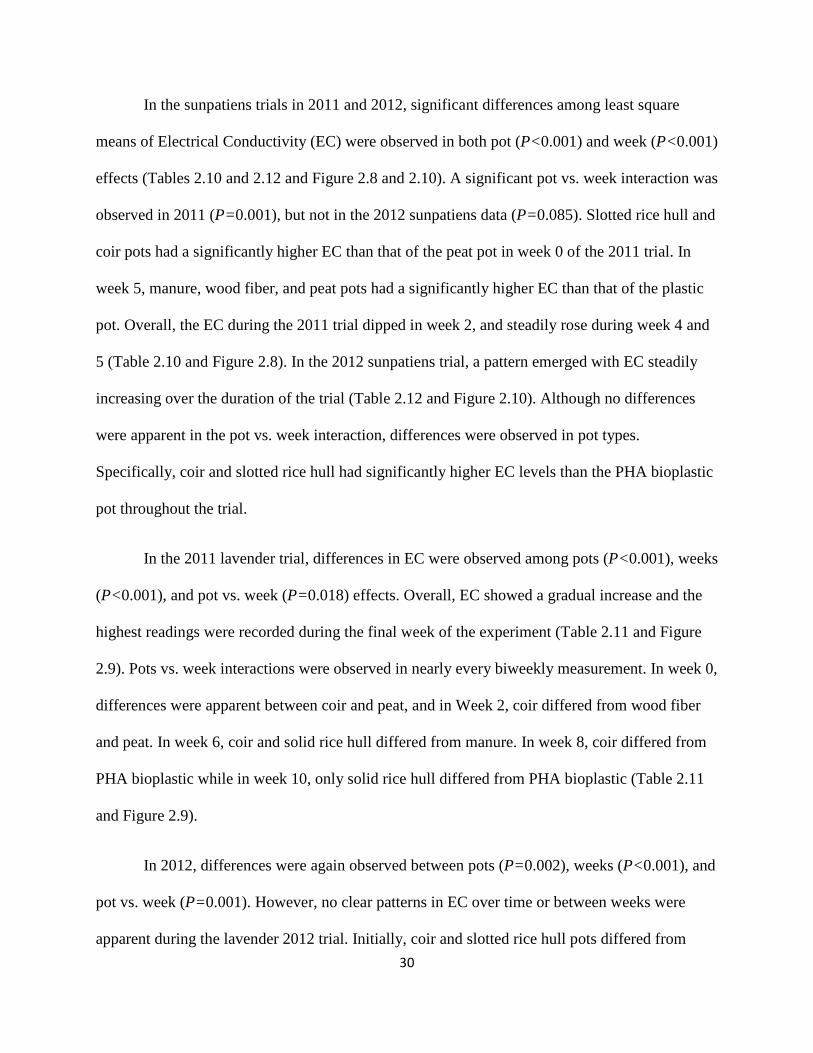
In the sunpatiens trials in 2011 and 2012, significant differences among least square
means of Electrical Conductivity (EC) were observed in both pot (P<0.001) and week (P<0.001)
effects (Tables 2.10 and 2.12 and Figure 2.8 and 2.10). A significant pot vs. week interaction was
observed in 2011 (P=0.001), but not in the 2012 sunpatiens data (P=0.085). Slotted rice hull and
coir pots had a significantly higher EC than that of the peat pot in week 0 of the 2011 trial. In
week 5, manure, wood fiber, and peat pots had a significantly higher EC than that of the plastic
pot. Overall, the EC during the 2011 trial dipped in week 2, and steadily rose during week 4 and
5 (Table 2.10 and Figure 2.8). In the 2012 sunpatiens trial, a pattern emerged with EC steadily
increasing over the duration of the trial (Table 2.12 and Figure 2.10). Although no differences
were apparent in the pot vs. week interaction, differences were observed in pot types.
Specifically, coir and slotted rice hull had significantly higher EC levels than the PHA bioplastic
pot throughout the trial.
In the 2011 lavender trial, differences in EC were observed among pots (P<0.001), weeks
(P<0.001), and pot vs. week (P=0.018) effects. Overall, EC showed a gradual increase and the
highest readings were recorded during the final week of the experiment (Table 2.11 and Figure
2.9). Pots vs. week interactions were observed in nearly every biweekly measurement. In week 0,
differences were apparent between coir and peat, and in Week 2, coir differed from wood fiber
and peat. In week 6, coir and solid rice hull differed from manure. In week 8, coir differed from
PHA bioplastic while in week 10, only solid rice hull differed from PHA bioplastic (Table 2.11
and Figure 2.9).
In 2012, differences were again observed between pots (P=0.002), weeks (P<0.001), and
pot vs. week (P=0.001). However, no clear patterns in EC over time or between weeks were
apparent during the lavender 2012 trial. Initially, coir and slotted rice hull pots differed from

31
wood fiber and peat, but by Week 2, only plastic differed from peat and manure. Between weeks
4 and 8, the overall EC measurements fluctuated dramatically. However, all pot types maintained
statistically similar EC levels during Weeks 4, 6, 8, and 12. During Week 10, only manure
differed from PLA bioplastic (Table 2.13 and Figure 2.11).
Overall, coir showed an elevated average EC during all four experiments, but was only
significantly different from that of the plastic control pot in Week 0 for the lavender experiment
in 2011. It is recommended that EC levels be below 4.5 to 5.0 dS/m (4500-5000 mS/cm) for the
pour through method (Nelson, 2002). New Guinea Impatiens are especially sensitive to salt
accumulation (Dole and Wilkins, 2005). Throughout the duration of all four trials, recorded EC
levels never exceed this critical point. In conclusion, despite EC fluctuations and differences
among pot types, it is unlikely that EC significantly affected plant growth, as significantly high
or low EC measurements did not seem to match any patterns observed in plant growth.
Watering Frequency
Both species required more frequent watering during the 2012 season compared to the
2011 season. For example, peat pots in the 2011 lavender trial were watered 25 times during the
season, in comparison to 36 times in the 2012 lavender trial. This was likely due to the shorter
duration of the experiment, but also environmental factors, such as a higher median temperature
in the 2012 season.
In the short term sunpatiens crop, no significant differences (P=0.258) were seen in
watering frequency for the 2011 season (Table 2.14). However, there was a significant difference
in watering frequency among pots for the 2012 season (P<0.001). Wood fiber, peat, and manure
pots were among the top tier of pots in watering frequency, and slotted rice hull, straw, and PHA

32
bioplastic were among the lowest tier of water requirements. In comparison to the plastic control
pot, which required a watering frequency of 21.3, only the PHA bioplastic differed with an
average frequency of 16.3 (Table 2.16).
Although differences were not seen in 2011 for the short term sunpatiens, differences in
watering frequency were significant for the long term lavender 2011 trial (P=0.006). In the
lavender 2011 trial, the peat pot, with a watering frequency of 25.0, differed from the PLA
bioplastic and PHA bioplastic pots, with an average number of watering of 13.6 and 14.0,
respectively. However, no pots were significantly different from that of the plastic control pot in
watering frequency (Table 2.15). In the lavender 2012 trial, significant differences (P=0.002)
were observed between coir and peat pots, both requiring an average watering frequency of 36.3,
and the PHA bioplastic and straw pots, with 27.3 and 27.0, respectively. Again, no pot types
were significantly different from that of the plastic control pot in the number of watering events
(Table 2.17)
Over all four trials, the peat pot maintained the highest average watering frequency
compared to all other pots, while PHA bioplastic and straw pots were among the lowest water
requiring treatments. Although peat did consistently have the highest average watering
frequency, the peat pot was not statistically different from the plastic control pot in any of the
four trials. Furthermore, with the exception of the PHA bioplastic during the sunpatiens 2012
trial, all pots tested had watering frequencies that were not significantly different from that of the
plastic control pot.
A similar study conducted at the University of Illinois measured the water use of
biocontainers in a greenhouse setting. Plants were watered by hand using a beaker when the soil
33
moisture levels were at or below 40% VWC. Water use was calculated as the difference between
the volume of water applied and the volume of water lost through drainage. The results showed
that containers made of porous material used greater volumes of water, and that the wood fiber
pot required the highest amount of water overall. However, the author notes that the use of
shuttle trays and potting mix optimization may negate some of the differences observed (Koeser
et al., 2013a).
These results suggest that most biodegradable pots have similar watering requirements to
traditional plastic pots, but growers should be alerted to possible higher watering frequencies of
biopots made of porous materials, such as the peat, coir, wood fiber, and manure pots.
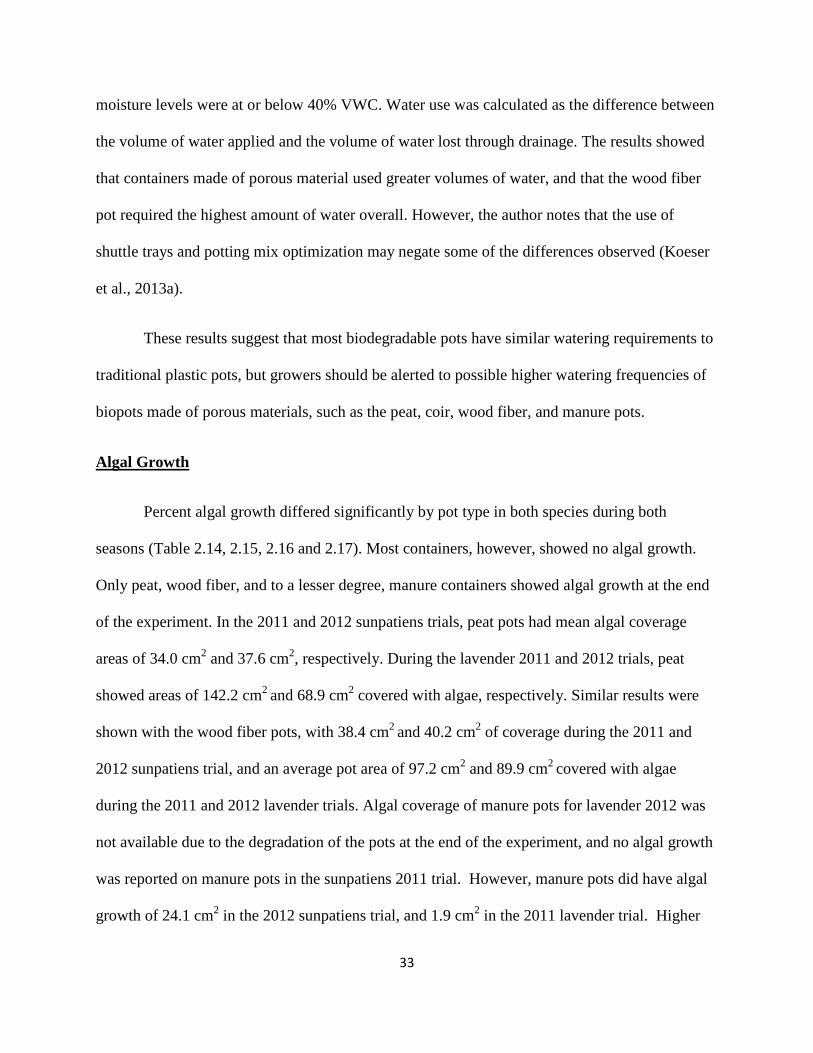
Algal Growth
Percent algal growth differed significantly by pot type in both species during both
seasons (Table 2.14, 2.15, 2.16 and 2.17). Most containers, however, showed no algal growth.
Only peat, wood fiber, and to a lesser degree, manure containers showed algal growth at the end
of the experiment. In the 2011 and 2012 sunpatiens trials, peat pots had mean algal coverage
areas of 34.0 cm2 and 37.6 cm2, respectively. During the lavender 2011 and 2012 trials, peat
showed areas of 142.2 cm2 and 68.9 cm2 covered with algae, respectively. Similar results were
shown with the wood fiber pots, with 38.4 cm2 and 40.2 cm2 of coverage during the 2011 and
2012 sunpatiens trial, and an average pot area of 97.2 cm2 and 89.9 cm2 covered with algae
during the 2011 and 2012 lavender trials. Algal coverage of manure pots for lavender 2012 was
not available due to the degradation of the pots at the end of the experiment, and no algal growth
was reported on manure pots in the sunpatiens 2011 trial. However, manure pots did have algal
growth of 24.1 cm2 in the 2012 sunpatiens trial, and 1.9 cm2 in the 2011 lavender trial. Higher

34
levels of algal growth were observed on peat and wood fiber pots as the time of production in the
greenhouse increased. At the conclusion of the long term experiments, every peat and wood fiber
pot had measureable algae growth. These results are similar to those observed at the University
of Illinois, in which wood fiber and peat pots also showed algal growth during a six-week trial,
and algal growth became more widespread as the study time increased. After the 12-week trial,
algal growth was reported on wood fiber, peat, and manure pots (Koeser, 2013). Algal growth
could weaken the overall appearance of a marketable product, and may have a negative impact
on a consumer’s willingness to purchase plants.
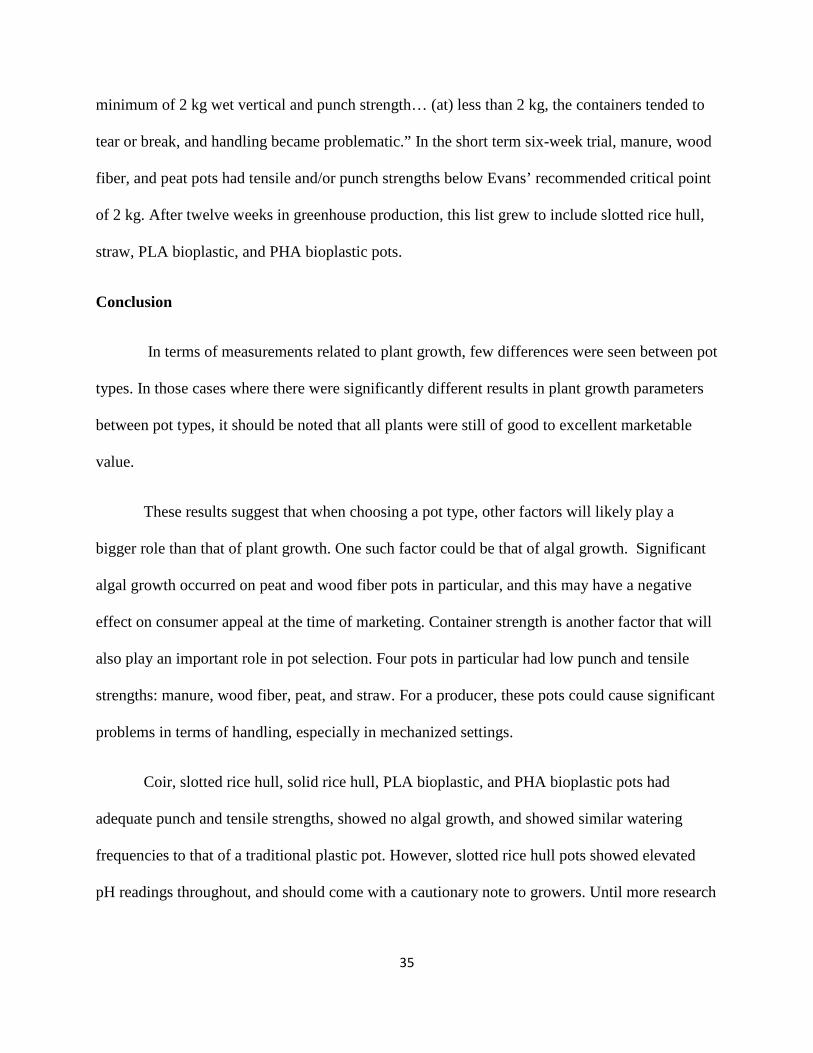
Container Strength
The punch strength of the biopots differed significantly by container type for sunpatiens
in 2011 and 2012 (P<0.001), and also for lavender in 2011 and 2012 (P<0.001). Plastic
containers offered high punch strengths with means ranging from 14.4 kg to 20.0 kg. Only the
coir containers in the short term sunpatiens trials provided punch strengths similar to plastic
(Table 2.14, 2.15, 2.16, and 2.17). In all other trials, all nine biopots had significantly lower
punch strengths than that of the plastic control pot. Specifically, manure, peat, and wood fiber
pots consistently showed the lowest punch strengths, ranging from 0.1 kg to 0.6 kg.
Tensile strength varied significantly by container type. Five containers had tensile
strengths consistently above 10 kg: coir, slotted rice hull, PLA bioplastic, plastic, and solid rice
hull (Table 2.14, 2.15, 2.16 and 2.17). Manure and wood fiber containers consistently had tensile
strengths at 0 kg for all trials. The peat pot showed a tensile strength of 1.9 kg in the sunpatiens
2012 trial, but 0 in all other trials, while the straw pot had average tensile strengths between 2.2
and 5.7. Similar research conducted by Evans et al., (2010), found that containers “required a
35
minimum of 2 kg wet vertical and punch strength… (at) less than 2 kg, the containers tended to
tear or break, and handling became problematic.” In the short term six-week trial, manure, wood
fiber, and peat pots had tensile and/or punch strengths below Evans’ recommended critical point
of 2 kg. After twelve weeks in greenhouse production, this list grew to include slotted rice hull,
straw, PLA bioplastic, and PHA bioplastic pots.
Conclusion
In terms of measurements related to plant growth, few differences were seen between pot
types. In those cases where there were significantly different results in plant growth parameters
between pot types, it should be noted that all plants were still of good to excellent marketable
value.
These results suggest that when choosing a pot type, other factors will likely play a
bigger role than that of plant growth. One such factor could be that of algal growth. Significant
algal growth occurred on peat and wood fiber pots in particular, and this may have a negative
effect on consumer appeal at the time of marketing. Container strength is another factor that will
also play an important role in pot selection. Four pots in particular had low punch and tensile
strengths: manure, wood fiber, peat, and straw. For a producer, these pots could cause significant
problems in terms of handling, especially in mechanized settings.
Coir, slotted rice hull, solid rice hull, PLA bioplastic, and PHA bioplastic pots had
adequate punch and tensile strengths, showed no algal growth, and showed similar watering
frequencies to that of a traditional plastic pot. However, slotted rice hull pots showed elevated
pH readings throughout, and should come with a cautionary note to growers. Until more research

36
is conducted, coir, solid rice hull, PLA bioplastic, and PHA bioplastic pots could be considered
superior based on our results.
The most likely contributing factor to that of pot selection will be cost. Consumer
willingness to pay a higher price for biodegradable pots has been studied. Yue et al., (2010)
found that survey participants were willing to pay approximately a $0.58 premium per rice hull
pot, $0.37 premium per straw pot, and $0.23 premium for each PLA bioplastic pot, compared
with traditional plastic containers. But, additional costs other than the initial pot price must also
be considered. Many of the biodegradable pots are hard to separate, and could cause a costly
increase in labor required at planting time (see addendum, page 81). Factors such as this need to
be further researched before biodegradable plant pots can be unequivocally recommended as
alternatives to plastic pots in floriculture production.

37
Figure 2.1. Containers used for the study. Top row, left to right: Peat, straw, coir, manure. Bottom row: Slotted rice hull, solid rice hull, plastic pot, PHA bioplastic sleeve. Not pictured: Wood fiber, PLA bioplastic pot.
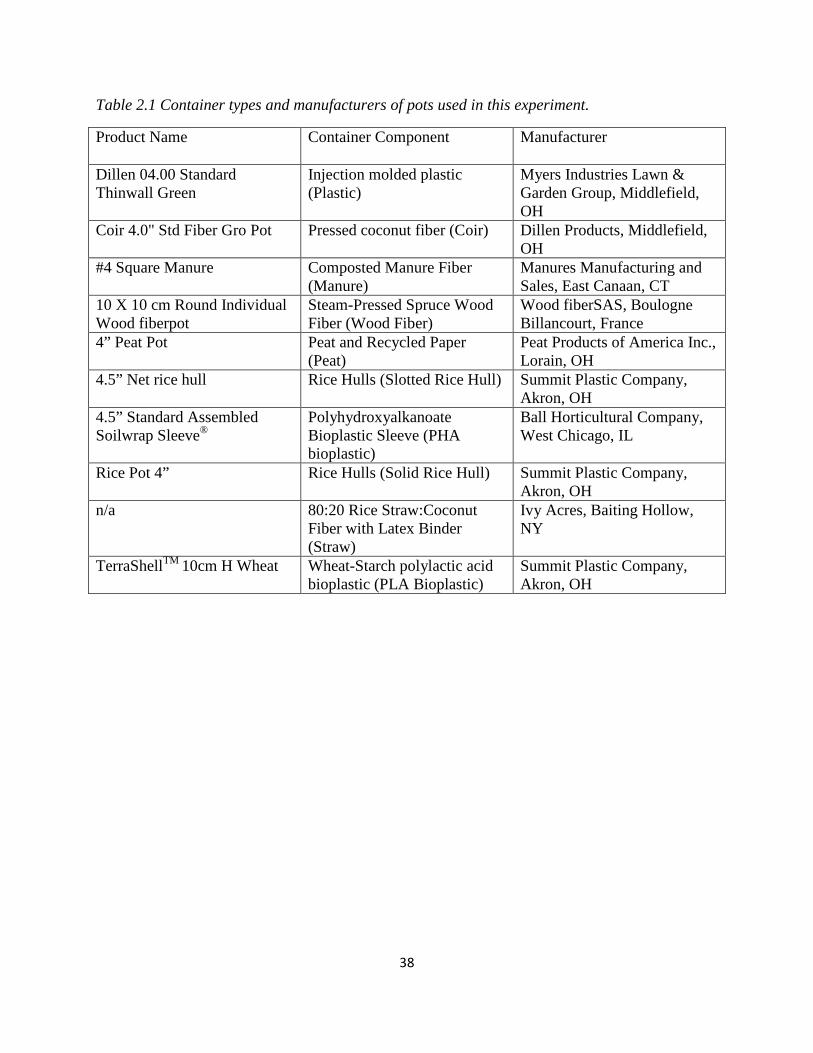
38
Table 2.1 Container types and manufacturers of pots used in this experiment.
Product Name Container Component Manufacturer
Dillen 04.00 Standard Thinwall Green
Injection molded plastic (Plastic)
Myers Industries Lawn & Garden Group, Middlefield, OH
Coir 4.0" Std Fiber Gro Pot Pressed coconut fiber (Coir) Dillen Products, Middlefield, OH
#4 Square Manure Composted Manure Fiber (Manure)
Manures Manufacturing and Sales, East Canaan, CT
10 X 10 cm Round Individual Wood fiberpot
Steam-Pressed Spruce Wood Fiber (Wood Fiber)
Wood fiberSAS, Boulogne Billancourt, France
4” Peat Pot Peat and Recycled Paper (Peat)
Peat Products of America Inc., Lorain, OH
4.5” Net rice hull Rice Hulls (Slotted Rice Hull) Summit Plastic Company, Akron, OH
4.5” Standard Assembled Soilwrap Sleeve®
Polyhydroxyalkanoate Bioplastic Sleeve (PHA bioplastic)
Ball Horticultural Company, West Chicago, IL
Rice Pot 4” Rice Hulls (Solid Rice Hull) Summit Plastic Company, Akron, OH
n/a 80:20 Rice Straw:Coconut Fiber with Latex Binder (Straw)
Ivy Acres, Baiting Hollow, NY
TerraShellTM 10cm H Wheat Wheat-Starch polylactic acid bioplastic (PLA Bioplastic)
Summit Plastic Company, Akron, OH

39
Figure 2.2. Experimental design of the greenhouse experiment.

40
Figure 2.3. Photographs depicting visual ratings of Lavendula angustifolia ‘Elegans Ice’ in 2011. From left to right, “1”, “3”, and “5”.

42
Table 2.2. Final plant growth of Impatiens spp. 'Sunpatiens Compact' grown in a greenhouse for five weeks in 2011 using biodegradable plant pots.
Coir 59.7 a 3.7 a 23.3 a 13.7 a 681.8 aManure 68.3 a 4.1 a 23.7 a 15.6 a 754.2 aWood Fiber 66.0 a 4.1 a 22.8 a 14.1 a 779.6 aPeat 66.1 a 3.9 a 24.2 a 14.8 a 780.1 aSlot. Rice Hull 68.7 a 4.4 a 24.4 a 13.5 a 767.3 aPLA Bioplastic 58.3 a 3.6 a 22.8 a 13.2 a 696.2 aPHA Bioplastic 73.0 a 4.6 a 24.2 a 14.6 a 829.7 aSolid Rice Hull 62.6 a 3.8 a 23.6 a 14.3 a 715.7 aStraw 60.4 a 3.8 a 23.1 a 14.2 a 698.0 aPlastic 65.8 a 4.4 a 23.7 a 14.6 a 742.3 a
P value 0.278 0.269 0.710 0.823 0.548
All measurements were taken at the end of the five week experiment. zMeans in a column followed by different letters are significantly different at the P ≤ 0.05 level, Holm-Sidak method. yData passed Normality Test (Shapiro Wilk) and Equal Variance Test. xData passed Equal Variance Test, but failed Normality Test (Shapiro Wilk).
method was used to indicate if treatments were different from other treatments (as indicated by lower case letters).Experimental units were replicated three times. Statistical analysis using ANOVA with Holm-Sidak
Final Area
(cm2)yz Container Type Fresh Wt (g)yz Dry Wt. (g)yz Final Width
(cm)xz
Final Height
(cm)yz

43
Table 2.3. Final plant growth of Lavendula angustifolia 'Elegans Ice' grown in a greenhouse for ten weeks in 2011 using biodegradable plant pots.
Coir 19.1 a 3.5 a 11.5 a 26.4 a 381.4 a 4.5 aManure 21.3 a 3.7 a 12.9 a 34.6 a 439.4 a 4.7 aWood Fiber 22.0 a 3.7 a 12.9 a 30.3 a 482.1 a 4.5 aPeat 22.3 a 4.0 a 11.8 a 29.6 a 446.9 a 4.6 aSlot. Rice Hull 19.1 a 3.3 a 13.5 a 27.4 a 428.4 a 3.6 aPLA Bioplastic 17.9 a 2.9 a 12.3 a 25.7 a 440.2 a 3.7 aPHA Bioplastic 24.4 a 4.0 a 13.6 a 28.5 a 514.8 a 4.7 aSolid Rice Hull 21.7 a 4.0 a 14.1 a 28.3 a 496.5 a 4.3 aStraw 17.8 a 3.3 a 12.4 a 29.3 a 379.9 a 4.6 aPlastic 19.2 a 3.2 a 13.5 a 28.4 a 438.2 a 3.7 a
P value 0.028 0.416 0.156 0.095 0.591 0.018
All measurements were taken at the end of the ten week experiment. zMeans in a column followed by different letters are significantly different at the P ≤ 0.05 level, Holm-Sidak method. yData passed Normality Test (Shapiro Wilk) and Equal Variance Test. xData passed Equal Variance Test, but failed Normality Test (Shapiro Wilk). wData failed Normality Test (Shapiro Wilk) and Equal Variance Test.
Experimental units were replicated three times. Statistical analysis using ANOVA with Holm-Sidak method was used to indicate if treatments were different from other treatments (as indicated by lower case letters).
Final Area
(cm2)wz RankingxzContainer Type Fresh Wt (g)yz Dry Wt. (g)yz Final Width
(cm)yz
Final Height
(cm)yz

44
Table 2.4. Final plant growth of Impatiens spp. 'Sunpatiens Compact' grown in a greenhouse for six weeks in 2012 using biodegradable plant pots.
Coir 56.9 e 3.6 bc 20.7 a 14.9 b 666.6 aManure 79.6 ab 4.7 ab 22.9 a 18.5 a 923.8 aWood Fiber 68.0 bcde 4.4 abc 21.6 a 17.4 ab 751.6 aPeat 65.2 bcde 4.0 abc 21.7 a 17.8 ab 733.2 aSlot. Rice Hull 57.9 e 3.5 c 20.7 a 15.2 ab 698.4 aPLA Bioplastic 73.5 abcd 4.3 abc 21.3 a 16.4 ab 774.2 aPHA Bioplastic 86.1 a 4.9 a 21.9 a 17.6 ab 911.5 aSolid Rice Hull 63.9 cde 4.0 abc 21.6 a 15.6 ab 781.0 aStraw 55.7 e 3.4 c 20.9 a 16.3 ab 676.8 aPlastic 76.3 abc 4.5 ab 22.5 a 16.8 ab 836.9 a
P value <0.001 <0.001 0.096 0.015 0.040
All measurements were taken at the end of thesix week experiment. zMeans in a column followed by different letters are significantly different at the P ≤ 0.05 level, Holm-Sidak method. yData passed Normality Test (Shapiro Wilk) and Equal Variance Test. xData passed Equal Variance Test, but failed Normality Test (Shapiro Wilk).
Experimental units were replicated three times. Statistical analysis using ANOVA with Holm-Sidak method was used to indicate if treatments were different from other treatments (as indicated by lower case letters).
Final Area
(cm2)wz Container Type Fresh Wt (g)yz Dry Wt. (g)yz Final Width
(cm)yz
Final Height
(cm)yz

45
Table 2.5. Final plant growth of Lavendula angustifolia 'Elegans Ice' grown in a greenhouse for twelve weeks in 2012 using biodegradable plant pots.
Container Type Fresh Wt (g)yz Dry Wt. (g)yz Final Width
(cm)yz Final Height
(cm)yz Final Area
(cm2)yz Rankingyz
Coir 26.0 a 5.7 a 13.0 b 22.6 a 451.0 a 3.9 a Manure 32.3 a 7.7 a 14.1 ab 31.3 a 527.0 a 3.8 a Wood Fiber 32.1 a 7.8 a 14.8 ab 29.2 a 545.1 a 3.7 a Peat 23.8 a 5.9 a 12.9 b 29.6 a 531.1 a 3.9 a Slot. Rice Hull 29.5 a 6.6 a 15.5 ab 26.7 a 572.0 a 3.6 a PLA Bioplastic 25.4 a 5.7 a 14.3 ab 25.1 a 454.1 a 3.5 a PHA Bioplastic 32.3 a 7.2 a 15.0 ab 28.7 a 534.8 a 3.8 a Solid Rice Hull 25.7 a 5.4 a 16.5 a 26.8 a 516.2 a 3.9 a Straw 32.2 a 7.4 a 15.1 ab 28.3 a 551.5 a 4.0 a Plastic 28.5 a 6.0 a 14.6 ab 24.4 a 515.1 a 3.8 a
P value 0.268 0.058 0.021 0.039 0.478 0.933 Experimental units were replicated three times. Statistical analysis using ANOVA with Holm-Sidak method was used to indicate if treatments were different from other treatments (as indicated by lower case letters). All measurements were taken at the end of the twelve week experiment. zMeans in a column followed by different letters are significantly different at the P ≤ 0.05 level, Holm-Sidak method. yData passed Normality Test (Shapiro Wilk) and Equal Variance Test.

46
Table 2.6. Leachate pH of media in biodegradable pots used to grow Impatiens spp. 'Sunpatiens Compact' in 2011x.
Coir 6.6 cd 6.6 de 6.4 bc 6.1 abManure 7.4 a 7.5 a 6.9 a 6.4 aWood Fiber 6.9 bc 7.1 abc 6.2 bc 5.7 bcdPeat 6.2 d 6.5 e 6.0 c 5.2 eSlot. Rice Hull 7.3 ab 7.3 ab 6.6 ab 6.0 abcPLA Bioplastic 6.6 cd 6.8 cde 6.2 bc 5.4 dePHA Bioplastic 6.5 cd 6.7 de 6.4 abc 6.1 abSolid Rice Hull 6.6 cd 6.7 de 6.2 bc 5.4 deStraw 6.9 bc 7.0 cd 6.5 ab 6.3 aPlastic 6.5 d 6.6 de 6.2 bc 5.6 cd
ANOVAPot <0.001Week <0.001Pot vs. Week <0.001Values are means of three experimental units replicated over time. Statistical analysis using ANOVAwith Tukey's Test or Holm-Sidak used to indicate if treatments were different from other treatments. Biweekly leachate pH measurements were taken using the pour-thru method. zMeans in a column followed by different letters are significantly different at the P ≤ 0.05 level, Tukey Test.yTreatments in a row followed by different letters are significantly different at the P ≤ 0.05 level, Holm-Sidak method.x Data for pH in 2011 passed Equal Variance Test and Normality Test (Shapiro Wilk).
Container TypeWeek 0
byzWeek 2 Week 4 Week 6
dyzcyzayz

47
Table 2.7. Leachate pH of media in biodegradable pots used to grow Lavendula angustifolia 'Elegans Ice' in 2011x.
Coir 6.3 d 6.5 c 6.5 cde 6.2 bc 6.3 bc 6.1 abcManure 7.6 a 7.3 a 7.4 a 7.2 a 6.9 a 6.5 aWood Fiber 6.8 b 7.0 ab 7.0 b 6.3 bc 6.1 bcd 6.0 bcdePeat 6.5 cd 6.5 c 6.3 e 6.0 c 5.7 d 5.7 eSlot. Rice Hull 7.0 b 7.3 a 7.4 a 7.1 a 6.4 b 6.3 abPLA Bioplastic 6.4 cd 6.4 c 6.4 de 6.2 bc 6.0 bcd 5.8 cdePHA Bioplastic 6.5 cd 6.4 c 6.6 bcde 6.3 bc 6.3 b 6.1 bcdSolid Rice Hull 6.4 cd 6.5 c 6.7 bcd 6.3 bc 5.9 cd 5.7 deStraw 6.7 d 6.8 bc 6.8 bc 6.4 b 6.4 b 6.3 abPlastic 6.4 cd 6.4 c 6.5 de 6.2 bc 6.0 bcd 5.7 de
ANOVAPot <0.001Week <0.001Pot vs. Week <0.001Values are means of three experimental units replicated over time. Statistical analysis using ANOVAwith Tukey's Test or Holm-Sidak used to indicate if treatments were different from other treatments. Biweekly leachate pH measurements were taken using the pour-thru method. zMeans in a column followed by different letters are significantly different at the P ≤ 0.05 level, Tukey Test.yTreatments in a row followed by different letters are significantly different at the P ≤ 0.05 level, Holm-Sidak method.x Data for pH in 2011 passed Equal Variance Test and Normality Test (Shapiro Wilk).
Container Typebz cz dz
Week 0 Week 2 Week 4 Week 6 Week 8 Week 10
ayz az az

48
Table 2.8. Leachate pH of media in biodegradable pots used to grow Impatiens spp. 'Sunpatiens Compact' in 2012x.
Coir 6.3 e 6.2 abc 6.3 bcd 6.7 abcdManure 7.0 ab 6.6 ab 7.2 a 7.1 aWood Fiber 6.9 abcd 6.2 bc 6.0 cde 6.3 bcdPeat 5.6 f 6.1 bc 5.3 f 5.7 efSlot. Rice Hull 7.1 a 6.6 ab 6.5 bc 6.7 abcPLA Bioplastic 6.9 abc 6.0 c 6.0 cde 6.3 cdePHA Bioplastic 6.4 de 6.7 a 6.7 b 6.7 abcdSolid Rice Hull 6.6 bcde 6.1 bc 5.7 ef 5.7 fStraw 6.7 abcde 6.5 ab 6.5 bc 6.8 abPlastic 6.5 cde 6.0 c 5.8 de 6.2 def
ANOVAPot <0.001Week <0.001Pot vs. Week <0.001Values are means of three experimental units replicated over time. Statistical analysis using ANOVAwith Tukey's Test or Holm-Sidak used to indicate if treatments were different from other treatments. Biweekly leachate pH measurements were taken using the pour-thru method. zMeans in a column followed by different letters are significantly different at the P ≤ 0.05 level, Tukey Test.yTreatments in a row followed by different letters are significantly different at the P ≤ 0.05 level, Holm-Sidak method.x Data for pH in 2012 passed Equal Variance Test and Normality Test (Shapiro Wilk).
Container TypeWeek 0 Week 2 Week 4 Week 6
ayz bcz cz bz

49
Table 2.9. Leachate pH of media in biodegradable pots used to grow Lavendula angustifolia 'Elegans Ice' in 2012x.
Coir 6.49 a 6.76 ab 6.4 bc 6.37 abc 6.74 abcd 6.32 abc 6.94 abManure 6.98 a 6.99 a 7.54 a 6.96 a 7.37 a 6.62 a 7.2 aWood Fiber 6.59 a 6.83 ab 5.87 cd 5.6 de 6.05 de 5.69 bcd 6.59 abcPeat 6.41 a 6.66 ab 5.54 d 7.09 e 6.71 e 6.58 d 6.25 cSlot. Rice Hull 7.09 a 7.02 a 6.71 b 6.58 ab 7.02 ab 6.07 abcd 7.24 aPLA Bioplastic 6.48 a 6.23 b 6.27 bc 5.98 bcde 6.08 de 5.62 cd 6.61 abcPHA Bioplastic 6.46 a 6.74 ab 6.87 ab 6.55 ab 6.9 abc 6.6 a 6.95 abSolid Rice Hull 6.49 a 6.24 b 5.9 cd 5.89 bcde 6.45 bcde 5.52 d 6.4 bcStraw 6.59 a 6.82 ab 6.48 bc 6.3 abcd 6.57 bcd 6.37 ab 7.1 aPlastic 6.39 a 6.24 b 6.28 bc 5.74 cde 6.2 cde 5.89 bcd 6.36 bc
ANOVAPot <0.001Week <0.001Pot vs. Week <0.001Values are means of three experimental units replicated over time. Statistical analysis using ANOVAwith Tukey's Test or Holm-Sidak used to indicate if treatments were different from other treatments. Biweekly leachate pH measurements were taken using the pour-thru method. zMeans in a column followed by different letters are significantly different at the P ≤ 0.05 level, Tukey Test.yTreatments in a row followed by different letters are significantly different at the P ≤ 0.05 level, Holm-Sidak method.x Data for pH in 2012 passed Equal Variance Test and Normality Test (Shapiro Wilk).
azWeek 12 Week 0 Week 2 Week 4 Week 6 Week 8 Week 10
abyz abzContainer Typecz dz bcz dz

50
5
5.5
6
6.5
7
7.5
8
0 2 4 6
Le
ach
ate
pH
Time after initial planting (Weeks)
Coir
Manure
Wood fiber
Peat
Slot. Rice
PLA
PHA
Solid Rice
Straw
Plastic
Figure 2.4. Leachate pH of media in biodegradable pots used to grow Impatiens spp. 'Sunpatiens Compact' in 2011. Values are means of three experimental units replicated over time. Statistical analysis using ANOVA with Tukey's Test or Holm-Sidak used to indicate if treatments were different from other treatments. Biweekly leachate pH measurements were taken using the pour-thru method.

51
5
5.5
6
6.5
7
7.5
8
0 2 4 6 8 10
Le
ach
ate
pH
Time after initial planting (Weeks)
Coir
Manure
Wood fiber
Peat
Slot. Rice
PLA
PHA
Solid Rice
Straw
Plastic
Figure 2.5. Leachate pH of media in biodegradable pots used to grow Lavendula angustifolia ‘Elegans Ice’ in 2011. Values are means of three experimental units replicated over time. Statistical analysis using ANOVA with Tukey's Test or Holm-Sidak used to indicate if treatments were different from other treatments. Biweekly leachate pH measurements were taken using the pour-thru method.

52
5
5.5
6
6.5
7
7.5
8
0 2 4 6
Lea
chat
e pH
Time after initial planting (Weeks)
Coir
Manure
Wood fiber
Peat
Slot. Rice
PLA
PHA
Solid Rice
Straw
Plastic
Figure 2.6. Leachate pH of media in biodegradable pots used to grow Impatiens spp. 'Sunpatiens Compact' in 2012x. Values are means of three experimental units replicated over time. Statistical analysis using ANOVA with Tukey's Test or Holm-Sidak used to indicate if treatments were different from other treatments. Biweekly leachate pH measurements were taken using the pour-thru method.
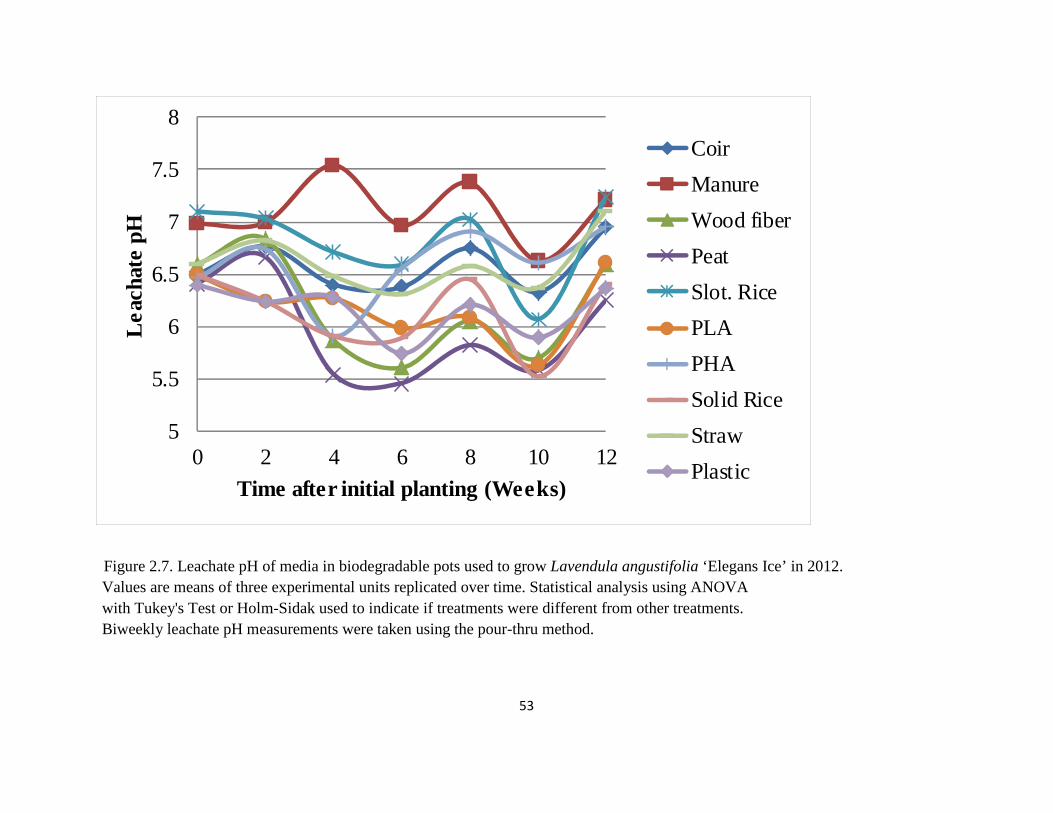
53
5
5.5
6
6.5
7
7.5
8
0 2 4 6 8 10 12
Lea
chat
e pH
Time after initial planting (Weeks)
Coir
Manure
Wood fiber
Peat
Slot. Rice
PLA
PHA
Solid Rice
Straw
Plastic
Figure 2.7. Leachate pH of media in biodegradable pots used to grow Lavendula angustifolia ‘Elegans Ice’ in 2012. Values are means of three experimental units replicated over time. Statistical analysis using ANOVA with Tukey's Test or Holm-Sidak used to indicate if treatments were different from other treatments. Biweekly leachate pH measurements were taken using the pour-thru method.

54
Table 2.10. Leachate EC (mS/cm) of media in biodegradable pots used to grow Impatiens spp. 'Sunpatiens Compact' in 2011x.
Coir 1971.2 a 1219.0 a 1372.6 a 1643.4abcManure 1733.1 ab 1170.1 a 1471.3 a 2195.3aWood Fiber 1243.3 ab 574.1 a 1659.1 a 2223.5aPeat 1157.7 b 655.2 a 1422.9 a 2183.8aSlot. Rice Hull 1929.8 a 1122.7 a 1486.3 a 1978.3abPLA Bioplastic 1400.9 ab 957.7 a 1415.0 a 1876.9abPHA Bioplastic 1542.6 ab 951.4 a 1107.0 a 1493.8abcSolid Rice Hull 1636.5 ab 822.2 a 1393.7 a 1662.7abcStraw 1513.9 ab 972.3 a 1230.7 a 1400.3bcPlastic 1587.1 ab 907.9 a 1259.2 a 1113.6c
ANOVAPot <0.001Week <0.001Pot vs. Week 0.001Values are means of three experimental units replicated over time. Statistical analysis using ANOVAwith Tukey's Test or Holm-Sidak used to indicate if treatments were different from other treatments. Biweekly leachate EC measurements were taken using the pour-thru method. zMeans in a column followed by different letters are significantly different at the P ≤ 0.05 level, Tukey Test.yTreatments in a row followed by different letters are significantly different at the P ≤ 0.05 level, Holm-Sidak method.x Data for EC in 2011 passed Equal Variance Test and Normality Test (Shapiro Wilk).
Container TypeWeek 0 Week 2 Week 4 Week 6
byz dz cz az
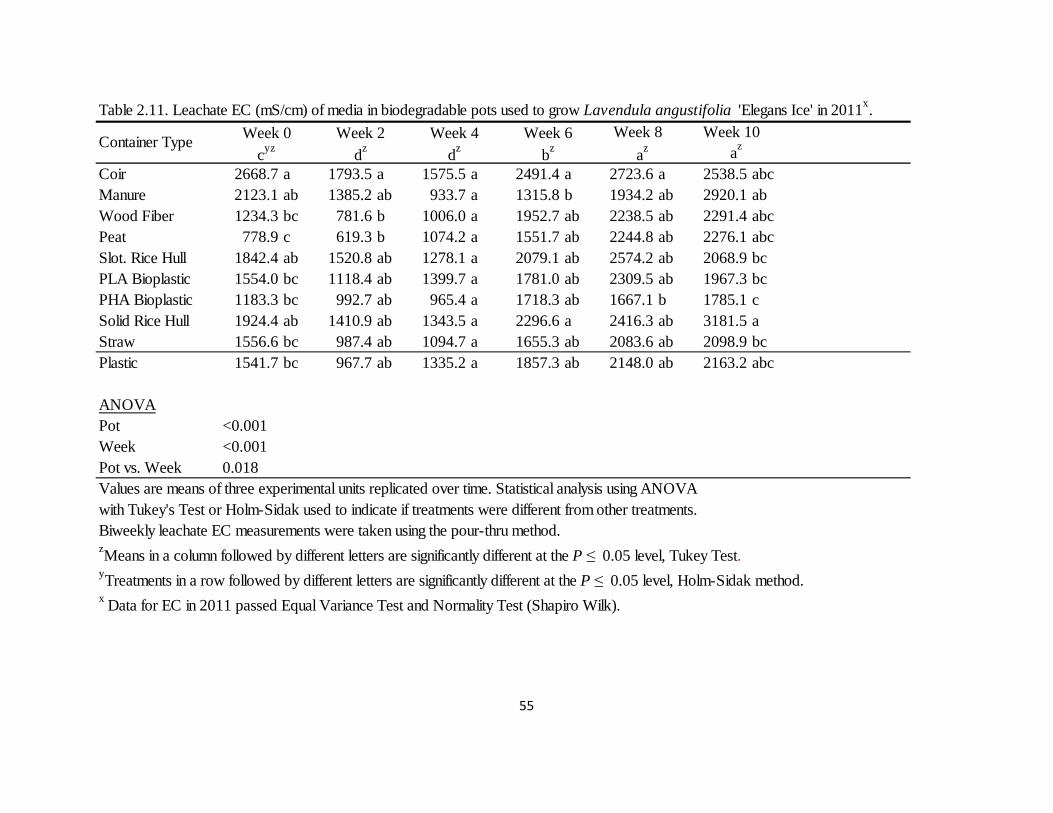
55
Table 2.11. Leachate EC (mS/cm) of media in biodegradable pots used to grow Lavendula angustifolia 'Elegans Ice' in 2011x.
Coir 2668.7 a 1793.5 a 1575.5 a 2491.4 a 2723.6 a 2538.5 abcManure 2123.1 ab 1385.2 ab 933.7 a 1315.8 b 1934.2 ab 2920.1 abWood Fiber 1234.3 bc 781.6 b 1006.0 a 1952.7 ab 2238.5 ab 2291.4 abcPeat 778.9 c 619.3 b 1074.2 a 1551.7 ab 2244.8 ab 2276.1 abcSlot. Rice Hull 1842.4 ab 1520.8 ab 1278.1 a 2079.1 ab 2574.2 ab 2068.9 bcPLA Bioplastic 1554.0 bc 1118.4 ab 1399.7 a 1781.0 ab 2309.5 ab 1967.3 bcPHA Bioplastic 1183.3 bc 992.7 ab 965.4 a 1718.3 ab 1667.1 b 1785.1 cSolid Rice Hull 1924.4 ab 1410.9 ab 1343.5 a 2296.6 a 2416.3 ab 3181.5 aStraw 1556.6 bc 987.4 ab 1094.7 a 1655.3 ab 2083.6 ab 2098.9 bcPlastic 1541.7 bc 967.7 ab 1335.2 a 1857.3 ab 2148.0 ab 2163.2 abc
ANOVAPot <0.001Week <0.001Pot vs. Week 0.018Values are means of three experimental units replicated over time. Statistical analysis using ANOVAwith Tukey's Test or Holm-Sidak used to indicate if treatments were different from other treatments. Biweekly leachate EC measurements were taken using the pour-thru method. zMeans in a column followed by different letters are significantly different at the P ≤ 0.05 level, Tukey Test.yTreatments in a row followed by different letters are significantly different at the P ≤ 0.05 level, Holm-Sidak method.x Data for EC in 2011 passed Equal Variance Test and Normality Test (Shapiro Wilk).
Container Typeaz
Week 0 Week 2 Week 4 Week 6 Week 8 Week 10
cyz dz dz bz az

56
Table 2.12. Leachate EC (mS/cm) of media in biodegradable pots used to grow Impatiens spp. 'Sunpatiens Compact' in 2012x.
Coir 2607.4 a 2017.8 a 2013.8 a 1558.7 aManure 2021.3 a 1532.1 a 1572.2 a 1940.2 aWood Fiber 1891.6 a 2053.1 a 1999.3 a 1571.9 aPeat 2035.8 a 1931.1 a 2103.4 a 1527.3 aSlot. Rice Hull 2656.6 a 1985.4 a 1640.5 a 1776.4 aPLA Bioplastic 2187.4 a 1681.1 a 1304.7 a 1152.0 aPHA Bioplastic 1738.6 a 1248.3 a 1206.0 a 1231.7 aSolid Rice Hull 2369.1 a 1604.2 a 1751.0 a 1330.5 aStraw 2063.4 a 1538.2 a 1495.4 a 1245.2 aPlastic 2484.4 a 1934.9 a 1627.9 a 1254.7 a
ANOVAPot <0.001Week <0.001Pot vs. Week 0.085Values are means of three experimental units replicated over time. Statistical analysis using ANOVAwith Tukey's Test or Holm-Sidak used to indicate if treatments were different from other treatments. Biweekly leachate EC measurements were taken using the pour-thru method. zMeans in a column followed by different letters are significantly different at the P ≤ 0.05 level, Tukey Test.yTreatments in a row followed by different letters are significantly different at the P ≤ 0.05 level, Holm-Sidak method.x Data for EC in 2012 passed Equal Variance Test and Normality Test (Shapiro Wilk).
Container TypeWeek 0 Week 2 Week 4 Week 6
ayz bz bz cz
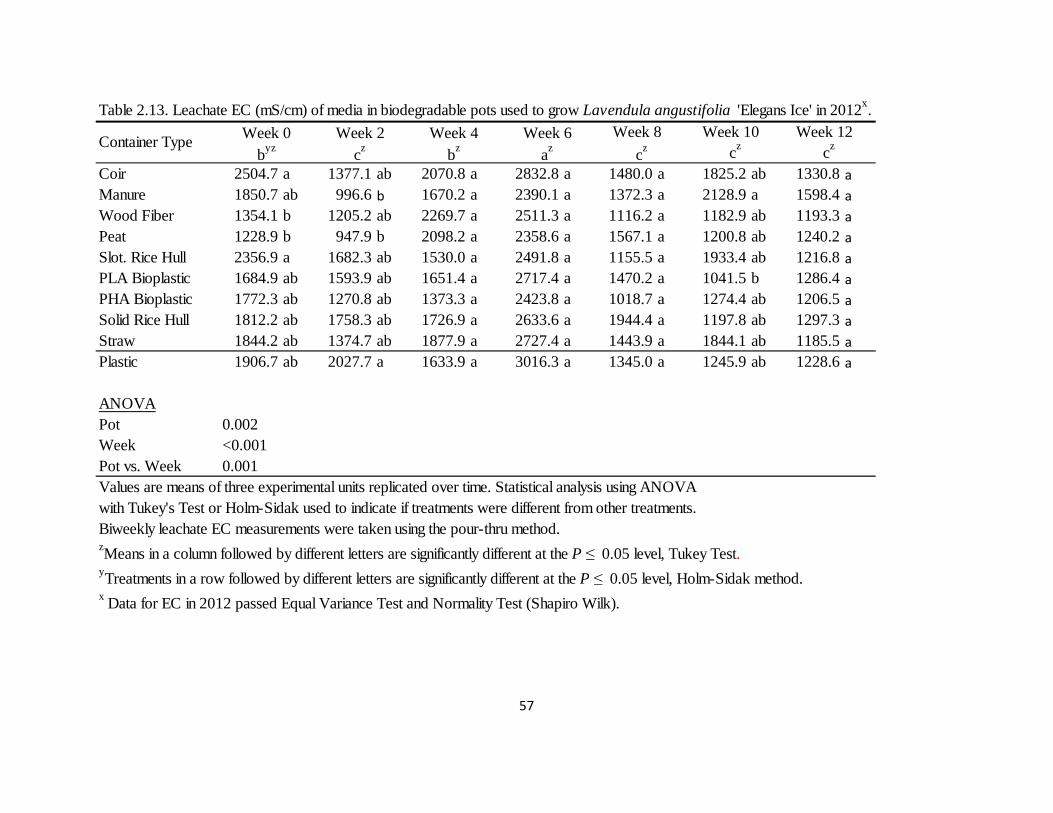
57
Table 2.13. Leachate EC (mS/cm) of media in biodegradable pots used to grow Lavendula angustifolia 'Elegans Ice' in 2012x.
Coir 2504.7 a 1377.1 ab 2070.8 a 2832.8 a 1480.0 a 1825.2 ab 1330.8 a
Manure 1850.7 ab 996.6b 1670.2 a 2390.1 a 1372.3 a 2128.9 a 1598.4a
Wood Fiber 1354.1 b 1205.2 ab 2269.7 a 2511.3 a 1116.2 a 1182.9 ab 1193.3a
Peat 1228.9 b 947.9 b 2098.2 a 2358.6 a 1567.1 a 1200.8 ab 1240.2 a
Slot. Rice Hull 2356.9 a 1682.3 ab 1530.0 a 2491.8 a 1155.5 a1933.4 ab 1216.8aPLA Bioplastic 1684.9 ab 1593.9 ab 1651.4 a 2717.4 a 1470.2 a1041.5 b 1286.4aPHA Bioplastic 1772.3 ab 1270.8 ab 1373.3 a 2423.8 a 1018.7 a1274.4 ab 1206.5aSolid Rice Hull 1812.2 ab 1758.3 ab 1726.9 a 2633.6 a 1944.4a 1197.8 ab 1297.3aStraw 1844.2 ab 1374.7 ab 1877.9 a 2727.4 a 1443.9 a 1844.1 ab 1185.5a
Plastic 1906.7 ab 2027.7 a 1633.9 a 3016.3 a 1345.0 a 1245.9 ab1228.6a
ANOVAPot 0.002Week <0.001Pot vs. Week 0.001Values are means of three experimental units replicated over time. Statistical analysis using ANOVAwith Tukey's Test or Holm-Sidak used to indicate if treatments were different from other treatments. Biweekly leachate EC measurements were taken using the pour-thru method. zMeans in a column followed by different letters are significantly different at the P ≤ 0.05 level, Tukey Test.yTreatments in a row followed by different letters are significantly different at the P ≤ 0.05 level, Holm-Sidak method.x Data for EC in 2012 passed Equal Variance Test and Normality Test (Shapiro Wilk).
cz czWeek 0 Week 2 Week 4 Week 6 Week 8 Week 10 Week 12
byzContainer Typecz bz az cz

58
0
500
1000
1500
2000
2500
0 2 4 6
Le
ach
ate
EC
Time after initial planting (weeks)
Coir
Manure
Wood fiber
Peat
Slot. Rice
PLA
PHA
Solid Rice
Straw
Plastic
Figure 2.8. Leachate EC of media in biodegradable pots used to grow Impatiens spp. ‘Sunpatiens Compact’ in 2011. Values are means of three experimental units replicated over time. Statistical analysis using ANOVA. Biweekly leachate EC measurements were taken using the pour-thru method.

59
0
500
1000
1500
2000
2500
0 2 4 6
Le
ach
ate
EC
Time after initial planting (weeks)
Coir
Manure
Wood fiber
Peat
Slot. Rice
PLA
PHA
Solid Rice
Straw
Plastic
Figure 2.9. Leachate EC of media in biodegradable pots used to grow Lavendula angustifolia ‘Elegans Ice’ in 2011. Values are means of three experimental units replicated over time. Statistical analysis ANOVA. Biweekly leachate EC measurements were taken using the pour-thru method.

60
0
500
1000
1500
2000
2500
3000
0 2 4 6
Le
ach
ate
EC
Time after initial planting (weeks)
Coir
Manure
Wood fiber
Peat
Slot. Rice
PLA
PHA
Solid Rice
Straw
Plastic
Figure 2.10. Leachate EC of media in biodegradable pots used to grow Impatiens spp. ‘Sunpatiens Compact’ in 2012. Values are means of three experimental units replicated over time. Statistical analysis using ANOVA. Biweekly leachate EC measurements were taken using the pour-thru method.
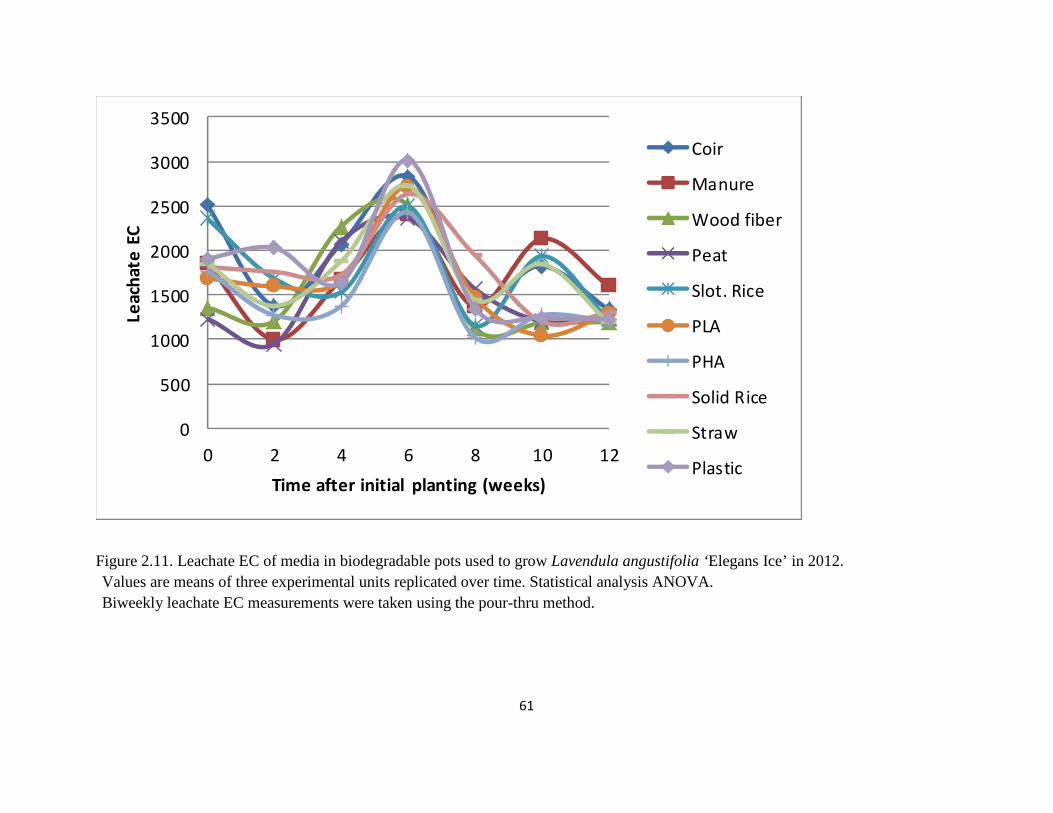
61
0
500
1000
1500
2000
2500
3000
3500
0 2 4 6 8 10 12
Le
ach
ate
EC
Time after initial planting (weeks)
Coir
Manure
Wood fiber
Peat
Slot. Rice
PLA
PHA
Solid Rice
Straw
Plastic
Figure 2.11. Leachate EC of media in biodegradable pots used to grow Lavendula angustifolia ‘Elegans Ice’ in 2012. Values are means of three experimental units replicated over time. Statistical analysis ANOVA. Biweekly leachate EC measurements were taken using the pour-thru method.

62
Table 2.14. Pot characteristics of biodegradable containers used to grow Impatiens spp. 'Sunpatiens Compact' in 2011.
Coir 14.3 a 0.0 a 22.3 a >10 aManure 13.3 a 0.0 a 0.2 c 0.0 cWood Fiber 15.3 a 38.4 a 0.3 c 0.0 cPeat 16.0 a 34.0 a 0.2 c 0.0 cSlot. Rice Hull 15.7 a 0.0 a 2.3 c >10 aPLA Bioplastic 12.7 a 0.0 a 4.5 b >10 aPHA Bioplastic 12.3 a 0.0 a 2.4 c .Solid Rice Hull 15.0 a 0.0 a 6.8 b >10 aStraw 13.0 a 0.0 a 2.8 c 5.8 bPlastic 14.0 a 0.0 a 19.9 a >10 a
P value 0.258 0.006 <0.001 <0.001Experimental units were replicated three times. Statistical analysis was made using ANOVA.Holm-Sidak method was used to indicate differences between treatments (as indicated by lower case letters). Missing data represented by "."Watering frequency was recorded throughout the experiment. Pot strength and algal/fungal growth was assessed at the end of the experiment. zMeans in a column followed by different letters are significantly different at the P ≤ 0.05 level, Holm-Sidak method.yData passed Normality Test (Shapiro Wilk) and Equal Variance Test. xData passed Equal Variance Test, but failed Normality Test (Shapiro Wilk).
Container TypeWatering
FrequencyyAlgal/Fungal
(kg)xz Punch (kg)xz Tensile (kg)xz

63
Table 2.15. Pot characteristics of biodegradable containers used to grow Lavendula angustifolia 'Elegans Ice' in 2011.
Coir 17.7 ab 0.0 c 7.7 b 10.0 aManure 19.0 ab 1.9 c 0.1 e 0 cWood Fiber 21.3 ab 97.2 b 0.2 e 0 cPeat 25.0 a 142.2 a 0.2 e 0 cSlot. Rice Hull18.0 ab 0.0 c 1.4 de 10.0 aPLA Bioplastic13.7 b 0.0 c 3.5 c 10.0 aPHA Bioplastic14.0 b 0.0 c 2.5 cd .Solid Rice Hull17.7 ab 0.0 c 6.4 b 10.0 aStraw 16.0 ab 0.0 c 1.3 de 4.1 bPlastic 15.7 ab 0.0 c 19.6 a 10 a
P value 0.0006 <0.001 0.001 0.001Experimental units were replicated three times. Statistical analysis was made using ANOVA.Holm-Sidak method was used to indicate differences between treatments (as indicated by lower case letters). Missing data represented by "."Watering frequency was recorded throughout the experiment. Pot strength and algal/fungal growth was assessed at the end of the experiment. zMeans in a column followed by different letters are significantly different at the P ≤ 0.05 level, Holm-Sidak method.yData passed Normality Test (Shapiro Wilk) and Equal Variance Test. xData passed Equal Variance Test, but failed Normality Test (Shapiro Wilk). wData failed Normality Test (Shapiro Wilk) and Equal Variance Test.
Container TypeWatering
Frequencyyz Algal/Fungal (kg)xz Punch (kg)wz Tensile (kg)xz

64
Table 2.16. Pot characteristics of biodegradable containers used to grow Impatiens spp. 'Sunpatiens Compact' in 2012.
Coir 20.7 abcdz 0.0 c 19.1 a >10 aManure 23.3 ab 24.1 b 0.3 c 0.0 cWood Fiber 25.0 a 40.2 a 0.3 c 0.0 cPeat 25.0 a 37.6 a 0.7 c 1.9 bSlot. Rice Hull 16.7 cd 0.0 c 2.1 c >10 aPLA Bioplastic 18.7 bcd 0.0 c 3.9 bc >10 aPHA Bioplastic 16.3 d 0.0 c 1.0 c .Solid Rice Hull 20.3 abcd 0.0 c 6.7 bc >10 aStraw 16.7 cd 0.0 c 3.0 bc 2.2 bPlastic 21.3 abc 0.0 c 14.4 ab >10 a
P value <0.001 <0.001 <0.001 <0.001Experimental units were replicated three times. Statistical analysis was made using ANOVA.Holm-Sidak method was used to indicate differences between treatments (as indicated by lower case letters). Missing data represented by "."Watering frequency was recorded throughout the experiment. Pot strength and algal/fungal growth was assessed at the end of the experiment. zMeans in a column followed by different letters are significantly different at the P ≤ 0.05 level, Holm-Sidak method.yData passed Normality Test (Shapiro Wilk) and Equal Variance Test. xData passed Equal Variance Test, but failed Normality Test (Shapiro Wilk).
Container TypeWatering
Frequencyyz Algal/Fungal (kg)xz Punch (kg)xz Tensile (kg)xz

65
Table 2.17. Pot characteristics of biodegradable containers used to grow Lavendula angustifolia 'Elegans Ice' in 2012.
Coir 36.3 a 0.0 b 12.5 b 10.0 aManure 30.7 ab . 0.2 e 0.0 cWood Fiber 34.3 ab 89.9 a 0.3 e 0.0 cPeat 36.3 a 69.0 a 0.5 e 2.6 bSlot. Rice Hull31.7 ab 0.0 b 1.7 de 10.0 aPLA Bioplastic29.0 ab 0.0 b 1.5 de 10.0 aPHA Bioplastic27.3 b 0.0 b 0.6 de .Solid Rice Hull29.7 ab 0.0 b 7.2 c 10.0 aStraw 27.0 b 0.0 b 2.2 d 3.6 bPlastic 30.0 ab 0.0 b 20.0 a 10.0 a
P value 0.002 <0.001 <0.001 <0.001Experimental units were replicated three times. Statistical analysis was made using ANOVA.Holm-Sidak method was used to indicate differences between treatments (as indicated by lower case letters). Missing data represented by "."Watering frequency was recorded throughout the experiment. Pot strength and algal/fungal growth was assessed at the end of the experiment. zMeans in a column followed by different letters are significantly different at the P ≤ 0.05 level, Holm-Sidak method.yData passed Normality Test (Shapiro Wilk) and Equal Variance Test. xData passed Equal Variance Test, but failed Normality Test (Shapiro Wilk).
Container TypeWatering
Frequencyyz Algal/Fungal (kg)xz Punch (kg)xz Tensile (kg)xz

66
Chapter 3: Evaluating the Performance of Biodegradable Pots in a Landscape Setting
Note: This work is part of a multi-institutional research initiative with additional trials conducted at
research facilities associated with the University of Illinois, Mississippi State University, and Texas A&M
University. For this thesis chapter, only work conducted at West Virginia University is reported. The final
publication to be submitted for peer review will include results from all four locations.
Summary
Recent introductions of several new biodegradable containers to the market have resulted in
research investigating biopots as potential alternatives to petroleum-based plastic containers.
Most research has focused on the performance of biodegradable pots in greenhouse settings and
their ability to withstand production environments. Little information is available pertaining to
the performance and degradability of these pots in the landscape. This research evaluated seven
plantable biopots and their effect on the growth and development of annuals during a growing
season (15 weeks) in the landscape. Above ground growth for the three crops, Lantana camara
‘Luscious Citrus’, Cleome hassleriana ‘Senorita Rosalita’, and Impatiens sp. ‘Sunpatiens
Compact’ was observed throughout the season, as well as pot degradation at the end of the
experiment. Results showed few differences in overall plant growth among the biopots tested,
and no significant differences were apparent in the visual quality ratings of plants at the end of
the growing season. Significant differences, however, were observed in pot degradation, as a
pattern of three tiers of pot performance emerged. Cowpot, a pot made from composted dairy
manure occupied the top tier with the most significant pot degradation at the end of the season.
Pots made of peat, straw, and PHA bioplastic were in the second tier. Pots made of coir, slotted
rice hulls, and wood fibers showed the least amount of degradation and were placed in a third tier
of biodegradability.

67
Background
Plastic containers for plant production have become a standard in the horticulture
industry because of their durability and flexibility to be made into virtually any size, shape, or
color (Evans et al., 2010). Plastic containers, however, have two significant limitations. First, the
container walls are impermeable, so when the roots contact the surface, they tend to circle the
container (Evans and Karcher, 2004). Root circling can be detrimental to a plant for numerous
reasons, including girdling of the stem, failing to adequately anchor plants once planted,
restricting the uptake of water, and decreasing nutrient absorption (Appleton, 1989). The second
limitation to plastic is the issue of proper disposal (Evans and Karcher, 2004). The horticulture
industry contributes a large part to the overall waste stream in the U.S. In 1993, Garthe and
Kowal (1993) found that of the 542 million pounds of plastic used in agriculture annually, 320
million pounds, or 59%, was attributed to plant containers. While agricultural plastic only
contributes about 1% to the total plastic waste stream in the US, the amount of waste is still
significant and could be improved upon (Garthe and Kowal, 1993; EPA, 2010).
Although solutions to reduce plastic waste have been proposed, many are not feasible for
the horticulture industry. Some plastic containers can be reused within the greenhouse and
nursery setting, but the cost of cleaning and sterilizing often hinders this process. Another
solution to reducing plastic waste is recycling, but recycling of horticulture products is
complicated by contamination with soil and plant residue, grease, moisture, pesticides, and UV
light degradation of the plastics (Garthe and Kowal, 1993).
Since recycling options for containers are limited and reuse is not always feasible, the
industry must move in a different direction to reduce plastic waste (Evans et al., 2010). One
68
possible solution is the use of biodegradable containers, or biopots. Biopots are containers not
produced from petroleum that degrade rapidly and reduce the need for disposal (Evans et al.,
2010). “Rapidly” could be defined as one plant season, or several years, depending on the type of
pots being used. Plantable biopots are designed to be left intact on the root ball upon planting,
and allow the roots to grow through the container walls, thus decreasing the potential for root
circling and transplanting stress that could be associated with non-plantable biopots. The pots
also could have a labor saving cost component, as they require less time to plant, and reduce
plastic waste that needs clean up and disposal after planting.
Most biopot research has studied the water use of specific biopots. Evans and Karcher
(2004) found that plants grown in a greenhouse in peat and feather fiber biopots required more
frequent irrigation and more water overall when compared to plants grown in plastic pots. This is
believed to be attributed to a faster rate of evaporation through container walls due to the porous
nature of the pot (Evans and Hensley, 2004). In the landscape, pots made of porous material
could also experience more or less water loss from the root zone to the surrounding soil when
compared to standard planting methods, resulting in possible increased or decreased desiccation
of the plant. However, very little, if any, in depth research has focused on the performance of
biopots in the landscape (Evans et al., 2010).
One of the greatest issues facing biopots is the uncertainty as to whether these pots could
endure the production process in the greenhouse and hold up during the marketing to consumer,
yet still degrade in the landscape. The wet and dry vertical strengths has been tested and some
pots, such as rice hull and manure, have high dry vertical strengths, sometimes even higher than
plastic. Unsurprisingly, the wet strength of biopots was found to be lower than the dry strength

69
(Evans et al., 2010). In fact, after four weeks in a greenhouse setting, wood fiber, peat, and
manure pots had such low wet vertical strengths, that manual handling was found to be difficult
(Evans et al., 2010). This same study found that after 8 weeks in the landscape, manure pots had
the highest level of decomposition, followed by peat, rice straw, and wood fiber containers,
though no measurements pertaining to plant growth were taken (Evans et al., 2010).
The objectives of this study were to evaluate the effects of biodegradable pots on plants
grown in the landscape, and to evaluate the container degradation of seven plantable
biocontainers during two summer seasons using a low, medium, and high water requiring crop.
Materials and Methods
Location and Environment
The landscape performance experiment was conducted in a research field plot at the West
Virginia University Agronomy Farm in Morgantown, WV (US Hardiness Zone 6a), measuring
approximately 9 by 21 meters. Prior to planting, the plot was tilled and leveled. Black
plastic/landscape fabric was laid down to prevent weed growth, and a six-foot-tall wildlife
netting fence was placed around the perimeter of the plot. The first trial of the experiment began
on June 28, 2011 and ended October 9, 2011. The second trial began June 25, 2012 and ended
October 9, 2012.
Mean temperatures for 2011 and 2012 were comparable (Figure 3.1), but precipitation
amounts varied greatly between years (Figure 3.2). Initial ANOVA analysis of the data showed
differences in some measurements between years, but no pot-by-year interaction. Given this

70
difference between seasons and the differences in experimental design (fewer replications), the
results were analyzed and discussed by year.
Pots
Seven types of plantable biopots were evaluated for their performance in a landscape
setting and compared to a control plastic pot (Table 3.1). The plastic control pots were removed
before planting while other plants were planted with the biopot intact. Pot materials included
coir (Coir), composted manure (Cowpot), spruce wood fiber (Fertil), peat (Jiffy), slotted rice
hulls (Net), rice straw (Straw), and a bioplastic polyhydroxyalkanoate (PHA) sleeve (Soilwrap)
(Table 3.1). Pots will hereafter be referred to by their material composition.
Plant Material
Plant material was selected based on the overall water requirement and adaptability
across a wide range of climates, given that several universities were involved in the research.
Lantana camara ‘Luscious Citrus’, Cleome hassleriana ‘Senorita Rosalita’, and Impatiens sp.
‘Sunpatiens Compact’ were selected to represent low, medium, and high water requiring plants
respectively. Plants were purchased as 84-cell plugs and transplanted into the biopots in May for
both 2011 and 2012 trials. Plants were grown to marketable size in the greenhouse
(approximately six weeks) in 4-inch pots using a commercial growing mix (Fafard 2, FPM Peat
Moss Company, Ltd., Agawam, MA). The plants were irrigated as needed and fertilized at every
watering with 150 ppm N from a 20-10-20 fertilizer (Scotts, Marysville, OH). Temperature set
points were 20 °C/20 °C (D/N). The plants were pinched before being planted in the landscape to
encourage branching and uniformity.

71
Experimental Design
Plants were grouped by species and each species and its treatments (biopot type) were
arranged in a complete randomized design, with an individual potted plant serving as the
experimental unit. In 2011, the experiment was arranged in 10 rows of 8 plants each, with a total
of ten replications representing each pot type (10 plants x 8 pots). In 2012, the experiment was
arranged in 8 rows of 8 plants each, with a total of 8 replications representing each pot type (8
plants x 8 pots). An “X” was cut in the plastic/landscape fabric, and holes were dug to an
adequate size (slightly bigger than the pot), with a spacing of two feet between rows and
individual plants within the row. Plantable pots were placed in the hole, and covered lightly with
soil. Plastic pots were removed from plants before planting.
Irrigation and Fertilization in the Field
A drip irrigation system was installed so that each plant had an emitter directly above its
root zone. Plants were checked once a week and irrigation was applied for approximately 1 to 2
hours to individual experiments during the establishment phase (2-3 weeks) as needed. Plants
were fertilized with one tablespoon of 13-13-13 T100 slow release fertilizer (Nutricote, Plant
Products Co., Ontario, Canada) once after initial plant establishment.
Pot and Plant Performance Measurements
Measurements of height and width (in two directions E-W and N-S) were taken at the
start of the experiment and again after approximately 2 months of growth (August 16th, 2011 and
August 25th, 2012), followed by a final measurement on October 9 in 2011 and 2012. At the
conclusion of the experiment, plants were assigned a numerical value indicating overall quality

72
rating. A score of “1” represented a plant that was completely dead, with no green growth
apparent, while “2” represented plants that still had some green growth but were of very poor
quality. Scores of “3” were given to plants of fair quality, such as plants stunted in growth, or
with noticeable insect damage. Good quality plants with open flowers and limited insect damage
and blemishes were scored a “4”, and plants that were considered of excellent quality, with little
to no insect damage, and large size with many open flowers, were scored a “5”. Plants were then
harvested by severing the stems at the soil surface and the biomass was immediately analyzed for
fresh weight. The plants were placed in paper bags in a drying room at 46 C° and analyzed for
dry weight after two weeks.
After harvesting, pots were excavated and allowed to dry for several days. The rootball
was removed very carefully by using small carving knives to sever the roots from the pot,
following by light tugging and twisting on the plant stem until the rootball was freed. The pots
were individually photographed, then placed into bags and dried in a drying room at 46 C° for 2
weeks. Any remaining soil was lightly scraped off, and a final dry weight was taken. Post-
harvest dry weights were compared to the initial average weight of a new dried pot not subjected
to field exposure to determine percent degradation.
Statistical analysis
Prior to ANOVA, the data were tested for homogeneity of variances (Bartlett’s Test), and
for normality (Shapiro-Wilk test), with Sigma Plot (Systat Software, Inc, San Jose, CA).
Following a Two-Way Analysis of Variance, end of season pot and plant measurements were
analyzed per year using a series of One-Way Analysis of Variance (ANOVAs). If pot type

73
effects (treatments) were found, pairwise multiple comparisons were carried out using the Holm-
Sidak method for separation of means.
Results and Discussion
Mean monthly temperature and precipitation values for both experimental seasons are
shown in Figures 3.1 and 3.2. Mean temperatures for 2011 and 2012 were comparable, but
precipitation amounts varied greatly between years (Figure 3.1). Initial ANOVA analysis of the
data showed differences in some measurements between years, but no pot-by-year interaction.
Given this difference between seasons and the differences in experimental design (fewer
replications), the results were analyzed and discussed by year.
Plant Performance
In the 2011 season, no significant differences were observed in data relating to plant
growth and development. Across all pot types, lantana, cleome, and sunpatiens showed similar
final width and height, fresh and dry weight, as well as visual ratings (Tables 3.2, 3.3, 3.4).
The 2012 season showed similar results to the 2011 experiment. Again, no differences
were observed in the final width, dry weight, as well as visual ratings in any of the species tested.
However, small differences were observed in 2012 in lantana plant final height, cleome final
fresh weight, and sunpatiens fresh and dry weight and final width.
In 2012, only lantana grown in the plastic pot treatment was significantly taller
(P<0.001) than the other treatments, a fact that could be attributed to unimpeded growth after the
pot was removed at planting. However, other plant-related measurements that could be
considered better indicators of plant performance (final quality rating, fresh and dry weight) did

74
not corroborate this observation. This leads to the conclusion that the impact of removing the
container, in the case of the plastic control, is minimal when compared to planting biodegradable
containers (Table 3.5).
In 2012, cleome also showed few differences among pot types. A significant treatment
effect, (P=0.042) was observed in fresh weight, but upon further analysis, differences among
treatments could not be resolved with a separation of means test. Significant differences
(P=0.025) were observed in the final width of cleome plants in 2012, specifically between the
slotted rice hull and coir pot plants (Table 3.6). Again, the lack of corroboration with other
measurements of plant growth (fresh and dry weight, plant rating) led to the conclusion that
plantable pots perform similar to control plants with the plastic pot removed.
The 2012 sunpatiens trial showed significant differences among pot types in fresh weight
(P<0.001), dry weight (P<0.001), and final width (P=0.002). Upon further analysis, the pairwise
multiple comparisons showed that peat consistently ranked lower than all other biopots in these
three plant growth measurements (Table 3.7).
The 2011 season had considerably more precipitation compared to the 2012 season
(Figure 3.2). At times during the 2011 season, excessive rainfall caused already saturated field
plots to become flooded. This undoubtedly impacted the overall growth of plants, especially that
of the sunpatiens (Table 3.4). In the 2011 sunpatiens results, typical plant ratings ranged from 1-
3, whereas in 2012, plant ratings ranged from 4-5. Nonetheless, there were no differences
between pot types in 2011, leading us to conclude that the pot types responded similarly to the
wet conditions. A few differences in plant growth were observed in 2012, the drier year. A study
that looked at the water use and irrigation interval of geraniums grown in 4-inch biopots in a

75
greenhouse setting found that pots could be segregated into three groups of water use. Rice Hull
and bioplastic containers had water usage similar to that of plastic. An intermediate group
consisted of manure and paper containers. The group with the highest rate of water usage
included the straw, coir, wood fiber, and peat pots (Taylor et al., 2010). The same study also
found that wood fiber and peat pots had the highest rate of water loss through the container walls
(Taylor et al., 2010). In a drier season, such as 2012, water could have been wicked from the
porous containers into the surrounding soil. This could have impacted plant growth, and may
explain why sunpatiens, a high water requiring crop, grown in peat pots in 2012 had significantly
less growth than all other pot types. The higher water requirements of sunpatiens would also
explain why in 2012, more differences in growth parameters were observed at the end of the
season, than in lantana and cleome species that require less water.
The lack of consistent results pointing to a particular container as being superior in plant
performance across species, measurements, or years, and the fact that no differences were
observed in 2011, again leads us to conclude that most plantable pots perform similar to control
plants with the plastic pot removed.
Pot Performance
Pot performance was measured by the percent degradation for each pot at the conclusion
of the experiment. For all three species over both experimental seasons, there were significant
differences (P<0.001) in pot degradation.
In the 2011 lantana trial, pairwise comparisons revealed large differences between the
percent degradation of several pots (Table 3.2). The manure pots ranked higher than all other pot

76
types, with an average of 83.7 percent degradation over the season. The straw pot ranked second
highest with a percent degradation of 44.1. Peat and slotted rice hull pots had average percent
degradations of 20.1 and 23.5, respectively. However, these percentages of degradation were not
significantly different from that of the PHA bioplastic sleeve at 8.2 percent. The PHA bioplastic
was also not significantly different from the bottom ranking wood fiber and coir pots, showing
2.6 and 3.9 percent degradation, respectively.
The 2011 cleome trial showed similar results to that of the 2011 lantana trial. Again,
manure pots had the highest percent degradation at 85.4, not comparable to any other pot types,
and straw pots again ranked second highest with 45.8 percent degradation. Peat and slotted rice
hull pots ranked near the middle with 31.2 and 18.0 percent degradation, respectively. However,
slotted rice hull was not significantly different from PHA bioplastic, wood fiber, or coir, the
three lowest ranking with 7.1, 7.2, and 9.8 percent degradation, respectively (Table 3.3).
The 2011 sunpatiens trial showed results that corroborated the results of the two
aforementioned cleome and lantana trials. Manure pots once more ranked highest with 69.7
percent degradation, followed by straw pots with 43.4 percent degradation. Coir and wood fiber
pots again ranked the lowest among all pot types, with the addition of the peat pot, showing
percent degradation of 12.2, 2.3, and 11.4, respectively (Table 3.4).
Slightly lower average pot degradations were observed for some pots during the 2011
sunpatiens trial when compared to the cleome and lantana trials. For example, manure pots, the
highest ranked pot type in terms of percent degradation in all three trials, had an average percent
degradation in the mid 80’s for both the lantana and cleome trial, however only showed 69.7
percent degradation in the sunpatiens trial. As mentioned before, the 2011 season had noticeably

77
more precipitation than the 2012 season, and the sunpatiens in particular were subjected to minor
flooding. Although the plant ratings for the sunpatiens trial in 2011 showed no significant
differences between pot types, the ratings were noticeably lower than the lantana and cleome
trials during the same 2011 season. The low oxygen environment due to flooding may explain
the decreased plant growth and quality, and may have also impacted the degradation of the pots
in the 2011 sunpatiens trial.
The ranking of percent degradation of biopots was very similar in 2012 when compared
to 2011. The manure again ranked highest in percent degradation among all pots in 2012 in the
lantana trial, and showed 100 percent degradation. In a slightly different observation from the
2011 trials, the second highest rankings in pot degradation were found in PHA bioplastic, straw,
and peat pots with pot degradation of 64.1, 56.8, and 44.8 percent, respectively. The wood fiber,
slotted rice hull, and coir pots were ranked lowest, with average percent degradation of 11.9, 9.3,
and 5.9, respectively (Table 3.5).
In the 2012 cleome trial, manure pots once more ranked the highest with 95.9 percent
degradation, and straw pots again ranked the second highest with 52.8 percent degradation. Coir
and wood fiber pots showed limited degradation with 13.6 and 3.2 percent degradation (Table
3.6).
Similar to the observations made in the 2012 cleome and lantana trial, manure ranked the
highest with a percent degradation of 98.9 percent in the sunpatiens trial when compared to the
other biopots. Straw pots, showing the second highest percent degradation at 48.7, was not
significantly different from that of the wood fiber, peat, or PHA bioplastic pots with percent
degradations of 30.4, 47.0, and 32.0, respectively. This is a slightly different result from the 2011

78
sunpatiens trial when the second ranking straw pots were significantly different from all other
pots, and the wood fiber and peat pots were among the lowest ranking. However, similar to the
sunpatiens 2011 results, the coir and slotted rice hull pots showed 5.9 and 16.8 percent
degradations, the lowest of all pot types (Table 3.7).
When comparing the percent pot degradation, a pattern emerges with three tiers of pot
types, in which the top tier showed almost complete degradation over the growing season. In all
six trials, manure was significantly different from its counterparts and consistently had the
highest percentage of pot degradation. With the exclusion of the 2011 sunpatiens trial (69.7%),
which experienced poor root growth due to some flooding of the experimental field, manure pot
degradation ranged from 83 to 100%. In contrast, coir, slotted rice hull, and wood fiber pots
consistently showed some of the lowest rankings in pot degradation in all trials, ranging from 2-
30% in total pot degradation. Peat, PHA bioplastic, and straw pots comprised the middle tier,
with percent degradations ranging from 7-64%. Some overlap did occur between the middle and
bottom tier. For example, the wood fiber pot showed 30.4 percent degradation in the 2012
sunpatiens trial, but for the remaining five trials, it was among the lowest ranked in pot
degradation, with percent degradations ranging from 2.3 to 11.9.
Much in the same way that a compost pile requires ideal environmental conditions in
order to “work”, several factors also will influence the rate of pot degradation. Some of these
factors include moisture, temperature, pH, pot material, nitrogen, and microbial activity
(Nambuthiri et al., 2013). Many of these parameters were not studied as part of our experiments.
However, the high cellulose content of the manure pots likely made it decompose more quickly
than others, such as the coir pot, which has a high level of lignin. The availability of nitrogen
79
present in the manure pots may have also increased microbial activity, further enhancing the
decomposition of these pots (Evans et al., 2010).
Overall, very few differences were seen between pot types in plant growth parameters in
the landscape study. Although some differences were observed in the 2012 experiments, it
should be noted that these differences were not great enough to affect the overall plant quality
rating at the end of the season for any of the species being studied. In addition, the occasional
differences observed in plant growth do not match the pattern of percent degradation observed in
our study.
Past research has focused on the water requirements of the specific biopots, and the
potential for some pots to wick water more quickly. As previously mentioned, temperatures
between the two seasons were comparable, but precipitation varied greatly. Specifically, the
2011 season was notably “wetter” than that of the 2012 season. Some of our species grew better
in one season as compared to the other, but it is important to note that the increase or decrease in
overall growth because of the environment was consistent among all pot types. These results
suggest that when planted in the landscape, biopots are not subjected to the amount of water
wicking that occurs in a greenhouse. A similar study conducted at Longwood Gardens in Kennett
Square, PA, found that once planted in the field, plants grown in 4-inch plantable containers
performed just as well as plants grown in traditional plastic containers. This research, as well as
our own, suggests that when planted in the landscape, plantable biopots have the potential to
grow a plant of comparable size and quality to that of a traditional plastic pot (Kuehny et al.,
2011).

80
Conclusion
The results show that pot degradation could impact pot selection if clean-up of annual
beds is taken into account, especially in light of the fact that plant performance in the landscape
was similar for all pots studied. In the landscape setting, it is important that biopots are able to
degrade rapidly, so as not to impede plant growth, but also to prevent aesthetic and practical
problems for future site uses. In this case, rapid degradation as seen in the manure pots would be
beneficial. However, a fine balance must be established between a pot that is able to sufficiently
degrade in the landscape, yet withstand handling and automation during production and
transportation during marketing. While manure pots did show the greatest promise for rapid
degradation in this study, my research and others have reported that when wet, manual handling
of the manure pot was “found to be difficult” (Evans et al, 2010). Future research needs to be
conducted to establish a strength and degradability threshold, in order to better enable growers to
choose a pot both suitable for their own production needs, yet satisfy the needs of landscapers
and retail consumers.

81
Figure 3.1. Monthly mean temperature at the Morgantown, WV study site (USDA Hardiness Zone 6a) for the 2011 and 2012 growing seasons.

82
Figure 3.2. Monthly mean precipitation at the Morgantown, WV study site for the 2011 and 2012 growing seasons.
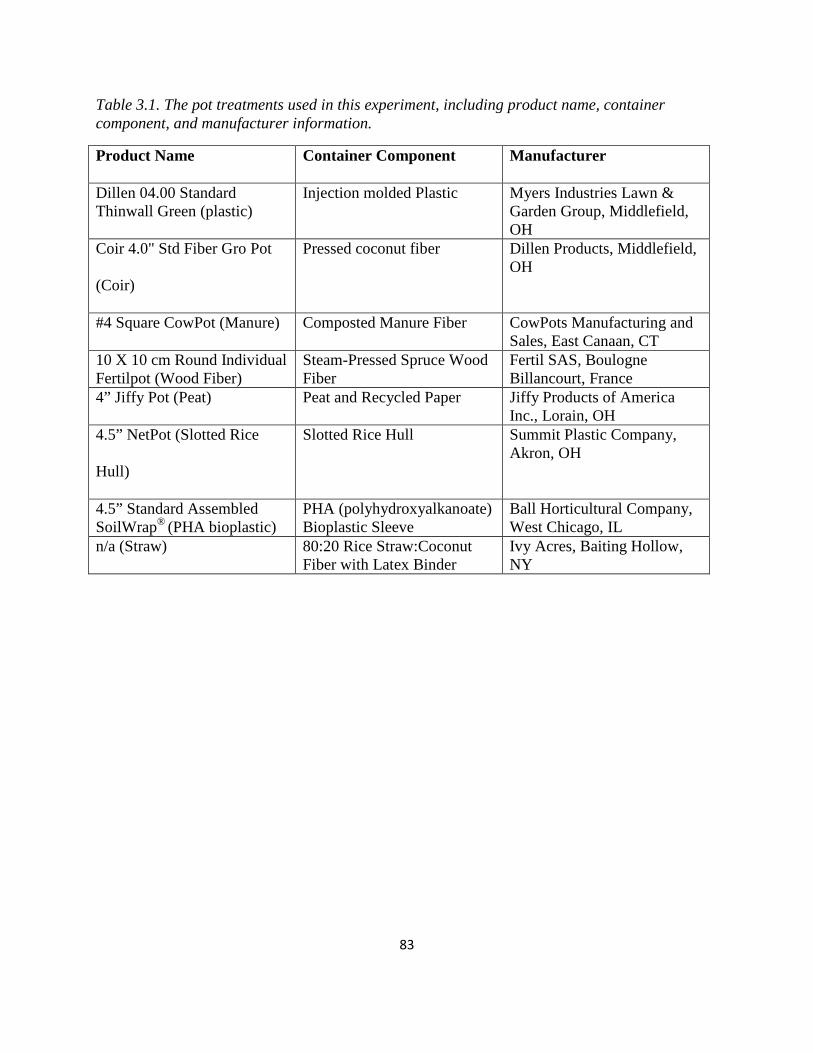
83
Table 3.1. The pot treatments used in this experiment, including product name, container component, and manufacturer information.
Product Name Container Component Manufacturer
Dillen 04.00 Standard Thinwall Green (plastic)
Injection molded Plastic Myers Industries Lawn & Garden Group, Middlefield, OH
Coir 4.0" Std Fiber Gro Pot
(Coir)
Pressed coconut fiber Dillen Products, Middlefield, OH
#4 Square CowPot (Manure) Composted Manure Fiber CowPots Manufacturing and Sales, East Canaan, CT
10 X 10 cm Round Individual Fertilpot (Wood Fiber)
Steam-Pressed Spruce Wood Fiber
Fertil SAS, Boulogne Billancourt, France
4” Jiffy Pot (Peat) Peat and Recycled Paper Jiffy Products of America Inc., Lorain, OH
4.5” NetPot (Slotted Rice
Hull)
Slotted Rice Hull Summit Plastic Company, Akron, OH
4.5” Standard Assembled SoilWrap® (PHA bioplastic)
PHA (polyhydroxyalkanoate) Bioplastic Sleeve
Ball Horticultural Company, West Chicago, IL
n/a (Straw) 80:20 Rice Straw:Coconut Fiber with Latex Binder
Ivy Acres, Baiting Hollow, NY

84
Table 3.2. Final plant growth of Lantana camara ‘Luscious Citrus’ and pot degradation of biopots after one growing season (15 weeks) in the landscape in 2011.
Coir 354.8 a 97.1 a 93.7 a 39.6 a 1.9 a 3.9 dManure 310.3 a 90.5 a 99.5 a 39.6 a 2.8 a 83.7 aWood Fiber 306.8 a 84.9 a 88.2 a 39.2 a 2.0 a 2.6 dPeat 491.8 a 133.4 a 112.6 a 40.8 a 2.8 a 20.1 cSlot. Rice 493.6 a 138.5 a 105.9 a 42.1 a 2.8 a 23.5 cPHA Biop. 415.5 a 117.8 a 93.8 a 40.1 a 2.9 a 8.2 cdStraw 376.5 a 103.4 a 99.5 a 39.0 a 2.3 a 44.1 bPlastic 419.9 a 117.0 a 100.5 a 38.8 a 2.0 a .
P value 0.134 0.161 0.277 0.939 0.357 <0.001
method was used to indicate if treatments were different from other treatments (as indicated by lower case letters).Percent degradation was determined by the dried weight of excavated pots after one growing season compared to new dried pots never subjected to field exposure. Missing data is represented by "."All measurements were taken at the end of the experiment. zMeans in a column followed by different letters are significantly different at the P ≤ 0.05 level, Holm-Sidak method. yData passed Normality Test (Shapiro Wilk) and Equal Variance Test. xData passed Equal Variance Test, but failed Normality Test (Shapiro Wilk).
Experimental units were replicated ten times. Statistical analysis using ANOVA with Holm-Sidak
Plant Ratingxz % DegradationxzContainer Type Fresh Wt. (g)yz Dry Wt. (g) yz Final Width
(cm)yz
Final Height
(cm)yz
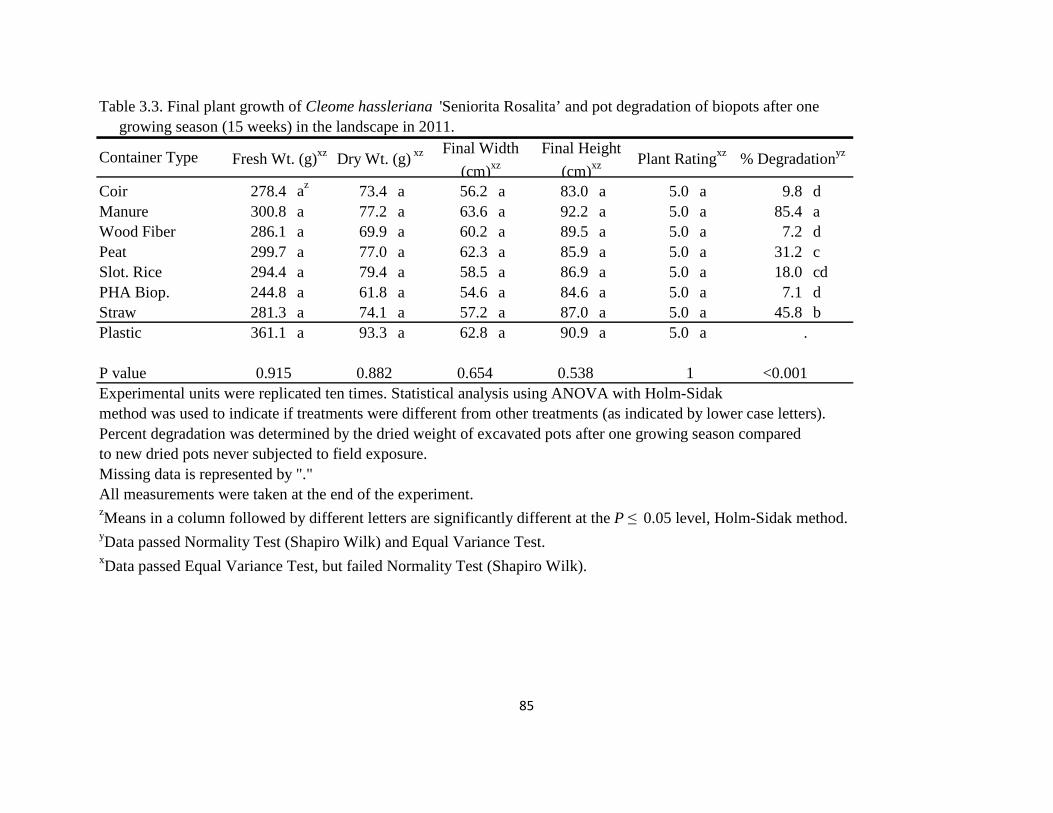
85
Table 3.3. Final plant growth of Cleome hassleriana 'Seniorita Rosalita’ and pot degradation of biopots after one growing season (15 weeks) in the landscape in 2011.
Coir 278.4 az 73.4 a 56.2 a 83.0 a 5.0 a 9.8 dManure 300.8 a 77.2 a 63.6 a 92.2 a 5.0 a 85.4 aWood Fiber 286.1 a 69.9 a 60.2 a 89.5 a 5.0 a 7.2 dPeat 299.7 a 77.0 a 62.3 a 85.9 a 5.0 a 31.2 cSlot. Rice 294.4 a 79.4 a 58.5 a 86.9 a 5.0 a 18.0 cdPHA Biop. 244.8 a 61.8 a 54.6 a 84.6 a 5.0 a 7.1 dStraw 281.3 a 74.1 a 57.2 a 87.0 a 5.0 a 45.8 bPlastic 361.1 a 93.3 a 62.8 a 90.9 a 5.0 a .
P value 0.915 0.882 0.654 0.538 1 <0.001
method was used to indicate if treatments were different from other treatments (as indicated by lower case letters).Percent degradation was determined by the dried weight of excavated pots after one growing season compared to new dried pots never subjected to field exposure. Missing data is represented by "."All measurements were taken at the end of the experiment. zMeans in a column followed by different letters are significantly different at the P ≤ 0.05 level, Holm-Sidak method. yData passed Normality Test (Shapiro Wilk) and Equal Variance Test. xData passed Equal Variance Test, but failed Normality Test (Shapiro Wilk).
Experimental units were replicated ten times. Statistical analysis using ANOVA with Holm-Sidak
Container TypeFinal Height
(cm)xz Plant Ratingxz % DegradationyzFresh Wt. (g)xz Dry Wt. (g) xz Final Width
(cm)xz

86
Table 3.4. Final plant growth of Impatiens spp. 'Sunpatiens Compact’ and pot degradation of biopots after one growing season (15 weeks) in the landscape in 2011.
Coir 233.2 az 21.3 a 29.4 a 17.9 a 2.8 a 12.2 cdManure 183.9 a 17.7 a 28.2 a 36.0 a 2.4 a 69.8 aWood Fiber 97.6 a 11.1 a 23.0 a 17.3 a 1.7 a 2.3 dPeat 174.0 a 16.8 a 27.0 a 16.5 a 2.4 a 11.4 cdSlot. Rice 416.9 a 34.2 a 38.0 a 20.3 a 0.1 a 20.0 cPHA Biop. 131.7 a 14.1 a 25.2 a 17.4 a 2.6 a 25.7 cStraw 239.0 a 24.8 a 31.8 a 21.0 a 2.5 a 43.4 bPlastic 226.6 a 20.4 a 29.7 a 18.1 a 3.2 a .
P value 0.501 0.505 0.624 0.585 0.276 <0.001
method was used to indicate if treatments were different from other treatments (as indicated by lower case letters).Percent degradation was determined by the dried weight of excavated pots after one growing season compared to new dried pots never subjected to field exposure. Missing data is represented by "."All measurements were taken at the end of the experiment. zMeans in a column followed by different letters are significantly different at the P ≤ 0.05 level, Holm-Sidak method. yData passed Normality Test (Shapiro Wilk) and Equal Variance Test. xData passed Equal Variance Test, but failed Normality Test (Shapiro Wilk).
Experimental units were replicated ten times. Statistical analysis using ANOVA with Holm-Sidak
% DegradationxzContainer Type Fresh Wt. (g)yz Dry Wt. (g) yz Final Width
(cm)yz
Final Height
(cm)yz Plant Ratingyz

87
Table 3.5. Final plant growth of Lantana camara ‘Luscious Citrus’ and pot degradation of biopots after one growing season (15 weeks) in the landscape in 2012.
Coir 225.8 az 55.2 a 73.0 a 19.0 b 5.0 a 6.0 cManure 315.7 a 74.4 a 79.8 a 16.1 b 5.0 a 100.0 aWood Fiber 286.2 a 68.3 a 80.0 a 17.9 b 5.0 a 11.9 cPeat 319.0 a 76.6 a 75.9 a 18.0 b 5.0 a 44.9 bSlot. Rice 411.5 a 87.7 a 98.4 a 19.0 b 5.0 a 9.3 cPHA Biop. 284.0 a 66.6 a 77.7 a 18.3 b 5.0 a 64.1 bStraw 235.0 a 55.0 a 70.9 a 17.9 b 5.0 a 56.8 bPlastic 310.7 a 76.6 a 80.6 a 25.4 a 5.0 a .
P value 0.083 0.072 0.092 <0.001 1 <0.001
method was used to indicate if treatments were different from other treatments (as indicated by lower case letters).Percent degradation was determined by the dried weight of excavated pots after one growing season compared to new dried pots never subjected to field exposure. Missing data is represented by "."All measurements were taken at the end of the experiment. zMeans in a column followed by different letters are significantly different at the P ≤ 0.05 level, Holm-Sidak method. yData passed Normality Test (Shapiro Wilk) and Equal Variance test. xData failed Normality Test (Shapiro-Wilk) and Equal Variance test. wData passed Normality Test (Shapiro-Wilk), but failed Equal Variance test. vData failed Normality Test (Shapiro-Wilk), but passed Equal Variance test.
Experimental units were replicated ten times. Statistical analysis using ANOVA with Holm-Sidak
Plant Ratingyz % DegradationxzContainer Type Fresh Wt. (g)vz Dry Wt. (g) yz Final Width
(cm)wz
Final Height
(cm)wz

88
Table 3.6. Final plant growth of Cleome hassleriana 'Seniorita Rosalita’ and pot degradation of biopots after one growing season (15 weeks) in the landscape in 2012.
Coir 192.7 az 50.2 a 44.7 b 74.5 a 5.0 a 13.6 dManure 301.2 a 77.9 a 50.9 ab 75.1 a 5.0 a 95.9 aWood Fiber 285.2 a 74.7 a 58.9 ab 74.1 a 5.0 a 3.2 dPeat 354.4 a 87.7 a 53.5 ab 75.4 a 5.0 a 32.6 cSlot. Rice 362.0 a 88.2 a 63.6 a 79.5 a 5.0 a 3.6 dPHA Biop. 186.1 a 49.2 a 48.8 ab 74.5 a 5.0 a 40.2 cStraw 244.7 a 60.5 a 49.6 ab 74.6 a 5.0 a 52.8 bPlastic 235.3 a 58.2 a 50.6 ab 70.5 a 5.0 a .
P value 0.042 0.055 0.025 0.445 1 <0.001
method was used to indicate if treatments were different from other treatments (as indicated by lower case letters).Percent degradation was determined by the dried weight of excavated pots after one growing season compared to new dried pots never subjected to field exposure. Missing data is represented by "."All measurements were taken at the end of the experiment. zMeans in a column followed by different letters are significantly different at the P ≤ 0.05 level, Holm-Sidak method. yData passed Normality Test (Shapiro Wilk) and Equal Variance test. xData failed Normality Test (Shapiro-Wilk) and Equal Variance test. wData passed Normality Test (Shapiro-Wilk), but failed Equal Variance test. vData failed Normality Test (Shapiro-Wilk), but passed Equal Variance test.
Experimental units were replicated ten times. Statistical analysis using ANOVA with Holm-Sidak
% DegradationxzContainer Type Fresh Wt. (g)vz Dry Wt. (g)wz Final Width
(cm)yz
Final Height
(cm)yz Plant Ratingvz

89
Table 3.7. Final plant growth of Impatiens spp. 'Sunpatiens Compact’ and pot degradation of biopots after one growing season (15 weeks) in the landscape in 2012.
Coir 1577.8az 109.5 a 73.9 a 37.1 a 5.0 a 6.0 dManure 1638.0 a 109.6 a 77.3 a 38.0 a 5.0 a 98.9 aWood Fiber 1745.2 a 122.3 a 76.7 a 38.0 a 5.0 a 30.4 bcPeat 782.2 b 59.3 b 56.1 b 33.6 a 5.0 a 47.0 bSlot. Rice 1377.5 a 104.5 a 73.4 a 33.8 a 5.0 a 16.8 cdPHA Biop. 1406.8 a 98.5 a 72.6 a 34.9 a 5.0 a 32.0 bcStraw 1374.8 a 98.3 a 72.8 a 36.8 a 5.0 a 48.7 bPlastic 1670.7 a 115.7 a 73.3 a 38.0 a 5.0 a .
P value <0.001 <0.001 0.002 0.434 1 <0.001
method was used to indicate if treatments were different from other treatments (as indicated by lower case letters).Percent degradation was determined by the dried weight of excavated pots after one growing season compared to new dried pots never subjected to field exposure. Missing data is represented by "."All measurements were taken at the end of the experiment. zMeans in a column followed by different letters are significantly different at the P ≤ 0.05 level, Holm-Sidak method. yData passed Normality Test (Shapiro Wilk) and Equal Variance test. xData failed Normality Test (Shapiro-Wilk) and Equal Variance test. wData passed Normality Test (Shapiro-Wilk), but failed Equal Variance test. vData failed Normality Test (Shapiro-Wilk), but passed Equal Variance test.
Experimental units were replicated ten times. Statistical analysis using ANOVA with Holm-Sidak
Plant Ratingvz % DegradationxzContainer TypeFresh Wt.
(g)wz Dry Wt. (g)wz Final Width
(cm)wz
Final Height
(cm)wz

90
Addendum: Evaluating the Denesting Times of Biodegradable Pots
Biodegradable plant pots are being evaluated for their potential to replace traditional
plastic pots in the horticulture industry. Past research has explored the marketability, consumer
preference, and growth of plants in biodegradable pots in a greenhouse setting (Hall, 2010;
Evans and Hensley, 2004). This research explored the incidence of algal/fungal growth during
greenhouse production, plant growth in a landscape setting, water use, as well as the pot strength
of biodegradable pots in the pre and post planting environment. These factors will likely all play
a contributing role in a grower’s willingness to use biodegradable pots for future production.
Cost will also likely play an important role in the decision making of both the producer
and the consumer. Upfront costs, such as the price of the pot, and potential markup to the
consumer, may impact sales. However, other indirect costs may play an even greater role. Little
is known about the ease of handling of the biodegradable pots in modern day greenhouse
settings. In a large production, any hindrances to efficient production could be very costly to a
grower.
Throughout our research, we noticed that the denesting time of some pots (the time it
takes to pull the pots apart), was greater for some pots than others. The work presented here
evaluated the time required to denest nine types of biodegradable pots.
Materials and Methods Pots Nine types of biopots were evaluated for their required denesting time compared to a
control plastic pot (Figure 2.1). These pots were either purchased or accepted as donations from
their respective manufacturers (Table 4.1). Pot materials ranged included coir (Coir), composted
manure fiber (Cowpot), spruce wood fiber (Fertil), peat (Jiffy), rice hulls (Slotted and Solid Rice

91
Pot), rice straw (Straw), and bioplastic pots made from polylactic acid (PLA) (TerraShell) and
polyhydroxyalkanoate (PHA) sleeve (Soilwrap). Pots will hereafter be referred to by their
material composition.
Experimental Design
Sixteen West Virginia University students were recruited for this study, and asked to
work in pairs. Each pair of students was given two trays with the capacity to hold twelve pots
each, and a stack of 24 tightly nested pots. One student was responsible for the denesting of the
pots and the placing of them into trays. This was to simulate a typical greenhouse worker. The
second student was responsible for timing the denesting process using a stopwatch, and
recording the time into a chart provided. Students were also asked to record any thoughts they
had on particular pots and the process of denesting.
Students were instructed to be precise, and to move quickly, but consistently. Once the
time was recorded for each stack of pots, students were instructed to carefully collect the pots,
and renest them back together the same way that they received them. Pots were rotated among
students until each group had denested all types of pots one time, resulting in eight replications.
Results and Discussion
Significant differences (P<0.001) were observed in the required denesting time between
pot types (Table 1.25). Particularly, the peat pot required on average more time to denest than all
other pots. Participants in the study needed 126.4 seconds to denest 24 pots, or roughly 5.3
seconds per pot. In comparison, participants needed only 21.9 seconds to denest 24 Straw pots,
or less than 1 second per pot. The plastic control pot required 28.4 seconds, resulting in 1.2
seconds per pot. Of the ten pots tested, only peat, manure, and wood fiber pots had denesting
times significantly different than that of the plastic pot.

92
The ease of pot denesting and the required time to do so most certainly will have an
impact on a grower’s decision to use biodegradable pots in a production facility. The time
required to denest peat pots was over five times greater than the time required to denest the same
amount of slotted rice hull pots.
Previous studies have focused on the compatibility of the biodegradable pots in
commercial facilities with mechanized equipment. Koeser et al., (2013), looked at the
mechanical filling of biodegradable pots using a gravity fed pot filling machine. The study found
that after calibrating the machine for the desired height and width of the pot, the proportion of
successfully filled pots was not significantly different among pot type. However, the study did
find a significant difference in pot filling speed between container types. Specifically, peat,
manure, and straw containers required substantially more time to fill than all other pots (Koeser
et al., 2013). The author noted that conveyor belt speed was most affected by the rate at which
the pots were unstacked (denested) and loaded into shuttle trays by employees. This observation
corroborated our results and indicates that denesting time may have a significant impact on the
potential adoption of biopots in the greenhouse industry.
Conclusion
Undoubtedly, the time required to denest some biodegradable containers could be very
costly to a grower in terms of not only labor required, but could also result in a production loss if
the denesting of pots causes delays. It is uncertain whether over time, employees could possibly
adapt methods and tools to expedite denesting process of certain containers. Additional research
is needed to explore the depth of this concern, and to quantify the costs of additional denesting
time requirements.
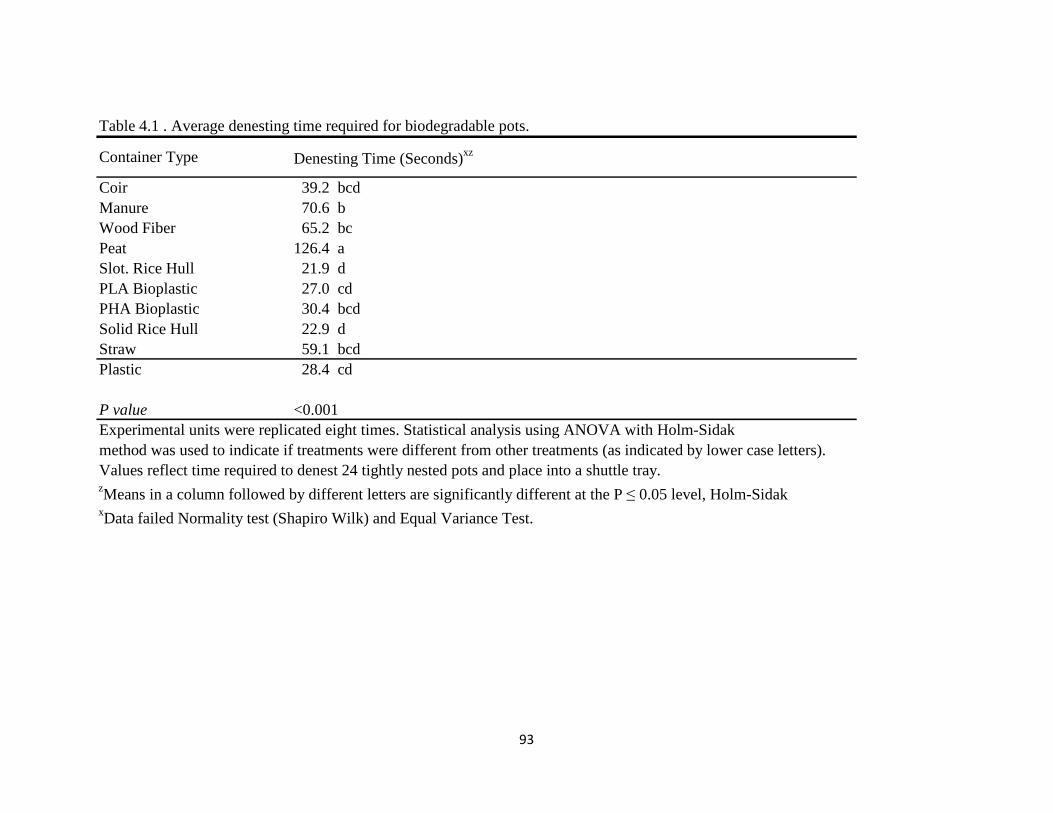
93
Table 4.1 . Average denesting time required for biodegradable pots.
Coir 39.2 bcdManure 70.6 bWood Fiber 65.2 bcPeat 126.4 aSlot. Rice Hull 21.9 dPLA Bioplastic 27.0 cdPHA Bioplastic 30.4 bcdSolid Rice Hull 22.9 dStraw 59.1 bcdPlastic 28.4 cd
P value <0.001Experimental units were replicated eight times. Statistical analysis using ANOVA with Holm-Sidak method was used to indicate if treatments were different from other treatments (as indicated by lower case letters).Values reflect time required to denest 24 tightly nested pots and place into a shuttle tray.zMeans in a column followed by different letters are significantly different at the P ≤ 0.05 level, Holm-Sidak methodxData failed Normality test (Shapiro Wilk) and Equal Variance Test.
Container Type Denesting Time (Seconds)xz

94
Bibliography:
Appleton, B. L. 1989. Evaluation of nursery container designs for minimization or prevention of root circling. J. of Environ. Hort. 7(2):59-61.
Ball, V. 1998. Ball Redbook. Ball Publishing. Batavia, Il. Pages 576-582.
Beeson, R.C.J., J.R. Harris, J. Lea-Cox, H.M. Mathers, P.J. Klinger, H.M. Gramling, T.E. Bilderback, M.A. Arnold, S. Chandler, and B. Bolusky. 2004. Strategic vision of container nursery irrigation in the next ten years. J. Environ. Horticulture 22(2):113- 115.
Beeson, R.C.J. 2006. Relationship of plant growth and actual evapotranspiration to irrigation frequency based on management allowed deficits for container nursery stock. J. Am. Soc. Hort. Sci. 131(1):140-148.
Belliveau, D. 2009. Plastics…and Beyond. 27 October 2011. http://gpnmag.com/articles/plasticsandbeyond.pdf
Bohmont, B. 1983. The New Pesticide User’s Guide. Reston, VA. Reston Publishing Co.
Carson, R. 1962. Silent Spring. Boston, MA. Houghton Mifflin Company. Pages 15-23
Casida, J.E., and G.B. Quistand. 1998. Golden age of insecticide research: Past, present, or future? Annu. Rev. of Entomol. 43:1-16.
Cavins, T., B. Whipker, and W. Fonteno. 2005. Pourthru: A method for monitoring nutrition in the greenhouse. Acta Hort. 779:289-298.
Chappell, M. 2012. Alternatives to petroleum-based containers for the nursery industry. The University of Georiga Cooperative Extension. B 1407.
CowPots. 2010. Why Are Cowpots Better? 27 October 2011. http://www.cowpots.com/cowpots- better.html
Davidson, H., R. Mecklenburg, and C. Peterson. 2000. Nursery Management. Fourth Edition. Upper Saddle River, NJ. Prentice Hall.
Delaplane, K.S. 1996. Pesticide usage in the United States: History, benefits, risks, and trends. North Carolina State University Cooperative Extension Service Factsheet http://ipm.ncsu.edu/safety/factsheets/pestuse.pdf
Dole, J. and Wilkins, H. 2005. Floriculture Principles and Species. Pearson Education, Inc. Upper Saddle River, NJ.

95
EPA. 2010. Municipal solid waste generation, recyling, and disposal in the United States: Facts and Figures for 2009. www.epa.gov/wastes
Evans, M.R., and Hensley, D.L. 2004. Plant growth in plastic, peat, and processed poultry feather fiber growing containers. Hort Science, 39(5): 1012-1014.
Evans, M. R., and D. Karcher. 2004. Properties of plastic, peat, and processed poultry feather fiber growing containers. Hort Science. 39(5): 1008-1011.
Evans, M. R., J. Kuehny, and M. Taylor. 2010. Physical properties of biocontainers for greenhouse crops production. HortTech. 20(3): 549-555.
Fereres, E., D. Goldhamer, and L. Parsons. 2003. Irrigation water management of horticultural crops. HortScience. 38(5): 1036-1042.
Fertil. 2011. What is Fertilpot? 27 October 2011. http://fertil.us/fpwhatis.htm
Garthe, J.W. and P.D. Kowal. 1993. Recyling used agricultural plastics. PennState fact sheet C-8. 21 Aug. 2008. http://www.abe.psu.edu/extension/factsheets/c/C8.pdf
Goulding, K., Jarvis, S. and A. Whitmore. 2008. Optimizing nutrient management for farm systems. Philos. T. Roy. Soc. B 363: 667–680.
Hall, C. R., R.G. Lopez, J.H. Dennis, C. Yue, B.L. Campbell, and B.K. Behe. 2010. The appeal of biodegradable packaging to floral consumers. HortScience. 45(4): 583-591.
Hanks, M. 1995. A Grower’s Guide to Flowering Plants and Shrubs. Random House Value Publishing, Inc. New York, NY. Page 69.
Higginbotham, J.A. 1990. Four centuries of planting and progress: A history of the US nursery industry. Am. Nurseryman. 171(12). Special Historical Issue.
Ignacimuthu, S., and S. Jayaraj. 2005. Sustainable Insect Pest Management. New Delhi. Narosa Publishing House. Pp. 19-25
Janick, J. 2007. The origins of horticultural technology and science. Acta Horticulture, 759: 41- 50.
Koeser, A. 2013. Dissertation: Performance and environmental impacts of biocontainers in horticultural crop production systems. http://hdl.handle.net/2142/44332
Koeser, A., G. Kling, C. Miller, and D. Warnock. 2013a. Compatibility of biocontainers in commercial greenhouse crop production. HortTechnology. 23(2): 149-156.
96
Koeser, A., S. Lovell, M. Evans, and J. Stewart. 2013b. Biocontainer water use in short-term greenhouse crop production. HortTechnology. 23(2):215-219.
Kuehny, J., M. Taylor, and M. Evans. 2011. Greenhouse and landscape performance of bedding plants in biocontainers. HortTechnology. 21(2):155-161.
McNeill, J.R., and V.V. Winiwarter. 2004. Breaking the sod: Humankind, history, and soil. Science. 304(5677):1627-1629.
McWilliams, J.E. 2008. “The horizon opened up very greatly”: Leland O. Howard and the transition to chemical insecticides in the United States, 1894-1927. Agric. Hist. 82(4):468-495.
Mikkelsen, R. and T. Bruulsema. 2005. Fertilizer use for horticultural crops in the U.S. during the 20th century. HortTech. 15(1):24-30.
Mohan, A. 2010. Plantable nursery pot biodegrades in soil. 27 October 2011. www.greenerpackage.com.
Mullen, J. D., J. Alston, D. Sumner, M. Kreith, and N. Kuminoff. 2005. The payoff to public investments in pest-management R and D: General issues and a case study emphasizing integrated pest management in California. Rev. Agr. Econ. 27(4):558-573.
Nambuthiri, S., R. Schnelle, A. Fulcher, R. Geneve, A. Koeser, S. Verlinden, and R. Conneway. 2013. Alternative containers for a sustainable greenhouse and nursery crop production. UK Cooperative Extension Service. HortFact-6000.
National Research Council.Committee on the Future Role of Pesticides in US Agriculture. 2000. The future role of pesticides in US agriculture. Washington, DC. National Academy Press. Pages 17-27
Nelson, P. 2002. Greenhouse Operation and Management. 6th Edition. Prentice Hall. Upper Saddle River, NJ.
NOAA National Climatic Data Center. 2012. State of the climate: National overview for July 2012. Published online August 2012, retrieved on October 22, 2013. http://www.ncdc.noaa.gov/sotc/national/2012/7
Poincelot, R. P. 2004. Sustainable Horticulture. Upper Saddle River, NJ. Prentice Hall. Pp. 15, 212, 362,476.
Simmons, J.S. 1945. How magic is DDT? Saturday Evening Post. Vol. 217 Issue 28, p18-86.
Spiertz, J.H.J. 2008. Nitrogen, sustainable agriculture and food security. Agron. for sustain. dev. 30(1):43-55.

97
Stern V.M., R.F. Smith, R. van den Bosch, and K.S. Hagen. 1959. The integrated control concept. Hilgardia. 29:81–101. Taylor, M., M. Evans, and J. Kuehny. 2010. The beef on biocontainers: Strength, water use, biodegradability and greenhouse performance. OFA Bulletin. Number 923.
Tejano, E.A. 1985. State of the art of coconut coir dust and husk utilization. The Philippine Journal of Coconut Studies. 1:1-7.
Van de Wetering, P. 2008. Straw pots. Greenhouse Product News. Volume 18. Number 4. www. Gpnmag.com
Veith T.L. 2002. Agricultural BMP placement for cost-effective pollution control at the watershed level. PhD Dissertation, Virginia Polytechnic Institute and State University, Blacksburg, VA.
Verlinden, Sven. November 2011. Personal Communication.
Warsaw, A.L., J.A. Andresen, B.M. Cregg, and R.T. Fernandez. 2009. Water conservation, growth, and water use efficiency of container-grown woody ornamentals irrigated based on daily water use. HortScience. 44(5):1308-1318
Yue, C., C. Hall, B. Behe, B. Campbell, J. Dennis and R. Lopez. 2010. Are consumers willing to pay more for biodegradable containers than for plastic ones? Evidence from hypothetical conjoint analysis and nonhypothetical experimental auctions. J. Agr. Ap. Econ. 42(4):757-772.