evaluating ecg capturing using sound-card of...
TRANSCRIPT

International Journal of Instrumentation and Control Systems (IJICS) Vol.4, No.1, January 2014
DOI : 10.5121/ijics.2014.4102 11
Evaluating ECG Capturing Using Sound-Card ofPC/Laptop
B. N. Patel1, D. N. Shah2
1,2Department of instrumentation and control, Sarvajanik College of Engineering andTechnology Surat, Gujarat, INDIA
Abstract
The purpose of the Evaluating ECG capturing using sound-card of PC/Laptop is provided portable and lowcost ECG monitoring system using laptop and mobile phones. There is no need to interface micro-controller or any other device to transmit ECG data. This research is based on hardware design,implementation, signal capturing and Evaluation of an ECG processing and analyzing system which attendthe physicians in heart disease diagnosis. Some important modification is given in design part to avoid alldefinitive ECG instrument problems faced in previous designs. Moreover, attenuate power frequency noiseand noise that produces from patient's body have required additional developments. The hardware designhas basically three units: transduction and conditioning Unit, interfacing unit and data processing unit.The most focusing factor is the ECG signal/data transmits in laptop/PC via microphone pin. The livesimulation is possible using SOUNDSCOPE software in PC/Laptop. The software program that is writtenin MATLAB and LAB-View performs data acquisition (record, stored, filtration) and several tasks such asQRS detection, calculate heart rate.
Keywords
ECG, Instrumentation Amplifier (AD620), Sound-scope, MATLEB, LAB-View and ECG monitoring system.
1. Introduction
What is an ECG?
The Heart is a muscle formed that allows it to act as a pump for blood circulation in a body. Theheart pumps blood when the muscle cells making up the heart wall contract, generating theiraction potential. This potential creates electrical currents that spread from the heart throughout abody.The electrical potential between various locations shows differences due to spreadingelectrical currents in the body. The electrical potential can be detected and recorded by placementof electrodes on skin. The cardiac electrical potential waveform generated by these bio-potentialsis called the Electrocardiogram (ECG).
Electro-conduction system of Heart
The conduction system of the heart is shown in figure 1. It consists of the Senatorial (SA) node,bundle of his, Atrioventricular (AV) node, the bundle branches, and Purkinje fibres. The SA nodeserves as a pacemaker for the heart and it provides the trigger signal. It is a small bundle of cellslocated on the rear wall of the right atrium, just below the point where the superior vena cava is

International Journal of Instrumentation and Control Systems (IJICS) Vol.4, No.1, January 2014
12
attached. The SA node fires electrical impulses through the bioelectric mechanism. It is capableof self excitation but is under control of the CNS so that the heart rate can be adjustedautomatically to meet varying requirements.
Fig 1: Electro-Conduction System of Heart
When the SA node discharges a pulse, then electrical current spreads across the atria, causingthem to contract. Blood in the atria is forced by the contraction through the valves to theventricles. The velocity of propagation for the SA node action potential is about 30cm/s in theatrial tissue. There is a band of specialized tissue between the SA node and AV node, however inwhich the velocity of propagation is faster than it is in atrial tissue. This internal conductionpathway carries the signal to the ventricals. The muscle cells of ventricles are actually excited bypurkinje fibres. The action potential travels along these fibres at the much faster rate on the orderof 2 to 4 m/s. The fibres are arranged in two bundles, one branch on left and another is on right.
Fig 2: Typical ECG Waveform
Conduction in the fibres is very rapid. The action potentials generated in SA node stimulates themuscle fibres of the myocardium, causing them to contract. When the muscle in the contraction, itis become shorter, and the volume of the ventricular chamber is less, so blood is constricted out.The shortening or tensing of so many muscles at one time creates a mass electrical signal that canbe detected by electrodes place on the surface of the patient’s chest. This electrical dispatch can
International Journal of Instrumentation and Control Systems (IJICS) Vol.4, No.1, January 2014
13
be plotted as a function of time and the resultant waveform is known as Electrocardiogram(ECG).
Different Methods of ECG Capturing
There are various Methods available of ECG capturing and evaluating.
1) ECG Machine2) Portable ECG Monitor3) ECG Readout Device4) PC based ECG system5) Using sound card of PC
2. Circuit Design
Introductory Description of Circuit Design
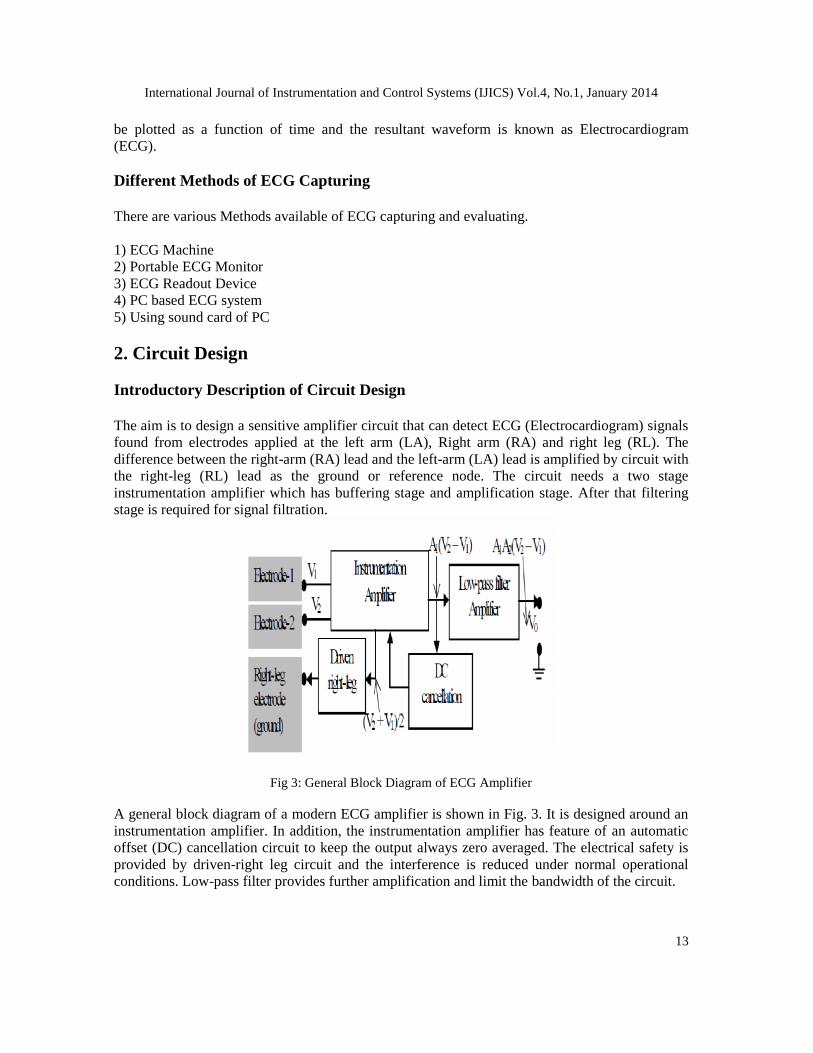
The aim is to design a sensitive amplifier circuit that can detect ECG (Electrocardiogram) signalsfound from electrodes applied at the left arm (LA), Right arm (RA) and right leg (RL). Thedifference between the right-arm (RA) lead and the left-arm (LA) lead is amplified by circuit withthe right-leg (RL) lead as the ground or reference node. The circuit needs a two stageinstrumentation amplifier which has buffering stage and amplification stage. After that filteringstage is required for signal filtration.
Fig 3: General Block Diagram of ECG Amplifier
A general block diagram of a modern ECG amplifier is shown in Fig. 3. It is designed around aninstrumentation amplifier. In addition, the instrumentation amplifier has feature of an automaticoffset (DC) cancellation circuit to keep the output always zero averaged. The electrical safety isprovided by driven-right leg circuit and the interference is reduced under normal operationalconditions. Low-pass filter provides further amplification and limit the bandwidth of the circuit.

International Journal of Instrumentation and Control Systems (IJICS) Vol.4, No.1, January 2014
14
Electrode placement
ECG is recording most commonly between the Right Arm (RA) and the Left Arm (LA).Sometimes another two combinations using the Left Leg (LL) are also used clinically (RA−LLand LA−LL). For common ground of the Instrumentation amplifier, there are one anotherelectrode connects to the patient. This is attached to the right leg.
Fig 4: Typical Electrode Placement
The movement of electrode with respect to the electrolyte is mechanically disturbed. So, thedistribution of charge at the interface and results in a momentaneous change of the half−cellpotential until equilibrium can be restored. If one electrode is moved while the other remainsstable, a potential difference appears between the two electrodes during this movement. Due tothis kind of movement the potential is referred to as movementartifactand this can be a grievouscause of interference in the measurement of ECG.
Theoretical Design
To fulfil the requirements of our ECG amplifier, we need to design a cascade circuit, which is acombination of a Instrumentation Amplifier, a Low Pass Filter, a High Pass Filter and a gainstage. For reducing noises, the order of cascade stages is considered. For example, in thefollowing cascade Figure, the output noise is
International Journal of Instrumentation and Control Systems (IJICS) Vol.4, No.1, January 2014
15
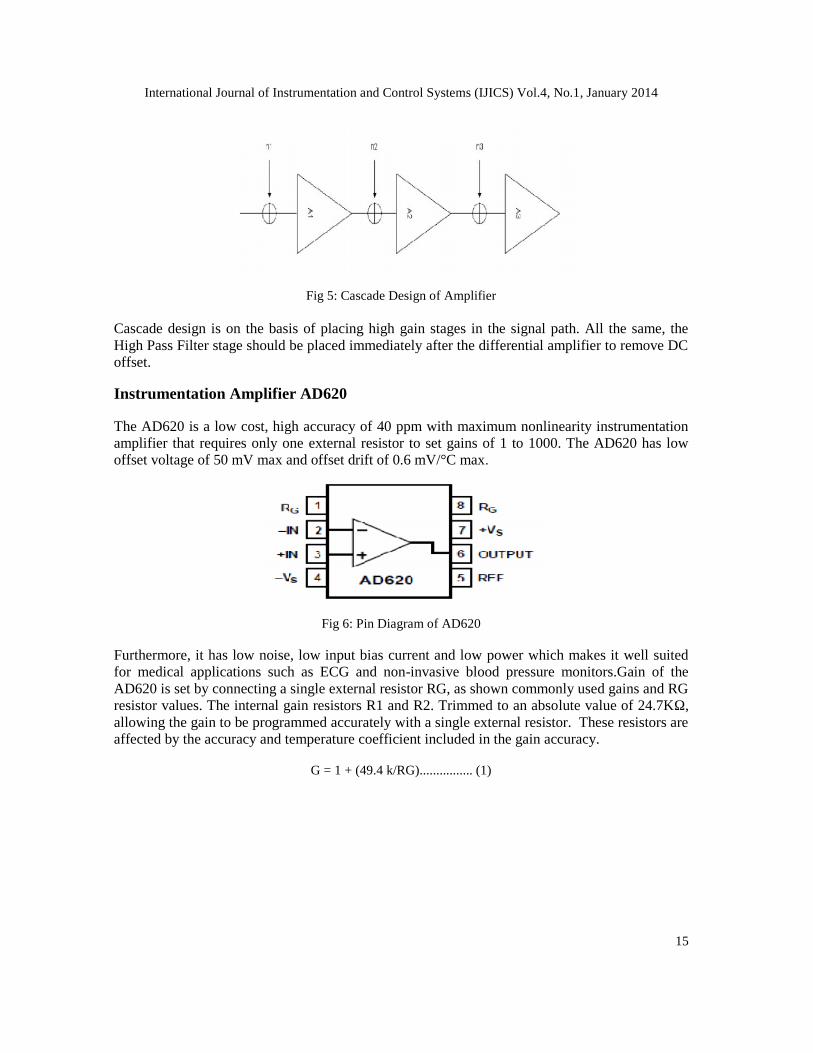
Fig 5: Cascade Design of Amplifier
Cascade design is on the basis of placing high gain stages in the signal path. All the same, theHigh Pass Filter stage should be placed immediately after the differential amplifier to remove DCoffset.
Instrumentation Amplifier AD620
The AD620 is a low cost, high accuracy of 40 ppm with maximum nonlinearity instrumentationamplifier that requires only one external resistor to set gains of 1 to 1000. The AD620 has lowoffset voltage of 50 mV max and offset drift of 0.6 mV/°C max.
Fig 6: Pin Diagram of AD620
Furthermore, it has low noise, low input bias current and low power which makes it well suitedfor medical applications such as ECG and non-invasive blood pressure monitors.Gain of theAD620 is set by connecting a single external resistor RG, as shown commonly used gains and RGresistor values. The internal gain resistors R1 and R2. Trimmed to an absolute value of 24.7KΩ,allowing the gain to be programmed accurately with a single external resistor. These resistors areaffected by the accuracy and temperature coefficient included in the gain accuracy.
G = 1 + (49.4 k/RG)................ (1)

International Journal of Instrumentation and Control Systems (IJICS) Vol.4, No.1, January 2014
16
Table 1: Values of Rg for settling Gain of AD620
The stability and temperature drift of the external gain setting resistor, RG, also affects gain.RG’s contribution to gain accuracy and drift can be directly inferred from the gain equation.There are many important features of AD620 such as gain set with one resistor, wide range powersupply, 100dB min CMRR (common-mode rejection ratio), low noise and excellent DCperformance. AD620 is used in many applications like portable battery operated system,physiological amplifier: EEG, ECG, EMG, multi channel data acquisition, ECG and medicalinstrumentation etc.
Designed Circuit
Fig 7: ECG Circuit with Right Leg Driven Circuit
Frequency Adjustment
The average heart rate of a person is around 1.1Hz and the signal level is very weak thus to avoidinterference from other signals, a band pass filter is needed. The desired frequencies (between0.05 Hz and 150Hz) can be achieved via operational amplifier, capacitors and Resistors where thevalues are found for the high pass and low pass respectively.

International Journal of Instrumentation and Control Systems (IJICS) Vol.4, No.1, January 2014
17
Low pass 0.05 =High Pass 150 =For High Pass filter R = 3.18 MΩ, C= 1µF
For Low Pass filter R = 106 KΩ, C= 0.01µF
Fig 8: Filter Circuit for ECG
Thus the filter supplies a gain of 5. The Resistor 3.18MΩ connected to non-inverting input is forkeeping the balance and symmetry.
Right Leg Driven Circuit
Fig 9: Right Leg Driven Circuit
The aim of right leg driven circuit is reducing the effect of noise. The common mode signal takenfrom the both ends of the Rg (gain resistance of AD620) is given back to body as a reference.

International Journal of Instrumentation and Control Systems (IJICS) Vol.4, No.1, January 2014
18
G=ΩΩΩ
The values of the resistances are 25KΩ for the input resistance. Also a low pass filter with 150Hzcut-off frequency is existent with R = 10KΩ and c =106nf. The gain of the circuitry is defined by1MΩ resistance.
Output DC level Shifting
The last stage of the circuit is both designed to provide the necessary gain and the necessaryvoltage shifting to make the signal appear on the limits is 0 to 5 volts. This stage is expected tohave a gain of 25. Since the amount of voltage shifting is unknown the voltage shifting is appliedafter the first ECG signal is observed. Initially an inverting amplifier with R1=5KΩ andR2=125KΩ used.
Realization of The circuit
The circuit is first realized on breadboard. Some of the values have changed due to theavailability of the resistors and capacitors. For the operational amplifier op07 is used in all stages.While the circuitry is being built each stage is checked by a given signal which would not causeclipping.
Changes with Realization
1) AD620
Installing Rg as 8.4KΩ gave unwanted gain so the value had to be increased to decrease the gain.Inserting a 27KΩ resulted with a gain of 10, even though it was unexpected, in order to not usinga larger resistance, the 27KΩ is accepted and the extra gain is corrected by changing the laststage.
2) Band-pass stage
For the high-pass filter a resistance of 3.18MΩ is used. The resistance is in fact labelled as 3MΩ,however its exact value was 3.18MΩ. For the low-pass filter the 106 is realize as an 112KΩ andthe 21.2KΩ is realize as a 21.8KΩ (series combination of 3.8KΩ and 18KΩ)
3) Output DC Level Shifting
The amount of shifting is done by supplying is done by supplying the inverting input andsupplying the shifting dc voltage from the non-inverting input, thus the amount of dc input can befound by dividing the desired DC voltage level by non-inverting gain of the stage.

International Journal of Instrumentation and Control Systems (IJICS) Vol.4, No.1, January 2014
19
Fig 10: Gain Stage and DC level Shifter
However due to non-ideal of op07 the non-inverting input lowered the gain. With an interactivemethod the correct values are found. The input dc voltage is supplied from Vdc by a voltagedivider.
Modification
To prevent the signal being lost in the 50Hz interface, a 50Hz notch filter is designed andimplemented.
Fig 11: Schematic of Notch Filter
Complete ECG Circuit
Fig 12: Complete ECG Circuit

International Journal of Instrumentation and Control Systems (IJICS) Vol.4, No.1, January 2014
20
Soundcard of Laptop
A sound card also known as an audio card which has facilitates the input and output of audiosignals to and from a computer under control of computer programs. Typical uses of sound cardsinclude providing the audio component for multimedia applications such as music composition,editing video or audio, presentation, education, and entertainment (games). Many computers havein built sound capabilities, while others require further soundcard expansion cards to provide foraudio potentiality.
Fig 13: Soundcard Hardware
Sound card has usually functioned of analogue-to-digital converter (ADC), which convertsrecorded or generated analogue data into a digital format. The output signal is connected to anamplifier, headphones, or external device using standard interconnects. For higher data rates andmultiple functions, there is more advanced card commonly include more than one chip.
Microphone Pin Configuration
The diagram below illustrates how to configure a standard stereo microphone plug. The tip of thepin is the left channel, the ring type metal portion is the right channel, and the rest of the pin is theground. There is one plastic ring between two channels which separates the channel and ground.Use a multimeter or continuity tester to determine the channel identifications of the solder logs.
Fig 14: Microphone Pin
1 – Signal (audio) out left channel/Channel-12 – Signal (audio) out right channel/Channel-23 – Ground – common for microphone and audio out.
Heart Pulse Detector Circuit
Photoplethysmography (PPG) is a non-invasive method of measuring the variation in bloodvolume in tissues using a light source and a detector which is the principle of heart pulse detectorcircuit.

International Journal of Instrumentation and Control Systems (IJICS) Vol.4, No.1, January 2014
21
Fig 15: Heart Pulse Sensor
Since the change in blood volume is synchronous to the heart beat, this technique can be used tocalculate the heart rate. For reflectance PPG, the light source and the light detector are bothplaced on the same side of a body part. The light is emitted into the tissue and the reflected lightis measured by the detector. PPG can be applied to any parts of human body. In either case,the detected light reflected from or transmitted through the body part will fluctuate according topulse rate blood flow caused by the beating of the heart.
3. Software Description
Sound Card Scope
The PC based Soundcard Oscilloscope obtains its data with 96 kHz and 16 Bit resolution from thesoundcard. The data source can be selected in the Windows mixer such as Microphone, Line-Inor Wave.
Fig 16: Sound Scope Display
The frequency range depends on which kind of a soundcard already in laptop/pc, but 20-20000Hzshould be possible with all modern cards. The oscilloscope contains in further a signal generatorfor 2 channels for Sine, Square, Triangular and Saw tooth wave forms in the frequency rangefrom 0 to 20 kHz. These signals are available at the speaker output of the sound card.
International Journal of Instrumentation and Control Systems (IJICS) Vol.4, No.1, January 2014
22
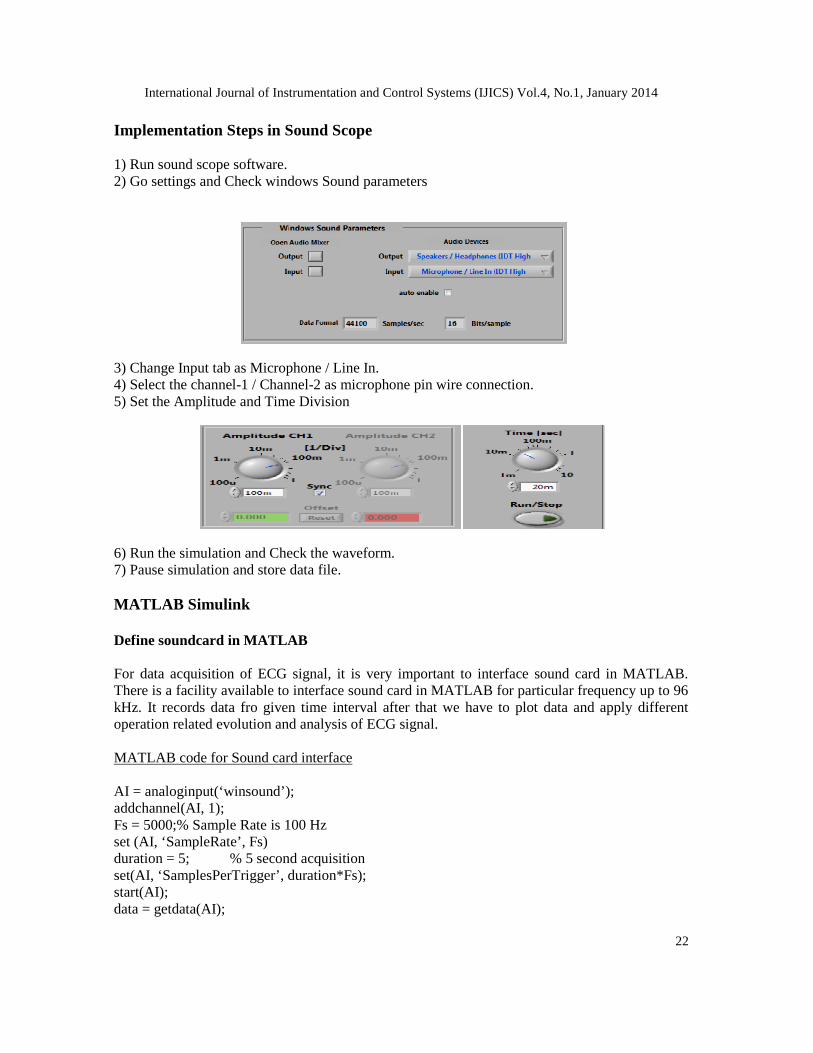
Implementation Steps in Sound Scope
1) Run sound scope software.2) Go settings and Check windows Sound parameters
3) Change Input tab as Microphone / Line In.4) Select the channel-1 / Channel-2 as microphone pin wire connection.5) Set the Amplitude and Time Division
6) Run the simulation and Check the waveform.7) Pause simulation and store data file.
MATLAB Simulink
Define soundcard in MATLAB
For data acquisition of ECG signal, it is very important to interface sound card in MATLAB.There is a facility available to interface sound card in MATLAB for particular frequency up to 96kHz. It records data fro given time interval after that we have to plot data and apply differentoperation related evolution and analysis of ECG signal.
MATLAB code for Sound card interface
AI = analoginput(‘winsound’);addchannel(AI, 1);Fs = 5000;% Sample Rate is 100 Hzset (AI, ‘SampleRate’, Fs)duration = 5; % 5 second acquisitionset(AI, ‘SamplesPerTrigger’, duration*Fs);start(AI);data = getdata(AI);
International Journal of Instrumentation and Control Systems (IJICS) Vol.4, No.1, January 2014
23
delete(AI)plot(data,’DisplayName’,’data’,’YdataSource’,’data’);figure(gcf)
Filter of signal in MATLAB
Some common ECG Filtering tasks are performed which are Baseline wander filter and Powerline interference filter. When filtering any biomedical signal care should be taken not to falsifythe desired information in any condition. A major intrest is how the QRS complex affects theoutput of the filter. Sometimes the filter often carry out a large unwanted impulse and possibledistortion caused by the filter should be cautiously quantified.
Apply Butterworth Filter /Base line Filter
Baseline filter is included extragenoeous low-frequency for high-bandwidth components and itcan be caused by movements of electordes which effects electrode impedance, Respiration andBody movements. Which can cause troubles to analysis mostly when analise the low-frequencyST-T segment.
MATLAB Code :
sig = dataplot(sig)[A,B] = BUTTER(2,0.002)subplot(211),plot(data);subplot(212),plot(filter(A,B,data));
Apply Notch filter / Power Line Filter
Electromagnetic fields from power lines can cause 50/60 Hz sinusoidal disturbance, possiblycompanioned by some of its constant frequency. Such noise can cause problems interpreting low-amplitude waveforms and unauthentic waveforms can be introduced. Naturally care should betaken to keep power lines as far as possible and shield and ground them but this is not alwayspossible everywhere.
MATLAB Code :
input=dataplot(input)fs=750;N=length(input);t = ((0:length(input)-1)./fs); %Time Intervalt=t’;figure(1)plot(t, input)xlabel(‘Sampling frequency’)ylabel(‘Volts’)

International Journal of Instrumentation and Control Systems (IJICS) Vol.4, No.1, January 2014
24
Ys = fft(input)/N;i_space=linspace(0,.5,N/2); %adjusting the frequency range at particular intervalfrq = fs*i_space;Ys = Ys(1:ceil(N)/2);plot(frq,2*abs(Ys))xlabel(‘Frequency in Hz’)ylabel(‘|Y(f)|’)
%intialization
F_0=0.33;Delta_F=0.1;[b,a] = iirnotch (F_0,Delta_F);%creates coefficient vectors a and bfvtool(b,a);refined=filter(b,a,input); %filter signal[H Hf] = freqz(b,a,N); %returns transfer functionamp=abs(H);figure(2)plot(Hf*fs,amp)xlabel(‘Frequency in Hz’)ylabel(‘|H(f)|’)
%Attempting different values of delta F
subplot(3,1,1)plot(t,refined)title(‘Refined ECG Signal when delta F=1’)xlabel(‘Sampling Frequency’)ylabel(‘volt’)F_0=0.6;Delta_F=0.001;[b,a] = iirnotch (F_0,Delta_F);%creates coefficient vectors a and brefined=filter(b,a,input); %filter signalsubplot(3,1,2)plot(t,refined)title(‘Refined ECG Signal when delta F=5’)xlabel(‘Sampling Frequency’)ylabel(‘volt’)
F_0=0.9;Delta_F=0.0001;[b,a] = iirnotch (F_0,Delta_F,fs);%creates coefficient vectors a and brefined=filter(b,a,input); %filter signalsubplot(3,1,3)plot(t,refined)title(‘Refined ECG Signal when delta F=10’)xlabel(‘Sampling Frequency’)ylabel(‘volt’)

International Journal of Instrumentation and Control Systems (IJICS) Vol.4, No.1, January 2014
25
%interferenceinterference=input-refined;plot(t, interference)title(‘Interference’)xlabel(‘Sampling Frequency’)ylabel(‘volt’)
Heart Beat Count
The data signal hold and sample with particular sample frequency for counting the heart pulses.Then count the dominant peak of signal which corresponds to heart pulses.Peaks are defined to besamples greater than their two nearest neighbours and greater than 1 and divides beat counted bysignal.
MATLAB Code:%progaram to determine the BPM of ECG signal
sig = data;plot(sig)xlabel(‘Samples’);ylabel(‘Electrical Activity’);title(‘Ecg Signal sampled at 100Hz’);hold onplot(sig,’ro’)
%count the dominant peaks in the signal(these 25orrespond to heart beats)% - peaks are defined to be samples greater than their two nearest neighbours and greater than 1
beat_count = 1;for k = 2 : length(sig) – 1if(sig(k) > sig(k-1) & sig(k) > sig(k+1) & sig(k) > 1) %k%disp(‘Prominent Peak found’)beat_count = beat_count + 1endend
%Devide the beats counted by the signal duration (in minutes)beat_count = 1;fs = 4000;N = length(sig);duration_in_seconds = N*0.1/fs;duration_in_minutes = duration_in_seconds/60;BPM = beat_count/duration_in_minutes
sig = sig(1:500);hold offplot(sig)

International Journal of Instrumentation and Control Systems (IJICS) Vol.4, No.1, January 2014
26
LAB-View
This technical description will introduce the concepts required to build a basic system with LAB-View. The most important building blocks for any LAB-view application, including the frontpanel, block diagram, palettes, controls, and indicators. Graphical Programming Basics see howto connect functions and work with a variety of data types when constructing applications.Common Tools view a collection of important tools and common user functions that all usersshould be familiar with LAB-View.
Lab View Design To get ECG data
The basic block diagram of the ECG signal condition is shown in fig 17. The filtrations proceduredescribes below and detail of specification of software components.
Fig 17: Block Diagram of ECG in LAB-View
Acquire Sound Block
[1] Error in describes error conditions that occur before this function runs and this input providesstandard error in functionality.[2]Path out identifies the ECG data stored in wave file.
[3] Total number of samples have total number of channels selection and the number of bits persample in the wave file.[4]Format shows the sample rate, the number of channels and the number of bits per sample inthe wave file.[5]Sample rate (S/s) selects sampling rate for the wave file. Common rates are 44,100 S/s,22,050S/s and 11.025 S/s.[6]Number of channels specifies which channel of soundcard in the wave file. This input canaccept as many channels as sound card supports. For most sound cards 1 is Mono and 2 is Stereo.[7]Bits per sample are the quality of each sample in bits. Common resolutions are 16 bits and 8bits but 16 bits are more accurate than 8 bits.

International Journal of Instrumentation and Control Systems (IJICS) Vol.4, No.1, January 2014
27
[8]Error out contains error information. This output provides standard error out functionality.
Biosignal Filtering (Waveform Classical / Array Filter) Block
[1]Type specifies the classical filter to apply to input biosignal 0 Low-pass,1 High-pass and 2Band-pass
[2]Freq specs specify the frequency specifications for the classical filter.[3]Fpass 1 specifies the first pass band edge frequency in hertz. The default is 0.2.[4]Fpass 2 specifies the second pass band edge frequency in hertz. This VI ignores Fpass 2 forlow pass and high pass filters. The default is 0.[5]Fstop 1 specifies the second stop band edge frequency in hertz. The default is 0.3.[6]Fstop 2 specifies the second stop band edge frequency in hertz. This VI ignores for low passand high pass filters. The default is 0.1.[7]Ripple specs specifies the ripple specifications for the classical filter.[8]Pass band specifies the ripple level in the pass band. The default is 0.1.[9]Stop band specifies the ripple level in the stop band. The default is 60.[10]Error in describes error conditions that occur before this function runs.[11]Out returns the filter that this VI applies to the input biosignal.[12]Error out contains error information. This output provides standard error out functionality.
ECG Feature Extractor (Waveform QRS) Block
[1]QRS detector parameter specifies the parameters that this VI uses to detect QRS waves.[2]Rough highest heart rate determines the approximate highest heart rate of the ECG signal inbeats per minute (bpm) and the default value is 60 bpm.[3]Peak detection initial threshold determines the initial threshold for QRS complex detection.
[4]Threshold factor defines the factor that VI uses to determine the threshold for separatingnoise peaks and QRS waves. Threshold factor must be greater than 0 and less than 1.[5]Error in describes error conditions that occur before this function runs and this input providesstandard error in functionality[6]QRS time returns the occurring times of detected QRS complexes. This QRS time by usingthe input ECG signal, which might be a preprocessed signal.[7]QRS peak returns the amplitudes of the detected QRS complexes. QRS peak through the inputECG signal, which might be preprocessed..[8]Error out contains error information. This output provides standard error out functionality

International Journal of Instrumentation and Control Systems (IJICS) Vol.4, No.1, January 2014
28
Bio-Medical Tool connectivity
The Biomedical Workbench in LAB-View Biomedical Toolkit provides applications for biosignal and biomedical image analysis. These applications enable to apply biomedical solutionsusing Lab VIEW. These applications to log and play biosignals, simulate and generate biosignals,analyzebiosignals, and view biomedical images. The application can acquire real world and real-time biomedical data by using biomedical sensors and National Instruments hardware. Theapplications in Biomedical Workbench is extract features from electrocardiogram (ECG) signals,to analyze heart rate variability (HRV), and to measure blood pressure.
ECG Feature Extractor
ECG feature Extractor imports ECG signals from different file types. See Biosignal Viewer forfile formats supported. It imports ECG signals from a data acquisition (DAQ) device andintegrates robust
Fig 18: ECG feature Extractor
extraction algorithms to detect ECG features, such as the QRS Complex, P wave, and T wave. Ittransfers RR interval data to Heart Rate Variability Analysis application and exports ECGfeatures reports for printing.
Heart Rate Variability (HRV) Analyzer
HRV analyzer synchronizes RR intervals from the ECG Feature Extractor application andimports RR intervals from an electrocardiogram (ECG) file that the ECG Feature Extractorapplication generates or from a text file that contains RR intervals.
International Journal of Instrumentation and Control Systems (IJICS) Vol.4, No.1, January 2014
29
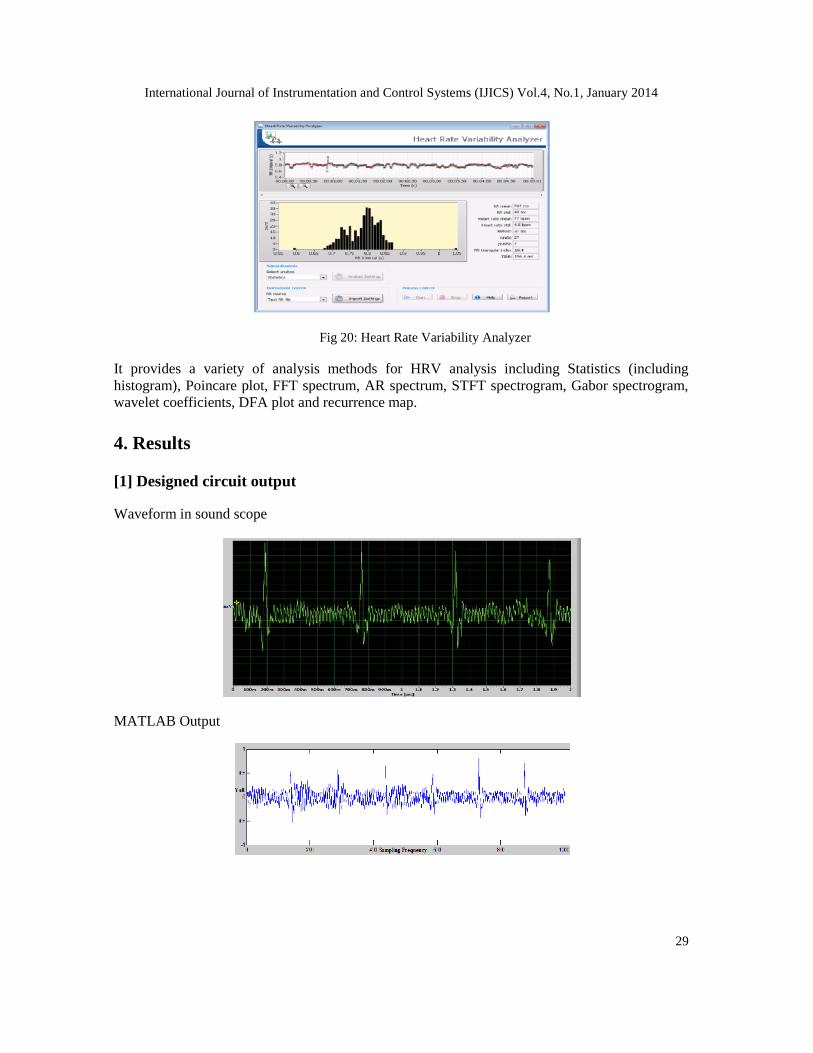
Fig 20: Heart Rate Variability Analyzer
It provides a variety of analysis methods for HRV analysis including Statistics (includinghistogram), Poincare plot, FFT spectrum, AR spectrum, STFT spectrogram, Gabor spectrogram,wavelet coefficients, DFA plot and recurrence map.
4. Results
[1] Designed circuit output
Waveform in sound scope
MATLAB Output
International Journal of Instrumentation and Control Systems (IJICS) Vol.4, No.1, January 2014
29
Fig 20: Heart Rate Variability Analyzer
It provides a variety of analysis methods for HRV analysis including Statistics (includinghistogram), Poincare plot, FFT spectrum, AR spectrum, STFT spectrogram, Gabor spectrogram,wavelet coefficients, DFA plot and recurrence map.
4. Results
[1] Designed circuit output
Waveform in sound scope
MATLAB Output

International Journal of Instrumentation and Control Systems (IJICS) Vol.4, No.1, January 2014
30
MATLAB Filtrations output
Heart Beat Result in LAB-View
Filtrations in LAB-View
Heart Beat Result in MATLAB

International Journal of Instrumentation and Control Systems (IJICS) Vol.4, No.1, January 2014
31
[2] Heart pulse sensor output
Digital Oscilloscope Output
Sound Scope Output
MATLAB Output
5. Conclusion
Evaluating ECG Capturing Using sound Card of PC/laptop is designed and performed withoutinterfacing microcontroller or any other data transmission devices. The transformations of ECGsignal from circuit to laptop via micro-phone jack which is already connected with inbuiltsoundcard. This method has low cost and less complexity. Only it required basic knowledge ofcircuit design and programming skills. In circuit design, various electronics and bio-medicalinstrumentation’s principle are used. AD620 is a specific instrumentation amplifier. This is usedspecially in bio-medical application because it has high CMRR and low input noise amplifier.There are high-pass, low-pass, band-pass and notch filters are designed for reduced frequencyoriented noise.
The Sound-scope is a one of the software which shows the live or real time simulation of ECGsignal which transmit through micro-phone pin. MATLAB is stored the data in sampling

International Journal of Instrumentation and Control Systems (IJICS) Vol.4, No.1, January 2014
32
frequency of soundcard. In which sample and hold process carry out and various operations suchare filtration and beat count performed by programme. In LAB-View, the basic block diagramdesigned and each block has facility of set all function and variable value with bio-medical toolconnectivity.
When the circuit is implemented, sensitivity of the circuit is very high. There is some minorchange and movement affect the output wave. After, the take care by using special ECG leadcables and shield cable is used for interface a circuit. Circuit is totally cover with the aluminiumfoil paper so that, noise interference from environment and electrical & electronics components isreduced.
Acknowledgement
We welcome this opportunity to express our devout appreciation and regards to our Head ofDepartment Dr. UtpalPandya, Department of instrumentation & control Engineering, Sarvajanikcollege of engineering and Technology, Surat, for his unconditional guidance. He alwaysbestowal parental care upon us and expressd keen interest in solving our problems. An eruditeteacher, a tremendous person and a strict disciplinarian, we consider ourselves fortunate to haveworked under his supervision. Without his co-operation, the extensive work involved incompiling background information and preparing the paper for publication would not be possible.
References
[1] Introduction to Biomedical Equipment Technology by Joseph J. Carr and John M. Brown.[2] Handbook of Biomedical Instrumentation by R. S. Khandpur[3] Introduction to Medical Electronics Applications by D. Jennings, A Flint, BCH Turton, LDM Nokes[4] seminarprojects.com/s/biomedical-projects-using-labview[5] sites.google.com/site/fionaproj/home/beng-401/ecg-circuit[6] engineerslabs.com/ecg-circuit-analysis-and-design-simulation[7] www.edaboard.com› Forum › AnalogDesign › Analog Circuit Design[8] www.docircuits.com/learn/category/ecg/[9] http://e2e.ti.com/support/amplifiers/precision_amplifiers/f/14/t/148599.aspx[10] http://www.biosemi.com/publications/artikel5.htm[11] http://healthcare.analog.com/en/patientmonitoring/ecg-diagnostic-line-powered/segment/health.html[12] https://www.mathworks.in/products/daq/supported/sound-cards.html[13] http://www.ni.com/white-paper/5593/en/[14] www.ni.com/pdf/academic/us/journals/ijee_11.pdf
Authors
Bhavikkumar Patel received B.E.degree in Instrumentation and Control Engineeringfrom the Gujarat Technological University, India. His area of interest covers Bio-medical Instrumentation and Automation aswell as PLC and SCADA.
Dhrumil Shah has received B.E. degree in Instrumentation and Control Engineeringfrom Gujarat Technological University, India. He also seeks some of his interests incontrol system designing and Signal Conditioning.