evaluating innovative courses in introductory statistics: resources from the eatlas project...
TRANSCRIPT

Evaluating Innovative Courses in Introductory
Statistics: Resources from the eATLAS Project
Elizabeth Fry and Rebekah IsaakUniversity of Minnesota
eATLAS funded by NSF DUE 1044812 & 1043141

Overview
• Principles of Curriculum Evaluation• Example: Evaluation of CATALST Project• Instruments developed for CATALST
that became part of eATLAS• Additional instrument developed for
eATLAS• Recommendations for future curriculum
evaluations
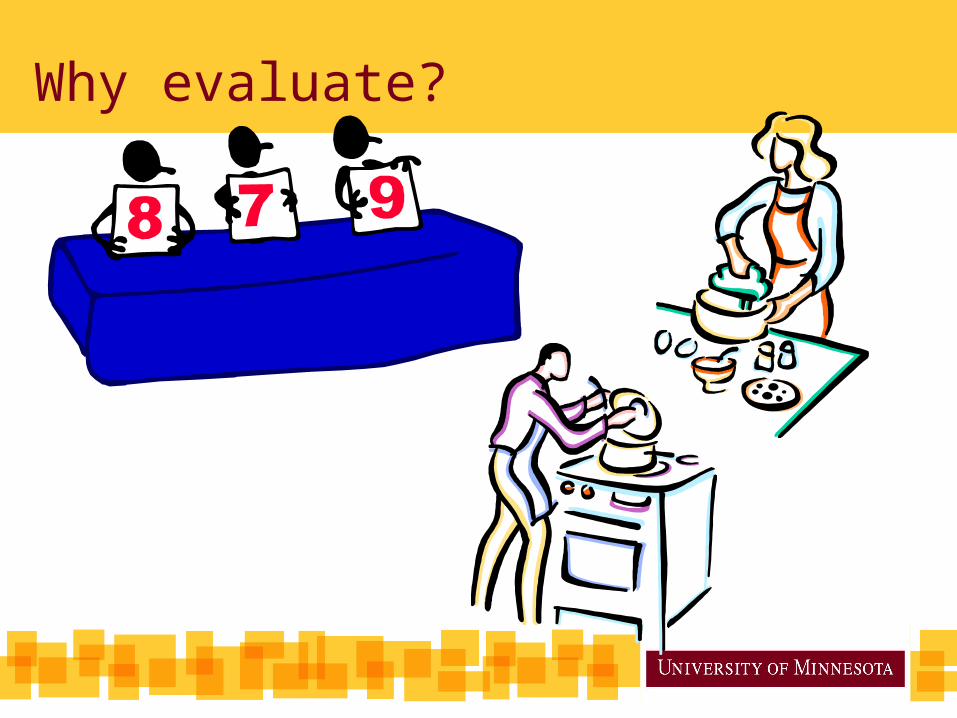
Why evaluate?
• Evaluation produces information that can be used to improve the project
• Evaluation can document what has been achieved, and to what extent the desired goals and impacts have been attained
Why evaluate?
Guidelines for Evaluating Curriculum• One size does not fit all (Frechtling,
2010)• Clearly define the purpose
– Formative vs. summative– “The purpose of an evaluation should
derive in part from the project, what it is intended to achieve, and the questions it is addressing.” (Frechtling, 2010, p. 114)
• Use multiple methods• Document well

Guidelines for Evaluating Curriculum• Tradeoffs depend on:
– Evaluation Purpose
– Degree of confidence needed
• Work smart, not hard: – Choose evaluation
activities that cover multiple purposes
Cost Time
Breadth
Rigor

The CATALST Project
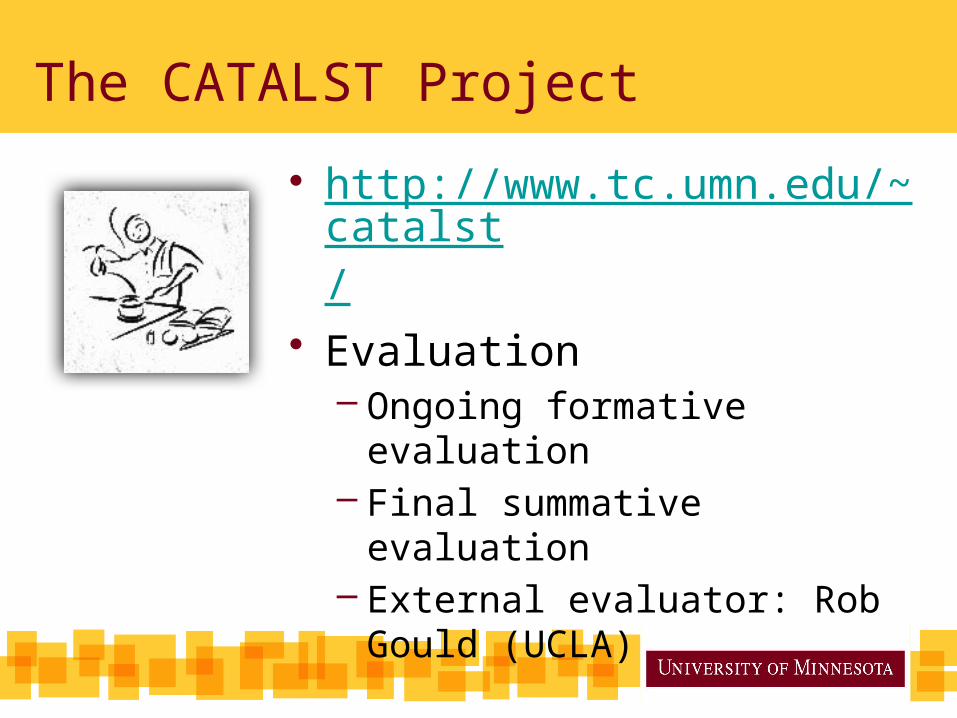
• http://www.tc.umn.edu/~catalst/
• 5 year project• Purpose:
– To create and implement innovative learning materials for an introductory, non-calculus based statistics course
– To assess student achievement
The CATALST Project
• http://www.tc.umn.edu/~catalst/
• Evaluation– Ongoing formative evaluation– Final summative evaluation– External evaluator: Rob Gould
(UCLA)

CATALST Goals & Evaluation Questions
Goal 1: Create innovative learning materials for an introductory, non-calculus based statistics course based on modeling and simulation
• Evaluation Question: – Has the project succeeded in this goal?

CATALST Goals & Evaluation Questions
Goal 2: Implement the Educational Innovations
• Evaluation Question: – What is the feasibility of implementing the
CATALST materials and approach in an undergraduate statistics course?

CATALST Goals & Evaluation Questions
Goal 3: Assess Student Achievement
• Evaluation Question: – Has this been accomplished?

CATALST Goals & Evaluation Questions
Goal 4: Conduct Research on Undergraduate Statistics Education
• Evaluation Question: – Have these studies taken place and what
has been learned from these studies?
CATALST Goals & Evaluation Questions
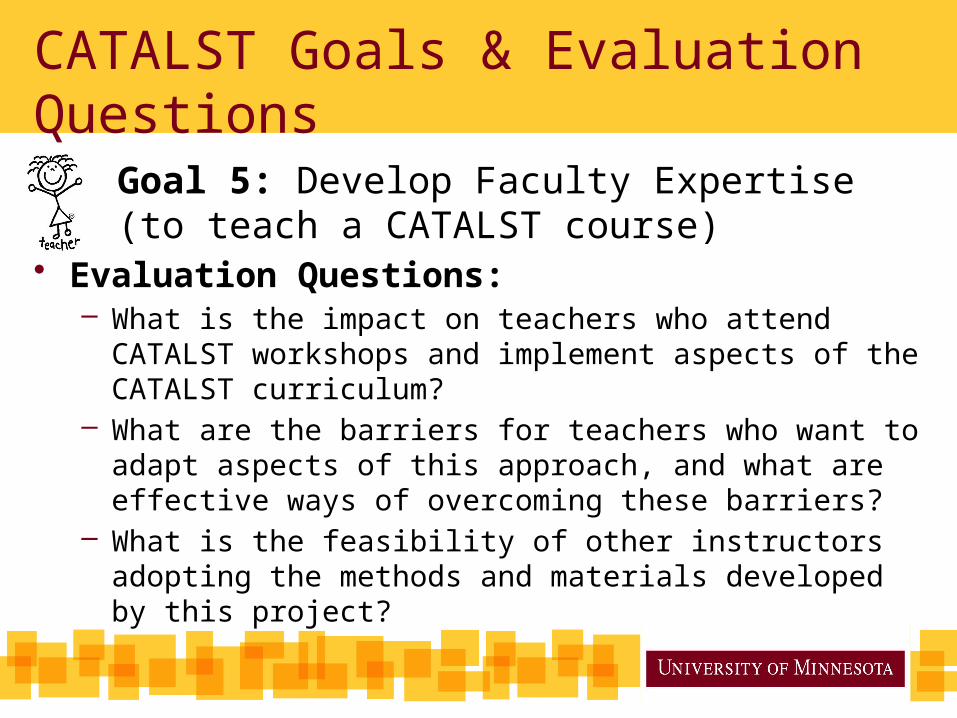
Goal 5: Develop Faculty Expertise (to teach a CATALST course)
• Evaluation Questions: – What is the impact on teachers who attend CATALST
workshops and implement aspects of the CATALST curriculum?
– What are the barriers for teachers who want to adapt aspects of this approach, and what are effective ways of overcoming these barriers?
– What is the feasibility of other instructors adopting the methods and materials developed by this project?

CATALST: Formative Evaluation
• Constant changes, updates & improvements– Curriculum
• Content• Contexts• Activities
– Pedagogy• Scaffolding• Inverted classroom• Cooperative learning• Group assessments

CATALST: Formative Evaluation
• Implementation– Workshops and
gatherings– Lesson plans– Implementer visits– Feedback from
implementers
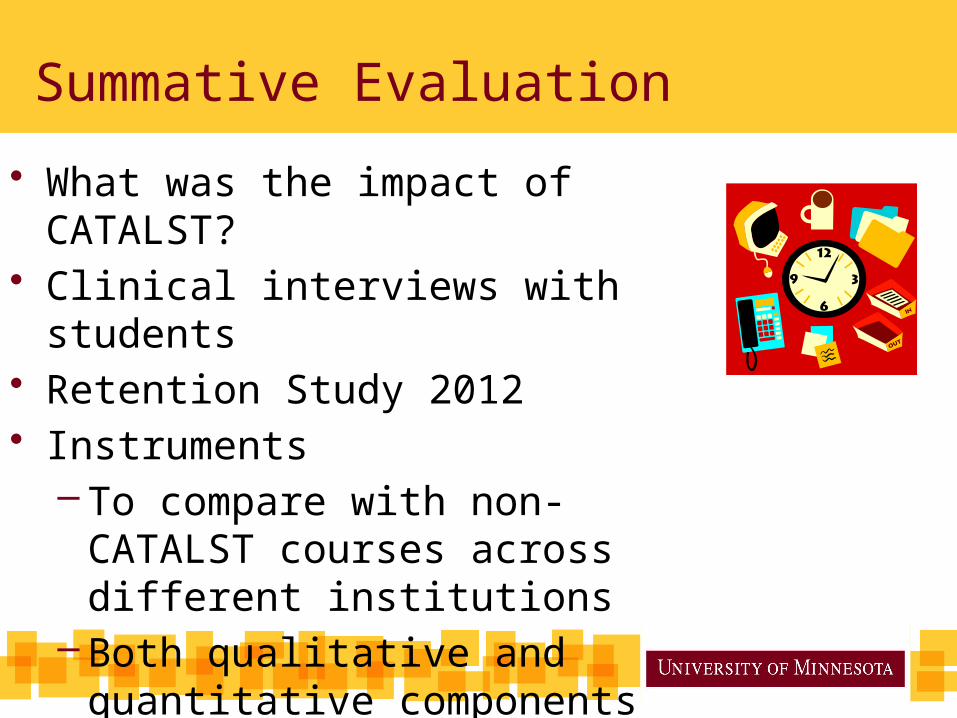
• What was the impact of CATALST?
• Clinical interviews with students • Retention Study 2012• Instruments
– To compare with non-CATALST courses across different institutions
– Both qualitative and quantitative components
Summative Evaluation

Summative Evaluation Data
Gathered Fall 2011/Spring 2012
14 instructors at 8 institutions
CATALSTSpring 2012289 students taught by8 instructors
Non-CATALSTFall 2011/Spring 2012:440 students taught by6 instructors

Instruments developed for CATALSTFor assessing student outcomes:• Goals and Outcomes Associated with Learning
Statistics (GOALS), 2 versions:• TRAD: for students in traditional courses• RAND: for students in randomization-based
courses• Models of Statistical Thinking (MOST)For assessing student attitudes:• Affect Survey (Attitudes and beliefs about statistics)
These instruments were developed for evaluation of CATALST, but can also be used in other settings

Goals and Outcomes Associated with Learning Statistics (GOALS)• 27 forced-choice items • Items assess statistical reasoning in a
first course in statistics• Two versions
– TRAD: Items 19-22 assess traditional approach to statistical inference
– RAND: Items 19-22 assess randomization-based approach to statistical inference
– 23 items common to both versions
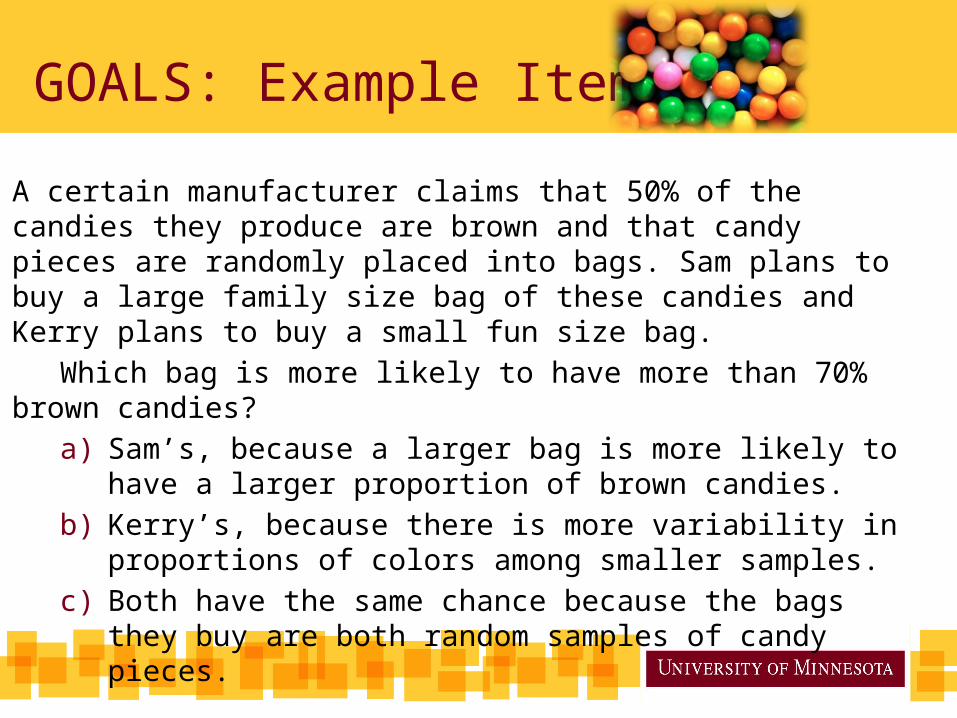
GOALS: Example Item
A certain manufacturer claims that 50% of the candies they produce are brown and that candy pieces are randomly placed into bags. Sam plans to buy a large family size bag of these candies and Kerry plans to buy a small fun size bag.
Which bag is more likely to have more than 70% brown candies?
a) Sam’s, because a larger bag is more likely to have a larger proportion of brown candies.
b) Kerry’s, because there is more variability in proportions of colors among smaller samples.
c) Both have the same chance because the bags they buy are both random samples of candy pieces.

Models of Statistical Thinking (MOST)
• 4 real-world contexts• 4 open-ended items that ask students to
explain how they would set up and solve a statistical problem that involves a statistical inference
• 7 forced-choice follow-up items• Used in both traditional and
randomization-based courses
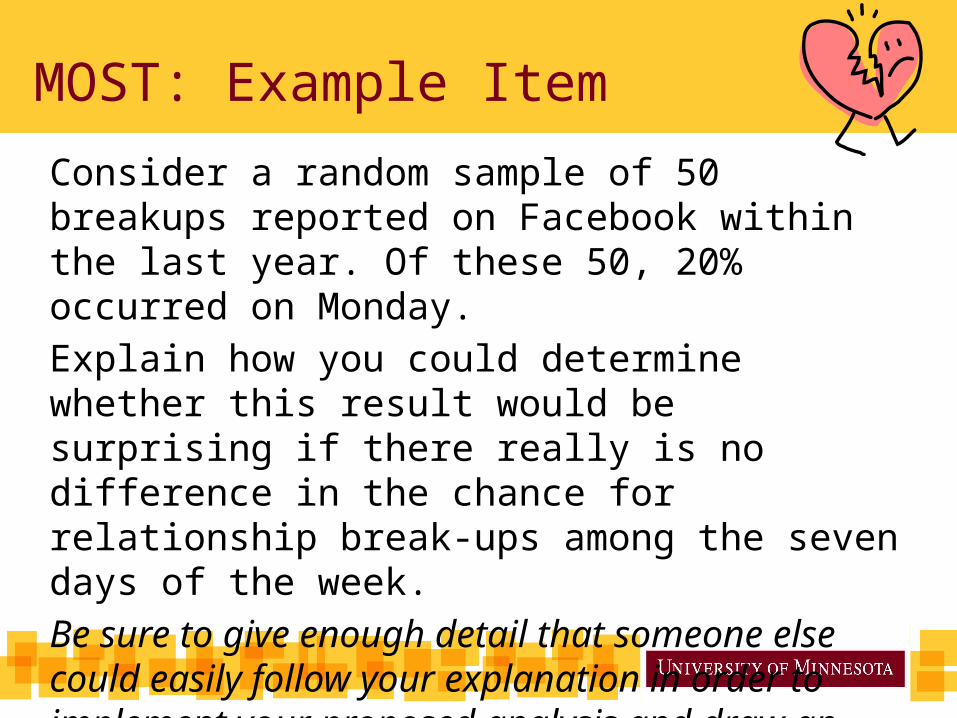
Consider a random sample of 50 breakups reported on Facebook within the last year. Of these 50, 20% occurred on Monday.
Explain how you could determine whether this result would be surprising if there really is no difference in the chance for relationship break-ups among the seven days of the week.
Be sure to give enough detail that someone else could easily follow your explanation in order to implement your proposed analysis and draw an appropriate inference (conclusion).
MOST: Example Item

Affect Survey
• 12 questions– 4 items assess experience in an introductory
statistics course– 4 items assess use of statistical software– 4 items assess beliefs about statistics
• 4 response categories
Strongly
Disagree
Strongly Agree
Disagree
Agree

• This course helped me understand statistical information I hear or read about in the media.
• I would be comfortable using software to test for a difference between groups after completing this class.
• I feel that statistics offers valuable methods to analyze data to answer important research questions.
Affect Survey: Example Items

Information Provided by Evaluation• CATALST can be taught successfully by a
variety of instructors in a variety of settings
• Data are still being analyzed , but preliminary results suggest that CATALST students seem to show higher levels of:
Statistical thinkingPositive attitudes and beliefsUnderstanding and interpreting p-values
and confidence intervals
than students in comparison courses

Information Provided by Evaluation
• Even though CATALST students did not study a lot of traditional content, they did not score lower on the 23 common items on GOALS
• Weakest areas: understanding how sample size affects sampling variability
• Several months after the course: positive attitudes remain about what students have learned, and good understanding of modeling and inference is retained.

eATLAS Instruments
• e-ATLAS (Evaluation and Assessment of Teaching and Learning About Statistics) grant from NSF 2011-2013
• Developed instruments to use in large scale assessments across introductory statistics classes in USA as well as in evaluations of new curricula
• Assessments of student outcomes: GOALS, MOST and Affect Survey
• Assessment of teacher practice and beliefs: Statistics Teaching Inventory (STI)

Statistics Teaching Inventory (STI)
4 versions
Face-to-face
classes (2
versions)
Online classes
Hybrid classes
Lecture/recitation
format (lecturer plus
TA)
One instructor per
section

Statistics Teaching Inventory (STI)
Six different sections:• Pedagogy• Curricular Emphasis• Technology• Assessment• Beliefs• Course Characteristics

STI: Example Items
From Curricular Emphasis section

Next Steps for eATLAS
• Statistics Teaching Inventory will be given to a national random sample to track change over time and provide baseline data
• Subset of STI respondents to administer student instruments (GOALS, MOST, Affect) for their courses
• STI can also be used in evaluations of projects that seek to impact instructors
Recommendations for Designing Curriculum Evaluations
• Clarify purpose and goals for the project• Have clear, focused evaluation questions and
identify what types of information can be used to answer each question
• Clarify processes for gathering both formative and summative data
• Use good assessment instruments! • Have a good external evaluator to provide
critical feedback• Gather different types of information to
continually improve materials

Thank you!
Rebekah Isaak
Elizabeth Fry
Contact Information
Joan Garfield
References
• Frechtling, J. (2010). The 2010 User-Friendly Handbook for Project Evaluation. Retrieved from: http://www.westat.com/pdf/projects/2010ufhb.pdf