evaluating methods of inferring gene regulatory networks
TRANSCRIPT

RESEARCH ARTICLE Open Access
Evaluating methods of inferring generegulatory networks highlights their lack ofperformance for single cell gene expressiondataShuonan Chen1 and Jessica C. Mar1,2,3*
Abstract
Background: A fundamental fact in biology states that genes do not operate in isolation, and yet, methods thatinfer regulatory networks for single cell gene expression data have been slow to emerge. With single cell sequencingmethods now becoming accessible, general network inference algorithms that were initially developed for datacollected from bulk samples may not be suitable for single cells. Meanwhile, although methods that are specific forsingle cell data are now emerging, whether they have improved performance over general methods is unknown. Inthis study, we evaluate the applicability of five general methods and three single cell methods for inferring generegulatory networks from both experimental single cell gene expression data and in silico simulated data.
Results: Standard evaluation metrics using ROC curves and Precision-Recall curves against reference sets sourced fromthe literature demonstrated that most of the methods performed poorly when they were applied to either experimentalsingle cell data, or simulated single cell data, which demonstrates their lack of performance for this task. Using defaultsettings, network methods were applied to the same datasets. Comparisons of the learned networks highlighted theuniqueness of some predicted edges for each method. The fact that different methods infer networks that varysubstantially reflects the underlying mathematical rationale and assumptions that distinguish network methodsfrom each other.
Conclusions: This study provides a comprehensive evaluation of network modeling algorithms applied to experimentalsingle cell gene expression data and in silico simulated datasets where the network structure is known. Comparisonsdemonstrate that most of these assessed network methods are not able to predict network structures from single cellexpression data accurately, even if they are specifically developed for single cell methods. Also, single cell methods, whichusually depend on more elaborative algorithms, in general have less similarity to each other in the sets of edgesdetected. The results from this study emphasize the importance for developing more accurate optimized networkmodeling methods that are compatible for single cell data. Newly-developed single cell methods may uniquelycapture particular features of potential gene-gene relationships, and caution should be taken when we interpretthese results.
Keywords: Gene regulatory network, Single cell genomics, Bayesian network, Correlation network
* Correspondence: [email protected] of Systems and Computational Biology, Albert Einstein Collegeof Medicine, Bronx, New York, USA2Department of Epidemiology and Population Health, Albert Einstein Collegeof Medicine, Bronx, New York, USAFull list of author information is available at the end of the article
© The Author(s). 2018 Open Access This article is distributed under the terms of the Creative Commons Attribution 4.0International License (http://creativecommons.org/licenses/by/4.0/), which permits unrestricted use, distribution, andreproduction in any medium, provided you give appropriate credit to the original author(s) and the source, provide a link tothe Creative Commons license, and indicate if changes were made. The Creative Commons Public Domain Dedication waiver(http://creativecommons.org/publicdomain/zero/1.0/) applies to the data made available in this article, unless otherwise stated.
Chen and Mar BMC Bioinformatics (2018) 19:232 https://doi.org/10.1186/s12859-018-2217-z

BackgroundEvery cell in an organism is regulated by its own uniquetranscriptome. Advances in single cell sequencing tech-nologies have illuminated how the regulatory processesthat control individual cells consist of signals that arevariable and heterogeneous. Quantifying single celltranscriptomes in large numbers has therefore allowedus to survey the landscape of heterogeneity in geneexpression, resulting in the discovery of new cellsub-populations that are important for driving cellulardifferentiation and disease processes. It is remarkable toconsider that these discoveries would otherwise be un-detectable using standard approaches from bulk samples.As single cell biology continues to gain greater promin-ence, it is inevitable that our understanding of how sig-nal transduction pathways operate will be updated, andthat key regulators and new cell types can be identifiedwith increased resolution [1].The analysis of gene expression data from single cells
comes with a variety of computational challenges. Thereare features that are inherent to single cell gene expres-sion data, that distinguish this data type from their bulksample counterparts, and require additional attention asfar as statistical analysis and bioinformatics modeling areconcerned. For this reason, computational methods thatwere originally developed for bulk sample data may notnecessarily be suitable for data generated from singlecells. For instance, single cell data has higher rates ofzero values than bulk sample data. This results from acombination of true biological effects where a transcriptof a gene is not expected to be produced in every cell,and technical variation, where higher degrees of sensitiv-ity and variation are associated with single cell assays be-cause of the limited amounts of biological material. Forstandard bulk sample data, it is often common to ex-clude or impute these zero values as a preprocessingstep to improve the stability of downstream analyses.However, in a single cell setting, the higher rates of zerovalues mean that filtering or imputation approaches maydistort the overall shape of the gene expression distribu-tion substantially, and therefore a more careful set ofpreprocessing rules is required [2, 3].Another feature of single cell data is the range of gene
expression distributions that are present in a cell popula-tion. Because of heterogeneity in gene expression ofsingle cells, these distributions may not always follow aGaussian distribution or even a single distribution type,which is a common assumption at the core of manystandard bioinformatics approaches. Analyzing singlecell data therefore requires methodologies that can ad-dress these kinds of data-specific challenges to producereliable inferences.Recently, new methods have been developed that deal
with specific aspects of analyzing single cell gene expression
data. MAST [4] assesses differential gene expression whileaccounting for technical variation in single cell data,whereas scDD tests for differences between gene expressiondistributions [5]. Multiple studies show these singlecell-specific methods outperform standard bulk samplemethods for detecting differentially expressed genes [6, 7].A host of other methods has been released to analyze geneexpression data from single cells that go beyond differentialexpression [8–15]. One approach from the Monocle toolkit[16] infers the trajectory of individual cells to recreate“pseudo-time”, a mapping that provides insight into thetranscriptional dynamics or developmental hierarchiesof single cells, including the gene sets or cellsub-populations underlying these relationships [17–20]. These newly-developed methods show promise intheir potential to improve the accuracy of inferencesderived from single cell gene expression data.In contrast to differential expression analysis, it is only
recently that the methods for gene regulatory network(GRN) modeling have been developed specifically forsingle cell data [21]. While each method addresses someof the distinct features of single cell data, a commontheme is that network reconstruction is limited to asimple model. This is a concern because the inferrednetworks may fail to fully represent and exploit the com-plexity occurring in the transcriptomes of single cells.For instance, some methods such as the single-cellnetwork synthesis (SCNS) toolkit, as well as BoolTrai-neR (BTR) [22] rely on a binary indicator variable forgene expression which may be an over-simplification ofmore subtle expression changes and hidden interactions.Also, the computational cost of calculating a Booleanfunction and cell state constrains the scalability of themethods to more meaningful and realistic numbers ofgenes to study. More recently, a method based on aGamma-Normal mixture model [23] shows potential forcapturing the multi-modality of gene expression insingle cells; however, limitations of this method are thatit is only appropriate for profiles with two to three com-ponents, and must follow these two distribution types ofa Gamma and Normal distribution. The network recon-struction part of this method is also based on co-activationwhere interactions are identified using binary activation/de-activation relationships which may not be sensitiveenough to generalize across all genes. Another recentmethod SCODE requires pseudo-time estimates for singlecell datasets to solve linear ordinary differential equations(ODEs) [24]. This may be problematic if the pseudo-timeinference step introduces an additional level of noise orerror that then affects the accuracy of downstream networkreconstruction.Notably, many network analyses of single cell data still
depend on methods that were developed for bulk sampledata, especially the popular use of co-expression networks
Chen and Mar BMC Bioinformatics (2018) 19:232 Page 2 of 21
[25–27]. These association networks are straightforwardto interpret, but may not necessarily be suitable forsingle cell gene expression data since they do not ac-count for drop-out events or model heterogeneity inthe data. Therefore, understanding how standard net-work methods perform when applied to single celldata, as well as exploring whether the methods de-signed for single cell data have higher accuracy, arecritical questions for conducting appropriate analyses.To our knowledge, a thorough investigation into theutility of these general and new network approachesfor single cells has not been done. Understanding thelimitations and strengths of these existing methods isinformative for providing guidance for choosing anetwork method for single cell analysis, and thedevelopment of new network inference methods forsingle cell gene expression data.In this study, we investigated the performance of
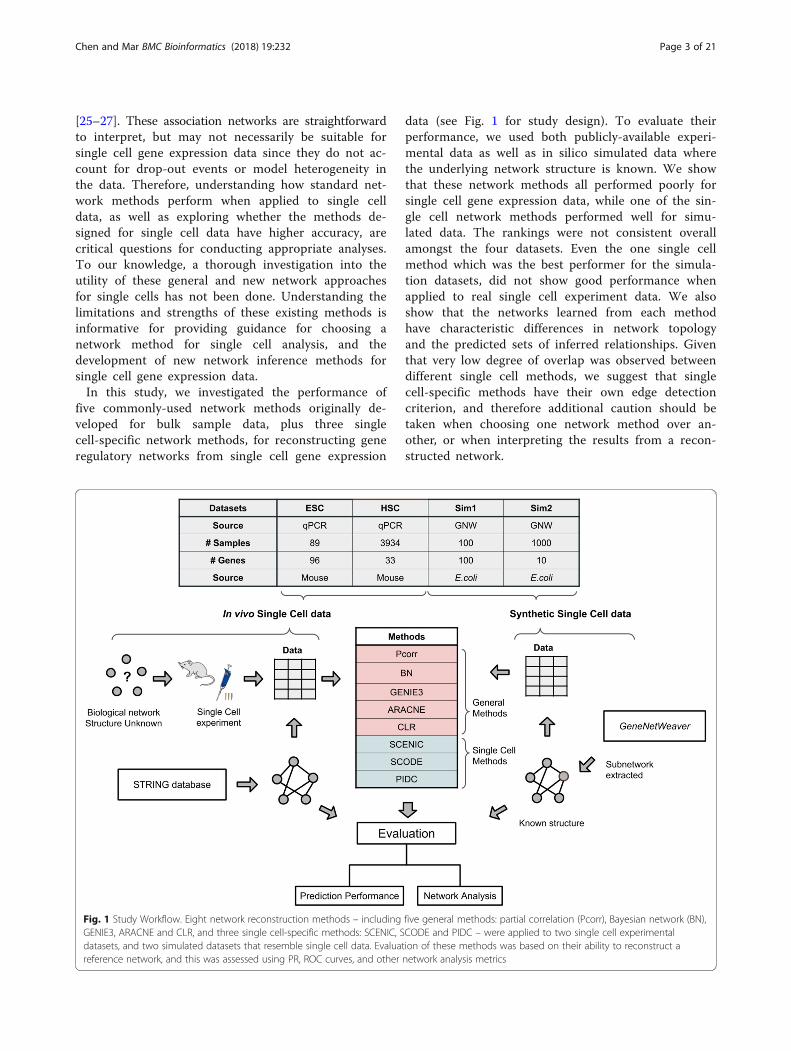
five commonly-used network methods originally de-veloped for bulk sample data, plus three singlecell-specific network methods, for reconstructing generegulatory networks from single cell gene expression
data (see Fig. 1 for study design). To evaluate theirperformance, we used both publicly-available experi-mental data as well as in silico simulated data wherethe underlying network structure is known. We showthat these network methods all performed poorly forsingle cell gene expression data, while one of the sin-gle cell network methods performed well for simu-lated data. The rankings were not consistent overallamongst the four datasets. Even the one single cellmethod which was the best performer for the simula-tion datasets, did not show good performance whenapplied to real single cell experiment data. We alsoshow that the networks learned from each methodhave characteristic differences in network topologyand the predicted sets of inferred relationships. Giventhat very low degree of overlap was observed betweendifferent single cell methods, we suggest that singlecell-specific methods have their own edge detectioncriterion, and therefore additional caution should betaken when choosing one network method over an-other, or when interpreting the results from a recon-structed network.
Fig. 1 Study Workflow. Eight network reconstruction methods – including five general methods: partial correlation (Pcorr), Bayesian network (BN),GENIE3, ARACNE and CLR, and three single cell-specific methods: SCENIC, SCODE and PIDC – were applied to two single cell experimentaldatasets, and two simulated datasets that resemble single cell data. Evaluation of these methods was based on their ability to reconstruct areference network, and this was assessed using PR, ROC curves, and other network analysis metrics
Chen and Mar BMC Bioinformatics (2018) 19:232 Page 3 of 21

MethodsGRN inference methodsWe use N to denote the total number of genes, and useS to denote the total number of samples i.e. single cellsprofiled. A gene expression dataset is represented by aS ×N matrix, where each row vector s (s = 1, …, S) repre-sents a N-dimensional transcriptome, and each columnvector y (y = 1, …, N) corresponds to a S-dimensionalgene profile in the total cell population. The goal of thenetwork inference method is to use the data matrix (ex-perimental or synthetic datasets) to predict a set of regu-latory interactions between any two genes from the totalof N genes. The final output is in the form of a graphwith N nodes and a set of edges. In a GRN, each node inthe network represents a gene and an edge connectingtwo nodes represents an interaction between these twogenes (representing either direct physical connections orindirect regulation). In the next section, we describe theset of network inference methods that were used in ourstudy, followed by the description of datasets used, thereference networks, and statistical metrics used to assessperformance.
Partial correlation (Pcorr)The principle underlying correlation networks is that iftwo genes have highly-correlated expression patterns(i.e. they are co-expressed), then they are assumed toparticipate together in a regulatory interaction. It is im-portant to highlight that co-expressed genes are indica-tive of an interaction but this is not a necessary andsufficient condition. Partial correlation is a measure ofthe relationship between two variables while controllingfor the effect of other variables. For a network structure,the partial correlation of nodes Xi and Xj (i-th and j-thgene) are defined with respect to other nodes XSm ,where Sm ∈ X\{i, j}:
ρijjSm ¼ corrXiX jjSm ¼ σ ijjSmffiffiffiffiffiffiffiffiffiffiffiffiffiffiffiffiffiffiffiffiσ iijSmσ jjjSmp
Under this definition, inferring the Pcorr is equivalentto inferring a the set of non-zero partial correlations be-tween variables, and testing the hypothesis:
H0 : ρijjSm ¼ 0vs:
H1 : ρijjSm≠0;
where ρijjSm indicates the partial correlation coefficientdefined above. Therefore the presence of an edge betweenxi and xj indicates that a correlation exists between xi andxjregardless of which other nodes are being condi-tioned on.Typically, gene expression profiles from single cell data
follow an analog-like, multimodal distribution rather
than a unimodal continuous shape. Therefore, metricslike the Pearson correlation coefficient are less suited forsingle cell expression data because this metric measuresa linear dependency between two variables. Therefore, amore appropriate measure is a rank-based measure ofcorrelation, such as the Spearman correlation and Ken-dall rank correlation coefficients. Given the non-linearnature of single cell gene expression data, Spearman’scorrelation coefficient was used in this study. Pairwisepartial correlations were calculated, and Fisher’s trans-formation was used for variance stabilization:
zijjSm¼12
log1þ ρijjSm1−ρijjSm
Adjustment for multiple testing correction of theP-values was done using the Benjamini-Hochbergmethod [28]. Statistical significance was defined at the0.05 level, and this threshold was used to identify thefinal set of predicted pairwise interactions using Pcorr.
Bayesian networksA Bayesian network (BN) encodes conditional depend-encies between random variables X, that are representedas nodes in the graph or network. Each node is charac-terized by a conditional probability table for discretedata, or a regression model in the case of continuousvariables, that specify the probability or likelihood ofobtaining a certain outcome for the node given thevalues of its parent nodes.The network structure is defined as the graph G
= (V,E), where V corresponds to the set of random vari-ables X, represented as nodes, and E corresponds to theset of edges that connect any of these nodes in thegraph. In this study, we only consider a BN for continu-ous variables since gene expression is more appropriatelymodeled as a continuous measure. Under this setting,BN defines a factorization of the joint probability distri-bution of V = {x1,…xN} (global probability distribution)into a set of local probability distributions, given by theMarkov Property of BNs, which states that each variablenode directly depends on its parent variables ΠXi :
f x1;…; xNð Þ ¼YNi¼1
f xijΠxið Þ
Because gene expression is typically modeled as a con-tinuous value, Gaussian Bayesian Networks are com-monly used to reconstruct networks for this kind ofdata. In such a BN, the global distribution is assumed tofollow a multivariable Normal distribution, and localdistributions are linear regression models where the par-ent nodes are used as explanatory variables.
Chen and Mar BMC Bioinformatics (2018) 19:232 Page 4 of 21

Structure learning in BN pertains to the task of learn-ing the network structure from the dataset. There areseveral methods available for the task, and we used ascore-based structure learning algorithm, specifically theBayesian Information criterion (BIC) score to guide thenetwork inference process. We used bootstrap resam-pling to learn a set of R = 1000 network structures, andthen used model averaging to build an optimal singlenetwork (the significant threshold was determined bythe function averaged.network from the R packagebnlearn [29], which finds the optimal threshold based onthe likelihood of the learned network structure). Al-though a BN can learn directed edges, all directionswere not included in our results to facilitate a fairercomparison with the other network methods, since mostof these do not infer directed edges. For this compari-son, we therefore treated the directed edges showinghigher absolute values as the representative regulatoryrelationships. BN inference was performed using the Rpackage bnlearn [29].
GENIE3GEne Network Inference with Ensemble of Trees (GENIE3)uses a tree-based method to reconstruct GRNs, and hasbeen successfully applied to high-dimensional datasets [30].It was also the best performer in the DREAM4 In SilicoMultifactorial challenge [31]. In this method, reconstructinga GRN for N genes is solved by decomposing the task intoN regression problems, where the aim is to determine thesubset of genes whose expression profiles are the most pre-dictive of a target gene’s expression profile.Each tree is built on a bootstrapped sample from the
learning matrix, and at each test node, k attributes areselected at random from all candidate attributes beforedetermining the best split. By default, and as suggestedfrom the original literature, k¼ ffiffiffiffiffi
Np
was used in this study.For each sample, the learning samples are recursively splitwith binary tests based each on a single input gene. Thelearning problem is equivalent to fitting a regressionmodel, where the subset of genes are covariates, that mini-mizes the squared error loss between the predicted andobserved expression value for the target gene. Each modelproduces a ranking of the genes as potential regulators ofa target gene. Ranks are assigned based on weights thatare computed as the sum of the total variance reductionof the output variable due to the split, and therefore indi-cate the importance of that interaction for its predictionof the target gene’s expression. Although GENIE3 is ableto learn the directions of edges too, we used the samerationale and procedure as for the BN, where directededges were not incorporated into the learned networks tofacilitate a more straightforward comparison of resultsfrom all network methods.
ARACNEAlgorithm for the Reconstruction of Accurate CellularNetworks (ARACNE) [32] is one of the most commoninformation-theoretic network approaches that is basedon Mutual Information (MI). MI is a generalization ofthe pairwise correlation coefficient, and measures thedegree of dependency between two variables xiand xj:
MIij¼Xxi
Xx j
p xi; xj� �
log2p xi; xj� �
p xið Þp xj� � ;
where p(xi, xj) is the joint probability distribution of xiand xj, and p(xi) and p(xj) are the marginal probabilitydistribution functions of xi and xj, respectively. To calcu-late MI, discrete variables are required. We used the Rpackage minet, which calculates MI by equal-width bin-ning for discretization and empirical entropy estimationas described in [33]. Following the calculation of MI forevery available pair of genes, ARACNE applies the DataProcessing Inequality (DPI) to eliminate indirect effectsthat can be explained by the remaining interactions inthe network. DPI states that if gene xi interacts withgene xk via gene xj, or equivalently:
xi→xj→xk ;
then,
I xi; xkð Þ≤ min I xi; x j� �
; I x j; xk� �� �
:
ARACNE calculates all pairwise MIs, and for all pos-sible gene triplets, it will remove those interactions thatviolate the DPI beyond a specified level of tolerancegiven by eps, which is a parameter designed to compen-sate for errors in the estimated MI. Specifically, if thedifference between the potential indirect interaction andthe minimum of any other two is such that:
I xi; xkð Þ− min I xi; x j� �
; I x j; xk� �� �
> eps:
then the potential edge (connecting xi and xk) will belabeled as an indirect interaction and be removed fromthe inferred network. The tolerance threshold eps wasset to eps = 0.1 for all network inference with ARACNE(a value of eps = 0.1–0.2 is suggested in the originalpaper).
CLRContext Likelihood of Relatedness (CLR) [31, 34] is an-other commonly-used approach that is also based onMI. The difference is that CLR takes into account thebackground distribution of the MI values where ARA-CNE does not. The adjustment for the backgrounddistribution is aimed to reduce the prediction of falsepositives in the detection of interactions that may becaused by noise. Similar for ARACNE, we used the R
Chen and Mar BMC Bioinformatics (2018) 19:232 Page 5 of 21

package minet for the entropy and MI calculation. CLRderives a modified z-score that is associated with theempirical distributions of the MI for each i:
zi ¼ maxj
0;I xi; xj� �
−μi
σ i
� �
where μi and σi are the mean and standard deviation ofMI values I(xi, xk), k = 1, …X. The pairwise interactionlikelihood score is then estimated between two genes xiand xj based on the joint likelihood, which is used as theweight of the edges in constructing the final network:
ωij ¼ffiffiffiffiffiffiffiffiffiffiffiffiffiffiffiffiz2i þ z2j :
q
SCENICSingle-Cell rEgulatory Network Inference and Clustering(SCENIC) is a recently-released single cell method for iden-tifying stable cell states and network activity based on theestimated GRN model [35]. This GRN reconstruction usesgene co-expression modules (which can be inferred fromGENIE3, for example), combined with known cis-regulatorymotif enrichment analysis. Specifically, it borrows informa-tion from a pre-built database (RcisTarget), to identifyenriched transcription factor binding motifs in the identifiedco-expression modules. Significantly-enriched motifs arethen associated with their corresponding upstream tran-scription factors. The genes from any enriched motifs forthe same upstream transcription factors are combined.Top-ranked genes for each motif are selected as the regulon,and each transcription-regulon combination is assigned inthe edge list to obtain the network.As suggested by the method’s authors, we incorporated
the transcription factor information from RcisTarget whenGENIE3 was applied to reconstruct the co-expressionmodule network. However, since the weights of each edgein SCENIC are derived from the GENIE3 algorithms, wedid not incorporate ranking results for SCENIC in ana-lyses that involved GENIE3. Instead, results from SCENICwere compared with networks inferred by other single cellmethods. Also, since this method is based on RcisTarget,which only provides databases from human and mice, weonly applied this method to the two single cell experimen-tal data, as data generated from the simulation only con-tain E. coli genes.
SCODESCODE is a method developed to reconstruct a GRN forsingle cell data via regulatory dynamics based on ODEs[24]. Specifically, the expression dynamics of transcrip-tion factors are described using linear ODEs:
dx ¼ Axdt;
where A corresponds to the square matrix representing the
regulatory relationships between variables (i.e., weightedadjacency matrix corresponding to the reconstructednetwork). SCODE aims to optimize A with limited compu-tational cost, so that the above equation can represent themolecular dynamics at a certain measurement point. Inorder to do this, pseudo-time data is required as an extrainput, in addition to the expression data. We followed themethod described in the original publication and usedMonocle2 [16] for single cell pseudo-time estimation. Forthe input arguments of SCODE, we used D = 4 and I = 100,where D represents the number of expression patterns forthe genes and I represents the number of iterations for theoptimizations.
PIDCPartial Information Decomposition and Context (PIDC)is a method developed for single cell gene expressiondata that uses multivariate information measures toidentify potential regulatory relationships between genes[36]. Partial information decomposition (PID) was intro-duced to measure statistical dependencies in a triplet ofvariables simultaneously, by partitioning the informationprovided by two sources of variables about another tar-get variable as three categories: redundant, unique, andsynergistic [37]. The PIDC inference algorithm uses ameasure of the average ratio of unique information be-tween two variables across all of the third variables in
the rest of the variables, i.e., UniquezðX;Y ÞIðX;Y Þ , followed by the
definition of Proportional Unique Contribution (PUC):
uX;Y ¼X
Z∈Sn X;Yf g
UniqueZ X;Yð ÞI X;Yð Þ
þX
Z∈Sn X;Yf g
UniqueZ Y ;Xð ÞI X;Yð Þ
That is, the sum of UniquezðX;Y ÞIðX;Y Þ calculated using every
other gene Z in the network (S is the complete set ofgenes). The confidence of an edge, which is the sum ofthe cumulative distribution functions of all the scoresfor each gene, is next calculated as follows:
c ¼ FX uX;Y� �þ FY uX;Y
� �
where FX(U) is the estimated empirical probability distri-bution for all the PUC scores involving gene X. By incorp-orating the distribution of PUC score for a particulargene, rather than simply keeping edges that ranked high-est across all genes, PIDC aims to detect the most import-ant set of inferred interactions.
Data and analytic methodsExperimental single cell datasetsThe details of the datasets used in this study are summa-rized in Table 1. The two experimental single cell datasets
Chen and Mar BMC Bioinformatics (2018) 19:232 Page 6 of 21

were obtained from studies that profiled embryonic stemcell (ESC) populations and blood-forming stem cell popu-lations (which we refer to as hematopoietic stem cell(HSC) to distinguish it from the former dataset) [26, 38].These two datasets were generated using quantitative PCRfrom 96.96 array chips (ESC) and 48.48 array chips (HSC)on the Fluidigm BioMark HD platform.
Reference networks derived from experimental assaysProtein-Protein Interaction (PPI) networks were extractedfrom the STRING database and used as a reference net-work to compare the reconstructed networks. These net-works represent potential interactions that are derivedfrom evidence based on experimental results, metabolicand signal transduction pathway databases, text-miningand other sources of information [39] . Of note, the refer-ence used in our study was different from the stringent“gold standards” used in DREAM5 challenge, since we in-cluded all possible interactions and did not restrict thenetwork to the direct regulatory interactions only. For in-stance, edges were permitted in the reference network ifthey represented protein-protein associations or a sharedfunction between two proteins, and did not necessarilyrepresent a physical binding event.
Simulated single cell datasets and in silico referencenetworksSimulated datasets were generated using the softwareGeneNetWeaver (GNW), which has become a commontool to generate gene expression data and GRN modelevaluations [40]. Generating datasets where the networkis known provides a straightforward approach forscoring the reconstructed networks. GNW has previ-ously been used to evaluate different GRN modelingmethods. For instance, it was selected to generate the“gold standard” networks for DREAM4 and DREAM5network inference challenges, as well as other publicationsthat conducted comparisons of network modeling ap-proaches [31, 41, 42].To obtain a reference network, GNW was used to
extract the topology of a subnetwork with a total numberof 100 and 10 genes for two simulated datasets (Sim1 and
Sim2, respectively) from the transcriptional regulatorynetworks of Escherichia coli (E.coli) that were derivedfrom experimental data, and then expression datasetswere generated by simulations based on stochastic differ-ential equations. Since we wanted to generate two casescorresponding to real single cell experimental studies withn = p and n > > p, S = 100 for Sim1 and S = 1000 for Sim2were generated as time series experiments in GNW. Thesingle time point is considered as a single cell sample, andwe generated the dataset of 10 time points 100 times (i.e.,in total, there are 100 time series data, each with 10 timepoints) to obtain S = 1000 for Sim2 dataset (i.e., 10 genesand 1000 samples), while for Sim1 dataset, we sampled100 time points from a single time series simulation (seeAdditional file 1: Figure S1 for simulation settings inGNW). Both Sim1 and Sim2 have the same duration oftime series 1000. More detail on the processes used in ourstudy can be found in [31]. These simulation parameterswere designed to follow those similar to other studies thatuse in silico single cell gene expression data [36].Since the aim of this study is to test the applicability of
network inference methods to single cell data, we used thedata simulated from GNW to mimic the characteristics ofsingle cell experimental data. Considering that drop-outevents are one of the most important features of single celldata, we artificially induced drop-out events to the datagenerated from GNW. Specifically, for each gene, we mea-sured its population mean expression across cell samples,and used this value as a threshold. For each sample, if thegene’s expression was lower than the threshold, it wouldbe replaced according to a Binomial probability of 0.5 (i.e.,inducing drop-out where the resulting value was noweither 0 or the original data point). This approach is simi-lar to the method used to generate single cell simulationdata for network evaluation that was published recently[36]. This simulated data does not perfectly represent thedata distribution of an experimental single cell dataset(Additional file 2: Figure S2C & D); however, given the factthat more genuine single cell simulations are currentlyunavailable, this represents the current best option forsimulation in this study, especially by accounting fordrop-out events to mimic experimental single cell data.
Table 1 Summary of datasets used in the evaluation of the eight network methods
Datasets ESC HSC Sim1 Sim2
#Sample (S) 89 3934 100 1000
#Gene (N) 96 33 100 10
Methods Fluidigm qPCR Fluidigm qPCR GNW in silico GNW in silico
Source Mouse Mouse E. coli E. coli
Reference (Ref) STRING PPI STRING PPI GNW GNW
#Edges in Ref 409 126 263 9
Citation [26] [38] [40, 47] [40, 47]
Chen and Mar BMC Bioinformatics (2018) 19:232 Page 7 of 21

Statistical metrics to evaluate network performanceTo evaluate the performance of the network methods, thestandard metrics, Precision-Recall (PR) curve and Re-ceiver Operating Characteristic (ROC) curve were used.The True Positive Rate (TPR), False Positive Rate (FPR),precision and recall for ROC and PR curve were definedas functions of cut-off (k) as follows:
TPR kð Þ ¼ recall kð Þ ¼ TP kð ÞTP kð Þ þ FN kð Þ
FPR kð Þ ¼ FP kð ÞFP kð Þ þ TN kð Þ
precision kð Þ ¼ TP kð ÞTP kð Þ þ FP kð Þ
The Area Under Curve (AUC) of the PR curve (definedas AUPR) and ROC curve (defined as AUROC) were cal-culated using the R package minet. Each network methodproduced a weighted adjacency matrix (or an edge listwhich can be equivalently transformed into an adjacencymatrix) for each network. For Pcorr, each value in thematrix was the inverse of the adjusted P-value for thatpairwise correlation. For BN, each value in the matrix wasthe proportion of an edge to be detected in the1000-bootstrap sampling. For GENIE3, each value was theweight that gives the the predictive importance of the linkbetween two genes. For ARACNE, each value was the MIafter processing DPI to remove any potential indirectinteraction, and for CLR, each value was the z-score thatwas corrected by the MI background distribution. ForSCODE, each value was a corresponding element in theestimated matrix A. For PIDC, the confidence score wasused for the ranking, as described above. We did not in-clude SCENIC for the reasons mentioned under the spe-cific method’s description above. For the networkmethods that identified positive versus negative weights,we took absolute values and ignored the specific effects(see the description for each method).
Learning networks using default parametersWhere possible, the default settings in each networkmethod were used to derive a single best final network.For GENIE3, SCODE and PIDC, there are no defaultparameter settings in the original methods, and weightedscores do not have statistical meanings but only to rankthe connections. Therefore, in order to determine thenumber of edges to be detected in these methods, we setthe total number of edges learned to be equivalent orlower to the number detected by the BN method (as aresult, the total number of edges in the final networkcan be less than the BN’s, as some of the edges are elimi-nated when accounting for directions). TP, TN, FP, FN,precision (P¼ TP
TPþFP ), recall (R¼ TPTPþFN ), F1 score ( F1¼
2PRPþR), False Discovery Rate (FDR¼ FP
TNþFP) were calculatedfor these learned networks (Additional file 3: Table S1).
Principal component analysis (PCA)PCA was used to investigate the similarity of the learnednetworks, as measured by the ranking of the interactionsinferred. For a given network with N nodes, the total
number of possible edges is NðN−1Þ2 . Each learned network
was represented as a vector where each value was theranking of that interaction in the total network, ranging
from 1 to NðN−1Þ2 , where 1 corresponds to the top rank.
PCA was performed used prcomp in R.
Comparing networks using characteristics of degreedistributionDegree is defined as the number of edges a particularnode has in the network. The degree distributions of thelearned networks were compared using the R packageigraph [43] as another comparison of similarity. Refer-ence networks and the degree distributions of two theor-etical network structures were also used in thecomparison. An Erdős-Rényi random graph was gener-ated, where the number of genes in each dataset was setas the number of nodes, and the total number of edgeswas equivalent to the reference network for each dataset.For the scale-free network, we used the Barabási-Albertmodel [44], and similarly, used the number of genes asthe number of nodes for each dataset.
ResultsMost network inference methods cannot correctlyreconstruct networks from simulated gene expressiondata, including those designed for single cellsEvaluation of the network methods using PR and ROCcurves [41] showed that all methods demonstrated poorperformance when applied to the simulated datasets thatmimic single cell experimental data (Fig. 2). Based onthe ROC curves, almost all methods had performance ator around the random baseline (AUC = 0.5) for the Sim1dataset (Fig. 2a). For the Sim2 dataset, we observedgreater diversity in performance across the networkmethods (Fig. 2b), indicating method specificity in theprediction accuracy. A specific example is SCODE,which had better performance than the other methodsand this was consistent for both small and large simu-lated datasets (i.e., Sim1 and Sim2). However, theAUROC scores for SCODE were 0.575 (Fig. 2a), and0.634 (Fig. 2b) which despite being the highest for allmethods, are still not scores that are indicative of strongperformance. Meanwhile, PIDC, which is also a methodthat was developed for single cell data, did not show adetectable advantage over other methods when appliedto either Sim1 or Sim2 datasets, suggesting that all
Chen and Mar BMC Bioinformatics (2018) 19:232 Page 8 of 21

single cell methods do not necessarily perform betterthan general bulk methods in terms of accuracy, and in-stead, specific attributes of the method do matter. It canbe seen that almost all the methods had high rates offalse positives (Fig. 2c and d) even when small numbersof edges were detected (the starting point of the PRcurve is 0 on the y-axis for all the methods). This obser-vation indicates that even the edges that were detected
with the highest confidence from the simulated singlecell dataset were false positives for these methods.We considered whether it was possible that the lack of
performance of all methods was due to the artificialdrop-out event that was added to the simulated data. Totest this hypothesis, we used the dataset that generatedSim2 without inducing drop-out events (this data is de-noted as “Sim2_bulk”, since it resembles the bulk-level
a b
c d
Fig. 2 ROC (top) and PR (bottom) curves for each method applied to the simulated datasets. The results obtained from the Sim1 dataset areshown on the left (a & c) and the Sim2 dataset is shown on the right (b & d). Diagonal black lines on the ROC curves are baselines indicating theprediction level equivalent to a random guess (a & b). ROC curves showed that when the threshold changes and more edges are detected, bothfalse positive and true positive rates increased, but the speed of this increase might not be the same. The PR curves show that when thedetection thresholds decreased, the number of detected edges increased, with a corresponding increase in recall (more true edges are detected)but decrease in precision (increasing the number of detected edges that are not in the reference network)
Chen and Mar BMC Bioinformatics (2018) 19:232 Page 9 of 21

simulated data, Additional file 4: Figure S3), and appliedthe five general methods to reconstruct the network.When we compared these results to those obtained fromSim2 (the single cell simulated dataset), all five methodsshowed an increase in their AUROC and AUPR scores,although the degree of improvement in performancevaried widely. For instance, ARACNE and CLR hadAUROC = 0.293 and 0.364, respectively for Sim2_bulk(Additional file 4: Figure S3), which was an improvementover 0.217 and 0.343 from Sim2 (Fig. 2) but qualitatively,did not represent a substantial change. For GENIE3, amuch higher score was observed when it was applied tothe Sim2_bulk data (AUROC = 0.875, Additional file 4:Figure S3), compared to poor performance when appliedto Sim2 (AUROC = 0.425, which is lower than 0.5). Des-pite the variability in the amount of improvement ob-served, the improvements were at least consistentlyobserved for all methods. The conclusion from this re-sult is that methods not specifically designed for singlecell data have poorer performance when drop-out eventsare present in the data. Therefore, the poor performanceobserved is most likely due to the presence of drop-outevents. A consistent improvement in performance wasnot observed for the Sim1 dataset. This is likely due tothe fewer number of cell samples in the experimentaldesign of Sim1 compared to Sim2, so that even withoutdrop-out, the sample size is not large enough in Sim1for the methods to improve their prediction accuraciesdetectably.Although ROC curves are the typical choice for compar-
ing classifiers, the PR curve is more relevant for evaluatingthe network comparison in this situation (Fig. 2c and d).The task of reconstructing a network has a relatively lowpositive rate (i.e. a sparse prediction problem). In such aproblem, the positive predictive value (i.e. precision) is amore useful metric because it measures the proportion ofedges detected by the model that is correct, rather thansimply the TP (i.e. recall), which is the total number oftrue edges recovered. Some network methods identifymany more edges, and therefore based on TP they mayscore highly, but upon closer inspection based on preci-sion, the learned network is of lower quality because alower proportion of those edges are actually true. This isespecially relevant when evaluating the learned networksagainst the PPI reference networks from experimentaldata. In this situation, the PPIs have been derived from abroader set of cell types, perturbations, and experimentalassays that are likely to result in a larger number of inter-actions. On the other hand, the two experimental datasetsselected in our comparison represent highly-specializedcell types and therefore only a subset of the reference net-works are expected to be relevant. Therefore, in this case,the evaluation of methods is based on both results fromthe PR curve and the ROC curve (Fig. 2).
Similarly, comparisons based on PR and ROC curvesreveal poor performance for all methods for reconstructingnetworks from experimental single gene expression cell dataUsing the same evaluation framework, all seven networkmethods were applied to real single cell gene expressiondata. They demonstrated poor performance, where mostof the ROC curves were comparable to the level of ran-dom predictions (Fig. 3a and b). Pcorr and BN per-formed slightly better than other methods for the ESCand HSC datasets, respectively. However, compared towhat was observed for the Sim2 dataset (Fig. 2b), theiradvantages in performance for these datasets were negli-ble. Similar to the simulated data, almost all the methodshad high rates of false positives (Fig. 3c and d) whensmall numbers of edges were detected. Exceptions forthis were CLR and SCODE, when they were applied toHSC data, as shown by the fact that the starting point ofPR curve is 1 on the y-axis in Fig. 3d. In this respect,CLR and SCODE had better performance over othernetwork methods, although based on an evaluationusing the ROC curve only, CLR did not show any advan-tage over other methods. In contrast to the simulationdata, especially the Sim2 dataset, where methods showeddiverse performance (AUROC score ranged from 0.217to 0.634), neither of the ESC or HSC dataset showedsuch a range in performance across the networkmethods (AUROC score ranged from 0.469 to 0.555 forthe ESC dataset, and 0.519 to 0.592 for the HSC data-set), suggesting that these methods all consistently givepoor performance when applied to real single cell data.Overall performance of the network methods was fur-
ther assessed by comparing the AUROC and AUPRscores (Fig. 4). Because there are fewer genes in the HSCdataset than the ESC dataset, the number of potentialinteractions between genes in the network is alsosmaller. This should result in an easier prediction prob-lem compared to the ESC dataset, which has a largernumber of genes (by one order of magnitude). The effectresulting from the differences in sample size for theHSC versus ESC datasets is reflected by the two distinctbaselines in the AUPR bar graph (Fig. 4b), and thehigher baseline seen in Fig. 3d compared with Fig. 3c.Based on AUROC and AUPR, the performance of the
seven methods (we did not include SCENIC in the evalu-ation, see Methods) were compared, between and withineach dataset (Fig. 4). Using these metrics alone, the simu-lated data did not score higher than the experimental singlecell data when compared to either the HSC or ESC dataset.Moreover, many of the methods had even poorer perform-ance when applied to simulated data. To our surprise, thetwo simulation datasets seem to be more challenging formost of the network methods to learn from, as demon-strated by the scores that are lower than the random pre-diction baselines (Figs. 2 and 3). As mentioned earlier, the
Chen and Mar BMC Bioinformatics (2018) 19:232 Page 10 of 21

only exception was SCODE, which obtained a score thatwas consistently higher than other methods for the simu-lated data, especially for the Sim2 dataset (Fig. 4a). ARA-CNE had the second best performance for the Sim1 dataset(behind SCODE), but this performance is not consistent asARACNE was one of the worst performers when applied toboth experimental single cell datasets (Fig. 4).
The total number of detected edges vary by networkmethod, and when evaluated by a community-basedapproach, single cell methods have increased predictionaccuracy over bulk methodsTo understand how many of the same high-confidence in-teractions were being detected by the eight networkmethods, we investigated the similarity between detected
a b
c d
Fig. 3 ROC (top) and PR (bottom) curves for each method applied to single cell experimental data. The results obtained from the ESC dataset areshown on the left side (a & c) and the HSC dataset is shown on the right side (b & d). Diagonal black lines on the ROC curves are baselinesindicating the prediction level equivalent to a random guess (a & b). In (a) and (b), almost all the methods aligned with diagonal black lines inthe ROC curve, suggesting the predictions are nearly equivalent to a random guess for all these methods. It is easier to observe the behavior ofeach method in PR curves. Although the ROC curves indicate similar performance across all methods, for the HSC dataset, the PR curve revealthat the methods have different prediction accuracy (when the total number of detected edges is small), as shown when the curve is close tothe y-axis, and thus provides another aspect of evaluation
Chen and Mar BMC Bioinformatics (2018) 19:232 Page 11 of 21

edges in learned networks using default, “out-of-the-box”settings (with exception for GENIE3, SCODE and PIDC,see Methods). For the four datasets, one network modelwas generated by each method, resulting in thirty inferrednetworks in total (SCENIC was not applied to Sim1 andSim2, see Methods), and a comparative framework similarto the DREAM challenge was applied [41]. We found thatthe total number of detected edges varied widely frommethod to method, even when they were applied to thesame datasets (Additional file 5: Figure S4). ARACNE andCLR are more likely to detect a higher number of edgescompared to other methods, as well as what is capturedby the reference networks. In contrast, Pcorr detected theleast number of edges when applied to the Sim1 dataset,with zero true positive (Additional file 5: Figure S4C). Thismight be caused by the low cell sample to gene ratio (100cell samples to 100 genes), and because Pcorr is based onthe significance test of the correlation coefficients,this method is more strongly affected when applied toa dataset with a smaller sample size. In general, thepercentage of edges detected by each method had lowoverlap with those in the reference networks for allnetwork methods. The overlap was slightly higher ingeneral for ARACNE and CLR, but these gainsseemed to be negated by the fact that the total num-ber of detected edges for these two methods was con-sistently higher than all other methods. Especially, for
the Sim2 dataset, where ARACNE detected 45 edgesin total, resulting in a fully-connected network.An alternative way to evaluate the overlap between
learned networks is to instead, look at how well groupsof network methods did at recovering edges from a ref-erence network together. This kind of evaluation isoften referred to as a community-based approach [41].In our study, it was insightful to contrast the accuracyof network reconstruction done by the general, bulkmethods combined, versus the single cell methodscombined. To test this, we obtained the union of edgesdetected by the bulk methods, and separately, the unionof those edges detected by the single cell methods(Additional file 6: Figure S5). We compared the per-centage of true positives relative to the reference net-works (the number of edges detected by CLR andARACNE were too large to make meaningful compari-sons, therefore we did not include them in this ana-lysis). We included the edges that were detected by anyof Pcorr, BN, or GENIE3 for bulk methods, and in-cluded those that were detected by any from SCENIC,SCODE, or PIDC (for Sim1 and Sim2, only SCODEand PIDC) for the single cell methods.Except for the ESC data, the community-based ap-
proach by single cell methods had better predictionperformance compared to the general bulk methods.This might be caused by the fact that the more recent
Fig. 4 AUROC (top) and AUPR (bottom) scores demonstrate consistently poor performance for most of the methods and datasets. In bothpanels, the horizontal red lines represent the line of a random guess and baseline, which are the same (= 0.5) for AUROC across datasets (a) butdiffer for AUPR (b), since the baseline indicates the value of precision when all the reference edges were recovered, and this depends on thetotal number of genes in the datasets and the number of edges in the reference networks
Chen and Mar BMC Bioinformatics (2018) 19:232 Page 12 of 21

single cell network methods have more diversity intheir inference algorithms, while the general methodswe included in this analysis are somewhat similar asthey are mostly based on regression models. For in-stance, the three bulk methods are made up of Pcorr,BN, and GENIE3 where Pcorr is based on partial cor-relation, and both BN and GENIE3 use regression mod-eling for edge prediction; these are two statisticalapproaches that draw a large degree of overlap. Alter-natively, the single cell methods collectively representdivergent approaches where SCENIC is based on aco-expression network combined with bioinformaticsknowledge, SCODE uses ODEs, and PIDC is aMI-based method. Therefore, each single cell methodlearned a network that was distinct, and combining theresults of the single cell networks intuitively may giverise to a more comprehensive overlap with the refer-ence networks.
A common set of edges are detected by different methodsbut a large number of method-specific and data-specificedges are observed for both experimental data andsimulation dataGiven the large variation in the number of edges detectedby the network methods, we next compared the overlap inedges to investigate whether a core set of edges wasdetected (Figs. 5 and 6), and how many of the detectededges were also in the reference network. For the five gen-eral network methods in our study, only results fromPcorr, BN and GENIE3 are shown, for the same reasonsmentioned above. It is clear that some of the edges wereconsistently detected, no matter which methods wereused, e.g. 48 + 7 common edges for the ESC dataset and78 + 35 common edges for the HSC dataset were detectedby these three general methods (Figs. 5a and b). This wasobserved in both real single cell experimental data andsimulated data, although networks for the experimental
a b
c d
Fig. 5 Intersection of reconstructed networks from general methods and reference networks outlines the ability of the different methods toidentify the same true positives. These methods detected a core set of interactions in the learned networks for the ESC data (a), HSC data (b),and two simulated datasets, Sim1 (c) and Sim2 (d). In general, each method also detected edges that were unique to the method and thedataset, except for Pcorr in Sim1 (c, see text). Only a small set of edges in the reference networks were recovered by intersection of threemethods, and also different methods detected edges that were unique. Moreover, we show that even after combining all the methods, therewere still edges in the reference network that were not detected, as indicated in the white section for each panel
Chen and Mar BMC Bioinformatics (2018) 19:232 Page 13 of 21

data showed more common edges (e.g., 48 + 7 commonedges were commonly detected for ESC, amongst 96genes, while only 14 + 0 edges were consistently detectedfor Sim1, amongst 100 genes). Meanwhile, a subset ofedges that were unique to a specific method was also ob-served. For instance, for the HSC dataset, 42 + 20 edgeswere detected by the BN only, and not detected either byPcorr or GENIE3. An exception for this was when Pcorrwas applied to the Sim1 dataset where all edges (15 intotal) were also detected by GENIE3, and 14 out of these15 were detected by the BN. It is worthwhile noting thatthe total amount of detected edges by Pcorr was muchsmaller for this dataset. The high degree of overlap be-tween these methods was not surprising, since they aredependent on the same mathematical rationale which in-volves a regression model, as mentioned above.We also compared the quality of detected edges by exam-
ining the overlap between multiple network methods and
the reference networks (Fig. 5, indicated by the number onthe center of each Venn diagram). We found that not alledges were able to be recovered by the reconstructednetworks, regardless of which datasets were used. In fact,the number of edges in the reference networks that wererecovered from all three methods is far lower than the totalnumbers of edges in the reference networks. For instance,for the ESC dataset, 7 “true” edges were recovered by allthe methods while there were 409 total “true” edges in ref-erence network (Fig. 5a). For the simulation datasets, wefound that the recovery rate of reference edges was alsopoor. For instance, amongst 14 edges that were commonlydetected from the Sim1 dataset using three generalmethods, none of them were in the reference network(although this might be affected by the fact that the numberof true positives for the Pcorr method was zero).For all three single cell methods (SCENIC, SCODE and
PIDC, with SCENIC only applied to ESC and HSC dataset,
a b
c d
Fig. 6 Intersection of learned networks from single cell methods and the reference network highlights the differences between the edges thatare uniquely detected by each method. Although single cell methods detected a common set of interactions, there was far more inconsistencyin their detections, compared to the results of general methods. Each method, however, was able to detect some ‘correct’ edges that are uniqueto each method (as indicated from the overlap between each colored ellipse and the white ellipse, also see Results). Similarly, only a handful ofedges were commonly detected by all three methods for the HSC and Sim2 datasets (b & d), and no single edge was commonly detected forthe ESC and Sim1 datasets (a & c)
Chen and Mar BMC Bioinformatics (2018) 19:232 Page 14 of 21

see Methods), we found that there were fewer edges over-lapping each of the learned networks, and the recovery ofreference edges was even poorer (Fig. 6). For instance, therewere no edges detected consistently by all three methodsfor the ESC dataset. For the Sim1 dataset, there were only 4edges detected by both SCODE and PIDC, but none ofthem were in the reference network. What was interestingis, in the ESC dataset, ‘correctly’ detected edges were uniqueto each method (Fig. 6a). For instance, SCENIC detected 11edges that were present in the reference network, but noneof these 11 edges were detected from either SCODE orPIDC. This was the same for SCODE (26 ‘correct’ edges de-tected), and PIDC (17 ‘correct’ edges detected). This mayexplain why there was such low consistency amongst theedges identified by the methods, and the low predictionaccuracy when their intersect was examined. That is, thesesingle cell methods utilize completely different approaches,which did not reduce their performance largely bythemselves, but did reduce their prediction accuracy whenintersected edges were examined. This also supports thepossible explanation observed when evaluating the methodsbased on the community-based approach (Additional file 6:Figure S5), where a better prediction accuracy was seen bythe union of single cell methods, than the general methodsfor three out of four datasets. This result suggests thatsingle cell methods were able to detect ‘correct’ edges in aunique manner, which also suggests the importance ofa community-based method for better overall networkprediction.It is possible that this inconsistency in overlap may be
due to the fact that the reference network does not ac-curately reflect the true GRN controlling the cells ofinterest in this comparative study. This can be under-stood by considering that the PPIs used to make up thereference networks were derived from a variety of infor-mation sources that reflect a diversity of experimentaldesigns, cell types, and developmental stages that weredifferent from the variables in our study. This thereforerepresents a significant limitation to those results thatare based on comparisons with the reference networkbecause it represents a much broader GRN whereas thetwo datasets were generated from stem cell populations,and likely to be governed by a more specific set of regu-latory interactions. It is worth highlighting that the refer-ence network was derived mainly from genome-wideassays whereas the Fluidigm datasets represent only lim-ited numbers of genes that were profiled.Also, 48 and 78 potential interactions in the ESC and
HSC datasets respectively, were detected by all generalmethods, and 17 potential interactions in the HSC weredetected by all single cell methods. These edges, how-ever, did not exist in the reference network and thereforewould be automatically discounted as false positives.This result suggests that some indirect interactions are
consistently detected by these methods, or some interac-tions genuinely exist in these datasets but have not yetbeen observed in the reference networks, especially forthe single cell experiments. We also acknowledge thatthe fact that the overlap between the three methods waslarger for the HSC dataset than the ESC dataset, may bedue to the larger sample size for the HSC dataset, whichmay give rise to a more consistent, stable predictionproblem by the different network methods.
Investigating the similarity of interactions show thatthere is no consistent clustering of any of the learnednetworks from the different methodsTo gain a clearer understanding of which methods may infernetworks with greater topological similarity, we appliedPrincipal Component Analysis (PCA) to assess networksimilarity for each of the datasets. The rationale of this ana-lysis is to investigate whether methods that are based onsimilar principles might infer networks with similar edgedetection patterns, which is measured by the rankings basedon the edge weights. For instance, since ARACNE, CLR andPIDC are methods based on measuring MI, we wanted totest if they all assigned higher weights to the same set ofedges and reconstruct networks with similar structures. Toconduct this comparison, a vector of the length equal to the
number of potential interactions with N nodes, (NðN−1Þ2 ) was
assigned with ranks based on the possibility to be detectedusing that method (see Methods). This analysis was basedonly on the learned networks, and was independent of thereference networks. No significant clusters were apparent inthe PCA plots for any of the four datasets (Fig. 7). Formethods such as ARACNE and CLR, where we expectedthe learned networks to be similar to each other, these didnot always correspond to the closest points to each other inPCA-space in the four plots (Fig. 7). SCODE, which was thebest performer for the simulated datasets, has totally differ-ent network prediction pattern compared to all others. Thisresult provides further evidence that despite similarity inmathematical rationale, the performance of ARACNE andCLR are data-specific.
The degree distributions of the reconstructed networksshow different underlying features based on knowntopologies from the single cell dataAnother approach to evaluating similarity in network top-ologies is to compare the degree distributions to knowntheoretical graph structures (Additional file 7: Figure S6).We compared the degree distributions obtained from thelearned networks and the reference network, and to twotheoretical distributions, the random graph, and thescale-free topology network. Scale-free topology is a net-work structure that has features of heavy tails and peaksat the point close to zero. In addition to social networks,
Chen and Mar BMC Bioinformatics (2018) 19:232 Page 15 of 21

many large biological networks have been reported to followa scale-free topology structure. A random graph is anothertype of simple network structure where the degree distribu-tion follows a Bernoulli distribution. We found that in thesimulated data, the reference network was in close agree-ment with the theoretical network for scale-free topologies(Additional file 7: Figure S6C and D). The consistencybetween scale-free topology and the reference network canbe explained by the fact that the simulation datasets weresubtracted from a real biological network of E. coli, whichmight have a structure that follows the scale-free topologynetworks. By contrast, for the HSC and ESC datasets(Additional file 7: Figure S6A and B), the reference networksdid not overlap with either of these two theoretical distribu-tions, and instead represented a mixture of the two features.For all four datasets, the BN was more likely to learn net-works with higher degree, compared to other methods, andresembled the random network structures. This resultfurther supports the finding that the underlying networktopologies are different for the reference network and
networks learned from single cell data, suggesting that moreoptimal reference-based networks need to be generated andmade available for more reliable evaluation of networkperformance.
DiscussionThis study investigated whether any of the fivecommonly-used network methods were suitable forreconstructing networks from single cell gene expres-sion data, and if three newly-developed single cellspecific network methods would have better perform-ance for predictions. Evaluating the quality of thereconstructed network is challenging due to the factthat inferring networks is a computationally demandingtask to which no single solution exists and thereforethere are many ad hoc variations on how to identifynetwork interactions. The evaluation is further compli-cated by the fact that in genetics, regulatory networksare never identified comprehensively, and therefore thebenchmarks that are used to evaluate the reconstructed
a b
c d
Fig. 7 Investigating the similarity of the networks produced by the seven network methods. The PCA plots indicate how much each method issimilar to each other in terms of edge detection ranking. We show that there is no consistency in the clustering of these methods, and anysimilarities amongst them vary based on the datasets. SCODE was notably a consistent outlier amongst all the methods
Chen and Mar BMC Bioinformatics (2018) 19:232 Page 16 of 21
network are always inherently incomplete. Moreover, thereference networks we do have are obtained through ahost of experimental variables, e.g. technology platforms,cell lines, primary cell types, environmental conditions,and other factors, that most certainly affect the relevanceor specificity for subsets of interactions in the referencenetworks. Until we have amassed enough data to resolvethe contributions of these different factors definitively, anycomparison to reference networks is only ever an approxi-mation under the best circumstances. To offset the limita-tions associated with the reference networks, it wasnecessary to not rely solely on this comparison to conductthe evaluation. Therefore, it was important to generate insilico data from known networks as an additional way toevaluate the network reconstruction methods for singlecell data.The results from the DREAM5 network prediction
competition [41] suggested that methods for inferringGRNs are specific to certain types of data, and there wasno one stand-out method that performed the strongestfor all types of data. In our study, similar trends wereobserved where we concluded that there was no onemethod that performed significantly better than any ofthe others for all of the datasets under the comparisonsconducted. Rather, more significantly, most of themethods in our evaluation performed relatively poorlyfor all datasets, at a level that was close to, if not worsethan, a random guess. Overall, these results suggest thatthe reconstruction of networks from single cell data isnot reliable or accurate for most of methods tested.The inability to construct networks reliably for single
cell gene expression data may be the result of thedistinct features associated with single cell data thatmake it more challenging with existing networkmethods. Assumptions underlying five general methods(e.g. Normality distributions of the data) may not besuitable for single cell expression data. For single cellnetwork methods, one method may only be able to iden-tify particular interactions between the genes, whileneglecting others. The poor performance could also bethe result of the fact that reference networks are nottruly representative of relevant interactions occurring insingle cell biology. For single cell experimental data, thetrue network is unknown, and a protein-protein associ-ation database obtained from previous research does notnecessarily reflect the true scenario in single cells.Therefore there might be a large number of false posi-tives in the reference network itself, i.e., no genuineinteraction is observed in the true single cell state, eventhough it may have been detected in previous experi-mental conditions and therefore is present in the refer-ence network. These possible reasons all support arationale for further investigation into the developmentof network methods that are specifically optimized for
single cell gene expression data, as well as access tomore accurate resources for network evaluation andvalidation.As mentioned, evaluating the performance of each
method using simulated datasets is a straightforwardprocess, since we know the underlying network. By con-trast, finding a clear benchmark to evaluate performancefor single cell experimental data is harder since a genu-ine “gold standard” reference does not yet exist. In thisstudy, we tried to incorporate a “bronze standard” inorder to compare the network methods but it is criticallyimportant for a control reference network for single cellsto be generated for the field to move forward. The refer-ence networks were extracted from the STRING data-base, where any gene pair was included as an edge in thereference networks and not limited to single cells or theHSCs, ESCs or cell types that represented a specific dataset of interest. In this way, it might be expected that alarger number of false negatives and true positives areseen from the learned networks than the true case, andoverall the use of the PPIs as a reference network maybe insufficient as an accurate benchmark for networkreconstruction.Because of the limitations associated with the refer-
ence network, we placed more emphasis on the preci-sion of each method in the network comparisons.Specifically, we were interested in assessing how manyof the edges that were detected were actually in the ref-erence network (i.e. reported before in the literature), ra-ther than detecting what percentage of the interactionsin the reference networks were recovered. Hence, theuse of the PR curves was a more appropriate metric forour evaluation. Additionally, another advantage of usingPR curves is that they can more readily reflect distinctfeatures of the data. For instance, the major differencebetween Sim1 vs. Sim2, as well as ESC vs. HSC, is theratio between sample size and the number of genes inthe dataset. In Sim1 datasets, the total number of genesis 100, and hence the number of potential edges is 4950,or 100 choose 2. Therefore, the ratio between the num-ber of true connections in the reference network and thetotal combination of two nodes is lower than those ofSim2, which is 45, or 10 choose 2, suggesting that theremay be difficulties in general for making predictionswith so many options. This can be seen in the baselinelevel of PR curve that is far lower for ESC and Sim1,than the baseline for HSC and Sim2 (Figs. 2c and d, 3cand d). This trend is masked in the ROC curves andcannot readily be identified. For the ROC curves, the di-agonal line reflects the baseline, but it is clearly the samefor all datasets (Figs. 2a and b, 3a and b) irrespective ofthe underlying experimental design.Of note, GENIE3 showed far better performance than
other general methods for the Sim2 dataset in the case
Chen and Mar BMC Bioinformatics (2018) 19:232 Page 17 of 21

when artificial drop-out was removed from the simulateddata (Additional file 4: Figure S3). This strong perform-ance observed for ‘bulk’ simulated data was consistentwith the previous results from the DREAM challenges,where GENIE3 was the best performer on the in silicodata [31]. Therefore, in both the DREAM challenge andthis study, it is clear that GENIE3 is a suitable approachfor the simulated datasets, when bulk sample gene ex-pression data is considered for network reconstruction.In our comparison, however, with induced drop-out in-cluded, the performance of GENIE3 was severely af-fected in ways that were apparent for the Sim2 dataset,where the AUROC score fell below 0.5 (AUROC =0.425, Fig. 2). This is not surprising, given the fact thatmethods like GENIE3, although robust for bulk samplegene expression datasets, were not specifically designedfor datasets with such high rates of zero values, as inthe case of single cell data. For Sim1 data, the differ-ence between ‘bulk’ and ‘single cell’ data are less signifi-cant, probably because the sample size affected theperformance of these methods. This further highlightsthe importance of using data generated by large samplesizes to derive the most accurate network inferencepossible.Out of all the methods, SCODE obtained the highest
score in general for the simulated datasets (ranked asthe best performer for both Sim1 and Sim2, Figs. 2 and4). Significantly, we found that SCODE did not performwell when applied to single cell experimental data. Thisresult further emphasizes the data-specific performancefor each method, and that the utility of the methods de-pends on the study of interest. In particular, the strongperformance of SCODE for simulated data was not sur-prising, considering the similarity between the mechan-ism in which the simulated data was generated usingGNW, and the prediction algorithm used in SCODE(i.e., pseudotime is inferred from the static single celldata, and then the algorithm uses ODEs to describe themolecular dynamics based on the inferred time seriesdata). In addition, it also highlights the discrepancybetween using simulation data to study the performanceof network prediction, versus using real single cellexperimental data. Multiple reasons may exist to explainthis discrepancy, but the most relevant reason might bethat there are fundamental differences in the structureof single cell data that cannot yet be captured by simu-lated data. This is evident by considering the data distri-butions that vary between experimental data andsimulated data, even after we imitate the simulated datato real data by inducing drop-out (Additional file 2: Fig-ure S2).The performance of the BNs was not stronger than
any of the other methods, except when it was appliedto the HSC dataset. BNs are known to require large
sample sizes to accurately learn the model structure.The results from our comparative study support thisobservation because HSC has the largest number ofcells (3934 cells) amongst the four datasets used inour comparison, and the BN was the best performeramongst all methods when applied to the HSC data-set. Although the Sim2 dataset (sample size of 1000cells) was generated to mimic the sample-gene ratioof the HSC dataset, again, without a clearer under-standing of the observed differences in the perform-ance for real data and simulated data, it is hard toexplain concretely why the BN method performedbetter for the HSC dataset but not the Sim2 dataset.Another explanation for the poor performance of BNscompared to other methods may also be due to thefact that BNs do not allow self-loops, which preventsBNs from predicting interactions that are genuinelyrepresented by this network structure. These limita-tions further highlight the need to consider methodsthat are appropriate to the study of interest. Assess-ment based only on prediction performance of thelearned network may not be an adequate test to fullyunderstand the utility of the network method.In this study, we did not limit the parameter for the
number of edges detected when using ‘out-of-the-box’setting network reconstructions. By doing so, we de-signed the study to be able to compare the moststraightforward networks that can be generated from‘default’ settings of the algorithms, as these are mostlikely to be produced by a typical user. At the same time,there are two potential limitations that should be con-sidered when comparing the results from this study.First, some of the network methods do not have internalthresholds to determine the number of edges, in whichcase we had to specify a number and therefore used thenumber of edges predicted from the BN, as the max-imum number, for easier comparisons. Second, for somemethods, the ‘default’ parameter was not necessarily agood choice, which was made clear by the fact that forthe Sim2 dataset, ARACNE reconstructed afully-connected network. An alternative approach toovercome these limitations, and potentially facilitate aneasier comparison, is to fix the total number of predictededges, so that all the reconstructed networks would havethe same number of edges. However, a critical questionthat this may raise is, how the fixed number of edges canbe defined given a particular number of cell samples andgenes? An ad hoc number is likely to bias the results, byproviding a setting that allows for stronger performanceby some methods over others. The rationale for this canbe seen from the diversity observed in the number ofedges detected by the different methods (Additional file5: Figure S4). Moreover, it is unrealistic that the numberof expected edges is known a priori for the network, and
Chen and Mar BMC Bioinformatics (2018) 19:232 Page 18 of 21

therefore a comparison done with fixed numbers for allmethods does not seem feasible.The decision to include BNs in the network methods
was motivated by the fact that BNs represent interac-tions between genes as probabilistic events. The ration-ale is that if BNs could learn the GRN accurately, thenit may be more informative to use conditional probabil-ities as a way to model single cell gene expression data,given the digital nature in which transcripts are pro-duced. BNs also allow for inferring directed interac-tions, and therefore may be more accurate and usefulfor perturbation studies involving single cells, such asknock-out or knock-in experiments, which were notaddressed in our study. Overall, modeling GRNs asprobabilistic interactions allows for multiple networkrepresentations for the one single cell dataset. This is anew paradigm for network biology, where traditionally,it is thought that one GRN represents a cellular pheno-type. Given the stochasticity of gene expression insingle cells, it is not implausible to consider one GRNwith multiple conditional probabilities that explains thevariability or heterogeneity of gene expression by ac-counting for different states that interactions betweengenes may operate through. Although BNs did not havestrong performance in this study, given the mathemat-ical framework of BNs, it seems likely that modifica-tions to this specific kind of network approach mayyield new methods to model single cell gene regulatorynetworks in ways that allow us to gain deeper insightinto how GRNs are controlled at the level of singlecells.When considering the mathematical rationale under-
lying the current set of single cell network methods,SCENIC is similar to GENIE3, PIDC is similar to theMI-based methods ARACNE and CLR, and SCODE issimilar to Pcorr and BN through its relationship to regres-sion modeling. But the probabilistic aspect of BNs is notwell-represented by any of the single cell methods cur-rently available. While standard BN software has previ-ously been applied to single cell data, such as BANJO forsingle cell RNA-sequencing data [45], there are manyopportunities in which steps within the BN method couldbe modified for single cells. For instance, there aretwo main stages of BN learning, the first being thestructural learning step, and the second is the param-eter learning step. The latter is where probabilistic in-teractions are inferred, and this is specifically wheremethodological innovations could be applied to bedirectly relevant to single cell gene expression data.In our study, we have used only one implementationof the BN, as a means to conduct comparisons withother network methods, but a potential source oftechnological advances exist for BNs for this special-ized problem of network reconstruction [46].
ConclusionsIn this study, we performed a comparison of eightnetwork algorithms to test their ability to reconstructnetworks from single cell gene expression data. In par-ticular, we included both general, popular networkmethods that were developed for bulk samples, as wellas three single cell-specific methods that were developedrecently. We found that single cell network inferencemethods do not necessarily have better performancethan general methods, and even for the method that per-formed well for simulated data (SCODE), it did not havea higher prediction accuracy than other methods for theexperimental single cell data. In addition, we found thatwhen applied to simulated data without drop-out,GENIE3 was the best performer amongst all generalmethods, while this did not generalize to the simulated‘single cell’ data where drop-out was induced. From thisstudy, we therefore conclude that for single cell data,either generated from experiments or simulations, thesenetworks methods had consistently poor performancefor reconstructing networks.Not surprisingly, the networks reconstructed from
these methods had features that were distinct fromeach other. The two general methods using mutual in-formation detected far more edges in the network thanmethods based on other approaches. Community-baseddetection accuracy was higher for single cell methods,than general bulk sample methods, and the edges iden-tified by each of the methods from the same datasetswere different. Assessment of the overlap of the de-tected edges indicate that most of the methods canlearn edges that are specific to the method. Lastly, thePCA analysis shows that SCODE had a distinct patternof prediction, while even the presumably similarmethods (e.g., ARACNE and CLR are considered to besimilar) did not consistently cluster together in theplots, indicating that their network topology was notnecessarily more similar to each other than the othermethods.For the first time, this study provided a comprehensive
assessment of the five common network reconstructionalgorithms, as well as three new single cell networkreconstruction algorithms, for single cell gene expressiondata. Reconstructing GRNs from gene expression datahas been one of the most important topics in systemsbiology. Therefore, evaluating the performance of exist-ing algorithms and understanding their limitations whenapplied to a newer wave of data, such as single cell geneexpression data, is extremely helpful to facilitate furtherdevelopment of new methodologies that are specific forsingle cells. Such models would further provide new op-portunities to understand cell-to-cell heterogeneity, andother biologically interesting questions such as stem celldifferentiation and cancer development.
Chen and Mar BMC Bioinformatics (2018) 19:232 Page 19 of 21

Additional files
Additional file 1: Figure S1. Simulation parameters using GNW togenerate simulated datasets, Sim1 (top) and Sim2 (bottom). For Sim1, wesampled 101 times points (the first time point at t = 0 was not used)from a series of time series data, with other parameters kept the same asthe ones used in the DREAM4 challenge, and eventually obtained S = 100.For Sim2, we sampled 11 time points (the first time point at t = 0 was notused) from 100 series of time series data, with the other parameters keptthe same as the ones used in the DREAM4 challenge, and eventuallyobtained S = 1000. (PDF 347 kb)
Additional file 2: Figure S2. Data distributions of the single cellexperimental and simulated datasets. The two experimental datasetsshowed evidence of zero-inflation which is a typical feature of single cellgene expression data (A & B). For the simulated datasets (C & D), zerovalues were added according to a probablistic scheme for drop-outevents as per experimental single cell data. The simulated datasets (C &D) still have notable differences in the data distributions compared to thereal single cell experiment data (A & B), despite the underlying mechanismsdesigned to mimic features of the single cell data. (PDF 383 kb)
Additional file 3: Table S1. Summary of metrics used to evaluateperformance of each method. (DOCX 19 kb)
Additional file 4: Figure S3. ROC (top) and PR (bottom) curves forgeneral methods applied to the Sim2 datasets without the drop-outeffect. To examine whether poor performance observed was due to themethods, or the complexity of the datasets, we used the Sim2_bulkdataset (Sim2 without inducing drop-out). From both AUROC and AUPRscores, all five methods had improved performance on the Sim2_bulkdataset compared to the performance on Sim2 data where drop-out wasincluded. (PDF 180 kb)
Additional file 5: Figure S4. Variable numbers of edges (and truepositives) were detected for each method from the four datasets. Eachbar represents the total number of edges detected (colored bar) and thenumber of True Positives (TPs) among them (white bar) when using thedefault setting of each method to apply for each dataset. The totalnumber of edges detected varies widely for each method, and ARACNEand CLR detected far more edges than the reference networks and othermethods. For the Sim2 dataset, ARACNE recovered a fully-connectednetwork. (PDF 272 kb)
Additional file 6: Figure S5. Comparison of community-detectednetwork by bulk sample network methods versus single cell networkmethods. For general methods (or ‘bulk’ methods), we obtained theunion of edges from Pcorr, BN and GENIE3, and compared how thisunion network overlaps with the reference network. For single cellmethods, we applied the same comparison by obtaining the union ofSCENIC (included only for the ESC and HSC data), SCODE and PIDC. Forthree out of the four datasets, the union of the single cell methods had ahigher recovery rate than the union of general methods. (PDF 194 kb)
Additional file 7: Figure S6. Degree distributions of the learnednetworks (from Pcorr, BN, GENIE3, SCODE and PIDC), reference networks,and theoretical distributions of random graph and scale-free network.The network models were learned using default settings, and degreedistributions were represented as density plots. Theoretical models ofrandom graphs and scale-free network were generated for each dataset. Forthe simulated datasets, reference networks overlapped relatively well withnetworks with the theorectical scale-free network (C & D), while for single celldatasets, the reference networks had much wider distributions. (PDF 745 kb)
AbbreviationsARACNE: Algorithm for the Reconstruction of Accurate Cellular Networks;AUC: Area under the curve; AUPR: Area under the PR curve; AUROC: Areaunder the ROC curve; BIC: Bayesian Information Criterion; BN: Bayesiannetwork; CLR: Context Likelihood of Relatedness; DPI: Data ProcessingInequality; E. coli: Escherichia coli; ESC: Embryonic stem cell; FPR: False positiverate; GENIE3: GEne Network Inference with Ensemble of Trees;GNW: GeneNetWeaver; GRN: Gene regulatory network; HSC: Hematopoieticstem cell; MI: Mutual Information; ODE: Ordinary Differential Equation;PCA: Principal component analysis; Pcorr: Partial correlation; PID: Partial
Information Decomposition; PIDC: Partial Information Decomposition andContext; PPI: Protein-protein interaction; PR: Precision-recall; ROC: Receiveroperating characteristic; SCENIC: Single-Cell rEgulatory Network Inferenceand Clustering; SCNS: Singe-cell network synthesis; Sim1: Simulation 1 (seeTable 1); Sim2: Simulation 2 (see Table 1); TPR: True positive rate
AcknowledgementsWe acknowledge the advice and support of Keisuke Ito, Kyoko Ito, and SamuelZimmerman.
FundingSC was funded by a NYSTEM training grant (C030292GG). JCM was supportedby a grant from NYSTEM (C029154).
Availability of data and materialsThe experimental datasets are publicly available, with details contained inthe references cited. Simulated datasets are available upon email request.
Authors’ contributionsSC completed the analysis. JCM derived the study. Both authors co-wrotethe manuscript. Both authors read and approved the final manuscript.
Ethics approval and consent to participateNo ethics approval was required for the study. All input data are publiclyavailable through the citations supplied.
Consent for publicationNot applicable.
Competing interestsThe authors declared that they have no competing interests.
Author details1Department of Systems and Computational Biology, Albert Einstein Collegeof Medicine, Bronx, New York, USA. 2Department of Epidemiology andPopulation Health, Albert Einstein College of Medicine, Bronx, New York,USA. 3Australian Institute for Bioengineering and Nanotechnology, Universityof Queensland, Brisbane, QLD, Australia.
Received: 28 October 2017 Accepted: 24 May 2018
References1. Buganim Y, et al. Single-cell expression analyses during cellular
reprogramming reveal an early stochastic and a late hierarchic phase. Cell.2012;150(6):1209–22.
2. Lin P, Troup M, Ho JW. CIDR: ultrafast and accurate clustering throughimputation for single-cell RNA-seq data. Genome Biol. 2017;18(1):59.
3. Azizi E, et al. Bayesian inference for single-cell clustering and imputing.Genomics and Computational Biology. 2017;3(1):e46. https://genomicscomputbiol.org/ojs/index.php/GCB/article/view/46.
4. Finak G, et al. MAST: a flexible statistical framework for assessingtranscriptional changes and characterizing heterogeneity in single-cell RNAsequencing data. Genome Biol. 2015;16(1):278.
5. Korthauer KD, et al. A statistical approach for identifying differentialdistributions in single-cell RNA-seq experiments. Genome Biol. 2016;17(1):222.
6. Dal Molin A, Baruzzo G, Di Camillo B. Single-cell RNA-sequencing: assessmentof differential expression analysis methods. Front Genet. 2017;8:62.
7. Jaakkola MK, et al. Comparison of methods to detect differentially expressedgenes between single-cell populations. Brief Bioinform. 2017;18(5):735–43.
8. Kharchenko PV, Silberstein L, Scadden DT. Bayesian approach to single-celldifferential expression analysis. Nat Methods. 2014;11(7):740–2.
9. Vallejos CA, Marioni JC, Richardson S. BASiCS: Bayesian analysis of single-cellsequencing data. PLoS Comput Biol. 2015;11(6):e1004333.
10. Qiu X, et al. Single-cell mRNA quantification and differential analysis withcensus. Nat Methods. 2017;14(3):309–15.
11. Vu TN, et al. Beta-Poisson model for single-cell RNA-seq data analyses.Bioinformatics. 2016;32(14):2128–35.
12. Guo M, et al. SINCERA: a pipeline for single-cell RNA-Seq profiling analysis.PLoS Comput Biol. 2015;11(11):e1004575.
Chen and Mar BMC Bioinformatics (2018) 19:232 Page 20 of 21

13. Pierson E, Yau C. ZIFA: dimensionality reduction for zero-inflated single-cellgene expression analysis. Genome Biol. 2015;16:241.
14. Leng N, et al. Oscope identifies oscillatory genes in unsynchronized single-cell RNA-seq experiments. Nat Methods. 2015;12(10):947–50.
15. Delmans M, Hemberg M. Discrete distributional differential expression(D3E)–a tool for gene expression analysis of single-cell RNA-seq data. BMCBioinformatics. 2016;17:110.
16. Trapnell C, et al. The dynamics and regulators of cell fate decisions are revealedby pseudotemporal ordering of single cells. Nat Biotechnol. 2014;32(4):381.
17. Campbell KR, Yau C. Order under uncertainty: robust differential expressionanalysis using probabilistic models for pseudotime inference. PLoS ComputBiol. 2016;12(11):e1005212.
18. Specht AT, Li J. LEAP: constructing gene co-expression networks for single-cell RNA-sequencing data using pseudotime ordering. Bioinformatics. 2017;33(5):764–6.
19. Guo J, Zheng J. HopLand: single-cell pseudotime recovery using continuousHopfield network-based modeling of Waddington's epigenetic landscape.Bioinformatics. 2017;33(14):i102–9.
20. Reid JE, Wernisch L. Pseudotime estimation: deconfounding single cell timeseries. Bioinformatics. 2016;32(19):2973–80.
21. Fiers M, et al. Mapping gene regulatory networks from single-cell omicsdata. In: Brief Funct genomics; 2018.
22. Lim CY, et al. BTR: training asynchronous Boolean models using single-cellexpression data. BMC Bioinformatics. 2016;17(1):355.
23. Ghazanfar S, et al. Integrated single cell data analysis reveals cell specificnetworks and novel coactivation markers. BMC Syst Biol. 2016;10(5):11.
24. Matsumoto H, et al. SCODE: an efficient regulatory network inferencealgorithm from single-cell RNA-Seq during differentiation. Bioinformatics.2017;33(15):2314–21.
25. Hu G, et al. Single-cell RNA-seq reveals distinct injury responses in differenttypes of DRG sensory neurons. Sci Rep. 2016;6:31851.
26. Biase FH, Cao X, Zhong S. Cell fate inclination within 2-cell and 4-cellmouse embryos revealed by single-cell RNA sequencing. Genome Res.2014;24(11):1787–96.
27. Pina C, et al. Single-cell network analysis identifies DDIT3 as a nodal lineageregulator in hematopoiesis. Cell Rep. 2015;11(10):1503–10.
28. Hochberg Y, Benjamini Y. More powerful procedures for multiplesignificance testing. Stat Med. 1990;9(7):811–8.
29. Scutari M. Learning Bayesian networks with the bnlearn R package. arXivpreprint arXiv. 2009;0908:3817.
30. Irrthum A, Wehenkel L, Geurts P. Inferring regulatory networks fromexpression data using tree-based methods. PLoS One. 2010;5(9):e12776.
31. Greenfield A, et al. DREAM4: combining genetic and dynamicinformation to identify biological networks and dynamical models. PLoSOne. 2010;5(10):e13397.
32. Margolin AA, et al. ARACNE: an algorithm for the reconstruction of generegulatory networks in a mammalian cellular context. BMC bioinformatics.2006;7(Suppl 1):S7.
33. Paninski L. Estimation of entropy and mutual information. Neural Comput.2003;15(6):1191–253.
34. Faith JJ, et al. Large-scale mapping and validation of Escherichia colitranscriptional regulation from a compendium of expression profiles. PLoSBiol. 2007;5(1):e8.
35. Aibar S, et al. SCENIC: single-cell regulatory network inference andclustering. Nat Methods. 2017;14(11):1083–6.
36. Chan TE, Stumpf MPH, Babtie AC. Gene regulatory network inferencefrom single-cell data using multivariate information measures. Cell Syst.2017;5(3):251–67. e3
37. Williams PL, Beer RD. Nonnegative decomposition of multivariateinformation. arXiv preprint arXiv. 2010;1004:2515.
38. Moignard V, et al. Decoding the regulatory network of early blooddevelopment from single-cell gene expression measurements. NatBiotechnol. 2015;33(3):269–76.
39. Szklarczyk D, et al. STRING v10: protein–protein interaction networks,integrated over the tree of life. Nucleic Acids Res. 2014;43(D1):D447–52.
40. Schaffter T, Marbach D, Floreano D. GeneNetWeaver: in silico benchmarkgeneration and performance profiling of network inference methods.Bioinformatics. 2011;27(16):2263–70.
41. Marbach D, et al. Wisdom of crowds for robust gene network inference. NatMethods. 2012;9(8):796–804.
42. Bellot P, et al. Netbenchmark: a bioconductor package for reproduciblebenchmarks of gene regulatory network inference. BMC bioinformatics.2015;16(1):312.
43. Csardi G, Nepusz T. The igraph software package for complex networkresearch. InterJournal, Complex Systems. 2006;1695(5):1–9.
44. Barabási A-L, Albert R. Emergence of scaling in random networks. science.1999;286(5439):509–12.
45. Papatsenko D, et al. Single-cell analyses of ESCs reveal alternativepluripotent cell states and molecular mechanisms that control self-renewal.Stem cell reports. 2015;5(2):207–20.
46. Woodhouse S, et al. Processing, visualising and reconstructing networkmodels from single-cell data. Immunol Cell Biol. 2016;94(3):256–65.
47. Gama-Castro S, et al. RegulonDB version 7.0: transcriptional regulation ofEscherichia coli K-12 integrated within genetic sensory response units(Gensor units). Nucleic Acids Res. 2010;39(suppl_1):D98–D105.
Chen and Mar BMC Bioinformatics (2018) 19:232 Page 21 of 21