evaluating oklahoma 21 century community learning centers
TRANSCRIPT

Evaluating Oklahoma 21st Century
Community Learning Centers
2019-2020 Report to the Oklahoma State
Department of Education
December 2020

2019-2020 OSDE 21st CCLC Evaluation Report Page | 2
Evaluating Oklahoma 21st Century Community Learning Centers
2019-2020 Report to the Oklahoma State Department of Education
Prepared by:
The David P. Weikart Center for Youth Program Quality
A unit of the Forum for Youth Investment
7064 Eastern Avenue, NW
Washington, DC 20012
Phone: 734.961.6900
www.cypq.org
This report provides a comprehensive overview of the previous detailed Network and site-level data
summaries provided to the Oklahoma State Department of Education during the 2019-2020
program year.
2019-2020 Site and Network Survey Data Summaries, delivered August 21, 2020
2019-2020 SAPQA and YPQA Network and Site Reports available in Scores Reporter

2019-2020 OSDE 21st CCLC Evaluation Report Page | 3
Table of Contents
Program Background .............................................................................................................................. 4
Evaluation Design ................................................................................................................................... 7
Performance Measures ........................................................................................................................... 9
Program Quality Assessment .............................................................................................................. 9
Annual Performance Reporting ....................................................................................................... 10
Leading Indicator Surveys ................................................................................................................ 10
Evaluation Sample ................................................................................................................................ 11
Evaluation Results ................................................................................................................................11
Instructional Quality .............................................................................................................................. 11
Implementation Quality ........................................................................................................................ 15
Intentional Recruitment ................................................................................................................... 15
YPQI Fidelity ...................................................................................................................................... 16
External Relationships ..................................................................................................................... 17
Engagement .......................................................................................................................................... 17
Program Activities ............................................................................................................................. 17
Program Attendance ........................................................................................................................ 18
Family Engagement .......................................................................................................................... 19
Skill Development ................................................................................................................................. 20
Conclusions and Recommendations ....................................................................................................21
Appendix A: Annual Performance Report (APR) Requirements for Data Collection .............................23
Appendix B. Leading Indicator Framework ...........................................................................................24

2019-2020 OSDE 21st CCLC Evaluation Report Page | 4
Program Background
During the 2019-2020 program year, The Oklahoma State Department of Education (OSDE)
delegated more than $14.5 million of federal funds to 21st Century Community Learning Center
(CCLC) programming.1,2 In the 2019-2020 program year, the OSDE network funded 58 grantees,
representing 112 different sites/centers across the state.
OSDE 21st CCLC funding is awarded to applicants whose main goals are to:
1. Provide opportunities for academic enrichment, including providing tutorial services to help
students meet the challenging state academic standards;
2. Offer students a broad array of additional services, programs and activities designed to
reinforce and complement the regular academic program; and
3. Offer participating students’ families opportunities for active and meaningful engagement in
their children’s education, including opportunities for literacy and related educational
development.
OSDE 21st CCLC programs operate on the evidence-based premise that frequent, regular
attendance in high-quality out-of-school time programs (Quality) leads to program engagement
(Engagement), and to the acquisition of essential 21st Century skills (Skills), which in turn contribute
to greater success in college, career, and life (Transfer). The Quality-Engagement-Skills-Transfer
model is called QuEST (Figure 1).
Figure 1. QuEST Model
1 Authorized under Title IV, Part B, of the Elementary and Secondary Education Act (ESEA), as amended by Every Student
Succeeds Act (20 U.S.C. 7171-7176) 2 Data retrieved from https://www2.ed.gov/about/overview/budget/statetables/index.html
Transfer: Application of skills/beliefs in
new settings
Time & Practice in Setting: Multiple sessions Point-of-service session
Quality
Instruction,
Content
Engagement Behavior, Interest
with challenge,
developmental
experiences
Skill/Belief 21st Century Beliefs
and Behaviors
Transfer Outcomes School Success:
Achievement,
Behavior

2019-2020 OSDE 21st CCLC Evaluation Report Page | 5
Combined with the 21st CCLC Annual Performance Reporting requirements, the OSDE 21st
CCLC program framework begins with high-quality out-of-school-time programming (See Figure 2). If
students are provided high-quality programs (e.g. high-quality staff practices supported by strong
organizational capacity) then OSDE will see higher levels of youth attendance in the variety of
academic, enrichment, and family engagement activities offered. If activities offered are both high-
quality and engaging, then students will have more opportunities to improve the skills required to be
successful in the 21st century, such as social and emotional behaviors and academic efficacy, which
will prepare youth to be more confident and interested in school day content. These students will
then show up to the classroom ready to learn, leading them to greater gains in academic
performance and post-secondary success.
Figure 2. OSDE 21st CCLC program framework
Quality Engagement Skill Implied Transfer
Outcomes
Youth Program Quality
• Safe Environment
• Supportive Environment
• Interaction
• Engagement
Implementation Quality
• Staffing
• Intentional Recruitment
• YPQI Fidelity
- Assessment
- Planning with Data
- Improvement Plans
- Training
- Coaching
• Instructional Context
• External Relationships
Attendance
Academic Support
Enrichment Activities
Family Services &
Satisfaction
Homework
Completion
Social Emotional
Skills
Academic
Efficacy
Academic Outcomes
• English/Reading
• Math
College & Career
Readiness
In support of these objectives, OSDE has partnered with the David P. Weikart Center for
Youth Program Quality since 2009 to establish and implement the Youth Program Quality
Intervention (YPQI), a data-driven continuous improvement process centered on four core staff
practices. First, managers and staff are trained to use the Program Quality Assessment (PQA) that
aligns best with their program and coordinate self- and external assessments of instructional quality
at their sites. Next, staff participate in a Planning with Data workshop leaving them empowered with
a drafted improvement plan to implement changes to improve program quality at their site. Third,

2019-2020 OSDE 21st CCLC Evaluation Report Page | 6
managers and staff attend aligned trainings (e.g. Methods Workshops, Quality Coaching) to
strengthen skills and support quality practices. Finally, managers and other identified coaches
provide technical assistance and ongoing support to program staff.3,4 The YPQI process embeds a
culture of continuous assessment, planning, and improvement in program quality (Figure 3).
Figure 3. Youth Program Quality Intervention
As shown in Table 1, the 2019-2020 program year began with an OSDE-hosted Showcase
and New Grantee orientation in September to establish expectations and timelines for the year and
reflect on and celebrate successes from the previous year. In October, all staff completed training on
the Program Quality Assessment, with new staff participating in PQA Basics and returning staff
completing PQA Plus. From November 7 – December 6, 2019, all sites were expected to complete a
self-assessment using the Youth and School-Age PQA’s to collect objective data about staff-youth
interactions within programs at each site. Year 2 and 3 sites were also expected to complete an
external assessment. In January 2020, sites participated in a Planning with Data workshop to review
their program strengths and growth opportunities and subsequently submit a Program Improvement
Plan detailing goals, timelines, necessary resources, and staffing supports to achieve desired
improvements.
To support these goals, managers and staff had access to ongoing training opportunities
throughout the year to improve targeted instructional skills. Youth Work Methods summits were
offered in November 2019 and scheduled for March 2020 to support identified program
improvements. Supplemented by ongoing technical assistance and embedded coaching supports
through take-it back agendas, these opportunities were made available to all participating programs
to reinforce continuous improvement practices.
3 Smith, C., Akiva, T., Sugar, S., Lo, Y. J., Frank, K.A., Peck, S. C., Cortina, K.S. & Devaney, T. (2012). Continuous quality
improvement in afterschool settings: Impact findings from the Youth Program Quality Intervention study, Washington, D.C.:
Forum for Youth Investment. 4 Smith, C., & Hohmann, C. (2005). Full findings from the youth program quality assessment validation study. Ypsilanti, MI:
High/Scope Educational Research Foundation.

2019-2020 OSDE 21st CCLC Evaluation Report Page | 7
Unfortunately, on March 13, 2020 the majority of in-school and afterschool programs
throughout the United States closed unexpectedly in response to the rising COVID-19 pandemic.
Many programs shifted quickly to provide emergency relief to youth and families struggling with food
insecurity. Staff were also able to participate in additional professional development opportunities
through their access to online Youth Work Methods. This abrupt change also disrupted data
collection efforts; participation in the staff and family surveys was limited, and all youth-centered
measures, including the survey and state assessments, were cancelled.
Table 1. 2019-2020 OSDE 21st CCLC Project Timeline
Activity Timeline Performance Measures
Summer Programming May 2019 – August 2019
Afterschool Programming August 2019 – May 2020*
Showcase and Orientation September 2019
Ongoing TA and Coaching September 2019-May 2020*
Annual Performance Reporting Summer: Varies per program
Fall: 8/1 – 12/31/2020
Spring: 1/1/2020 through end of
programming*
Attendance
Staffing
Academic, Enrichment
and Family Activities
Program Quality Assessments November 7 – December 6, 2019 Self and External YPQA
and SAPQA
Professional Development
PQA Basics/PQA Plus
Planning with Data
Youth Work Methods Summits
October 2019
January 2020
November 2019
March 2020*
Leading Indicator Surveys February 3 – April 24, 2019* Site Coordinator/ Grantee
Director
Afterschool Teacher/Youth
Workers
Youth
Family
Youth Outcomes August 2020* Reading and Math State
Assessments
Note: * Indicates activities that were disrupted and/or cancelled due to the emergence of COVID-19
in March 2020. These include afterschool programming, scheduled TA and coaching visits, spring
2020 APR data collection, March 2020 Youth Work Method Summit, Youth Surveys, and spring
2020 state assessments.

2019-2020 OSDE 21st CCLC Evaluation Report Page | 8
Evaluation Design
To assess the impact of OSDE 21st CCLC engagement, the partnership with Weikart has
included an annual evaluation that examines improvements in program quality, youth engagement in
academic and enrichment activities, and the development of 21st Century skills among participating
PreK-12th grade students. Throughout the year, the evaluation approach included steps to guide data
collection efforts across sites, as well as additional data summary reports to support staff in their
efforts to interpret the findings and apply these learnings to continuous improvement decisions. This
annual evaluation report expands on previous data reports by analyzing all data sources together
and examining the findings in relation to the Oklahoma 21st CCLC Statewide Goals and Objectives
(see Table 2).
Table 2. Oklahoma 21st CCLC Statewide Goals and Objectives
Goal 1: Improve both academic and non-academic outcomes for regularly attending participants.
Objective 1.1: Participants in the program will demonstrate increased performance on the State
Assessment Proficiency Tests in reading and mathematics.
Objective 1.2: Participants in the program will report higher levels of social and emotional
competency, increased skills in work habits, and in academic efficacy.
Goal 2: Promote a physically and emotionally safe place to attend and continual instruction to
promote healthy bodies, minds, and habits.
Objective 2.1: Grantees will consistently offer high-quality instructional programming, regardless
of content, as measured by the Youth PQA or School-Age PQA.
Objective 2.2: Grantees will provide high-quality activities in the core academic areas such as
reading and literacy, mathematics, and science.
Objective 2.3: Grantees will provide high-quality activities in enrichment areas such as nutrition
and health, art, music, technology.
Goal 3: Provide opportunities for parents and students to learn and connect with their community
together.
Objective 3.1: Grantees will establish and maintain partnerships and collaborative relationships
within the community to enhance participants’ access to a variety of opportunities.
Objective 3.2: Grantees will establish collaborative relationships that offer opportunities for
literacy and related educational activities to the families of participating students.
Objective 3.3: Grantees will maintain a high satisfaction rate among families served by the
program.
Goal 4: Build organizational capacity to deliver high-quality programming to all participants
attending 21st CCLC programming.
Objective 4.1: Grantees will identify students characterized as “at-risk” and actively recruit those
students to attend 21st CCLC programming.
Objective 4.2: Grantees will engage in the Youth Program Quality Intervention as a part of a
program quality improvement process.
Objective 4.3: Grantees will facilitate opportunities for communication between and among
center coordinators and direct staff working in the 21st CCLC programs.
Objective 4.4: Grantees will maintain a high job satisfaction rate among grantee directors, center
coordinators, and direct staff.

2019-2020 OSDE 21st CCLC Evaluation Report Page | 9
Performance Measures
Multiple data sources were collected from participating sites to evaluate the impact of OSDE
programs. Each site was scheduled to submit Program Quality Assessment (PQA) data, Grantee
Director/Site Coordinator, Afterschool Teacher/Youth Worker, Family and Youth surveys, as well as
youth participation, staffing, activities, family engagement and Reading and Math proficiency
assessment data in alignment with the Annual Performance Reporting requirements. Due to COVID-
19, fewer staff and family surveys were submitted in comparison to previous years, and youth
surveys and state assessments were cancelled.
Program Quality Assessment
The Program Quality Assessment (PQA) is a validated, observation-based instrument
designed to evaluate the quality of K-12 youth programs and identify staff training needs. PQA data
spans four domains of program quality: Safe Environment, Supportive Environment, Interaction, and
Engagement. Oklahoma 21st CCLC programs used both the School-Age PQA and the Youth PQA to
collect site performance data.
• The School-Age PQA is composed of 70 items
comprising 19 scales. The School-Age PQA is
appropriate for observing programs that serve youth
Kindergarten – 6th grades.
• The Youth PQA is composed of 63 items comprising
18 scales. The Youth PQA is appropriate for observing
programs that serve youth in 4th – 12th grades.
PQA data was collected for all sites as a self-assessment and for a select set of sites as
external assessment. To collect self-assessment data, an internal team was selected at each site to
observe staff practices using the PQA. After observations, the team had a scoring meeting to discuss
their notes and come to a consensus on the score for each item on the tool. OSDE recruited and
trained reliable assessors for second-and third-year grantees to hire for external assessment. Raters
received endorsement through a reliability training process in which they were required to reach 80%
agreement with the Weikart Center’s master scores on the PQA. Scores were entered into Scores
Reporter, a Weikart Center online data collection platform.
The primary purpose of the Program Quality Assessment is to measure Instructional Quality,
defined as the extent to which programs promote positive youth development through evidence-
Supportive Environment
Safe Environment
Engagement
Interaction

2019-2020 OSDE 21st CCLC Evaluation Report Page | 10
based staff practices implemented consistently across youth activities. Instructional Quality,
measured by the Instructional Total Score (ITS), is composed of ratings of staff practice at the point
of service, or when staff or youth interact during the program. The ITS is a composite score of three
out of the four quality domains: a structured environment facilitated through guidance and
encouragement (i.e., Supportive Environment), opportunities for leadership and collaboration (i.e.,
Interaction), and the capacity to promote planning and reflection (i.e., Engagement).
Annual Performance Reporting
The online federal data collection system (hereafter referred to as the Annual Performance
Reporting or 21APR System) was designed to collect required site operations data across seven key
program areas including: Centers, Activities, Staffing, Families, Participation and Outcomes, and
Program Attendance, outlined in alignment with the Government Performance and Results Act
(GPRA) Indicators (see Appendix A). To complete this data collection, grantees kept track of their
data using an Excel spreadsheet created by the Weikart Center. OSDE grantees submitted 21APR
data to the Weikart Center at three time points throughout the program year (summer, fall, and
spring) for input into the online 21APR platform in accordance with federally mandated deadlines.
Leading Indicator Surveys
Grantee Directors, Site Coordinators, Afterschool Teachers/Youth Workers, Families and
Youth were all invited to complete surveys to share feedback on their experience during the 2019-
2020 program year (See Table 3). Specifically, these surveys informed our understanding of
Organizational Context, Instructional Context, External Relationships, Youth Skills and Family
Satisfaction (See Appendix B for the complete Leading Indicators Framework). Online surveys were
created and administered via Qualtrics and electronic links for each were posted to Oklahoma 21st
CCLC’s webpage on the Weikart website (www.cypq.org/ok21cclc). Survey data collection for staff
and families launched on February 3, 2019. With the COVID-19 disruption, family and staff surveys
remained open through April 24, 2020, but the youth surveys were cancelled for the program year.
Table 3. 2019-2020 Leading Indicator Surveys
Survey Intended Audience Length
Site Coordinator/ Grantee Director Individual(s) responsible for site operations. 82 items
Afterschool Teacher/ Youth Worker Staff responsible for providing direct
programming to youth. 65 items
Family All parents/guardians of youth attending the
afterschool programs (regardless of youth age) 24 items
Youth Youth in grades 4 through 12 who attended the
afterschool programs5 40 items
5 Surveys are directed only at this age group because the survey method is not developmentally appropriate for children in
third grade or lower.

2019-2020 OSDE 21st CCLC Evaluation Report Page | 11
Evaluation Sample
For the 2019-2020 program year, data were collected from the 112 participating sites. All
sites submitted the required 21st CCLC annual performance data on program activities, family
services, and attendance to be reported to the US Department of Education each term (see Table 4).
PQA data, Grantee Director/Site Coordinator Survey data, and Afterschool Teacher/Youth Worker
Survey data was also submitted from the 106 sites that operated during the school year (See Table
5). Preliminary analyses showed no significant differences between Youth PQA and School-Age PQA
scores, and therefore all PQA data was collapsed to provide a larger sample size for analysis.
Table 4. 2019-2020 Available APR Data
% Participating Sites
Activities 100%
Staffing 100%
Family Services 100%
Participating Youth by Grade Pre-K – 5th 6th – 12th
Attendance 11,823 4,637
Table 5. 2019-2020 Available PQA and Survey Data # Submissions Site Response Rate
PQA External (2nd and 3rd Year Grantees Only) 39 100%
Self 106 100%
Surveys
Grantee Director/Site Coordinator/
Afterschool Teacher 433 77%
Family 1,226 61%
Evaluation Results
Instructional Quality
Over the past decade, research has proliferated the youth development field demonstrating
the significant relationship between high-quality programs and youth outcomes. Studies have shown
that youth programs with the highest instructional practices, meaning those that prioritize a safe
environment, supportive relationships, positive staff-youth interactions, and active learning principles
are more likely to promote youth engagement and attendance, which in turn promotes youth skill
development across multiple domains, such as academic, social-emotional, and behavioral skills.6
6 Durlak, J.A., & Weissberg, R.P. (2007). The impact of after-school programs that promote personal and social skills.
Chicago, Il: Collaborative for Academic, Social and Emotional Learning.

2019-2020 OSDE 21st CCLC Evaluation Report Page | 12
The 2019-2020 PQA data show that Grantees successfully achieved Objective 2.1 by
continuing to offer high-quality instructional programming. Looking at both external and self-
assessments (see Charts 1 and 2), all PQA domains received an average score of 3 or higher,
meaning that the majority of quality instructional practices were observed some of the time and/or
for some of the students. These results are consistent with previous results, such that instructional
practices within the Safe Environment and Supportive Environment domains were strongest, with
lower staff practices reported within the Interaction and Engagement domains. This pattern is
common among all YPQI networks as providing an interactive and engaging program environment for
youth requires an advanced set of staff practices and can be more difficult to achieve compared to
establishing a Safe and Supportive Environment.
Chart 1. 2018-2020 External PQA Domain Means
Chart 2. 2018-2020 Self PQA Domain Means
Interestingly, a comparison of external and self-assessment scores show both a different
perspective of quality for this program year and a different trend in change over time. The self-
assessment data suggests high consistency in instructional quality in comparison to last year.
Alternatively, external assessors reported a general decline in staff practices across the majority of
4.67 4.484.14
3.594.07
4.794.46
3.613.18
3.75
1
3
5
Safe Envrionment Supportive
Environment
Interaction Engagement Instructional Total
Score
2018-2019 2019-2020
4.794.33 4.29
3.754.12
4.714.37 4.20
3.764.11
1
3
5
Safe Envrionment Supportive
Environment
Interaction Engagement Instructional Total
Score
2018-2019 2019-2020

2019-2020 OSDE 21st CCLC Evaluation Report Page | 13
domains, most notably for Interaction and Engagement. While the difference in self- and external-
assessment scores is not surprising given how the assessments are conducted (e.g. self-assessment
scores are based on a consensus meeting, external assessors are required to pass reliability
training), this finding is stronger than differences identified in previous years, and suggests that
additional conversations to distinguish staff practices may benefit all sites and support a greater
shared understanding of high-quality programs across grantees. Given this significant difference
between external and self-assessment scores, as well as the limited sample size for external
assessments, the remaining analyses for this evaluation focused on self-assessment scores only.
Examining scale scores also provides an opportunity to identify specific strengths to be
celebrated and concrete improvement opportunities for targeted training and support. Similar to
domain scores, the self-assessment scale scores remained consistent with the previous year, with
noted improvements observed in Session Flow practices, Adult Partners, Planning and Reflection,
and declines in practices associated with Reframing Conflict and Collaboration (see Charts 3-6).
Chart 3. 2018-2020 Safe Environment Scale Means, Self-Assessment
Chart 4. 2018-2020 Supportive Environment Scale Means, Self-Assessment
Note: *YPQA only scales; **SAPQA only scales
4.85 4.874.52
4.85 4.844.78 4.814.42
4.75 4.80
1
3
5
Emotional Safety Healthy Environment Emergency
Preparedness
Accomodating
Environment
Nourishment
2018-2019 2019-2020
4.65 4.634.21
4.49
3.92
4.454.04
4.66 4.744.22
4.55
3.854.31 4.14
1
3
5
Warm Welcome Session Flow Active
Engagement
Skill Building Encouragement Reframing
Conflict*
Child-Centered
Space**
2018-2019 2019-2020

2019-2020 OSDE 21st CCLC Evaluation Report Page | 14
Chart 5. 2018-2020 Interaction Scale Means, Self-Assessment
Note: *YPQA only scales; **SAPQA only scales
Chart 6. 2018-2020 Engagement Scale Means, Self-Assessment
Note: **SAPQA only scales
A closer look at the range or spread of scores across sites also provides insights on network
strengths and growth areas. Scales where the network average was about a 4.5 were identified as
major strengths of OSDE 21st CCLC sites. Scales where every single site scored the item at a 3 or 5
were also flagged as possible ceiling effects, meaning additional improvements in these areas are
unlikely. With all scale scores averaging above a 3.0 consistently, opportunities for improvement
were selected by identifying individual items that received an average score around a 3.0 or below,
meaning that these practices occurred more informally than intentionally, and were not consistently
available for all youth across all sites.
Table 6. Program Quality Assessment Strengths and Opportunities
Strengths Opportunities for Improvement
Emotional Safety
Healthy Environment*
Accommodating Environment*
Nourishment*
Session Flow
Leadership
School-Age Planning
Reflection
*Identified as possible ceiling effects
4.30 4.38 4.33
3.784.14
4.744.37 4.36 4.18
3.61
4.384.67
1
3
5
Managing
Feelings**
Belonging Collaboration* Leadership Adult Partners* Interactions with
Adults**
2018-2019 2019-2020
3.06
3.873.52
4.53
3.38
3.873.64
4.43
1
3
5
Planning Choice Reflection Responsibility**
2018-2019 2019-2020

2019-2020 OSDE 21st CCLC Evaluation Report Page | 15
Implementation Quality
Consistent implementation of high-quality instructional practices across sites requires clarity
and support from Grantee Directors around YPQI expectations and available resources. Following the
US Department of Education requirement and additional guidance from the Oklahoma 21st CCLC
goals and objectives, grantees and sites were well informed and supported to implement all four
components of the YPQI intervention, with the intent to recruit students characterized as “at-risk”
and provide them a variety of engaging academic, enrichment and family engagement activities that
will support students’ readiness for academic success.
Survey data from Grantee Directors, Site Coordinators, Afterschool Teachers/Youth Workers
and Families was collected to examine staff implementation of the OSDE program model.
Complemented by APR data, survey responses about student recruitment, YPQI fidelity and External
Relationships was analyzed to confirm that OSDE programs had the necessary resources to provide
positive developmental experiences for all participating youth.
Intentional Recruitment
The Oklahoma statewide performance goals prioritize the need for sites to actively recruit “at-
risk youth” to participate in 21st CCLC programs. Grantees must serve students who attend school
sites eligible for Title 1 designation, meaning at least 40% of students at the school must qualify to
receive free or reduced-price meals through the National School Lunch Program. During the 2019-
2020 program year, all 112 sites achieved Objective 4.1 and served “at-risk” youth qualified to
receive free and reduced-price meals. While statewide only 59% of youth qualified for free and
reduced price meals, 84% of youth attending 21st CCLC programs received free and or reduced price
meals, showing that grantees were successful in recruiting the most at-risk youth to their programs
(see Chart 7). Similarly, Oklahoma 21st CCLC grantees served a greater proportion of American
Indian youth, a group of young people who on average experience greater academic, mental health
and behavioral challenges in comparison to their peers.7 Additionally, Grantee and site staff reported
that the majority of students were recruited to the program because they were not achieving
minimum performance standards on state assessment (87%) or course requirements (64%), and
would benefit from additional academic supports (76%).
Additional analyses were explored to examine the extent to which all youth had equal access
to quality 21st CCLC programs throughout Oklahoma. The results found no significant differences in
self-assessed program quality across demographic characteristics, meaning all participating youth in
Oklahoma had equal access to high-quality afterschool programming.
7 Fast Facts: Native American Youth and Indian Country (2016). The Center for Native American Youth at The Aspen
Institute. Retrieved from: https://www.cnay.org/resource-hub/fast-facts/

2019-2020 OSDE 21st CCLC Evaluation Report Page | 16
Chart 7. 2020 Student Demographics
YPQI Fidelity
Implementation fidelity requires that Grantee and site leaders establish clear policies and
procedures that create a supportive work environment for afterschool staff to deliver high-quality
programs. When staff were asked about their work environment, more than three-quarters reported
that supervisors check-in at least monthly to discuss program goals and priorities, as well as to
encourage staff to be innovative and try new ideas. This support translates into frequent staff
collaboration, with more than 80% of afterschool staff meeting monthly to problem solve program
practices and activities, meeting Objective 4.3 encouraging communication among staff and sites.
Building on this strong foundation, staff are prepared to engage in the four core staff
practices central to YPQI implementation: 1) Program Quality Assessment, 2) Planning with Data, 3)
Coaching, and 4) Training. Fulfilling objective 4.2, the majority of Grantee and site staff reported high
engagement in the YPQI process, confirming they participated in the assessment process, attended
trainings to support instructional practice and data use, and almost half received coaching during
the 2019-2020 program year (see Figure 2). Not only did most staff report the trainings received to
be very useful, but almost all Grantee Directors/Site Coordinators (98%) and Afterschool Teachers
(93%) reported they were highly satisfied with their job, successfully achieving Objective 4.4.
9%
17%
59%
2%
10%
8%
18%
13%
48%
6%
18%
84%
1%
7%
8%
9%
34%
42%
Limited English Proficiency
Individualized Education Program
Free and Reduced Lunch
Asian/ Pacific Islander
Two or More Races
Black/ African American
Hispanic/ Latino(a)
American Indian/ Alaskan Native
White
OK Public Schools OK 21st CCLC

2019-2020 OSDE 21st CCLC Evaluation Report Page | 17
Figure 2. Grantee and Site Staff Reports of YPQI Fidelity
External Relationships
Strong partnerships create opportunities for programs and students to build connections to
the local community. For 21st CCLC programs, it is essential to establish a collaborative relationship
with the local schools to ensure that students are receiving the types of supports needed to be
successful during the school day. More than two-thirds of Grantee and site staff reported attending
meetings to discuss linkages between the school day and program activities. Similarly, just over half
of Grantee and site staff surveyed reported participating in parent-teacher conferences to support
wrap-around connections between the school-day, afterschool program, and home environment,
successfully achieving Objective 3.1. The data suggest that additional efforts to strengthen
connections with local businesses may be a valuable avenue to support student’s community service
and awareness of local opportunities.
Engagement
The priorities of 21st CCLC funding are to provide students with academic and enriching
activities that will promote program attendance so that more skill development can occur within the
program and then transfer into school day success. Each term, staff reported on the different types
of academic and enrichment activities that were offered, youth attendance, and the various family
activities designed to deepen family engagement in student learning.
Program Activities
Focusing on the typical school year schedule, fall 2019 and spring 2020, the data show
strong support for Objectives 2.2 and 2.3, with almost all sites offering a variety of academic and
enrichment activities on a weekly basis. Chart 8 shows that academic supports such as homework
help, tutoring and literacy were offered most frequently, closely followed by enrichment programs like
physical activity, arts and music, and mentoring. In support of these program goals, the majority of
staff reported intentional efforts to provide students with new experiences (84%) and align academic
content with youth interests (86%) as well as expressed needs for academic support (79%). Similar
to previous years, character education programs such as drug, violence and truancy prevention
87% participated
in the assessment
process
71% attended Planning with Data
69%attended training to improve practice
49%received coaching supports
74%+ found each training very useful

2019-2020 OSDE 21st CCLC Evaluation Report Page | 18
activities were not as consistently available to OSDE 21st CCLC participants, with the majority of
those activities being offered once or twice a term, and most often during the summer term. On
average, activities lasted for 1-2 hours and typically 10-15 youth participated in each session, with
larger groups of youth participating in sessions offered less frequently.
Chart 8. 2020 School Year Program Activities Offered Once a Week or More
▪ Academic
Activities
▪ Enrichment
Activities
▪ Character
Education
▪ College & Career
Readiness
Program Attendance
For the desired program impacts to be achieved, youth must attend the program frequently
and consistently throughout the year.8 The 21st CCLC annual performance requirements track 30
day, 60 day and 90 day attendance patterns each term as indicators of student engagement. Given
the challenges experienced in spring due to COVID-19, attendance was recalculated for this analysis
to examine the percentage of days attended each term. For example, if a program were open 100
days and a student attended 80 days, they would have an attendance rate of 80%. During the
2019-2020 school year, the majority of participating students attended their program between 25%-
49% of the time, or the equivalent of 2-3 days per week (see Chart 9).
8 Vandell, D. L., Reisner, E. R., & Pierce, K. M. (2007). Outcomes Linked to High-Quality Afterschool Programs:
Longitudinal Findings from the Study of Promising Afterschool Programs. Policy Studies Associates, Inc.
2%
6%
7%
12%
17%
23%
39%
43%
47%
53%
79%
87%
92%
94%
97%
98%
Drug Prevention
Violence Prevention
Truancy Precention
Counseling Programs
Community/Service Learning
Entrepreneurship
Youth Leadership
College & Career Readiness
English Language Learners Support
Mentoring
Arts & Music
STEM
Physical Activity
Literacy
Tutoring
Homework Help

2019-2020 OSDE 21st CCLC Evaluation Report Page | 19
Chart 9. 2020 Average Program Attendance, by Term
Additional analyses were explored to examine the relationship between self-assessed
program quality and youth attendance. A statistically significant correlation between the Interaction
domain and attendance was found, meaning that programs with higher quality interaction practices
were also more likely to have greater youth attendance throughout the year (r(103)=.242, p<.05). In
particular, student attendance was more likely to be higher at programs that demonstrated strong
practices in Belonging (r(103)=.224, p<.05) and Collaboration (r(103)=.384, p<.05). These findings
align well with existing afterschool literature acknowledging the importance of friendships and
positive interactions with peers and adults to program satisfaction, and suggest that instructional
priorities around building community and cooperative learning would be especially beneficial for
programs seeking to improve youth attendance.9
Family Engagement
In addition to youth activities, sites were required to offer active and meaningful family
engagement opportunities in support of youth’s academic success. In support of Objective 3.2, 75%
of sites reported they provided family services throughout the year, with sites engaging an average of
71 families each. More than three-quarters of the families surveyed reported that they received
information at home and/or attend a program meeting at least monthly, and 83% of families agreed
that the program improved their connections to school day teachers and school content. Not
surprisingly, families also reported high levels of program satisfaction (see Chart 10). Fulfilling
9 Hansen, D. M., Larson, R. W., & Dworkin, J. B. (2003). What adolescents learn in organized youth activities: A
survey of self‐reported developmental experiences. Journal of research on adolescence, 13(1), 25-55.
17% 14%24%
28%44%
48%
26%
35%
22%30%
8% 6%
Summer Fall Spring
Less than 25% 25-49% 50-74% 75-100%
2019-2020 OSDE 21st CCLC Evaluation Report Page | 20
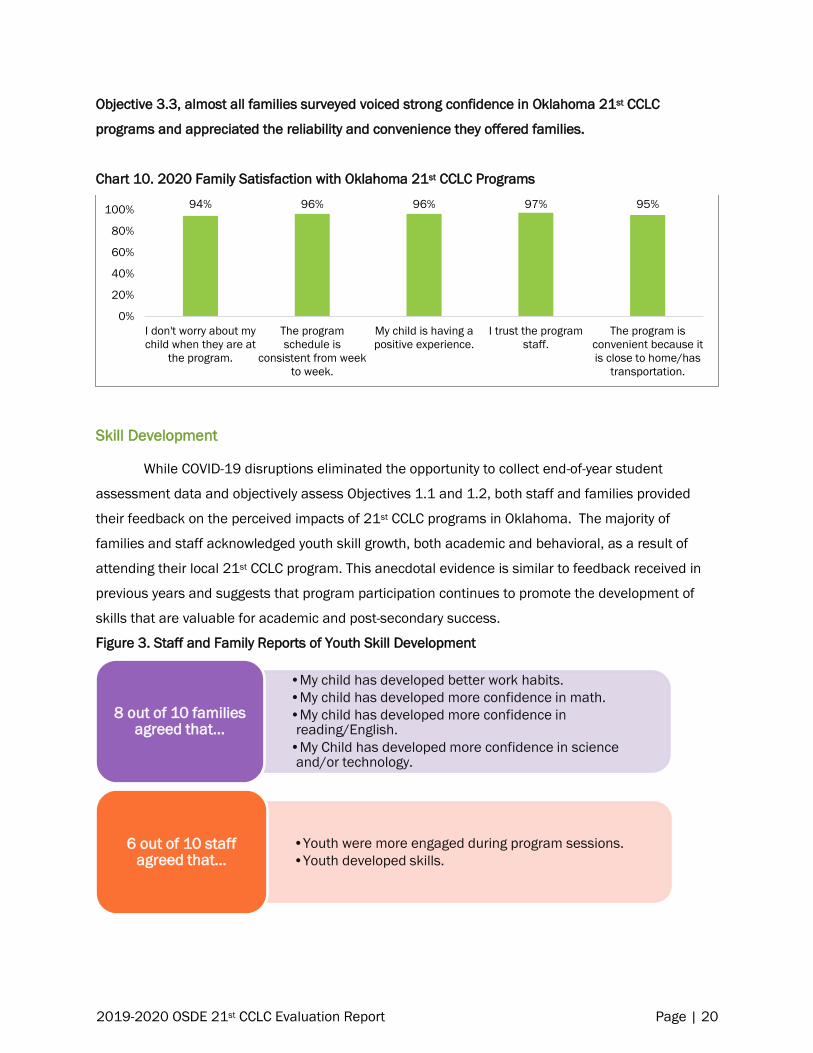
Objective 3.3, almost all families surveyed voiced strong confidence in Oklahoma 21st CCLC
programs and appreciated the reliability and convenience they offered families.
Chart 10. 2020 Family Satisfaction with Oklahoma 21st CCLC Programs
Skill Development
While COVID-19 disruptions eliminated the opportunity to collect end-of-year student
assessment data and objectively assess Objectives 1.1 and 1.2, both staff and families provided
their feedback on the perceived impacts of 21st CCLC programs in Oklahoma. The majority of
families and staff acknowledged youth skill growth, both academic and behavioral, as a result of
attending their local 21st CCLC program. This anecdotal evidence is similar to feedback received in
previous years and suggests that program participation continues to promote the development of
skills that are valuable for academic and post-secondary success.
Figure 3. Staff and Family Reports of Youth Skill Development
94% 96% 96% 97% 95%
0%
20%
40%
60%
80%
100%
I don't worry about my
child when they are at
the program.
The program
schedule is
consistent from week
to week.
My child is having a
positive experience.
I trust the program
staff.
The program is
convenient because it
is close to home/has
transportation.
•My child has developed better work habits.
•My child has developed more confidence in math.
•My child has developed more confidence in reading/English.
•My Child has developed more confidence in science and/or technology.
8 out of 10 families agreed that...
•Youth were more engaged during program sessions.
•Youth developed skills.
6 out of 10 staff agreed that...

2019-2020 OSDE 21st CCLC Evaluation Report Page | 21
Conclusions and Recommendations
The purpose of this report is to summarize the performance, successes and growth
opportunities that emerged for Oklahoma 21st CCLC programs during the 2019-2020 program year.
With a focus on program quality, implementation fidelity, youth and family engagement and skill
development, this evaluation included multiple sources of data from staff, families, and program
records to inform conclusions and recommendations.
❖ Goal 1: Improve both academic and non-academic outcomes for regularly attending participants.
While state assessment and youth survey data was not collected this year due to COVID-19
related program disruptions, feedback from staff and families recognized that students
demonstrated growth in both academic and behavioral skills as a result of their participation in
Oklahoma 21st CCLC programs. Similar to previous years, this feedback bolsters confidence that
program participation continues to promote the development of skills, such as positive work habits
and academic confidence, that are valuable for academic and post-secondary success.
❖ Goal 2: Promote a physically and emotionally safe place to attend and continual instruction to
promote healthy bodies, minds, and habits
Oklahoma 21st CCLC programs continue to provide high-quality afterschool programming to
youth throughout the state as all PQA domains received an average score of 3 or higher from both
external and self-assessors. The data show that instructional practices within the Safe and
Supportive Environment domains continue to be strengths throughout the state, and that additional
training opportunities on Youth Leadership, Planning and Reflection practices would support
continuous improvement efforts. Additionally, the data this year show a statistically significant
difference between self- and external assessment scores for Interaction and Engagement domains,
reinforcing the recommendation that additional training for assessors, including more time spent
prior to the observation connecting with the program and clarifying the intent of the items, could help
bridge the gap between the self- and external perspectives.
Reported activity data shows that almost all sites reported offering a variety of both
academic (e.g., homework help, tutoring, literacy) and enrichment opportunities (e.g., physical
activity, arts and music, mentoring) on at least a weekly basis throughout the academic year. Annual
Performance data show the majority of participating students attended their program approximately
2-3 days per week. A statistically significant correlation between the Interaction domain and
attendance was found, meaning that programs with higher quality Interaction practices, specifically
around Belonging and Collaboration, were also more likely to have greater youth attendance

2019-2020 OSDE 21st CCLC Evaluation Report Page | 22
throughout the year. These findings suggest that instructional priorities around building community
and cooperative learning would be especially beneficial for programs seeking to improve youth
attendance.
❖ Goal 3: Provide opportunities for parents and students to learn and connect with their
community together.
Grantee Directors, Site Coordinators, Afterschool staff and families all reported engaging in
multiple opportunities throughout the year that connect the school-day, afterschool program, and
home environment in support of student success. Grantee and site staff both reported attending
school meetings and parent-teacher conferences to identify and address specific academic needs.
families reported high levels of satisfaction and confidence in Oklahoma 21st CCLC programs and
appreciated the partnership and genuine care from staff about their family well-being. Additional
efforts to strengthen connections with local businesses may be a valuable next step to further
increase opportunities for community engagement.
❖ Goal 4: Build organizational capacity to deliver high-quality programming to all participants
attending 21st CCLC programming.
Building on a strong, supportive foundation of communication and collaboration both within
and across programs, the majority of Grantee and site staff reported high engagement in the YPQI
process, confirming they participated in the assessment process, attended trainings to support
instructional practice and data use, and almost half received coaching during the 2019-2020
program year. Approximately three-quarters of staff reported these opportunities to be very useful
which likely contributed to almost all Grantee Directors, Site Coordinators and Afterschool teachers
reporting high satisfaction with their job.
Having a strong afterschool workforce throughout the state drives consistency in quality
programming and helps all sites be successful with recruitment and retention. Oklahoma 21st CCLC
programs continued to exceed recruitment targets with 84% of youth attending 21st CCLC programs
receiving free and/or reduced-price meals, higher than the statewide average of 59% for the 2019-
2020 school year. Across most other key demographic characteristics, Oklahoma 21st CCLC
participating youth were representative of the statewide student population, except that Grantees
also served a greater proportion of American Indian youth in comparison to state averages.
Additional analyses found no significant differences in program quality across demographic
characteristics, meaning all participating youth in Oklahoma had equal access to high-quality
afterschool programming.

2019-2020 OSDE 21st CCLC Evaluation Report Page | 23
Appendix A: Annual Performance Report (APR) Requirements for Data Collection
Program Area Data Collected Summer10
Fall Spring
Centers
• Center Name, Address, City, State, Zip Code
• Contact Name, Email and Phone Number
• Center Type: Public School, Charter School, College/University,
Community Based, Faith Based, Other
• Expanded Learning Time: Yes/No
• Feeder Schools
• Community Partners
X X X
Activities
Frequency, average hours per session, average participants per session,
and secondary College and Career Readiness goal for the following:
Academics
• STEM
• Literacy
• Tutoring
• Homework Help
• English Language Learning Support
Enrichment
• Entrepreneurship
• Arts and Music
• Physical Activity
• Community/ Service Learning
• Mentoring
Character Education
• Drug Prevention
• Counseling Programs
• Violence Prevention
• Truancy Prevention
• Youth Leadership
College and Career Readiness
• College and Career Readiness
X X X
Staffing
Number of paid and volunteer
• Administrators
• College students
• Community members
• High school students
• Parents
• School day teachers
• Non-teaching school staff
• Subcontracted staff
• Other
X X X
Families
If program serves families of youth Pre-K to 5th Grade and 6th Grade to
12th Grade
Number of family members served of Pre-K to 5th Grade youth
Number of family members served of 6th – 12th Grade Youth
X X X
Participation
and
Outcomes
Youth Demographic Information: race, gender, English proficiency, free or
reduced lunch eligibility, special needs status, grade level
Oklahoma School Testing Program (OSTP) for youth in grades 3-8
Attendance Data by Term
Youth Outcomes data: Previous and Current year Math and ELA
Performance data requirements were waived as state assessments did
not take place in spring 2020.
X
10 Summer data is not collected from first year grantees

2019-2020 OSDE 21st CCLC Evaluation Report Page | 24
Appendix B. Leading Indicator Framework
Organizational Context
Indicator Scale Source
Staffing Model
Capacity Project Director/Site Coordinator Survey
Job Satisfaction Project Director/Site Coordinator Survey
Direct Staff/Youth Worker Survey
Continuous
Improvement
Continuous Quality Improvement Project Director/Site Coordinator Survey
Direct Staff/Youth Worker Survey
Participation in YPQI Supports Project Director/Site Coordinator Survey
Direct Staff/Youth Worker Survey
Horizontal Communication Direct Staff/Youth Worker Survey
Vertical Communication Direct Staff/Youth Worker Survey
Youth Governance Youth Role in Governance Project Director/Site Coordinator Survey
Enrollment Policy Academic Targeting Project Director/Site Coordinator Survey
Instructional Context
Indicator Scale Source
Academic Press Academic Planning Direct Staff/Youth Worker Survey
Homework Completion Youth Survey
Engaging Instruction
Youth Engagement and Belonging Youth Survey
Growth and Mastery Goals Direct Staff/Youth Worker Survey
Instructional Quality Youth PQA & School-Age PQA
External Relationships
Indicator Scale Source
System Norms Accountability Project Director/Site Coordinator Survey
Collaboration Project Director/Site Coordinator Survey
Family Engagement Communication Family Survey
School Alignment
Student Data Project Director/Site Coordinator Survey
School Day Content Project Director/Site Coordinator Survey
Direct Staff/Youth Worker Survey
Community
Resources Community Engagement Project Director/Site Coordinator Survey
Youth Skills
Indicator Scale Source
Socioemotional
Development Social and Emotional Competencies Youth Survey
Academic Efficacy
Work Habits Youth Survey
Reading/English Efficacy Youth Survey
Math Efficacy Youth Survey
Science Efficacy Youth Survey
Technology Efficacy Youth Survey
Academic Efficacy Family Survey
Family Satisfaction
Indicator Scale Source
Family Satisfaction
Confidence in Care Family Survey
Convenience of Care Family Survey
Family School Connection Family Survey