evaluating pavement damage in the fayetteville shale … fayetteville shale1.pdf · evaluating...
TRANSCRIPT

Transportation Research CommitteeTransportation Research Committee
Elisha WrightElisha Wright--KehnerKehner March 17, 2008March 17, 2008
Placeholder for photos
Evaluating Pavement Damage in the Evaluating Pavement Damage in the Fayetteville Shale Play AreaFayetteville Shale Play Area
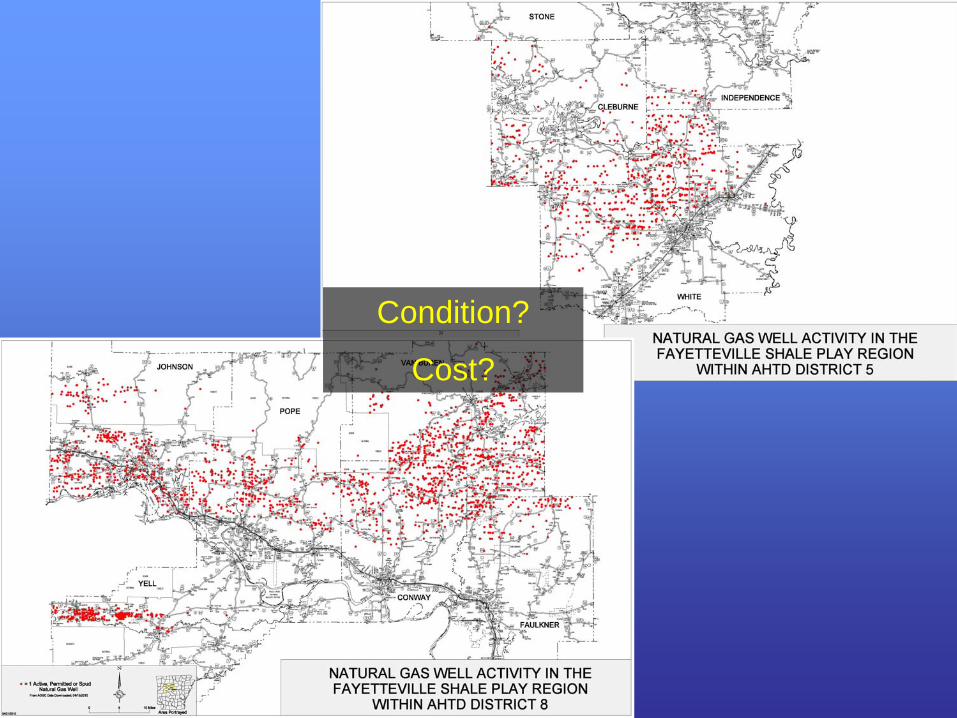
Condition?
Cost?

PAVEMENT DAMAGEPAVEMENT DAMAGEWeaker Roads are taking a hitWeaker Roads are taking a hit
Higher Volume Routes are showing Higher Volume Routes are showing signs of significant damage signs of significant damage

ROUTES UNDER STUDYROUTES UNDER STUDY
•• Looked at every routes/section in affected Looked at every routes/section in affected areas of Districts 5 & 8areas of Districts 5 & 8–– District experience District experience –– District Maintenance activity District Maintenance activity –– Traffic CountsTraffic Counts–– Field evaluationsField evaluations–– Automatic Road Analyzer (ARAN) performance Automatic Road Analyzer (ARAN) performance
datadata–– Injection well locationsInjection well locations

LOWER TRAFFIC VOLUME ROUTESLOWER TRAFFIC VOLUME ROUTES

ARAN DATAARAN DATA
•• Roughness Roughness –– IRIIRI•• Rutting Rutting •• CrackingCracking•• Pavement Serviceability Pavement Serviceability
Rating (PSR)Rating (PSR)•• Pavement Edge Condition Pavement Edge Condition

PAVEMENT DAMAGE ANALYSISPAVEMENT DAMAGE ANALYSIS
Deflection analysis for permitting Deflection analysis for permitting loads on weight restricted routes loads on weight restricted routes
(27 routes in the area were (27 routes in the area were analyzed resulting in $44,198 of analyzed resulting in $44,198 of
permit fees in 2010.)permit fees in 2010.)
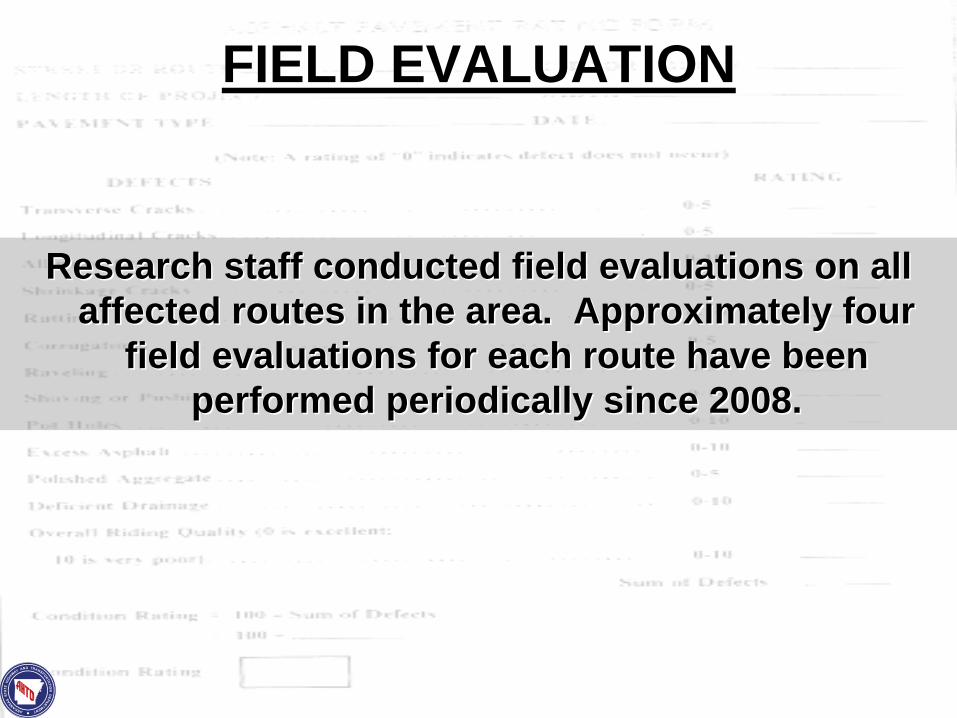
FIELD EVALUATIONFIELD EVALUATION
Research staff conducted field evaluations on all Research staff conducted field evaluations on all affected routes in the area. Approximately four affected routes in the area. Approximately four
field evaluations for each route have been field evaluations for each route have been performed periodically since 2008. performed periodically since 2008.

TRAFFIC DATATRAFFIC DATA
Technical Services has increased their collected Technical Services has increased their collected traffic counts and classification counts within the traffic counts and classification counts within the
affected area for the last three years. affected area for the last three years.

TRAFFIC VOLUMESTRAFFIC VOLUMES

TRAFFIC VOLUMESTRAFFIC VOLUMES

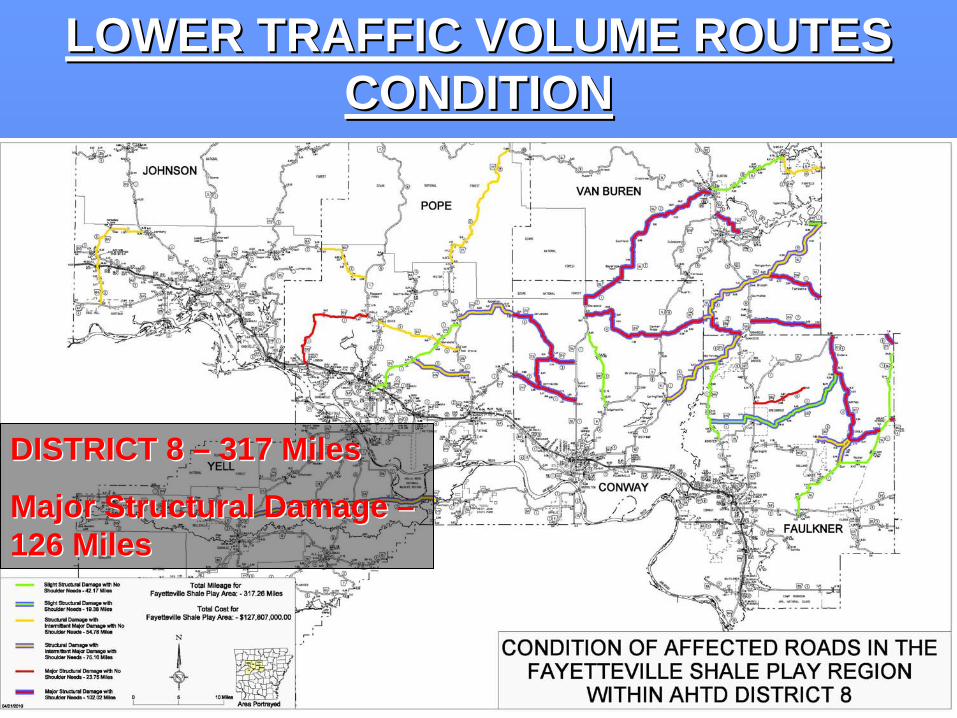
LOWER TRAFFIC VOLUME ROUTESLOWER TRAFFIC VOLUME ROUTESCONDITIONCONDITION
DISTRICT 5 DISTRICT 5 -- 221 Miles221 Miles
Major Structural Damage Major Structural Damage –– 101 Miles101 Miles
LOWER TRAFFIC VOLUME ROUTESLOWER TRAFFIC VOLUME ROUTESCONDITIONCONDITION
DISTRICT 8 DISTRICT 8 –– 317 Miles317 Miles
Major Structural Damage Major Structural Damage –– 126 Miles126 Miles

LOWER TRAFFIC VOLUME ROUTESLOWER TRAFFIC VOLUME ROUTES
538 Miles538 Miles
$219 Million$219 Million

ROUTES UNDER STUDYROUTES UNDER STUDY
•• Looked at every higher volume Looked at every higher volume routes/section in affected areas of Districts routes/section in affected areas of Districts 5 & 85 & 8–– District experience District experience –– Traffic CountsTraffic Counts–– Automatic Road Analyzer (ARAN) performance Automatic Road Analyzer (ARAN) performance
datadata–– Pavement Structural AnalysisPavement Structural Analysis–– Well sitesWell sites

HIGHER TRAFFIC VOLUME ROUTESHIGHER TRAFFIC VOLUME ROUTES

CRACKINGCRACKING
STATE HIGHWAY 9STATE HIGHWAY 9
Block CrackingBlock Cracking
Alligator CrackingAlligator Cracking

RUTTINGRUTTING
STATE HIGHWAY 9 SECTION 11 STATE HIGHWAY 9 SECTION 11 -- LM .48LM .48

PAVEMENT EDGE CONDITIONPAVEMENT EDGE CONDITION

PAVEMENT EDGE CONDITIONPAVEMENT EDGE CONDITION
Edge DropEdge Drop--off off Needs Study Needs Study
Preventative MaintenancePreventative Maintenance
SafetySafety

HIGHER TRAFFIC VOLUME ROUTES HIGHER TRAFFIC VOLUME ROUTES –– REMAINING LIFEREMAINING LIFE

HIGHER TRAFFIC VOLUME ROUTES HIGHER TRAFFIC VOLUME ROUTES –– OVERLAY THICKNESSOVERLAY THICKNESS
DISTRICT 5 DISTRICT 5 -- 141 Miles141 Miles
$90 Million$90 Million
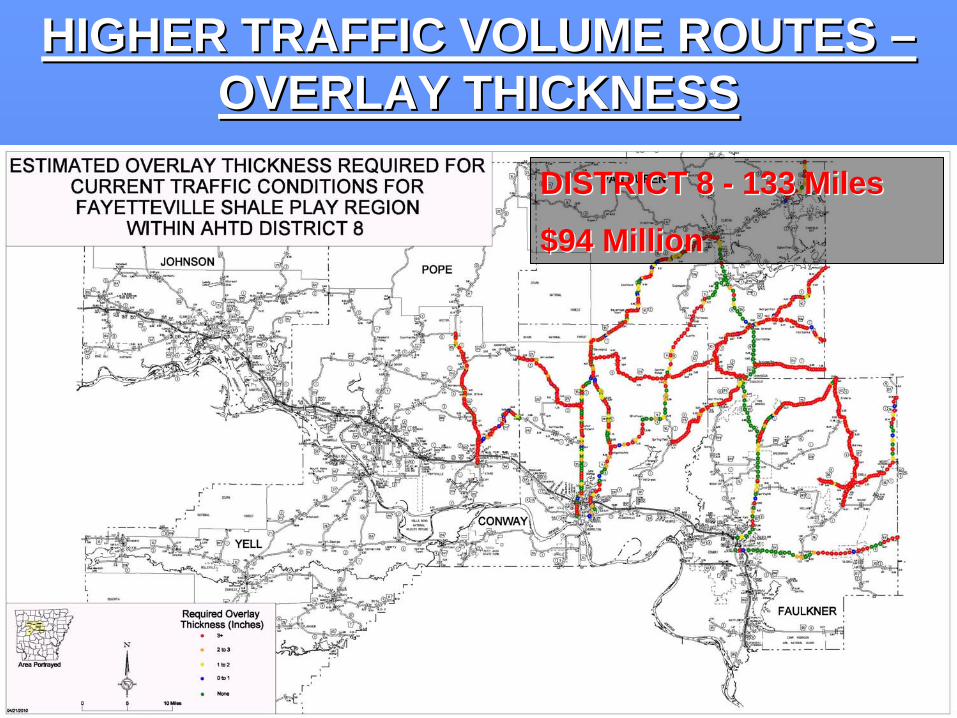
HIGHER TRAFFIC VOLUME ROUTES HIGHER TRAFFIC VOLUME ROUTES –– OVERLAY THICKNESSOVERLAY THICKNESS
DISTRICT 8 DISTRICT 8 -- 133 Miles133 Miles
$94 Million$94 Million

AFFECTED AREAAFFECTED AREA
812 Miles812 Miles
$403 Million$403 Million

visit us on the web atwww.arkansashighways.com
Arkansas State HighwayArkansas State Highwayand and
Transportation DepartmentTransportation Department