evaluating satellite products for precipitation estimation
TRANSCRIPT

City University of New York (CUNY) City University of New York (CUNY)
CUNY Academic Works CUNY Academic Works
Publications and Research City College of New York
2013
Evaluating Satellite Products for Precipitation Estimation in Evaluating Satellite Products for Precipitation Estimation in
Mountain Regions: A Case Study for Nepal Mountain Regions: A Case Study for Nepal
Nir Y. Krakauer CUNY City College
Soni M. Pradhanang CUNY Hunter College
Tarendra Lakhankar CUNY City College
Ajay K. Jha Colorado State University - Fort Collins
How does access to this work benefit you? Let us know!
More information about this work at: https://academicworks.cuny.edu/cc_pubs/563
Discover additional works at: https://academicworks.cuny.edu
This work is made publicly available by the City University of New York (CUNY). Contact: [email protected]

Remote Sens. 2013, 5, 4107-4123; doi:10.3390/rs5084107OPEN ACCESS
Remote SensingISSN 2072-4292
www.mdpi.com/journal/remotesensing
Article
Evaluating Satellite Products for Precipitation Estimation inMountain Regions: A Case Study for NepalNir Y. Krakauer 1,*, Soni M. Pradhanang 2, Tarendra Lakhankar 1 and Ajay K. Jha 3
1 Department of Civil Engineering and NOAA-CREST, The City College of New York, NY 10031,USA; E-Mail: [email protected]
2 Institute for Sustainable Cities, City University of New York, NY 12401, USA;E-Mail: [email protected]
3 Department of Horticulture and Landscape Architecture, Colorado State University, Fort Collins,CO 80523, USA; E-Mail: [email protected]
* Author to whom correspondence should be addressed; E-Mail: [email protected];Tel.: +1-212-650-8003.
Received: 26 June 2013; in revised form: 12 August 2013 / Accepted: 13 August 2013 /Published: 16 August 2013
Abstract: Precipitation in mountain regions is often highly variable and poorly observed,limiting abilities to manage water resource challenges. Here, we evaluate remote sensingand ground station-based gridded precipitation products over Nepal against weather stationprecipitation observations on a monthly timescale. We find that the Tropical RainfallMeasuring Mission (TRMM) 3B-43 precipitation product exhibits little mean bias andreasonable skill in giving precipitation over Nepal. Compared to station observations, theTRMM precipitation product showed an overall Nash-Sutcliffe efficiency of 0.49, which issimilar to the skill of the gridded station-based product Asian Precipitation-Highly ResolvedObservational Data Integration Towards Evaluation of Water Resources (APHRODITE). Theother satellite precipitation products considered (Global Satellite Mapping of Precipitation(GSMaP), the Climate Prediction Center Morphing technique (CMORPH), PrecipitationEstimation from Remotely Sensed Information Using Artificial Neural Networks-CloudClassification System (PERSIANN-CCS)) were less skillful, as judged by Nash-Sutcliffeefficiency, and, on average, substantially underestimated precipitation compared to stationobservations, despite their, in some cases, higher nominal spatial resolution compared toTRMM. None of the products fully captured the dependence of mean precipitation onelevation seen in the station observations. Overall, the TRMM product is promising foruse in water resources applications.

Remote Sens. 2013, 5 4108
Keywords: quantitative precipitation estimation; Nash-Sutcliffe efficiency; Nepal;Himalayas; monsoon Asia
1. Introduction
Mountain regions are critical to regional water resources, with often heavy precipitation supplyingriver flow to extensive downstream reaches, and are also vulnerable to hydrological hazards, such asflooding [1,2]. Since precipitation in mountain regions may vary strongly in space, accurate spatiallydistributed data are critical to assessing mountain water resources; however, in many regions, fewweather station measurements are available in near real time. Although remote sensing precipitationproducts based on satellite observations offer potentially high spatial and temporal resolution and lowlatency, discrepancies between available products put their accuracy for mountain regions in question [3],necessitating a full evaluation of their skill before they can be recommended for operational use.
Here, we evaluate the accuracy of satellite precipitation products for Nepal, located between latitudes26◦–31◦N and longitudes 80◦–89◦E in the north of the Indian subcontinent on the southern flank of theHimalayas (Figure 1) [4]. Nepal’s low and middle foothills receive large amounts of rain from aboutJuly to September as part of the South Asian monsoon (summer rainy season), but populations theremay experience water shortages during the rest of the year [5,6]. While the Himalayan peaks and theTibetan plateau to the north are in a relatively dry “rain shadow” [7], winter snow at high elevationsnevertheless contributes to spring and summer streamflow [8]. Precipitation amount and timing impactkey regional hazards, such as flooding and landslides [9–11]. Few rain gauge measurements from Nepalare publicly available, especially in near real time, and the national network is inadequate to captureprecipitation variability in mountain regions [12,13].
Several studies have previously applied satellite precipitation products for the Indian subcontinentor for the Himalayas region, which includes Nepal. For example, Bhatt and Nakamura [14] andBookhagen and Burbank [15] used the Tropical Rainfall Measuring Mission (TRMM) satellite-borneprecipitation radar to study the seasonality and diurnal variation of precipitation around the Himalayas,but without validating the satellite precipitation estimates against other observations. Brown [16]compared available daily station data from India and Sri Lanka to two satellite precipitation products,using, as a criterion for accuracy, the discrepancy between the gauge and satellite yearly accumulations.Islam and Uyeda [17] compared precipitation seasonal cycles and number of rain days in two versions ofthe TRMM precipitation product to station measurements over Bangladesh, showing that a low bias inTRMM monsoon rainfall was mitigated in a more recent version. Yatagai and Kawamoto [18] foundthat the TRMM Precipitation Radar (PR) product underestimated summer precipitation by 28–38%over the Himalayas. Focusing specifically on Nepal, Shrestha et al. [19] found that streamflow inthe Bagmati river (in a region of Nepal with relatively dense station coverage) was simulated poorlywhen forced by basin-wide precipitation from a Climate Prediction Center (CPC) satellite-derivedproduct compared to using interpolated rain gauge measurements, since the CPC product failed tocapture some of the heaviest precipitation events. Similarly, Islam et al. [20] found that Version 6

Remote Sens. 2013, 5 4109
of the TRMM product generally underestimated daily precipitation over Nepal compared to availablestation data. They then used linear regression to calibrate the TRMM product, although withoutconsidering geographic variation in the calibration factor. Duncan and Biggs [21], on the other hand,found that TRMM generally overestimated precipitation over Nepal compared to the gridded stationmeasurement product Asian Precipitation-Highly Resolved Observational Data Integration towardsEvaluation of Water Resources (APHRODITE), concluding that TRMM, therefore, is of limited usefor water resource management or hazard planning in Nepal. Andermann et al. [22] found thatAPHRODITE did better at matching station-measured precipitation amounts at several watersheds andswath profiles in Nepal and adjacent countries than any of the remote sensing products evaluated,including TRMM. Yamamoto et al. [23] compared the mean seasonal and diurnal cycles of precipitationmeasured by a single high-altitude automated weather station in Nepal with those of several remotesensing-based precipitation products, finding that TRMM best represented the mean seasonal cycle,while the Global Satellite Mapping of Precipitation (GSMaP) products performed particularly poorly;interannual variability was not considered.
Figure 1. Topography and district boundaries of Nepal. Circles show the locationsof stations with precipitation data (from the Department of Hydrology and Meteorology(DHM), People and Resource Dynamics Project (PARDYP) or Stations at High Altitude forResearch on the Environment (SHARE)) used in this study.
In this work, our goal is to systematically quantify the performance of satellite precipitation productsover Nepal compared to station observations. To do this, we evaluate both absolute amounts ofprecipitation and patterns of spatial and temporal variability. We focus on the monthly timescale, whichis relevant for water resources applications, such as agriculture and hydropower. We compare meanspatial patterns and interannual variability of precipitation, as well as mean precipitation by altitude andseason between the satellite products and, where possible, with observations. We use several versions

Remote Sens. 2013, 5 4110
of Nash-Sutcliffe efficiency to quantify the degree of agreement between station observations and eachsatellite precipitation product along some dimensions of interest, such as mean spatial distribution, theseasonal cycle, and interannual variability.
2. Methods
2.1. Gridded Precipitation Products
We sought to include in our evaluation satellite precipitation products that are available in near realtime and, also, had at least several years of archived fields available. The archived products are what weactually evaluate in this paper using time series of station observations, while the availability of a nearreal time version would enable these products to be operationally used for water resources applicationsin Nepal. Given the sharp topographic contrasts in precipitation known to exist in Nepal, we soughtsatellite products with as high a spatial resolution as possible, but at least 0.25◦.
TRMM Product 3B-43 is released by the Goddard Space Flight Center of the National Aeronauticsand Space Administration (NASA). TRMM is a satellite launched in late 1997 that includes severalinstruments for monitoring precipitation using microwave, infrared and visible wavelengths [24].Product 3B-43 aggregates to calendar months the three-hour precipitation product, 3B-42, whichincorporates microwave and infrared observations from multiple satellites, including TRMM. 3B-43uses rain gauge data in order to remove any detected biases from the estimated precipitation field [25]and has a spatial resolution of 0.25◦. A version of the three-hour product is processed in near real time.An advantage of TRMM 3B-43 compared to other satellite products is extensive validation and biasadjustment based on ground measurements. We used the latest research version (7A) of TRMM 3B-43,which was available from 1998 through September, 2012.
The GSMaP project is carried out by the Japan Aerospace Exploration Agency (JAXA).Near-real-time and reanalyzed hourly precipitation products are available at 0.1◦ spatial resolutions.These are based on both microwave and infrared satellite radiometry, combined using a Kalmanfilter [26,27]. We used the daily-aggregated version of the reanalysis product (Version 5.222), availablefor March 2000 to November 2010.
The CPC Morphing technique (CMORPH) aims to produce global precipitation analyses at veryhigh spatial and temporal resolution by propagating precipitation estimated from satellite microwaveobservations using cloud movements obtained from geostationary satellite infrared sensors [28]. Thisproduct is available in near real time at 0.073◦ and 0.25◦ spatial resolutions at ftp://ftp.cpc.ncep.noaa.gov/precip/global CMORPH/ . We used CMORPH fields archived at the 0.25◦ resolution, available for 2003to 2010.
The University of California at Irvine’s Precipitation Estimation from Remotely SensedInformation Using Artificial Neural Networks-Cloud Classification System (PERSIANN-CCS) [29] usesgeosynchronous satellite infrared cloud imagery, trained against satellite microwave data andground-based gauges and radar, to achieve high spatial and temporal resolutions for precipitationestimation. The archived PERSIANN product was available for the Indian subcontinent at 0.04◦,three-hour resolution for 2006–2010 (http://chrs.web.uci.edu/PERSIANN-CCS/data.html), which we

Remote Sens. 2013, 5 4111
aggregated in time to monthly ones. The spatial resolution is thus the highest of any of the productsevaluated here. A near-global near real time PERSIANN product with the same 0.04◦ spatial resolutionis available at http://chrs.web.uci.edu/persiann/.
The APHRODITE project has produced a daily precipitation dataset over Asia based solely onrain gauge measurements [30]. The measurements used include station data obtained from nationalmeteorological agencies, including Nepal’s Department of Hydrology and Meteorology (DHM). Stationdata were interpolated using an algorithm that takes topography into account and uses climatology toestimate missing values. We used the APHRODITE V1101 monsoon Asia product at the best availableresolution of 0.25◦, available for 1951–2007. We aggregated the daily values to monthly ones. WhileAPHRODITE is not currently available in near real time, we considered it important to include it inour evaluation, because it offers long-term spatial fields of precipitation distribution that are based onstation data and because considering its skill in reproducing station observations may give an indicationof how well satellite products can be expected to perform for precipitation estimation for water resourcesapplications compared with interpolation from available station data.
2.2. Station Precipitation Data
Almost complete daily precipitation series for 11 major stations, covering 1988–2007, were obtainedfrom DHM, comprising a total of 2,666 observations (complete station-months). As well, incompleteprecipitation series for 2008–2012 were obtained from the DHM website for 265 stations (Figure 1),totaling 4,615 observations. Additional observations (701 station-months) were obtained for 1993–2000from 12 stations in the Jhikhu Khola watershed, gauged as part of the People and Resource DynamicsProject (PARDYP) [31]. Observations from four high-elevation sites over the period 2002–2008(72 station-months) were obtained from the Stations at High Altitude for Research on the Environment(SHARE) project [32].
Since the station observations from DHM (through 2007) were among those used to construct theAPHRODITE product [30], comparison with the DHM observations should show better performance forAPHRODITE, compared to satellite products that did not use many of these observations for calibration.By contrast, the PARDYP and SHARE measurements were not used to construct APHRODITE; so,these represent more independent data [22]. However, preliminary sensitivity analysis did not showsystematic differences between DHM and the other station observation networks in terms of theirfit to APHRODITE versus the satellite-based gridded products; so, we consider here all the stationprecipitation data together without distinction.
2.3. Metrics for Precipitation Product Quality
We compared the average nationwide precipitation by year and maps of the distribution of meanprecipitation between the satellite precipitation products and the gridded station-based APHRODITE.Because the station observations are sparse and, in most cases, are not complete over multi-year periods,we do not attempt here to reconstruct the average nationwide precipitation by year or to make nationalmaps based on the station observations. Instead, we average the station precipitation as a function ofelevation (aggregating into 100-m elevation bands, then using a cubic spline to smooth) and compare this

Remote Sens. 2013, 5 4112
with the mean precipitation from each product as a function of elevation within Nepal. We also comparethe mean seasonal cycle of precipitation between the precipitation products and the station observations.Another measure of product quality is the mean bias in each precipitation product compared to stationobservations, defined by the difference between the mean station-observed precipitation and that givenby the product averaged over the same grid cells and months.
Our primary metric for the degree to which each gridded precipitation product reproduces stationobservations is the Nash-Sutcliffe efficiency, NSE, which is based on the magnitude of the residualvariance relative to the variance of the measured data [33]. Here, high NSE indicates a small meansquare difference between station observations and the precipitation product:
NSE = 1 − ⟨(P1 − P2)2⟩
⟨(P1 − ⟨P1⟩)2⟩(1)
where P1 refers to station observations and P2 to a precipitation product, and ⟨·⟩ denotes an averageacross observation stations and months. NSE = 1 would mean that the product agrees exactly withthe station observations, while NSE = 0 indicates that the mean square error of the product is aslarge as just using the mean observed value as the predictor. Unlike the correlation coefficient, r,between a precipitation product and station observations, NSE penalizes systematic bias in the product’sprecipitation estimates, as well as irregular discrepancies.
Note that the station observations measure precipitation over the very small surface area of the raingauge, whereas the precipitation products being compared with the observations nominally representprecipitation averaged over a much larger grid cell that includes the rain gauge location. Thus, we do notexpect perfect correspondence (NSE = 1) between the station observations and any of the precipitationproducts. Nevertheless, we expect that the degree to which the different products approach thestation-measured precipitation, as measured by NSE, offers a reasonable overall metric of theirrelative quality.
In order to evaluate how well the precipitation products represent different aspects of precipitationmeans and variability, we consider the following forms of the NSE metric:
• NSEall calculated using all the monthly measurements;• NSEmean using the mean annual values for each station (this quantifies how well the product
represents spatial variability in mean precipitation, irrespective of its timing within eachstation record);
• NSEseasonal using stations’ mean seasonal cycles (for each station, these were expressed as 12elements that give the fraction of the yearly mean precipitation seen in each month; this quantifieshow well each product represents seasonal precipitation patterns);
• NSEvariability using monthly values with the station climatology subtracted (this quantifies howwell each product represents interannual variability in precipitation).
Because each precipitation product considered is available for a different time period, the NSE valuesfor each precipitation product are calculated using station observations overlapping with that product,which is a somewhat different set of observations for each product. To check whether this materiallyaffects our evaluations of product quality based on NSE, we also computed pairwise NSEall values: forexample, the value of NSEall for precipitation product A calculated for only those observations when
Remote Sens. 2013, 5 4113
product B is also available is based on exactly the same observation set as that computed for product B
using only those observations when A is also available, and hence, these two pairwise NSEall values canbe directly compared to evaluate the relative quality of products A and B.
3. Results
3.1. Mean and Interannual Variability
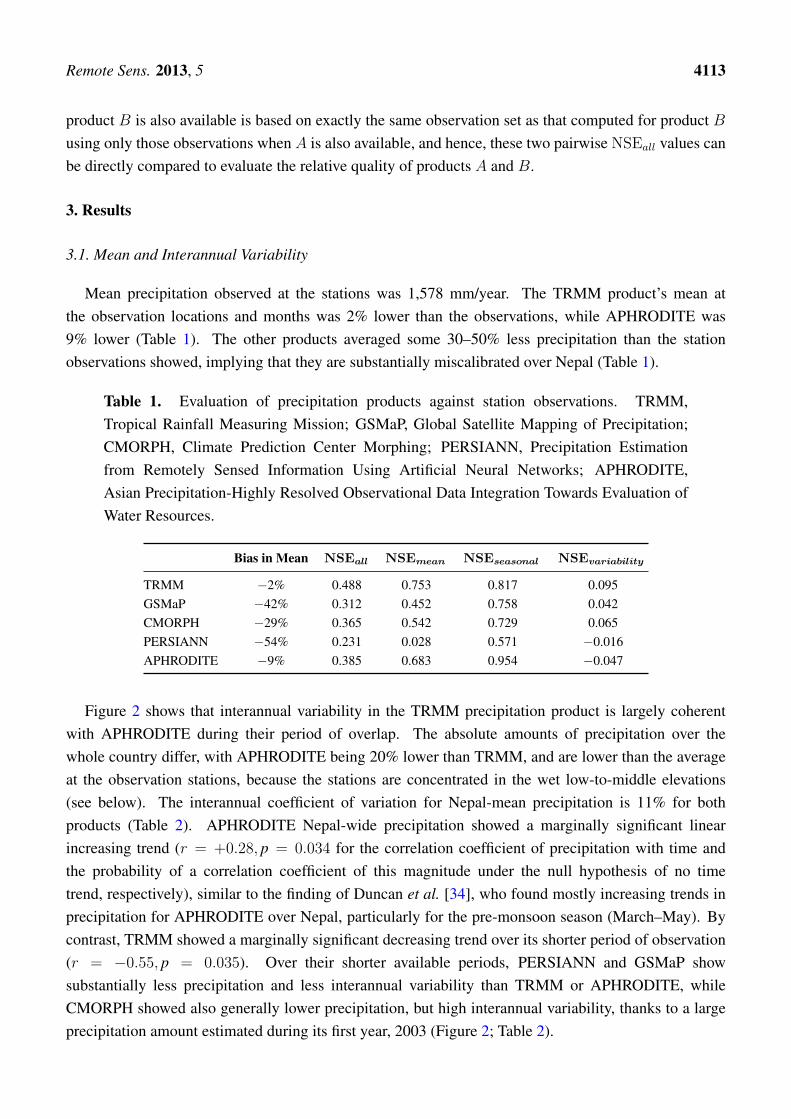
Mean precipitation observed at the stations was 1,578 mm/year. The TRMM product’s mean atthe observation locations and months was 2% lower than the observations, while APHRODITE was9% lower (Table 1). The other products averaged some 30–50% less precipitation than the stationobservations showed, implying that they are substantially miscalibrated over Nepal (Table 1).
Table 1. Evaluation of precipitation products against station observations. TRMM,Tropical Rainfall Measuring Mission; GSMaP, Global Satellite Mapping of Precipitation;CMORPH, Climate Prediction Center Morphing; PERSIANN, Precipitation Estimationfrom Remotely Sensed Information Using Artificial Neural Networks; APHRODITE,Asian Precipitation-Highly Resolved Observational Data Integration Towards Evaluation ofWater Resources.
Bias in Mean NSEall NSEmean NSEseasonal NSEvariability
TRMM −2% 0.488 0.753 0.817 0.095GSMaP −42% 0.312 0.452 0.758 0.042CMORPH −29% 0.365 0.542 0.729 0.065PERSIANN −54% 0.231 0.028 0.571 −0.016APHRODITE −9% 0.385 0.683 0.954 −0.047
Figure 2 shows that interannual variability in the TRMM precipitation product is largely coherentwith APHRODITE during their period of overlap. The absolute amounts of precipitation over thewhole country differ, with APHRODITE being 20% lower than TRMM, and are lower than the averageat the observation stations, because the stations are concentrated in the wet low-to-middle elevations(see below). The interannual coefficient of variation for Nepal-mean precipitation is 11% for bothproducts (Table 2). APHRODITE Nepal-wide precipitation showed a marginally significant linearincreasing trend (r = +0.28, p = 0.034 for the correlation coefficient of precipitation with time andthe probability of a correlation coefficient of this magnitude under the null hypothesis of no timetrend, respectively), similar to the finding of Duncan et al. [34], who found mostly increasing trends inprecipitation for APHRODITE over Nepal, particularly for the pre-monsoon season (March–May). Bycontrast, TRMM showed a marginally significant decreasing trend over its shorter period of observation(r = −0.55, p = 0.035). Over their shorter available periods, PERSIANN and GSMaP showsubstantially less precipitation and less interannual variability than TRMM or APHRODITE, whileCMORPH showed also generally lower precipitation, but high interannual variability, thanks to a largeprecipitation amount estimated during its first year, 2003 (Figure 2; Table 2).

Remote Sens. 2013, 5 4114
Figure 2. Mean annual precipitation over Nepal from TRMM (1998–2011), GSMaP(2001–2009), CMORPH (2003–2010), PERSIANN (2006–2010) and APHRODITE(1951–2007). Least-squares linear trend fits for the TRMM and APHRODITE products,which have the longest available time series, are also shown (thin dashed lines).
600
800
1000
1200
1400
1600
1800
2000
1950 1960 1970 1980 1990 2000 2010
mm/year
TRMMGSMaP
CMORPHPERSIANNAPHRODITE
Table 2. Mean precipitation over Nepal (mm/year) and its coefficient of variation (CV,interannual standard deviation divided by the mean) for different precipitation products.
Mean CV
TRMM 1,614 0.114GSMaP 940 0.084CMORPH 1,103 0.188PERSIANN 691 0.079APHRODITE 1,302 0.110
We also looked more closely at how the TRMM product, which was available and archived for alonger period (1998–2012) than any of the other satellite precipitation products evaluated, compareswith station observations over time. Inspection of the differences between the product and stationobservations showed that the average bias in monthly precipitation (TRMM minus station) was−2.7 mm, not significantly different from zero (the standard error (SE) of the mean was 2.0 mm).Averaged over each calendar year, however, TRMM shows a substantial positive bias over the first yearsof the product (1998–2000, mean ± SE is +40.8± 5.5 mm/month) and a smaller generally negative biasover the other years (2001–2012, −8.6± 2.1 mm/month with no significant linear trend over the period)(Figure 3). Thus, it is possible that the decreasing trend in precipitation seen by TRMM may be due toproduct inhomogeneity, rather than to a real decrease in precipitation over Nepal in recent years. Still,

Remote Sens. 2013, 5 4115
the on average small bias in TRMM, especially for the more recent years, is better than any of the othersatellite precipitation products considered (Table 1).
Figure 3. Mean bias in the TRMM precipitation product, compared to Nepal stationobservations, by year. Error bars show the standard error of the bias over each year.
-60
-40
-20
0
20
40
60
1998 2000 2002 2004 2006 2008 2010 2012
Mean bias (mm/month)
3.2. Spatial and Orographic Variability
The nature of differences between the gridded precipitation fields is shown in Figure 4. Whilethe large-scale features are quite similar between TRMM and APHRODITE, the APHRODITE meanprecipitation field is less smooth than TRMM’s, with much more variation between adjacent pixels. Onepossible explanation for the difference would be that APHRODITE is better at resolving orographicvariation in precipitation near its grid scale. This may be due to the 1◦ resolution of some of theprecipitation fields used to construct the TRMM product [25], which does not adequately resolvetopographic variability in this region. However, as we shall see below, APHRODITE does not appearto be better than TRMM in capturing observed inter-station variability, at least as judged by NSE. ThePERSIANN product, though it nominally has the highest spatial resolution of the products evaluatedhere, misses broad regions of enhanced precipitation seen in both the TRMM and APHRODITE productsand, also, shows some indications of striping, presumably due to processing artifacts. The GSMaPand CMORPH products similarly underestimate precipitation in many low and middle elevation areascompared to TRMM and APHRODITE.
Figure 5 shows the altitude distribution in Nepal, compared to the distribution of available stationmeasurements. Stations are fairly well distributed in altitudes up to about 2,400 m; however, only 5% ofthe precipitation data are from stations above 2,400 m, compared with 37% of Nepal’s area.

Remote Sens. 2013, 5 4116
Figure 4. Mean precipitation (mm/year) over Nepal from (a) TRMM; (b) GSMaP;(c) CMORPH; (d) PERSIANN and (e) APHRODITE products. The color scale is the samefor all panels. North is up; longitude (◦E) and latitude (◦N) are shown for reference.
(a) TRMM precipitation, mm/year
26
27
28
29
30
31
80 82 84 86 88
(b) GSMaP precipitation, mm/year
26
27
28
29
30
31
80 82 84 86 88
(c) CMORPH precipitation, mm/year
26
27
28
29
30
31
80 82 84 86 88
(d) PERSIANN precipitation, mm/year
26
27
28
29
30
31
80 82 84 86 88
(e) APHRODITE precipitation, mm/year
26
27
28
29
30
31
80 82 84 86 88
0 100 300 km
(e) APHRODITE precipitation, mm/year
26
27
28
29
30
31
80 82 84 86 88
0 100 300 km
0 500 1000 1500 2000 2500
Figure 6 shows the mean precipitation in Nepal by altitude as estimated from the station measurementscompared with the gridded products. The station measurements hint at a secondary peak in precipitationat the lowest elevations (< 500 m) and show a pronounced primary peak between about 1,500–2,000 m,with sharply drier conditions above 3,000 m. The APHRODITE and TRMM products both showsubstantially less dependence of precipitation on altitude, with TRMM showing consistently moreprecipitation than APHRODITE at any given altitude. APHRODITE is closer in precipitation amountto station observations below about 1,300 m, while TRMM is closer for 1,300–2,500 m. Both productsshow too much precipitation above 3,000 m compared to the mean inferred from the few available stationdata. GSMaP, CMORPH and PERSIANN all exhibit a peak in precipitation at the lowest altitude bandand, especially over the middle elevations around 1,500–2,500 m, have precipitation that is much toolow compared to station observations.

Remote Sens. 2013, 5 4117
Figure 5. Distribution of Nepal’s area and of station precipitation measurements by altitude.
0
0.2
0.4
0.6
0.8
1
0 500 1000 1500 2000 2500 3000 3500 4000
Fraction below this altitude
Altitude (m)
Area
Stations
Figure 6. Mean precipitation in Nepal by altitude, estimated from station measurements andfrom the gridded products.
0
500
1000
1500
2000
2500
0 500 1000 1500 2000 2500 3000 3500 4000
Precipitation (mm/year)
Altitude (m)
TRMMGSMaP
CMORPHPERSIANNAPHRODITEStations
Figure 7 shows the mean seasonal cycle of precipitation over the lower altitudes where the stations areconcentrated (below 2,400 m). All the products show a seasonality broadly consistent with the stationobservations. Interestingly, the observations, CMORPH and PERSIANN show peak precipitation inAugust, while TRMM, GSMaP and APHRODITE show it in July. Further investigation is required

Remote Sens. 2013, 5 4118
to understand the origin of this difference; since the different products span different time periods,interannual variability in the monsoon could be a factor.
Figure 7. Climatology of mean precipitation in Nepal (averaged over elevations below2,400 m), estimated from station measurements and from the gridded products.
0
100
200
300
400
500
2 4 6 8 10 12
Precipitation (mm/month)
Month
TRMMGSMaPCMORPH
PERSIANNAPHRODITEStations
3.3. Measures of Correspondence with Station Observations
The PERSIANN product had the lowest NSEall, indicating that it had large mean square differencesfrom station observations, despite it nominally featuring the highest spatial resolution of any of theproducts evaluated. TRMM had the best NSEall, at 0.49, APHRODITE had an intermediate NSEall
of 0.38 and GSMaP and CMORPH had NSEall lower than TRMM and APHRODITE, but higher thanPERSIANN (Table 1).
Looking at NSE variants intended to measure the ability of products to reproduce various aspectsof the observed field, TRMM was somewhat better than APHRODITE in representing the spatialdistribution of mean precipitation over the available stations (NSEmean in Table 1); this is despite thesmoother appearance of the mean precipitation field from TRMM compared to APHRODITE (Figure 4).The seasonality of precipitation was relatively well captured by all the products, with APHRODITEgiving the best performance (NSEseasonal in Table 1). The interannual variability of precipitation wasTRMM’s weakest aspect, but its NSEvariability was still better than either APHRODITE or any of theother satellite precipitation products (Table 1).
Considering NSEall for pairwise station observation sets to enable more rigorous comparison of anytwo precipitation products (Table 3), we see that there is some variation in NSEall for a given productdepending on which subset of station observations is used. However, the TRMM product has thehighest NSEall across subsets (first row with numbers in Table 3), while APHRODITE ranks second

Remote Sens. 2013, 5 4119
(last row of Table 3), and the other products underperform both TRMM and APHRODITE in terms ofcorrespondence with station observations.
Table 3. NSEall computed for subsets of station observations where pairs of precipitationproducts are both available. For example, NSEall for station observations evaluated for theTRMM product when the APHRODITE product was also available was 0.425, while NSEall
for the APHRODITE product evaluated with the same station observations was 0.374.
TRMM GSMaP CMORPH PERSIANN APHRODITE
TRMM 0.488 0.492 0.503 0.504 0.425GSMaP 0.312 0.312 0.330 0.343 0.119CMORPH 0.365 0.363 0.365 0.381 0.150PERSIANN 0.231 0.230 0.231 0.231 0.056APHRODITE 0.374 0.347 0.371 0.376 0.385
4. Discussion
We presented an evaluation of several precipitation products over Nepal. We found that, comparedto available station measurements, the TRMM satellite monthly precipitation product was, on average,almost unbiased and had some skill (positive NSE). The skill of the TRMM product in reproducingstation precipitation, as measured by NSEall, is competitive with that of the gridded station productAPHRODITE, where TRMM has the advantage of being available for recent years (with a version evenavailable in near real time). While local rain gauge networks combined with ground-based radar shouldoffer the best accuracy for assessing precipitation amounts, we conclude that well-calibrated satelliteproducts, such as TRMM, can be very useful, where, as is usually the case in Nepal, adequate grounddata are not collected or available.
It may be possible to use systematic features of the station-TRMM mismatch identified here, as inthe altitude dependence of precipitation, to improve the TRMM product for particular spatial scales andapplications. There may also be other geographic differences in the skill of precipitation products (e.g.,eastern versus western Nepal) that could be important for water resources applications. Furthermore, theability of TRMM to capture interannual variability may be improved by better corrections for satelliteorbit and sensor drift [35,36]; the time dependence that we discovered in the TRMM bias over Nepal(Figure 3) may perhaps be mitigated by such improvements in the TRMM precipitation estimationalgorithm, which will hopefully be reflected in future versions of the TRMM precipitation product.
It is interesting that APHRODITE had larger mean bias in precipitation amount than TRMM (andgenerally lower NSE), even though the products were compared to some of the same station data usedto generate APHRODITE in the first place. The bias of APHRODITE is apparently not specific to theparticular set of stations we used, because a similar bias toward low precipitation amounts was foundin the evaluation of APHRODITE with a different compilation of station data for Nepal and nearbyareas [22]. It therefore seems likely that this regional bias is an artifact of the processing methods usedin APHRODITE, and it should be possible to remove it in a future version of APHRODITE. On the otherhand, we found little mean bias for TRMM (particularly after 2000), which is different from previous

Remote Sens. 2013, 5 4120
studies [20,22]. Perhaps, this difference reflects the improved correction of bias at large spatial scales inthe most recent version of TRMM, which we used.
The other three satellite products evaluated—GSMaP, CMORPH and PERSIANN—greatlyunderestimated the mean precipitation, and their elevation dependence of precipitation matchedstation observations poorly, despite the substantially better nominal spatial resolution of GSMaP andPERSIANN compared to TRMM. This suggests that there is still much work to be done in appropriatelyleveraging the high spatial resolution and temporal coverage of geostationary satellites to improveprecipitation estimates at fine scales and short latency, particularly for mountainous areas, such as Nepal,where limited ground-based data is available for calibration and validation in near real time. Cokrigingor related approaches could be tested for optimally merging station observations with remote sensingproducts having different resolutions to form an accurate high-resolution precipitation map [13,37].
Another future direction is to evaluate the near real time versions of the satellite precipitation productsat daily and subdaily resolutions, which would be particularly useful for applications such as flood andlandslide prediction and warning [38]. In general, it is expected that correlations between satellite andgauge precipitation measurements, and even correlations between gauges, worsen at these fine temporalresolutions [39,40], making this a more challenging task.
5. Conclusions
We found that the TRMM 3B-43 precipitation product exhibits reasonable skill in giving precipitationover Nepal. The TRMM product shows promise for use in water resource applications. The othersatellite products evaluated showed substantially worse performance in reproducing station precipitationamounts, despite, in some cases, nominally higher spatial resolution, suggesting that there is still muchscope for improvement in the algorithms used.
Acknowledgments
We are grateful to the Nepal Department of Hydrology and Meteorology and the PRADYP andSHARE projects for collecting station precipitation data and for the TRMM, GSMaP, CMORPH,PERSIANN and APHRODITE projects for creating and making available their precipitation products.This work is part of the project “Adaptation for climate change by livestock smallholders in Gandaki riverbasin”, supported by the USAID Feed the Future Innovation Lab for Collaborative Research for AdaptingLivestock Systems to Climate Change at Colorado State University under subaward 9650-32. Allstatements made are the views of the authors and not the opinions of the funders or the US government.
Conflicts of Interest
The authors declare no conflict of interest.

Remote Sens. 2013, 5 4121
References
1. Viviroli, D.; Durr, H.H.; Messerli, B.; Meybeck, M.; Weingartner, R. Mountains of the world,water towers for humanity: Typology, mapping, and global significance. Water Resour. Res. 2007,43, W07447.
2. Viviroli, D.; Archer, D.R.; Buytaert, W.; Fowler, H.J.; Greenwood, G.B.; Hamlet, A.F.; Huang, Y.;Koboltschnig, G.; Litaor, M.I.; Lopez-Moreno, J.I.; et al. Climate change and mountain waterresources: Overview and recommendations for research, management and policy. Hydrol. EarthSyst. Sci. 2011, 15, 471–504.
3. Tian, Y.; Peters-Lidard, C.D. A global map of uncertainties in satellite-based precipitationmeasurements. Geophys. Res. Lett. 2010, 37, doi:10.1029/2010GL046008.
4. Chalise, S.B.; Shrestha, M.L.; Thapa, K.B.; Shrestha, B.R.; Bajracharya, B. Climateand Hydrological Atlas of Nepal; International Center for Integrated Mountain Development:Kathmandu, Nepal, 1996.
5. Manandhar, S.; Pandey, V.P.; Kazama, F. Application of Water Poverty Index (WPI) in Nepalesecontext: A case study of Kali Gandaki River Basin (KGRB). Water Resour. Manag. 2012, 26,89–107.
6. Merz, J.; Nakarmi, G.; Shrestha, S.K.; Dahal, B.M.; Dangol, P.M.; Dhakal, M.P.; Dongol, B.S.;Sharma, S.; Shah, P.B.; Weingartner, R. Water: A scarce resource in rural watersheds of Nepal’sMiddle Mountains. Mt. Res. Dev. 2003, 23, 41–49.
7. Winiger, M.; Gumpert, M.; Yamout, H. Karakorum-Hindukush-western Himalaya: Assessinghigh-altitude water resources. Hydrol. Process. 2005, 19, 2329–2338.
8. Hannah, D.M.; Kansakar, S.R.; Gerrard, A.; Rees, G. Flow regimes of Himalayan Rivers of Nepal:Nature and spatial patterns. J. Hydrol. 2005, 308, 18–32.
9. Agrawala, S.; Raksakulthai, V.; van Aalst, M.; Larsen, P.; Smith, J.; Reynolds, J. Development andClimate Change in Nepal: Focus on Water Resources and Hydropower; Technical Report; OECD:Paris, France, 2003.
10. Chalise, S.R.; Khanal, N.R. Recent Extreme Weather Events in the Nepal Himalayas. In TheExtremes of the Extremes: Extraordinary Floods; Snorrason, A., Finnsdotir, H.P., Moss, M.E.,Eds.; International Association of Hydrological Science: New York, USA, 2002; Volume 271,pp. 141–146.
11. Merz, J.; Dangol, P.M.; Dhakal, M.P.; Dongol, B.S.; Nakarmi, G.; Weingartner, R. Rainfall-runoffevents in a middle mountain catchment of Nepal. J. Hydrol. 2006, 331, 446–458.
12. Sharma, K.P. Climate Change: Trends and Impacts on the Livelihoods of People; Technical Report;Jalsrot Vikas Sanstha/Nepal Water Partnership: Kathmandu, Nepal, 2009.
13. Diodato, N.; Tartari, G.; Bellocchi, G. Geospatial rainfall modelling at eastern Nepalese highlandfrom ground environmental data. Water Resour. Manag. 2010, 24, 2703–2720.
14. Bhatt, B.C.; Nakamura, K. Characteristics of monsoon rainfall around the Himalayas revealed byTRMM precipitation radar. Mon. Wea. Rev. 2005, 133, 149–165.
15. Bookhagen, B.; Burbank, D.W. Topography, relief, and TRMM-derived rainfall variations alongthe Himalaya. Geophys. Res. Lett. 2006, 33, doi:10.1029/2006GL026037.

Remote Sens. 2013, 5 4122
16. Brown, J.E. An analysis of the performance of hybrid infrared and microwave satellite precipitationalgorithms over India and adjacent regions. Remote Sens. Environ. 2006, 101, 63–81.
17. Islam, M.N.; Uyeda, H. Use of TRMM in determining the climatic characteristics of rainfall overBangladesh. Remote Sens. Environ. 2007, 108, 264–276.
18. Yatagai, A.; Kawamoto, H. Quantitative estimation of orographic precipitation over the Himalayasby using TRMM/PR and a dense network of rain gauges. Proc. SPIE 2008, 7148, 71480C,doi:10.1117/12.811943.
19. Shrestha, M.; Artan, G.; Bajracharya, S.; Sharm, R. Using satellite-based rainfall estimates forstreamflow modelling: Bagmati Basin. J. Flood Risk Manag. 2008, 1, 89–99.
20. Islam, M.N.; Das, S.; Uyeda, H. Calibration of TRMM derived rainfall over Nepal during1998–2007. Open Atmos. Sci. J. 2010, 4, 12–23.
21. Duncan, J.M.A.; Biggs, E.M. Assessing the accuracy and applied use of satellite-derivedprecipitation estimates over Nepal. Appl. Geogr. 2012, 34, 626–638.
22. Andermann, C.; Bonnet, S.; Gloaguen, R. Evaluation of precipitation data sets along the Himalayanfront. Geochem. Geophys. Geosyst. 2011, 12, doi:10.1029/2011GC003513.
23. Yamamoto, M.K.; Ueno, K.; Nakamura, K. Comparison of satellite precipitation products withrain gauge data for the Khumb region, Nepal Himalayas. J. Meteorol. Soc. Jpn. Ser. II 2011,89, 597–610.
24. Kummerow, C.; Barnes, W.; Kozu, T.; Shiue, J.; Simpson, J. The Tropical Rainfall MeasuringMission (TRMM) sensor package. J. Atmos. Ocean. Technol. 1998, 15, 809–817.
25. Huffman, G.; Adler, R.; Bolvin, D.; Nelkin, E. The TRMM Multi-Satellite Precipitation Analysis(TMPA). In Satellite Rainfall Applications for Surface Hydrology; Gebremichael, M., Hossain, F.,Eds.; Springer: Dordrecht, The Netherlands, 2010; pp. 3–22.
26. Kubota, T.; Shige, S.; Hashizume, H.; Aonashi, K.; Takahashi, N.; Seto, S.; Takayabu, Y.; Ushio, T.;Nakagawa, K.; Iwanami, K.; et al. Global precipitation map using satellite-borne microwaveradiometers by the GSMaP project: Production and validation. IEEE Trans. Geosci. Remote Sens.2007, 45, 2259–2275.
27. Ushio, T.; Kachi, M. Kalman Filtering Applications for Global Satellite Mapping of Precipitation(GSMaP). In Satellite Rainfall Applications for Surface Hydrology; Gebremichael, M., Hossain, F.,Eds.; Springer: Dordrecht, The Netherlands, 2010; pp. 105–123.
28. Joyce, R.J.; Janowiak, J.E.; Arkin, P.A.; Xie, P. CMORPH: A method that produces globalprecipitation estimates from passive microwave and infrared data at high spatial and temporalresolution. J. Hydrometeorol. 2004, 5, 487–503.
29. Hong, Y.; Hsu, K.L.; Sorooshian, S.; Gao, X. Precipitation estimation from remotely sensedimagery using an artificial neural network cloud classification system. J. Appl. Meteorol. 2004,43, 1834–1853.
30. Yatagai, A.; Kamiguchi, K.; Arakawa, O.; Hamada, A.; Yasutomi, N.; Kitoh, A. APHRODITE:Constructing a long-term daily gridded precipitation dataset for Asia based on a dense network ofrain gauges. Bull. Am. Meteorol. Soc. 2012, 93, 1401–1415.
31. Merz, J. Water Balances, Floods and Sediment Transport in the HKH. Ph.D. Thesis, University ofBerne, Berne, Switzerland, 2004.

Remote Sens. 2013, 5 4123
32. Bonasoni, P.; Laj, P.; Angelini, F.; Arduini, J.; Bonafe, U.; Calzolari, F.; Cristofanelli, P.;Decesari, S.; Facchini, M.; Fuzzi, S.; et al. The ABC-Pyramid Atmospheric Research Observatoryin Himalaya for aerosol, ozone and halocarbon measurements. Sci. Total Environ. 2008,391, 252–261.
33. Nash, J.; Sutcliffe, J. River flow forecasting through conceptual models Part I—A discussion ofprinciples. J. Hydrol. 1970, 10, 282–290.
34. Duncan, J.M.A.; Biggs, E.M.; Dash, J.; Atkinson, P.M. Spatio-temporal trends in precipitation andtheir implications for water resources management in climate-sensitive Nepal. Appl. Geogr. 2013,43, 138–146.
35. Brown, S.; Desai, S.; Keihm, S.; Lu, W. Microwave radiometer calibration on decadal timescales using on-Earth brightness temperature references: Application to the TOPEX MicrowaveRadiometer. J. Atmos. Oceanic Technol. 2009, 26, 2579–2591.
36. Fisher, B.; Wolff, D.B. Satellite sampling and retrieval errors in regional monthly rain estimatesfrom TMI, AMSR-E, SSM/I, AMSU-B, and the TRMM PR. J. Appl. Meteorol. Climatol. 2011,50, 994–1023.
37. Tesfagiorgis, K.; Mahani, S.E.; Krakauer, N.Y.; Khanbilvardi, R. Bias correction of satellite rainfallestimates using a radar-gauge product—A case study in Oklahoma (USA). Hydrol. Earth Syst. Sci.2011, 15, 2631–2647.
38. Sugiura, T. Satellite-Based Assessment of Flood Risk and Flood Exposure; Technical Report;Center for River Basin Organizations and Management, Solo, Central Java, Indonesia, 2010.
39. Juglea, S.; Kerr, Y.; Mialon, A.; Lopez-Baeza, E.; Braithwaite, D.; Hsu, K. Soil moisture modellingof a SMOS pixel: Interest of using the PERSIANN database over the Valencia Anchor Station.Hydrol. Earth Syst. Sci. 2010, 14, 1509–1525.
40. Ouma, Y.O.; Owiti, T.; Kipkorir, E.; Kibiiy, J.; Tateishi, R. Multitemporal comparative analysisof TRMM-3B42 satellite-estimated rainfall with surface gauge data at basin scales: Daily, decadaland monthly evaluations. Int. J. Remote Sens. 2012, 33, 7662–7684.
c⃝ 2013 by the authors; licensee MDPI, Basel, Switzerland. This article is an open access articledistributed under the terms and conditions of the Creative Commons Attribution license(http://creativecommons.org/licenses/by/3.0/).