evaluating the geomorphic channel response to beaver dam
TRANSCRIPT

Syracuse University Syracuse University
SURFACE SURFACE
Theses - ALL
June 2020
Evaluating the geomorphic channel response to beaver dam Evaluating the geomorphic channel response to beaver dam
analogue installation using unoccupied aerial vehicles analogue installation using unoccupied aerial vehicles
Julianne Davis Syracuse University
Follow this and additional works at: https://surface.syr.edu/thesis
Part of the Physical Sciences and Mathematics Commons
Recommended Citation Recommended Citation Davis, Julianne, "Evaluating the geomorphic channel response to beaver dam analogue installation using unoccupied aerial vehicles" (2020). Theses - ALL. 426. https://surface.syr.edu/thesis/426
This Thesis is brought to you for free and open access by SURFACE. It has been accepted for inclusion in Theses - ALL by an authorized administrator of SURFACE. For more information, please contact [email protected].

Abstract
Beaver dam analogues (BDAs) are a stream restoration technique that is rapidly gaining
popularity in the western United States. These low-cost stream-spanning structures, designed
after natural beaver dams, are being installed to confer the ecologic, hydrologic and geomorphic
benefits of beaver dams in streams that are too degraded to provide suitable beaver habitat.
BDAs can slow streamflow, reduce the erosive power of the stream and promote aggradation,
making them attractive restoration tools in incised channels. Despite increasing enthusiasm for
BDAs, few studies to date have evaluated the impacts of these structures on channel
morphology. Here, we examine the geomorphic changes that occurred within the first year of
restoration efforts in south-central Wyoming using high-resolution visible light orthophotos and
elevation data collected with unoccupied aerial vehicles (UAVs). By leveraging the advantages
of rapidly acquired images captured by low-cost UAV surveys with recent advancements in
Structure from Motion photogrammetry, we constructed centimeter-scale digital elevation
models (DEMs) of the restoration reach and an upstream reference reach. Through DEM
differencing, we identified areas of enhanced erosion and deposition around the BDAs,
suggesting that BDA installation initiated a unique geomorphic response beyond the scale of
natural channel variability. However, we measured net erosion in both reaches which is counter
to the desired restoration outcome of net aggradation around the BDAs. This net loss of sediment
is inconsistent with studies of natural beaver dams, underscoring the differences between BDAs
and the dams that inspired their construction, but is in agreement with theoretical channel
evolution models of beaver-related stream restoration. To better understand the impacts of BDAs
on channel morphology and restoration efforts throughout the Mountain West, it is imperative

that we consistently assess the effects of beaver-inspired restoration projects across a range of
hydrologic and geomorphic settings and that we continue this monitoring for years to decades.

EVALUATING THE GEOMORPHIC CHANNEL RESPONSE TO BEAVER DAM
ANALOGUE INSTALLATION USING UNOCCUPIED AERIAL VEHICLES
by
Julianne M.S. Davis
B.A. State University of New York at Geneseo, 2016
THESIS
Submitted in partial fulfillment of the requirements for the degree of
Master of Science in Earth Sciences
Syracuse University
June 2020

Copyright © Julianne Davis 2020
All Rights Reserved

v
Acknowledgements
I am incredibly grateful to my mentors and colleagues at Syracuse University and
beyond. Thank you to the faculty, students and staff in the Earth and Environmental Sciences
Department at Syracuse University for encouraging my development as a scientist and for
providing me with the opportunities and support that led to this thesis. Thank you to my
colleagues in the Lautz research group for your feedback and suggestions over the last two years.
I would particularly like to thank Nathaniel Chien for collecting the 2017 data and getting this
project off the ground, J.R. Slosson for his thoughtful comments on my manuscript and Julio
Beltran for his unwavering positivity and strong work ethic during the second field season. In
addition, I thank Ruta Basijokaite for her constant encouragement and for the coffee breaks that
fueled much of the data analysis in this thesis.
Thank you to the Central New York Association of Professional Geologists, the Syracuse
University Earth and Environmental Sciences Department and the Education Model Program on
Water-Energy Research (No. DGE-1449617) for financially supporting this project. I would also
like to acknowledge support from the National Science Foundation Graduate Research
Fellowship (Grant No. 1650114). Thank you to Andrea Turnbull for organizing and disbursing
these awards and to Annie Pennella for reviewing my many seed grant proposals and for being a
constant source of encouragement. I would also like to thank the founding and current principal
investigators of EMPOWER, Dr. Laura Lautz and Dr. Charles Driscoll, for conceiving of and
ensuring the success of this program.
This work would not be possible without our collaborators at The Nature Conservancy of
Wyoming, particularly John Coffman, Dr. Courtney Larson and Dr. Corinna Riginos. Thank you
for inviting us to partner with you on this project, providing access to the research site and

vi
assisting with field work. I appreciate everything you have taught me about Red Canyon Ranch,
the social and political context of beaver-inspired restoration, and the importance of effective
communication across organizations and disciplines. In addition, I would like to thank Chris
Kratt and Chris Sladek from the Air Center for Transformative Environmental Monitoring
Programs for their timely and effective provision of experimental design support, logistical
support and equipment for the project (NSF EAR awards 1440596 and 1440506).
I am extremely grateful to the beaver dam analogue research team. Thank you to Dr.
Chris Russoniello for teaching me different field methods and for helping me grow as a research
scientist. Thank you to my committee member Dr. Philippe Vidon for his research guidance and
for keeping the team’s spirit strong during long days in the field. Thank you to my committee
member Dr. Christa Kelleher for fostering and sharing my excitement for UAVs, for her insight
during the research process and for encouraging me to pursue multiple funding and professional
development opportunities. I would especially like to thank my advisor, Dr. Laura Lautz. Thank
you for the opportunity to be part of this incredible team, for encouraging me to invest in all
aspects of my development as a scientist and for your thoughtful mentorship. In addition, I
would like to thank Casey Pearce for her unwavering support, for sharing this experience with
me and for being there during all the highs and lows of the research process.
A final word of appreciation goes to my family and friends for their encouragement and
love. A special thank you to Aaron Davis for always believing in me, cheering me on and
sharing my passion. Few people would be excited about building a beaver dam analogue in the
pond behind the house or spending two days of our vacation doing fieldwork and I am grateful
that you are one of those people.

vii
Table of Contents
Abstract ........................................................................................................................................... i
Acknowledgements ....................................................................................................................... v
Table of Contents ........................................................................................................................ vii
List of Figures ............................................................................................................................. viii
List of Tables ................................................................................................................................ ix
1. Introduction ............................................................................................................................... 1
2. Methods ...................................................................................................................................... 6
2.1 Study Area ............................................................................................................................. 6
2.2 Unoccupied Aerial Vehicle (UAV) Surveys ......................................................................... 8
2.3 Image Processing and DEM Creation ................................................................................... 9
2.4 DEM Error Analysis............................................................................................................ 10
2.5 DEM Differencing and Change Detection .......................................................................... 12
3. Results ...................................................................................................................................... 13
3.1 DEM Accuracy Assessment ................................................................................................ 13
3.2 Planform Changes in Channel Morphology ........................................................................ 15
3.3 Geomorphic Changes from DEM Differencing .................................................................. 15
4. Discussion................................................................................................................................. 19
4.1 Do BDAs Initiate a Unique Morphologic Response? ......................................................... 19
4.2 Can BDAs Achieve Restoration Goals?.............................................................................. 22
4.3 Are UAVs a Viable Tool for Assessing Geomorphic Changes in Fluvial Systems? .......... 26
5. Conclusion ............................................................................................................................... 29
Figures .......................................................................................................................................... 32
Tables ........................................................................................................................................... 39
References .................................................................................................................................... 41
Curriculum Vitae ........................................................................................................................ 48

viii
List of Figures
Figure 1. Study site ...................................................................................................................... 32
Figure 2. Elevation difference density plots ................................................................................ 33
Figure 3. Orthophotos of the beaver dam analogues (BDAs), 2017–2019 .................................. 33
Figure 4. 2018 and 2019 digital elevation models (DEMs) and DEM of difference (DoD) ....... 34
Figure 5. Thresholded DoDs for the BDA reach and the reference reach ................................... 35
Figure 6. Areal and volumetric elevation change distributions ................................................... 36
Figure 7. Cross sections from the DEMs and 2019 field survey ................................................. 37
Figure 8. Field photos of BDA breaches...................................................................................... 38

ix
List of Tables
Table 1. UAV flight information and details on elevation data ................................................... 39
Table 2. DEM error metrics ......................................................................................................... 39
Table 3. Areas and volumes of morphologic changes ................................................................. 40
Table 4. Change in water surface elevation over the BDAs, July 2019 ....................................... 40
1
1. Introduction
Channel incision is a widespread phenomenon that is causing ecosystem degradation in
streams and adjacent riparian areas throughout the western United States (e.g. Chaney, Elmore
and Platts, 1990; Pollock, Beechie and Jordan, 2007; Beechie, Pollock and Baker, 2008; Polvi
and Wohl, 2013; Pollock et al., 2014; Livers et al., 2018). While it is difficult to identify a single
driver of this incision in most hydrologic systems, climate change and human activity have been
linked with accelerated downcutting and stream deterioration. In arid and semi-arid regions of
the western United States, natural erosive processes induced by strong precipitation events and
high topographic relief are exacerbated by shifts in the intensity and frequency of precipitation,
the timing of peak spring streamflow and recent human alteration of stream channels and
floodplains (Naiman, Johnston and Kelley, 1988; Chaney et al., 1990; Pollock et al., 2007;
Beechie et al., 2008; Polvi and Wohl, 2013; Livers et al., 2018). Changes in land use, particularly
hydromodification and water diversion (e.g. Pollock et al., 2007; Burchsted, Daniels, Thorson
and Vokoun, 2010), the conversion of productive bottomlands to agricultural fields (e.g. Wohl,
2005), overgrazing in riparian corridors (e.g. Apple, 1985; Chaney et al., 1990; Trimble and
Mendel, 1995) and the decline in beaver populations due to habitat loss and trapping (Naiman et
al., 1988; Pollock, Heim and Werner, 2003; Pollock et al., 2007; Polvi and Wohl, 2013) have
further diminished channel stability.
Degradation resulting from these natural and anthropogenic disturbances leads to channel
confinement. As the streambed erodes and streamflow is constricted between steep, nearly
vertical banks, base level decreases. Streams become physically and hydrologically severed from
elevated floodplains and the local water table drops. These hydrologic responses limit surface
water-groundwater exchange and cause riparian vegetation to senesce, reducing plant density and
diversity (e.g. Apple, 1985; Krueper, 1993). Although riparian zones cover < 1% of land area,

2
they are extremely productive and provide critical forage, habitat, and surface water access in
otherwise dry regions, making these narrow vegetated corridors a key focus of restoration efforts
in the western United States (Apple, 1985; Chaney et al., 1990; Krueper, 1993; Bouwes et al.,
2016).
Given the hydrologic and ecologic impacts of channel incision, the goal of many stream
restoration projects in degraded systems is to counter the erosive processes dominating in the
channel. By minimizing erosion and promoting aggradation, restoration efforts seek to raise the
streambed and reconnect the stream and floodplain (e.g. Palmer et al., 2005; Pollock et al., 2007;
Beechie et al., 2010; Curran and Cannatelli, 2014; Pollock et al., 2014). Strategies to reshape
stream geometry range from invasive and expensive to more passive and low-cost approaches.
As interest in natural channel design and process-based restoration has increased, dramatic
restoration efforts such as channel fill and relocation have given way to smaller scale projects
using engineered rock weirs, cross-vanes and check dams (Rosgen, 2001; Wilcox, Benoit and
Mink, 2001; Fanelli and Lautz, 2008; Beechie et al., 2010; Rosgen, 2013; Norman et al., 2017).
More passive, ecologically-focused approaches seek to initiate restoration by replanting
vegetation near the stream to improve bank stability, by adding large woody debris to create
more complex streamflow patterns and by encouraging beaver reintroduction and dam building
to dissipate flow energy (Apple, 1985; Wohl, 2015; Bouwes et al., 2016).
As beaver populations have recovered in the western United States, land owners, land
managers and researchers have noted the hydrologic, geomorphic and ecologic benefits of beaver
dams (Apple, 1985; Naiman et al., 1988; Butler and Malanson, 1995; Meentemeyer and Butler,
1999; Pollock et al., 2007; 2014). However, beaver translocation and reintroduction are not
feasible in all settings. Beaver-human conflict, such as nuisance beaver activity, limit the areas

3
where beavers can be successfully introduced (Pollock et al., 2014; Dittbrenner et al., 2018;
Pilliod et al., 2018). In addition, some systems are too degraded to support beavers, particularly
those that are deeply incised or lack adequate vegetation for dam construction and food (Pollock
et al., 2014; Dittbrenner et al., 2018; Lautz et al., 2019). In systems such as these, beaver-
inspired restoration efforts such as beaver dam analogues (BDAs) are quickly gaining popularity
(Pollock et al., 2014; Pilliod et al., 2018; Lautz et al., 2019; Shahverdian et al., 2019; Scamardo
and Wohl, 2020).
BDAs are stream-spanning structures that are constructed from natural materials and are
intended to mimic natural beaver dams in both form and function (Pollock et al., 2014; 2017;
Pilliod et al., 2018; Shahverdian et al., 2019). BDAs are semi-permeable and are designed to be
dynamic, short-term restoration tools (Lautz et al., 2019). Typically, BDAs are built by pounding
wooden fence posts vertically into the streambed, weaving willow or other vegetation through
the posts and stabilizing the dam with gravel and streambed sediments (Pollock et al., 2017;
Shahverdian et al., 2019) but construction varies based on geomorphic settings, local vegetation
and project budgets. Like natural beaver dams, BDAs can create upstream impoundments,
elevate stream water and local groundwater levels, reduce flow velocities and induce deposition
of suspended sediments, all of which contribute to restoring connectivity between the stream and
floodplain (Apple, 1985; Naiman et al., 1988; Meentemeyer and Butler, 1999; Westbrook,
Cooper and Baker, 2006; Pollock et al., 2007; 2014). The widespread adoption of BDAs
throughout the western United States is likely a result of their simple design and construction
using primarily natural materials, making them a relatively inexpensive restoration strategy
(Pollock et al., 2017; Pilliod et al., 2018; Shahverdian et al., 2019).
4
Despite the inferred similarities between beaver dams and BDAs, there is uncertainty
about whether they can create the same morphologic changes especially in degraded systems
(Pollock et al., 2014; Lautz et al., 2019). Although BDAs are intended to deliver the benefits of
natural beaver dams in the absence of beavers, the two structures have unique construction,
lifespans, maintenance frequency and geomorphic settings. Beavers continuously repair and
rebuild their dams, which can last decades (Butler, 1995), while BDAs generally receive annual
maintenance and have design lifespans of just a few years (Johnson et al., 2019; Lautz et al.,
2019). BDAs can be installed in incised channels that offer only marginal beaver habitat due to
concentrated flow energy, steep banks and limited riparian vegetation (Pollock et al., 2014;
Dittbrenner et al., 2018; Pilliod et al., 2018; Lautz et al., 2019). Additionally, most studies on the
morphologic impacts of beaver dams span decades, enabling assessments of the long-term
impacts of beaver dams on the landscape (e.g. Meentemeyer and Butler, 1999; Westbrook,
Cooper and Baker, 2011; Levine and Meyer, 2014). In contrast, BDAs are a relatively new
restoration technique and most projects are still in the early stages. Altogether, there is a dearth
of information and peer-reviewed studies to date on the impacts of BDA installation despite
strong interest from land managers and the increasing popularity of beaver-inspired stream
restoration (Majerova et al., 2015; Bouwes et al., 2016; Pilliod et al., 2018; Silverman et al.,
2018; Vanderhoof and Burt, 2018; Weber et al., 2018; Scamardo and Wohl, 2020).
BDAs are intended to be installed in sequence, similar to natural beaver dam
construction, with the entire BDA complex spanning hundreds of meters to a few kilometers
along a stream (Pollock et al., 2014; Bouwes et al., 2016; Vanderhoof and Burt, 2018; Scamardo
and Wohl, 2020). Therefore, analyzing the geomorphic impacts of these restoration structures
necessitates matching the scale of measurement with the scale of the restoration project such that

5
geomorphic changes can be resolved at individual BDAs as well as along a kilometer-scale
reach. At fine scales, field-based methods such as erosion pins and topographic field surveys
provide detailed point measurements at the expense of time and spatial density (Lawler, 1993;
Pollock et al., 2007; Curran and Cannatelli, 2014). At coarser scales, airborne light detection and
ranging (LiDAR) surveys generate spatially continuous, decimeter-scale topographic data along
several kilometers of a stream but these surveys are cost prohibitive for many projects (e.g.
Brasington, Vericat and Rychkov, 2012; Cook, 2017). In contrast and as a complement to these
other approaches, unoccupied aerial vehicles (UAVs) can be deployed quickly and are a user
friendly, low cost platform for acquiring visible light (red-green-blue, RGB) images of a
restoration area. The RGB images can be used to generate both orthophotos and topographic data
when combined with Structure from Motion (SfM) photogrammetric software (e.g. Westoby,
Brasington, Glasser, Hambrey and Reynolds, 2012; Fonstad, Dietrich, Courville, Jensen and
Carbonneau, 2013). SfM-generated topographic data have accuracies comparable to airborne
LiDAR and topographic field surveys while offering flexibility in the temporal and spatial scales
of observation (e.g. Fonstad et al., 2013; Cook, 2017). UAV- and SfM-based geomorphic
analyses have been performed to estimate erosion in agricultural drainages (Prosdocimi,
Caligaro, Sofia, Dalla Fontana and Tarolli, 2015) and after intense flooding events (Tamminga,
Eaton and Hugenholtz, 2015; Cook, 2017). Though many studies have affirmed the accuracy of
UAV- and SfM-derived measurements of fluvial processes (e.g. Prosdocimi et al., 2015;
Tamminga et al., 2015; Hamshaw et al., 2017; Marteau, Vericat, Gibbins, Batalla and Green,
2017), there are fewer examples of UAV and SfM application in analyzing geomorphic changes
resulting from stream restoration efforts (e.g. Carrivick and Smith, 2018; Duró, Crosato,
Kleinhans and Uijttewaal, 2018).

6
In this study, we examine the morphologic response to a BDA restoration project in Red
Canyon Creek, Wyoming, to understand the impacts of BDA installation on channel form and
fluvial processes. Using data from annual UAV surveys, we assess the geomorphic changes that
occurred during the first year after BDAs were installed in an incised channel. By comparing the
morphologic response near the BDAs with geomorphic changes in an upstream reference reach,
we constrain the impacts of the BDAs from natural channel variability to better understand the
geomorphic outcomes of beaver-inspired restoration efforts. As the literature on BDAs is limited
and few field studies have considered the impacts of BDAs on channel morphology (e.g.
Scamardo and Wohl, 2020), our work provides some of the first benchmarking of geomorphic
adjustments in response to BDA installation. We also consider the advantages and limitations of
using UAVs and SfM to measure channel response to restoration efforts. As BDAs continue to
gain popularity, developing a thorough understanding of their potential benefits and limitations is
necessary to inform future beaver-inspired restoration efforts.
2. Methods
2.1 Study Area
Red Canyon Creek is a meandering third-order stream in south-central Wyoming, on the
eastern flank of the Wind River Range (Figure 1). The 84 km2 watershed is largely coincident
with Red Canyon Ranch, an active cattle ranch owned and sustainably managed by The Nature
Conservancy (TNC) of Wyoming (Lautz, Siegel and Bauer, 2006). Red Canyon Creek flows
south to north through Red Canyon Ranch and is fed by two tributaries, Barret Creek and Cherry
Creek, before discharging into the Little Popo Agie River. In this semi-arid region, peak
streamflow occurs during snowmelt in the late spring and early summer (Lautz et al., 2006).
7
Stream substrate and alluvial floodplain sediments are predominantly sandy gravel and silt and
are sourced from the Triassic Chugwater Formation, an iron-rich sandstone and siltstone that
underlies the eastern half of the watershed (Lautz et al., 2006; Fanelli and Lautz, 2008). The
streambed is incised approximately 1.5 m to 3 m below the floodplain.
TNC has encouraged beaver activity in the watershed and local beaver populations have
intermittently occupied reaches of Red Canyon Creek (Lautz et al., 2006), although today
isolated beaver colonies inhabit only the upper tributaries in the watershed. Beavers last occupied
the lower reaches of Red Canyon Creek in 2015. The recent loss of beavers and their dams,
coupled with above average precipitation and streamflow events since 2015, has exacerbated
legacy incision and further disconnected the stream from the riparian floodplain.
To counter this degradation, TNC installed five beaver dam analogues (BDAs) along a
~250 m reach of Red Canyon Creek in 2018 (Figure 1c) with the goals of slowing streamflow,
particularly during spring peak flows, and promoting aggradation on the streambed to begin
reconnecting the stream and floodplain. The first BDA (BDA 2) was built in April 2018 and the
remaining four were installed in August 2018 during a field workshop on BDA restoration
practices hosted by TNC, Utah State University and the Natural Resources Conservation Service.
The BDAs were built using a variety of construction approaches, with the central three BDAs
(BDAs 2–4) constructed following the prototypical post and willow design and placed
approximately 30 m apart. BDA 1 was constructed using a post-less adaptation of the typical
BDA design and BDA 5 was built without gravel or sediments. The two distal BDAs were
destroyed within one year of installation.
The stream segments analyzed in this study are located in an approximately 500 m reach
of Red Canyon Creek downstream of the confluence with Cherry Creek (Figure 1b–c). In this

8
lower reach, the stream gradient is less than 2% (Lautz et al., 2006) and the channel is incised
about 1 to 2 m below the adjacent riparian floodplain. The experimental BDA reach spans
approximately 100 m of the stream and includes the central BDA complex (BDAs 2, 3 and 4).
Since BDAs 1 and 5 were destroyed before the 2019 UAV survey, they are excluded from the
BDA reach. A portion of Red Canyon Creek approximately 150 m upstream of the BDA
installation sites was selected as the reference reach. The reference reach is approximately 130 m
in length. Like the BDA reach, it flows transversely across the floodplain and has a sinuosity of
1.6, similar to the BDA reach sinuosity of 1.5. Due to the distance between the two reaches, any
potential influence of restoration activity on the reference reach is minimized.
2.2 Unoccupied Aerial Vehicle (UAV) Surveys
Annual unoccupied aerial vehicle (UAV) surveys were conducted from 2017 to 2019 to
capture the geomorphic changes related to BDA installation (Table 1). The first survey occurred
one year prior to BDA installation (August 2017), the second survey was completed less than a
week after BDA installation (August 2018) and the third survey was approximately one year
following BDA installation (July 2019). Flights were contracted with the Air Center for
Transformative Environmental Monitoring Programs (CTEMPs) from Oregon State University
and the University of Nevada, Reno. Air CTEMPs generated the flight plans and executed the
UAV surveys. In each flight, forward image overlap and image sidelap were at least 70% to
ensure repeat coverage of the entire study area and to allow for the creation of precise, high-
resolution digital elevation models (DEMs). In 2017 and 2018, geotagged nadir visible light
images were collected using a Sony A5100 onboard a DJI Phantom 4. In 2019, images were
captured with a Sony R10 mounted on a DJI M600. All flight details are summarized in Table 1.

9
Prior to each survey, we placed 10 to 13 targets throughout the study area to serve as
ground control points (GCPs) for positional registering during subsequent photogrammetry. In
2017, we used 0.3 m (1 ft) white bucket lids marked with black electrical tape as GCPs. In 2018
and 2019, we constructed the GCPs from 0.3 m (1 ft) black and white checkered floor tiles
fastened to 1.8 m (6 ft) lengths of white tarp to increase the visibility of the GCPs in UAV
images. We measured the coordinates of each GCP relative to a local benchmark using a Nikon
Nivo 5.M total station, which has horizontal (northing and easting) accuracy and precision of 2
cm and vertical (elevation) accuracy and precision of 0.6 cm.
2.3 Image Processing and DEM Creation
The UAV images were processed in Agisoft PhotoScan Pro version 1.3.4 using the same
settings throughout the workflow for each year (Agisoft, 2017). Where applicable, we present the
settings we used at each processing step. After the images were uploaded the software computed
image quality, a parameter based on image sharpness that ranges from zero (blurred) to one (very
sharp). We discarded images with sharpness values less than 0.7 (compared to a recommended
threshold of 0.5; Agisoft, 2017), applying a more conservative threshold so that only the clearest
images were retained. Across the three years, we removed only seven images (all from 2019) due
to poor image quality caused by blur and glare.
PhotoScan then aligned the images by automatically detecting the same feature in at least
two overlapping images. To specify the criteria for aligning images, we assigned a key point
limit of 40,000 and a tie point limit of 4,000. Based on these settings, PhotoScan identified
40,000 unique features in each image based on attributes such as brightness and color (Fonstad et
al., 2013). Of those 40,000 points, 10% were retained as tie points. The 4,000 tie points were

10
used to calculate internal and external camera orientations and parameters as well as to perform a
scale invariant feature transform, generating a sparse 3D point cloud with spatial positioning
determined from the 2D geotagged images (James and Robson, 2012; Westoby et al., 2012;
Fonstad et al., 2013). We refined the spatial accuracy of the sparse point cloud by visually
identifying each GCP in at least two images and marking GCP centers with the surveyed
coordinates. The resulting registered point cloud was projected into the WGS 84 / UTM Zone
12N (EPSG::32612) coordinate system.
Using the sparse point cloud, we performed a gradual selection process to remove tie
points with high errors or uncertainties and to optimize camera calibration parameters. We
removed tie points generated from fewer than three images, with reconstruction uncertainties less
than 10 pixels, with reprojection errors less than 0.5 pixels or with projection accuracies less than
10 cm. During this iterative process, we deleted approximately 80% of the tie points. PhotoScan
then generated a final dense point cloud from the remaining tie points using a mild depth filter
and medium quality. The mild depth filter retained fine-scale details in the point cloud and
preserved data continuity and the medium quality setting reduced computation time by
subsampling images by a factor of four. The resulting dense point clouds contained between ~27
million and 78 million points and were used to produce digital elevation models (DEMs) with
resolutions from 3.5 cm pixel-1 to 6.9 cm pixel-1 (Table 1). DEMs and high resolution
orthophotos were then exported to ArcMap 10.7 for further analysis.
2.4 DEM Error Analysis
As an independent measure of DEM accuracy, we conducted a detailed topographic field
survey in 2019 coincident with the UAV flight. Using a Nikon Nivo 5.M total station, we

11
measured the locations of 24 static well casings on the floodplain and 165 submerged points
upstream and downstream of BDAs 2–4 to serve as check points, as well as water surface
elevations around each BDA. We compared the elevations of the check points with DEM-
derived elevations to calculate error metrics (mean error, root mean square error, standard
deviation of error, maximum absolute error) for both dry and wet areas. For dry areas, we
compared elevations only where the well casings were clearly visible in the orthophotos to
minimize the influence of vegetation on DEM-reported elevations. Errors were calculated by
subtracting field-measured elevations from DEM-generated elevations. Negative errors indicate
that the DEM underpredicts elevations and positive errors indicate that the DEM elevations are
higher than surveyed elevations.
Given that there are known issues with estimating elevations in submerged areas, we
tested a refraction correction on the 2019 DEM with our highly resolved survey observations (n
= 165). The correction is based on the index of refraction at the air-water interface and is applied
to account for the systematic overestimation of submerged topography in SfM-generated DEMs
(e.g. Westaway, Lane and Hicks, 2000; 2001; Woodget, Carbonneau, Visser and Maddock,
2015). Other corrections use pixel RGB or brightness values and are based on changes in water
color with increasing depth (e.g. Westaway, Lane and Hicks, 2003; Tamminga, Hugenholtz,
Eaton and Lapointe, 2014; Strick et al., 2019) but due to a change in camera and image colors
between 2018 and 2019 (Table 1), we did not test a color-based correction. To estimate true
streambed elevations, we calculated water depths based on the 2019 DEM and multiplied the
depths by the refractive index of water (n = 1.34), then subtracted the difference between the
corrected and uncorrected water depths from the DEM.

12
2.5 DEM Differencing and Change Detection
The DEMs were resampled to the coarsest resolution (6.9 cm pixel-1) and aligned to
ensure direct pixel-to-pixel comparisons. To highlight areas of geomorphic change after BDA
installation, we compared the 2018 and 2019 DEMs using Geomorphic Change Detection 7.0
(GCD) software (http://gcd.joewheaton.org) in ArcMap 10.7 (Wheaton, Brasington, Darby and
Sear, 2010). GCD calculated elevation changes between the successive DEMs to create DEMs of
difference (DoDs) for the BDA reach and the reference reach. By measuring the areal extent of
elevation changes in each reach, the GCD software estimated volumes of erosion and deposition
between 2018 and 2019. To minimize the impacts of vegetation and shadows on calculated
elevation changes, we restricted the analyses to areas of the study reaches where the channel was
visible in both years.
To distinguish true geomorphic changes from DEM error, we tested three uncertainty
thresholds commonly used in similar analyses: raw (unthresholded), a simple minimum level of
detection (minLoD; Brasington, Rumsby and McVey, 2000) and probabilistic thresholding at a
95% confidence interval (Wheaton et al., 2010). Elevation changes below the uncertainty
thresholds could not be confidently distinguished from noise in the DoDs and were discarded.
We calculated the minLoD by propagating the error in each DEM into the DoD (e.g. Brasington,
Langham and Rumsby, 2003; Lane, Westaway and Hicks, 2003), using
𝜀𝐷𝑜𝐷 = √(𝜀𝐷𝐸𝑀𝑛𝑒𝑤)2 + (𝜀𝐷𝐸𝑀𝑜𝑙𝑑)2 (1)
where 𝜀𝐷𝑜𝐷 is the propagated DoD error and 𝜀𝐷𝐸𝑀𝑛𝑒𝑤 and 𝜀𝐷𝐸𝑀𝑜𝑙𝑑 are the errors calculated
for each DEM. To calculate the 95% confidence interval (CI) threshold, we multiplied the
minLoD by the student’s t-value for the chosen confidence interval (t = 1.96 for the 95% CI).

13
Using each uncertainty threshold, the GCD software calculated the spatial extents and volumes
of geomorphic changes.
3. Results
3.1 DEM Accuracy Assessment
As this study analyzes morphologic changes after BDA installation, we focus on the 2018
and 2019 DEMs in the following text. The root mean square errors (RMSEs) calculated by
PhotoScan during point cloud creation and registration were generally consistent with the
accuracy of the total station used to survey the GCPs and orient the point cloud with real-world
coordinates (Table 1). In 2018 and 2019, the horizontal RMSEs calculated by PhotoScan and
used as a measure of accuracy ranged from 0.74 cm to 1.53 cm. These accuracies were lower
than the 2 cm accuracy of the total station which suggested that the modeled point clouds had
good spatial alignment with the surveyed real-world coordinates. The RMSEs were higher in
2019, at 1.53 cm and 1.42 cm for easting and northing, respectively, but were consistent with
total station accuracy and lower than the final DEM resolution of 6.9 cm pixel-1. Based on the
agreement between the low horizontal RMSEs and instrument accuracy, we are confident in the
positional accuracies of the resulting DEMs.
The elevation RMSE was below the total station accuracy of 0.6 cm in 2019 but reached
1.02 cm in 2018 (Table 1). The higher residual in 2018 suggested poorer agreement between
surveyed and modeled elevations after point cloud transformation and alignment. To further
examine this offset, we compared the DEM elevations with the surveyed elevations at the check
points on the floodplain (see Section 2.4 DEM Error Analysis). The RMSE and standard
deviation of the error (SDE), used as measurements of accuracy and precision, respectively, were
14
higher in 2018 (RMSE = 11.8 cm and SDE = 8.9 cm) than in 2019 (RMSE = 4.7 cm and SDE =
3.7 cm; Table 2), consistent with the annual error metrics calculated by PhotoScan (Table 1).
Five check points were excluded from the error calculations in 2018 (Table 2) due to vegetation
obscuring the well casings in the orthophoto. All error metrics were positive despite negative
elevation differences at some check points, showing that the DEM-reported elevations could be
higher or lower than the surveyed elevations (Figure 2a). The error statistics we calculated are
consistent with other UAV-based studies of fluvial geomorphology (e.g. Tamminga et al., 2015;
Cook, 2017; Marteau et al., 2017) and therefore are appropriate for DEM differencing.
For submerged portions of the channel, the refraction correction improved the accuracy
of DEM-derived bathymetry. After the correction, the mean error (ME) and RMSE decreased
from 36.4 cm to 27.3 cm and from 42 cm to 36.3 cm, respectively (Figure 2b and Table 2).
However, the uncorrected data had a higher precision with the SDE increasing from 20.9 cm to
24 cm after the correction. As the refraction correction did not consistently improve the elevation
measurements in submerged areas, we used the original uncorrected data in our analyses. We
acknowledge that the reported streambed elevations overestimated true stream bathymetry and
incorporate this offset into our calculations of geomorphic change.
Following Brasington et al. (2003) and Wheaton et al. (2010), we calculated the different
uncertainty thresholds using the SDE as the estimate of elevation error. Using Equation (1), we
calculated a minLoD of 9.8 cm. The probabilistic threshold was more restrictive, only retaining
elevation changes that were above a desired confidence interval. We calculated the 95% CI level
of detection by multiplying the minLoD by the corresponding t-value for the 95% CI (t = 1.96),
resulting in a 19.2 cm level of detection.

15
3.2 Planform Changes in Channel Morphology
The BDAs initiated a morphologic response in the stream that resulted in areas of both
deposition and erosion (Figure 3). From 2018 to 2019, deposition occurred upstream of BDAs 2
and 3 with lateral accretion concentrated on the insides of the meanders (Figure 3g–h). Much of
this deposition was on areas that were visibly vegetated in 2017 and 2018 (Figure 3a–b, 3d–e and
3g–h). Downstream of BDAs 3 and 4, erosion was the dominant morphologic change with >1 m
of cut bank retreat immediately downstream of each BDA (Figure 3h–i). We note that the visible
changes from 2017 to 2018 are restricted to changes in channel inundation due to water level
adjustments in response to BDA installation versus actual changes in channel morphology
(Figure 3a–f).
3.3 Geomorphic Changes from DEM Differencing
The elevation changes quantified in the DoDs are consistent with the planform changes
visible in the orthomosaic images with deposition upstream of BDAs 2 and 3 and erosion
downstream of BDAs 3 and 4 (Figures 3–5). The same spatial patterns are apparent regardless of
the uncertainty threshold applied, with smaller magnitude changes being discarded as the level of
detection becomes more restrictive (Figures 5–6 and Table 3). The greatest vertical elevation
change in the BDA reach occurred upstream of BDA 2 where up to 0.8 m of sediment were
deposited (Figure 5). BDAs 3 and 4 also trapped sediment, but that deposition was limited in
spatial extent and magnitude compared to the point bar aggradation upstream of BDA 2. The
most intense erosion was concentrated downstream of BDAs 3 and 4, where elevations decreased
by up to 2 m as a result of bank slumping and retreat from 2018 to 2019. The DoDs also revealed
subtle elevation changes such as deposition between BDAs 3 and 4, erosion upstream of BDA 3

16
and minor decreases in elevation immediately downstream of BDAs 2 and 3 associated with
scour pool formation. Despite differences in the magnitudes of measured elevation changes
around each BDA, all three dams exhibited a consistent pattern where some detectable
deposition occurred upstream and erosion occurred downstream (Figure 5).
Although the range of elevation changes in the reference reach was larger than in the
BDA reach, the majority of these changes were small in magnitude (+ 20 cm) and below the
thresholds for the minLoD (9.8 cm) and the 95% CI (19.2 cm; Figure 6). When the minLoD was
applied, there were detectable changes across 43% of the 433 m2 reference reach area and 66%
of the 415 m2 BDA reach area (Figure 5 and Table 3). With the 95% CI, these percentages
decreased to 20% and 36% of reference and BDA reach areas, respectively.
Regardless of the threshold applied, both reaches had a net loss of sediment from 2018 to
2019 (Table 3). Using more restrictive thresholds increased the net sediment loss per stream
length. For example, the normalized net volumetric change in the BDA reach increased from
0.16 m3 of sediment lost per meter of stream when no threshold was applied to 0.21 m3 m-1 for
the 95% CI. The different uncertainty thresholds had a more dramatic impact on net volume
calculations in the reference reach, where net sediment loss was 0.04 m3 per meter of stream
when measured from the raw DoD and 0.15 m3 m-1 when measured from the 95% CI DoD. This
bias towards greater erosion as the threshold becomes more restrictive is a function of the
vertical elevation changes resulting from erosion and deposition. Across both reaches, positive
elevation changes exhibited a smaller range than negative elevation changes; therefore, net
volumes calculated from more restrictive thresholds favored erosion (Figure 6 and Table 3).
Although there was net sediment export from both reaches, the geomorphic changes in
the BDA reach impacted a greater area and resulted in more sediment movement than the

17
changes in the reference reach. Although the range of elevation changes was greater in the
reference reach, with a maximum vertical elevation change of 1.06 m and a minimum of -3.06 m,
the areas over which detectable elevation changes occurred were larger in the BDA reach
resulting in higher calculations of erosion and deposition (Figure 6 and Table 3). Overall, the
gross volumes of erosion and deposition in the BDA reach were approximately 1.5–2 times
greater than the gross volumes in the reference reach. For example, at the 95% CI there were
0.25 m3 m-1 of deposition and 0.46 m3 m-1 of erosion in the BDA reach but in the reference
reach, there were only 0.1 m3 m-1 of deposition and 0.25 m3 m-1 of erosion (Table 3).
At the 95% CI, geomorphic changes in inundated portions of the BDA reach were largely
excluded (Figure 5e). Since the level of detection at the 95% CI (19.2 cm) is similar to the DEM
error in submerged areas (20.9 cm; Table 2), the detected elevation changes retained in the DoD
at the 95% CI were likely areas of true erosion and deposition and not a result of DEM noise.
The general patterns of geomorphic change within and between the two reaches were not altered
when submerged portions of the channel were incorporated or excluded (Figures 5–6 and Table
3). Therefore, we judge the most conservative threshold to be appropriate for this study and rely
on calculations from the 95% CI in subsequent analyses, although we report volumetric changes
at the other two thresholds as well (Table 3).
Four cross sections over the DEMs highlight localized changes in the channel, informing
the nature of vertical erosion and deposition and providing 2D examples of the morphologic
differences we observed in the DoDs (Figure 7). From 2018 to 2019, the channel became more
asymmetric upstream of each BDA (Figure 7 A–A’, B–B’ and C–C’). Point bar deposition
upstream of BDA 2 constricted the channel width to approximately 3.2 m, narrower than the
active channel width in 2017 or 2018 (Figures 3 and 7 A–A’). Deposition upstream of BDA 2

18
increased the streambed elevation across much of the submerged channel with the exclusion of
localized scour along the left bank (Figure 7 A-A’). Similarly, deposition upstream of BDA 4
occurred on the exposed left bank and on the streambed, locally raising streambed elevation
before a transition to channel scour at the right bank (Figure 7 C–C’). Upstream of BDA 3, the
channel also narrowed and became more asymmetric after BDA installation with erosion
concentrated on the outside of the meander and deposition along the inner meander (Figures 3, 5
and 7 B–B’). The most extreme erosion occurred downstream of BDA 4, with >2 m of lateral cut
bank retreat and ~1.7 m of vertical erosion (Figures 3, 5 and 7 D–D’).
The cross sections also illustrate the effects of vegetation and water depth on DEM-
reported elevations. Changes in vegetation height manifest in increases and decreases in
elevation but can be distinguished from bare-earth elevation changes through inspection of the
annual orthophotos (Figures 3, 4b and 7). The increases in elevation near the right bank in the
2019 cross sections aligned with transitions from exposed sediment to grass (Figure 7). From
2018 to 2019, the increases in elevation at the right bank at B–B’, C–C’ and D–D’ were
attributed to vegetation growth (Figures 3e–f, 3h–i and 7). Decreases in elevation near the center
of the channel in A–A’ and B–B’ were the result of vegetation being submerged and buried after
BDA construction (Figures 3 and 7). These plants were visible immediately upstream of BDAs 2
and 3 in the 2018 orthophotos but were largely absent in the 2019 orthophotos (Figure 3d–e and
3g–h). Comparing the bathymetry reported by the 2019 DEM with the surveyed streambed
points illustrates the discrepancy between field-measured and DEM-reported elevations (see
Sections 2.4 DEM Error Analysis and 3.1 DEM Accuracy Assessment). In submerged areas, the
survey elevations were consistently lower than the DEM-generated elevations and this offset
increased with water depth (Figure 7). In D–D’, turbulence downstream of BDA 4 exacerbated

19
the DEM over-prediction of streambed elevations illustrating the sensitivity of UAV-generated
topographic data to poor water clarity. Fortunately, the 95% CI we established excluded areas of
turbulence downstream of each BDA from the DoD and subsequent volume calculations (Figures
3g–i and 5e).
4. Discussion
4.1 Do BDAs Initiate a Unique Morphologic Response?
In all three uncertainty scenarios, the same pattern of geomorphic change persisted: we
observed greater erosion and deposition around the BDA complex than in the upstream reference
reach (Figures 5–6 and Table 3). Gross deposition in the BDA reach was 0.15 m3 m-1 greater than
in the reference reach (Table 3). The difference in gross erosion between the two reaches was
even more pronounced at 0.21 m3 m-1. These differences suggest that the BDAs initiated a
morphologic response in the channel that both exceeded the magnitude of natural channel
variability and was unique from the morphologic responses to physical drivers such as
precipitation, valley slope and suspended sediment load. As the two reaches in this study are
~150 m apart and are both oriented transversely across the floodplain, we assume that the
physical drivers impacting the two reaches are comparable. Although we used a high 95% CI
threshold that discarded elevation changes over the majority of the reach areas, this restrictive
level of detection exchanged a loss of information for an improvement in the geomorphic
plausibility of the measured elevation changes (Wheaton et al., 2010).
Combining orthophotos, high resolution DEMs and field observations enabled us to
detect how patterns of erosion and deposition were influenced by the evolution of the BDAs and
their interaction with the surrounding landscape. The pattern of deposition and erosion around

20
individual BDAs manifests at the reach scale as well, with deposition concentrated upstream of
the BDA complex and erosion dominating downstream of the BDA complex. The majority of the
deposition in the BDA reach occurred upstream of BDA 2 with some additional deposition
upstream of and between BDAs 3 and 4 (Figures 3 and 5e). The distribution of erosive changes
along the reach mirrors deposition, with minor erosion downstream of BDA 2 and cut bank
retreat downstream of BDAs 3 and 4. This transition from deposition dominating upstream to
erosion dominating downstream is in contrast to the reference reach where the morphologic
changes were more spatially random with no clear differentiation between elevation changes in
the upstream or downstream areas (Figure 5f). There are several possible explanations for this
pattern, including (1) BDA order, (2) vegetation presence and (3) BDA breaches.
Although BDAs are semi-permeable, they do impound water and can generate head drops
of at least 15 cm showing that they effectively slow streamflow (Table 4). As the first standing
BDA in the complex, BDA 2 dissipated stream energy and created an upstream area of slower
streamflow that enabled the deposition of suspended sediment. Downstream of BDA 2, there was
likely a lower suspended sediment load, reducing the potential for deposition at subsequent
BDAs. BDA 2 may have also trapped sediment that was mobilized when BDA 1 failed in
addition to vegetative remnants of that dam. Near BDAs 2 and 3, deposition occurred
preferentially along the right bank and narrowed the active channel width (Figures 3 and 5).
These areas of higher deposition are along the inner edges of meanders and were vegetated in
2018, two physical factors that likely contributed to the enhanced local deposition.
Notably, each BDA breached along the left bank, either by overtopping flow or scour
along the streambed (Figure 8). At BDA 2, flow beneath the dam caused an area of visible
turbulence downstream (Figures 3g and 8a). Some of this erosion is captured by the DoD

21
although it is less pronounced than the erosion at BDAs 3 or 4 (Figure 5e). BDA 3 breached
along the left bank, resulting in streamflow overtopping and flowing around the dam and higher
turbulence downstream (Figures 3h and 8b). The small channel avulsion near BDA 3 created an
area of unobstructed streamflow and directed erosive energy against the left bank which retreated
by >1 m between 2018 and 2019 (Figure 5e). The most intense erosion occurred downstream of
BDA 4, likely the result of a large breach in the dam that preferentially directed streamflow
against the left bank (Figures 3i, 5e and 8c). Despite this breach, BDA 4 maintained an upstream
impoundment and corresponded to the largest drop in head, a 45 cm decrease in water surface
elevation over the dam (Table 4).
The cut bank retreat downstream of BDAs 3 and 4 resulted in 1 to 2 m of vertical
elevation decreases that, although limited in area, were responsible for the enhanced erosion in
the BDA reach compared to the reference reach (Figure 5e, Figure 6 and Table 3). The bimodal
distribution of volumetric elevation changes in the BDA reach suggests that these higher
magnitude changes contributed to approximately 50% of the erosion that occurred from 2018 to
2019. These breach-driven morphologic changes highlight the importance of installing BDAs in
sequence as downstream BDAs can capture some of the sediment lost due to breaches upstream
and retain material within the reach. The contribution of BDA breaches to the geomorphic
changes we measured also underscores the benefit of coupling on-the-ground observations with
multiple remote sensing measurements. We readily identified the breaches and the associated
areas of erosion in the field but due to breach-generated turbulence some of the observed
morphologic changes, notably scour ponds downstream of each BDA, were poorly captured by
the UAV-derived topography (Figures 5 and 7).

22
The concentration of deposition-induced morphologic changes at the upstream BDA and
the transition to erosion dominating at downstream BDAs suggest that BDA order and breaching
strongly influence potential aggradation. However, a 2020 study on sedimentation upstream of
BDAs in Colorado found BDA height to be the most significant variable in models predicting
sediment accumulation (Scamardo and Wohl, 2020). Interestingly, at the Colorado field sites the
tallest BDA was the most downstream structure where pond sedimentation was measured.
However, Scamardo and Wohl (2020) did not report any BDA breaches which suggests that
BDA construction and breaching may impact patterns of erosion and deposition. In addition,
differences in methodology and the time elapsed between measurements may contribute to the
unique channel responses we identified. Scamardo and Wohl (2020) compared field
measurements of sediment accumulation in upstream ponds over two to three months in summer
and fall whereas our findings emphasize morphologic changes along the streambanks and span
nearly one year.
4.2 Can BDAs Achieve Restoration Goals?
Beaver-inspired restoration in incised channels is aimed at increasing sedimentation and
channel aggradation (Pollock et al., 2007; 2014; Scamardo and Wohl, 2020). While the
morphologic response measured in the BDA reach of Red Canyon Creek is counter to this
restoration goal, there are several explanations for our particular finding that BDAs generate net
erosion. First, there was net sediment loss in both study reaches suggesting that net erosion
would have occurred in the experimental reach regardless of BDA presence. The pattern of net
erosion in both reaches suggests that physical drivers of channel form, such as precipitation,
elevated the erosive power of the stream from 2018 to 2019. Unusually high precipitation in May

23
and June 2019 resulted in higher than average streamflow, inundating the BDAs. BDA 5 failed
during this heavy precipitation period, as determined from field photos provided by TNC, likely
due to the high erosive energy in the stream. It is possible that this period of intense precipitation
is responsible for the breaches observed in the standing BDAs and much of the downstream cut
bank retreat as well. However, without comprehensive field observations or UAV surveys
bracketing this period of extreme precipitation, we cannot determine the exact contribution of
this unusual weather event to changes in channel form.
Second, our study spans the initial year of restoration activity during which the stream
was dynamically responding to the addition of the BDAs. As the system adjusts and establishes a
new equilibrium state, a transition from erosion-dominated morphologic changes to net
deposition may be possible. Multi-year studies of natural beaver dams have found that net
deposition occurs several years after dam construction although the aggradation rate is highly
variable and often attributed to factors other than dam age and construction, such as climate,
lithology and slope (e.g. Butler and Malanson, 1995; Westbrook et al., 2011; Levine and Meyer,
2014). The range of sedimentation rates measured in beaver ponds across the continental United
States spans from centimeters to >1 m per year (e.g. Naiman et al., 1988; Butler and Malanson,
1995; Pollock et al., 2007; Westbrook et al., 2011). In the Mountain West, typical sedimentation
rates upstream of beaver ponds range from 1–20 cm year-1 when measured over a 6 year
timespan (Westbrook et al., 2011) and from 2–28 cm year-1 for dams between 3 and 30 years in
age (Butler and Malanson, 1995). If we assume these sedimentation rates represent the maximum
deposition possible in the ponds upstream of BDAs in Red Canyon Creek, the uncertainty
threshold we used for change detection (95% CI = 19.2 cm) would have rendered much of that
potential deposition in submerged areas undetectable. As BDAs and beaver dams are distinct

24
structures with different construction and maintenance it may not be realistic to assume that they
would result in similar deposition rates (Lautz et al., 2019). BDAs are typically more permeable
than beaver dams which suggests that BDAs may be less effective in creating ponded regions of
slower streamflow and in trapping sediment upstream (Scamardo and Wohl, 2020). In addition,
active beaver dams are constantly maintained and repaired but recommended BDA maintenance
is on an annual timescale (Pollock et al., 2017), allowing for the possibility of enhanced erosion
due to breaching as we observed downstream of BDAs 3 and 4. The breaches and downstream
bank retreat we identified are consistent with findings of net erosion associated with abandoned
beaver dams or dam-induced overbank flooding during high flow events (e.g. Burchsted and
Daniels, 2014; Curran and Cannatelli, 2014; Levine and Meyer, 2014).
While this study is one of first to analyze the geomorphic changes resulting from a
beaver-inspired stream restoration project, channel evolution models have been used for decades
to understand and predict a linear transition from degraded channels to restored systems at new
equilibrium states (e.g. Schumm, Harvey and Watson, 1984; Simon and Hupp, 1986; Thorne,
1999). More recently, these models have been updated to include a range of initial morphologic
conditions, incorporate the cyclical nature of channel incision and aggradation (Cluer and
Thorne, 2014) and consider ecological processes and biotic agents such as beavers (Pollock et
al., 2014). In a four-stage channel succession model that cycles between incision, trench
widening, aggradation and dynamic equilibrium, beaver reintroduction has the most potential to
arrest incision and initiate aggradation during the second phase, trench widening (Pollock et al.,
2014). Where streams are too incised for beavers to inhabit, the addition of debris dams or BDAs
may offer some of the same benefits as natural beaver dams (e.g. Pollock et al., 2007; 2014;
Lautz et al., 2019). In the context of a beaver-mediated channel evolution model, the trench

25
widening phase, during which erosion is the dominant physical process, is a critical part of
restoration. As flow is rerouted due to BDA installation and possible dam breaching, bank
erosion increases the active channel width. In a wider channel the erosive power of the stream is
reduced and a transition towards net aggradation can begin, initiated in part by downstream
BDAs trapping sediment that eroded further upstream. If breaches in existing BDAs are repaired
and new BDAs are installed, this transition from net degradation to net aggradation can be
sustained. The duration of each phase in channel succession is highly variable but can last for
decades. Beaver reintroduction or BDA installation has the potential to accelerate the transition
from trench widening to aggradation but this process will still likely take several years depending
on the extent of degradation and the sediment supply in the stream (Pollock et al., 2014).
In an incised channel such as Red Canyon Creek, the detection of appreciable deposition
is unlikely just one year after BDA installation given theoretical channel evolution models and
the uncertainty in the methods we used. It is important to note, however, that the only other study
focused on geomorphic changes near BDAs found that the dams successfully trapped sediment
and initiated deposition (Scamardo and Wohl, 2020). This discrepancy highlights the need for
continued monitoring of these restoration sites as BDAs have been shown to accumulate
increasing sediment volumes as they age (Bouwes et al., 2016) and also highlights the possible
influences of measurement method and restoration site characteristics such as incision depth,
channel slope, lithology and climate on desired outcomes. However, the lack of net aggradation
over the course of this study does not suggest that the BDAs in Red Canyon Creek will fail to
meet restoration objectives. Rather, BDA installation may have initiated a transition from an
actively incising system to a channel widening system, increasing the potential for net
aggradation over the next few years. The breaches we observed are not a failure of the BDA

26
design but instead are consistent with the theoretical BDA-mediated restoration cycle and the
one-year expected lifespan of BDAs (Pollock et al., 2014).
4.3 Are UAVs a Viable Tool for Assessing Geomorphic Changes in Fluvial Systems?
RGB images captured during UAV surveys are a powerful tool, providing both elevation
data and continuous visible light orthophotos of study areas that allow for visual assessment of
morphologic changes, detailed mapping of geology and vegetation cover and quantification of
geomorphic processes (e.g. Cook, 2017; Duró et al., 2018). As such, UAVs are gaining
popularity in studies of morphologic change and SfM-derived topographic data are being used to
measure processes ranging from moraine formation in Iceland (Chandler et al., 2020) and soil
deflation in Greenland (Heindel, Chipman, Dietrich and Virginia, 2018) to bank erosion in
agricultural drainages (Prosdocimi et al., 2015) and geomorphic changes following large
flooding events (Tamminga et al., 2015; Cook, 2017). In fluvial settings, UAVs have been used
to measure the morphology of bedrock gorges in Taiwan (Cook, 2017), anthropogenically
straightened rivers in the Netherlands (Duró et al., 2018) and sandy braided rivers in Canada
(Strick et al., 2019).
The accuracy of UAV- and SfM-generated topographic data has been evaluated through
comparisons with terrestrial laser scanning (TLS), airborne LiDAR and topographic field
surveys. In exposed and well-illuminated areas, UAV data rival the accuracy of these more
expensive or time consuming data collection methods (e.g. Prosdocimi et al., 2015; Tamminga et
al., 2015; Cook, 2017; Hamshaw et al., 2017; Strick et al., 2019). However, in submerged areas
the accuracy of optical remote sensing declines with increasing water depth (Figure 7; Westaway
et al., 2000; 2001). While multiple corrections have been developed to improve the accuracy of

27
elevation data in inundated areas, these corrections perform best when the streambed and wetted
edge of the stream are clearly visible (Westaway et al., 2000, 2001, 2003; Tamminga et al., 2014;
Woodget et al., 2015; Dietrich, 2017). Overhanging vegetation, shadowed streambanks, sun glint
on the water surface, turbulence or high turbidity drastically reduce the accuracy of these
corrections (e.g. Cook, 2017; Dietrich, 2017). The apparent failure of the refraction correction
we applied to the 2019 DEM is likely due to a combination of these factors, including vegetation
obscuring the water surface and stream edge (Figure 4a), shadows resulting from steep
streambanks and near-stream vegetation (Figure 4c), ripples and turbulence downstream of the
BDAs (Figure 3g–i), sun glint and floating debris, all of which reduced streambed visibility in
the UAV data. Combining a more robust method for measuring submerged topography, such as
total station surveys, multibeam echo sounders (Javernick, Brasington and Caruso, 2014) or
bathymetric LiDAR (e.g. Bailly, Le Coarer, Languille, Stigermark and Allouis, 2010; Kinzel,
Legleiter and Nelson, 2013), with UAV-derived elevation data for exposed surfaces is an
alternative to our approach of using a more restrictive threshold to account for elevation
uncertainty in wetted portions of the channel. However, merging different data acquisition
methods obviates the key advantages of UAV data, namely the high spatial resolution, efficiency
and low cost. Regardless, when ideal UAV flight conditions cannot be met due to weather,
turbidity or limited field access, we recommend complimenting UAV surveys with another
method to measure streambed topography. Using the current study as an example, robust
measurements of channel form across the streambed would have allowed us to use a lower
uncertainty threshold, retain more elevation data and resolve morphologic changes in the BDA
ponds with higher confidence.

28
The exclusion of vegetated areas where the UAV data likely reports elevations
somewhere between the ground surface and canopy height (Cook, 2017) has little impact on our
findings. The BDAs were installed in an incised channel and did not raise water levels to the
floodplain elevation so any morphologic changes beyond the active channel are irrelevant to our
assessment of geomorphic responses to BDA installation. However, the presence of vegetation
on the floodplain likely impacted our assessment of DEM error. We attribute the lower error
metrics in 2019 in part to the enhanced visibility of the well casings in the UAV data. Prior to the
2019 topographic survey and UAV flight, we cleared the vegetation surrounding the well casings
but we did not clear those areas in previous years. Despite the exclusion of obscured check
points in 2018, the impact of vegetation height is apparent in the elevation differences calculated
between the DEM and total station survey data (Figure 2a). The plateau in elevation differences
around ~0.2 m is consistent with the 2018 DEM incorporating partial vegetation heights into the
final elevation model.
The nadir perspective of traditional UAV flights prevents the SfM elevation data from
reliably reconstructing the shape of eroded streambanks, particularly where undercutting or scour
has occurred. Eroded banks appear vertical and any small-scale topographic variations are lost
(Figure 7 D–D’). Incorporating oblique camera perspectives can improve bank reconstruction
either by using a flexible multi-rotor UAV platform or by adding ground based photos to the
SfM workflow (e.g. Prosdocimi et al., 2015; Hamshaw et al., 2017; James, Robson, d’Oleire-
Oltmanns and Neithammer, 2017; Duró et al., 2018). Field measurements using erosion pins
capture morphologic changes along concave banks but these point measurements can be
challenging to integrate with remote sensing data and cover limited portions of the channel.

29
Given these challenges and advantages of UAVs for assessing morphologic changes, we
consider them to be one of many viable tools. UAV- and SfM-generated data have the unique
benefit of providing both reach-scale orthophotos and detailed elevation measurements from a
single RGB camera. By comparing the coregistered orthophotos and DEMs, we were able to
distinguish true geomorphic changes from areas of vegetation growth and focus our analyses on
unobscured portions of the channel. The continuity of UAV data allowed us to identify spatial
trends, such as the repeated pattern of upstream deposition and downstream erosion at each
BDA, which may have been lost in point measurements from erosion pins or topographic field
surveys. When SfM data are used in concert with another data type, such as terrestrial laser
scanning, aerial or bathymetric LiDAR or a detailed topographic field survey, submerged regions
can be better resolved, a comprehensive accuracy assessment can be performed and higher
confidence levels can be assigned to areas where the different datasets agree. In this study, we
rely on areas where there is stronger agreement between the UAV data and field elevation data to
drive our conclusions. In these portions of the channel the geomorphic changes measured exceed
the magnitude of DEM uncertainty, allowing decimeter-scale changes to be resolved with high
confidence.
5. Conclusion
In apparent contrast to the aggradation desired from BDA restoration projects, we found
an increase in erosion around a complex of three BDAs. However, when placed in the context of
the larger watershed and of channel evolution models, these results are not surprising. There was
net sediment loss in an upstream reference reach as well, suggesting that the physical drivers
acting on the system over the one year timeframe of the study favored erosion. Compared to the
morphologic changes in the reference reach, the channel response to BDA installation resulted in

30
volumes of erosion and deposition that were nearly double those measured in the reference
reach, supporting the idea that BDAs initiate unique geomorphic responses beyond those that can
be attributed to natural channel variability. We found that BDA position in the sequence and dam
integrity influenced the patterns of geomorphic change, with deposition concentrated upstream of
the first BDA and dam breaches due to overtopping streamflow resulting in cut bank retreat at
downstream BDAs. Although a breach formed in each standing BDA and two of the original five
dams were completely destroyed within one year, these findings are consistent with the dynamic
and temporary design of BDAs and underscore the importance of installing these structures in
sequences, similarly to how beavers construct their dams, so that the impacts of a few BDAs
failing can be absorbed by the remaining intact structures.
The short lifespan of BDAs demands methodological approaches for assessing the
impacts of these structures on fluvial systems that can be rapidly deployed and have flexible
spatial and temporal resolutions. The coincident evolution of Structure from Motion (SfM)
photogrammetry and development of low-cost, lightweight UAV platforms have enabled the
collection of elevation data at scales capable of resolving morphologic changes with centimeter-
scale accuracy. Although the combination of UAVs and SfM has been successfully applied in a
few studies of channel erosion, these methods have not been widely adopted for monitoring
stream restoration. We demonstrate several advantages of UAV- and SfM-generated data,
notably the benefit of simultaneously acquiring both visible light orthophotos and elevation data
and the ability to repeatedly assess how the stream system responds to restoration efforts. Given
the discrepancy between the strong enthusiasm for BDAs and the dearth of data assessing the
effectiveness of these beaver-inspired structures, there is an immediate need for additional

31
monitoring across restoration sites and over longer time frames to better understand the potential
outcomes of BDA restoration efforts.

32
Figures
Figure 1. (a) The beaver dam analogues were installed at Red Canyon Ranch in south-central
Wyoming. (b) The main stream flowing through the ranch is Red Canyon Creek, a third-order
stream that flows to the north. The study area is located near the northern terminus of the
stream. Digital elevation model (10 m pixel-1), watershed extent and stream locations are from
the U.S. Geological Survey (U.S. Geological Survey, 2017; 2019). (c) Five beaver dam
analogues (red) were installed in Red Canyon Creek in 2018. BDAs 2–4 were intact in July
2019 and are the focus of this study (‘BDA Reach’). An upstream reach with a similar
gradient and sinuosity was selected as a reference (‘Reference Reach’).

33
Figure 2. Density plots comparing DEM elevations with elevations from a 2019 topographic
survey for (a) exposed and (b) submerged points. Elevation differences were calculated by
subtracting field elevations from DEM elevations. Dashed lines show the mean error values
calculated between the two elevation datasets (Table 2). (b) The corrected submerged data
was adjusted following Woodget et al. (2015).
Figure 3. Annual orthophotos (2017–2019) of the installation sites for BDAs 2–4. A camera
change between the 2018 and 2019 UAV surveys is responsible for the color changes (Table
1). Streamflow is from left to right. Arrows indicate the locations of the BDAs.
34
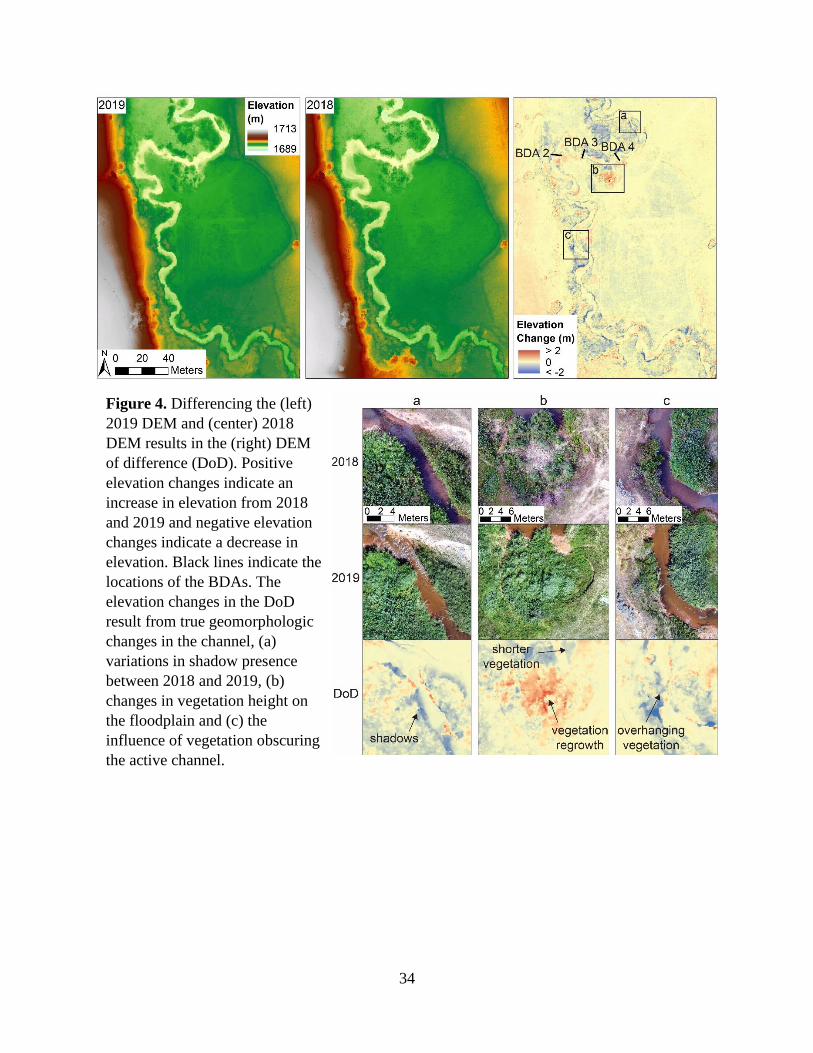
Figure 4. Differencing the (left)
2019 DEM and (center) 2018
DEM results in the (right) DEM
of difference (DoD). Positive
elevation changes indicate an
increase in elevation from 2018
and 2019 and negative elevation
changes indicate a decrease in
elevation. Black lines indicate the
locations of the BDAs. The
elevation changes in the DoD
result from true geomorphologic
changes in the channel, (a)
variations in shadow presence
between 2018 and 2019, (b)
changes in vegetation height on
the floodplain and (c) the
influence of vegetation obscuring
the active channel.

35
Figure 5. 2018–2019 DEM of difference (DoD) restricted to the two study reaches. Three
error assessments are shown: a raw, unthresholded DoD (a–b), a 9.8 cm minimum level of
detection threshold (minLoD; c–d) and a 19.2 cm 95% confidence interval threshold (95% CI;
e–f). Brown lines indicate the locations of the BDAs. Black arrows indicate flow direction.
The DoDs are overlain on the 2018 hillshade model.

36
Figure 6. Areal and volumetric elevation change distributions for the BDA reach and the
reference reach. Elevation changes were calculated by subtracting 2018 elevations from 2019
elevations and are shown using 5 cm binning. Light grey bars are data above the 95%
confidence interval (95% CI). Dark grey bars show the additional data included when the
uncertainty threshold is reduced to the minimum level of detection (minLoD). Black bars are
the data excluded by both uncertainty thresholds.

37
Figure 7. Cross sections over the 2018 and 2019 digital elevation models (DEMs). Dashed
lines indicate DEM-reported elevations below the water surface. Green ‘Vs’ indicate areas of
elevation change resulting from variations in vegetation presence and height. The black ‘T’
indicates a portion of the 2019 DEM where turbulence interfered with DEM-reported
elevations. Note the different X and Y axes for each cross section.

38
Figure 8. Field photos showing the breaches at each BDA. (a) BDA 2 breached via scour
beneath the dam, determined through field observations and evidenced by turbulent flow
downstream of the dam. Image perspective is upstream. (b) BDA 3 breached along the left
bank, resulting in minor channel avulsion and flow around the edge of the dam. Image
perspective is upstream. (c) Breaching at BDA 4 occurred via overtopping streamflow. Image
perspective is aligned with streamflow from left to right.

39
Tables
Table 1. UAV flight details and camera information for 2017–2019. Information related to the
elevation data products generated by Agisoft PhotoScan is presented for 2018 and 2019. Values
in italics are error metrics calculated by Agisoft PhotoScan.
UAV flights
Date August 15, 2017 August 14, 2018 July 30, 2019
Camera SONY A5100 SONY A5100 SONY R10
UAV platform DJI Phantom 4 DJI Phantom 4 DJI M600
Altitude (m) 62.7 66.2 44.2
Images 803 544 601
Image resolution (cm pixel-1) 1.60 1.73 0.87
Ground control points 11 10 13
Survey area (km2) 0.0916 0.0988 0.0769
Data products
GCP easting RMSE (cm) - 0.74 1.53
GCP northing RMSE (cm) - 0.80 1.42
GCP elevation RMSE (cm) - 1.02 0.47
GCP total RMSE (cm) - 1.50 2.14
Dense points - 27,905,508 78,773,274
Point density (m-2) - 210 821
DEM resolution (cm pixel-1) - 6.9 3.5
Table 2. Error statistics comparing DEM-derived elevations with elevations from a 2019 field
survey.
n ME (cm) RMSE (cm) SDE (cm) Emax (cm)
2018 exposed 19 8 11.8 8.9 25
2019 exposed 24 3 4.7 3.7 13
2019 submerged 165 36.4 42 20.9 117.3
2019 corrected 165 27.3 36.3 24 116.4
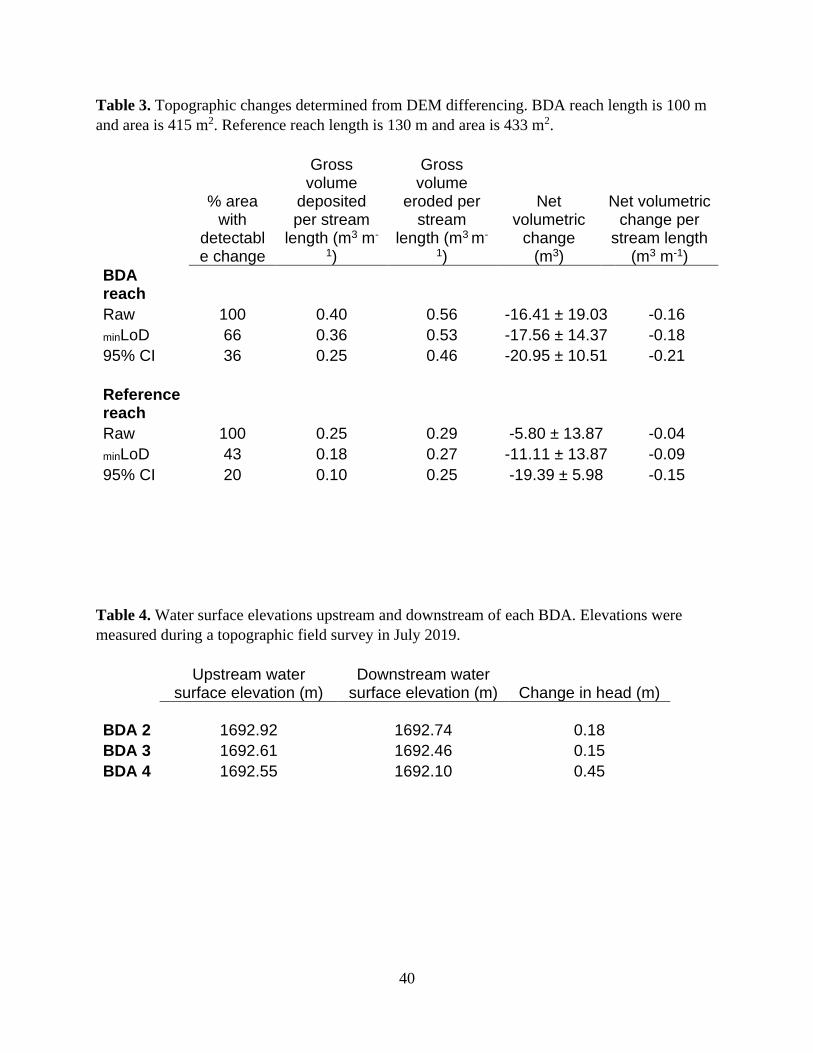
40
Table 3. Topographic changes determined from DEM differencing. BDA reach length is 100 m
and area is 415 m2. Reference reach length is 130 m and area is 433 m2.
% area with
detectable change
Gross volume
deposited per stream
length (m3 m-
1)
Gross volume
eroded per stream
length (m3 m-
1)
Net volumetric
change (m3)
Net volumetric change per
stream length (m3 m-1)
BDA reach Raw 100 0.40 0.56 -16.41 ± 19.03 -0.16
minLoD 66 0.36 0.53 -17.56 ± 14.37 -0.18
95% CI 36 0.25 0.46 -20.95 ± 10.51 -0.21
Reference reach Raw 100 0.25 0.29 -5.80 ± 13.87 -0.04
minLoD 43 0.18 0.27 -11.11 ± 13.87 -0.09
95% CI 20 0.10 0.25 -19.39 ± 5.98 -0.15
Table 4. Water surface elevations upstream and downstream of each BDA. Elevations were
measured during a topographic field survey in July 2019.
Upstream water surface elevation (m)
Downstream water surface elevation (m) Change in head (m)
BDA 2 1692.92 1692.74 0.18
BDA 3 1692.61 1692.46 0.15
BDA 4 1692.55 1692.10 0.45

41
References
Agisoft LLC. 2017. Agisoft PhotoScan User Manual: Professional Edition, Version 1.3.4.
Apple LL. 1985. Riparian habitat restoration and beavers. In: Johnson RR, Ziebell CD, Patton
DR, Ffolliott PF, Hamre RH (Eds.), Riparian ecosystems and their uses. U.S. Forest
Service General Technical Report RM-120, Fort Collins, CO, pp. 35–38.
Bailly J-S, Le Coarer Y, Languille P, Stigermark C, Allouis T. 2010. Geostatistical estimation of
bathymetric LiDAR errors on rivers. Earth Surface Processes and Landforms 35: 1199–
1210. https://doi.org/10.1002/esp.1991.
Beechie TJ, Pollock MM, Baker S. 2008. Channel incision, evolution and potential recovery in
the Walla Walla and Tucannon River basins, northwestern USA. Earth Surface Processes
and Landforms 33(5): 784-800. https://doi.org/10.1002/esp.1578.
Beechie TJ, Sear D, Olden JD, Pess GR, Buffington JM, Moir H, Roni P, Pollock MM. 2010.
Process-based principles for restoring river ecosystems. BioScience 60: 209–222.
https://doi.org/10.1525/bio.2010.60.3.7.
Bouwes N, Weber N, Jordan CE, Saunders WC, Tattam IA, Volk C, Wheaton JM, Pollock MM.
2016. Ecosystem experiment reveals benefits of natural and simulated beaver dams to a
threatened population of steelhead (Oncorhynchus mykiss). Scientific Reports 6: 28581.
https://doi.org/10.1038/srep28581.
Brasington J, Langham J, Rumsby B. 2003. Methodological sensitivity of morphometric
estimates of coarse fluvial sediment transport. Geomorphology 53: 299–316.
https://doi.org/10.1016/S0169-555X(02)00320-3.
Brasington J, Rumsby BT, McVey R. 2000. Monitoring and modelling morphological change in
braided river systems using the Global Positioning System. Earth Surface Processes and
Landforms 25: 973–990. https://doi.org/10.1002/1096-9837(200008)25:93.0.CO;2-Y.
Brasington J, Vericat D, Rychkov I. 2012. Modeling river bed morphology, roughness, and
surface sedimentology using high resolution terrestrial laser scanning. Water Resources
Research 48: W11519. https://doi.org/10.1029/2012WR012223.
Burchsted D, Daniels MD. 2014. Classification of the alterations of beaver dams to headwater
streams in northeastern Connecticut, U.S.A. Geomorphology 205: 36–50.
https://doi.org/10.1016/j.geomorph.2012.12.029.
Burchsted D, Daniels MD, Thorson R, Vokoun J. 2010. The river discontinuum: Applying
beaver modifications to baseline conditions for restoration of forested headwaters.
BioScience 60: 908–922. https://doi.org/10.1525/bio.2010.60.11.7.
Butler, DR. 1995. The geomorphic influence of beavers. In: Butler, DR (Ed.),
Zoogeomorphology: Animals as Geomorphic Agents. Cambridge University Press, New
York, NY, pp. 148–182.

42
Butler DR, Malanson GP. 1995. Sedimentation rates and patterns in beaver ponds in a mountain
environment. Geomorphology 13: 255–269. https://doi.org/10.1016/0169-
555X(95)00031-3.
Carrivick JL, Smith MW. 2019. Fluvial and aquatic applications of Structure from Motion
photogrammetry and unmanned aerial vehicle/drone technology. Wiley Interdisciplinary
Reviews: Water 6: e1328. https://doi.org/10.1002/wat2.1328.
Chandler BMP, Chandler SJP, Evans DJA, Ewertowski MW, Lovell H, Roberts DH, Schaefer
M, Tomczyk AM. 2020. Sub-annual moraine formation at an active temperate Icelandic
glacier. Earth Surface Processes and Landforms. https://doi.org/10.1002/esp.4835.
Chaney E, Elmore W, Platts WS. 1990. Livestock grazing on western riparian areas. Produced
for the United States Environmental Protection Agency by the Northwest Resource
Information Center, Inc., Eagle, ID, 45 p.
Cluer B, Thorne C. 2014. A stream evolution model integrating habitat and ecosystem benefits.
River Research and Applications 30: 135–154. https://doi.org/10.1002/rra.2631.
Cook KL. 2017. An evaluation of the effectiveness of low-cost UAVs and structure from motion
for geomorphic change detection. Geomorphology 278: 195–208.
https://doi.org/10.1016/j.geomorph.2016.11.009.
Curran JC, Cannatelli KM. 2014. The impact of beaver dams on the morphology of a river in the
eastern United States with implications for river restoration. Earth Surface Processes and
Landforms 39: 1236–1244. https://doi.org/10.1002/esp.3576.
Dietrich JT. 2017. Bathymetric Structure-from-Motion: extracting shallow stream bathymetry
from multi-view stereo photogrammetry. Earth Surface Processes and Landforms 42:
355–364. https://doi.org/10.1002/esp.4060.
Dittbrenner BJ, Pollock MM, Schilling JW, Olden JD, Lawler JJ, Torgersen CE. 2018. Modeling
intrinsic potential for beaver (Castor canadensis) habitat to inform restoration and climate
change adaptation. PLoS ONE 13: e0192538.
https://doi.org/10.1371/journal.pone.0192538.
Duró G, Crosato A, Kleinhans MG, Uijttewaal WSJ. 2018. Bank erosion processes measured
with UAV-SfM along complex banklines of a straight mid-sized river reach. Earth
Surface Dynamics 6: 933–953. https://doi.org/10.5194/esurf-6-933-2018.
Fanelli RM, Lautz LK. 2008. Patterns of water, heat, and solute flux through streambeds around
small dams. Ground Water 46(5): 671–687. https://doi.org/10.1111/j.1745-
6584.2008.00461.x.
Fonstad MA, Dietrich JT, Courville BC, Jensen JL, Carbonneau PE. 2013. Topographic structure
from motion: A new development in photogrammetric measurement. Earth Surface
Processes and Landforms 38: 421–430. https://doi.org/10.1002/esp.3366.

43
Hamshaw SD, Bryce T, Rizzo DM, O’Neil-Dunne J, Frolik J, Dewoolkar MM. 2017.
Quantifying streambank movement and topography using unmanned aircraft system
photogrammetry with comparison to terrestrial laser scanning. River Research and
Applications 33: 1354–1367. https://doi.org/10.1002/rra.3183.
Heindel RC, Chipman JW, Dietrich JT, Virginia RA. 2018. Quantifying rates of soil deflation
with Structure-from-Motion photogrammetry in west Greenland. Arctic, Antarctic, and
Alpine Research 50: 1–13. https://doi.org/10.1080/15230430.2017.1415852.
James MR, Robson S. 2012. Straightforward reconstruction of 3D surfaces and topography with
a camera: Accuracy and geoscience application. Journal of Geophysical Research: Earth
Surface 117: F03017. https://doi.org/10.1029/2011JF002289.
James MR, Robson S, d’Oleire-Oltmanns S, Niethammer U. 2017. Optimising UAV topographic
surveys processed with Structure-from-Motion: Ground control quality, quantity and
bundle adjustment. Geomorphology 280: 51–66.
https://doi.org/10.1016/j.geomorph.2016.11.021.
Javernick L, Brasington J, Caruso B. 2014. Modeling the topography of shallow braided rivers
using Structure-from-Motion photogrammetry. Geomorphology 213: 166–182.
https://doi.org/10.1016/j.geomorph.2014.01.006.
Johnson MF, Thorne CR, Castro JM, Kondolf GM, Mazzacano CS, Rood SB, Westbrook C.
2019. Biomic river restoration: A new focus for river management. River Research and
Applications 36: 3–12. https://doi.org/10.1002/rra.3529.
Kinzel PJ, Legleiter CJ, Nelson JM. 2013. Mapping river bathymetry with a small footprint
green LiDAR: Applications and challenges 1. Journal of the American Water Resources
Association 49: 183–204. https://doi.org/10.1111/jawr.12008.
Krueper DJ. 1993. Effects of land use practices on western riparian ecosystems. In: Finch DM,
Stangel PW (Eds.), Status and management of neotropical migratory birds. U.S.
Department of Agriculture and U.S. Forest Service General Technical Report RM-229,
Fort Collins, CO, pp. 321-330.
Lane SN, Westaway RM, Hicks DM. 2003. Estimation of erosion and deposition volumes in a
large, gravel-bed, braided river using synoptic remote sensing. Earth Surface Processes
and Landforms 28: 249–271. https://doi.org/10.1002/esp.483.
Lautz LK, Kelleher CK, Vidon P, Coffman J, Riginos C, Copeland H. 2019. Restoring stream
ecosystem function with beaver dam analogues: Let’s not make the same mistake twice.
Hydrological Processes 33(1): 174–177. https://doi.org/10.1002/hyp.13333.
Lautz LK, Siegel DI, Bauer RL. 2006. Impact of debris dams on hyporheic interaction along a
semi-arid stream. Hydrological Processes 20(1): 183–196.
https://doi.org/10.1002/hyp.5910.
44
Lawler DM. 1993. The measurement of river bank erosion and lateral channel change - a review.
Earth Surface Processes and Landforms 18(9): 777–821.
https://doi.org/10.1002/esp.3290180905.
Levine R, Meyer GA. 2014. Beaver dams and channel sediment dynamics on Odell Creek,
Centennial Valley, Montana, USA. Geomorphology 205: 51–64.
https://doi.org/10.1016/j.geomorph.2013.04.035.
Livers B, Wohl E, Jackson KJ, Sutfin NA. 2018. Historical land use as a driver of alternative
states for stream form and function in forested mountain watersheds of the Southern
Rocky Mountains. Earth Surface Processes and Landforms 43: 669–684.
https://doi.org/10.1002/esp.4275.
Majerova M, Neilson BT, Schmadel NM, Wheaton JM, Snow CJ. 2015. Impacts of beaver dams
on hydrologic and temperature regimes in a mountain stream. Hydrology and Earth
System Sciences 19: 3541–3556. https://doi.org/10.5194/hess-19-3541-2015.
Marteau B, Vericat D, Gibbins C, Batalla RJ, Green DR. 2017. Application of Structure-from-
Motion photogrammetry to river restoration. Earth Surface Processes and Landforms 42:
503–515. https://doi.org/10.1002/esp.4086.
Meentemeyer RK, Butler DR. 1999. Hydrogeomorphic effects of beaver dams in Glacier
National Park, Montana. Physical Geography 20: 436–446.
https://doi.org/10.1080/02723646.1999.10642688.
Naiman RJ, Johnston CA, Kelley JC. 1988. Alteration of North American streams by beaver.
BioScience 38: 753–762. https://doi.org/10.2307/1310784.
Norman LM, Sankey JB, Dean D, Caster J, DeLong S, DeLong W, Pelletier JD. 2017.
Quantifying geomorphic change at ephemeral stream restoration sites using a coupled-
model approach. Geomorphology 283: 1–16.
https://doi.org/10.1016/j.geomorph.2017.01.017.
Palmer MA, Bernhardt ES, Allan JD, Lake PS, Alexander G, Brooks S, Carr J, Clayton S, Dahm
CN, Follstad Shah J, Galat DL, Loss SG, Goodwin P, Hart DD, Hassett B, JenkinsonR,
Kondolf GM, Lave R, Meyer JL, O’Donnel TK, Pagano L, Sudduth E. 2005. Standards
for ecologically successful river restoration. Journal of Applied Ecology 42: 208–217.
https://doi.org/10.1111/j.1365-2664.2005.01004.x.
Pilliod DS, Rohde AT, Charnley S, Davee RR, Dunham JB, Gosnell H, Grant GE, Hausner MB,
Huntington JL, Nash C. 2018. Survey of beaver-related restoration practices in rangeland
streams of the western USA. Environmental Management 61: 58–68.
https://doi.org/10.1007/s00267-017-0957-6.
Pollock MM, Beechie TJ, Jordan CE. 2007. Geomorphic changes upstream of beaver dams in
Bridge Creek, an incised stream channel in the interior Columbia River basin, eastern
Oregon. Earth Surface Processes and Landforms 32: 1174–1185.
https://doi.org/10.1002/esp1553.

45
Pollock MM, Beechie TJ, Wheaton JM, Jordan CE, Bouwes N, Weber N, Volk C. 2014. Using
beaver dams to restore incised stream ecosystems. BioScience 64: 279–290.
https://doi.org/10.1093/biosci/biu036.
Pollock MM, Heim M, Werner D. 2003. Hydrologic and geomorphic effects of beaver dams and
their influence on fishes. American Fisheries Society Symposium 37: 213–233.
Pollock MM, Jordan CE, Lewallen G, Woodruff K, Castro J. 2017. The beaver restoration
guidebook: Working with beaver to restore streams, wetlands and floodplains. Version
2.0. United States Fish and Wildlife Service, Portland, OR, 219 p.
Polvi LE, Wohl E. 2013. Biotic drivers of stream planform. BioScience 63: 439–452.
https://doi.org/10.1525/bio.2013.63.6.6.
Prosdocimi M, Calligaro S, Sofia G, Dalla Fontana G, Tarolli P. 2015. Bank erosion in
agricultural drainage networks: New challenges from Structure-from-Motion
photogrammetry for post-event analysis. Earth Surface Processes and Landforms 40:
1891–1906. https://doi.org/10.1002/esp.3767.
Rosgen DL. 2001. The cross-vane, w-weir and j-jook vane structures…Their description, design
and application for stream stabilization and river restoration. In Hays DF (Eds.),
Wetlands engineering & river restoration 2001. American Society of Civil Engineers,
Reston, VA, pp. 1–22. https://doi.org/10.1061/40581(2001)72.
Rosgen DL. 2013. Natural channel design (NCD): Fundamental concepts, assumptions &
methods. In Simon A, Bennet SJ, Castro JM (Eds.), Stream restoration in dynamic fluvial
systems: Scientific approaches, analyses and tools. American Geophysical Union
Geophysical Monograph Series 194, pp. 69–93. https://doi.org/10.1029/2010GM000990.
Scamardo J, Wohl E. 2020. Sediment storage and shallow groundwater response to beaver dam
analogues in the Colorado Front Range, USA. River Research and Applications 36: 398–
409. https://doi.org/10.1002/rra.3592.
Schumm S, Harvey M, Watson C. 1984. Incised channels: Morphology dynamics and control.
Water Resources Publication. Littleton, CO.
Shahverdian SM, Wheaton JM, Bennett SN, Bouwes N, Camp R, Jordan CE, Weber N. 2019.
Chapter 4 – Mimicking and promoting wood accumulation and beaver dam activity with
post-assisted log structures and beaver dam analogues. In Wheaton JM, Bennett SN,
Bouwes N, Maestas JD, Shahverdian SM (Eds.), Low-tech process-based restoration of
riverscapes: Design manual. Utah State University Restoration Consortium, Logan, UT,
66 p.
Silverman NL, Allred BW, Donnelly JP, Chapman TB, Maestas JD, Wheaton JM, White J,
Naugle DE. 2019. Low-tech riparian and wet meadow restoration increases vegetation
productivity and resilience across semiarid rangelands. Restoration Ecology 27: 269–278.
https://doi.org/10.1111/rec.12869.
46
Simon A, Hupp CR. 1986. Geomorphic and vegetative recovery processes along modified
Tennessee streams: An interdisciplinary approach to disturbed fluvial systems. Forest
Hydrology and Watershed Management. IAHS-AISH Publ.167.
Strick RJP, Ashworth PJ, Sambrook Smith GH, Nicholas AP, Best JL, Lane SN, Parsons DR,
Simpson CJ, Unsworth CA, Dale J. 2019. Quantification of bedform dynamics and
bedload sediment flux in sandy braided rivers from airborne and satellite imagery. Earth
Surface Processes and Landforms 44: 953–972. https://doi.org/10.1002/esp.4558.
Tamminga AD, Hugenholtz C, Eaton B, Lapointe M. 2014. Hyperspatial remote sensing of
channel reach morphology and hydraulic fish habitat using an unmanned aerial vehicle
(UAV): A first assessment in the context of river research and management. River
Research and Applications 30: 132–133. https://doi.org/10.1002/rra.
Tamminga AD, Eaton BC, Hugenholtz CH. 2015. UAS-based remote sensing of fluvial change
following an extreme flood event. Earth Surface Processes and Landforms 40: 1464–
1476. https://doi.org/10.1002/esp.3728.
Thorne CR. 1999. Bank processes and channel evolution in the incised rivers of north-central
Mississippi. In Darby SE, Simon A (Eds.), Incised river channels, John Wiley & Sons:
Chichester, UK, pp. 97–121.
Trimble SW, Mendel AC. 1995. The cow as a geomorphic agent – a critical review.
Geomorphology 13(1–4): 223–253. https://doi.org/10.1016/0169-555X(95)00028-4.
USGS. 2017. 1/3rd arc-second Digital Elevation Models (DEMs). USGS National Map 3DEP
Downloadable Data Collection. US. Geological Survey.
https://usgs.gov/NationalMap/data (accessed October 23 2019).
USGS. 2019. National Hydrography Dataset. U.S. Geological Survey. https://nhd.usgs.gov/
(accessed October 23 2019).
Vanderhoof MK, Burt C. 2018. Applying high-resolution imagery to evaluate restoration-
induced changes in stream condition, Missouri River Headwaters Basin, Montana.
Remote Sensing 10(6): 913. https://doi.org/10.3390/rs10060913.
Weber N, Bouwes N, Pollock MM, Volk C, Wheaton JM, Wathen G, Wirtz J, Jordan CE. 2017.
Alteration of stream temperature by natural and artificial beaver dams. PLoS ONE 12: 1–
23. https://doi.org/10.1371/journal.pone.0176313.
Westaway RM, Lane SN, Hicks DM. 2000. The development of an automated correction
procedure for digital photogrammetry for the study of wide, shallow, gravel-bed rivers.
Earth Surface Processes and Landforms 25: 209–226.
https://doi.org/10.1002/(SICI)1096-9837(200002)25:2<209::AID-ESP84>3.0.CO;2-Z.
Westaway RM, Lane SN, Hicks DM. 2001. Remote sensing of clear-water, shallow, gravel-bed
rivers using digital photogrammetry. Photogrammetric Engineering and Remote Sensing
67: 1271–1281.

47
Westaway RM, Lane SN, Hicks DM. 2003. Remote survey of large-scale braided, gravel-bed
rivers using digital photogrammetry and image analysis. International Journal of Remote
Sensing 24: 795–815. https://doi.org/10.1080/01431160110113070.
Westbrook CJ, Cooper DJ, Baker BW. 2006. Beaver dams and overbank floods influence
groundwater-surface water interactions of a Rocky Mountain riparian area. Water
Resources Research 42: 1–12. https://doi.org/10.1029/2005WR004560.
Westbrook CJ, Cooper DJ, Baker BW. 2011. Beaver assisted river valley formation. River
Research and Applications 27: 247–256. https://doi.org/10.1002/rra.1359.
Westoby MJ, Brasington J, Glasser NF, Hambrey MJ, Reynolds JM. 2012. “Structure-from-
Motion” photogrammetry: A low-cost, effective tool for geoscience applications.
Geomorphology 179: 300–314. https://doi.org/10.1016/j.geomorph.2012.08.021.
Wheaton JM, Brasington J, Darby SE, Sear DA. 2010. Accounting for uncertainty in DEMs from
repeat topographic surveys: Improved sediment budgets. Earth Surface Processes and
Landforms 35: 136–156. https://doi.org/10.1002/esp.1886.
Wilcox J, Benoit T, Mink L. 2001. Evaluation of geomorphic restoration techniques applied to
fluvial systems. Feather River Resource Management Group. www.feather-river-river-
crm.org/project-files/georest/cover.html.
Wohl E. 2005. Compromised rivers: Understanding historical human impacts on rivers in the
context of restoration. Ecology and Society 10(2): 2.
Wohl E. 2015. Of wood and rivers: Bridging the perception gap. Wiley Interdisciplinary
Reviews: Water 2: 167–176. https://doi.org/10.1002/wat2.1076.
Woodget AS, Carbonneau PE, Visser F, Maddock IP. 2015. Quantifying submerged fluvial
topography using hyperspatial resolution UAS imagery and structure from motion
photogrammetry. Earth Surface Processes and Landforms 40: 47–64.
https://doi.org10.1002/esp.3613.
48
JULIANNE (SWEENEY) DAVIS
(585) 967-4648
Syracuse, NY
EDUCATION
M.S., Earth Sciences (anticipated) June 2020
Syracuse University, Syracuse, NY
Thesis: Evaluating the geomorphic channel response to beaver dam analogue installation using
unoccupied aerial vehicles
B.A., Geological Sciences, summa cum laude Dec. 2016
State University of New York (SUNY) at Geneseo, Geneseo, NY
Honors Thesis: Using semi-automated workflows in ArcGIS to assess the morphometry and
degradation of sub-kilometer scale impact craters at the InSight landing site, Elysium Planitia,
Mars
PUBLICATIONS
Wade, J., Lautz, L., Kelleher, C., Vidon, P., Davis, J., Beltran, J., and Pearce, C., Heterogeneity
in groundwater-surface water interactions driven by beaver dam analogues: in preparation.
Sweeney, J., Warner, N.H., Golombek, M.P., Ganti, V., Lamb, M.P., Fergason, R.L., and Kirk,
R., 2018, Degradation of 100-meter-scale impact craters on Mars with implications for surface
process rates in the Hesperian and Amazonian: Journal of Geophysical Research: Planets, 123,
doi: 10.1029/2018JE005618.
Warner, N.H., Golombek, M.P., Sweeney, J., Fergason, R.L., Kirk, R., and Schwartz, C.H.,
2017, Near surface stratigraphy and regolith production in southwestern Elysium Planitia, Mars:
implications for Hesperian-Amazonian terrains and the InSight lander mission: Space Science
Reviews, 211, 147-190, doi:10.1007/s11214-017-0352-x.
Golombek, M.P., Kipp, D., Warner, N.H., Daubar, I.J., Fergason, R.L., Kirk, R., Beyer, R.,
Huertas, A., Piqueux, S., Putzig, N.E., Campbell, B.A., Morgan, G.A., Charalambous, C., Pike,
W.T., Gwinner, K., Calef, F., Kass, D., Mischna, M., Ahley, J., Bloom, C., Wigton, N., Hare, T.,
Schwartz, C.L., Gengl, H., Redmond, L., Trautman, M., Sweeney, J., et al., 2017, Selection of
the InSight landing site: Space Science Reviews, 211, 5-95, doi:10.1007/s11214-016-0321-9.
FELLOWSHIPS
NSF NRT Fellowship, Energy Model Program on Water-Energy Aug. 2019 – Aug. 2020
Research (EMPOWER) at Syracuse University
NSF Graduate Research Fellowship Sept. 2018 – Aug. 2023

49
RESEARCH EXPERIENCE
Graduate Researcher, Syracuse University Aug. 2018 - Present
Advisor: Dr. Laura Lautz, Department of Earth Sciences
• Processed visible light unoccupied aerial vehicle (UAV) images to create digital
elevation models (DEMs) of the study site in Red Canyon Ranch, Wyoming
• Calculated spatial and temporal changes in channel morphology to understand how
beaver dam analogues alter patterns of erosion and deposition
Research Technician (post-graduation), SUNY Geneseo Jan. – Aug. 2017
Research Aide (undergraduate), SUNY Geneseo May 2015 – May 2016
Advisor: Dr. Nicholas Warner, Department of Geological Sciences
• In both positions, used ArcGIS to rapidly measure the morphometry of ~4,000 impact
craters at the landing site of NASA’s InSight mission to Mars
• Estimated crater degradation rates to understand the climate history of the landing site
and identify potential landing site hazards
• As an undergraduate, began developing workflows in ArcMap to expedite the process of
measuring crater morphometry and presented this research at several national conferences
• Post-graduation, refined the workflows, prepared a first-author manuscript and
supervised undergraduate researchers who applied the workflow to other regions on Mars
NSF REU Intern, Lamont-Doherty Earth Observatory, Palisades, NY June – Aug. 2016
Advisors: Dr. Yael Kiro and Dr. Steven Goldstein, Department of Earth and Environmental
Sciences
• Prepared salt, sediment and water samples from the Dead Sea for isotope analyses
• Used uranium isotope ratios to determine the relative contributions of different water
sources to the Dead Sea during climatic variations in the Holocene
• Trained in ultraclean laboratory practices, column chemistry and basic use of ICP-MS
• Presented the results at the 2016 American Geophysical Union Annual Meeting
PROFESSIONAL EXPERIENCE
Quality Control Technician, EagleView, Rochester, NY Feb. – June 2018
• Performed quality and accuracy assessment on aerial imagery and data products using
proprietary image processing programs
• Processed raw imagery to embed positional information using Applanix software
• Trained in basic troubleshooting
Environmental Management Intern, American Rock Salt, Mt. Morris, NY Jan. – May 2016
• Participated in federal safety inspections
• Prepared a chemical inventory and compiled the necessary safety data sheets for all
underground and aboveground mine facilities
• Assessed state pollutant discharge elimination system (SPDES) permit compliance
• Assisted with public presentations and meetings in anticipation of mine expansion

50
TECHNICAL SKILLS
Software: MATLAB, R, Visual MODFLOW Flex, ArcGIS, Microsoft Office Suite, Agisoft
PhotoScan, Pix4D, Adobe Illustrator
Field: Total station, iButton temperature loggers, Marsh-McBirney flow meter
HONORS AND AWARDS
Outstanding Student Presentation Award, AGU Hydrology Section Dec. 2019
Runner up in the AGU/NASA Data Visualization and Storytelling Competition Oct. 2019
Megalith Award for academic excellence and department service, SUNY Geneseo Dec. 2016
Dwornik Award for Best Undergraduate Poster, GSA Planetary Geology Division June 2016
Phi Beta Kappa April 2016
GRANTS
AGU/NASA Data Visualization and Storytelling Competition Travel Grant ($1,000) Dec. 2019
EMPOWER Professional Development Seed Grant ($350) Dec. 2019
EMPOWER Emerging Interdisciplinary Research Seed Grant ($3,000) July 2019
Syracuse University Department of Earth Sciences Merriam Research Grant ($1,900) April 2019
Central N.Y. Association for Professional Geologists Student Research Grant ($500) Dec. 2018
EMPOWER Professional Development Seed Grant ($1,500) Dec. 2018
TEACHING EXPERIENCE
Graduate Teaching Assistant, Syracuse University, Syracuse, NY
Introductory Earth Sciences Laboratory Spring 2019
Freshmen-level Oceanography Fall 2019
Undergraduate Teaching Assistant, SUNY Geneseo, Geneseo, NY
Introductory Environmental Science Lab Fall 2016
Historical Geology Lab Spring 2016
Mineralogy Lab Fall 2015
WORKSHOPS AND FIELD COURSES
EMPOWER Domestic Field Course: Hubbard Brook, NH and Syracuse, NY Aug. 2019
Women in Geospatial Sciences, Building Leaders for Tomorrow Workshop May 2019
Alan Alda Center Science Communication Workshop, Syracuse, NY Feb. 2019
Partnering with Beaver in Restoration Workshop, Lander, WY Aug. 2018
SUNY Geneseo International Field Course: Chile Jan. 2015
SERVICE, LEADERSHIP AND VOLUNTEER EXPERIENCE
AGU Hydrology Section Student Subcommittee (H3S) member Mar. 2020 – Present
Syracuse University Geology Graduate Organization treasurer and secretary Aug. 2019 – Present
Frontiers of Science Coordinator Sept. 2019 – Present
NSF National Research Traineeship Conference Volunteer Sept. 2019
Syracuse Environmental Challenge Science Fair Judge May 2019
SUNY Geneseo AIPG Student Chapter co-founder and secretary June 2015 – Dec. 2016

51
CONFERENCE ABSTRACTS
Poster Presentations:
Davis, J., Lautz, L.K., Kelleher, C., Russoniello, C. J., and Vidon, P., 2019, Assessing the
effects of beaver dam analogues on channel morphology using high-resolution imagery from
unoccupied aerial vehicles (UAVs): Abstract H53M-1962 presented at 2019 Fall Meeting, AGU,
San Francisco, California, 9–13 December.
Warner, N.H., Sweeney, J., Ganti, V., Golombek, M.P., Lamb, M.P., Fergason, R.L., and Kirk,
R., 2018, Degradation of one-hundred-meter-scale rocky ejecta craters at the InSight landing site
on Mars and implications for surface processes and erosion rates: Geological Society of America
Abstracts with Programs, v. 50, no. 6.
Golombek, M.P., Warner, N.H., Ganti, V., and Sweeney, J., 2017, Degradation of small impact
craters: Erosion rates and Mars climate: Geological Society of America Abstracts with Programs,
v. 49, no. 6.
Sweeney, J., Warner, N.H., Golombek, M.P., Kirk, R., Fergason, R.L., Pivarunas, A., Schwartz,
C.H., and Hernandez, D.J., 2017, Constructing a semi-automated method in ArcMap to measure
impact crater morphology: 48th Lunar and Planetary Science Conference, abstract 1741.
Sweeney, J., Kiro, Y., and Goldstein, S., 2016, Uranium isotopes as an indicator of the Dead Sea
response to Holocene climate shifts: American Geophysical Union Fall Meeting, abstract 2373.
Sweeney, J., Warner, N.H., Golombek, M.P., Kirk, R., Fergason, R.L., and Pivarunas, A., 2016,
Crater degradation and surface erosion rates at the InSight landing site, western Elysium Planitia:
47th Lunar and Planetary Science Conference, abstract 1576.
Warner, N.H., Golombek, M.P., Sweeney, J., and Pivarunas, A., 2016, Regolith thickness
estimates from the size frequency distribution of rocky ejecta craters in southwestern Elysium
Planitia, Mars: 47th Lunar and Planetary Science Conference, abstract 2231.
Oral Presentation:
Sweeney, J., Warner, N.H., Golombek, M.P., Kirk, R., Fergason, R.L., Pivarunas, A., Schwartz,
C.H., and Hernandez, D.J., 2015, Crater degradation and surface erosion rates at the InSight
landing site, Western Elysium Planitia, Mars: Geological Society of America Abstracts with
Programs, v. 47, no. 7, p. 603.
OTHER PRESENTATIONS
Davis, J., Assessing the impacts of beaver dam analogues on channel morphology in western
rangelands, Central New York Association of Professional Geologists monthly meeting,
Syracuse, NY, January 2020.
Davis, J., Eager as a beaver: Imitating nature’s ecosystem engineers, Ignite @ AGU, San
Francisco, CA, December 2019.