evaluating the impact of social security...
TRANSCRIPT
EVALUATING THE IMPACT OF SOCIAL SECURITY BENEFITS
ON HEALTH OUTCOMES AMONG THE ELDERLY
Padmaja Ayyagari
CRR WP 2015-25 September 2015
Center for Retirement Research at Boston College Hovey House
140 Commonwealth Ave Chestnut Hill, MA 02467
Tel: 617-552-1762 Fax: 617-552-0191 http://crr.bc.edu
Padmaja Ayyagari is an assistant professor in the department of health management and policy at the University of Iowa. The research reported herein was performed pursuant to a grant from the U.S. Social Security Administration (SSA) funded as part of the Retirement Research Consortium. The opinions and conclusions expressed are solely those of the author and do not represent the opinions or policy of SSA, any agency of the federal government, the University of Iowa, or Boston College. Neither the United States Government nor any agency thereof, nor any of their employees, makes any warranty, express or implied, or assumes any legal liability or responsibility for the accuracy, completeness, or usefulness of the contents of this report. Reference herein to any specific commercial product, process or service by trade name, trademark, manufacturer, or otherwise does not necessarily constitute or imply endorsement, recommendation or favoring by the United States Government or any agency thereof. © 2015, Padmaja Ayyagari. All rights reserved. Short sections of text, not to exceed two paragraphs, may be quoted without explicit permission provided that full credit, including © notice, is given to the source.

About the Steven H. Sandell Grant Program
This paper received funding from the Steven H. Sandell Grant Program for Junior Scholars in Retirement Research. Established in 1999, the Sandell program’s purpose is to promote research on retirement issues by scholars in a wide variety of disciplines, including actuarial science, demography, economics, finance, gerontology, political science, psychology, public administration, public policy, sociology, social work, and statistics. The program is funded through a grant from the Social Security Administration (SSA). For more information on the Sandell program, please visit our website at: http://crr.bc.edu/?p=9570, send e-mail to [email protected], or call (617) 552-1762.
About the Center for Retirement Research
The Center for Retirement Research at Boston College, part of a consortium that includes parallel centers at the University of Michigan and the National Bureau of Economic Research, was established in 1998 through a grant from the Social Security Administration. The Center’s mission is to produce first-class research and forge a strong link between the academic community and decision-makers in the public and private sectors around an issue of critical importance to the nation’s future. To achieve this mission, the Center sponsors a wide variety of research projects, transmits new findings to a broad audience, trains new scholars, and broadens access to valuable data sources.
Center for Retirement Research at Boston College Hovey House
140 Commonwealth Ave Chestnut Hill, MA 02467
Tel: 617-552-1762 Fax: 617-552-0191 http://crr.bc.edu
Affiliated Institutions: The Brookings Institution
Massachusetts Institute of Technology Syracuse University
Urban Institute

Abstract
Given concerns about the depletion of the Social Security Trust Fund, policymakers are
considering several proposals to improve the financial sustainability of the program, including
some that would lower benefits over time. The extent to which reductions in Social Security
benefits impact individual health and well-being is not well understood. Using data from a
nationally representative survey of older adults, we examine the impact of changes in Social
Security income on a broad range of elderly health outcomes, including cognitive function,
depression, disability and self-rated health. Prior literature has documented a positive
association between income and health. However, this association may reflect unmeasured
confounders that are correlated with both income and health (e.g. childhood environment) or
may reflect the impact of health on income. To address these concerns and to identify the causal
impact of income on health, we employ an instrumental variables strategy based on changes in
Social Security income due to amendments to the Social Security Act in the 1970s. We discuss
the implications of our findings for aging populations and for public policy.
The paper finds that:
• Higher Social Security benefits due to amendments to the Social Security Act in the
1970s led to significant improvements in elderly health outcomes. Specifically,
individuals receiving higher Social Security benefits due to these amendments saw
significant improvements in functional limitations (e.g. bathing, eating, preparing meals)
and cognitive function.
• Improvements in health are not uniform across all groups. In particular, improvements in
cognitive function were larger for individuals with better cognition.
• Further, higher Social Security income led to significant decreases in depressive
symptoms but only in the case of households whose primary Social Security beneficiary
had less than a high school education.
The policy implications of the findings are:
• Our findings have important implications for aging populations and for public policy.
Our findings suggest that cuts to Social Security benefits could potentially have

significant negative impacts on the functional limitations and cognitive function of older
adults, while increases in benefits could lead to improvements in health outcomes.
• In addition to the direct impact on population health, increases in Social Security benefits
could potentially be offset by reduced health care expenditures by the Medicaid or
Medicare program, since functional limitations and cognitive impairments are often
associated with significant health care spending.

Executive Summary
As U.S. policymakers consider various proposals to address the financial sustainability of
the Social Security program, it is important to evaluate the extent to which reductions in Social
Security benefits may impact individual health and well-being. Although a positive association
between income and health has been documented by prior literature, the extent to which this
association represents causal effects is not well understood. In this study, we use a quasi-
experimental approach to evaluate the impact of Social Security income on a wide range of
health outcomes, including cognitive function, depression, disability and self-rated health.
Income may affect health through several pathways. Higher income reduces financial
strain, resulting in lower stress and fewer depressive symptoms, which have also been linked to
cognitive decline. Individuals with higher incomes have better access to health care, which may
help delay the onset of severe health conditions or better manage current chronic conditions.
Higher Social Security income has been shown to increase the likelihood of early retirement, and
there is strong evidence that early retirement leads to faster declines in cognition. On the other
hand, retirement has also been shown to improve psychological well-being. Further, unmeasured
confounders (e.g. childhood environment, school quality) may influence both income and health,
or causality may run from health to income, leading to a spurious correlation between the two.
Therefore, the net impact of Social Security income on health outcomes is an empirical question.
To identify the causal impact of Social Security benefits, we examine changes in Social
Security income due to amendments to the Social Security Act in 1972 and 1977, commonly
referred to as the “Social Security Notch.” Prior to 1972, Social Security payments were not
indexed for inflation and benefits instead had been periodically increased by Congress. In 1972,
the Social Security Act was amended to provide an annual automatic cost-of-living adjustment
for benefits. However, the formula used to index benefits was flawed, leading to a faster
increase in benefits relative to inflation (referred to as “double indexation”). To correct this
error, the Social Security Act was amended in 1977, leading to a reduction in benefits for those
born in 1917 or later. These changes resulted in higher benefit amounts for individuals born
during 1915 to 1917, compared to adjacent cohorts with the same work history. Thus, by
comparing the health outcomes of persons born during 1915 to 1917 to the health of adjacent
cohorts, we are able to identify estimates of the relationship between income and health based on
quasi-experimental evidence.

We use data from the Study of Assets and Health Dynamics among the Oldest Old
(AHEAD), a longitudinal survey of community dwelling older adults and their spouses. We
restrict our sample to households born between 1901 and 1930 and employ an instrumental
variables regression model to identify the causal impact of Social Security benefits on health.
The instrument is a binary indicator for being born during 1915 to 1917, and the key explanatory
variable is self-reported Social Security income at the household level. Social Security income
is, on average, about $420 higher for the 1915-1917 cohort compared to the other cohorts.
Dependent variables include four measures of cognitive function: serial 7, which measures
working memory; word recall, which measures episodic memory; mental status, which measures
knowledge, language, and orientation; and the total cognition score, which sums the mental
status and word recall scores. We also estimate regressions using the count of Activities of Daily
Living (ADL) and Instrumental Activities of Daily Living (IADL) limitations as dependent
variables. Depression is measured using an abridged 8-item version of the Center for
Epidemiologic Studies (CESD) scale that asks respondents how they felt for much of the time
over the past week (e.g. depressed, lonely). Self-rated health is based on a survey question
asking individuals to rate their health as excellent, very good, good, fair or poor. Regressions
also include a basic set of sociodemographic characteristics (e.g. age, gender, race and ethnicity,
geographic region of residence, and marital status).
We find that higher Social Security benefits due to the 1977 amendments led to
significant improvements in cognitive function and reductions in ADL and IADL limitations.
Specifically, a $1,000 increase in annual Social Security income increases the total cognitive
score by approximately 4 percent and decreases ADL and IADL limitations by approximately 16
percent. In addition, we find that the number of depressive symptoms decreases by about 19
percent for households whose primary Social Security beneficiary has less than a high school
education, but there is no significant change in the mental health of households whose primary
beneficiary has a high school degree or higher education. Further, we use instrumental variable
quantile regression models to assess differences in the impact of income at different quantiles of
the distribution of total cognition. We find that the effect of income is larger at higher quantiles,
suggesting that individuals with better cognitive function experience larger gains. Our findings
suggest that changes to Social Security benefits have important implications for the health and
well-being of the elderly. Reductions to benefits could potentially have significant negative

impacts on the functional limitations and cognitive function of older adults, while increases in
benefits could lead to improvements in health outcomes. In addition to the direct impact on
population health, changes in Social Security benefits could potentially be offset by reduced
health care expenditures by the Medicaid or Medicare program, since functional limitations and
cognitive impairments are often associated with significant health care spending.

Introduction
The U.S. Social Security program is expected to face substantial financial challenges in
the near future due to demographic changes, including population aging due to the baby boom
generation, increasing life expectancy, and a declining worker-to-beneficiary ratio. Proposals to
address concerns about the financial sustainability of the Social Security program include
reducing benefits to future recipients. For example, a potential change to the Social Security
program is to index benefits using the chained Consumer Price Index, which would result in
lower annual increases for recipients. Other changes would increase benefits for certain targeted
groups. For example, another potential change is to increase the minimum Social Security
benefits for low-wage workers (Springstead, Whitman, and Shoffner 2014). The extent to which
such changes in Social Security benefits affect individual health and well-being is not well
understood. Existing studies have not reached a consensus on the impact of Social Security
benefits on health; decreases in benefits due to amendments to the Social Security Act in 1977
significantly reduced prescription drug use (Moran and Simon 2006) and mortality rates (Snyder
and Evans 2006), but did not have any impact on weight (Cawley, Moran, and Simon 2010).
More generally, there is not a consensus on the impact of income, including retirement income,
on health outcomes (Smith 1999). In this study, we contribute to this literature and the
understanding of the potential influences of changes to Social Security benefits by evaluating the
impact of Social Security income on a broad set of health outcomes among the elderly, including
cognitive function, depression, disability, and self-rated health.
In addition to affecting individual well-being, the health outcomes we focus on are
associated with substantial health care expenditures and impose a significant financial burden on
public programs such as Medicare and Medicaid (Ayyagari, Salm, and Sloan 2007, Unützer et al.
2009, Hurd et al. 2013). Declines in self-rated health and in cognition often precede the onset of
more severe health conditions such as Alzheimer’s disease (AD) or other dementias, which can
seriously impair an individual’s ability to carry out even basic daily activities. Aggregate health
care payments for persons with AD, estimated to be $200 billion in 2012, are expected to grow
over the next few years due to the aging of the baby boom generation (Alzheimer's Association
2012). Depression is strongly associated with low income and is often more severe among
persons with disability.

2
Social Security income could affect health outcomes among the elderly through several
pathways. Greater income could improve health through less financial strain, better access to
health care, and more beneficial living arrangements. Higher income reduces financial strain,
resulting in lower stress and fewer depressive symptoms, which in turn slows age-related
cognitive decline (Mendes De Leon, Rapp, and Kasl 1994). Individuals with greater income
have greater access to health care, which may help delay the onset of severe health conditions or
better manage current chronic conditions. Even among Medicare beneficiaries, income is
correlated with more coverage through the purchase of supplemental Medigap coverage (Ettner
1997, Fang, Keane, and Silverman 2008). Social Security income has also been shown to affect
the likelihood of living with others for elderly widows and divorcees (Engelhardt, Gruber, and
Perry 2005). Some studies have found that living alone is detrimental to neurocognitive health
and is associated with more depressive symptoms (Daviglus et al. 2010). Higher income, in
particular higher Social Security income, has been found to reduce labor supply and lead to early
retirement (French 2005, van der Klaauw and Wolpin 2008). Previous research has documented
that reductions in Social Security benefit levels have led to increases in labor force participation
for persons older than 65 years (Snyder and Evans 2006). There is strong evidence that being
engaged in work is protective of cognitive impairment and that early retirement leads to faster
declines in cognition (Rohwedder and Willis 2010, Bonsang, Adam, and Perelman 2012,
Mazzonna and Peracchi 2012). Therefore, early retirement or reduced work may offset the other
beneficial pathways through which higher income affects cognition. However, the impact of
retirement is not uniform across all health outcomes. In particular, prior work has found that
retirement improves psychological well-being (Charles 2004). Therefore, the net relationship
between income and health outcomes is theoretically ambiguous. Further, any observed
association between income and health may represent a spurious correlation due to unmeasured
confounders that are correlated with both income and elderly health outcomes, such as childhood
environment (Almond and Currie 2011).
This project examines the relationship between Social Security income and the health of
elderly individuals by using a quasi-experimental approach to identify the causal impact of
income on cognitive function, disability, depression and self-rated health. Specifically, we
assess the impact of exogenous changes to Social Security benefits due to amendments to the
Social Security Act in 1972 and 1977, commonly referred to as the “Social Security Notch,”

3
These amendments resulted in adjacent cohorts receiving different benefits for the same work
history. Using data from the Study of Assets and Health Dynamics among the Oldest Old
(AHEAD), we find that higher Social Security income improves cognitive function, disability
and mental health but has no impact on self-rated health.
Background on the Social Security Notch
The Social Security notch has been described in detail by prior studies (Krueger and
Pischke 1992, Engelhardt, Gruber, and Perry 2005) and on the website of the Social Security
Administration.1 Here we provide a brief overview of the notch changes that are relevant to our
study. Prior to 1972, Social Security payments were not indexed for inflation and benefits
instead had been periodically increased by Congress. In 1972, the Social Security Act was
amended to provide an annual automatic cost-of-living adjustment for benefits. However, the
formula used to index benefits was flawed, leading to a faster increase in benefits relative to
inflation (referred to as “double indexation”), so that workers born after 1910 received an
unintended windfall gain. This error was corrected by Congress in 1977, leading to a reduction
in benefits for those born in 1917 or later. To avoid abrupt changes for those close to retirement,
a five-year transition period was implemented during which benefits were gradually reduced
based on a special transition formula. For persons born in 1922 or later, benefits are calculated
using the new formula implemented in 1977. These changes resulted in different cohorts
receiving different benefits for the same work history. Moreover, due to grandfathering
provisions, these policy changes resulted in permanent changes in the Social Security benefits
received by these cohorts. The amendments directly affect individuals’ incomes but do not
impact health or other confounding factors directly. Therefore, by comparing the health
outcomes of persons in nearby cohorts with differing Social Security income due to the 1977
amendments, we are able to address key limitations of extant literature and provide estimates of
the relationship between income and health based on quasi-experimental evidence.
1 For example, see: http://www.ssa.gov/history/notchfile1.html, http://www.ssa.gov/history/notchfile2.html and http://www.ssa.gov/history/notchfile3.html.

4
Data
We use data from the AHEAD longitudinal survey of community-dwelling persons born
before 1924 and their spouses, regardless of age. Respondents were first interviewed in 1993
and then re-interviewed in 1995. We use data only from the 1993 wave of the AHEAD to avoid
any concerns about attrition between waves.
The dependent variables include a wide range of health measures. The AHEAD includes
detailed measures designed to capture various dimensions of cognition: knowledge, reasoning,
orientation, calculation, and language. Specifically, we use the following four measures of
cognitive function:2 (1) serial 7, (2) word recall, (3) mental status, and (4) total cognition score.
The AHEAD measures were derived from well-validated scales such as the Mini-Mental State
Examination and the Telephone Interview for Cognitive Status and were adapted so that they
could be administered in a large population study (Herzog and Wallace 1997). They have been
shown to have satisfactory psychometric properties and construct validity (Herzog and Wallace
1997).
Serial 7 measures working memory based on a task in which respondents are asked to
subtract 7 from 100 and to continue subtracting 7 from each subsequent number for a total of
five times. The score, ranging from 0 to 5, is the count of correct subtractions across the five
trials, with each subtraction being assessed independently. Word recall, a measure of episodic
memory, is based on a list of 10 nouns read to the respondent who is then asked to recall as many
words as possible in any order (immediate word recall). After approximately 5 minutes, during
which time respondents are asked other survey questions, they are asked to repeat the task
(delayed word recall). The score, which is the number of words that were correctly recalled from
both times, ranges from 0 to 20. Mental status is based on various tests designed to measure
knowledge, language and orientation, and sums the scores for serial 7, backwards counting from
20, object naming, date naming and president/vice-president naming. Respondents are asked to
count backwards as quickly as possible beginning with the number 20. Answers are coded 0 for
incorrect, 1 for correct on the second try and 2 for correct on the first try. In addition,
respondents are asked to report the month, day, year and day of the week during their interview,
and to name the object they would “usually use to cut paper” and “the kind of prickly plant that
2 In analysis not shown, we also examined two subjective measures of cognition: self-rated current memory (excellent, very good, good, fair or poor) and a self-report of how current memory compares to memory two years back (better, same or worse). We found no impact of Social Security income on either measure of cognition.
5
grows in the desert.” Each answer is coded 1 for a correct response and 0 for an incorrect one.
New-interviewees and re-interviewees ages 65 years or older are also asked to name the current
President and Vice President of the United States. Answers are coded 1 for getting each last
name right and 0 otherwise. The mental status score ranges from 0 to 15, with a higher value
representing better cognition. Total Cognition Score sums the mental status and word recall
scores, and imputes values for missing observations (Fisher et al. 2012, Ofstedal, Fisher, and
Herzog 2005). This measure ranges from 0 to 35, with a higher value representing better
cognition.
In addition to cognitive function, we assess the impact of income on self-rated health,
disability and depression.3 Self-Rated Health is based on a survey question asking respondents
to rate their health as excellent, very good, good, fair or poor health. We estimate separate
models using the continuous measure (ranging from 1 for excellent to 5 for poor health) and a
binary indicator for fair or poor health. Disability is measured using the count of limitations
performing ADL) and IADL. For ADLs, the survey asks about difficulty walking across a room,
dressing, bathing, eating, getting in and out of bed, and using the toilet. For IADLS, the survey
asks about difficulty using the phone, taking medication, managing money, and shopping for
groceries or preparing meals. Depression is measured using an abridged 8-item version of the
Center for Epidemiologic Studies (CESD) scale. Respondents are asked how often they felt
depressed, that everything was an effort, whether sleep was restless, felt they could not get
going, felt lonely, enjoyed life, felt sad and were happy. In addition to the continuous CESD
score, we also use a binary indicator for clinical depression based on a threshold of three or more
depressive symptoms. This threshold has been used by prior studies to evaluate clinically
relevant depressive symptomatology (Ayyagari and Shane 2015, McInerney, Mellor, and
Nicholas 2013).
The key explanatory variable is self-reported household income from Social Security
retirement, spousal or widow benefits. All regressions include a basic set of covariates – own
age and gender, the primary beneficiary’s age, race and ethnicity, census region of residence, a
binary indicator for residing in an metropolitan statistical area and indicators for the type of
3 We also examined two measures of cardiovascular health for a subsample of individuals who reported that they had ever been diagnosed with heart conditions. These measures were self-reports of a heart attack over the past five years and recent experiences of angina or chest pains. Unfortunately, for both measures the sample size was too small (approximately 2000 observations) to yield reliable estimates.

6
household: male head-married, male head-single, female head-never married, female head-
widowed (female head-divorced forms the reference category).
We follow previous studies on the Social Security benefits notch (Krueger and Pischke
1992, Moran and Simon 2006, Cawley, Moran, and Simon 2010, Goda, Golberstein, and
Grabowski 2011) in constructing the analysis sample. The analysis is restricted to households in
which the primary beneficiary was born between 1901 and 1930. In the case of two-person or
male-only households, the male member is designated as the primary beneficiary. In the case of
never-married females, the female is designated as the primary beneficiary. In the case of
divorced or widowed females, the deceased or former husband is designated as the primary
beneficiary. Since year of birth is not available for deceased or former husbands, we subtract
three years from the female’s year of birth to compute the primary beneficiary’s year of birth.
Engelhardt, Gruber and Perry (2005) has shown that the median age difference between spouses
in this cohort was three years. In addition to the birth-year restrictions, we exclude households
that report a Social Security income of less than $100 per month and observations with missing
or incomplete data.
Figure 1 presents the histograms for each measure of cognition. There is considerable
variation in each measure of cognition. In the case of serial 7, about 34 percent of the sample
obtains a perfect score while about 8 percent gets every answer wrong. The distribution of the
word recall score is slightly right skewed. The majority of individuals (76 percent) get less than
or equal to half the answers correct. About 23 percent of the sample obtains a perfect score on
the mental status measure. The distribution of the total cognition score is slightly left skewed,
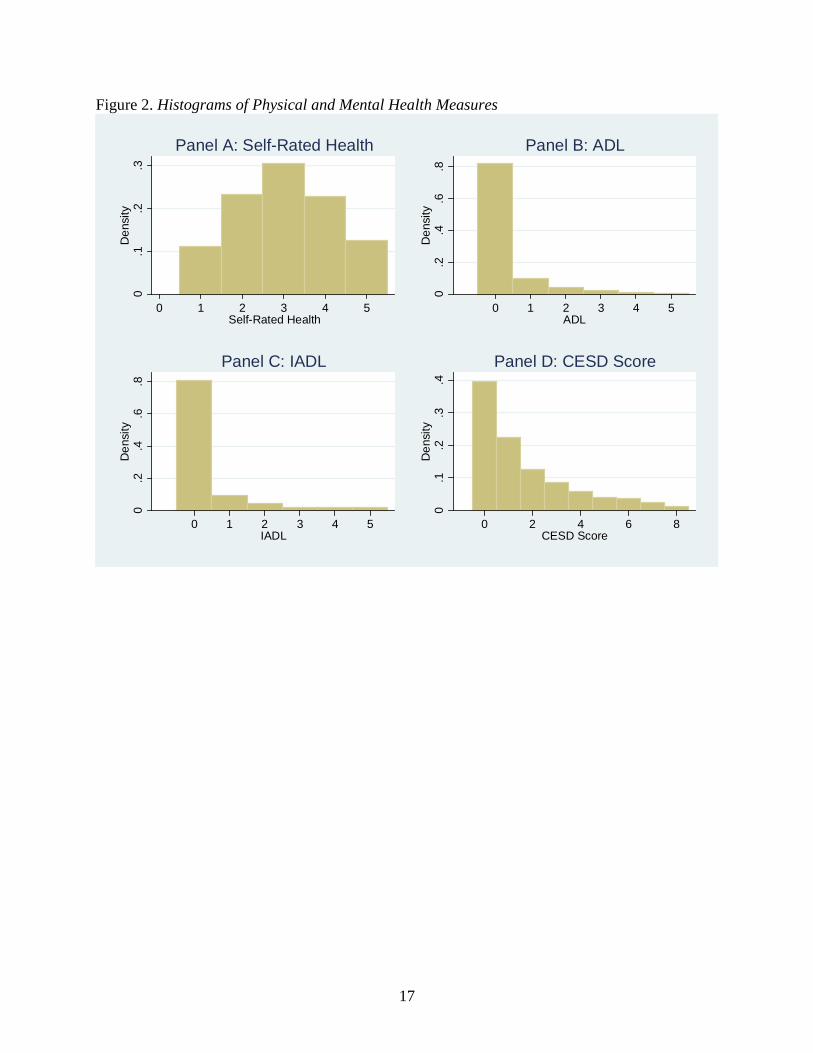
with about 30 percent of the sample obtaining a score of 17 or lower. Figure 2 presents the
histograms for the physical and mental health measures. About 65 percent of sample persons
report excellent to good health. Over 80 percent of individuals report no functional limitations
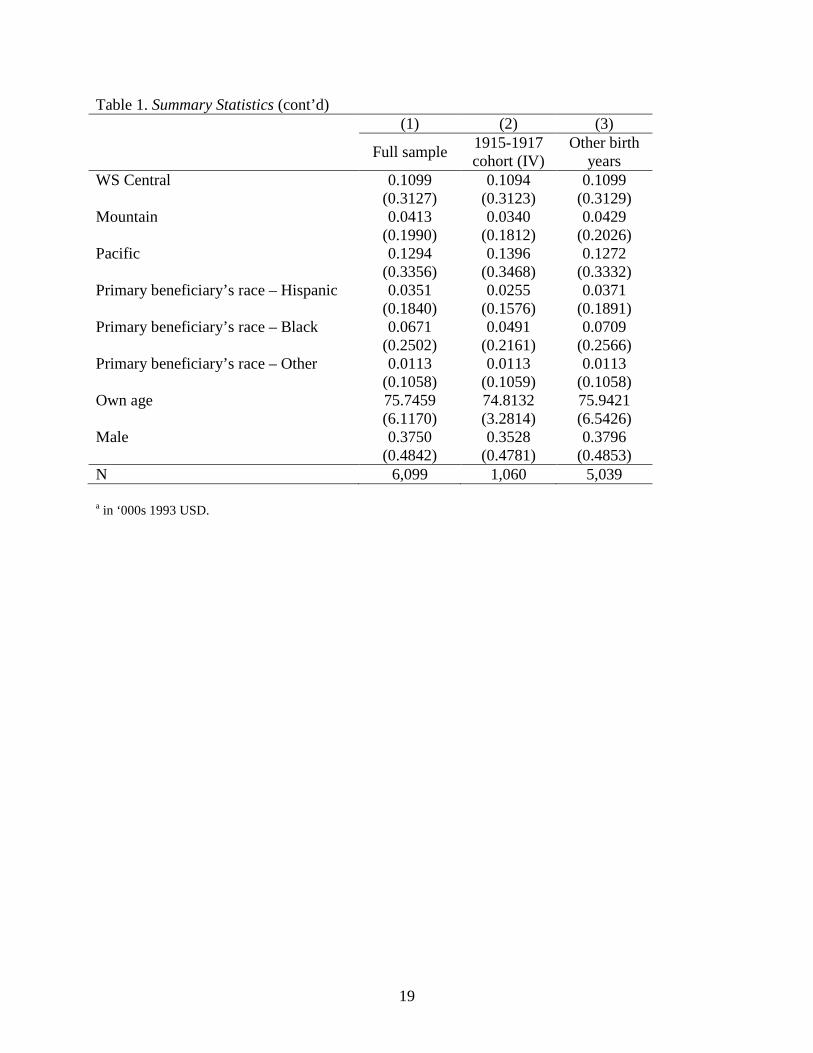
and approximately 40 percent of individuals do not report any depressive symptoms. Table 1
presents summary statistics for the full sample and separately for the cohorts used to create the
instrumental variable (described below). The average annual Social Security income for the
sample is nearly $11,000, which is about 39 percent of total household income, and the average
age of the primary Social Security beneficiary is nearly 78 years old. Social Security income is,
on average, about $420 higher for the 1915-1917 cohort compared to the other cohorts. This

7
cohort difference in benefits is about $1,020 for households whose primary beneficiary has less
than a high school education (not shown).
Methods
We first estimate the association between Social Security income and each measure of health
separately using ordinary least squares (OLS):
𝐻𝐻𝐻𝐻𝐻ℎ𝑖ℎ = 𝛼1 + 𝛼2𝑆𝑆𝑆𝑆𝑆𝑆𝑆𝐻ℎ + 𝛼3𝑋𝑖ℎ + 𝜀𝑖ℎ (Equation 1)
where 𝐻𝐻𝐻𝐻𝐻ℎ𝑖 represents a measure of health as previously described for individual 𝑖 in
household ℎ. The key explanatory variable in equation 1 is Social Security income at the
household level (‘𝑆𝑆𝑆𝑆𝑆𝑆𝑆𝐻’) and 𝑋 denotes the covariates.
As mentioned above, a key concern with evaluating the relationship between income and
health is that unobserved factors may be correlated with both Social Security income and health
outcomes leading to a spurious correlation between the two variables. Further, causality may run
in the reverse direction with health influencing income, although this is less likely in the case of
Social Security income. Thus, the estimate 𝛼2 from Equation (1) does not identify the causal
impact of Social Security income. To address the endogeneity of income, we estimate an
instrumental variable (IV) model using the following specification:
𝑆𝑆𝑆𝑆𝑆𝑆𝑆𝐻ℎ = 𝛽1 + 𝛽2𝑁𝑆𝐻𝑆ℎℎ + 𝛽3𝑋𝑖ℎ + 𝜈𝑖ℎ (Equation 2)
𝐻𝐻𝐻𝐻𝐻ℎ𝑖ℎ = 𝛾1 + 𝛾2𝑆𝑆𝑆𝑆𝑆𝑆𝑆𝐻� ℎ + 𝛾3𝑋𝑖ℎ + 𝜖𝑖ℎ (Equation 3)
The IV (𝑁𝑆𝐻𝑆ℎℎ) is a binary indicator that takes the value one for households whose
primary beneficiary was born during 1915-1917 and zero for households whose primary
beneficiary was born in any other year between 1901 and 1930. The IV model represented by
equations (2) and (3) identifies the causal impact of income on health under two key
assumptions. The first assumption is that the instrument (𝑁𝑆𝐻𝑆ℎℎ) is a strong predictor of
income. Prior studies have documented that the birth years 1915-1917 represent the peak of the
benefits notch and the largest deviation of Social Security income from the trend throughout the
period 1901-1930. Therefore, a binary variable defining the 1915-1917 cohorts provides the

8
strongest instrument and enables the interpretation of the impact of an increase in Social Security
income (Goda, Golberstein, and Grabowski 2011, Cawley, Moran, and Simon 2010, Moran and
Simon 2006). We can also assess the strength of the instrument in our sample based on the F-
statistic of the weak instrument test (Staiger and Stock 1997, Stock and Yogo 2005). The second
key assumption is that the instrument should not be correlated with health except via its effect on
income (exclusion restriction). Although this assumption is typically not testable, in the case of
our application, it is plausible that being born during 1915 to 1917 should not be correlated with
health relative to other adjacent cohorts except due to the differences in Social Security benefits
due to the 1977 amendments. All regressions cluster the standard errors at the year of birth level,
to account for correlations in health outcomes within birth cohorts.
In addition to estimating the overall impact of Social Security benefits on health, we
examine the extent to which these effects vary by educational attainment.4 Further, to examine
the heterogeneity of the impact of income by level of health, we estimate instrumental variable
quantile regression (Chernozhukov and Hansen 2008) where equations 2 and 3 are modified to
estimate the impact of income at various quantiles of the distribution of health. Specifically, we
focus on the 0.10, 0.25, 0.5, 0.75, and 0.90 quantiles. Because this methodology is most
appropriate for continuous variables, we restrict these analyses to the total cognition score.5
Quantile regression allows us to estimate the impact of income not only at the center but also at
the tails of the distribution of cognition, thereby providing information on the extent to which
changes in Social Security benefits could potentially influence disparities in cognition.
Results
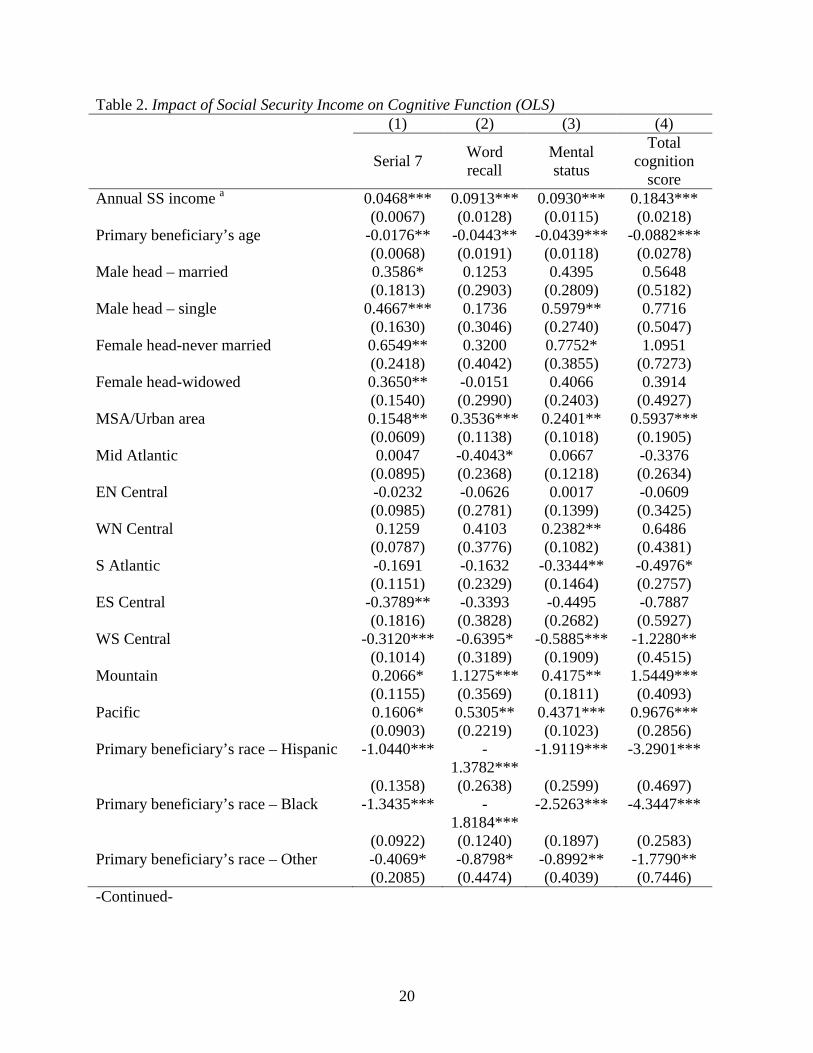
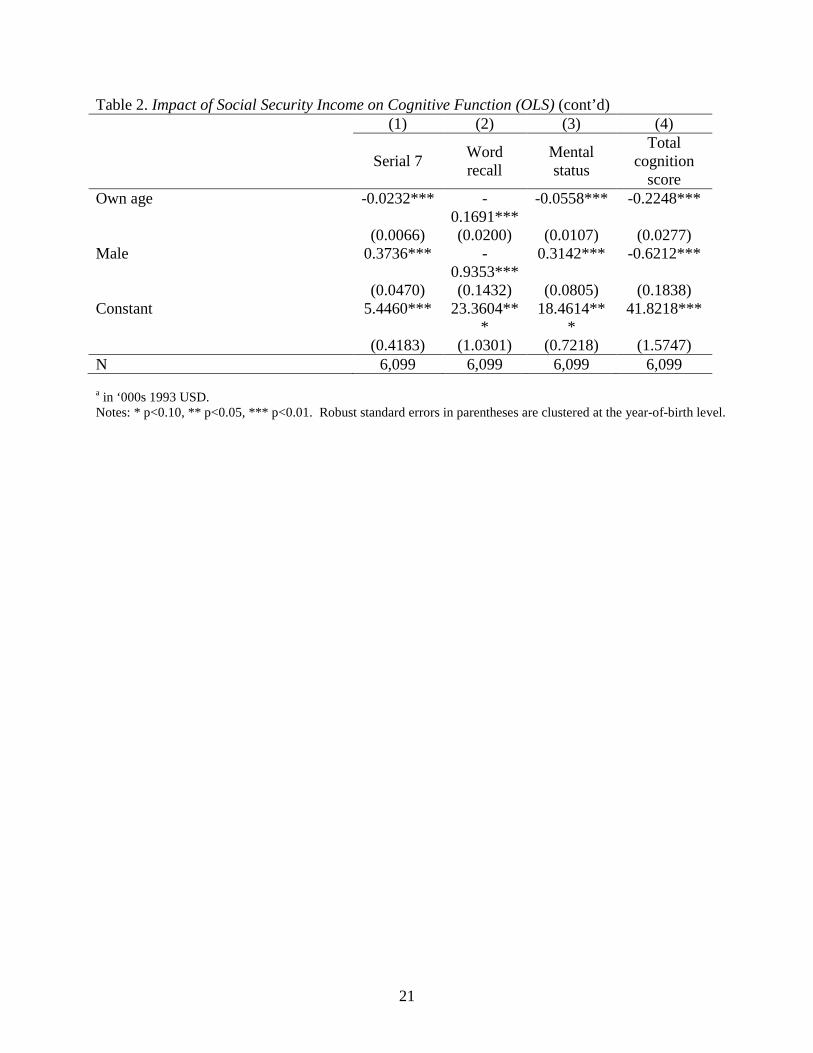
We begin by examining the correlation between Social Security income and cognitive
function using the OLS models (Table 2). Across all four measures of cognition, there is a
positive, significant correlation between income and cognition, although the magnitudes of the
point estimates are rather modest. Specifically, a $1,000 increase in annual income is associated
with a 0.05 higher serial 7 score, 0.1 higher word recall and mental status score, and a 0.2 higher
total cognition score. Relative to the sample means, these estimates represent a 1.4 percent
4 We also explored heterogeneous effects by race and ethnicity, but sample sizes were too small to obtain reliable estimates. 5 We also explored instrumental variable quantile regressions for some of the other continuous measures of health, including word recall, mental status, and CESD. However, these models did not converge.

9
increase in the serial 7 score, a 1.2 percent increase in word recall, a 0.8 percent increase in
mental status, and a 0.9 percent increase in the total cognition score. Next, we assess the
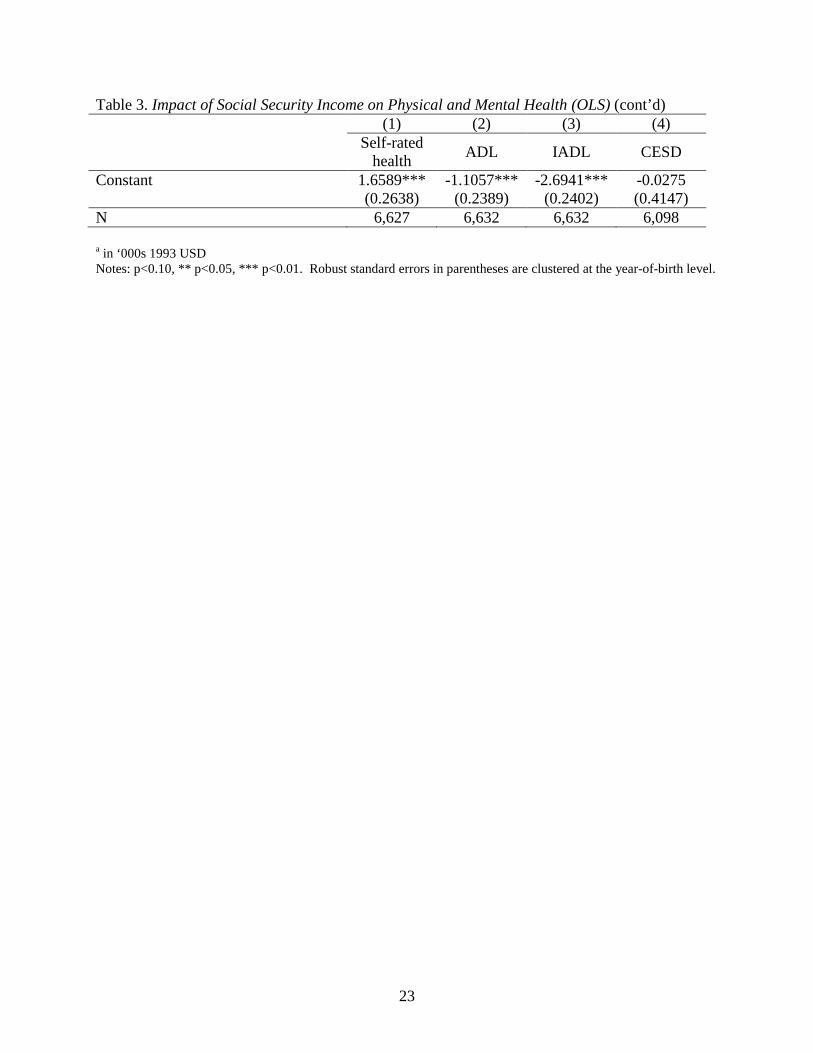
correlation between income and self-rated health, ADLs, IADLs and the CESD score (Table 3).
For each of these measures, a higher value indicates worse health. We find that higher income is
significantly associated with better self-rated health, fewer ADL and IADL limitations, and
fewer depressive symptoms. The point estimates presented in Table 3 represent a 1 percent
decrease in self-rated health, a 4.1 percent in ADLs, a 5.2 percent decrease in IADLs and a 2.1
percent decrease in the CESD score.
As discussed above, these estimates do not represent causal effects due to unobserved
factors that may be correlated with both income and health outcomes. Therefore, we account for
the endogeneity of income using the IV models represented by equations (2) and (3). In Table 4,
we present results for the cognition measures. Column (1) presents the first stage results, while
columns 2 to 5 present the second stage results for each of the cognition measures. The first
stage results show that the instrument is strongly correlated with Social Security income and the
F-statistic from the test of weak instruments is 13.3, above the commonly accepted threshold of
10. Conditional on other covariates, individuals born between 1915 and 1917 have annual Social
Security income approximately $700 greater than other cohorts. Accounting for the endogeneity
of income, we find a significant positive impact of Social Security income on all four measures
of cognitive function. Relative to the sample mean, there is a 4.8 percent increase in the serial 7
score, a 6.6 percent increase in the recall score, a 2.1 percent increase in the mental status score,
and a 3.9 percent increase in the total cognition score. The IV models identify a larger effect
than the OLS models, which may be due to measurement error in self-reported Social Security
income which would bias OLS estimates towards zero. It is also plausible that unobserved
factors are correlated with income and cognition in ways that bias OLS estimates downwards.
Table 5 presents results from the IV models for self-rated health, disability and
depression. There is no longer a significant effect of income on self-rated health, suggesting that
the correlation identified by OLS models may be driven by unobserved confounders. We also
estimated OLS and IV models using the binary indicator for fair or poor self-rated health (not
shown). Results were similar to the ones obtained using the continuous measure. In contrast, we
do find a significant reduction in functional limitations even after accounting for the endogeneity
of income. Relative to the sample mean, there is a 15.8 percent reduction in the number of ADL

10
limitations and a 15.7 percent decline in the number of IADL limitations. We also find a 9.1
percent decrease in the number of depressive symptoms; however, this estimate is only
significant at the 10 percent level.
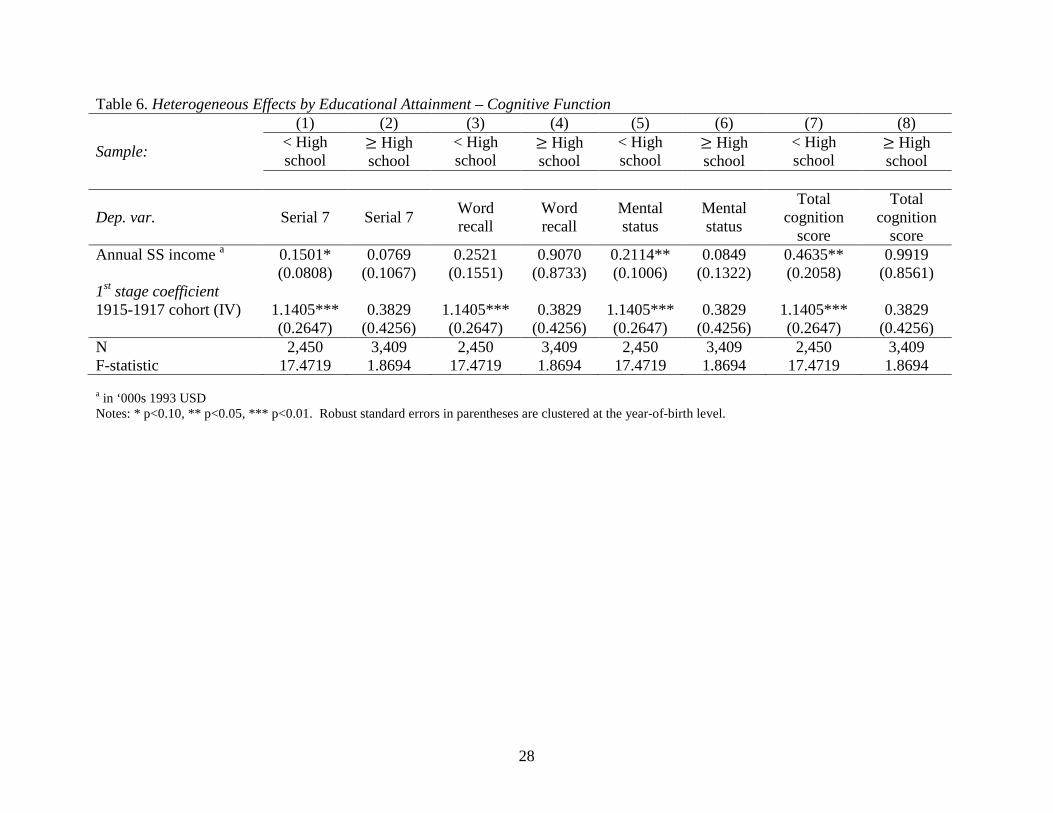
In Tables 6 and 7, we explore heterogeneous effect by educational attainment.
Specifically, we estimate separate regressions for households whose primary Social Security
beneficiary has less than a high school education and for households whose primary beneficiary
has a high school degree or higher education. Heterogeneity by education is important for two
reasons. First, the 1977 amendments also increased the covered earnings maximum used to
calculate the “average indexed monthly earnings” (AIME), which summarizes up to 35 years of
a worker’s indexed earnings and is used to determine benefits. As a result of this change, the
notch had a larger effect on persons with less than a high school education (Goda, Golberstein,
and Grabowski 2011). Secondly, education is well known to be strongly correlated with health.
Therefore, Social Security benefits may differentially affect the health of low-education
households compared to high-education households. Table 6 shows that the impact of income on
cognition does vary by education. For serial 7, mental status, and total cognition, we find that
Social Security income has a positive impact on cognition for households whose primary
beneficiary has less than a high school degree. For households whose primary beneficiary is a
high school graduate, Social Security income does not have a statistically significant influence
on cognition for any of the measures, although the point estimates are larger than the point
estimates for low-education households for word recall and total cognition.
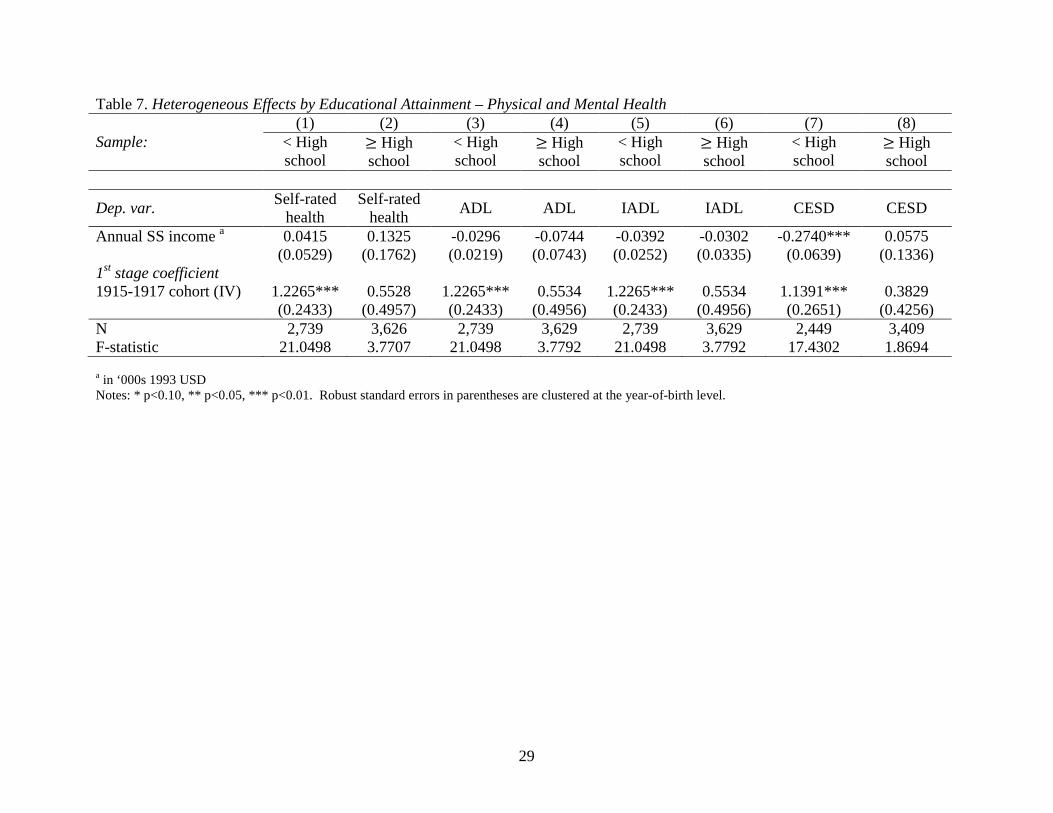
We do not find significant effects of income on self-rated health or disability when we
stratify the sample by education (Table 7). However, in the case of CESD score, there is a large
and significant effect of income for low-education households. In contrast, the estimate for
high=education households is small in magnitude and statistically insignificant. Further, we
evaluate the extent to which these decreases in the number of depressive symptoms represent
clinically meaningful improvements in mental health. Using a binary indicator of three or more
depressive symptoms, we find that a $1,000 increase in Social Security income decreases the
probability of three or more depressive symptoms by 2 percentage points (or 8 percent relative to
the sample mean) in the full sample (not shown). This effect is significant at the 10 percent
level. Consistent with the results using the continuous CESD measure, we find that higher
Social Security benefits are associated with a large, significant decline in the likelihood of
11
depression among households whose primary beneficiary has less than a high school education.
Specifically, for these households, a $1000 increase in Social Security income led to a 5.8
percentage point (18.5 percent) drop in the probability of having three or more depressive
symptoms. In contrast, the effect for high-education households is statistically insignificant.
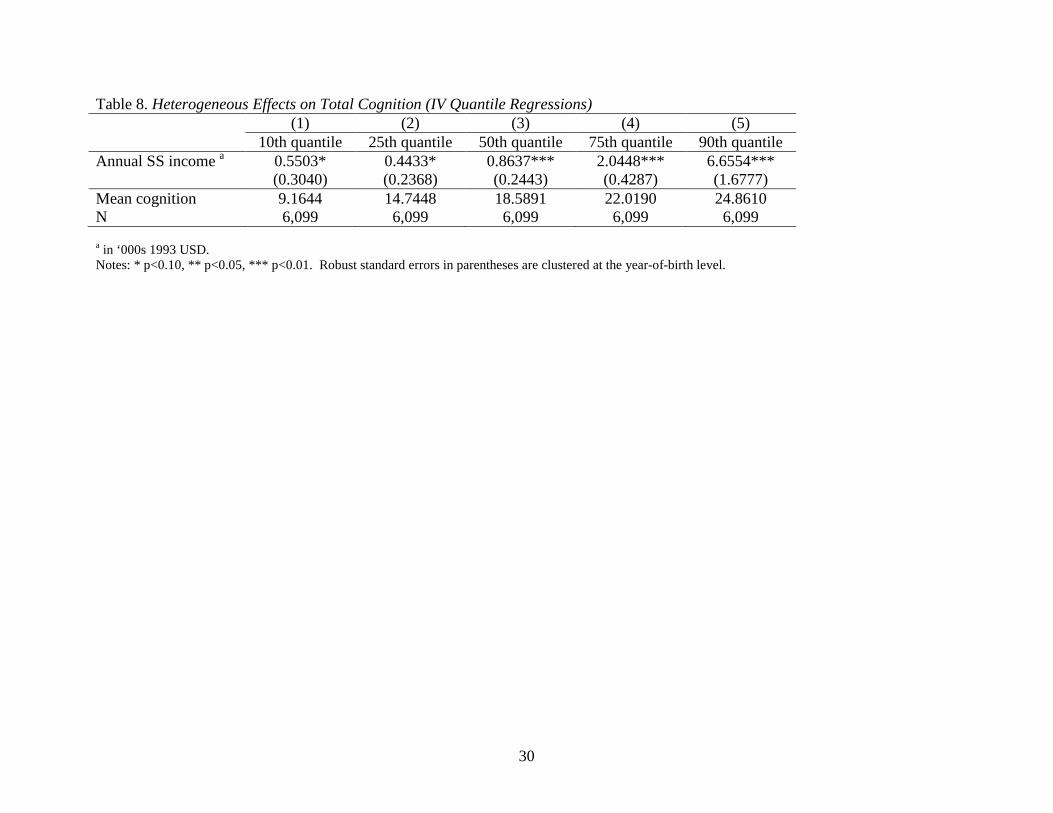
Finally, we assess the extent to which the impact of income varies at different levels of
cognition using an instrumental variable quantile regression model. The results presented in
Table 8 show that there is a larger effect of income at higher quantiles. At the 10th quantile, a
$1000 increase in Social Security income is associated with a 0.6 unit increase in the total
cognition score, while at the 90th quantile a similar amount of income results in a 6.7 increase in
the total cognition score. Thus, while higher Social Security benefits are beneficial to all groups,
individuals with better cognition benefit more from increases in income. This suggests that
disparities in cognition increase sharply with income.
Conclusion
Using data from a nationally representative survey of older adults, we find that higher
Social Security income significantly improves health outcomes among the elderly. Specifically,
we find that increases in annual Social Security benefits led to significant improvements in
functional limitations and cognitive function, and that the improvements in cognition function
were larger for individuals with better cognition. We also find significant improvements in
mental health, but only in the subsample of households whose primary beneficiary has less than a
high school education. In contrast, we do not find any significant improvements in self-rated
health. By using a quasi-experimental approach based on amendments to the Social Security Act
in the 1970s, this study is able to address several limitations of prior literature on the relationship
between income and health, including unmeasured confounders and reverse causality.
The findings of our study have important implications for aging populations and for
public policy. As discussed above, several proposals that would change Social Security benefits
in order to address the financial solvency of the Social Security Trust Fund are currently under
consideration by policymakers. During a period of renewed policy discussion around changes to
entitlement programs for the elderly, it is important to understand whether changes to Social
Security might influence the health and well-being of the elderly. Our findings suggest that
reductions to Social Security benefits could potentially have significant negative impacts on the

12
functional limitations and cognitive function of older adults, while increases in benefits could
lead to improvements in health outcomes. In addition to the direct impact on population health,
changes in Social Security benefits may also affect public health insurance programs such as
Medicaid and Medicare since functional limitations and cognitive impairments are often
associated with significant health care spending. Thus, any increased program outlays on Social
Security benefits could potentially be offset by reduced health care expenditures by the Medicaid
or Medicare program. However, further research is necessary to fully understand the net impact
of changes to Social Security benefits on aggregate spending by federal and state governments.

13
References Almond, Douglas and Janet Currie. 2011. “Killing Me Softly: The Fetal Origins Hypothesis.”
Journal of Economic Perspectives 25(3): 153-72.
Alzheimer’s Association Report. 2012. “2012 Alzheimer’s Disease Facts and Figures.” Alzheimer’s & Dementia 8(2): 131-168.
Ayyagari, P., M. Salm, and F. A. Sloan. 2007. “Effects of Diagnosed Dementia on Medicare and Medicaid Program Costs.” Inquiry 44(4): 481-494.
Ayyagari, Padmaja and Dan M. Shane. 2015. “Does Prescription Drug Coverage Improve Mental Health? Evidence from Medicare Part D.” Journal of Health Economics 41: 46-58.
Bonsang, Eric, Stéphane Adam, and Sergio Perelman. 2012. “Does Retirement Affect Cognitive Functioning?” Journal of Health Economics 31(3): 490-501.
Cawley, John, John Moran, and Kosali Simon. 2010. “The Impact of Income on the Weight of Elderly Americans.” Health Economics 19(8): 979-993.
Charles, K. K. 2004. “Is Retirement Depressing?: Labor Force Inactivity and Psychological Well-Being in Later Life.” Research in Labor Economics 23: 269-299.
Chernozhukov, Victor and Christian Hansen. 2008. “Instrumental Variable Quantile Regression: A Robust Inference Approach.” Journal of Econometrics 142(1): 379-398.
Daviglus, M. L., C. C. Bell, W. Berrettini, P. E. Bowen, E. S. Connolly, N. J. Cox, J. M. Dunbar-Jacob, E. C. Granieri, G. Hunt, and K. McGarry. 2010. “NIH State-of-the-Science Conference Statement: Preventing Alzheimer’s Disease and Cognitive Decline.” NIH Consensus and State-of-the-Science Statements 27(4): 1-30.
Engelhardt, Gary V., Jonathan Gruber, and Cynthia D. Perry. 2005. “Social Security and Elderly Living Arrangements: Evidence from the Social Security Notch.” Journal of Human Resources XL (2): 354-372.
Ettner, Susan L. 1997. “Adverse Selection and the Purchase of Medigap Insurance by the Elderly.” Journal of Health Economics 16(5): 543-562.
Fang, Hanming, Michael P. Keane, and Dan Silverman. 2008. “Sources of Advantageous Selection: Evidence from the Medigap Insurance Market.” Journal of Political Economy 116(2): 303-350. –
Fisher, G. G., H. Hassan, W. L. Rodgers, and D. R. Weir. 2012. “Health and Retirement Study –Imputation of Cognitive Functioning Measures: 1992–2010 Early Release.” Ann Arbor, MI: Survey Research Center.

14
French, Eric. 2005. “The Effects of Health, Wealth, and Wages on Labour Supply and Retirement Behaviour.” The Review of Economic Studies 72(2): 395-427.
Goda, Gopi Shah, Ezra Golberstein, and David C Grabowski. 2011. “Income and the Utilization of Long-Term Care Services: Evidence from the Social Security Benefit Notch.” Journal of Health Economics 30(4): 719-729.
Herzog, A. Regula and Robert B. Wallace. 1997. “Measures of Cognitive Functioning in the AHEAD Study.” The Journals of Gerontology Series B: Psychological Sciences and Social Sciences 52(Special Issue): 37-48.
Hurd, Michael D., Paco Martorell, Adeline Delavande, Kathleen J. Mullen, and Kenneth M. Langa. 2013. “Monetary Costs of Dementia in the United States.” New England Journal of Medicine 368(14): 1326-1334.
Krueger, Alan B. and Jorn-Steffen Pischke. 1992. “The Effect of Social Security on Labor Supply: A Cohort Analysis of the Notch Generation.” Journal of Labor Economics 10(4): 412-37.
Mazzonna, Fabrizio and Franco Peracchi. 2012. “Ageing, Cognitive Abilities and Retirement.” European Economic Review 56(4): 691-710.
McInerney, Melissa, Jennifer M. Mellor, and Lauren Hersch Nicholas. 2013. “Recession Depression: Mental Health Effects of the 2008 Stock Market Crash.” Journal of Health Economics 32(6): 1090-1104.
Mendes De Leon, Carlos F., Stephen S. Rapp, and Stanislav V. Kasl. 1994. “Financial Strain and Symptoms of Depression in a Community Sample of Elderly Men and Women: A Longitudinal Study.” Journal of Aging and Health 6(4): 448-468.
Moran, John R and Kosali Ilayperuma Simon. 2006. “Income and the Use of Prescription Drugs by the Elderly Evidence from the Notch Cohorts.” Journal of Human Resources 41(2): 411-432.
Ofstedal, M. B., G. G. Fisher, and A. R. Herzog. 2005. “Documentation of Cognitive Functioning Measures in the Health and Retirement Study.” Ann Arbor, MI: University of Michigan.
Rohwedder, Susann and Robert J. Willis. 2010. “Mental Retirement.” Journal of Economic Perspectives 24(1): 119-38.
Smith, James P. 1999. “Healthy Bodies and Thick Wallets: The Dual Relation between Health and Economic Status.” Journal of Economic Perspectives 13(2): 145-166.
Snyder, Stephen E. and William N. Evans. 2006. “The Effect of Income on Mortality: Evidence from the Social Security Notch.” The Review of Economics and Statistics 88(3): 482-495.

15
Springstead, Glenn R., Kevin Whitman, and Dave Shoffner. 2014. “Proposed Revisions to the Special Minimum Benefit for Low Lifetime Earners.” Social Security Administration Policy Brief 2014-01. Washington, D.C.: U.S. Social Security Administration.
Staiger, Douglas and James H. Stock. 1997. “Instrumental Variables Regression with Weak Instruments.” Econometrica 65(3): 557-586.
Stock, James and Motohiro Yogo. 2005. “Testing for Weak Instruments in Linear IV Regression.” in Identification and Inference for Econometric Models: Essays In Honor of Thomas Rothenberg. New York: Cambridge University Press: 80-108.
Unützer, Jürgen, Michael Schoenbaum, Wayne J. Katon, Ming‐Yu Fan, Harold A. Pincus, Diane
Hogan, and Jennifer Taylor. 2009. “Healthcare Costs Associated with Depression in Medically Ill Fee‐for‐Service Medicare Participants.” Journal of the American Geriatrics Society 57(3): 506-510.
Van der Klaauw, Wilbert and Kenneth I. Wolpin. 2008. “Social Security and the Retirement and Savings Behavior of Low-Income Households.” Journal of Econometrics 145(1–2): 21-42.

16
Figure 1. Histograms of Cognitive Function Measures
0.1
.2.3
.4D
ensi
ty
0 1 2 3 4 5Serial 7
Panel A: Serial 7
0.0
2.0
4.0
6.0
8.1
Den
sity
0 2 4 6 8 10 12 14 16 18 20Word Recall
Panel B: Word Recall0
.05
.1.1
5.2
.25
Den
sity
0 1 3 5 7 9 11 13 15Mental Status
Panel C: Mental Status
0.0
2.0
4.0
6.0
8D
ensi
ty
0 5 10 15 20 25 30 35Total Cognition Score
Panel D: Total Cognition Score
17
Figure 2. Histograms of Physical and Mental Health Measures
0.1
.2.3
Den
sity
0 1 2 3 4 5Self-Rated Health
Panel A: Self-Rated Health
0.2
.4.6
.8D
ensi
ty
0 1 2 3 4 5ADL
Panel B: ADL0
.2.4
.6.8
Den
sity
0 1 2 3 4 5IADL
Panel C: IADL
0.1
.2.3
.4D
ensi
ty
0 2 4 6 8CESD Score
Panel D: CESD Score

18
Table 1. Summary Statistics (1) (2) (3) Full sample 1915-1917
cohort (IV) Other birth
years Serial 7 3.2623 3.3991 3.2336 (1.6918) (1.6503) (1.6992) Word recall 7.8834 8.4066 7.7734 (3.8703) (3.7720) (3.8820) Mental status 12.2620 12.5330 12.2050 (2.7099) (2.4572) (2.7569) Total cognition score 20.1454 20.9396 19.9784 (5.6614) (5.2330) (5.7340) Self-rated health 3.0220 3.0293 3.0206 (1.1867) (1.1765) (1.1889) ADL 0.3352 0.2775 0.3470 (0.8519) (0.7746) (0.8664) IADL 0.3908 0.2970 0.4101 (0.9827) (0.8412) (1.0082) CESD score 1.6358 1.5377 1.6564 (1.9844) (1.9189) (1.9975) Annual SS income a 10.8135 11.1612 10.7404 (5.1330) (5.5231) (5.0447) Primary beneficiaries’ age 77.7357 76.9632 77.8982 (5.6568) (0.8128) (6.2001) Male head–married 0.5678 0.5236 0.5771 (0.4954) (0.4997) (0.4941) Male head-single 0.0935 0.0962 0.0929 (0.2911) (0.2950) (0.2903) Female head-never married 0.0174 0.0151 0.0179 (0.1307) (0.1220) (0.1325) Female head-widowed 0.2889 0.3189 0.2826 (0.4533) (0.4663) (0.4503) MSA/Urban area 0.7508 0.7311 0.7549 (0.4326) (0.4436) (0.4302) Mid Atlantic 0.1399 0.1519 0.1373 (0.3469) (0.3591) (0.3442) EN Central 0.1874 0.1981 0.1852 (0.3903) (0.3988) (0.3885) WN Central 0.0795 0.0774 0.0800 (0.2706) (0.2673) (0.2713) S Atlantic 0.2351 0.2142 0.2395 (0.4241) (0.4104) (0.4268) ES Central 0.0361 0.0321 0.0369 (0.1865) (0.1763) (0.1886) -Continued-
19
Table 1. Summary Statistics (cont’d) (1) (2) (3) Full sample 1915-1917
cohort (IV) Other birth
years WS Central 0.1099 0.1094 0.1099 (0.3127) (0.3123) (0.3129) Mountain 0.0413 0.0340 0.0429 (0.1990) (0.1812) (0.2026) Pacific 0.1294 0.1396 0.1272 (0.3356) (0.3468) (0.3332) Primary beneficiary’s race – Hispanic 0.0351 0.0255 0.0371 (0.1840) (0.1576) (0.1891) Primary beneficiary’s race – Black 0.0671 0.0491 0.0709 (0.2502) (0.2161) (0.2566) Primary beneficiary’s race – Other 0.0113 0.0113 0.0113 (0.1058) (0.1059) (0.1058) Own age 75.7459 74.8132 75.9421 (6.1170) (3.2814) (6.5426) Male 0.3750 0.3528 0.3796 (0.4842) (0.4781) (0.4853) N 6,099 1,060 5,039 a in ‘000s 1993 USD.
20
Table 2. Impact of Social Security Income on Cognitive Function (OLS) (1) (2) (3) (4)
Serial 7 Word recall
Mental status
Total cognition
score Annual SS income a 0.0468*** 0.0913*** 0.0930*** 0.1843*** (0.0067) (0.0128) (0.0115) (0.0218) Primary beneficiary’s age -0.0176** -0.0443** -0.0439*** -0.0882*** (0.0068) (0.0191) (0.0118) (0.0278) Male head – married 0.3586* 0.1253 0.4395 0.5648 (0.1813) (0.2903) (0.2809) (0.5182) Male head – single 0.4667*** 0.1736 0.5979** 0.7716 (0.1630) (0.3046) (0.2740) (0.5047) Female head-never married 0.6549** 0.3200 0.7752* 1.0951 (0.2418) (0.4042) (0.3855) (0.7273) Female head-widowed 0.3650** -0.0151 0.4066 0.3914 (0.1540) (0.2990) (0.2403) (0.4927) MSA/Urban area 0.1548** 0.3536*** 0.2401** 0.5937*** (0.0609) (0.1138) (0.1018) (0.1905) Mid Atlantic 0.0047 -0.4043* 0.0667 -0.3376 (0.0895) (0.2368) (0.1218) (0.2634) EN Central -0.0232 -0.0626 0.0017 -0.0609 (0.0985) (0.2781) (0.1399) (0.3425) WN Central 0.1259 0.4103 0.2382** 0.6486 (0.0787) (0.3776) (0.1082) (0.4381) S Atlantic -0.1691 -0.1632 -0.3344** -0.4976* (0.1151) (0.2329) (0.1464) (0.2757) ES Central -0.3789** -0.3393 -0.4495 -0.7887 (0.1816) (0.3828) (0.2682) (0.5927) WS Central -0.3120*** -0.6395* -0.5885*** -1.2280** (0.1014) (0.3189) (0.1909) (0.4515) Mountain 0.2066* 1.1275*** 0.4175** 1.5449*** (0.1155) (0.3569) (0.1811) (0.4093) Pacific 0.1606* 0.5305** 0.4371*** 0.9676*** (0.0903) (0.2219) (0.1023) (0.2856) Primary beneficiary’s race – Hispanic -1.0440*** -
1.3782*** -1.9119*** -3.2901***
(0.1358) (0.2638) (0.2599) (0.4697) Primary beneficiary’s race – Black -1.3435*** -
1.8184*** -2.5263*** -4.3447***
(0.0922) (0.1240) (0.1897) (0.2583) Primary beneficiary’s race – Other -0.4069* -0.8798* -0.8992** -1.7790** (0.2085) (0.4474) (0.4039) (0.7446) -Continued-
21
Table 2. Impact of Social Security Income on Cognitive Function (OLS) (cont’d) (1) (2) (3) (4)
Serial 7 Word recall
Mental status
Total cognition
score Own age -0.0232*** -
0.1691*** -0.0558*** -0.2248***
(0.0066) (0.0200) (0.0107) (0.0277) Male 0.3736*** -
0.9353*** 0.3142*** -0.6212***
(0.0470) (0.1432) (0.0805) (0.1838) Constant 5.4460*** 23.3604**
* 18.4614**
* 41.8218***
(0.4183) (1.0301) (0.7218) (1.5747) N 6,099 6,099 6,099 6,099 a in ‘000s 1993 USD. Notes: * p<0.10, ** p<0.05, *** p<0.01. Robust standard errors in parentheses are clustered at the year-of-birth level.

22
Table 3. Impact of Social Security Income on Physical and Mental Health (OLS) (1) (2) (3) (4) Self-rated
health ADL IADL CESD
Annual SS income a -0.0299*** -0.0137*** -0.0201*** -0.0339*** (0.0042) (0.0025) (0.0033) (0.0063) Primary beneficiary’s age 0.0057 0.0046 0.0086 0.0203*** (0.0044) (0.0045) (0.0051) (0.0073) Male head–married 0.0178 -0.0360 0.2839*** -0.2259* (0.0750) (0.0708) (0.0621) (0.1271) Male head-single -0.2544*** -0.0662 0.0275 0.2963* (0.0739) (0.0826) (0.0677) (0.1494) Female head – never married -0.2113 -0.1943* 0.0913 -0.4978** (0.1415) (0.1076) (0.1047) (0.1912) Female head – widowed -0.0017 -0.0570 0.1488*** -0.0429 (0.0628) (0.0629) (0.0532) (0.1137) MSA/Urban area -0.1159*** -0.0064 0.0071 -0.0083 (0.0357) (0.0251) (0.0299) (0.0635) Mid Atlantic -0.0161 0.0437 0.0730 -0.0419 (0.0899) (0.0445) (0.0491) (0.1671) EN Central -0.0201 0.0419 0.0627 -0.2395 (0.0786) (0.0483) (0.0480) (0.1476) WN Central -0.1812* 0.0100 0.0600 -0.5291*** (0.0915) (0.0529) (0.0440) (0.1566) S Atlantic -0.0717 0.0662 0.0794 -0.2329 (0.0733) (0.0412) (0.0532) (0.1511) ES Central 0.1619 0.0236 0.3351*** -0.1843 (0.1033) (0.0683) (0.1027) (0.1769) WS Central 0.0813 0.2478*** 0.2269*** 0.2635* (0.0684) (0.0525) (0.0697) (0.1401) Mountain -0.3123*** -0.0064 0.0054 -0.2780 (0.1000) (0.0474) (0.0569) (0.2001) Pacific -0.2028*** -0.0011 0.0048 -0.4010*** (0.0722) (0.0394) (0.0506) (0.1452) Primary beneficiary’s race – Hispanic 0.3708*** 0.1474 0.2201*** 0.8198*** (0.1088) (0.0908) (0.0792) (0.2000) Primary beneficiary’s race – Black 0.4070*** 0.0943* 0.2787*** 0.3252*** (0.0560) (0.0461) (0.0778) (0.0975) Primary beneficiary’s race – Other 0.3346** 0.0894 0.1639 0.4549 (0.1424) (0.1105) (0.0992) (0.2878) Own age 0.0176*** 0.0163*** 0.0306*** 0.0111* (0.0034) (0.0031) (0.0045) (0.0061) Male 0.0702** -0.0642*** -0.0545** -0.3462*** (0.0334) (0.0180) (0.0259) (0.0471) -Continued-
23
Table 3. Impact of Social Security Income on Physical and Mental Health (OLS) (cont’d) (1) (2) (3) (4) Self-rated
health ADL IADL CESD
Constant 1.6589*** -1.1057*** -2.6941*** -0.0275 (0.2638) (0.2389) (0.2402) (0.4147) N 6,627 6,632 6,632 6,098 a in ‘000s 1993 USD Notes: p<0.10, ** p<0.05, *** p<0.01. Robust standard errors in parentheses are clustered at the year-of-birth level.

24
Table 4: Impact of Social Security Income on Cognitive Function (IV)
Dep. var.
(1) (2) (3) (4) (5) IV 1st Stage IV 2nd Stage
Annual SS income a Serial 7 Word
recall Mental status
Total cognition
score Annual SS income a 0.1546*** 0.5224** 0.2604*** 0.7827*** (0.0312) (0.2156) (0.0553) (0.2319) 1915-1917 cohort (IV) 0.7128** (0.2774) Primary beneficiary’s age -0.0156 -0.0158** -0.0367** -0.0410*** -0.0777*** (0.0226) (0.0062) (0.0175) (0.0105) (0.0248) Male head – married 7.3930*** -0.4299 -3.0298** -0.7852 -3.8150** (0.3311) (0.2879) (1.5239) (0.4996) (1.5811) Male head – single 2.7570*** 0.1750 -0.9939 0.1448 -0.8492 (0.3376) (0.1783) (0.6096) (0.3095) (0.6545) Female head – never married 1.0432** 0.5492** -0.1031 0.6110 0.5079 (0.4824) (0.2619) (0.5367) (0.4068) (0.8368) Female head – widowed 1.0940*** 0.2505 -0.4731 0.2288 -0.2442 (0.1987) (0.1561) (0.3768) (0.2452) (0.5025) MSA/Urban area 0.8560*** 0.0648 -0.0065 0.1003 0.0938 (0.1616) (0.0620) (0.2009) (0.0975) (0.2407) Mid Atlantic 0.5958 -0.0608 -0.6663 -0.0350 -0.7013 (0.6298) (0.1114) (0.4231) (0.1709) (0.5471) EN Central 0.4984 -0.0776 -0.2801 -0.0827 -0.3629 (0.4724) (0.0968) (0.3451) (0.1359) (0.4176) WN Central 0.3533 0.0890 0.2630 0.1810 0.4440 (0.5791) (0.0954) (0.4682) (0.1337) (0.5751) S Atlantic -0.4627 -0.1178 0.0420 -0.2547 -0.2127 (0.5995) (0.1261) (0.4309) (0.1834) (0.5337) ES Central -0.0732 -0.3690** -0.2996 -0.4341 -0.7337 (0.5537) (0.1781) (0.4465) (0.2713) (0.6602) WS Central -0.9428* -0.2098* -0.2306 -0.4298* -0.6604 (0.4793) (0.1110) (0.4986) (0.2245) (0.6521) Mountain -0.2357 0.2347* 1.2398*** 0.4611** 1.7009*** (0.5824) (0.1209) (0.4626) (0.1978) (0.5514) Pacific 0.1614 0.1422 0.4568 0.4085*** 0.8654* (0.5598) (0.0966) (0.3521) (0.1246) (0.4519) Primary beneficiary’s race – Hispanic -3.0585*** -0.7114*** -0.0474 -1.3953*** -1.4427* (0.3811) (0.1488) (0.7081) (0.2757) (0.7745) Primary beneficiary’s race – Black -2.5791*** -1.0622*** -0.6929 -2.0895*** -2.7823*** (0.3795) (0.1483) (0.6369) (0.2706) (0.7531) Primary beneficiary’s race – Other -1.2133 -0.2777 -0.3626 -0.6985* -1.0611* (0.8014) (0.2350) (0.3809) (0.3843) (0.6098)
-Continued-

25
Table 4: Impact of Social Security Income on Cognitive Function (IV) (cont’d)
Dep. var.
(1) (2) (3) (4) (5) IV 1st Stage IV 2nd Stage
Annual SS income a Serial 7 Word
recall Mental status
Total cognition
score Own age 0.0558** -0.0289*** -0.1919*** -0.0646*** -0.2565*** (0.0207) (0.0063) (0.0195) (0.0090) (0.0247) Male -0.1377 0.3876*** -0.8795*** 0.3358*** -0.5437*** (0.1073) (0.0431) (0.1188) (0.0781) (0.1568) Constant 2.5907* 5.1075*** 22.0056**
* 17.9355**
* 39.9412**
* (1.4751) (0.4443) (1.5369) (0.7710) (2.1384) N 6,099 6,099 6,099 6,099 6,099 F-statistic 13.3002
a in ‘000s 1993 USD. Notes: * p<0.10, ** p<0.05, *** p<0.01. Robust standard errors in parentheses are clustered at the year-of-birth level.

26
Table 5. Impact of Social Security Income on Physical and Mental Health (IV)
Dep. var. (1) (2) (3) (4)
Self-rated health ADL IADL CESD
Annual SS income a 0.0508 -0.0528** -0.0615*** -0.1484* (0.0504) (0.0266) (0.0219) (0.0883) Primary beneficiary’s age 0.0073 0.0038 0.0078 0.0183** (0.0048) (0.0047) (0.0050) (0.0075) Male head – married -0.5728 0.2505 0.5869*** 0.6123 (0.3637) (0.2068) (0.1492) (0.6323) Male head – single -0.4794*** 0.0429 0.1430* 0.6062** (0.1555) (0.1107) (0.0747) (0.2370) Female head – never married -0.2944*** -0.1540 0.1340 -0.3854 (0.1142) (0.1121) (0.1142) (0.2438) Female head – widowed -0.0827 -0.0177 0.1904*** 0.0788 (0.0753) (0.0700) (0.0504) (0.1465) MSA/Urban area -0.1839*** 0.0266 0.0419 0.0875 (0.0571) (0.0262) (0.0288) (0.0717) Mid Atlantic -0.0545 0.0623 0.0927 0.0277 (0.0997) (0.0545) (0.0608) (0.2116) EN Central -0.0529 0.0578 0.0796 -0.1813 (0.0801) (0.0546) (0.0578) (0.1948) WN Central -0.2015* 0.0198 0.0703 -0.4900** (0.1043) (0.0617) (0.0514) (0.1929) S Atlantic -0.0327 0.0472 0.0593 -0.2874 (0.0870) (0.0390) (0.0579) (0.1794) ES Central 0.1804 0.0146 0.3255*** -0.1948 (0.1182) (0.0723) (0.1050) (0.1944) WS Central 0.1698* 0.2049*** 0.1815** 0.1549 (0.0957) (0.0577) (0.0762) (0.1717) Mountain -0.2868** -0.0188 -0.0077 -0.3078 (0.1245) (0.0495) (0.0651) (0.2279) Pacific -0.2134*** 0.0040 0.0102 -0.3815** (0.0807) (0.0475) (0.0547) (0.1795) Primary beneficiary’s race – Hispanic 0.6236*** 0.0248 0.0904 0.4662 (0.1854) (0.1105) (0.0993) (0.3204) Primary beneficiary’s race – Black 0.6136*** -0.0059 0.1727** 0.0261 (0.1631) (0.0722) (0.0686) (0.2331) Primary beneficiary’s race – Other 0.4443*** 0.0362 0.1077 0.3175 (0.1622) (0.1172) (0.0920) (0.2851) Own age 0.0139*** 0.0181*** 0.0325*** 0.0172** (0.0045) (0.0034) (0.0043) (0.0077) Male 0.0885*** -
0.0731*** -0.0639** -0.3608***
(0.0307) (0.0191) (0.0251) (0.0460) -Continued-

27
Table 5. Impact of Social Security Income on Physical and Mental Health (IV) (cont’d)
Dep. var. (1) (2) (3) (4)
Self-rated health ADL IADL CESD
Constant 1.3393*** -0.9504***
-2.5299*** 0.3313
(0.2867) (0.2586) (0.2496) (0.5997)
First Stage Estimates
Dep. var. Annual SS income a
Annual SS income a
Annual SS income a
Annual SS income a
1915-1917 cohort (IV) 0.8605** 0.8610** 0.8610** 0.7121** (0.3298) (0.3298) (0.3298) (0.2775) F-statistic 18.9649 18.9889 18.9889 13.2758 N 6,627 6,632 6,632 6,098 a in ‘000s 1993 USD. Notes: * p<0.10, ** p<0.05, *** p<0.01. Robust standard errors in parentheses are clustered at the year-of-birth level.
28
Table 6. Heterogeneous Effects by Educational Attainment – Cognitive Function (1) (2) (3) (4) (5) (6) (7) (8)
Sample: < High school
≥ High school
< High school
≥ High school
< High school
≥ High school
< High school
≥ High school
Dep. var. Serial 7 Serial 7 Word recall
Word recall
Mental status
Mental status
Total cognition
score
Total cognition
score Annual SS income a 0.1501* 0.0769 0.2521 0.9070 0.2114** 0.0849 0.4635** 0.9919 (0.0808) (0.1067) (0.1551) (0.8733) (0.1006) (0.1322) (0.2058) (0.8561) 1st stage coefficient 1915-1917 cohort (IV) 1.1405*** 0.3829 1.1405*** 0.3829 1.1405*** 0.3829 1.1405*** 0.3829 (0.2647) (0.4256) (0.2647) (0.4256) (0.2647) (0.4256) (0.2647) (0.4256) N 2,450 3,409 2,450 3,409 2,450 3,409 2,450 3,409 F-statistic 17.4719 1.8694 17.4719 1.8694 17.4719 1.8694 17.4719 1.8694
a in ‘000s 1993 USD Notes: * p<0.10, ** p<0.05, *** p<0.01. Robust standard errors in parentheses are clustered at the year-of-birth level.
29
Table 7. Heterogeneous Effects by Educational Attainment – Physical and Mental Health
Sample: (1) (2) (3) (4) (5) (6) (7) (8)
< High school
≥ High school
< High school
≥ High school
< High school
≥ High school
< High school
≥ High school
Dep. var. Self-rated health
Self-rated health ADL ADL IADL IADL CESD CESD
Annual SS income a 0.0415 0.1325 -0.0296 -0.0744 -0.0392 -0.0302 -0.2740*** 0.0575 (0.0529) (0.1762) (0.0219) (0.0743) (0.0252) (0.0335) (0.0639) (0.1336) 1st stage coefficient 1915-1917 cohort (IV) 1.2265*** 0.5528 1.2265*** 0.5534 1.2265*** 0.5534 1.1391*** 0.3829 (0.2433) (0.4957) (0.2433) (0.4956) (0.2433) (0.4956) (0.2651) (0.4256) N 2,739 3,626 2,739 3,629 2,739 3,629 2,449 3,409 F-statistic 21.0498 3.7707 21.0498 3.7792 21.0498 3.7792 17.4302 1.8694 a in ‘000s 1993 USD Notes: * p<0.10, ** p<0.05, *** p<0.01. Robust standard errors in parentheses are clustered at the year-of-birth level.
30
Table 8. Heterogeneous Effects on Total Cognition (IV Quantile Regressions) (1) (2) (3) (4) (5) 10th quantile 25th quantile 50th quantile 75th quantile 90th quantile Annual SS income a 0.5503* 0.4433* 0.8637*** 2.0448*** 6.6554*** (0.3040) (0.2368) (0.2443) (0.4287) (1.6777) Mean cognition 9.1644 14.7448 18.5891 22.0190 24.8610 N 6,099 6,099 6,099 6,099 6,099
a in ‘000s 1993 USD. Notes: * p<0.10, ** p<0.05, *** p<0.01. Robust standard errors in parentheses are clustered at the year-of-birth level.
31
RECENT WORKING PAPERS FROM THE CENTER FOR RETIREMENT RESEARCH AT BOSTON COLLEGE
Does Age-Related Decline in Ability Correspond with Retirement Age? Anek Belbase, Geoffrey T. Sanzenbacher, and Christopher M. Gillis, September 2015 Job Polarization and Labor Market Outcomes for Older, Middle-Skilled Workers Matthew S. Rutledge and Qi Guan, September 2015 What Causes Workers to Retire Before They Plan? Alicia H. Munnell, Geoffrey T. Sanzenbacher, and Matthew S. Rutledge, September 2015 Calculating Neutral Increases in Retirement Age by Socioeconomic Status Geoffrey T. Sanzenbacher, Anthony Webb, Candace M. Cosgrove, and Natalia S. Orlova, August 2015 How Does Occupational Access for Older Workers Differ by Education? Matthew S. Rutledge, Steven A. Sass, and Jorge D. Ramos-Mercado, August 2015 How Much Longer Do People Need to Work? Alicia H. Munnell, Anthony Webb, and Anqi Chen, August 2015 The Challenge of Pension Reform in Georgia: Non-Contributory Pensions and Elderly Poverty Tamila Nutsubidze and Khatuna Nutsubidze, July 2015 The Transition from Defined Benefit to Defined Contribution Pensions: Does It Influence Elderly Poverty? Natalia S. Orlova, Matthew S. Rutledge, and April Yanyuan Wu, July 2015 Will the Average Retirement Age Continue to Increase? Matthew S. Rutledge, Christopher M. Gillis, and Anthony Webb, July 2015 The Role of Occupations in Differentiating Health Trajectories in Later Life Michal Engelman and Heide Jackson, University of Wisconsin-Madison, July 2015 The Relationship Between Automatic Enrollment and DC Plan Contributions: Evidence from a National Survey of Older Workers Barbara A. Butrica and Nadia S. Karamcheva, July 2015 Evidence of Increasing Differential Mortality: A Comparison of the HRS and SIPP Barry P. Bosworth and Kan Zhang, July 2015
All working papers are available on the Center for Retirement Research website (http://crr.bc.edu) and can be requested by e-mail ([email protected]) or phone (617-552-1762).