evaluating the informational efficiency of australian ...eprints.qut.edu.au/2528/1/2528.pdf ·...
TRANSCRIPT

Helen Higgs* and Andrew C. Worthington**
Evaluating the informational efficiency of Australian electricity spot markets: multiple variance ratio tests of random walks Published as: Higgs, Helen and Worthington, Andrew (2003) Evaluating the informational efficiency of Australian electricity spot markets: multiple variance ratio tests of random walks. Pacific and Asian Journal of Energy 13(1):pp. 1-16
Abstract This paper examines whether Australian electricity spot prices follow a random walk. Daily peak and off-peak (base load) prices for New South Wales, Victoria, Queensland and South Australia are sampled over the period July 1999 to June 2001 and analysed using multiple variance ratio tests. The results indicate that the null hypothesis of a random walk can be rejected in all peak period and most off-period markets because of the autocorrelation of returns. For the Victorian market, the off-peak period electricity spot price follows a random walk. One implication of the study is that in most instances, stochastic autoregressive modelling techniques may be adequate for forecasting electricity prices.
Introduction
Over the last two decades an increasing number of developed and developing economies
around the world have restructured their electricity markets. Starting with Chile, Argentina
and the United Kingdom, and followed by the United States and most members of the
European Union, these efforts have entailed a move away from the heavily-regulated publicly
or privately-owned, vertically-integrated utilities of the past towards more market-based
structures for electricity suppliers in the present and potentially more competitive outcomes
for consumers in the future (Crow 2002).
In the past ten years Australia has also been at the forefront of these efforts to introduce
competition into the global power industry. Where electricity was once supplied by state
government-owned entities that had never operated on a national or even a regional basis, and
where interstate connections were weak and regional electricity trade limited, the market is
now characterised by the separation of the generation, transmission and distribution functions
by company, and by a competitive national electricity market across the majority of
* Ms. Helen Higgs is a Lecturer in Econometrics in the School of Economics and Finance, Queensland University of Technology, Australia. She holds a master’s in econometrics from the University of Queensland and is currently undertaking her doctorate at the Queensland University of Technology. ** Dr. Andrew C. Worthington is an Associate Professor in Finance in the School of Economics and Finance, Queensland University of Technology, Australia. He holds a doctorate in economics from the University of Queensland.

H. Higgs and A.C. Worthington 2
Australian states and territories. And for the most part, the restructuring and liberalisation of
the Australian electricity market has been a success. In evidence, the benefits to the economy
of electricity market liberalisation amounted to $1.5 billion in 2000 alone, labour productivity
in the electricity supply industry doubled in the last decade while capital productivity
increased by ten percent, and average retail electricity prices are now more than ten percent
below the levels of the early 1990s (ABARE 2002).
However, in recent years the pace of electricity reform in Australia has slowed. The target
dates for full retail competition have been delayed and each of the five National Electricity
Market (NEM) members: namely, New South Wales (NSW), Victoria (VIC), Queensland
(QLD), South Australia (SA) and the Australian Capital Territory (ACT) are still
characterised by separate transmission companies. Full privatisation has occurred only in
Victoria. In South Australia private companies manage the state-owned generation,
transmission and distribution companies under long-term leases; in the remaining states and
territories they remain in government ownership. The dominance of the individual generating
companies in each market is also high with the two largest generators accounting for seventy
percent of generation in NSW, and in most other states and territories at least fifty percent.
The NEM itself is not yet strongly integrated with interstate trade representing only some
seven percent of total generation. During periods of peak demand, the interconnectors can
become congested and the NEM separates into its regions, promoting price differences across
markets and exacerbating reliability problems and the market power of regional utilities.
Ongoing challenges remain in implementing efficient transmission pricing with a view to
strengthening interconnection as a check on regional market power and extending retail
access to all consumers.
Nevertheless, overriding the electricity reform process in Australia has been the ongoing
objective that “…the electricity market should be competitive” such that cost of consuming
the delivered electricity is as low as economically feasible, but is still sufficient to induce
investment in new capacity. In the short run, the market regulations are constructed in such a
way that the most efficient generators are dispatched to meet a given level of electricity
demand. The lowest market price provided ensures that all generators are at least
compensated for any short run marginal costs incurred (ABARE 2002). In the longer run, it is
expected that efficient markets will signal a return on investment, through higher prices, that
is sufficient to induce further capacity expansion. Competitive investment would then result
in additions to generation capacity in such a way that the average cost of meeting electricity
demand requirements over time was minimised (ABARE 2002). Accordingly, the benchmark

Evaluating the informational efficiency of Australian electricity spot markets 3
for efficiency within the national electricity market is competitive market outcomes. By
measuring the extent to which actual market prices exceed the prices that would occur in a
competitive market, some assessment of the efficiency of pricing is obtained.
Yet the ability of these newly competitive electricity markets to play the role that is
ascribed to them depends not only on their efficiency in an economic sense but also on their
efficiency in the market sense. If they are to help improve the operation of the electricity
market itself in the shorter term, and the capital market in the longer term, then the price
formation process is crucial. And more often than not, an assessment of price formation is
couched in terms of ‘market efficiency’. Under this efficient market hypothesis prices are
rationally related to economic realities and incorporate all the information available to the
market. In such a market price changes should be serially random (or follow a random walk)
and the absence of exploitable excess or abnormal profit opportunities implies that electricity
is appropriately priced at its equilibrium level. Such information is also important because it
determines the statistical assumptions that underlie price forecasts in these markets.
Of course, there are any number of reasons to believe that competitive outcomes in
electricity markets are associated with random (or non-serially correlated) prices changes
while non-competitive outcomes are associated with non-random (or serially correlated) price
changes. In a competitive electricity market, prices are inherently volatile as demand varies
widely both within a day or week and across seasons within a year. Electricity consumption is
difficult to predict and the lack of real-time pricing means demand is not very responsive to
price changes. Further, the ability to quickly increase production beyond installed capacity is
limited, and the high cost of idle capacity and the lack of economical storage, along with the
fact that demand and supply must be continuously balanced to meet certain physical supply
quality requirements (frequency, voltage and stability) together imply that prices reflect the
underlying volatility in the cost of supplying electricity (ABARE 2002). This would suggest
that electricity spot prices should at least approximate a random walk.
However, in a non-competitive environment there is every reason to expect that efforts by
generation businesses to exercise market power by withholding capacity or by raising prices
at which they are willing to supply electricity above their short run marginal cost will be
reflected in sustained price increases. For example, the withholding of capacity by generators
in California contributed to significant price increases in 2000/01 (Joskow and Kahn 2001)
while Robinson and Baniak (2002) found generators in the English and Welsh Electricity
Pool had an incentive to raise prices and manipulate volatility in order to benefit from higher
H. Higgs and A.C. Worthington 4
risk premia in the contract market. Wolfram (1999) likewise examined the impact of duopoly
power in the British electricity market.
In this paper an attempt is made to examine the informational efficiency of the four state-
based regional electricity markets that comprise the Australian National Electricity Market by
testing for random walks in the wholesale electricity prices. The paper itself is divided into
five main areas. The first section briefly surveys the establishment and operation of the
Australian National Electricity Market. The second section provides a description of the data
employed in the analysis, while the third section discusses the methodology employed. The
results are dealt with in the fourth section. The paper ends with a brief conclusion in the final
section.
Australian electricity markets
The Australian National Electricity Market (NEM) encompasses electricity generators in the
eastern state electricity markets of Australia operating as a nationally interconnected grid. The
member jurisdictions of the NEM thus include the three most populous states of New South
Wales (NSW) [including the Australian Capital Territory (ACT)], Victoria (VIC) and
Queensland (QLD) along with South Australia (SA). The only non-state based member that
currently provides output into the NEM is the Snowy Mountains Hydroelectric Scheme
(SNO). The SNO is regarded as a special case owing to the complexity of arrangements
underlying both its original construction and operating arrangements involving both the state
governments of New South Wales and Victoria, as well as the Commonwealth (federal)
government. It is intended that the island state of Tasmania will become a member of the
NEM pending completion of the Basslink interconnector, which will link Tasmania’s
Electricity Supply Industry with that of the mainland. The remaining Australian state of
Western Australia along with the Northern Territory is unlikely to participate in the NEM in
the foreseeable future due to the economic and physical unfeasibility of interconnection and
transmission augmentation across such geographically dispersed and distant areas.
The limitations of transfer capability within the centrally coordinated and regulated NEM
are indeed one of its defining features. Queensland has two interconnectors that together can
import and export 880 megawatts (MW) to and from NSW, NSW can export 850 MW to the
Snowy and 3000 MW from the Snowy and Victoria can import 1500 MW from the Snowy
and 250 MW from South Australia and export 1100 MW to the Snowy and 500 MW to South
Australia. There is currently no direct connector between NSW and South Australia and
Queensland is only connected directly to NSW.

Evaluating the informational efficiency of Australian electricity spot markets 5
The NEM was developed and operates under a number of legislative agreements,
memorandums of understanding and protocols between the participating jurisdictions. They
include a mechanism for uniformity of relevant electricity legislation across states,
implementation of the National Electricity Code (NEC) and the creation of the National
Electricity Code Administrator (NECA) and the National Electricity Market Management
Company (NEMMCO) to control and implement the NEM. The NECA is the organisation
charged with administering the NEC. This entails monitoring participant compliance with the
Code and raising Code breaches with the National Electricity Tribunal (IEA: 2001: 132).
Other roles of the NECA include managing changes to the NEC and establishing procedures
for dispute resolution, consultative, and reporting procedures (NEMMCO 2001: 28). The
NECA also established the Reliability Panel in 1997, in order to “determine power system
security and reliability standards, and monitor market reliability” (IEA: 2001: 132).
The market rules that govern the operation of the NEM are embedded in the NEC, which
was developed in consultation with government, industry and consumers during the mid-
1990s. NEMMCO (2001: 4) summarises the rationale for the thoroughness of the NEC:
The rules and standards of the Code ensure that all parties seeking to be part of the electricity network should have access on a fair and reasonable basis. The Code also defines technical requirements for the electricity networks, generator plant, and customer connection equipment to ensure that electricity delivered to the customers meets prescribed standards.
The NEC required authorisation by the Australian Competition and Consumer Commission
(ACCC) to be implemented, as do any changes. Born from the Hilmer microeconomic
reforms in the 1990s the ACCC is the peak Australian body aimed at enforcing competition
law. To this affect, the ACCC is responsible for administering the Trade Practices Act (1974),
which was augmented under the National Competition Policy (NCP) reforms to facilitate
access arrangements to network infrastructure and the addition of competitive neutrality
provisions, which ensure there can be no discrimination between public and private service
providers. Asher (1998: 10) highlights the key change to the Trade Practices Act (1974) under
the National Competition Policy reforms as “establishing a third party access regime to cover
the services provided by significant infrastructure facilities” (facilities not economically
feasible to duplicate and where the access arrangements would be necessary to promote
effective competition in upstream or downstream markets). In addition to the administration
of this role in regard to market infrastructure, the ACCC is the organisation responsible for
the regulation of the transmission network component of the Australian Electricity Supply
Industry. Of the various facets this role encompasses, transmission pricing is the most

H. Higgs and A.C. Worthington 6
prominent. This is managed by the ACCC on a revenue cap basis, in an attempt “to constrain
monopoly pricing while allowing the business owners a rate of return sufficient to fund
network operation and expansion” (ACCC 2000: 8). In brief, the ACCC’s price cap
methodology is (IEA 2001: 137):
The revenue of transmission companies is regulated on the basis of an adjusted replacement value of the assets, known as deprival value, and its weighted cost of capital. The maximum annual revenue allowed to transmission is subject to a “CPI-X” price cap, fixed for a period of at least five years, that reduces transmission charges over time in real terms.
The transmission-pricing role is carried out in conjunction with a service reliability protocol,
to ensure quality of service. As noted, changes to the NEC effecting transmission or any other
aspect of the market must be authorised by the ACCC. As such the ACCC is responsible for
the evaluation of changes to market operations. It is the role of the National Electricity Market
Management Company (NEMMCO) to implement and administer changes to market
operation.
The National Electricity Market Management Company (NEMMCO) operates the
wholesale market for electricity trade between generators and retailers (and also large
consumers). From an operational perspective, output from generators is pooled then scheduled
to meet demand. The IEA (2001: 134) summarises the core elements as follows:
The National Electricity Market is a mandatory auction in which generators of 30 MW [megawatts] or more and wholesale market customers compete. Generators submit bids consisting of simple price-quantity pairs specifying the amount of energy they are prepared to supply at a certain price. Up to ten such pairs can be submitted per day. In principle, these bids are firm and can only be altered under certain conditions. Generator bids are used to construct a merit order of generation. Customer bids are used to construct a demand schedule. Dispatch minimises the cost of meeting the actual electricity demand, taking into account transmission constraints for each of the five regions in which the market is divided…There are no capacity payments or any other capacity mechanisms.
The two key aspects required for the pool to operate are a centrally coordinated dispatch
mechanism and operation of the ‘spot market’ process. As the market operator, NEMMCO
coordinates dispatch to “balance electricity supply and demand requirements” (NEMMCO,
2001: 3), which is required because of the instantaneous nature of electricity, and the spot
price is then “the clearing price [that] matches supply with demand” (NEMMCO 2001: 3).
The pool rules dictate that generators in the NEM with a capacity greater than 30MW are
required to submit bidding schedules (prices for supplying different levels of generation) to
NEMMCO on a day before basis. Separate capacity schedules are submitted for each of the

Evaluating the informational efficiency of Australian electricity spot markets 7
48 half-hour periods of the day. As a result, the industry supply curve (also called a bid stack)
may be segmented to a maximum extent of ten times the number of generators bidding into
the pool. NEMMCO determines prices every five minutes on a real time basis. This is
achieved by matching expected demand in the next five minutes against the bid stack for that
half-hour period. The price offered by the last generator to be dispatched (plant are dispatched
on a least-cost basis) to meet total demand sets the five-minute price. The price for the half-
hour trading period (or pool price) is the time-weighted average of the six five-minute periods
comprising the half-hour trading period. This is the price generators receive for the actual
electricity they dispatch into the pool, and is the price market customers pay to receive
generation in that half hour period.
<TABLE 1 HERE>
An illustration of spot market pricing in the NEM is drawn from NEMMCO (2001 12).
Table 1 contains offer prices for six generators (in megawatt hours) and demand information
(in megawatts) for the six five-minute dispatch periods in the 12:30 trading interval.
Assuming each of these generators has 100 MW (megawatts) of capacity, Figure 1
graphically analyses the least cost dispatch for these five-minute intervals. For example, at
12:05 total demand is 290 MW and to meet this demand the full capacity of the lowest priced
generators 1 ($32 MWh) and 2 ($33 MWh) and most of the capacity of generator 3 ($35
MWh) is required. The marginal price for this five-minute interval is then $35 MWh. This
information, along with the remaining five-minute intervals until 12:30, is tabulated in Table
2, which shows the marginal price for each five-minute interval as a result of the plant
dispatch mix, which is primarily dependant on the level of demand. The pool price for the
12:30 trading interval is the average of these six five-minute marginal prices.
<TABLE 2 HERE>
The spot pricing procedure, while bringing balance between supply and demand, can
expose participants to significant variation. This is owing to the dependence of the pool
process on generator bidding strategies [for instance, Brennan et al. (1998) highlight the
potential for holders of large generating portfolios to bid non-competitively in order to
exercise market power] and the impact of the complex interaction of supply and demand
factors on pricing. As such the spot price can be volatile, leading to large financial exposure.
The occurrence of various phenomenon in the NEM have seen instances of high spot prices,
and in some cases the maximum price cap for the NEM (Value of Lost Load) has been
triggered.
<FIGURE 1 HERE>

H. Higgs and A.C. Worthington 8
Events in the past, which have had a tendency to drive NEM prices toward the upper end
of the price spectrum, are of three types. First, prices can increase dramatically when a
generation plant ‘trips’ or ‘falls over’, rendering it inoperable and forcing the plant’s
contributed capacity to be removed from the bid stack. This is particularly the case if the plant
provides base load output. Secondly, abnormal environmental temperatures drive demand up
as customers increase demand for cooling or heating technology. Higher demand requires
more generation to balance the system, which means plants bidding in at a higher price level
on the least-cost merit order are sequentially dispatched to meet the additional demand. Third,
technical constraints or faults with the systems design can also lead to higher prices. These
three instances combined to cause an electricity supply crisis for Victoria in February 2000, as
profiled by the IEA (2001: 123):
The Victorian outages reflected a combination of unusual circumstances, including an industrial dispute, which had taken around 20 per cent of generating capacity off line, two unplanned generator outages, and an extremely high peak demand caused by a heat wave across southeastern Australia. The situation was exacerbated by Victorian government intervention to introduce a price cap and establish consumption restrictions, which prolonged the shortages and distorted market responses…The mandatory consumption restrictions introduced by the Victorian government over six days lowered demand in Victoria and had the perverse effect of electricity flowing from Victoria into New South Wales and South Australia while the restrictions were in place.
The illustration of NEMMCO’s dispatch and spot pricing methodology highlights the inherent
volatility of the spot price, which can lead to large variations in financial exposure. This is
owing to the dependence of the pool process on both generator bidding strategies and the
impact of the complex interaction of supply and demand factors on pricing.
Description and properties of the data
The data employed in the study are wholesale prices for electricity encompassing the period
from 1 July 1999 to 30 June 2001. All price data is obtained from the National Electricity
Market Company (NEMMCO 2002) originally on a half-hourly basis representing 48 trading
intervals in each 24-hour period. Following Lucia and Schwartz (2001) a series of daily
arithmetic means is drawn from the trading interval data. Although such treatment entails the
loss of at least some ‘news’ impounded in the more frequent trading interval data, daily
averages play an important role in electricity markets, particularly in the case of financial
contracts. For example, the NSW and Victorian base and peak load electricity futures
contracts traded on the Sydney Futures Exchange (SFE) from 1999 to 2002 were settled

Evaluating the informational efficiency of Australian electricity spot markets 9
against the arithmetic mean of half hourly spot prices in a given contract month. Moreover,
De Vany and Walls (1999a; 1999b) and Robinson (2000) both employ daily spot prices in
their respective analyses of the western United States and United Kingdom spot electricity
markets.
In order to highlight the different price formation processes in the peak and off-peak period
spot electricity markets, two separate daily average price series are constructed for each
regional market. The peak period series is formed from the half-hourly trading intervals
Monday to Friday from 7:00 to 21:00 hours resulting in 522 week day observations. The off-
peak period encompasses the remaining Monday to Friday half-hourly trading intervals along
with Saturday and Sunday. This results in a longer continuous series of 731 daily
observations. Categorisation of peak and off-peak (or base load) period prices in this manner
is identical to that employed in the NEM and as specified in the Sydney Futures Exchange
Corporation Limited/d-cypha Limited (a subsidiary of Transpower Limited – owner and
operator of the New Zealand national electricity grid) electricity strips for New South Wales,
Victoria, Queensland and South Australia.
<TABLE 3 HERE>
Table 3 presents the summary of descriptive statistics of the daily peak and off-peak period
spot prices for the four regional electricity markets. Samples means, medians, maximums,
minimums, standard deviations, skewness, kurtosis and the Jacque-Bera statistic and p-value
are reported. Figures 2 and 3 graph the logarithm of the daily peak and off-peak period prices
over the period selected (all prices in Australian dollars). Within the period examined, the
highest peak spot prices are in Queensland (QLD) and South Australia (SA) averaging $59.35
and $81.24 per megawatt-hour respectively. The lowest peak period prices are in New South
Wales (NSW) and Victoria (VIC) with average spot prices of $41.14 and $47.07 respectively.
The standard deviations of spot prices range from $49.18 (NSW) to $165.83 (SA). Of the four
markets, NSW and QLD are the least volatile with standard deviations of $49.18 and $75.55
respectively, whereas VIC and SA are the most volatile with standard deviations of $94.16
and $165.83. According to the coefficient of variation, which measures the standard deviation
relative to the mean, the peak period prices for VIC and SA are more variable than NSW and
QLD.
<FIGURE 2 HERE>
The distributional properties of the spot price series generally appear non-normal. All spot
electricity prices in the peak period are positively skewed, and with kurtosis exceeding three
can be represented by a leptokurtic distribution. The calculated Jaque-Bera statistic and

H. Higgs and A.C. Worthington 10
corresponding p-value in Table 3 are used to test the null hypothesis that the distribution for
the daily average peak spot electricity prices is normally distributed. All p-values are smaller
than the 0.01 level of significance indicating that peak period spot electricity prices cannot be
approximated by a normal distribution. The off-peak spot prices range from $26.79 (NSW) to
$40.20 (SA) per megawatt-hour. In general, the off-peak prices are relatively lower than the
peak prices for each electricity market, and are also less volatile with standard deviations
ranging from $17.64 (NSW) to $48.60 (VIC). And similarly to peak period prices, the
distributional properties for all regional markets are non-normal.
<FIGURE 3 HERE>
Empirical Methodology
Consider the following random walk with drift process: ttt εpp ++= − β1 (1)
or ttt εΔpr +== β (2)
where pt is the natural logarithm of the electricity spot price, β is an arbitrary drift parameter,
rt is the change in electricity prices and εt is a random disturbance term satisfying E(εt) = 0
and E(εtεt-g) = 0, g ≠ 0, for all t. The random walk hypothesis implies that the residuals are
both uncorrelated and possess a unit root; thereby providing two alternative testing
procedures. In the case of the latter, unit root tests focus on establishing whether a series is
difference stationary or trend stationary. However, it is well known that unit root tests have
very low power and often fail to detect some departures from random walks (Smith et al.
2002: 479). An alternative is the variance ratio test that focuses attention on the uncorrelated
residuals, is widely used for examining the behaviour of series that are not normally
distributed and is shown to have good size and power properties (Chow and Denning 1993).
Chow and Denning’s (1993) multiple variance ratio (MVR) procedure detailed below is based
on Lo and MacKinlay’s (1988) variance ratio test with the size of the test controlled for
multiple comparisons [for previous applications see Huang (1995), Smith (2002) and Smith et
al. (2002)].
As shown by Lo and Mackinlay (1988), the variance ratio statistic is derived from the
assumption of linear relations in observation interval regarding the variance of increments. If
a time series follows a random walk process, the variance of a qth-differenced variable is q
times as large as the first-differenced variable. For a time series partitioned into equally

Evaluating the informational efficiency of Australian electricity spot markets 11
spaced intervals and characterised by random walks, one qth of the variance of (pt - pt-q) is
expected to be the same as the variance of (pt – pt-1):
)()( 1−− −=− ttqtt ppqVarppVar (3)
where q is any positive integer. The variance ratio is then denoted by:
)1()(
)(
)(1
)( 2
2
1 σσ q
ppVar
ppVarqqVR
tt
qtt
=−
−=
−
−
(4)
such that under the null hypothesis VR(q) = 1. For a sample size of nq + 1 observations (p0, p1,
…, pnq), Lo and Mackinlay’s (1988) unbiased estimates of σ2(1) and σ2(q) are
computationally denoted by:
)1(
)ˆ()1(ˆ 1
21
2
−
−−=∑=
−
nq
ppnq
kkk μ
σ (5)
and
h
qppq
nq
qkqkk∑
=− −−
=
2
2
)ˆ()(ˆ
μσ (6)
)( ofmean sampleˆwhere 1−−= tt ppμ and:
)1)(1(nqqqnqqh −−+≡ (7)
Lo and Mackinlay (1988) produce two test statistics, Z(q) and Z*(q), under the null hypothesis
of homoskedastic increments random walk and heteoskedastic increments random walk
respectively. If the null hypothesis is true, the associated test statistic has an asymptotic
standard normal distribution. With a sample size of nq + 1 observations (p0, p1, …,pnq) and
under the null hypothesis of homoskedastic increments random walk, the standard normal test
statistic Z(q) is:
)(ˆ1)(ˆ
)(0 qqRVqZ
σ−
= (8)
where 2/1
0 )(3)1)(12(2)(ˆ ⎥⎦
⎤⎢⎣
⎡ −−=
nqqqqqσ (9)
The test statistic for a heteoskedastic increments random walk, Z*(q) is:

H. Higgs and A.C. Worthington 12
)(ˆ1)(ˆ
)(*
qqRVqZ
eσ−
= (10)
where 2/1
1
1
2
ˆ14)(ˆ⎥⎥⎦
⎤
⎢⎢⎣
⎡⎟⎟⎠
⎞⎜⎜⎝
⎛−= ∑
−
=
q
kke q
kq δσ (11)
and
2
1
21
)1(
21
21
)ˆ(
)ˆ()ˆ(ˆ
⎥⎦
⎤⎢⎣
⎡−−
−−−−=
∑
∑
=−
+=−−−−
nq
jjj
nq
kjkjkjjj
k
pp
pppp
μ
μμδ (12)
Lo and MacKinlay’s (1988) procedure is devised to test individual variance ratios for a
specific aggregation interval, q, but the random walk hypothesis requires that VR(q) = 1 for all
q. Chow and Denning’s (1993) multiple variance ratio (MVR) test generates a procedure for
the multiple comparison of the set of variance ratio estimates with unity. For a single variance
ratio test, under the null hypothesis, VR(q) = 1, hence Mr(q) = VR(q) – 1 = 0. Consider a set of
m variance ratio tests {Mr(qi)⏐i = 1,2,…,m}. Under the random walk null hypothesis, there
are multiple sub-hypotheses:
Hoi: Mr(qi) = 0 for i = 1,2,…,m H1i: Mr(qi) ≠ 0 for any i = 1,2,…,m (13)
The rejection of any one or more Hoi rejects the random walk null hypothesis. For a set of test
statistics, say Z(q), {Z(qi)⏐i = 1,2,…,m}, the random walk null hypothesis is rejected if any
one of the estimated variance ratio is significantly different from one. Hence only the
maximum absolute value in the set of test statistics is considered. The core of the Chow and
Denning’s (1993) MVR test is based on the result:
( ) αα −≥≤ 1)};;()(,...,)({max 1 TmSMMqZqZPR m (14)
where SMM(α;m;T) is the upper α point of the Standardized Maximum Modulus (SMM)
distribution with parameters m (number of variance ratios) and T (sample size) degrees of
freedom. Asymptotically when T approaches infinity:
2/*);;(limα
α ZmSMMT
=∞∞→
(15)

Evaluating the informational efficiency of Australian electricity spot markets 13
mZ /1*2/
)1(1 andon distributi normal standard where * ααα
−−== . Chow and Denning control
the size of the MVR test by comparing the calculated values of the standardized test statistics,
either Z(q) or Z*(q) with the SMM critical values. If the maximum absolute value of, say Z(q)
is greater than the SMM critical value than the random walk hypothesis is rejected.
Importantly, the rejection of the random walk under homoskedasticity could result from
either heteroskedasticity and/or autocorrelation in the electricity spot price series. If the
heteroskedastic random walk is rejected than there is evidence of autocorrelation in the spot
electricity price series. With the presence of autocorrelation in the price series, the first order
autocorrelation coefficient can be estimated using the result that )(ˆ qM r is asymptotically
equal to a weighted sum of autocorrelation coefficient estimates with weights declining
arithmetically:
∑−
=⎟⎟⎠
⎞⎜⎜⎝
⎛−=
1
1)(ˆ12)(ˆ
q
kr k
qkqM ρ (16)
2q where =
)1(ˆ1)2(ˆ)2(ˆ ρ=−≡ RVM r (17)
Empirical Results
Table 4 presents the results of the multiple variance ratio tests of the four state-based spot
electricity markets; namely, New South Wales (NSW), Victoria (VIC), Queensland (QLD)
and South Australia (SA). Different sampling periods are employed for the peak and off-peak
period price series that take into the differing structures of the underlying data, i.e. Monday to
Friday for the peak period (5-day cycle) and Sunday to Saturday for the off-peak period (7-
day cycle). The sampling intervals for the peak period are 2, 5, 10 and 15 days, while the
sampling intervals for the off-peak period are 2, 7, 14 and 21 days.
<TABLE 4 HERE>
For each interval Table 4 presents the estimates of the variance ratio VR(q) and the test
statistics for the null hypotheses of homoskedastic, Z(q) and heteroskedastic, Z*(q)
increments random walk. Under the multiple variance ratio procedure, only the maximum
absolute values of the test statistics are examined. For a sample size of 522 and 731 for the
peak and off-peak periods respectively and m = 4, the critical value is 2.49 at the 0.05 level of
significance. For each set of multiple variance ratio tests, an asterisk denotes the maximum
H. Higgs and A.C. Worthington 14
absolute value of the test statistic that exceeds this critical value and thereby indicates whether
the null hypothesis of a random walk is rejected.
Consider the results for NSW in the peak period. The null hypothesis that the natural
logarithm of the spot electricity price series follows a homoskedastic random walk is rejected
at Z(5) = 6.0767. Rejection of the null hypothesis of a random walk under homoskedasticity
for a 5-day period is also a test of the null hypothesis of a homskedastic random walk under
the alternative sampling periods and we may therefore conclude that NSW peak period spot
electricity prices do not follow a random walk. However, rejection of the null hypothesis
under homoskedasticity could result from heteroskedasticity and/or autocorrelation in the
price series. After allowing for generalized heteroskedasticity, the null hypothesis is also
rejected at Z*(5) = 3.3552. The heteroskedastic random walk hypothesis is thus rejected
because of autocorrelation in the daily increments of the natural logarithm of NSW spot
electricity prices. We may conclude that the NSW peak-period electricity spot market is not
informationally efficient.
Further, Lo and Mackinlay (1988) show that for q=2, estimates of the variance ratio minus
one and the first-order autocorrelation coefficient estimator of daily price changes are
asymptotically equal. On this basis, the estimated first order autocorrelation coefficient is -
0.1324 corresponding to the estimated variance ratio )2(R̂V of 0.8676 (i.e. 0.8676 - 1.0000).
This indicates there is negative autocorrelation in NSW peak-period electricity spot prices.
Just one implication is that a relatively simple stochastic model incorporating an
autoregressive process could model the short-term fluctuations in NSW peak period electricity
prices. Alternatively, had the heteroskedastic random walk hypothesis not been rejected then
models that take account of varying heteroskedasticity, such as the autoregressive conditional
heteroskedasticity (ARCH) family of techniques, would be required.
Similar results are obtained for VIC, QLD and SA in peak period electricity prices. These
markets all reject both homoskedastic and heteroskedastic increments random walk
hypotheses because of negative autocorrelation in the series. The estimated first order-
autocorrelation coefficients range from -0.3839 for QLD to -0.5146 for SA. This would
suggest that a simple first-order autoregressive model used to forecast prices in electricity
markets could potentially be more accurate for South Australia, followed by Victoria,
Queensland and New South Wales.
In the off-peak period, the NSW, QLD and SA markets also reject both homoskedastic and
heteroskedastic increments random walk hypotheses because of negative autocorrelation in

Evaluating the informational efficiency of Australian electricity spot markets 15
the series. The estimated first order autocorrelation coefficients in this instance are -0.1473 for
NSW, -0.2637 in Queensland and -0.3123 for South Australia. Once again first-order
autoregressive modelling techniques may yield useful forecasts of electricity prices, and
would be relatively more accurate for South Australia than the remaining states. As a rule, the
autocorrelation coefficients in the off-peak period are lower than in the peak period. More
interestingly, however, the Victorian off-peak period price series rejects the homoskedastic
increments random walk hypothesis but fails to reject the heteroskedastic increments random
walk hypothesis. This could be the result of heteroskedasticity and/or autocorrelation in the
VIC electricity spot price series. The suggestion is that the Victorian off-peak period
electricity prices follow a random walk and are therefore informationally efficient.
The finding that electricity prices in most of the National Electricity Market’s (NEM)
regional markets do not follow a random walk is not difficult to rationalise. That is, it would
normally be only in large, institutionally mature, liquid markets that there would be a
sufficiently active price formation process for the market to follow a random walk. By way of
contrast, the Australian electricity markets have a very small number of participants that are
generally able to exert market power and trading rules that may serve to structure price
formation. For example, the recent ABARE (2002) paper concerning competition in the
Australian electricity market found that “in the six months examined in 1999, prices were
considered to have deviated substantially from competitive outcomes for at least two-thirds of
the period in all states…”. However, the result that Victorian off-peak period electricity prices
do in fact follow a random walk is more difficult to justify. Certainly, the Victorian market
was the first to commence competitive trading in 1994 and it benefits from relatively more
transmission interconnectors than the other regions. Combined together, this would suggest
that in the off-peak period when transmission constraints are less pronounced that market
power is constrained and the price formation process more closely approximates a random
walk.
Concluding Remarks
This paper examines the informational efficiency of four Australian electricity spot markets
during the period 1999 to 2001. All of these spot markets are member jurisdictions of the
recently established National Electricity Market (NEM). Multiple variance test statistics with
both homoskedastic and heteroskedastic variances are used to test for random walks in both
peak and off-peak period prices. The results indicate that despite the presence of a national
market for electricity, only the Victorian off-peak period market is informationally efficient.

H. Higgs and A.C. Worthington 16
This would suggest, amongst other things, that Australian spot electricity prices could be
usefully forecasted using autoregressive-modelling techniques, especially in South Australia
and Queensland. The evidence also provides complementary evidence to the results of studies
concerned with the economic efficiency of these liberalised markets that generators with
market power may be sustaining non-competitive outcomes.
This analysis could be extended in a number of ways. One useful extension would be to
examine each of the electricity markets individually and in more detail. For example,
wholesale electricity spot markets in Victoria and New South Wales have existed since 1994
and 1996 respectively and an examination of the price formation process in these states would
be particularly useful. Another extension would be to consider market power in an alternative
form where generators with market power may have an incentive to create volatility in the
spot market and not just increase prices by withholding capacity or offering higher prices.
References
Asher, A. 1998 Fair competition in the electricity and gas markets. pp 10–17. In National Power Sourcebook 1999. Sydney: AIC Worldwide Pty Ltd
Australian Bureau of Agricultural and Resource Economics (ABARE). 2002 Competition in the Australian National Electricity Market. ABARE Current Issues 1655, January
Australian Competition and Consumer Commission (ACCC). 2000 Infrastructure Industries: Energy. Canberra: Commonwealth of Australia
Brennan D and Melanie J. 1998 Market power in the Australian power market. Energy Economics 20(2): 121–133
Chow KV and Denning K. 1993 A simple multiple variance ratio test. Journal of Econometrics 58(3): 385-401
Crow RT. 2002 What works and what does not in restructuring electricity markets. Business Economics July: 41–56
De Vany AS and Walls WD. 1999 Cointegration analysis of spot electricity prices: insights on transmission efficiency in the western US. Energy Economics 21(3): 435–448
Huang BN. 1995 Do Asian stock markets follow random walks? Evidence from the variance ratio test. Applied Financial Economics 5(4): 251-256
International Energy Agency (IEA). 2001 Energy Policies of IEA Countries: Australia 2001 Review. Paris: Organisation for Economic Cooperation and Development
Joskow PL and Kahn E. 2001 A quantitative analysis of pricing behaviour in California’s wholesale electricity market during summer 2000.

Evaluating the informational efficiency of Australian electricity spot markets 17
National Bureau of Energy Research, Working Paper 8157
Lo A and MacKinlay AC. 1988 Stock market prices do not follow random walks: Evidence from a simple specification test. Review of Financial Studies 1(1): 41-66
Lucia JJ and Schwartz ES. 2001 Electricity Prices and Power Derivatives: Evidence for the Nordic Power Exchange. University of California Los Angeles Working Paper, Los Angeles
National Electricity Market Management Company Limited (NEMMCO). 2001 An Introduction to Australia’s National Electricity Market. Melbourne: NEMMCO
National Electricity Market Management Company Limited (NEMMCO). 2002 The National Electricity Market [Available online at <http://www.nemmco.com.au/>, last accessed on 31 October 2002
Robinson T. 2000 Electricity pool series: a case study in non-linear time series modeling. Applied Economics 32(5): 527–532
Robinson T and Baniak A. 2002 The volatility of prices in the English and Welsh electricity pool. Applied Economics 34(5): 1487-1495
Smith G. 2002 Tests of random walk hypothesis for London gold prices. Applied Economics Letters 9(5): 671-674
Smith G, Jeffries K and Ryoo HJ. 2002 African stock markets: multiple variance ratio tests of random walk. Applied Financial Economics 12(4): 475-484
Wolfram CD. 1999 Measuring duopoly power in the British electricity spot market. American Economic Review 89(4): 805-826
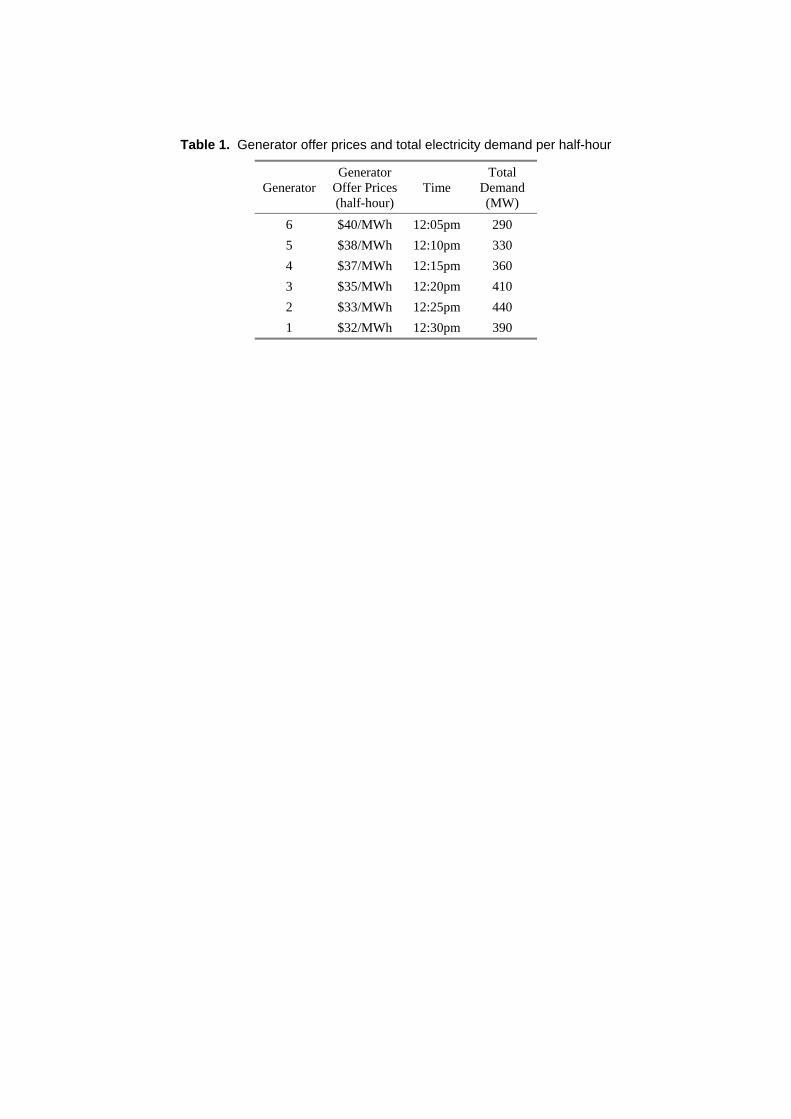
Table 1. Generator offer prices and total electricity demand per half-hour
Generator Generator
Offer Prices (half-hour)
Time Total
Demand (MW)
6 $40/MWh 12:05pm 290 5 $38/MWh 12:10pm 330 4 $37/MWh 12:15pm 360 3 $35/MWh 12:20pm 410 2 $33/MWh 12:25pm 440 1 $32/MWh 12:30pm 390

Table 2. Dispatch of generation and spot price calculation
Graph point price
Dispatch $/MWh
Time demand
Total (MW) Scenario
Point A 35 12:05pm 290 Generators 1 & 2 are fully utilised. Generator 3 is partially utilised.
Point B 37 12:10pm 330 Generators 1,2 & 3 are fully utilised. Generator 4 is partially utilised.
Point C 37 12:15pm 360 Generators 1,2 & 3 are fully utilised. Generator 4 is partially utilised.
Point D 38 12:20pm 410 Generators 1,2, 3 & 4 are fully utilised. Generator 5 is partially utilised.
Point E 38 12:25pm 440 Generators 1,2, 3 & 4 are fully utilised. Generator 5 is partially utilised.
Point F 37 12:30pm 390 Generators 1,2 & 3 are fully utilised. Generator 4 is partially utilised.
The spot price is calculated as: ($35/MWh + $37/MWh + $37/MWh + $38/MWh + $38/MWh+ $37/MWh) / 6 = $37/MWh

Figure 1. Least cost dispatch and generator utilisation
Spot Price Calc 12:30 period
0
100
200
300
400
500
12:05 PM 12:10 PM 12:15 PM 12:20 PM 12:25 PM 12:30 PM
5 min periods in half hour
Tota
l Dem
and
(MW
)
Generator 1
Generator 2
Generator 3
Generator 4
A
BC
D
E
F

Figure 2. Graph of logarithm of off-peak spot prices in Australian regional markets, 1999 - 2001
2
3
4
5
6
7/01/99 1/17/00 8/04/00 2/20/01
NSW
1
2
3
4
5
6
7
8
7/01/99 1/17/00 8/04/00 2/20/01
VIC
2
3
4
5
6
7
8
7/01/99 1/17/00 8/04/00 2/20/01
QLD
2
3
4
5
6
7
7/01/99 1/17/00 8/04/00 2/20/01
SA

Figure 3. Graph of logarithm of peak spot prices in Australian regional markets, 1999 - 2001
2
3
4
5
6
7
7/01/99 4/06/00 1/11/01
NSW
0
2
4
6
8
7/01/99 4/06/00 1/11/01
VIC
2
3
4
5
6
7
8
7/01/99 4/06/00 1/11/01
QLD
2
3
4
5
6
7
8
7/01/99 4/06/00 1/11/01
SA

Table 3. Descriptive statistics of peak and off-peak spot prices in Australian regional markets, 1999 - 2001
Peak period prices Off-peak period prices Statistics NSW VIC QLD SA NSW VIC QLD SA Mean 41.1351 47.0696 59.3459 81.2360 26.7935 27.6042 28.1153 40.1999Median 30.7717 30.5916 40.5845 49.2485 23.3558 21.0521 22.4447 31.6163Maximum 585.3686 1658.6050 1078.3920 1880.7390 292.4489 1133.9540 1175.5260 862.1242Minimum 13.3610 4.2003 16.1152 11.3086 9.6137 6.1663 13.1747 11.8490Std. Dev. 49.1807 94.1586 75.5536 165.8283 17.6442 48.6029 46.7401 44.8984Skewness 7.4035 11.8212 7.3861 7.4107 7.9648 18.4743 20.8426 11.3711Kurtosis 70.0879 178.7824 80.3146 63.4598 104.6152 394.0806 500.9244 177.0935CV 1.1956 2.0004 1.2731 2.0413 0.6585 1.7607 1.6624 1.1169J-B 102660 684220 134757 84282 322231 4700002 7604420 938900J-B p-value 0.0000 0.0000 0.0000 0.0000 0.0000 0.0000 0.0000 0.0000Observations 522 522 522 522 731 731 731 731
Notes: Prices are in Australian dollars per megawatt-hour; peak period encompasses Mondays to Fridays 7:00 to 21:00, off-peak period encompasses Monday to Fridays before 7:00 and after 21:00 plus Saturday and Sunday, J-B–Jarque-Bera test statistic; NSW–New South Wales, VIC–Victoria, QLD–Queensland, SA–South Australia; CV–Coefficient of variation.

Table 4. Multiple variance ratio tests for peak and off-peak spot prices in Australian regional markets, 1999-2001
Region Statistics Peak period prices Off-peak period prices q = 2 q = 5 q =10 q = 15 q = 2 q = 7 q =14 q = 21
NSW VR(q) 0.8676 0.4167 0.2566 0.1840 0.8527 0.3064 0.1816 0.1554 Z(q) 3.0214 *6.0767 5.0258 4.3844 3.9810 *6.8753 5.4087 4.4726 Z*(q) 1.4648 *3.3552 3.0128 2.7547 1.4335 *2.9546 2.8913 2.7127VIC VR(q) 0.5022 0.2854 0.1569 0.1179 0.9295 0.3217 0.1814 0.1468 Z(q) *11.3628 7.4452 5.6994 4.7398 1.9050 *6.7239 5.4100 4.5179 Z*(q) *4.5334 3.5833 3.1862 2.8979 1.0475 2.2205 2.1888 2.0752QLD VR(q) 0.6161 0.2997 0.1280 0.1054 0.7363 0.2577 0.1619 0.1200 Z(q) *8.7636 7.2958 5.8948 4.8069 7.1250 *7.3588 5.5387 4.6602 Z*(q) *5.4688 5.2875 4.7609 4.0938 2.3125 *3.0355 2.7272 2.5687SA VR(q) 0.4854 0.2461 0.1162 0.0802 0.6877 0.2302 0.1077 0.0808 Z(q) *11.7455 7.8545 5.9748 4.9424 *8.4371 7.6313 5.8972 4.8677 Z*(q) *5.4337 4.3054 3.7847 3.4311 3.6715 *3.8902 3.6411 3.3301
Notes: Peak period encompasses Mondays to Fridays 7:00 to 21:00, off-peak period encompasses Monday to Fridays before 7:00 and after 21:00 plus Saturday and Sunday; NSW–New South Wales, VIC–Victoria, QLD–Queensland, SA–South Australia; VR(q) – variance ratio estimate, Z(q) - test statistic for null hypothesis of homoskedastic increments random walk, Z* (q) - test statistic for null hypothesis of heteroskedastic increments random walk; the critical value for Z(q) and Z*(q) at the 5 percent level of significance is 2.49, asterisk indicates significance at this level; Sampling intervals (q) are in days.