evaluating the integration and use of automated housing
TRANSCRIPT

Evaluating the Integration and Use of Automated Housing SupplyMonitoring Systems for Municipal Housing Policy and Administration
BY
CHENG-HUNG UN
B.S. Architecture and City DesignChinese Culture University, Taipei, Taiwan
Submitted to the Department of Urban Studies and Planning in partialfulfillment of Master of Urban Planning
at the
MASSACHUSETTS INSTITUTE OF TECHNOLOGY
June, 1991c Cheng-Hung Lin 1991
The author hereby grants to M.I.T. permission to reproduce and todistribute copies of this thesis document in whole or in part.
Signature of Author.Department of Urban Studies & Planning
May, 1991
Certified by -
Lyna WigginsAssistant Professor
Thesis Supervisor
Accepted byPhilip L. Clay
Director of the Master's Program
wsAiUSETTS NSTfTUTEOF TECHN,00GY
n 05 1991LIBRAHIES

Evaluating the Integration and Use of Automated Housing SupplyMonitoring Systems for Municipal Housing Policy and Administration
BYCHENG-HUNG UN
Submitted to the Department of Urban Studies and Planning in partialfulfillment of Master of Urban Planning
ABSTRACT
This thesis conducts a study of the use of a new computerapplication of Geographical Information System (GIS). Its majorpurpose is to study the potential of the GIS for organizing housinginformation to support municipal housing policy and administration. Acase study was completed for Cambridge, Massachusetts, after threeareas of literature were reviewed about information technology andmunicipal land and housing policy. Finally, a system design of theproposed Housing Supply Monitoring System (HSMS) was completed.
Using GIS to organize municipal data has great potential to providehousing information that municipalities could collect only once everyfew years. The proposed HSMS could only afford to integrate data ofdemographics, buildings, land, and the housing market to provide policy-makers with information on quantity and quality of land inventory, thehousing stock, and the associated economic and social changes. Becausethe HSMS can show this information in tabular and map form, officialscan more easily monitor the sub-systems and sub-areas of housing formaking sound policy.
Under the constraints of high costs of digital parcel maps andcomputer networks, an inexpensive approach for establishing a HSMS isalso recommended. A municipality wishing to apply a HSMS shouldconsider establishing comprehensive goals for long-term departmentalcoordination. Complying with these goals, each department can thenselect their individualized tools. Meanwhile, a central database shouldbe developed and maintained to ensure data compatibility.
Thesis Supervisor: Dr. Lyna L. WigginsTile: Assistant Professor of Urban Planning
2
Table of Contents
Abstract 2
Table of Contents 3
List of Tables and Figures 4
Acknowledgements 5
Chapter One: Introduction 6
Chapter Two: Research Method 8ObjectivesMethod
Chapter Three: Literature Review 11Residential Capacity PlanningLand Information SystemsCambridge Housing Policy and Administration
Chapter four: Analysis of User Departments 27Tasks and current Information NeedsAccessibility of Required Information
Chapter five: Proposed Housing Supply Monitoring Systems 41System RequirementOrganization Information
Chapter six: Policy Recommendations 73Housing Policy and AdministrationSystem ConstructionRemaining Problems
Bibliography
Appendix
3

List of Tables
Table IV-1: Interviews Conducted
Table IV-2 Information Needs of Cambridge Housing-related Departments
Table IV-3: Available Databases in the CDD's DataManagement Component
Table IV-4: The Availability of Required HousingInformation by Cambridge Department
Table V-1: Summary of Information Requirements of theProposed Housing Supply Monitoring Systems
Table V-2: Data Requirements of the Proposed HousingSupply Monitoring Systems
Table V-3: Collected Data and Data Sources of Cambridge
28
33
35
38
43
46
55
List of Figures:
Figure IV-1:Cambridge Housing Information Flow 40
Figure V-1:Three approaches for Identifying Vacant Land Parcels 63
4

Acknowledgements
After enjoying two challenging years at MIT, I am more certain thatdoing research is my real interests. Otherwise, the frustration causedby language problems and overwhelmingly difficult work load shouldhave made me change my mind. Conquering these difficulties gives meconfidence to go beyond master degree to seek further study onplanning information technology.
First, I want to extend my heartily thanks to my thesis adviser,Miss. Lyna Wiggins. She has been helping me refine my thesisapproaches and correct my writing sentence by sentence. I hope that Idid not discourage her to supervise Taiwanese students again. Secondly,I would like to express my appreciation to my two thesis readers. Mr.Phil Herr and Mr. Jerome Rothenberg. Without their direction andcomments, I could be still unrealistically planning to solve all thehousing problems of my country simply by a housing informationsystem. They made me understand that the issues of land use andhousing policy are far more complex than a rational tool can possiblyhandle. Mr. Joseph Ferreira has inspired me many concepts of planninginformation systems. His commends have been very valuable in ourthesis preparation class.
Cambridge officials such as Gene Gebolys, Cara Seiderman, andRandall Wilson, have leaded me to right persons in Cambridge. Thekindness of them and other officials I interviewed have given me awonderful time in doing interviews. As a foreigner student, theunderstanding of the functions and information needs of Cambridgedepartments is especially valuable. In the future, if working for mygovernment, these experience should help me generate new ideas. Ishould thank Miss. Miyata in Cambridge Rent-control for down-loadingdata for me. I should also thank Mr. Goetze for the data of CambridgeHousing Needs Study and his knowledgeable explanation of Map/Info.
I should especially thank my wife for solely taking care of ournewborn baby at the last stage of my thesis, and her understanding ofmy academic goals. These two years have brought us new lives andfuture for our family.
5

Chapter One
I. Introduction
Municipalities have information needs regarding the inventory of
housing, but most can afford a complete investigation only once every
few years. These investigations often provide a "snap shot" of housing
at one point in time, and quickly get out of date.
From the economic perspective, because housing prices are
determined by supply and demand, maintaining a sufficient supply of
houses to offset demand may stabilize housing prices. Therefore, it is
valuable for a municipality, from municipal data, to have current
information on housing supply. The housing supply consists of housing
stock, new construction, and remaining housing capacity of vacant and
under-utilized land. Also, information about housing maintenance is
important for managing housing stock.
Because a large quantity of electronic data and new information
technology is becoming increasingly available, monitoring levels of
housing supply is more feasible than ever. For providing housing supply
information, the Geographic Information System (GIS) is a promising
new computer tool. It may help us track various attributes and
locations of housing and, on maps, graphically show spatial patterns of
these attributes. For instance, a map generated by using GIS show the
distribution of building age across the city. A GIS can aggregate
household data up to geographic boundaries like census tracts. It can
also sort out households by specifying a certain distance to a specific
location, say, half mile to a proposed shopping center. My thesis
explores how GIS might be used in organizing such housing supply
information.
6
M !"". " wk, - - 11 - il-

In this research, using a case study municipality's data, I propose a
GIS-based housing supply monitoring system (HSMS) to organize
housing supply information. The case study municipality is Cambridge,
Mass. My research steps include literature review, interviews with
Cambridge officials, analyses of user departments, design of a GIS-
based system, and suggestions about how the information might help a
municipality's housing policy and housing administration.
I conclude that the proposed HSMS needs six major features to serve
a municipality. These six features are: 1) locating vacant land; 2)
identifying under-utilized land; 3) studying the development
feasibility; 4) revealing building maintenance of housing stock; 5)
counting and analysis of housing stock; 6) tracking new construction
and demolition.
7

Chapter Two
ie. Research Method
A. Objectives
My first objective is to examine the use and limitations of housing
supply information for municipal housing policy making and housing
administration.
The second objective is to test a prototype of the municipality's
housing supply monitoring system. I will examine the use of GIS for
organizing a few departments' databases to provide information on
housing supply. I expect to find problems in data sharing, data
integration, and software or hardware constraints.
The last objective is, with the experience of constructing the
prototype, to make recommendations that might serve as a guide for
other municipalities.
B. Method
There are four major parts to my research. First, literature review
and a case study helps define how housing supply information could be
useful for municipal housing policy and administration. Then, I study
the process of organizing the required information and examine how the
current municipal data could be used in a GIS for a more completed
system design. Finally, I evaluate the use and limitations of the
proposed HSMS based on the functions of Cambridge agencies.
1. Literature Review
My literature review concentrates on the following fields:
residential capacity planning, Cambridge's housing management, and
land information systems. In the literature on residential capacity
planning, I looked for ways of determining locations and density for
8

residential use. For background information on my case study, I
examined Cambridge's past and present in housing policy and
administration. In land information systems, I looked for techniques
used for defining housing supply.
2. Case Studv
To understand the limitations and application of housing supply
information, the case study method has an advantage in exploring
problems and new possibilities. For my case study, I chose Cambridge,
because it is a built-up municipality and has problems of both housing
development and redevelopment typical of an older metropolitan area. I
interviewed Cambridge officials in housing related departments.
The first step was to find out which departments needed housing
supply information. To be familiar with these departments generally, I
investigated their function,policies, programs, and commitments. Also,
I investigated what kinds of data these departments had been using.
I also looked into the details of how these departments used their
own data, what information the data helps create, what decision-
making the data helped, and the data's practicality. Then, I asked for
interviewees' information needs, despite whether the supporting data
was currently available. After the interviews, I summarized the data
and information requirements for each department.
Then I looked at issues of data collection, data accuracy, data form
(if it is in digital form),data compatibility, and so on. Regarding the
flows of required information and data, I also examined current
procedures for interchanging data, etc.
3. Designina a Housing Supply Monitorina System
Through the results of the interviews, I determined the required
9

information, needed data, and the process of organizing the information
and exchanging data. From the information and data requirements, I
then further explored the use of GIS to process and present the required
information. This work defining a prototype of HSMS heavily
concentrates on computer applications, such as GIS and database
management.
Under the time constraints of this research, and because
Cambridge's digital base map will not be available soon, I substituted
another existing land-use information system for the partial prototype.
I chose the East Boston Land Information System (CLUIS) data to study
the technical process of the information system construction. Data
available in CLUIS are not necessarily available in Cambridge, and vice
versa. Therefore, I used only data that a municipality typically has and
occasionally suggested possible other uses if other data had been
available. However, using CLUIS gave me another chance to study the
data availability issue in a different institutional setting.
4. Evaluating the Use and Limitation of the Prototype
Finally, I discussed how Cambridge might use the monitoring-system-
generated information in practice. I looked into what kinds of tasks the
municipality cannot do otherwise, and at whether the results were only
particular to Cambridge, or if they could be applied to other
municipalities that were at a different stage of urbanization.
10

Chapter Three
Ill. Literature Review
A. Residential Capacity Planning
The housing supply information on land and housing concerning
current conditions and potential for change is useful to help decide how
to improve and maintain the use of land and housing. The traditional
discipline that determines the use and future changes of land is land
use planning. I believed the knowledge accumulated in this field could
help me master the logic and procedures of deciding on locations and
density of residential uses, which are important for applying the
proposed HSMS.
1. Decidina on Locations and Densities for Residential Uses
The most important consideration in land use planning is to reduce
conflicts among different land uses (Dysart & Claw 1989:4). This is
emphasized, because some land uses are not compatible with one or
another concerns such as safety, health, environmental protection, and
efficiency. A good land-use plan reduces so-called "negative
externalities", provides a healthy and safe environment, and is an
efficient way of using natural resources.
The best location for residential use generates the highest utility of
land use. After environment-sensitive areas have been excluded, a good
residential area must be within "suitable" distances to public services,
play grounds, parks, and other public amenities (Lynch, 1981: 368-369).
This criterion will lead to an even distribution of accessibility to
amenities and services.
The decision on how dense an area should be depends upon the
carrying capacity of the area. Because people have different needs, the
11

carrying capacity of an area differs from place to place. A carrying
capacity for residential use depends on many limitations coming from
natural resources, public services, people's preferences, limitations of
public finances, and other political and economic considerations.
To keep up with regional growth, a good residential arrangement
should prepare for future needs. If a jurisdiction is under-developed
and needs further development, it should ensure enough housing to
support future economic growth. On the other hand, a self-sustaining
jurisdiction facing similar growth pressure is more likely to restrict
growth. At any rate, a land-use plan must take future needs into
account.
There is a classical way of thinking about the process of making a
land use plan that is exemplified by Chapin & Kaiser in their book Land
Use Planning (Chapin & Kaiser, 1979). Although the wider literature did
not necessarily reflect the practice of land use planning, this book did
show the current fundamental thinking about land use planning. The
ideas of this book about the logic of deciding a land-use plan may be
summarized as follows:
Drafting a land-use plan is a series of trial-and-errors, ranging
from environmental investigations to public presentations. A planner
first surveys current land-use activities and remaining land-use
capacity, and then estimates future needs from the trend of growth. A
good land-use pattern is one that balances future needs and the
remaining capacity of land.
From the estimated population referenced with conventional
standards, planners calculate preliminary land-use needs. The objective
is to arrange all kinds of land-use needs to comply with carrying
12

capacities, suitable distances, and externalities, and the other
principles discussed previously. Among different land uses, commercial
and industrial uses consume less land and are more important for the
economy. Therefore, planners estimate their future needs and locate
them first, based on economic and population growth. The remaining
land is for residential use and public use. Planners then assign
transportation facilities, which occupy the biggest share of public land
use, based on the estimated needs of other land uses. Finally, having
this preliminary plan, a more accurate measurement of capacity and
needs help refine the plan for the next round (Chapin & Kaiser, 1979:
361-386).
2. Process of Municipal Land Use Planning
There are three main forms of municipal land-use regulations.
Zoning regulations are the most significant, and control the use and
development density of land in a designated district. Subdivision
regulations control how a raw land may be divided into parcels.
Building codes specify the standards of construction.
To implement these regulations, municipalities have powers of
taxation, police power, and land acquisition (Dysart & Claw, 1989:5).
With these powers, a municipality can do many things. They can charge
property taxes for public services and public investment, eliminate
undesired land-use activities, enforce a beneficial land-use plan, and
acquire land for building roads and other public utilities. Furthermore,
a municipality also can control the direction of growth through
infrastructure and public service provisions.
The process of municipal land use decision-making often starts with
a developer's proposal. Frequently, developers first request variances,
13

and then the municipal rezoning commission responds. The results of
variances differ widely, depending upon the situations and relative
power of each party (Rudel, 1989:3). The common situation is that land-
use authorities respond to the majority of urgent problems with little
information, few theories, and very short studies (Rudel, 1989:3, Lynch,
1981:41).
In creating a land use plan, different interest groups often debate
possible solutions. Since it is difficult to measure how good a land use
pattern is, land-use decisions are always a political process. One
significance of land use planning, despite any rationales, is to serve
current residents for public interests (Rudel, 1989: 11; Reilly,
1973:225). For example, residents can exclude other uses that might
jeopardize their property value for aesthetic, economic, or political
reasons (Dysart & Claw, 1989:3).
Building permits are issued if the proposal complies with
regulations and there is no substantial objection from a public hearing.
Public hearings are mandated to give an opportunity for surrounding
residents to address their concerns. Citizen participation is essential
in the municipal development review. Current residents can exercise
their rights to oppose development for concerns about environmental
preservation or other considerations.
3. Role of Rational Tools in Municipal Land Use Planning
When there are conflicts in deciding a land-use proposal, the process
of decision-making becomes a political one. The aims of this political
process are to achieve a consensus rather than a rational solution. The
final decision is made practically rather than scientifically.
Facing these conflicts, planners often play different roles in solving
14

controversies. Planners can ask elected representatives to make
decisions, suggest solutions based on the best of their knowledge, or
set up a process where different interest groups can work out an
acceptable solution (Susskind edited by Neufville 1981:183-186).
However, these land-use decisions are clearly dependent upon resident
choices.
To settle land use conflicts, decision-supporting tools are not fully
trusted. One reason is that these tools are not commonly understood by
the average person. Another reason is that results of analyses are
widely different, depending upon the scenarios that are examined
(Jacob, 1989).
Measuring the benefits of a land-use proposal can help make a good
choice, but unfortunately it is hard to measure. Some land-use-
assigning models employ the notion. of lowest costs (Raymond T. Laird
etc., 1979), but this method cannot quantify some aesthetic, moral, or
emotional effects. Applying utility concepts become more complicated
when deciding land-use densities simultaneously.
Scientific analyses such as market analysis, impact assessment, and
public finance analysis are helpful in land-use decisions. These rational
analyses can help create alternatives, make choices, and settle
conflicts in negotiations. The usefulness of the rational approaches,
like the ones mentioned above, comes from their ability of showing
impacts of actions, simulating the dynamics of land use, and creating
other what-if scenarios. However, technical tools can help make land
use decisions but cannot replace an inevitable political process
(Susskind edited by Neufville 1981:183-186). Therefore, these
technical support for discovering an optimal solution is a tool in the
15

political process of land use planning.
A. Land Information Systems
In this section, I first look into the functions and significance of
Land Information Systems (LIS), which are an information systems
designed for systematically collecting, updating, processing, and
distributing land-related information. Because understanding the
characteristics of LIS help me define the proposed HSMS, I investigated
criteria for establishing a successful land information system.
1. Functions and Significance of Land Information Systems
A Land Information System (LIS) is a newly developed technology
parallel to the GIS in providing geographic information. As early as
1980, a National Academy of Sciences Report advocated the needs of a
new profession developed to this area:
There is considerable concern that the qualified personnelrequired to perform the functions inherent in a comprehensive landinformation system will not be available at all levels of governmentand the private sector..... Means must be found to develop thequalified personnel and to encourage university research anddevelopment activities and programs.
In a article written by Harvey M. Jacobs, "Implementing Local
Multipurpose Land Information Systems: Political-Economic Research
Issues," he summarized the function and use of a LIS as the following:
(Jacobs, 1989) The multiple land information system is one of
several phrases used to describe an interrelated set of computerized
data on land. A composite defihition from a recent Work Bank
publication is:
A relatively new development that incorporates into onesource the legal and fiscal cadastral data (a cadastre is an officialregister of the location, boundaries, ownership, value and other
16
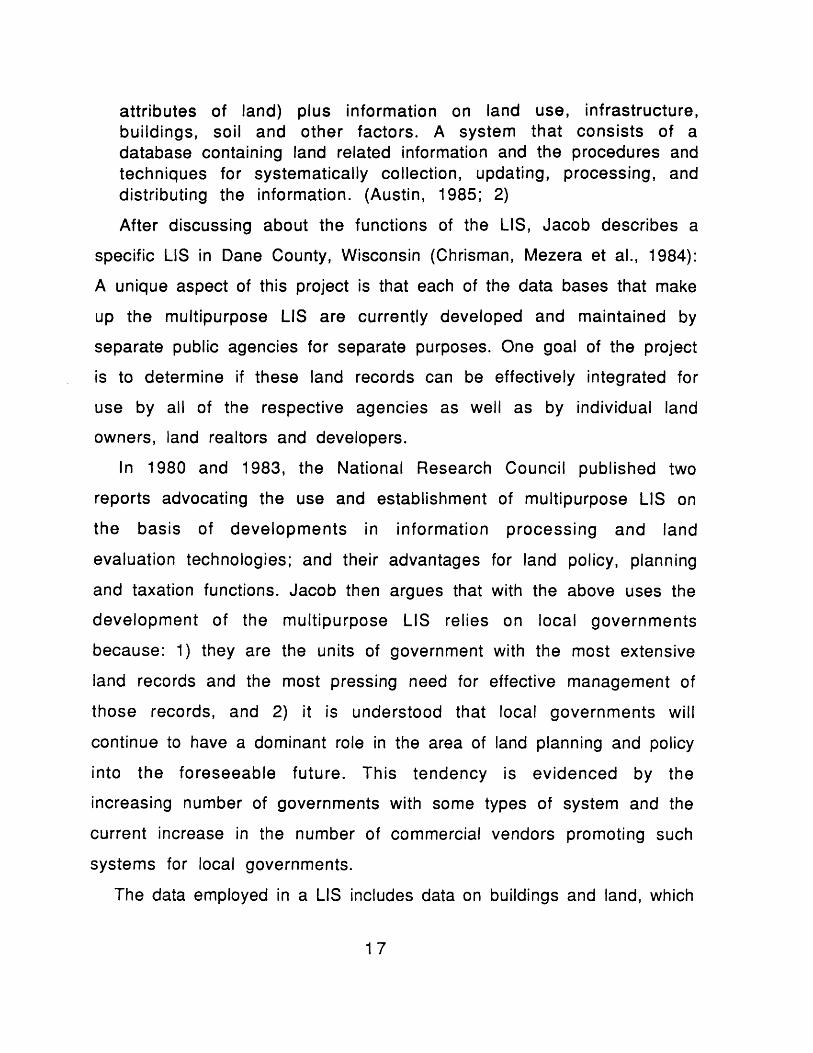
attributes of land) plus information on land use, infrastructure,buildings, soil and other factors. A system that consists of adatabase containing land related information and the procedures andtechniques for systematically collection, updating, processing, anddistributing the information. (Austin, 1985; 2)
After discussing about the functions of the LIS, Jacob describes a
specific LIS in Dane County, Wisconsin (Chrisman, Mezera et al., 1984):
A unique aspect of this project is that each of the data bases that make
up the multipurpose LIS are currently developed and maintained by
separate public agencies for separate purposes. One goal of the project
is to determine if these land records can be effectively integrated for
use by all of the respective agencies as well as by individual land
owners, land realtors and developers.
In 1980 and 1983, the National Research Council published two
reports advocating the use and establishment of multipurpose LIS on
the basis of developments in information processing and land
evaluation technologies; and their advantages for land policy, planning
and taxation functions. Jacob then argues that with the above uses the
development of the multipurpose LIS relies on local governments
because: 1) they are the units of government with the most extensive
land records and the most pressing need for effective management of
those records, and 2) it is understood that local governments will
continue to have a dominant role in the area of land planning and policy
into the foreseeable future. This tendency is evidenced by the
increasing number of governments with some types of system and the
current increase in the number of commercial vendors promoting such
systems for local governments.
The data employed in a LIS includes data on buildings and land, which
17

the proposed HSMS also needs in order to formulate information on
housing supply; thus, the HSMS could be designed to provide only a part
of a larger planned functions of the LIS. The proposed HSMS
concentrates more on housing-related activities, whereas the LIS
targets broader applications. The design and study of the HSMS thus
may represent a detailed application of LIS for housing-related
activities. The use and limitations of the LIS and the criteria of
establishing a successful LIS can therefore direct the establishment of
aHSMS.
2. Criteria for Establishing a successful GIS/LIS
Many public and private institutions rely on maps and geographic
information for daily tasks and long-term planning efforts.
Applications of the Geographic Information System/Land Information
System (GIS/LIS) technology for this purpose are still mostly in early
stages of development. Although these GIS applications have been
around for more than ten years, there are not many fully operational,
successful cases, as yet. Obstacles largely come from factors other
than the technology itself. From the experiences of these early
applications, criteria for a successful GIS/LIS can be formulated for
directing future GIS implementation.
In 1989, Croswell published a paper reviewing 39 GIS
implementations, and related information system literature from
various sources, in order to examine experiences in system
development efforts (Croswell, 1989). This paper gives background
information for identifying the criteria for a successful GIS system,
which are defined by the following research questions: 1) Why do
systems fail or fall short of expectations? 2) What are the ingredients
18

of success? 3) What approaches should be taken to increase chances of
success and the realization of the benefits that GIS technology should
provide?
The author then synthesizes the major obstacles of information
system implementations from these 39 articles (most of these articles
discuss their individual experiences in establishing an information
system) as the following: for major problems, two thirds of these 39
articles recognized organizational coordination and conflicts; followed
by data and software standards/data integration; the third was
planning and management support; the forth is training/understanding
of technology; and, the rest expressed concern about other technical
problems.
These major problems of GIS implementation reveal that, to
implement a new technology, institutional problems are considered
more difficult than the technology itself. The authors of these 39
articles especially address the importance of coordination with the
data processing department and the commitment from management. The
data processing department increasingly plays a role as a system
manager of a GIS project, although complaints about their lack of
understanding of GIS have been very common. With the same degree of
importance, the system requires the management to lead and promote
commonly agreed upon goals and coordination mandates among related
departments.
Obstacles related to data and software standards occur both in data
collection and data transfer among different types of software in
terms of compatibility and accuracy. The institutional consensus about
the applications of information technology should be first considered
19
to incorporate user needs together with the limitations and advantages
of particular hardware and software. Comprehensive decisions made at
the beginning would save much effort in the future.
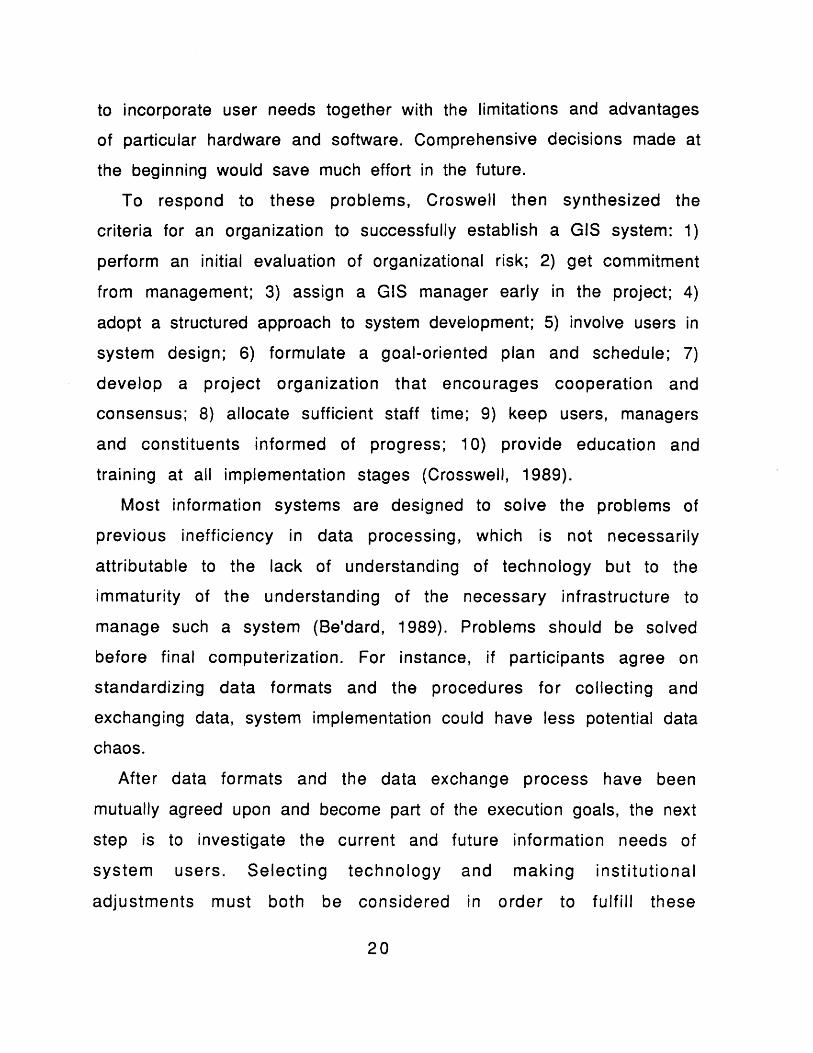
To respond to these problems, Croswell then synthesized the
criteria for an organization to successfully establish a GIS system: 1)
perform an initial evaluation of organizational risk; 2) get commitment
from management; 3) assign a GIS manager early in the project; 4)
adopt a structured approach to system development; 5) involve users in
system design; 6) formulate a goal-oriented plan and schedule; 7)
develop a project organization that encourages cooperation and
consensus; 8) allocate sufficient staff time; 9) keep users, managers
and constituents informed of progress; 10) provide education and
training at all implementation stages (Crosswell, 1989).
Most information systems are designed to solve the problems of
previous inefficiency in data processing, which is not necessarily
attributable to the lack of understanding of technology but to the
immaturity of the understanding of the necessary infrastructure to
manage such a system (Be'dard, 1989). Problems should be solved
before final computerization. For instance, if participants agree on
standardizing data formats and the procedures for collecting and
exchanging data, system implementation could have less potential data
chaos.
After data formats and the data exchange process have been
mutually agreed upon and become part of the execution goals, the next
step is to investigate the current and future information needs of
system users. Selecting technology and making institutional
adjustments must both be considered in order to fulfill these
20
synthesized information requirements. The process should start from
setting long-term goals of data processing for the whole organization
and short-term objectives for growing the system step by step
(Madziya, 1989). The system can then be designed for particular user
needs without creating obstacles to other users.
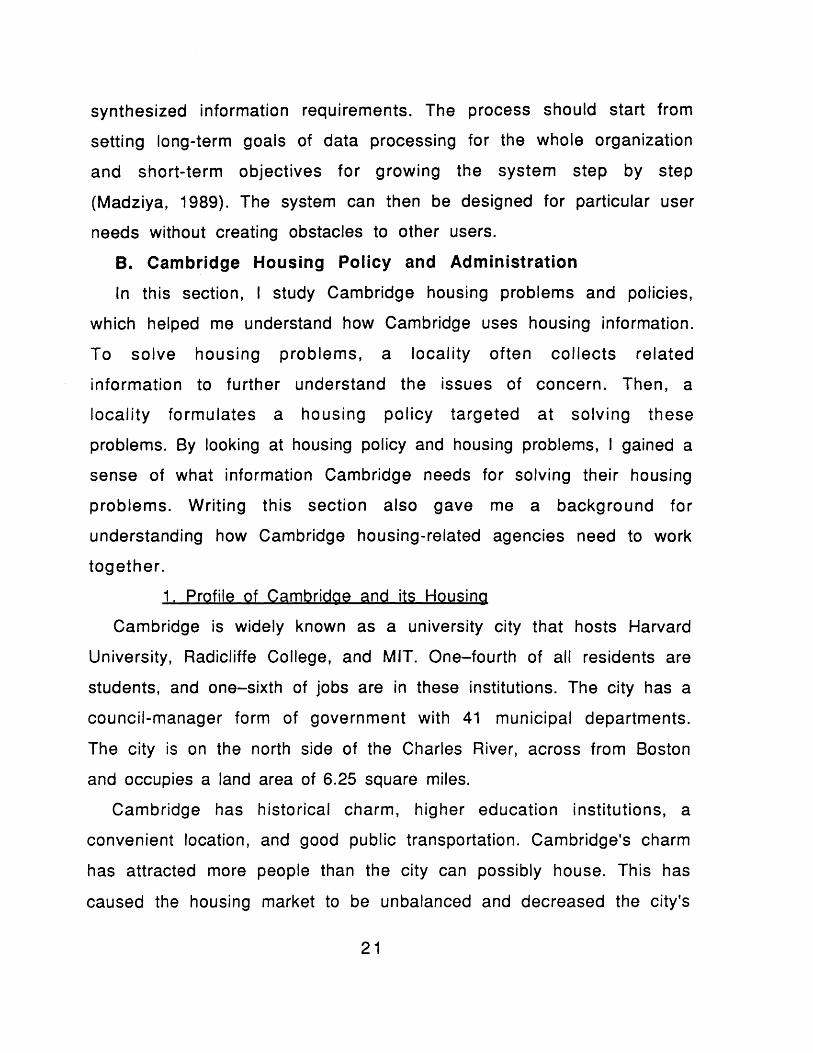
B. Cambridge Housing Policy and Administration
In this section, I study Cambridge housing problems and policies,
which helped me understand how Cambridge uses housing information.
To solve housing problems, a locality often collects related
information to further understand the issues of concern. Then, a
locality formulates a housing policy targeted at solving these
problems. By looking at housing policy and housing problems, I gained a
sense of what information Cambridge needs for solving their housing
problems. Writing this section also gave me a background for
understanding how Cambridge housing-related agencies need to work
together.
1. Profile of Cambridge and its Housina
Cambridge is widely known as a university city that hosts Harvard
University, Radicliffe College, and MIT. One-fourth of all residents are
students, and one-sixth of jobs are in these institutions. The city has a
council-manager form of government with 41 municipal departments.
The city is on the north side of the Charles River, across from Boston
and occupies a land area of 6.25 square miles.
Cambridge has historical charm, higher education institutions, a
convenient location, and good public transportation. Cambridge's charm
has attracted more people than the city can possibly house. This has
caused the housing market to be unbalanced and decreased the city's
21

housing affordability. Only five US cities with a population of 75,000
or more are denser than Cambridge (Cambridge Annual Financial Report,
1988). The city's estimated population was 90,290 in 1988, down from
a 1950 peak of 120,740.
The economy of Cambridge has been shifting from manufacturing to
services. Three out of four jobs were in the delivery of services or
trade in 1988 (Cambridge Monograph, 1988).
The city has over 42,000 housing units in about 16,000 buildings.
Seventy-seven percent of all households are rentals; 23% are privately
owned. As to building type, nearly ten percent of all homes are single
family; 37% contain 2-4 dwelling units; 11% have 5-8 units. The
remaining 29% are in apartments of nine or more units. As to policy
statuses, 40 % are under rent control, 12% are subsidized, 24 % are
owner-occupied, and 24% are private rental units not under rent control
(Goetze, 1990).
2.Cambridae Housing Problems
The severe housing shortage that Cambridge is confronting can be
portrayed by high rents and housing prices. To own a median-priced
home, one has to have an annual income higher than $90,000. Only 18%
of all Cambridge households can afford this median price; unless they
want to pay more than 30% of their income for housing (Goetze, 1990).
Cambridge housing prices increased substantially in the 80s. The
median housing-price increased 102% from 1981 to 1986 in constant
dollars (North Cambridge Neighborhood Study, 1988). On the other hand,
people are paying high rents (38% percent of all tenants pay more than
30% of their income for rent).
The housing shortage is so severe that, even with government
22
assistance, housing supply barely meets housing needs. In the 80s, only
253 units out of nearly 2,000 new units were affordable housing
(Report to City Council, 1990). In addition, only one out of three
qualified applicants for assisted housing (low income, elderly, single
parents, and other needy people) can acquire a space (Goetze, 1990).
Rent-control keeps many houses affordable, but the stock is
shrinking. The rents of rent-controlled units are usually 40% lower
than current market rates (Goetze: vi, 1990), but the rent-controlled
housing stock is deteriorating because of insufficient capital
improvement. Rent-controlled rents are not attractive enough to
encourage renovation, while at the same time Cambridge housing stock
is aging. In Cambridge, nearly two out of three houses are more than
fifty years old. This ratio seems significantly higher than the average
of the Boston SMSA, which is 50%.1
Although facing a serious shortage of affordable housing, Cambridge,
as a built-out city, has little land for new construction. The
prospective sites for affordable housing exist in old industrial areas.
Cambridge no longer needs these over-zoned industrial sites because of
the changing economy. Now, three out of four jobs are in the service
industry (Economic Highlights, Internal Report by CDD, 1990).
Unfortunately, land owners and residents oppose current re-zoning
efforts.
Without using the industrial land, more housing means higher
densities in existing residential areas. Obviously, allowing higher
1 This information is from a Cambridge Monograph, which is aninternal report by the Community Development Department. The reportis based on census data for 1980.
23

densities to encourage conversion of old houses is hardly desirable and
will also invite residents' opposition. In addition, historical
preservation also limits housing development. Cambridge has many
historical buildings which are part of the city's remarkable history. To
preserve the character of Cambridge, the city regulates old housing
conversion and thus somehow constrains housing supply.
The problem of affordable housing in Cambridge is due mainly to
limited resources. Cambridge has very little land available for
affordable housing development. In addition, the current funding is
limited due to cutbacks in the state and federal assistance. Local
efforts to make housing affordable by rent-control are jeopardized by
the deteriorating rent-controlled stock. Another initiative -
inclusionary zoning has an uncertain future. Meanwhile, the Affordable
Housing Trust has not accumulated enough funding yet. In the present
political and economic climate, an implementation of a city-wide
policy of producing massive affordable housing remains doubtful.
3. Cambridae Housing policy
In a built-out area like Cambridge, promotion of the goal of housing
affordability depends on maintaining the housing stock rather than
developing new housing. The Cambridge housing policy aims at
improving the housing stock and simultaneously maintaining
affordability. This has been the direction of the Cambridge housing
policy after state and federal assistance faded in the 80s (Rosenberg,
1990).
A very significant component of the Cambridge housing policy is rent-
control. This policy regulates 40 percent of all housing stock, excluding
one-to-three-families housing. The policy restricts the increase of
24

rents; thus rent-controlled units are more affordable. The rent
differences between rent-control and non-rent-control units are very
substantive in Cambridge. 2 The Cambridge Housing Authority (CHA)
owns 7% of all existing housing stock and gives financial support to
another 2.5% of households through rent certificates and vouchers
(Goetze: 12, 1990). Facing cutbacks from federal and state funding, CHA
could not generate more public housing in the 80s. Now, the major work
of CHA is managing its existing stock.
The Community Development Department (CDD) has several housing
programs designed to increase housing affordability and habitability.
These programs include in-fill construction, rehabilitation of
deteriorating multi-family structures, and other home improvement
programs. They either provide financial support to help owners improve
their houses or help tenants to attain home ownership. Their work
includes issuing low-interest-rate loans and organizing limited equity
cooperatives along with coordination with non-profit housing
developers.
Cambridge has also employed housing linkage fees for affordable
housing. This policy requires commercial developers to contribute
money to an affordable housing trust. Unfortunately, this policy was
employed after major commercial development had already been
completed.
A land bank is another affordable housing effort in Cambridge. This
2 Typical Rents Controlled Rents Total Units1 Bedroom or less $650 $400 86902 Bedroom $950 $570 57403 Bedroom $1,150 $690 1970
25

effort sets aside surplus public-owned land for affordable housing
development. Because Cambridge is a built-out city, there are currently
only eight parcels available for development (Haly, 1991, interview).
For re-zoning outdated industrial sites for residential use,
Cambridge is considering the use of inclusionary zoning in East
Cambridge, North Cambridge, and other areas. The intention is to give
density bonuses for exchanging affordable housing units. Unfortunately,
land owners were not interested in these rezoning efforts, because
their land has been zoned for high FAR. This high FAR leads to high-rise
development and increases construction costs. These high construction
costs render density bonuses less attractive to developers and less
cost-effective to the city.
Recently, the federal government required each municipality to come
up with its own affordable housing plan as a prerequisite of receiving
federal assistance. Cambridge is also seeking to reevaluate its housing
policy. As councilor Edward Cyr said in his evaluation report, it is
necessary to address the needs of reforming the affordable housing
efforts and there is need for accurate and comprehensive housing
information. Housing inventory information is needed at this particular
moment to find out how well the current housing stock is serving
housing needs (Gyr, 1991).
From this discussion of Cambridge housing problems and housing
policy, I conclude that housing information in Cambridge focuses on
current housing stock but not much on available land or new
construction. Therefore, an HSMS should also incorporate maintenance
of existing housing stock for use by each housing-related department.
26

Chapter Four
IV. Analysis of User Departments in Cambridge, MA
In this chapter, I discuss the functions and information needs of
different departments and how these different agencies attain and
share housing information. Finally, I explain the housing information
flow in Cambridge. I believe studying the real situation in Cambridge
has helped me define a design for a HSMS more practically.
Presumably, the major users of HSMS are housing related
departments. Their needs of housing information define an HSMS. In
addition, the use, sources, accuracy, and forms of housing data are also
important. Therefore, helped by two Cambridge Planners, I selected the
housing related departments and their knowledgeable officials to
interview (Listed in Table IV-1).
A. Tasks and Current Information Needs
The Community Development Department (CDD) is the core of
Cambridge planning. The department includes several sub-departments
related to housing; such as Housing, Neighborhood Planning, Economic
Development, and Data Management. Other departments also create and
use housing data. Their functions and their needs for housing
information are discussed in the following paragraphs.
1. The housing component in the CDD is in charge of developing and
preserving affordable housing. There are many ongoing housing
programs designed to expand affordable housing ownership and to
rehabilitate existing buildings. This branch gives small grants, low-
interest loans, and technical support to help convert or rehabilitate
housing (most of them are rent-controlled units).
27

Table IV-1: Interviews Conducted
DEPARTMENT INTERVIEWEE DEPARTMENT INTERVIEWEE
1. HousingDepartment(CDD)
2. NeighborhoodPlanning (CDD)
3. EconmDevelopment(CDD
4. Data
SusanShelbsingerCarole Marks
Cara SeidermanMoustafa Moorad
Gene Gebolys
7. HistoricalPreservation
8. HomeOwnershipRehab
9. Rent Control
Nancy Doonan
Peter Daily
Yuka MiyataBuddy Packer
Velerie RomanRandall Wilson
11. Public Works RobertPatterson
5. Cambridge Terry Hurie
Authority 12. Inspectional Ranjitservices
6. AsessingaSinganayagam
Peter Helwia
Source: Defined by the Author
To accomplish these complex jobs, they need information on the
offerings for sale of land and buildings to search for development
opportunities. In addition, they need the waiting list of public housing
for selecting prospective customers, and sale prices for deciding the
costs of a project (Marks 1991, interview).
Presently, to apply for federal financial assistance, this department
is organizing information on the condition of affordable housing. This
28

information is crucial for formulating an affordable housing plan. The
federal government needs to know about the needs for affordable
housing, how well the affordable housing stock is maintained, how
many affordable housing units Cambridge can develop in the future, and
how much assistance Cambridge needs. This is a typical requirement
for applying for funding.
2. The Neighborhood Planning Component (NPC) in the CDD works with
neighborhood stabilization committees in East and North Cambridge and
other neighborhoods. NPC is a mediator between the City and
neighborhood people who are concerned about the quality of their
neighborhood.
NPC recently conducted several neighborhood studies that looked
into information on demographics; existing zoning and land use; and
housing trends, including the number of sales, prices, and affordability
analyses. This information helps the City and neighborhood people to
identify problems and collaborate on solutions (Seiderman, 1991,Interview).
3. The Economic Development Component (EDC) is in charge of
promoting the commercial and industrial activities for sustaining the
vitality of the City. For these tasks, they need all kinds of data.
Because EDC is also the major planning staff to the city council, the
zoning board, and the planning board, their information needs may vary
from case to case. Housing information is only one of the required types
of information (Gebolys, 1991, Interview).
4. The Data Management Component (DMC) is the core branch that
provides data and information to the whole Community Development
Department and the public. They collect data and information for
29

supporting .many planning activities, such as: quantifying linkage fees,
housing studies, rezoning research, neighborhood population studies,
employment surveys, housing sales analyses, traffic mitigation
surveys, commercial build-out analyses, development proposal
tracking, pre-census accounts, and so on (Wilson, 1991, Interview).
5. The Cambridge Housing Authority (CHA) is an independent agency
that is outside of the Cambridge government. They have a separate
committee that consists of one member appointed by the state and four
other members appointed by the city council. Their tasks include
managing the current public housing stock, developing vacant land or
converting existing buildings into public housing, providing rent
certificates, etc. Therefore, they need information on the current
public housing stock, current residents and prospective residents, and
possible projects on vacant lots or properties for sale (Hurie, 1991,
Interview).
6. The Assessing Department determines taxes on properties and
mobile vehicles as well as issues exemptions. The department carries
out assessment models every three years and decides adjustment
ratios for years in between. For higher accuracy, the department needs
information on sales, rents, and the characteristics of each building
(Helwia, 1991, Interview).
7. The Historical Preservation Commission (HPC) preserves
historical buildings, studies the history of each building, publishes
research reports, manages historical districts, issues grants for
preserving the original externals of buildings, etc. Their current tasks
are doing research of the history of specific areas. HPC has done a
historical survey on each building. From this information, HPC is
30

working on publishing district histories on areas such as Old
Cambridge, East Cambridge, North Cambridge, and the like. To
accomplish this task, HPC needs historic information on a study area,
including the physical environment, and other social, demographic, and
economic changes (Doonan, 1991, Interview).
8. The function of the Rent Control Board has been discussed earlier.
To determine the maximum rents for each controlled building, the board
needs detailed information on rents, capital improvement, and the
maintenance of each building. In addition, financial information for
deciding capital costs is also needed (Miyata, 1991, Interview).
9. The Home Ownership Rehab is one of the nonprofit housing
developers who help the Cambridge Community Development (CDD)
develop and rehabilitate affordable housing. Through limited-equity
partnerships, community cooperatives, and other financial assistance,
the Rehab helps current tenants to achieve home ownership. The Rehab
also helps restore homes through low-interest loans issued by CDD. For
development, they need the same information as the sub-department of
housing development in CDD (Daly, 1991, Interview).
The Data Processing Department (DPD) is a centralized data processing
department that is in charge of selection, purchase, implementation
and management of the city's computer hardware and software. They
provide technical support on data processing. This centralized type of
data processing is designed to improve data compatibility and computer
applications among departments. Their data are mainly received from
different departments and then distributed through a network to all
other departments (Roman, 1991, Interview).
11. The Public Works Department (PWD) is in charge of maintaining
31

public-owned facilities such as roads, sewers, cemeteries, buildings,
parks, etc. For these tasks, the department needs detailed drawings for
engineering that require great accuracy both in data and the location of
facilities (Patterson, 1991, Interview).
12. The Inspectional Services department is in charge of inspection
and enforcement of all laws and city ordinances that relate to the state
electrical, plumbing, and building codes. The department issues building
permits based on these regulations. The department requires
information directly from applicants and their own inspectors. To judge
if a complaint is a violation, the department also needs the original
permits for reference (Singanayagam, 1991, Interview).
I summarized this previous discussion in Table IV-2, which shows
the needs of housing information for each department and, for each
item of housing information, which department needs it the most. Not
surprisingly, different departments have different information needs.
On the other hand, many of those departments involved in direct housing
development have similar information needs.
B. Accessibility of Required Information
From the previous discussion, one can see clearly what housing
related information each department needs. To satisfy its own
information needs, each department either collects the required data on
its own or uses data from other departments. In this section, I firstly
discuss where each department receives its required information and
then discuss how information flows among different departments.
1. Sources of Required Information
Using data from other departments requires adjustment and the
coordination of other departments. Sharing data is very labor intensive
32

TABLE IV-2: Information needs of Cambridge Housing-related Departments
NEEDS OF THE INFOBIMA TION CM £DD CM C 11A Q PJSEU.T 1(ISE._'l REMARK DAA___ON HOUSING AND LAND 11'.( NEBH'DE_'_ DATL COMM' ONT' REHAB PROC'G _QR ___
Sizes and Dimensions V V V VV VV W VVW VW VVW VV Vy WLocations and Surrounding Envi V WV VWV W V V WV V V VVV ___ y CCASIONALLYDevelopment studies of Vacant I WW fV VWV V V _ VN _ -EDEDCondition of the Housing Stock WV VVy ___ V V V V V vv _ _y ___-_
New Housing Construction _ VV V __ V VV V VVV VVV VVV
WW:Zoning VV VV VvyVVy VV VVV VV V yyV VVV VVV VVV OFTENCurrent Land Use V V VV VV VV V yV VVV VVV -EEDEDOwnership(P/Public, Ren'Contr'< V VW VV VV V VVY VVV VV VyV Vy -Census WVVW_____ _ V V V VV VV V _y_.
Household Demographic VV VVV V VVV V V VV V VVV V V ABSOLUTELYREQUIRED
Selling Properties VVV VV V VV _ yyy -
Sales Records VY V V V VV VVV VV VyV VyyRents VV V V VV VVV_ VVV VV VPublic Housing Waiting list VVV V VVV _ __ V V-- ~ VVVPublic & Assisted Housing Con( V V V ___ VVV Vy
Interior Conditions V VV VW W VV V VV V-External Conditions VW VV VVV VV VV V WVHistories of Buildings V -__ WCapital Improvement V V V VV VVV V VVV VVBuilding Violations V - ~~ VVV
Engineering Maps V V_ V VVV VLand Parcel Boundary V V VV VV VV VVy V V VVV y y- -VVV VVStreet Network Maps VV VV VV V VV V VV V yyy VV -- -~_
Source: collected by author from interviews Cambridge, 1991
but collecting data is even worse. When many departments need
automation of data storing and data processing, the requirement of data
compatibility is even more essential. Thus, Cambridge established the
Data Processing Department to ease the problems of compatibility.
For instance, the Data Management Component in CDD is in charge of
serving the information needs of other components within CDD. Yet each
component's information needs are not yet completely fulfilled. Often,
data is not available for organizing the required information. Shown in
Table IV-3, many data bases are no longer in use, because updating the
data requires too much work, which the data management component
can hardly afford. In this typical case, the CDD staff often make
decisions based on inadequate information.
The Housing component in the CDD, Cambridge Housing Authority, and
non-profit housing developers are directly involved in housing
development; thus they need information for development decisions,
which mostly comes from outside the city government. For instance,
prospective cases come mainly from brokers, financial information
from banks, and sales data from Bankers and Tradesman.
34

Table IV-3 Available Databases in the Cambridge CDD's DataManagement Component in Cambridge
DATA BASEResidentialSales
HousingConstruc-tion
HousingImproveme-nt Program
Land UseInventory
DESCRIPTIONPublished sources,Bankers and Tradesman,and Assessor's records
Organized from Assessor'sRecords and CHA at an adhoc base.
List of households whoreceived HousingRenovation Programs
REMARKSAutomatedsince 1981,Outdated.
Automatedsince 1980
Computerized records for Has not beeneach parcel in the city, it updated foruse, dimensions, and other ten yearscharacteristics
Census Data 1980 census
Tax Maps
CondoBuildingsData Base
CambridgeStreetListing
Parcel boundary andground plan, height,structural information(Outdated)
Computerized records foreach Condo and itscharacteristics
The originalare kept inPublic Works
SOURCEPrivateInfoSources
Assessor'sRecord &CHA
The CDID'sHousingComponent
AssessorRentControlInspection
US Census
Assessor
Assessor
Surveyed annually Covers only Electioincluding resident names, about 75% of Commiaddresses and, in some the sioncases, occupation and date populationof birth.
Source: Cambridge CDD data management component
ns-
35

Assessors collect very detailed information on buildings to estimate
building values, including the condition of each building. Assessors
survey the external and interior conditions of buildings, which is
computerized into an index to describe a building's maintenance. But,
the rest of the information on building maintenance is in paper form. In
addition, the information on when a building was built, which is from
the Historical Commission, is included in the assessor's records.
The Rent Control Board (RCB) has information on capital
improvement, heating fuel consumption, and tenant complaints. The RCB
sends out affidavits to tenants of rent-controlled units to determine if
their units have problems. If tenants report any problems, the RCB will
notify the owners to fix them. Capital improvement is claimed by
owners when they request rent adjustments. This type of information
can represent how well a building is maintained. Unfortunately,
affidavits are maintained in paper form only, but the RCB is considering
computerizing this information.
The Inspectional Services Department (ISD) receives complaints
from residents. These complaints might be violations or other
annoyances that are also valuable for determining levels of building
maintenance. In addition, the ISD also has data on zoning and original
permits that can contribute to building information. The ISD is
automating these complaints and permits.
The Registry of Deeds has sales information, which is useful for
studying the feasibility of a development project. When the Assessing
Department renews their assessment every year, the department
collects this sale data from the Registry of Deeds; This sales data is
also available from many private sources.
36

The Public Works Department is the source of original parcel base
maps which are essential to implement GIS at the parcel level. This
department is also in charge of assigning addresses that are very
important to spatial referencing. Whenever ownership or a parcel
boundary changes, the department receives the information from the
Registry of Deeds. The process for completing a change takes about six
months (Patterson, 1991, Interview).
Summarized in Table IV-4, one can see the patterns of information
availability. The information that some departments absolutely require
is most likely to be available, while occasionally needed information is
less likely to be available. Between these two extremes, information a
department often needs but is not really available will be collected
once every few years when funding is available. It is common that
decision makers often face some degree of inadequate information for
making decisions.
Besides a fair amount of information that is already available in
electronic form, there is still some information available only on
paper. Many kinds of information are manually maintained. Some of
them are important only to one department, and very few departments
need then for referencing. Histories of buildings and permit records
are two of these cases. Some of these case are very difficult to
automate.
From the previous analyses, I have discovered that the Assessing
Department is the major source of housing information. The assessor's
records include information on land and buildings in a very detailed
fashion. For instance, building information includes: the dimensions of
houses, structure types, building styles, foundation types, construction
37

TABLE IV-4: The Availability of Required Housing Information by Cambridge Departments
NEEDS OF THE INFORMATION c CDD CD-D £A B'iISTIRENT _QME DATA EUBLIC INSON HOUSING AND LAND HOUS 'GNEB _'D ECN'_CDATA __ _QMM ' B ERAB REQC'.LQQ OSERVSizes and Dimensions s asas © a s0©a g0Locations and Surrounding Envi 8 aas a s as ag9 3_a ©DOLLECTEDODevelopment studies of Vacant IK X X _ ~ ITSOWNConditions of the Housing Stock a © 0_a
New Housing Constructionas s __a ©SUPPORTED
Zoning a sasas _asso _ so gB e as 0 WELLCurrent Land Use ©as (0 a -Ownership(P/Public, Ren'Contr © g goB © e © sa_-_Census s 0a -- eSUPPORTED.Household Demographic as asa_ __ _a _sPARTIALLY
Selling Properties _a_ _
Sales Records g as©sogaa- a B e-- NEEDED BUTRents _ s o _a _ soa aBe-NOT AVAILABLPublic Housing Waiting list 0_ __a sPublic & Assisted Housing Con gB gBe as
Interior Conditions Inventory K g -External Conditions Inventory K _
Histories of Buildings gg
Capital Improvement as asasas a sBuilding Violations 83 _ _ _ _
Engineering Maps _a _
Land Parcel Boundary _as s © Be _Be_ ©gogaBe -_aStreet Network Maps __g_ ___ __ __ __ _a __g _
Italic font means computerized already
Source: collected by author from interviews, Cambridge, 1991
CA)

materials, roof types and materials, utility statuses, insulation,
number of rooms, construction materials, year built, and maintenance
level (Helwia, 1991, Interview).
2. Information Flow
In Cambridge, the flow of housing information (See Figure IV-1)
starts from the departments that collect the required data as
discussed above: For example, the Inspectional Services Department
collects information on new permits, the Historical Preservation
Commission investigates when buildings were built, the Registry of
Deeds provides ownership changes, and the Public Works Department
maintains accurate information on parcel boundaries.
The first stage of processing much of the housing information is
done by the Assessing Department. This department also collects
detailed information on buildings, as discussed in the last section, and
distributes the information to the Rent Control Board with building
values. Meanwhile, the Rent Control Board also collects information on
rents and exchanges it with the Assessing Department.
The core of this information flow is the Data Processing Department
which stores and distributes information to other departments through
a centralized network. The Water Department also contributes a current
list of residents, and Cambridge Housing Authority contributes its own
information on its current public housing stock.
The CDD's Data Management Component collects all these sources of
information and then combines them with the census data to support
the information needs of other planning components. The demographic
survey done by the Election Commission is also incorporated. Through
the Community Planning Department, this information is repackaged
39

and distributed to residents outside of the Cambridge governmental
system.
This summary of the required housing information reveals some
unfilled information needs. For instance, the Affordable Housing
Department and non-profit affordable housing developers are not
receiving the required information, detailed and case-oriented
information, for their development purposes. This information is not
something that these agencies can collect without the help from other
departments. In addition, because thorough information is hard to find,
using limited information cleverly requires much thinking and
experimentation. These unfilled information needs suggest the
direction for my proposed HSMS.
Figure IV-1:
CEIMMiOQ| blM9 UMI O~li~ M To=@
*FousingInspectional-. -. --.-.-- .- -uthoritServices : A. e igIAssessing
Historical ~~-~ ~ epartm -D.....Commission * * *. I ... ...
Probesiny- -- Data-. Managerent
Registrer .-of Deed
C6ritrofPubic Works Water Census
ElectionCommision
Source: Collected from author's interviews, city of Cambridge, 1991
40

Chapter Five
V. The Proposed Housing Supply Monitoring System
In the last chapter I studied the information needs of various
Cambridge agencies, the availability of the required data, and the
transactions of that data. In this chapter I outline a prototype design
for the proposed Housing Supply Monitoring System (HSMS) by defining
its information requirements, data requirements, ways of sharing data,
and procedures for processing information.
Because I have studied only Cambridge, generalizing my findings to
other typical municipalities has inevitable limitations. I therefore
outline the proposed HSMS to serve the functions of Cambridge agencies
first, and then make some adjustments to generalize the HSMS's
application for a typical urban municipality. The assumption is that,
although the housing data in Cambridge is not necessary universal, the
functions of the housing-related Cambridge agencies could represent
the functions of a typical urban municipality. With this consideration in
mind, I have designed the fundamental components of the HSMS, which
are described in the following sections.
A. System Requirements
Starting with information requirements, I explain what housing
information an HSMS should include. Then, I analyze what data are
required for organizing this information. Finally, I suggest the ways of
sharing data among data collectors, information organizers,
distributors, and users.
1. Information Requirements
An ideal HSMS should serve three levels of information needs which
include the information needs for operations, management, and policy
41

making (Huxhold, 1991:19). These three levels of information needs are
unique to different agencies, different levels of governments (state vs
municipality), and different governmental regions (rural vs urban).
The information requirements of the proposed HSMS come from the
needs of each housing related agency. Because Cambridge is a built-out
city, which faces a serious housing shortage, an emphasis on affordable
housing development and rehabilitation of deteriorating housing stock
is emphasized in the information requirements.
I summarize the information needs in Table V-1. Three types of
information needs are currently unfulfilled: information on specific
locations and surroundings of properties, market conditions, and
housing maintenance. Together, fulfilled information needs and
unfulfilled information needs define total housing information needs. I
give special attention to the unfulfilled information needs, because
they highlights the necessity of the proposed HSMS.
The first unfulfilled information need is information on specific
location and surroundings of a place, which is useful to help decision
makers better understand a place. To better plan for and manage an
area, decision makers need to know: the visual quality of surroundings,
the nearness to amenities or disturbances, types of residents, related
land use regulations, property values, and condition of the buildings,
etc. Usually, decision makers obtain this information by visiting the
site. After becoming familiar with an area, they can recall mental
images of the area by looking at a simple street map. This personal
observation method creates few formal records which other decision
makers can use.
But by using GIS, one can collect the information on a particular
42
.. "'W

Table V-1: Summary of Information Requirements of the Proposed Housing Supply Monitoring System
NEEDS OF THE INFORMATION Currentjnfor__ aiorltormatorIolmatr_ _ __eguiedData _torON HOUSING AND LAND Avallability Organi01 Upat Organizing Information
Sizes and Dimensions Computerized Assessors When Changes Land Sizes, Building Sizes
Locations and Surrounding Envi't Adjustment Needed Assessors When Changes Addresses, Lot Plate Maps, & Surroundings
Development Potential of Vacant Not Available None N/A Zoning, Sales, Rents, Property attributes, etc.
Condition of the Housing Stock Adjustment Needed Assessors Per 3-6 Years External, Interior Condition, Ages, Violation, etc.
New Housing Construction Computerized Inspectional Ser' By Changes Permits, Address, Land Parcel ID, Property Attribute
Zoning Computerized Inspectional Ser' When Changes Zoning Districts, FAR, Minimum Lot Size, Heights, etc
Current Land Use Computerized Assessors When Changes Current Land Use Type, Land Use Code, etc.
Ownership(P/Public, Ren'Contr'd Computerized N/A When Changes Owner Names, Property ID, Manager, etc.
Census Computerized Data Man't (CDD) Per 10 Years Demography, Income, Housing, etc.Household Demographic Computerized Election Com'n Annually Social, Economic, and Political attributes
Selling Properties Not Available Broker' Case List Monthly Address, Building Attributes, Prices, etc.
Sales Records Computerized Assessors When Changes Address, Building Attributes, Prices, Sale date, etc.
Rents Computerized Rent Control When Changes Address, Building Attributes, Rents, Contract Date, e
Public Housing Waiting list Computerized CHA Current Names, Family Members,
Public & Assisted Housing Cond Adjustment Needed CHA Current Address, Interior, External Conditions, etc.
Interior Conditions Adjustment Needed Assessors By Request No. and Size of Rooms, Heat, Plumbing, Paint, etc.
External Conditions Adjustment Needed Assessors By Request Materials, Structure, Roof, Foundation, etc.
Histories of Buildings Satisfactory, Manuall Historical Com'n One Time Worf The year that a building was built
Capital Improvement Computerized Rent Control When Changes Value put in, Finishing Date, Work Done, etc.
Building Violations Satisfactory, Manuall Inspectional Ser' By Requests Address, Violation Type, Problem Status, etc.
Engineering Maps Satisfactory, Manuall Public Works By Cases Dimensions of the Properties, Coordinates, etc.
Land Parcel Boundary Satisfactory, Manuall Public Works When Changes Dimensions of the Properties, Coordinates, etc.
Street Network Maps Satisfactory, Manuall Public Works When ChangesRoads, Land Marks, coordinates, etc.
Source: collected by author from interviews Cambridge, 1991
(.0

place in a more detailed and efficient fashion. Decision makers can use
all the existing digital maps to collect all the existing data on a study
area, and then do various analyses and document the results in a more
readable form that other decision makers can apply. This is the most
profound application of GIS in the proposed HSMS.
The second currently unfulfilled need is a better understanding of
market conditions, which includes information on sales, rents, and
properties for sale. This information is not centrally important, but
becomes more central as a municipality attempts to direct the
development of affordable housing. Useful for studying the feasibility
of a development project, this information is more critical in
identifying a good deal in periods when state and federal assistance
has decreased substantially. For this analysis, information on vacant
land, under-utilized land, and the real estate market is needed.
LIkewise, the third unfulfilled information need, information on
housing conditions and maintenance, is important for managing the
housing stock. Because housing rehabilitation programs aimed at
buildings in poor condition and affordable housing development both
require prospective projects, they need information on building
maintenance. The development opportunities might come from vacant
land, under-utilized land, poorly maintained buildings, or abandoned
buildings. Besides economic incentives, this information can help a
local government to understand how well the housing stock serves
housing needs.
Taking into account the above information needs, I designed a
proposed HSMS to include six basic features. The HSMS should have the
capability to provide information on land and buildings. For land, the
44

HSMS should be capable of: 1) locating vacant land parcels; 2) locating
under-utilized land; and 3) evaluating development potential based on
the current condition of the housing market. For buildings, the HSMS
should have functions to: 4) locate abandoned and poorly maintained
buildings; 5) analyze the current housing stock; and 6) track new
construction and demolition (to keep track of changes in land and
buildings). I will discuss the suggested ways of organizing these types
of information later.
2. Data Requirements
The data requirements represented in Table V-2 are derived from my
study of information requirements. The principal data unit is a
property. Some of the data is required, while other data is optional.
Some of the data can be created with a GIS; eliminating the necessity
of manual collection. I discuss these nine data categories: their use,
relevance to required information, data sources, data forms, and data
updates in the following sections.
a. Geographical Identification
To gain the insights into a potentially tremendous amount of data
relating to locations, one needs to summarize this data into more
understandable forms. This is one major contribution of "geo-
processing," which can help organize data into various combinations,
and make it more visible and easier to conceptualize. By using GIS, geo-
processing becomes easier and more efficient.
The link between a property on a digital map and other attribute data
can be through addresses, parcel IDs, or other specially designed
geo-codes. Many different agencies maintain their own databases, often
using these identifications in slightly different ways. It is therefore
45

Table V-2: Data Reguirements of the Proposed Housing Supply Monitoring System
DATA REQUIREMENTS Description and Use of the Data Qa Automation RemarkRsesourceStatus
Regulations on PropertiesZoning Districts Link to zoning regulations, can be generated by GIS Zoning/Inspectional. Paper-Filed Unneces yCurrent Land Use Vacant, residential use, industrial, commercial, etc. Assessors Computerized RequiredFAR The limit of floor area that can be built on a piece of la Zoning/Inspectional. Paper-Filed Unneces'yPermit Identification Number Link to issued permit records Inspectional Services Paper-Filed RequiredMinimum Lot Size Otherwise needs special permits for development Zoning/Inspectional. Paper-Filed Unneces'yHeight Limits Zoning/Inspectional. Paper-Filed Unneces
Build ing Maintenance
External Conditions To show how well a building has been maintained Assessors Paper-Filed RequiredViolations Violations of building codes, plumbing codes, etc. Inspectional Services Paper-Filed RequiredNeighbor Complaints Helpful for identification of sub-standard buildings Inspection/Rent Cont' Paper-Filed RequiredInterior Conditions To show how well a building has been maintained Assessors Paper-Filed RequiredReport Date of complaints Inspection/Rent Cont' Paper-Filed RequiredInspection Date Inspectional Services Paper-Filed RequiredInspection Results Inspectional Services Paper-Filed RequiredTenants Complaints Showing if there are problems with a rental house Rent Control Paper-Filed RequiredValues of Improvements The total values of a renovation work Inspection/Rent Cont' Computerized RequiredCompletion of Work Inspectional Services Computerized Optional
Types of Work If it is for structure, plumbing, etc. Inspection/Rent Cont' Paper-Filed RequiredConditions of the Housing Market
Dates of sales Registry of Deeds Computerized Required
Sales prices Registry of Deeds Computerized Required
Lease Date Rent Control Computerized Required
Rents Rent Control Computerized Required
Selling Prices The asking prices of the houses on the market N/A (Brokers) N/A Optional
Days on the Market To show how long a property has been on the market N/A (Brokers) N/A Optional
MapsLot Plat Maps Show the scope of a land parcel Public Works Paper-Filed Required
Surroundings Aerial Photo, Building Floor Plans, etc. N/A (Public Works) Paper-Filed Required
Street Network Maps Useful for roughly showing locations, Generated by TIGE Public Works Paper-Filed Required
Source: collected by author from interviews, Cambridge, 1991
0)

Table V-2: Data Reguirements of the Proposed Housing Supply Monitoring System
DATA REQUIREMENTS Description and Use of the Data aM Automatio lemarkResources StatUs
Geo graphical Identification
_ Address Positioning, mailing list, and link to other information Public Works Computerized RequiredParcel ID For linking to assessor data Assessors Computerized Required
Block Numbers Aggregate data to block levels, can be generated by GIS Planning Paper-Filed Unneces'yCensus Tracts For aggregating data, can be generated by GIS Planning Paper-Filed Unneces'y
Traffic Districts For aggregating data, can be generated by GIS Planning Paper-Filed Unneces'Ward and Precinct For aggregating data, can be generated by GIS Planning Paper-Filed Unneces'yNeighborhoods Numbers For aggregating data, can be generated by GIS Planning Paper-Filed Unneces'y
Dwellers or Owners of Properties
Names of Owners or Managers Registry of Deeds Computerized RequiredNames of the dwellers People who live at the address Water, etc Computerized RequiredHousehold Characteristics For planning purposes Election Commission Computerized OptionalWaiting List for Assisted Housing Deciding the demand for assisted housing Housing Authority Computerized Required
Property Permanent Attributes
_ Land size and Dimensions Assessors Computerized Required
Building Size and Dimensions Inspectional Services Computerized Required_ Number of Rooms To see if a building is too crowded for its residents Inspectional Services Computerized Required
Building Types Single houses, two-family houses, Triple deckers, etc. Inspectional Services Computerized RequiredConstruction Materials Wooden, RC, brick, etc. Inspectional Services Computerized Required
Roof Materials For estimating usable lifetime Inspectional Services Computerized RequiredBuilding Ages By specifying the year a building was built inspec'l/Hist'l/Asses: Computerized Required
Utilization Statuses of Buildings
HeatingA building is sub-standard if does not have heating sys Assessors Computerized Required
PlumbingSub-standard if plumbing system is out of order Inspectional Services Paper-Filed Required
Insulation Sub-standard if plumbing insulation is poor Assessors Computerized Required
Fuel Consumption For estimating dwelling costs Rent Control Computerized Optional
_ Water Consumption For estimating dwelling costs Water Computerized Optional
Electricity Consumption For estimating dwelling costs Electricity Computerized Optional
Source: collected by author from interviews, Cambridge, 1991

difficult to match the needed data when we wish to combine these
different databases. Therefore, it is typically necessary to unify
through the agreed-upon standards for address or parcel ID, or to create
"match" tables in order to build linkages among databases.
Other spatial identifiers like block, neighborhood, ward and precinct,
census tract, etc., for each parcel can be generate by the GIS. By
specifying the boundary of the districts, a GIS can assign these
identifiers to each parcel precisely. Whenever districts are changed,
new district identifiers can be assigned again. The data of addresses
and land parcel IDs are already computerized in Cambridge in the
assessor records. However, address formats are not yet standardized
across departments. But, the required maps are still in paper form that
need to be digitized for use in a computer-based system. I will discuss
this issue in the "maps" section, below.
b. Tenants or Owners
Many governmental activities generate the need to contact the
residents in a certain area for various reasons, including property
owners and tenants. This data comes from different sources: such as
the Assessing Department, which collects addresses of owners to mail
tax bills annually; the Rent Control Board, which collects data about
tenants annually; the election commission, which surveys the
demographics of current residents every year; and the Water
Department, which bills dwellers monthly. These types of data are
computerized already.
With this data and GIS, one can organize the demographic
information on tenants and owners easily (for instance, for mailing
labels). Another example is the pre-census count exercise. It is
48

difficult to aggregate household data up to census tracts because to
assign each household a census tract is difficult, but this task can be
more easily completed by using GIS. Because of privacy concerns, some
data should be published only in aggregated forms.
c. Semi-permanent Property Attributes
Dimensions, sizes, and other physical attributes of properties are
the key data representing features of a property. Many decisions need
this data. For instance, to determine the maximum floor area that
zoning regulations allow to be built, one needs the data about lot size.
These property attributes can be used for other indirect uses: For
instance, to determine the lifetime of a building, data on construction
materials, year built, and building types, etc. With this data, analyses
of the maintenance of the housing stock can be better performed.
Much of this data comes from Inspectional Services, because they
have the blueprints of permitted buildings. However, information on old
buildings is often either not available, outdated, or missing. The
assessors also have data from field surveys, which includes every
property and is already computerized. When Inspectional Services
issues a new permit the assessors will also receive a notice to update
their corresponding records.
d. Utilization Statuses of Buildings
Some decisions require more detail about how well a building fits
the needs of current residents. For instance, neighborhood planners
want to locate people who live in substandard housing. Data of this kind
can help them decide who they should plan for first. A building without
adequate heating, plumbing, and insulation is considered substandard.
The Rent Control Board also needs this data for deciding the
49
maximum rents for each rental housing unit every year, because the
costs of fuel consumption, water, and electricity are the major living
costs besides rents. The data can also show if a building is vacant,
which will have low water and electricity consumption.
The data in this category comes from many sources. The assessors
survey what types of systems a building has (like heating system). The
Rent Control Board collects data on fuel consumption. The Water
Department has data on water consumption. Most of this data is already
computerized.
e. Regulations Related to Properties
The use of land is also determined by regulations, which includes
zoning, subdivision ordinances, and other land use regulations. It is
necessary to specify the regulations pertaining to a property. Many
planning activities need this data. For instance, economic planners need
the data to decide how much commercial space is available and where
it is located. Housing planners need to know how much vacant land
exists for building new housing.
The Inspectional Services Department manages most of the data in
this category. Many regulations implemented in this agency are in paper
form, like the zoning map. To determine which zoning district a
property belongs to, small scale maps that can only approximately
locate an address often cause difficulties. By specifying the boundary
of a zoning district, through using GIS, every land parcel can precisely
be assigned a zoning district. Similarly, the other related regulations,
like minimum lot size, FAR, height limit, etc., can also be easily
assigned to a parcel.
The automation of these paper maps can greatly benefit the
50

Inspectional Services Department. Using GIS, it is easier for them to
send notices to residents living nearby a proposed variance, precisely
answer citizen's requests about the regulations on a specific lot, and
revise data more easily when zoning districts change.
f. Building Maintenance
I have previously discussed the use and data resources of the
information on building maintenance. The data for identifying building
maintenance is largely from the assessor. Presumably, assessors
survey the external and interior conditions of each building every three
years for renewing its assessment formula for assessment value. To
minimize the expensive direct surveys of building maintenance,
reported tenant complaints to the Rent Control Board and reported
violations to the Inspectional Services are valuable.
Most of this data is in paper form that needs to be computerized.
Although this automation is arranged to organize the information on
building maintenance, it can also benefit the data collectors. For
instance, after automating the records of violations, the Inspectional
Services Department could better manage the review of reported
violations.
g. Conditions of the Housing Market
As discussed previously, information about the current housing
market is useful for discovering new opportunities for developing
affordable housing. For instance, the price of a poorly maintained rent-
controlled house on the market is often low, and may be provide an
opportunity for the local government to develop affordable housing.
Information on the current housing market is valuable to a municipality
seeking local resources for affordable housing when state and federal
51
assistance has decreased dramatically.
The data for understanding the conditions of the housing market
includes: properties for sale on the market, sales records, rents, etc..
Except for properties for sale, the data are already computerized in
Cambridge. The source of sales data is the Registry of Deeds. The rents
for some units are from the Rent Control Board. The sale data is
available from private real estate sources like the broker's selling list.
Combining these data with the building attributes, a municipality can
have a clear picture of the local housing market, which plays central
role housing provision that the municipality should understand in order
to plan creatively.
h. Mp
Because the basic data component of the proposed HSMS is either
related to a house or a land parcel, the digital base map for applying
GIS requires parcel maps. On this map the boundary of a land parcel is
clearly defined, so that geo-processing can be done based on the
attribute features of land parcels. One can either search for land
parcels by their attributes (for instance, where are the parcels that
have buildings older that fifty years?) or search for attributes from
geographic features of land parcels (for instance, who lives within half
mile of a proposed retailing center?).
The paper parcel maps come from Public Works, where they update
the maps after receiving a notice of ownership or subdivision change
from the Registry of Deeds. They have surveyors, engineers, and
architects who maintain the maps. These parcel maps are likely to be
available for a municipality, and are necessary for the proposed HSMS.
The accuracy of parcel maps, street network maps, flood plane maps,
52

etc. is critical to fully utilize GIS for this analysis. Most GIS projects
require an accurate mapping base onto which additional layers can be
registered and overlaid. For instance, the flood plane map can specify
parcels that are not suitable for development. Because the proposed
HSMS requires parcel maps, which is only one type of maps that a
municipality-wide GIS would use, accurate digital parcel maps would
be useful for future coordination between the HSMS and a municipality-
wide GIS.
The accuracy requirements of parcel maps differ between
applications. For instance, deciding on ownership lines for two
adjacent parcels might require accuracy up to an inch. To decide on the
location of gas lines we might tolerate an accuracy of maps up to one
and one-half feet. Because the six basic functions of the proposed
HSMS only require accurate land area of land parcels, which are of also
available from assessors records, the accuracy requirements for the
parcel maps might be around five feet. Many existing municipal parcel
maps fit this latter accuracy requirement. Of course, we would all like
to have very accurate maps, but this is expensive.
Before a municipality can acquire accurate parcel maps that better
serve the needs of engineers, less accurate parcel maps can serve the
needs of the proposed HSMS well. A set of municipality wide parcel
maps prepared from aerial photography with "ground truth" often
demands an expense of more than a few million dollars (Patterson,
1991, Interview). It is more economical to use existing parcel maps.
If there are not many queries across layers of geographic features,
and maps are used only for displaying approximate locations of houses
or land parcels, a street network map is sufficient. The Census Bureau
53

offers digital street network maps, which are published together with
census data. Today's GIS can use these street network maps almost
directly.
A municipality needs to know about the surroundings of a place. An
aerial photograph is useful for this purpose. But because visiting a site
is often not costly in an urban municipality, an aerial photograph may
not be cost-effective for this purpose unless it is a byproduct of
another study. Another alternative is parcel maps with building
outlines. These maps can show more detail about a building and its
surroundings.
3. Information and Data Flow
a. Data Collection
The flow of housing information starts from the source of the
required data. This sources for housing data include Inspectional
Services, Registry of Deeds, Public Works, Rent Control Board, Housing
Authority, Assessing, and the Election and Historical Commissions.
These collected data are summarized in Table V-3.
54

Table V-3: Collected Data and Source
Source of Data COLLECTED DATAInspectional Services Building attributes of new permits,
resident complaints, zoning regulations,and code violations
Registry of Deeds Ownership, parcel boundaries, and salesdata (prices, buyers, sales date, etc.)
Public Works Parcel maps, street network maps, andengineering maps
Rent Control Board Rents, capital improvements, tenantcomplaints, and fuel consumption
Housing Authority A waiting list for assisted housing andattributes of existing public housing
Assessing Department Building attributes, assessed values,owners, housing conditions, andequipments
Election CommissionNames and household demography
Historical CommissionThe year a building was built
Broker Sales ListLocations, prices, date on the market,etc. for properties for sale
Source: collected by author's interview with Cambridge officials, 1991
The above departments are the best candidates for maintaining
digital data for the HSMS. These departments collect data because of
their own needs. To apply an HSMS, a remaining issue is whether these
data source departments have computerized their data processing. In
55

Cambridge, the Public Works has not computerized its map
management, but has submitted a request for purchasing computerized
mapping tools. The Inspectional Services has not computerized, either
but is working with the Data Processing Department on the automation
of its permit tracking.
Although all the required digital data for the proposed HSMS will be
available in Cambridge, this may not necessarily be true in other
municipalities. In a typical municipality, the Assessing Department,
which incorporates data from the Registry of Deeds and Housing
Authority, is most likely to be computerized. Its digital data is the
most available and a rich source for the proposed HSMS.
If other suggested digital data listed in Table V-3 are not available,
studying building maintenance and development feasibility will be very
difficult. Digital parcel maps are often not currently available in a
municipality. To apply an full version of the proposed HSMS, a
municipality needs to digitize its parcel maps first. Otherwise, the full
power of geo-processing will not be available. But even with just the
digital street network maps from the Census, the proposed HSMS can
still roughly display spatial distributions.
b. Data Processing
The six features of the proposed HSMS require further data
processing of the raw data collected by each data collection unit
identified in Table V-3. The role of data processing belongs to an
expert who knows how to: (1) transfer data from different databases,
(2) transform data into the required formats for different data
processing tools, (3) use data processing tools like GIS to do geo-
processing, and (4) coordinate data processing into a gradually refined
56

decision process (as information becomes available).
If each department had an internal computer expert who could do
data processing, they could fulfill these information needs more easily
and completely. Since the cost of this decentralized staffing is too
expensive, a municipality usually has a limited number of common data
processing staff to support all departments. In Cambridge, a
centralized data processing department was established for this
purpose.
Until a municipality has a data processing expert in each
department, a centralized data processing model is the best available
solution. Cambridge has a centralized data processing department in
charge of storing and distributing data through a computer network.
This centralized arrangement can solve many problems of data storing,
data sharing, and other technical problems.
I recommend that the proposed HSMS first reside in a centralized
data processing unit to integrate an often updated database, with data
input and maintained by each user department. This centralized data
processing department would play the roles of a coverage (digital maps
and associated data) manager, information organizer, educator, and
coordinator.
The increased convenience of using electronic data that the
centralized data processing unit provides also hastens users along the
path to more information needs. The growth of new needs can quickly
surpass the capacity growth of a centralized data processing
department. This may be the reason that Cambridge, even though it has
a centralized data processing department, still needs a data
management component internal to the Community Development
57
Department (CDD) to support many planning activities.
As user needs grow and become more sophisticated, the initial
centralized data processing would gradually become decentralized. In
Cambridge, the CDD's Data Management Component represents an
example of decentralized data processing. The department uses data
obtained through the network and then combines it with census data to
support the information needs of other planning components. With this
arrangement, the departments of land use, neighborhood planning,
housing, and also non-profit affordable housing developers, could have
direct access to the enhanced information on land and housing.
The second decentralized data processing component of the proposed
HSMS would be in Inspectional Services. Inspectional Services needs
the proposed HSMS to manage its daily administrative activities. As
discussed previously, an HSMS can help the department to manage the
implementation of the zoning ordinance, building codes, and other
regulations more efficiently.
Public Works is another prospective decentralized component and
could use the HSMS to manage its map inventory. Public Works could
handle map changes and updates more efficiently and fulfill the
requests for maps of different scales more quickly. With surveyor,
engineer, and architect staff, Public Works can also ensure the
accuracy of digital maps.
To avoid the lack of compatible data common in a completely
decentralized setting for data processing, a core database and agreed
upon standards are both necessary. In this distributed form of data
processing, each department collects data for their own purposes and
contribute data to a central database. This core database is the place
58
lillElis mii-ish-ni sim -inimll- mise

where the data listed in Table V-3 is pulled together for the proposed
HSMS.
To make the database durable, the central data processing unit
should organize users to set standard formats and processes for data
updates and "down-loads." As long as each data collection department
updates data for their own purposes and contributes to the central
database in a acceptable form, then the central database management
unit can make that data usable for other users, and the core database is
more likely to be durable.
Ideally, the data and information flow of the proposed HSMS is in a
network with a core database organized and maintained by a
centralized data processing department, which is in charge of data
storage, communication, and technical assistance, supported by
individual data collection by individual departments. Through a
communication network, each individual department collects,
processes, and exchanges data with other users.
Initially, a typical municipality may find it too costly to establish
the kind of network that exists in Cambridge but it would be possible
to start with a very simple "sneaker" network by exchanging digital
data on floppy disks. However, with the growing popularity of office
automation, eventually a computerized network would appear to be
necessary. The proposed HSMS should gradually adapt itself into a
distributed computer network, through which user departments would
obtain some independence in data processing but would not lose access
to technical support.
B. Organizing Information
The preceding discussion described the information and data
59
Ishi hinEi 11I I

requirements of the proposed HSMS and how data might be exchanged
among different departments. In this section, I suggest how to organize
the required information. Because Cambridge electronic base maps
were not available in 1991, I chose to test some of my concepts using
another available parcel-level GIS. The Centralized Land Use
Information System for East Boston (CLUIS), developed by the Boston
Redevelopment Authority (BRA), substituted for Cambridge for this
purpose. The CLUIS provided data typically available for a municipality.
CLUIS is a GIS-based land use information system, which contains
parcel attribute data mainly from the Boston's Assessing Department,
supplemented with other departments data, including the Fire
Department, Inspectional Services, and Rent Equity Board. The attribute
file contains around 170 items, filling about 1,000 columns. The items
are categorized into 13 files (see Appendix A).
Organizing the information requires adequate data, logical
procedures, and good tools. Practically, these three elements do not
always coexist. For instance, Cambridge does not have adequate data to
determine building maintenance very accurately without a field survey.
To find out something from inadequate direct data demands a logical
estimate using other relevant data. This is also discussed in the
following sections.
1. Land Information
In this section, I described how I used CLUIS to locate vacant
parcels and calculate the maximum floor area of these vacant parcels. I
also located under-utilized parcels with current floor area less than
the zoning allowance. To better understand the relevance of these
parcels, I also discuss ways of estimating their development potential.
60

a. Locating Vacant Parcels
Presumably, parcel-related files in CLUIS are most likely to have
the data needed for identifying vacant lots. Among the 13 different
files in CLUIS, there are five files useful for this purpose. These files
are: the Parcel File, the Residential Data File, the Commercial Data
File, the Field Inspection File, and the Tax History File. Four of the five
files come from the Assessing Department. The remaining file is the
Field Inspection File.
The Field Inspection File verifies the use of the assessment data
that an average municipality usually has. To survey airport-related
businesses in East Boston, BRA conducted this field survey to check
assessment data against each parcel's current situation. Therefore, the
vacant parcels I located from the assessment data could be verified by
this Field Inspection File.
Using the Tax History File's estimated building values, one might be
able to discover vacant lots. To be considered as vacant, a parcel should
have neither taxable building value nor other building information, such
as building height, floor area, number of dwelling units, and so on.
These conditions might be used as indicators of vacant lots.
There are two other items in three files that also should directly
indicate vacant parcels. One is the Land Use item (in the Parcel File)
and the other is the Primary Occupancy item (in the Residential Data
File and the Commercial Data File). Because these files are current,
updated annually from the Assessing Department, the information was
very useful for my task.
I therefore used the following three data sources to locate vacant
lots: the Land Use item, the Taxable Building Values item, and the
61

Primary Occupancy item. To verify their usefulness, I compare their
results with the Field Inspection File, which was considered to be the
most accurate file of the four. In such a comparison, any inconsistency
would suggest errors. For reducing the computer-processing time and
increasing the depth of my analyses, I randomly selected one precinct
(precinct 103) to conduct the following analyses.
The results of three different approaches are shown in Figure V-1
and summarized as follows: In the Field Inspection File (Group B), 69
parcels were verified as vacant. By using the Land Use item (Group A),
there were 70 parcels shown as vacant parcels. From assessed building
value, there were 96 cases having no taxable buildings, which might be
vacant parcels too. For the primary occupancy item, because it
duplicated the Land Use item of Parcel File, I decided to use the Land
Use item only.
The common areas in Figure V-1 show the differences of these three
approaches. In Group C, 96 parcels (61+2+4+29) were expected to be
vacant. In fact, the field inspectors only recognized 63 of them as
vacant. Among the difference, 33 parcels, I found that 13 of them were
sites of condominiums. Four other parcels are "slivers" polygons and
had no data. The other twelve parcels were the sites of churches, parks,
and publicly owned land. This suggests that the Tax History File is not
completely efficient for identifying vacant parcels.
62

Figure V-1: Three approaches for identifying vacant parcels
Parcel Filea private parking lot
A a retail strip cantera commercial vacant lota proposed development
-13 condosii .. 4 sliver polygons
--- N . 12 are the hosts of- - - churches, parks, public
Field Inspection landFile - - 2---
C Tax History File
a mistake by 0 one condo having noassessors building data
one public owned land
Source: by the author
By using the Land Use item, there were four parcels that the
inspectors thought were occupied, while the assessors thought they
were vacant (shown common in group A and C but not in B). Among these
four parcels, one had been set for development a year before the field
inspections. It was possible that the inspectors saw the parcel with a
building under construction, so they didn't record the parcel as vacant.
Meanwhile, a parcel will not have taxable building value until the
building is finished and registered. Therefore, a parcel under
construction is still shown as a vacant parcel by assessors. These left
three parcels include a private-owned parking lot, a retail strip center,
and a vacant commercial parcel.
63
There were also five parcels that both the inspectors and accessors
defined as vacant, but buildings existed on the parcels. This is in
contrast to our common sense that says a vacant lot should have no
buildings. Maybe both the inspectors and assessors saw no permanent
structures, and thus they classified the parcels as vacant. This
argument can be strengthened by the taxable building value on these
parcels, which were $600, $300, $300, $2600, and $2400 respectively.
If there were permanent buildings on the sites, the tax value should be
much higher.
From the preceding analyses, the most promising way to find vacant
parcels is to use the Land Use item of the Parcel File (Group A).
Although an adjustment for a time lag is required, the Parcel File from
the assessors is a rich and accurate source to locate vacant lots
reliably for planning purposes. (The programming for this analysis is
given in Appendix B).
By specifying the land use item with conditions (landuse = 'CL' or
'RL'), one can locate vacant parcels and highlight the locations of these
vacant parcels on the parcel maps. When dealing with a large area on
small scale maps an individual parcel is too small to observe easily,
and knowing the percentages of vacant land by block may be sufficient
for some purposes. By using GIS, blocks with different percentages of
vacant land can be indicated by different shades or colors, and one see
the distribution of vacant parcels more clearly.
b. Locating Under-utilized Land.
To locate under-utilized land, I develop a procedure to search for
parcels that used only a portion of their zoned floor area. In other
words, parcels were located where the current floor area of the
64
li 1_ 1 11' / -
building divided by its lot size is smaller than the zoned Floor Area
Ratio (FAR) (the programming is given in Appendix C). All information
needed for this calculation was available in the assessment data.
Aggregating the total floor area in order to compare it to its zoning
allowance for each block can show the built-out a block. By using GIS,
one can generate colored maps showing the percentage of built-out for
every block in different colors.
To determine the redevelopment potential for an identified under-
utilized parcel, one must take into account replacement costs of the
existing building on a lot. When demolishing an old building to build a
new building, the replacement costs are the costs of the demolition and
construction. If two buildings (the old and new) are identical, the
replacement benefit is the difference in market value between the new
building and the old building. If replacement costs are more than
replacement benefits, redevelopment is less likely to happen.
The development benefit of under-utilized land also includes an
unused zoning allowance of floor area. With this additional
contribution, under-utilized land has more redevelopment potential
than the simple "one to one replacement" mentioned above. Therefore,
redevelopment potential of these under-utilized parcels can be shown
in percentages of density utilization. A parcel with higher under-
utilized floor area allowance is more developable.
To more accurately represent redevelopment potential, it is useful
to combine this utilization rate with other information about the
existing building, such as building maintenance, building ages, and
construction materials. For instance, a single wooden house with a low
utilization rate, high age, and poor maintenance, is most likely to be
65

redeveloped. By using the data management tools of GIS, this type of
multi-constraints analysis can be easily completed. GIS is also capable
of doing this analyses and, in addition, can show the locations of the
identified buildings.
c. Evaluating Development Potential
To study the economic feasibility of development of vacant parcels
and under-utilized parcels, the required data for the analysis include
the market value of the proposed building and development costs.
Development costs can be estimated empirically from unit costs of
different building types, while potential sale prices are not so easy to
determine.
The way people set prices when they sell their homes is helpful to
define my analyses. People first collect information on the most
current sales that are close to their homes. They decide on their prices
based on the differences between these houses and their own houses.
How much adjustment one should make is a very arbitrary decision, and
heavily relies on a person's and their realtor's experience. Many
realtors have more information and better knowledge to help make a
judgement, because they have been studying the real estate market for
a long time.
In ARC/INFO (the GIS software used here), it is cumbersome but
possible to automatically locate the closest nearby and current sales
cases to a proposed development. For a developable lot, the command to
find the nearby sale cases is the command BUFFER. BUFFER can create a
zone within a certain distance to a parcel. This zone can then be used to
locate sale cases. The problem is the uncertainty of distance and the
speed of BUFFERing. How much distance should be specified? What if a
66

run of BUFFER doesn't locate any cases? The running speed of BUFFERing
is painfully slow in finding the answers.
A better way is to display each sale on the map. By visually
selecting the nearby cases or by using NEAR command, one can further
investigate selected cases. ARC/INFO has the command IDENTIFY, which
shows the associated data of the parcel. In this way, a decision maker
can locate the nearest cases and query the required information for
estimating potential sales prices. This is the same process that might
be used for locating estimates rents.
Based on the potential sales prices and estimated development
costs, one can then analyze the development potential for a prospective
site. To accurately determine development feasibility requires a
detailed study for each particular location and development type.
I recommend a simple method of estimating the development
feasibility based on the ratio of estimated sale prices to the estimated
construction cost. A higher ratio would suggest a site is more
developable. This method may be described as follows:
The development feasibility for vacant land can be estimated by
comparing its estimated unit sales value to its estimated unit
construction cost. Assuming construction cost is approximately one
half of the total value of a new building, one can suggest a parcel with
an estimated sale value two times more than the estimated
construction costs is developable.
Compared to its surroundings, a block is more likely to be
homogenous in building types and land use. Therefore, one can assume
67

the sale value of a new building equals the average sale price of a
block3. Using GIS, with an address-matched file of sales prices, or the
assessed values from the assessor's file, assigning each land parcel a
block number is easy and the calculation of the average sale prices by
block is also straight forward. On the other hand, one can assign the
construction cost based on FAR and the surrounding building types. That
is, if the surrounding buildings mostly are single-family wood-frame
houses, the development type of a prospective site is also single
wooden house. With these two numbers, one could show a simple
feasibility index based on the ratio of sales prices to construction
costs for each block
2. Information on Buildinas
In this section, I describe how I could use the HSMS to study building
maintenance and the composition of the current housing stock. I also
discuss licking permit tracking in the proposed HSMS. Information on
buildings is often more important than information about land in a built-
out city like Cambridge, while a fast growing area might emphasize
information about land.
a. Locating Abandoned and Poorly Maintained Buildings
In CLUIS, the Residential Data File and the Commercial Data File
have data showing parcels with badly maintained buildings or
abandoned buildings. This data is from the assessors, who evaluate
conditions of buildings using five categories: poor, fair, average, good,
3 Because sold buildings have different building ages and were soldat different times, these sales prices need another adjustment by theconsumer price index and building depreciation rate to be adjusted topresent values.
68

excellent. Assuming that conditions of poor and fair are non-standard,
by using GIS, one can locate these buildings on the digital maps. To
make the maps more clear, one can map the number of non-standard
buildings by blocks or the percentages of non-standard buildings by
blocks.
To see how useful the assessors' data is for locating abandoned
buildings, a field survey is necessary. (With a clear location of
suspected buildings on maps generated from GIS, a field survey will
become easier.) In Cambridge, to completely survey the conditions of
each building would take the assessors at least three years (Helwia
1991, Interview). Other supporting data to reduce this time lag and
reinforce the assessors data is necessary.
As discussed in chapter IV; section B-1, additional supporting data
for determining building maintenance comes from a few sources: the
Rent Control Board has information on capital improvements and
tenants complaints for rent-controlled buildings; Inspectional Services
has information on violation reports; the housing planners also do field
surveys on building conditions to locate needy households for
assistance (e.g., housing improvement loans on an ad hoc basis).
To obtain information on building maintenance, a municipality can
choose direct surveys, which might be conducted by assessors,
consultants, or student interns. Even with a simple windshield survey,
costs are still high and accuracy is doubtful (Zwick & Schneider, 1989).
Another approach is to make estimates from relevant information as
discussed above. In 1989, Zwick and Schneider published a paper
discussing one methodology for making this type of estimate. I
summarize their findings in the following paragraphs:
69

They located substandard buildings from assessors records by
setting mutually agreed upon criteria between the research team and
their client-Alachua County Housing Authority. Any buildings that have
records indicating an incomplete structure, no heating devices, no full
bath, or floor area less than 150 square feet are considered as
substandard. If a building did not fit into the above categories, but was
older than 50 years, it was categorized as substandard unless it had
recorded improvements and its current condition as graded by the
assessors was average or higher. Remaining buildings that had
abnormal external deterioration or current market value less than half
of the replacement value were classified as substandard also.
Other grades were then assigned to remaining buildings (not
substandard) depending on the assessors' grades and building ages.
Remaining buildings can be assigned "standard," if they were younger
than 50 years or older but with an assessors' grade higher than average.
Any remaining buildings were either "borderline" or "suspected,"
depending on different mixes of building ages and assessor grades.
Overall, their system provided correct categorizations of 99 percent of
the buildings.
By means such as that described above, conditions of buildings can
be more clearly estimated. One can then show locations of each
category on the digital maps and further study their spatial patterns.
This is the major function of GIS in this application.
b. Analyzing Current Housing Stock
Information about quantity and quality of the housing stock is useful
for understanding how well these buildings serve residents. Such
information is valuable for making sound housing policies. For instance,
70
Cambridge is considering some reforms to target affordable housing to
the really needy, after publication of a housing needs study indicating
that households living in rent-controlled housing were not significantly
different from households in non-controlled housing in terms of income
(Goetze, 1991: 30-31).
Because the proposed HSMS incorporates building data from
assessors' files and household demography from the election
commission, the data for analyzing the relationship between buildings
and households would be available in the HSMS. The HSMS could include
programed to automatically provide the information that this
"snapshot, one-time" housing study provides.
Because data on housing and household demography is saved on a
parcel basis in the proposed HSMS, one can group this data up to
different geographical boundaries, such as census tract, block, traffic
zone, etc. For instance, in the above cited housing needs study the
author analyzed the different characteristics of four types of
ownership status: which are rent-controlled rentals, non-controlled
rentals, privately owned, and public assisted (Goetze, 1991). The
attributes (e.g., income) of households in these four categories could be
shown on maps with different geographic boundaries. In addition, one
could select this data displayed using any boundaries desired to study
areas.
Many social and economic studies traditionally use census data,
which is only available every ten years. For local issues, census data is
not complete and accurate after a few years. As long as a source of
demographic data is available every year, combined with the assessors
housing data, an HSMS could be a useful base to facilitate these needed
71
studies.
c. Tracking construction and demolishing
Inspectional Services issues permits for new construction,
renovation, repair, or demolition. Whenever these changes happen, the
assessors also receive notice so they can change its relevant data.
Therefore, the assessors' data should be relatively accurate in tracking
the number of housing units and its changes.
Permit tracking becomes a popular computer application of
municipalities, which is designed to improve the management
efficiency of issuing building permits (e.g. providing an access to
monitor how a permit application is being handled by Inspectional
Services). If his computer application is available, a HSMS should link
the data of the permit tracking system to the centralized database.
Usually, the keys to link the data together are the address or parcel ID.
This linkage will ensure the most current data on the changes of
housing and land stock.
By mapping new construction over time in the proposed HSMS, one
might see patterns of city growth and the direction of public
investment. When plotting demolitions on maps, a policy maker might
discover redevelopment trends in the older areas and this may help re-
structure rehabilitation programs. This analysis is relatively easy
using GIS. With an HSMS, other data in addition to construction and
demolition can ass a more complex understanding of these trends. For
instance, lots of new construction and redevelopment of old buildings
in the area might suggest a gentrification trend.
72
Chapter Six
VI. Policy Recommendations
In previous chapters, I have discussed the fundamental components
of the proposed Housing Supply Monitoring System (HSMS) and its six
function groups. But the impact of such a system on municipal housing
policy and administration, as well as problems of system
establishment and implementation of the HSMS, are not yet clear. In
proposing a new system, it is difficult to evaluate these factors
without actually having established one. However, I will discuss this
issue based on my findings from interviews and previous discussions.
A. Policy Recommendations from a HSMS
1. Housing Policy and Administration
The major use of the HSMS for housing policy is to provide decision
makers with better information. to make sound housing policy. The
capability of the proposed HSMS comes from two areas: 1) the mapping
and geo-processing ability of the GIS; 2) an integrated database with
data on buildings, household demography, housing markets, land use, and
current utilization conditions. Assuming the ideal HSMS were available,
its use in housing policy might be described as follows.
For Cambridge, the proposed HSMS could reveal conditions of housing
maintenance to help housing rehabilitation programs target the most
needy. Because the GIS can display building maintenance by locations, it
should be more easily visually to detect a concentrated area with an
initial stage of deterioration. A decision maker could then study the
area's social, economic, and physical characteristics in order to trace
the causes of deterioration, including investigating if the income level
of the residents are too low to maintain housing well, seeing if the
73

deteriorating buildings are mostly rent-controlled units with owners
that are less likely to employ renovation, or if these buildings are just
very old.
The HSMS could facilitate inclusionary zoning decisions through
incorporating information on market trends and current market data.
For instance, an official could locate the most current and nearby
properties for sale in the market to estimate the sale prices of a
proposed development project. If the estimated market value of the
proposed project is high, density bonuses given by inclusionary zoning
regulations are likely to be more attractive to developers and therefore
the official could exchange for more affordable units from a better
negotiation position.
The HSMS could help affordable housing development programs to
locate prospective projects. For instance, an official could use the
HSMS to locate vacant parcels, under-utilized parcels, and parcels with
poorly maintained buildings. From the parcel maps, an official could
examine whether there are parcels adjacent that form a bigger site for
developing affordable housing. An official could further study
characteristics such as the average income, building values, and
building maintenance in the surrounding community. If the site has
appropriate features, such as the right size and in a welcoming
community, an official could next estimate the prices that developers
would bid on the market. If this price is too high, the official could
decide either to employ tax incentives, public subsidies, or switch to
other development opportunities.
The proposed HSMS could also facilitate housing administration. For
instance, an official could use the HSMS to select the residents that he
74
1 1s' 1 11 _ 1__ _ 1 1 10 - '

wants to contact in an area. He could either digitize a free line
boundary and overlay it on the parcel base map or, say, specify a mile
radius around a selected location. The GIS could select all residents
within this buffer and then use its data management tools to generate a
mailing list.
With the HSMS, officials could more easily provide mapped
information to use in public hearings. For instance, some background
maps, such as a colored land use map, can be plotted out easily at
different scales, and could be used for handouts or as wall maps. The
public hearing could thus have better documents to improve
communication.
The HSMS could ease data collection for housing related analyses,
since demographic data, building attribute data, land use data, and
housing market data would be available for joint use in the HSMS. From
the digital base map, a researcher could decide a study area and
retrieve all the relevant data to perform the necessary analyses. If the
analyses are beyond the limitations of GIS, data could be retrieved and
down-loaded in ASCII form to analyze using other data processing
tools.
One significant feature of the HSMS would be its ability to cross
reference housing market data with building attributes and
demographic data. The current condition of the housing market is a
mixture of many sub-markets and small market areas. One should not
interpret the housing market as a homogeneous market. For instance,
low income housing might be in short supply, whereas luxury
condominiums are over-built. It is simply not accurate to always
consider the housing market as a single market. Presumably, policy
75
- It I- - --lall~ ihiisi - ~il --

makers will be more capable of making effective housing policy, if they
have better information about the conditions of these sub-markets and
sub-areas.
Because the proposed HSMS has demographic data, building attribute
data, land use data, housing market data, and the locations of each land
parcel, the HSMS could therefore help analyze sub-markets and sub-
areas. For instance, one could search for the low-income households
and analyze the buildings they live in to study the low-income housing
sub-market. Combining demographics with the attributes of these
buildings, one could learn whether the low-income housing stock is
decreasing or deteriorating. With GIS, these sub-market analyses could
also be easily analyzed by sub-areas.
From my interviews, I noticed that a municipality like Cambridge
currently has no better tools to monitor the housing market than a
small developer would have. I think the reasons come from two past
trends: 1) in the past, the private sector has provided more housing, and
the public sector has mostly managed land use and provided necessary
assistance or interventions, and it has not been so necessary for the
public sector to monitor the housing market, since they have been less
involved in housing production; 2) in making housing policy under this
situation, Cambridge has found enough census data and assessor data to
fulfill its information needs.
In recent years, Cambridge has become more concerned about
affordable housing development (which is one segment of the housing
market). The cutbacks of federal and state assistance have forced
Cambridge to find local resources to fulfill the gap. Therefore,
Cambridge began to directly develop affordable housing in the 80s;
76

information that has been mainly valuable to private developers in the
past has also become useful for Cambridge.
Information on vacant land, under-utilized land, poorly maintained
buildings, and abandoned buildings mean opportunities, and sometimes
good deals, for developing affordable housing. This information is
especially valuable, when the local funding is limited and the local
government cannot afford big losses.
In addition, to decide either to develop affordable housing on its own
or to subsidize private developers, a municipality needs good
information on development activities. The public sector can work
better with the private housing industry, if they know the real estate
market as well as the private developers. Even more important, to
locate a good opportunity one step ahead of market trends can help
discover good deals for affordable housing development and save much
money for limited resources.
The popularity of public-private partnership in affordable housing
development suggests that the public sector should know more about
the real estate business. The history and current crisis of housing
affordability indicates that the traditional mechanisms of housing
provision are not efficient in providing affordable housing. On the other
hand, the experience learned from massive public interventions like
urban renewal illustrates the limitations of the capacity of federal and
state governments. Therefore, local governments need to share the
responsibility of developing affordable housing, and they should act
like entrepreneurs to do this job wisely. A tool like the proposed HSMS
could provide the required information.
2. Svstem Construction
77
In the last chapter, I defined the ideal HSMS as a distributed system,
with a centralized database management unit in charge of data sharing
and data storing. From this system, each user department down-loads
current digital maps and associated data from the central database
through a network to process their required information. Because real
situations are seldom so ideal, some adjustments are necessary to
compromise with the likely resource constraints. In this section, I
discuss a recommended process of establishing a HSMS, considering the
usual constraints of a municipality.
To apply new computer applications often requires much adjustment
for users and the system itself. With more available information,
decision makers can make decisions based on more facts and the
process of making decisions will change. The needs for information
will also change eventually. This interaction between the information
and decision-making often results in a long evolution process.
Taking this necessarily long evolution process into account, the
establishment of an information system can apply either a top-down
approach, bottom-up approach, or a combination. In general, the top-
down approach emphasizes the evaluation of short-term and long-term
needs of each user department to formulate a set of executive goals,
whereas the bottom-up approach concentrates on each user
department's particular needs. Unlike the top-down approach, which
demands a system construction that complies with synthesized goals,
the bottom-up approach recommends individualized solutions.
The assumptions of the top-down approach are that the
comprehensive system will have enough funding and political support,
and that the system requirements can be defined from analyzing each
78

user needs in advance. Because of the common political difficulties
associated with such an expensive comprehensive system and
sometimes unpredictable changes of user needs, these assumptions are
not necessarily true. On the other hand, the assumptions of the bottom-
up approach are that, after having experience in individual data
processing, user departments will work together better to advocate a
comprehensive system. Because of the "sectarianism" that each
department may insist upon the value of their own data processing
approaches, this assumption could be false.
To establish an HSMS, the top-down approach would suggest a
centralized system to fulfill comprehensive goals, which are the
syntheses of each user's needs. On the other hand, the bottom-up
approach might suggest decentralized systems, where each department
employs specialized software, each of which might be easy to use for
user departments but not compatible with one another.
The advantages of the centralized system, which the top-down
approach would suggest, are that: the user needs assessment can reveal
conflicting needs in advance; the system can ensure data compatibility
for different types of data processing; the central data processing unit
can support users and ease their difficulties in the learning process;
the system can eliminate investment duplication; and, most important,
the system can provide an environment for each user department to
work interactively.
The disadvantages of this centralized system are that: the expense
of establishment and maintenance is high; when changes occur, the
system responds more slowly than an individualized system; the
central data processing unit might become a sectarian agency, and tend
79
II

to establish its own political power rather than to transfer technical
skills; the system requires much institutional coordination, which
might be politically impossible; and, most strikingly, the centralized
system might become an exclusive means to serve political elites.
The advantages of decentralized systems are that: users gain the
immediate satisfaction of processing the required information; the
short term cost is lower; the user departments can more precisely
determine the needs of a comprehensive system from their own
experience; because of lower costs and firsthand use of information,
the system's political difficulties are less; and the system is more
flexible to new changes of information needs.
The disadvantages of the decentralized system are that: coordination
with other departments in data sharing is more difficult, because data
are not necessarily in compatible forms; the system might be only a
temporary solution, because future applications of a more
comprehensive system could demand a termination to the individualized
systems; the existing systems might become obstacles for a future
centralized system, because the old systems are an opportunity cost to
the new system; the believers in the old systems could become the
political opposition to the future system; and the long-term costs
might be higher.
A combination of these two approaches could keep their advantages
without disadvantages. One could employ the top-down approach to
formulate a set of comprehensive goals and system requirements. Each
user department then might establish their own applications under the
direction of these comprehensive goals. Because each department can
individualize its own applications and apply for funding separately, the
80

political and financial difficulties of system implementation might be
less. However, to ensure data compatibility, a centralized data
management unit should be established to collect data from each
department. This unit can guarantee data currency and availability for
other departments.
Because of the needs of a learning process, a smoother process of
growing a system provides more opportunities for the adjustment of
human and machine. To make a huge and comprehensive system work is
expensive. Besides, the use of a new information system is often vague
at the beginning. An alternative to a "one time revolution" of
establishing an information system is to start with a small or
prototype system to test out major technical problems, to educate
users, to improve institutional coordination, and to further evaluate
the cost-and-benefits of the system. If the small system shows fatal
problems, one can stop the project without losing too much, or one can
refine the system to start again.
No matter what initial steps a municipality decides to take, it
should first solve the problem of data compatibility. Data formats like
address and parcel ID need to be unified. Otherwise, it is very difficult
to incorporate data from different databases. For instance, in
Cambridge the assessors maintain their data by land parcels, and these
parcel IDs are not always consistent with the ones on the parcel maps.
Without correcting these errors, the HSMS cannot link the assessor's
building attributes with parcel digital maps.
To test an HSMS, it would be economical to set up a centralized
prototype PC system (CPC), which might be an IBM PC with a large hard
disk and a digitizer, with PC Arc/Info (popular GIS software). I
81

recommend that the CPC reside in either the data processing
department or in the planning department. To ensure the availability of
a completed database, a small centralized system can provide better
staffing to deal with the problems of data compatibility and data
processing. This is a better departure point for a municipality to test
out the HSMS with limited funding.
To ensure that the source of digital parcel maps be updated, a
mapping tool that is compatible to Arc/Info should also be employed in
Public Works for managing its map inventory. Because the six function
groups of the HSMS do not require accurate parcel maps, the current
assessor parcel maps are probably usable as the source of a digital
parcel map base. However, if engineering accuracy is desired for
municipality-wide GIS in the future, these less accurate parcel-level
digital maps may have to be entirely redone. Therefore, subject to
financial constraints, aerial photography might be a necessary
investment, otherwise selecting only a portion of the community for
the prototype is worth being considered.
By using this initial HSMS prototype, each department could
gradually learn about the use and limitations of the HSMS. If this pilot
system works, user needs are more likely to grow to the level of
encouraging the initiation of a more complete system. The needs of a
prototype HSMS will not justify the establishment of a large scale
network, but, together with the needs of office automation and
increasing data storage, this might be a long-term goal.
If a municipality-wide GIS is being considered by the municipality,
the HSMS could be a part of this GIS system. A municipality-wide GIS
often is a multiple-purpose information system, which could include
82

the housing information for a HSMS. If both systems apply GIS software
and their digital maps and data are compatible with each other, the
HSMS could reside within a municipality-wide GIS as a function module.
B. Remaining Problems
1. Technical Problems
The major technical problems facing the proposed HSMS are the
expensive digital parcel maps and their registration with other digital
maps. To establish accurate digital parcel maps, ground surveys or
aerial photography are necessary. Municipality-wide aerial photography
with "ground truth," often costs more than a million dollars to
accomplish (Patterson, 1991; Interview). A municipality cannot always
afford this price. On the other hand, without digital parcel maps, the
powers of the GIS cannot be utilized completely. A common dilemma in
implementing a parcel level GIS is this tension between inaccurate
parcel maps and high expense.
Because different applications need different accuracies, high
accuracy is not always necessary. Unless an application requires an
engineering level of accuracy, parcel maps indicating approximate
locations of land parcels and their ownership boundaries that are
relatively accurate to one another are usable for many applications. For
instance, for locating land parcels or buildings, one needs to know their
locations, but a pin map on a street network maps that indicates these
locations by dots may be useful enough for some applications not
requiring high accuracy.
To apply an HSMS, the critical factor requiring map accuracy is the
dimensions of land parcels, which are nice to have in order to obtain
the area and shape of a land parcel. Because an accurate land area
83
--- -~-~---

attribute field is available in the assessor's ownership records, the
dimensions of land parcels may not have to be very accurate for
determining land area. The shape of land parcels is also useful
information for determining if a parcel is usable for building houses,
(e. g. if its width is too narrow or it is an odd shape). For this purpose,
as long as the digital maps reflect the approximate shape of land
parcels, high accuracy is not necessary.
Because the assessor's parcel maps typically have sufficient
accuracy for applying an HSMS, they might be used as the map bases for
establishing digital parcel maps. Most municipalities have these paper
maps available for digitizing, typically consisting of many map sheets.
However, these tax maps vary in quality and accuracy between
communities, depending on their age. These paper maps often have no
real-world coordinates, which are helpful in digitizing parcel base
maps and registrating with other digital maps. For digitizing a parcel
map base with an engineering level of accuracy, many of the older tax
maps are not usable (Raymond, 1990).
For digitizing old tax maps, approximate coordinates can be
estimated from large scale paper maps, which cover the whole
municipality. Aerial photography for obtaining accurate coordinates
may be unnecessary for applying an HSMS, because of its relatively low
accuracy requirements and the high expense of aerial photography.
After digitizing old maps without coordinates, to bring the digital
maps into real world coordinates, several control points (more is
better) are needed for the entire municipality. Most GIS have packages
have a function to proportionally transform "rubber sheet" digital maps
to fit these control points. After transformation, the distance
84
"I
measured from digital maps can be very close to the real distance in
the real world. Of cause, if the old tax maps are very inaccurate, the
new digital maps will also be inaccurate.
The cost of a parcel level GIS largely comes from the establishment
and maintenance of digital parcel maps. Aerial photography and then
digitizing parcel maps is expensive. To reduce these costs, a
municipality should consider training their surveyors to use computer
aided mapping tools, which can be compatible to GIS. Improvements in
accuracy over a period of time could provide a currently updated digital
parcel base map for the HSMS or municipality-wide GIS.
Without digital parcel maps, it is still possible to apply some
features of the proposed HSMS. By using the street network digital
maps from the Census (TIGER files) to substitute for parcel maps, some
functions of the HSMS can still perform satisfactorily. The trade-off is
the lack of some functions and the inaccuracy of some applications.
Without digital parcel maps, the results of data processing would need
to be checked against paper parcel maps.
Every land parcel can be saved as a point in a GIS "coverage," which
is a digital map. By using Census street network digital maps (TIGER
files), the approximate locations can be assigned real-world
coordinates to be displayed on a street network map. These points
representing land parcels can be related to their attribute data in a
data file. Many of the functions of the HSMS can then be implemented by
using GIS.
The GIS can pin map vacant parcels, under-utilized parcels, and
poorly maintained buildings on the TIGER street network map using dots
of different shapes and colors. To see the size, shape, and its
85

surroundings of a selected land parcel, one would have to check with
paper parcel maps manually.
To study the development potential of prospective sites, one could
still use the previously recommended process to find the nearby cases
of recent sales. To see if there are some adjacent parcels which also
have development potential, one would have to manually check with
paper parcel maps several times, since the dots only indicate rough
locations of land parcels. Although not completely automated, this
process could still save the time of manually locating each parcel on
paper maps.
To obtain data for desired sub-areas, one could also specify a
boundary to retrieve data from the TIGER street network map by
applying the same process as the one for parcel maps. The problem is
the accuracy. The street network file is not very accurate on the one
hand. On the other hand, there is the inherent inaccuracy in representing
land parcels by approximate dots. Some applications, such as
determining improvement fees based on the nearness of residents to a
public improvement, cannot apply this method because of inaccuracy.
Because Arc/Info is expensive, using other cheaper tools such as
Map/Info (costing about $1,000 in 1991) might be a good alternative for
a municipality for such pin-maps. Map/lnfo has all the function just
discussed above with much less geo-processing ability than Arc/Info.
The major problem of using this very friendly and easy tool is the later
compatibility of incorporating a wider range of high-accuracy digital
maps, or using more complicated advanced applications.
All of the technical problems discussed above may not be significant
problems in the near future, because of the fast improving technology.
86

For instance, manual digitizing is being replaced by new "smart
scanners" that can read the features off paper maps automatically into
the computers. The current painfully slow running speed of PC Arc/Info
is expected to be solved by improvements in hardware and software in
the future.
2. Institutional Problems
In my interviews, I asked Cambridge officials in housing-related
departments about the use of GIS. Most of the answers I got were
negative. These officials did not think using GIS to display the spatial
distributions of housing-related data was important for their current
work. But most of them did consider the function of GIS to retrieve
data quickly from digital maps handy. They often mentioned the
potential for automatically generating mailing lists. This gap in
understanding the use of the potential use of GIS might be attributed to
the nature of municipal agencies, who are more like "daily
administrators" than "problem seekers." Another probable reason is the
relative low knowledge about GIS.
The unwillingness of users to learn new applications constrains the
success of information systems. For instance, users might not want to
learn how to use the GIS, although the GIS could be useful to their work.
Users might consider that new computer applications would potentially
provide new access to the public to monitor their work and thus create
more political pressure. They might reject learning new applications
because of the frustrations involved in the learning process.
Similar to an individual's reaction, institutions are also
conservative in adopting new computer applications. Governmental
agencies do not necessarily welcome the required changes in making
87

decisions and the required coordination with other departments. These
reactions might come from political considerations, internal
competition among agencies, sectarianism, or fears of being monitored.
All these issues are difficult to study but are very important.
With more participation from users, an information system should
be more capable of satisfying user needs. If user departments resist
new information applications, unless the system developer can
convince them to cooperate and ease the learning process, the system
has only a small chance to succeed. Promoting user participation in the
current institutional setting needs to employ new management
procedures or even new political processes. These demand further
studies beyond this thesis.
Taking the previous points into account, the HSMS developer should
first establish a set of executive goals to define long-term
requirements in order to minimize institutional obstacles. After
gaining consensus, the HSMS developer can then start with a small
project to test out all these possible problems. Institutional
coordination could appear to have a better chance to be improved with a
pilot project combined with long-term goals.
With a concern about equal access to information resources, the
HSMS developer should provide access to the public. For instance, a
landlord should be able to use the system to see average rent levels for
particular types of units. The government should make information,
subject to privacy and security concerns, available to the public.
To implement an HSMS, one should consider issues of security,
privacy, and efficiency. For instance, should anyone be able to obtain
demographic data for a specific household? How can security be
88

ensured for databases? How should privacy be protected? And, could
these security considerations handicap the efficiency of providing
useful information? All these issues are relevant to the establishment
of information systems, and should be studied, but are beyond the goals
of this thesis.
89

Bibliography
Austin, J., 1985. "Developing cadastral systems: Land data critical in growing cities," The Urban Edge, June/July, pp. 1-3.
Babcock, Richard F. 1969. The Zoning Game. Madision: The University of Wisconsin Press.
Be'dard, Yvan, 1989. "Information Engineering for the Development of Spatial Information Systems: A Research Agenda," 1989 URISA processing, volume IV:43.
Cambridge, City of, 1990. Report to City Council.
Chapin, Jr., F. Stuart and Edward J. Kaiser, 1979. Urban Land Use Plan n i ng. University of Illinois Press.
Chrisman, N. R., Kaufman J. L., et aI., 1984. Land records modernization: Centers of excellence from a Wisconsin perspective. Computers. EnYironment and Urban Systems, 9, 219-227.
Croswell, Peter L., 1989. "Facing Reality in GIS Implementation: Lessens learned and Obstacles to be Overcome," 1989 URISA Processing,volume IV:15.
Cyr, Ed, 1991. Housing Our people, The Cambridge Housing plan, A housing policy for Cambridge, Cambridge Housing Subcommittee, Internal Report.
Daly, Peter, 1991. Interview by author with Peter Daly, Manager, The Home Ownership Rehab, Cambridge, MA.
De Neufville, Judith I., 1981. The Land Use Policy Debate in the United State, New York: Plenum Press.
Doonan, Nancy, 1991. Interview by author with Nancy Doonan, Planner, The Historical Commission, Cambridge, MA.
90

Dysart III, Benjamin C. and Marion Claw, 1989, public Interest in the Use of Private Lands, New York: Praeger Publishes.
Gebolys, Gene, 1991. Interview by author with Gene Gebolys, Economic Planning of the Community Development Department, Cambridge, MA.
Goetze, Rolf, 1990. Cambridge Housing Challenges. Study report to Cambridge Community Development.
Helwia, Peter, 1991. Interview by author with Peter Helwia, Official, The Assessing Department, Cambridge, MA.
Hurie, Terry, 1991. Interview by author with Terry Hurie, Director, Cambridge Housing Authority, Cambridge, MA.
Huxhold, William E., 1991. An Introduction to Urban Geographic Information Systems, New York: Oxford University Press.
Jacobs, Harvey M., 1989. "Implementing Local Multipurpose Land Information Systems: Political-Economic Research Issues," Computers, Environment and Urban Systems, Vol, 13, pp. 3-13,
Lynch, Kevin, 1981, The Theory of Good City Form, Cambridge, Mass.: MIT Press, Cambridge, MA
Madziya, R. G., Ron Mattiussi, Gordin Willis, Edmonton Metrapotitan, 1989. "Doing it right- an Information Management System," 1989 URISA Processing, volume 111:3.
Marks, Carole, 1991. Interview by author with Carol Marks, Planner, CDD, Housing, Cambridge, MA.
Miyata, Yuka, 1991. Interview by author with Yuka Miyata, Database Manager, The Rent Control Board, Cambridge, MA.
Neufville, Judith I. de, 1981, The Land Use Policy Debate in the United State, Plenum Press, New York.
91

Packer, Buddy, 1991. Interview by author with Buddy Packer, Official, The Rent Control Board, Cambridge, MA.
Patterson, Robert, 1991. Interview by author with Robert Patterson, Senior Engineer, The Public Works, Cambridge, MA.
Raymond, Earl W., 1990. "Old Tax Maps: Are They Suitable for GIS?," Remote Sensing and Database Deyelopment News. A Publication of James W. Sewall Company, Winter: 5.
Raymond, T. Lair, et al. 1979. Quantitatiye land-capacity analysis, United States Government Printing Office.
Reilly, William (ed.), 1973. The Use of Land. New York: Crowell.
Roman, Valerie, 1991. Interview by author with Velerie Roman, Director, The Data Processing Department, Cambridge, MA.
Rosenberg, Michael, 1990. A Message From the Assistant City Manager for Community Development Department, NEWSREEL, Newsletter from Cambridge Community Development.
Rudel, Thomas K., 1989. Situations and Strategies in American Land -use Planning. Cambridge University Press, New York.
Seiderman, Cara, 1991. Interview by author with Cara Seiderman, Planner, Neighborhood Planning of the CDD, Cambridge, MA.
Shelsinger, Susan, 1991. Interview by author with Susan Shelsinger, Director, Housing of the CDD, Cambridge, MA.
Singanayagan, Si nganayagan, Cambridge, MA.
Ranjit, 1991. Interview by author with Ranjit Planner, The Inspectional Services Department,
Wilson, Randall, 1991. Interview by author with Randall Wilson, Planner, Data Management of the CDD, Cambridge, MA.
92

,....---- --'---"--------' --------~, ---
Zwick, Paul D., Richard H. Schneider, 1989. Substandard Housing in Alachua County: A computer Automated Property Tax Inventory and Identification Methodology, Proceedings of the Urban and Regional Information Systems Association. Volume IV, pp. 93.
93

- ..,,-
APPENDIX A (The list of 13 files in CLUIS)
ADDRESSEE FILE The person designated to receive tax bills and other mail from the
city Assessing Department. If there is no addressee the mail is send to the owner. There are parcel ID and ADDRESSEE items in this file.
COMMERCIAL DATA FILE The commercial data record is composed of fields selected for each
commercial or exempt parcel from the commercial data characteristics file of the Assessing Department. Apartment buildings and mixed-use properties (residential/commercial) are included in this file; exempt parcels include all publicly owned property as well as churches, and schools. Data are current. There are sixteen items in this file.
FIELD INSPECTION FILE Selected data from Assessing Department verified by field
inspection, and observed data. Field inspection conducted July and August, 1988. There are 13 items in this file.
FIRES FILE Selected data on all building fires the data cover 1986 to present.
INSPECTIONAL SERVICES FILE Identifying information for all permits in the inspectional database.
The data include 1985-1989.
MAIL FILE The current ail address used by the Assessing Department for tax
bills and other mailings to the taxpayers.
PARCEL FILE Identifying information for each parcel in the database. This is the
file upon which all other files depend. There will be one record in this file per parcel. All of the data elements are from the assessing department ownership history parcel file except where explicitly stated otherwise. The data are current.
94
r rr
RENT EQUITY FILE This record is comprised of field selected from the rent equity file
supplied to the project by the rent equity board. The data are current, but incomplete for many records.
RESIDENTIAL DATA FILE The residential data file is composed of fields selected for each
parcel from the residential database of the assessing department. A parcel with one to three dwelling units has a residential data record. A parcel with four or more residential units has a commercial record. No parcels would have a residential and commercial record. The data are current.
SALE FILE Five years of sales (1983-1988) for properties defined in the parcel
file. All of the data elements are from the Assessing Department Sales File except where explicitly stated otherwise.
TAX HISTORY FILE This file provides relevant tax information for property for a given
fiscal year (tax years 85 - 89). All information has been taken from the tax bill files for these five years so the land use, lot size, districts, and other data on each record were relevant for the indicated fiscal year and may not reflect the current data for the property.
TAX TITLE FILE This file contains all properties for which back taxed were owed at
the time of creation of database. These are current data.
ZONING BOARD OF APPEALS FILE This file contains information for cases filed with the Zoning Board
Appeals from January 1985 through the present. This file is an extract of the file created by Clark Broida in 1987. The large file up-to-date and available to CLUIS if necessary.
95

r I
APPENDIX B (Locate Vacant Parcels)
The process to locate vacant parcels is as follows:
For the A group, I executed commands in the TABLES module (One of many modules in Arc/info) to select vacant parcels. I selected any parcels that in the Land Use item of the Parcel File had data of "CL" or "RL." The commands I used are as follows: (In TABLES)
: SELECT EBSMALL2.PAT : RESELECT LANDUSE_PAR = 'CL' OR LANDUSE_PAR = 'RL' : LIST
(Then, the parcel's data in the PAT table will show after about one minute)
For the B group, the commands used are similar except I used "RESELECT LANDUSE_FLD CN 'V'" instead. For the C group, the command was "RESELECT RESBLDVAL = 0 AND COMBLDVAL = 0 AND INDBLDVAL = 0 AND EXEBLDVAL = 0." This command selects all parcels having no building value for residential, commercial, industrial, and exempt uses.
For common areas, like ones common between A and B, after RESELECTing for A, another "RESELECT" command for B will do the job. So, for the common part for A, B, and C, I used RESELECT for each of them.
For the part common in A and B, but not included in C, I use commands as follows:
: SELECT EBSMALL2.PAT : &RUN SEL_C
(A macro program does the same job as the RES ELECT command for selecting C. I use a ASCII editor to write the macro program, and ended with a macro reserved word- &RETURN)
: NSELECT : &RUN SEL_A : &RUN SEL_B
96

To locate the parcels discussed before on the base map, the commands I used are as follows:
In another ARC/INFO module, ARCPLOT, I first selected the vacant parcels and plotted them in red on the associated boundary map.
: DISP 4 : MAPE EBSMALL2 (The base map coverage file) : ARCS EBSMALL2 :RESELECT EBSMALL2 POLY LANDUSE_PAR = 'CL' OR LANDUSE_PAR = 'RL' : POL YGONSHADES EBSMALL2 2
97

APPENDIX C (Locating Under-utilized parcels)
For calculating under-utilized parcels, I used the following commands:
(In ARC) : ADD ITEM EBSMALL2.PAT EBSMALL2.PAT FAR_ED 4 4 N 1 (FAR_ED is for used FAR) (In TABLES) : SELECT EBSMALL2.PAT : RESELECT TOTALGFA_COM > 0 : CALCULATE FAR_ED = TOTALGFA_RES / SQRFOOT : NSELECT : CALCULATE FAR_ED = TOTALGFA_COM
To set up data for FAR, I used the commands as follows:
(In TABLES) : DEFINE ZON_FAR (Then add items as ZONING, 8, 8, C and FAR, 3, 3, I, 1 ) : ADD (Then, insert all data into the new file) (In ARC) JOINITEM EBSMALL2.PAT ZON_FAR EBSMALL2.PAT ZONING ZONING
Now, the data are ready for comparison. To identify under-utilized land, I select parcels that used less floor area than the zoning regulations allowed:
(In TABLES) : ASELECT : RESELECT FAR_ED> 0 : RESELECT FAR_ED < FAR
After finding vacant and under-utilized parcels, INFO commands can help print out the results. The commands I used are as follows:
98
- II

> SELECT EBSMAlL2.PAT > RES ELECT LANDUSE_PAR = 'Rl' OR LANDUSE_PAR = 'Cl' (This is for searching vacant parcels)
> REPORT VACANT (Then, define the report's format)
2 ENTER COLUMN CONTENT> PID (ParceIID) ENTER REPORT OPTIONS> N (Calculate the number of the parcels) ENTER COLUMN HEADINGS> PARCEL, ID
(And the same commands for other column definitions. These columns are Current Land Use, Lot Footage, Zoning District, Current Floor area, Allowed Floor area, and Buildable Floor area. For instance:)
2 ENTER COLUMN CONTENT> SQRFOOT ENTER REPORT OPTIONS> T (Calculate the sum of all parcels' area) ENTER COLUMN HEADINGS> Lot, Footage (And so on)
OUTPUT TO PRINTER (Y OR N) ?> Y LINES PER PAGE?>55 (The Maximum is 66 for normal paper) ENTER REPORT OPTIONS>
99