evaluating the performance of commercial banks in...
TRANSCRIPT

Asia Pacific Journal of Finance and Banking Research Vol. 5. No. 5. 2011.
D. K. Malhotra, Raymond Poteau, & Rahul Singh
15
EVALUATING THE PERFORMANCE OF COMMERCIAL BANKS IN INDIA
D. K. Malhotra1
Philadelphia University, USA Email: [email protected]
Raymond Poteau2
Philadelphia University, USA Email: [email protected]
Rahul Singh3
Birla Institute of Management Technology, India Email: [email protected]
ABSTRACT In this paper, we analyze the performance of commercial banks in India during
the period 2005 to 2009. This period covers the pre-credit crisis and the crisis time period. Specifically, the paper examines the behavior of profitability, cost of intermediation, efficiency, soundness of the banking system, and industry concentration for public and private sector Indian commercial banks. The empirical results show that competition in the Indian banking industry has intensified. While the net interest margin has improved, cost of intermediation is actually rising and banks are responding to the increased costs with higher efficiency levels.
JEL Codes: G20, G21 Keywords: Commercial Banks, intermediation, financial crisis, Indian banks, performance evaluation I. INTRODUCTION
1 D.K. Malhotra, Professor of Finance, School of Business Administration, Philadelphia University, School House Lane and Henry Avenue, Philadelphia, PA 19144, Phone: (215) 951-2813 2 Raymond Poteau, Professor of Accounting, School of Business Administration, Philadelphia University, School House Lane and Henry Avenue, Philadelphia, PA 19144, Phone: (215) 951-2811. 3 Rahul Singh, Associate Professor, Birla Institute of Management Technology, Plot No 5, Knowledge Park 2, Greater Noida, Noida, UP 201301, India.
Asia Pacific Journal of Finance and Banking Research Vol. 5. No. 5. 2011.
D. K. Malhotra, Raymond Poteau, & Rahul Singh
16
During the past three years, financial crisis has shaken the financial markets in general and the banking industry in particular around the world. Since the beginning of 2008, the financial market crisis has led to the collapse of major financial institutions and is now impacting the economic conditions in major markets around the world. The impact has been more profound on the industrialized economies in comparison to emerging markets. With the increase in globalization, how much is the impact of the current crisis on the performance of commercial banks in India? This paper examines this question by analyzing the performance of commercial banks in India during the period 2005 to 2009. The Indian banking sector is important for several reasons: liberalization of its financial system beginning 1991, the rapid growth of the Indian economy, and the influence of the financial sector on economic growth. A closer look at these reasons follows.
Banking industry in India has come a long way from the nationalization of its banks in 1969 to the liberalization of the financial system since 1991. During the reform process that started in 1991, the banking sector was opened up with the objective of improving the efficiency of the banking system in India through increased competition from private and foreign banks. With this view, government initiated the process of removing interest rate controls. Government also introduced capital adequacy requirements and other safety norms to ensure sound banking system. The objective is to strengthen banking supervision and increase competition through licensing of private banks and foreign banks. The ultimate goal is to integrate Indian banks into the global financial system.
Secondly, the Indian economy is the second fastest growing economy in the world after China. A prospect for global recovery from the worst financial crisis in seven decades is being leveraged with China and India at the fulcrum. Since these nations represent an engine of growth for the world economy, a large amount of capital is flowing to the stock markets of these nations. Banks, as financial intermediaries, are playing a crucial role by bringing enhanced liquidity and promoting market efficiency by facilitating smooth transfer of funds between borrowers and lenders that will promote capital mobility among nations. A sound banking system is essential for a smooth integration of Indian financial markets with the rest of the world, because banks play a crucial role in facilitating transfer of funds between borrowers and lenders.
Thirdly, previous studies show that a country’s financial sector influences future economic growth. The banking sector is the most important part of the financial markets. If the Indian banking sector is sound and efficient, it will have a positive impact on India’s growth.
We examine the performance of Indian commercial banks during the period 2005 to 2009. This time period covers before crisis and during crisis time. In particular, the behavior of profitability, cost of intermediation, efficiency, soundness of the banking system, and industry concentration are examined in this paper.
Asia Pacific Journal of Finance and Banking Research Vol. 5. No. 5. 2011.
D. K. Malhotra, Raymond Poteau, & Rahul Singh
17
The rest of the paper is organized along the following lines. In section II, we summarize previous studies related to commercial bank performance. Section III discusses the model used in this paper. Section IV discusses the data and methodology for this study. In section V, we discuss empirical results. Section VI concludes and summarizes this study. . II. LITERATURE REVIEW
Previous studies focused on the impact of financial reforms and the liberalization of the Indian economy on the banking sector. Using the data for the period 1985-1996, Kumbhakar and Sarkar (2003) investigate the total factor productivity growth in the Indian banking industry due to deregulation of the industry since 1991. They did not find increase in total factor productivity as a result of deregulation. The study also reports that the private sector banks show improved performance through expanded output, but deregulation did not impact public sector banks in a positive manner. Shanmugam and Das (2004) measure technical efficiency of Indian banks in four different ownership structures during the reform period of 1992-1999. They report that even after the reform process, potential of commercial banks in India has not been fully realized and they are still performing below their potential. They report that State bank group and foreign banks are more efficient in comparison to other banks in India. Das and Ghosh (2006) report that during the period 1992-2002, medium-sized public sector banks performed reasonably well. Their study also shows low non-performing loans contribute to the technical efficiency of banks. Gormley (2010)’s analyzes the impact of foreign banks entry into the Indian market on the access to credit in the Indian market. The study reports that the entry of foreign banks into the Indian market did not improve access to credit for all the firms in India. A Bodla and Verma (2007) study focuses on determinants of bank profitability in India. They find that profit margins have come under pressure due to increased competition and changing face of the Indian banking. The study also reports increased resource productivity, increase deposits, and a decline in non-performing loans as a result of the reform process. Rezvanian, Rao, and Mehdian (2008) use a nonparametric frontier approach to examine the effects of the ownership on the efficiency, efficiency change, technological progress and productivity growth of the Indian banking industry over the period 1998 to 2003. They find that foreign banks are significantly more efficient when compared to other banks, i.e. the Indian privately-owned and publicly-owned-banks. The findings also provide evidence to indicate that a large number of banks operate below their optimal scale. A Zhao, Casu, and Ferrari (2010) study finds that the Indian banking industry experienced sustained productivity growth during the period 1992-2004 due to mainly technological progress. They also find that increased competition does impact total factor productivity growth. Foreign banks have added to the competitive pressure in the banking market through technological innovations.
Asia Pacific Journal of Finance and Banking Research Vol. 5. No. 5. 2011.
D. K. Malhotra, Raymond Poteau, & Rahul Singh
18
Mariassunta (2005) study focuses on banking in emerging markets. The study shows that liberalization of capital inflows may undermine bank stability in emerging markets. Cole, Moshirian, and Wu’s study (2008) documents a positive and statistically significant relationship between bank stock returns and future GDP growth. Tabak and Tecles (2010) reports that for the period between 2000 and 2006, Indian public sector banks were most efficient followed by private and foreign banks in terms of cost and profit efficiencies. III. CONCEPTUAL FRAMEWORK
Given the significance of banking in economic growth, banks are considered private companies with a public purpose. They seek to create value for all the stakeholders and maximize shareholder wealth subject to the constraints of risk, market competition, social, and the legal/regulatory framework. The private nature of banks requires them to be viable through profitability and the public nature of banks emphasizes safety and soundness of the bank’s operations. Profitability is important for the viability of a bank, but safety and security is also critical for the survival of the financial system. Banks make a trade-off between the profitability level they strive to achieve and the risks they are willing to take. Therefore, when evaluating the performance of banks, we should consider both their profitability and financial condition to avoid misleading conclusions. For example, if a bank achieves loan growth and, consequently, higher profitability by engaging in excessively risky lending, it may be vulnerable to high loan defaults that would hurt its earnings or even threaten its survival over time as the world saw under the current economic crisis. Therefore, in order to evaluate banks, we consider the following four broad sets of ratios that capture the private-public nature of banking:
Profitability Ratios Cost of Intermediation Management Efficiency Ratios Safety Ratios In addition, we also compute the industry concentration ratio in the form of
deposit concentration, loan concentration, and asset concentration in order to analyze any change in industry concentration due to the current economic crisis. Profitability Ratios: The profitability ratios are used to measure how well a bank is performing in terms of profit. The profitability ratios can also be defined as the financial measurement that evaluates the capacity of a business to produce returns against the expenses and costs of business over a particular time period. Profitability of a bank is assessed through:
Return on Assets Return on Equity Net profit margin Yield on earning assets, and Income as a percentage of capital employed
Asia Pacific Journal of Finance and Banking Research Vol. 5. No. 5. 2011.
D. K. Malhotra, Raymond Poteau, & Rahul Singh
19
Return on assets (ROA): Return on assets is computed by dividing bank’s net income by its total assets. In general, the higher the ROA the better it is, provided it is not the result of excessive risk-taking. Banks will typically have a relatively low ROA in comparison to industrial organizations mainly because banks are highly leveraged. Return on equity (ROE): ROE is calculated by dividing net income by shareholders’ equity. In a typical bank, shareholders’ equity is usually small in comparison to other sources of funds that are used to fund a bank’s assets. Therefore, ROE is usually much higher than ROA. If the return on equity is very high relative to the return on asset, it indicates that the bank is highly leveraged and may have limited access to more borrowings.4 Net Profit Margin: Net profit margin measures net profit relative to the total revenue. In the case of banks, revenue consists of interest and non-interest income. Yield on earning assets (YEA): The YEA is the interest income on earning assets divided by the value of these assets. For the Indian commercial banks, we use interest income relative to total funds as a measure of the yield on earning assets. The prevailing interest rates in the economy impact the yield on earnings assets. YEA fluctuates with the level of interest rates in the economy over time. An unusually high YEA ratio for a bank may be an indication of high risk loan portfolio for that bank. On the other hand, low yielding problem loans may force a very low YEA ratio for a bank. A relatively low YEA may also be due to overly cautious lending policies of the bank.5 Income as a percentage of capital employed: It indicates the efficiency with which management has used the owners and creditors funds to generate an income. It determines the efficiency and profitability of capital invested in business. As the primary objective of business is to earn profit, the higher the return on capital employed, the more efficient the firm is in using its funds. Cost of Intermediation: Intermediation costs are the result of the cost of transforming deposits from one set of customers into loans for another set of customers. Cost of intermediation can also be used as an indicator of competitiveness in banking industry and can be measured in several different ways:
Interest Spread Net Interest Margin Cost of funding earning assets
Interest Spread: The difference between interest earned and interest expended is one measure of the cost of intermediation. Higher difference will point to a lower cost of intermediation and lower difference will point to a higher cost of intermediation.
Net interest margin (NIM): The NIM is calculated by dividing the net interest income by the earning assets. For Indian banks, it is measured by net interest income divided by total funds.
4 See Banking Industry Surveys, June 25, 2009, Standard and Poor’s 5 See Banking Industry Surveys, June 25, 2009, Standard and Poor’s
Asia Pacific Journal of Finance and Banking Research Vol. 5. No. 5. 2011.
D. K. Malhotra, Raymond Poteau, & Rahul Singh
20
According to Standard and Poor’s Banking Industry Surveys 2009, a NIM of less than 3% is generally considered low for a commercial bank; more than 5% is very high.6
Cost of funding earning assets (COF): This is the cost of obtaining deposits and other borrowed money. We use interest expense relative to total funds to compute this ratio for Indian commercial banks. The general level of interest rates in the economy and the make-up of the bank’s liabilities impacts this cost. COF will be lower if a bank has a high proportion of non-interest bearing demand deposits and a large equity base. Management Efficiency Ratios
Management efficiency ratios for banks mainly focus on the costs other than interest. We use the following two ratios to assess management efficiency of Indian banks:
Noninterest income to total funds Efficiency Ratio Noninterest income/total funds: This ratio captures sources of income other than
interest income. Banks typically look to these sources of income to diversify their income source. Noninterest income includes service charges on various types of accounts, ATM card fees, and other service charges such check imaging fees. Banks also charge trust fees, mortgage services fees, insurance commissions, as well as other fees. A higher ratio means that the bank is diversifying its sources of income.
Efficiency ratio: This ratio is based on noninterest expenses divided by operating revenue. Noninterest expenses include operational expenses such as personnel and occupancy costs (salaries, technology, building, supplies, and administrative expenses). Operating revenue includes net interest income (interest revenue less interest expense) plus fees income. Efficiency ratio measures costs required to generate each dollar of revenue and reflects the productivity of a bank. If the costs required to generate every dollar of revenue are low, it means lower operational costs. Lower operational costs translate into greater operational efficiency. Safety Ratios A safe and sound banking system is critical for a healthy financial market. Evaluation of a bank must consider the risks that the bank is taking in order to remain profitable. We use two ratios to evaluate riskiness of banks:
Debt Leverage Ratio, and Capital Adequacy Ratio. Debt leverage: Banks have a lower equity base and usually use borrowings to
fund their assets. Borrowings help banks expand their capacity to earn more money by either expanding their facilities or by making additional loans. For the commercial banks in India, we use total debt divided by owners’ funds as a measure of debt leverage.
6 See Industry Surveys Banking, June 25, 2009, Standard and Poor’s
Asia Pacific Journal of Finance and Banking Research Vol. 5. No. 5. 2011.
D. K. Malhotra, Raymond Poteau, & Rahul Singh
21
Capital Adequacy Ratio: Bank capital plays a very important role in the safety and soundness of individual banks and the banking system. Capital adequacy norms ensure that capital should be adequate to absorb unexpected losses or risks involved. If there is higher risk, then it would be necessary to provide back up with capital. Capital Adequacy measures the strength of the bank.
IV. DATA AND METHODOLOGY The data for this study was obtained from CNBC’s moneycontrol.com website.
The sample consists of 20 state owned banks and 15 private banks. Data covers the fiscal year ending March 31st 2005 to March 31st 2009. We use a two-pronged approach to analyze the performance Indian commercial banks. First, we divide the sample into public and private sector banks and compare their performance in terms of several measures of returns, cost, efficiency, and safety by using a simple two-tailed t-test for each of the five years included in our sample. Our goal is to find out if there is any statistical difference in the performance of public and private sector banks over this five-year period.
Secondly, we use panel data analysis to evaluate the performance of public and private sector banks from 2005 to 2009. We include a dummy variable to account for time trend in the performance of banks since 2005. Furthermore, we also analyze the impact of ownership on the performance of banks by including a dummy variable to evaluate the impact of ownership (private bank =1 and 0 otherwise) on the performance variables. In addition, we introduce total deposits, loans, and assets of a bank as control variables in the panel data regression analysis. A panel data set offers several econometric benefits over traditional pure cross section or pure time series data sets. The most obvious advantage is that the number of observations is typically much larger in panel data, which will produce more reliable parameter estimates and, thus, enable us to test the robustness of our linear regression results. Panel data also alleviates the problem of multicollinearity, because when the explanatory variables vary in two dimensions (cross-section and time series), they are less likely to be highly correlated. Panel data sets make it possible to identify and measure effects that cannot be detected in pure cross section or time series data. For instance, sometimes it is argued that cross section data reflect short-run behavior, while time series data emphasize long-run effects. By combining the cross-section and time series features of a data set, a more general and comprehensive dynamic structure can be formulated and estimated. The use of panel data suggests that individuals, firms, states, or countries are heterogeneous (Balestra 1995). Time series and cross-section studies not controlling for this heterogeneity run the risk of obtaining biased results (Baltagi 2000). Panel data controls for individual heterogeneity. The most intuitive way to account for individual and/or time differences in the context of panel data regression is to use the fixed effects model. The fixed effects

Asia Pacific Journal of Finance and Banking Research Vol. 5. No. 5. 2011.
D. K. Malhotra, Raymond Poteau, & Rahul Singh
22
Table 1. Summary statistics of the data used in this study. Data is for the year ending March 31st 2005 through 2009.
Ret
urn
on
Equ
ity (
RO
E)
Ret
urn
on
Ass
ets
Net
Pro
fit
Mar
gin
To
tal
Inco
me
/
Cap
ital
Em
plo
yed
(%
)
Inte
rest
Sp
read
Inte
rest
Inco
me
/ T
ota
l
Fu
nd
s N
et I
nte
rest
Inco
me
/ T
ota
l
Fu
nd
s N
on I
nte
rest
Inco
me
/ T
ota
l
Fu
nd
s In
tere
st
Exp
ended
/
To
tal
Fund
s
Inte
rest
Exp
ended
/
Inte
rest
Ear
ned
Cap
ital
Ad
equac
y
Rat
io
To
tal
Deb
t to
Ow
ner
s F
und
Eff
icie
ncy
Rat
io
2005
Mean 13.76 0.71 9.43 8.01 4.24 7.75 3.57 0.26 4.18 59.01 12.52 16.22 41.80%
Std. Dev. 17.51 0.92 11.71 1.12 0.90 1.10 1.06 0.15 0.49 8.60 1.73 5.73 13.59%
Min -66.51 -3.50 -46.62 4.51 1.44 4.34 0.94 0.04 2.81 42.53 9.09 2.58 11.00%
Max 35.66 1.79 19.44 9.61 6.19 9.19 5.62 0.64 5.38 92.93 16.23 27.98 83.22%
2006
Mean 12.89 0.74 9.90 8.27 3.91 7.99 3.68 0.29 4.30 59.56 12.12 14.91 39.31%
Std. Dev. 12.40 0.67 7.78 0.92 0.82 0.96 1.08 0.18 0.52 8.38 1.53 5.44 9.44%
Min -46.90 -2.28 -23.95 6.19 2.15 5.82 1.65 0.01 3.09 43.11 9.66 4.08 13.26%
Max 28.55 1.52 19.08 10.92 5.49 10.90 6.84 0.65 5.89 92.94 16.43 27.45 67.35%
2007
Mean 16.67 0.85 11.08 8.68 4.13 8.34 3.55 0.34 4.79 62.09 12.20 16.24 35.28%
Std. Dev. 5.95 0.32 3.65 0.74 0.85 0.76 0.90 0.28 0.54 7.79 1.09 6.04 7.61%
Min 2.95 0.14 1.75 7.41 2.25 7.27 1.37 0.01 3.86 46.15 9.77 6.62 12.86%
Max 29.11 1.52 16.47 10.62 6.27 10.58 6.22 1.07 6.38 89.63 14.51 33.38 49.07%
2008
Mean 16.34 0.92 11.02 9.50 4.17 9.15 3.48 0.35 5.68 68.90 12.60 15.79 29.58%
Std. Deviation 5.06 0.30 3.10 0.96 1.11 0.96 1.05 0.25 0.62 7.68 2.34 7.04 6.89%
Minimum 6.14 0.32 3.45 8.07 1.76 7.85 1.56 0.02 4.36 48.32 9.21 4.57 11.90%
Maximum 25.35 1.43 16.52 11.86 7.08 11.70 6.66 0.88 7.19 91.82 22.46 35.80 47.43%
2009
Mean 15.89 0.89 9.97 9.90 4.64 9.61 3.55 0.30 6.06 70.38 13.71 16.17 28.82%
Std. Deviation 7.22 0.31 4.83 1.03 1.31 1.04 1.02 0.25 0.63 7.15 2.02 7.36 7.45%
Minimum -16.44 0.33 -11.63 8.51 2.88 8.16 1.58 0.04 4.90 50.46 11.37 4.01 11.12%
Maximum 25.51 1.48 16.25 12.50 8.31 12.50 6.86 1.20 7.48 88.60 20.22 37.92 52.98%
Asia Pacific Journal of Finance and Banking Research Vol. 5. No. 5. 2011.
D. K. Malhotra, Raymond Poteau, & Rahul Singh
23
model assumes that difference across mutual funds can be captured in differences in the constant term. The regression coefficients (the slope parameters) across groups in this model are unknown, but fixed parameters. It is also known as the least square dummy variable (LSDV) model and we use the LSDV fixed-effect model to evaluate the performance of the banking industry in India.
V. EMPIRICAL RESULTS Table 1 provides summary statistics of the data used in this study for the period
2005 to 2009 for all the banks—public and private sector. On an average, return on equity (ROE) shows improvement from 13.76 percent
in 2005 to 16.67 percent in 2007. After 2007, return on equity shows a decline and in 2009, the average return on equity was 15.89 percent. Return on assets, on an average, has improved from 0.71 percent in 2005 to 0.89 percent in 2009. Average return on capital employed has increased from 8.01 percent in 2005 to 9.90 percent in 2009, an improvement of 189 basis points. Average net profit margin increased from 9.43 percent in 2006 to 11.08 percent in 2007. However, average profit declined slightly to 11.02 percent in 2008. In 2009, there is a substantial decline in the average net profit margin to 9.97 percent.
Table 1 shows average interest spread, the difference between the interest earned and interest expended, has been increasing since 2006 and the average spread has gone up by 73 basis points. On an average, the ratio of interest income to total funds has improved by 186 basis points. However, the ratio of net interest income to total funds has deteriorated slightly from 3.57 in 2005 to 3.55 in 2009, which shows increased cost of financial intermediation due to increased competition within the banking industry, but also due to other varied financial products available to the customers. The banking industry is realizing the need to look for sources of income other than interest income and it is reflected in the increase in the ratio of non-interest income to total funds over the period of 2005 to 2009. Cost of financial intermediation is rising for the banks in India with an increase in the ratio of interest expended to total funds. This ratio has gone up from 4.18 in 2005 to 6.06 in 2009. Similarly, the ratio of interest expended to interest earned has increased from 59.01 in 2005 to 70.38 in 2009, which shows rising cost of obtaining funds for the banking industry as a whole. The capital adequacy ratio has been on the rise since 2006. In 2006, the capital adequacy ratio was 12.12 percent and in 2009, the ratio was 13.71 percent, which points to the safety and soundness of the banking system in India. The ratio of total debt to owners’ funds has remained constant throughout the sample time period of 2005 to 2009. Efficiency ratio measures noninterest expense as a percentage of total income of the bank. A higher ratio is an indicator of inefficiency. Average efficiency of banks has improved over this period. The average efficiency ratio was 41.80 percent in 2005 and it has declined to 28.82
Asia Pacific Journal of Finance and Banking Research Vol. 5. No. 5. 2011.
D. K. Malhotra, Raymond Poteau, & Rahul Singh
24
percent in 2009, a significant gain in efficiency. This will help offset the higher cost of obtaining funds and help maintain profitability.
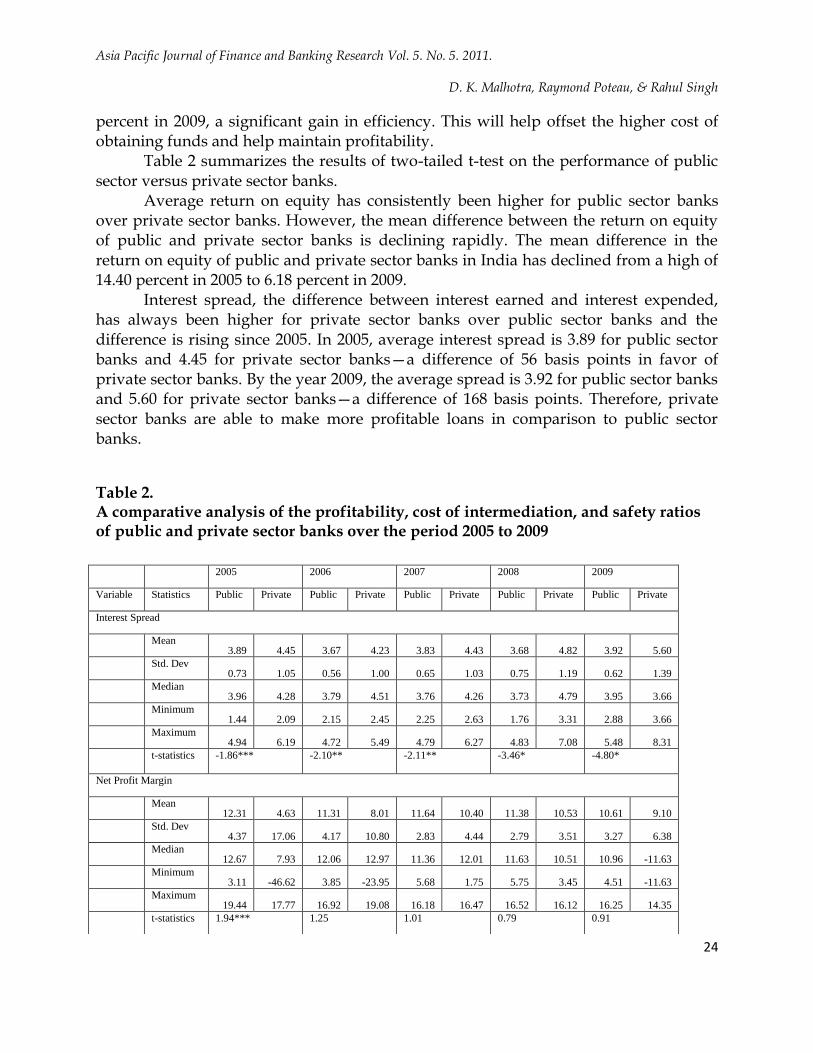
Table 2 summarizes the results of two-tailed t-test on the performance of public sector versus private sector banks.
Average return on equity has consistently been higher for public sector banks over private sector banks. However, the mean difference between the return on equity of public and private sector banks is declining rapidly. The mean difference in the return on equity of public and private sector banks in India has declined from a high of 14.40 percent in 2005 to 6.18 percent in 2009.
Interest spread, the difference between interest earned and interest expended, has always been higher for private sector banks over public sector banks and the difference is rising since 2005. In 2005, average interest spread is 3.89 for public sector banks and 4.45 for private sector banks—a difference of 56 basis points in favor of private sector banks. By the year 2009, the average spread is 3.92 for public sector banks and 5.60 for private sector banks—a difference of 168 basis points. Therefore, private sector banks are able to make more profitable loans in comparison to public sector banks.
Table 2. A comparative analysis of the profitability, cost of intermediation, and safety ratios of public and private sector banks over the period 2005 to 2009
2005 2006 2007 2008 2009
Variable Statistics Public Private Public Private Public Private Public Private Public Private
Interest Spread
Mean 3.89 4.45 3.67 4.23 3.83 4.43 3.68 4.82 3.92 5.60
Std. Dev 0.73 1.05 0.56 1.00 0.65 1.03 0.75 1.19 0.62 1.39
Median 3.96 4.28 3.79 4.51 3.76 4.26 3.73 4.79 3.95 3.66
Minimum 1.44 2.09 2.15 2.45 2.25 2.63 1.76 3.31 2.88 3.66
Maximum 4.94 6.19 4.72 5.49 4.79 6.27 4.83 7.08 5.48 8.31
t-statistics -1.86*** -2.10**
-2.11** -3.46* -4.80*
Net Profit Margin
Mean 12.31 4.63 11.31 8.01 11.64 10.40 11.38 10.53 10.61 9.10
Std. Dev 4.37 17.06 4.17 10.80 2.83 4.44 2.79 3.51 3.27 6.38
Median 12.67 7.93 12.06 12.97 11.36 12.01 11.63 10.51 10.96 -11.63
Minimum 3.11 -46.62 3.85 -23.95 5.68 1.75 5.75 3.45 4.51 -11.63
Maximum 19.44 17.77 16.92 19.08 16.18 16.47 16.52 16.12 16.25 14.35
t-statistics 1.94*** 1.25 1.01 0.79 0.91
Asia Pacific Journal of Finance and Banking Research Vol. 5. No. 5. 2011.
D. K. Malhotra, Raymond Poteau, & Rahul Singh
25
Interest Income/Total Funds
Mean 8.04 7.22 7.74 8.32 8.05 8.81 8.73 9.72 9.12 10.26
Std. Dev 1.06 1.36 0.49 1.30 0.43 0.94 0.54 1.12 0.61 1.16
Median 8.26 7.57 7.68 8.26 7.93 8.67 8.79 9.57 9.11 8.81
Minimum 4.34 3.71 6.89 5.82 7.35 7.27 7.85 8.08 8.16 8.81
Maximum 9.19 8.98 8.80 10.90 8.91 10.58 9.99 11.70 10.46 12.50
t-statistics 2.02** -1.85*** -3.22* -3.49* -3.32*
Non-interest income/Total Funds
Mean 0.27 0.25 0.31 0.25 0.33 0.38 0.32 0.39 0.27 0.34
Std. Dev 0.15 0.16 0.18 0.19 0.25 0.32 0.20 0.31 0.16 0.34
Median 0.26 0.22 0.30 0.22 0.30 0.33 0.29 0.51 0.29 0.06
Minimum 0.04 0.04 0.05 0.01 0.01 0.03 0.05 0.02 0.04 0.06
Maximum 0.64 0.62 0.65 0.59 1.06 1.07 0.86 0.88 0.64 1.20
t-statistics 0.38 1.04 -0.60 -0.84 -0.75
Interest Expended/Total Funds
Mean 4.17 4.01 4.29 4.33 4.77 4.86 5.63 5.73 6.01 6.12
Std. Dev 0.31 1.08 0.48 0.58 0.49 0.63 0.53 0.75 0.61 0.68
Median 4.23 4.46 4.24 4.47 4.70 4.80 5.71 5.71 5.95 5.42
Minimum 3.40 0.93 3.63 3.09 3.92 3.86 4.86 4.36 4.90 5.42
Maximum 4.56 5.38 5.89 5.25 5.98 6.38 6.39 7.19 6.98 7.48
t-statistics 0.64 -0.21 -0.46 -0.46 1.73***
Return on Assets
Mean 0.08 0.07 0.84 0.62 0.85 0.85 0.90 0.94 0.89 0.85
Std. Dev 0.01 0.01 0.33 0.96 0.24 0.41 0.29 0.33 0.31 0.71
Median 0.08 0.08 0.91 0.98 0.80 0.90 0.93 1.04 0.93 -1.48
Minimum 0.04 0.04 0.32 -2.28 0.42 0.14 0.39 0.32 0.33 -1.48
Maximum 0.09 0.09 1.36 1.52 1.35 1.52 1.43 1.43 1.48 1.38
t-statistics 1.80*** 0.94 0.07 -0.36 0.91

Asia Pacific Journal of Finance and Banking Research Vol. 5. No. 5. 2011.
D. K. Malhotra, Raymond Poteau, & Rahul Singh
26
Interest Expended/Interest Earned
Mean 57.97 59.08 59.10 60.17 62.59 62.01 70.48 66.79 72.14 68.04
Std. Dev 8.95 9.82 8.76 8.12 7.53 8.43 6.85 8.45 6.36 7.68
Median 55.96 61.87 57.12 60.46 61.28 59.98 68.74 67.08 71.41 70.22
Minimum 49.80 39.52 51.31 43.11 52.20 46.15 61.20 48.32 61.81 50.46
Maximum 92.93 77.01 92.94 73.48 89.63 81.91 91.82 82.27 88.60 80.12
t-statistics -0.35 -.021 0.22 1.43 -0.54
Capital Adequacy
Mean 12.77 12.60 12.26 11.94 12.18 12.32 12.01 13.38 13.02 14.63
Std. Dev 1.67 2.49 1.22 1.91 0.98 1.28 0.92 3.32 0.87 2.70
Median 12.49 12.18 11.91 11.27 12.05 12.54 12.04 12.80 13.19 11.65
Minimum 9.21 9.09 10.62 9.66 10.40 9.77 10.09 9.21 11.37 11.65
Maximum 16.23 18.81 14.80 16.43 14.14 14.51 13.47 22.46 14.25 20.22
t-statistics 0.23 0.62 -0.35 -1.76*** -2.52*
Total Debt/Owners Funds
Mean 16.57 14.31 15.77 13.76 17.39 14.32 18.04 12.78 19.12 12.24
Std. Dev 5.38 6.61 5.37 5.51 6.47 5.07 6.70 6.52 7.03 5.98
Median 17.10 13.17 16.59 13.97 16.15 13.39 16.22 10.55 16.19 4.01
Minimum 2.58 3.06 4.08 5.08 6.95 6.62 10.74 4.57 12.81 4.01
Maximum 27.98 24.71 27.45 26.08 33.38 25.37 35.80 26.15 37.92 25.31
t-statistics 1.11 1.08 1.52 2.32** 3.05*
Asset Concentration
Mean 3.98% 1.36% 3.84% 1.55% 3.75% 1.66% 3.74% 1.68% 3.84% 1.55%
Std. Dev 4.88% 2.13% 4.48% 2.75% 4.09% 3.02% 4.15% 2.83% 4.56% 2.30%
Median 2.72% 0.79% 2.63% 0.73% 2.76% 0.70% 2.80% 0.72% 2.68% 0.13%
Minimum 0.64% 0.07% 0.65% 0.12% 0.57% 0.12% 0.54% 0.11% 0.52% 0.13%
Maximum 23.56% 8.59% 21.58% 10.98% 19.87% 12.09% 20.24% 11.21% 22.10% 8.69%
t-statistics 1.94*** 1.75*** 1.67*** 1.65*** 1.78***

Asia Pacific Journal of Finance and Banking Research Vol. 5. No. 5. 2011.
D. K. Malhotra, Raymond Poteau, & Rahul Singh
27
Deposit Concentration
Mean 4.06% 1.25% 3.91% 1.45% 3.84% 1.54% 3.85% 1.53% 3.96% 1.38%
Std. Dev 4.96% 1.62% 4.40% 2.29% 3.99% 2.54% 3.95% 2.25% 4.38% 1.78%
Median 2.93% 0.81% 2.79% 0.74% 2.84% 0.68% 2.83% 0.68% 2.87% 0.13%
Minimum 0.70% 0.04% 0.73% 0.14% 0.62% 0.14% 0.61% 0.13% 0.58% 0.13%
Maximum 23.78% 6.47% 21.07% 9.15% 19.21% 10.17% 19.25% 8.76% 21.30% 6.27%
t-statistics 2.11** 1.97** 1.96** 2.03** 2.14**
Loan Concentration
Mean 3.95% 1.40% 3.85% 1.54% 3.81% 1.59% 3.81% 1.59% 3.90% 1.47%
Std. Dev 4.39% 2.36% 4.33% 2.88% 4.20% 2.93% 4.11% 2.71% 4.36% 2.22%
Median 2.71% 0.92% 2.83% 0.74% 2.83% 0.67% 2.86% 0.70% 2.79% 0.12%
Minimum 0.66% 0.08% 0.62% 0.13% 0.58% 0.11% 0.52% 0.10% 0.46% 0.12%
Maximum 21.11% 9.54% 20.82% 11.63% 20.33% 11.80% 20.02% 10.84% 21.07% 8.48%
t-statistics 2.03** 1.78*** 1.75** 1.81*** 1.97**
Net Interest Income/Total Funds
Mean 3.87 3.21 3.45 3.99 3.28 3.95 3.09 3.99 3.11 4.13
Std. Dev 0.89 1.12 0.63 1.45 0.62 1.07 0.67 1.24 0.66 1.14
Median 4.04 3.12 3.53 3.78 3.26 3.86 3.25 3.62 3.15 2.85
Minimum 0.94 1.67 1.65 2.16 1.37 1.74 1.56 1.96 1.58 2.85
Maximum 5.00 5.62 4.71 6.84 4.18 6.22 4.00 6.66 4.34 6.86
t-statistics 1.94*** -1.51 -2.35** -2.75* -3.33*
Asia Pacific Journal of Finance and Banking Research Vol. 5. No. 5. 2011.
D. K. Malhotra, Raymond Poteau, & Rahul Singh
28
Deposit Concentration
Mean 4.06% 1.25% 3.91% 1.45% 3.84% 1.54% 3.85% 1.53% 3.96% 1.38%
Std. Dev 4.96% 1.62% 4.40% 2.29% 3.99% 2.54% 3.95% 2.25% 4.38% 1.78%
Median 2.93% 0.81% 2.79% 0.74% 2.84% 0.68% 2.83% 0.68% 2.87% 0.13%
Minimum 0.70% 0.04% 0.73% 0.14% 0.62% 0.14% 0.61% 0.13% 0.58% 0.13%
Maximum 23.78% 6.47% 21.07% 9.15% 19.21% 10.17% 19.25% 8.76% 21.30% 6.27%
t-statistics 2.11** 1.97** 1.96** 2.03** 2.14**
Loan Concentration
Mean 3.95% 1.40% 3.85% 1.54% 3.81% 1.59% 3.81% 1.59% 3.90% 1.47%
Std. Dev 4.39% 2.36% 4.33% 2.88% 4.20% 2.93% 4.11% 2.71% 4.36% 2.22%
Median 2.71% 0.92% 2.83% 0.74% 2.83% 0.67% 2.86% 0.70% 2.79% 0.12%
Minimum 0.66% 0.08% 0.62% 0.13% 0.58% 0.11% 0.52% 0.10% 0.46% 0.12%
Maximum 21.11% 9.54% 20.82% 11.63% 20.33% 11.80% 20.02% 10.84% 21.07% 8.48%
t-statistics 2.03** 1.78*** 1.75** 1.81*** 1.97**
Net Interest Income/Total Funds
Mean 3.87 3.21 3.45 3.99 3.28 3.95 3.09 3.99 3.11 4.13
Std. Dev 0.89 1.12 0.63 1.45 0.62 1.07 0.67 1.24 0.66 1.14
Median 4.04 3.12 3.53 3.78 3.26 3.86 3.25 3.62 3.15 2.85
Minimum 0.94 1.67 1.65 2.16 1.37 1.74 1.56 1.96 1.58 2.85
Maximum 5.00 5.62 4.71 6.84 4.18 6.22 4.00 6.66 4.34 6.86
t-statistics 1.94*** -1.51 -2.35** -2.75* -3.33*

Asia Pacific Journal of Finance and Banking Research Vol. 5. No. 5. 2011.
D. K. Malhotra, Raymond Poteau, & Rahul Singh
29
Total Income/Capital Employed
Mean 8.31 7.47 8.05 8.57 8.38 9.19 9.04 10.11 9.39 10.57
Std. Dev 1.07 1.42 0.46 1.26 0.47 0.86 0.53 1.08 0.61 1.10
Median 8.55 7.81 8.00 8.48 8.33 9.20 8.99 10.00 9.48 8.92
Minimum 4.51 3.77 7.33 6.19 7.57 7.41 8.07 8.60 8.51 8.92
Maximum 9.58 9.61 9.01 10.92 9.52 10.62 10.14 11.86 10.60 12.50
t-statistics 2.01** -1.71*** -3.59* -1.17 -0.79
Efficiency
Mean 40.16% 43.98% 38.63% 40.23% 34.31% 36.58% 27.79% 31.97% 26.74% 31.60%
Std. Dev 8.22% 18.64% 7.60% 11.68% 6.33% 9.12% 4.35% 8.89% 4.02% 9.91%
Median 42.28% 41.35% 39.32% 37.75% 36.10% 35.23% 27.95% 30.75% 27.06% 11.12%
Minimum 12.34% 11.00% 16.51% 13.26% 14.53% 12.86% 17.17% 11.90% 14.82% 11.12%
Maximum 49.85% 83.22% 50.54% 67.35% 42.35% 49.07% 33.75% 47.43% 31.96% 52.98%
t-statistics -0.82 -0.49 -0.87 -1.84*** -2.00**
Asset Utilization
Mean 4.61 3.21 4.54 3.78 4.86 4.45 5.24 5.28 5.38 5.59
Std. Dev 1.21 1.55 0.97 1.56 1.25 1.58 1.77 2.48 1.74 2.60
Median 4.72 2.89 4.58 3.81 5.26 4.52 5.04 5.52 4.90 2.29
Minimum 1.28 1.53 2.31 1.95 1.81 2.26 2.35 1.78 3.27 2.29
Maximum 6.29 7.67 6.48 7.83 6.33 4.45 7.60 11.96 8.64 12.44
t-statistics 3.63* 1.76*** 0.87 -0.02 0.55
Return on Equity (ROE)
Mean 19.93 5.53 16.05 8.67 17.33 14.86 18.61 13.31 18.54 12.36
Std. Dev 7.98 23.04 6.24 16.95 5.95 7.44 4.04 4.78 4.20 8.89
Median 21.22 12.45 16.11 14.01 17.07 14.00 18.14 13.83 19.05 15.32
Minimum 7.06 -66.51 8.04 -46.90 5.16 2.95 10.72 6.14 11.31 -16.44
Maximum 35.66 25.79 28.55 22.99 29.11 28.83 25.35 21.75 25.51 18.70
t-statistics 2.60* 1.80** 1.20 3.55* 2.74*
Asia Pacific Journal of Finance and Banking Research Vol. 5. No. 5. 2011.
D. K. Malhotra, Raymond Poteau, & Rahul Singh
30
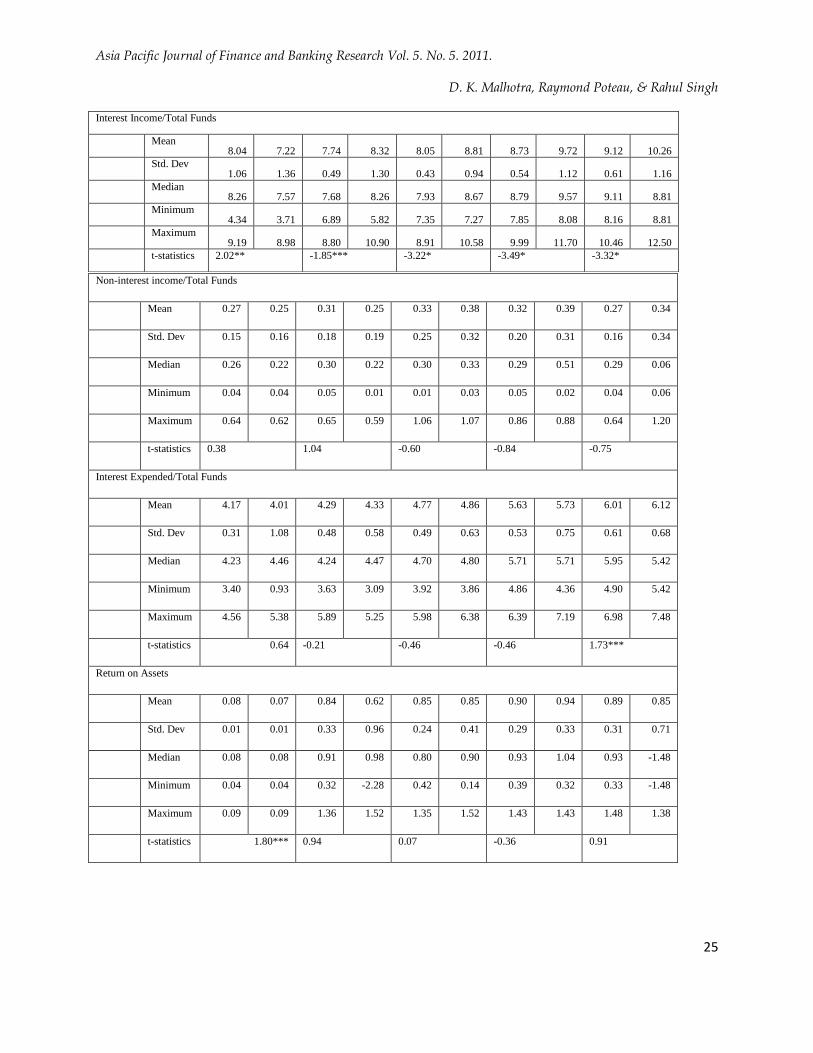
Average net profit margin for public sector banks has declined from 12.31 percent in 2005 to 10.61 percent in 2009. Average net profit margin for private sector banks has gone up substantially from 4.63 percent in 2005 to 9.10 percent in 2009. Net profit margin on an average is higher for public sector banks over private sector banks, but the difference is not statistically significant except for the year 2005. Also, the average difference in the net profit margin of public and private sector banks is shrinking rapidly. In 2005, the average difference in the net profit margin of public and private sector banks is 7.68 percent in favor of public sector banks. In 2009, the same difference has gone down to 1.51 percent in favor of public sector banks. Interest income as a percentage of total funds has increased slightly for public sector banks from 8.04 percent in 2005 to 9.12 percent in 2009. For private sector banks, interest income as a percentage of total funds increased from 7.22 percent in 2005 to 10.26 percent in 2009. Furthermore, on an average, interest income as a percentage of total funds is higher for public sector banks in 2005 and the difference is statistically significant. However, after 2005, interest income as a percentage of total funds is higher for private sector banks and the gap is statistically significant in favor of private sector banks. Non-interest income, which measures sources of income other than lending, has remained at a stable level of 0.27 percent of total funds for public sector banks. On the other hand, private sector banks are tapping into other sources of income and the non-interest income as a percentage of total funds has gone up from 0.25 percent in 2005 to 0.34 percent in 2009. However, the difference between public and private sector banks is not statistically significant. Average net interest income as a percentage of total funds is a measure of the cost of intermediation and its shows a decline for public sector banks till the year 2008. In 2009, there is only a small increase in the average net interest income for public sector banks. Private sector banks show a consistent increase every year. Private sector banks show a higher average net interest income in comparison to public sector banks in four out of five years in the sample and the difference is statistically significant in these years. Interest expended reflects the cost of obtaining the funds that the banks will use for lending purposes and it will have a direct impact on the profitability of banks. Interest expended as a percentage of total funds has risen for both public and private sector banks since 2005, but the increase has been higher for private sector banks in comparison to public sector banks. However, there is no statistical difference between public and private sector banks so far as the cost of obtaining the funds is concerned. Although there is no statistically significant difference in the return on assets of public and private sector banks throughout the sample period, but the average return on assets of both public and private sector banks shows a considerable improvement. For private sector banks, return on assets has improved from a low 0.07 percent in 2005 to a high of 0.94 percent in 2008. For public sector banks, return on assets jumped from 0.08 percent
Asia Pacific Journal of Finance and Banking Research Vol. 5. No. 5. 2011.
D. K. Malhotra, Raymond Poteau, & Rahul Singh
31
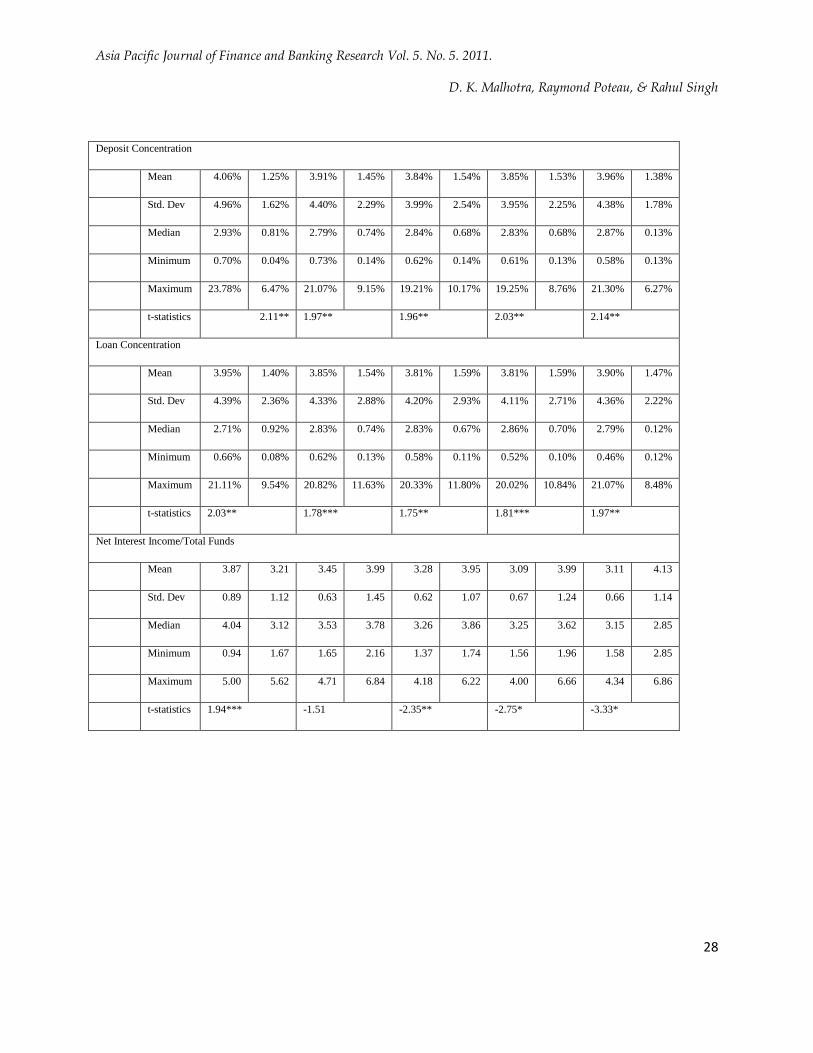
in 2005 to 0.89 percent in 2009. Asset utilization, on an average, is better for public sector banks over private sector banks for the years 2005 to 2007 and the difference is statistically significant also for the years 2005 and 2006. However, beginning with 2008, asset utilization, on an average, is better for private sector banks. However, the difference in asset utilization between public and private sector banks is not statistically significant from 2007 through 2009. Interest expended as a percentage of interest earned is another measure of the cost of obtaining the funds needed for lending purposes. A high ratio is an indication that bank finds it difficult to attract low cost deposits. It can also be an indication that the bank is unable to make more profitable loans and the net profit margin will be low. This ratio has steadily gone up for public and private sector banks since 2005, which means competition among banks as well as other investment alternatives is raising the cost of obtaining funds for lending purposes. There is no statistically significant difference for this ratio for public and private sector banks. Capital adequacy is used as a measure of bank’s soundness. The average capital adequacy ratio shows a decline for both public and private sector banks in 2006 over 2005. Since 2006, the average capital adequacy ratio has steadily gone up for private sector banks and has been higher than for the public sector banks and the difference is statistically significant in 2008 and 2009. The debt to equity ratio measured by total debt to owners’ funds has gone up on an average for public sector banks from 16.57 percent in 2005 to 19.12 percent in 2009. However, for private sector banks, this ratio has declined from 14.31 percent in 2005 to 12.24 percent in 2009 due to an increase in the capital adequacy ratio for private sector banks. The difference in the total debt-to-owners funds ratio for public and private sector banks is statistically significant in favor of public sector banks for the years 2008 and 2009. On an average, the share of public sector banks in total assets has steadily declined from 3.98 percent in 2005 to 3.84 percent in 2009. Average share of private sector banks has gone up from 1.36 percent in 2005 to 1.55 percent in 2009. Asset concentration is still statistically significantly higher in public sector banks over private sector banks in each of the five years in the sample. There is a statistically significantly higher deposit concentration in public sector banks over private sector banks for each of the five years. Deposit concentration in public sector banks declined from 2005 to 2008, but in 2009 deposit concentration in public sector banks increased again. Deposit concentration in private sector banks was steadily rising till the year 2008. In 2009, there is big drop in the average deposit share of private sector banks. The economic crisis has shaken the confidence of depositors in private sector banks. Loan concentration is also higher for public sector banks over private sector banks for each of the five years and the difference is statistically significant. Average loan share of public sector banks declined till the year 2008. In 2009, loan share of public
Asia Pacific Journal of Finance and Banking Research Vol. 5. No. 5. 2011.
D. K. Malhotra, Raymond Poteau, & Rahul Singh
32
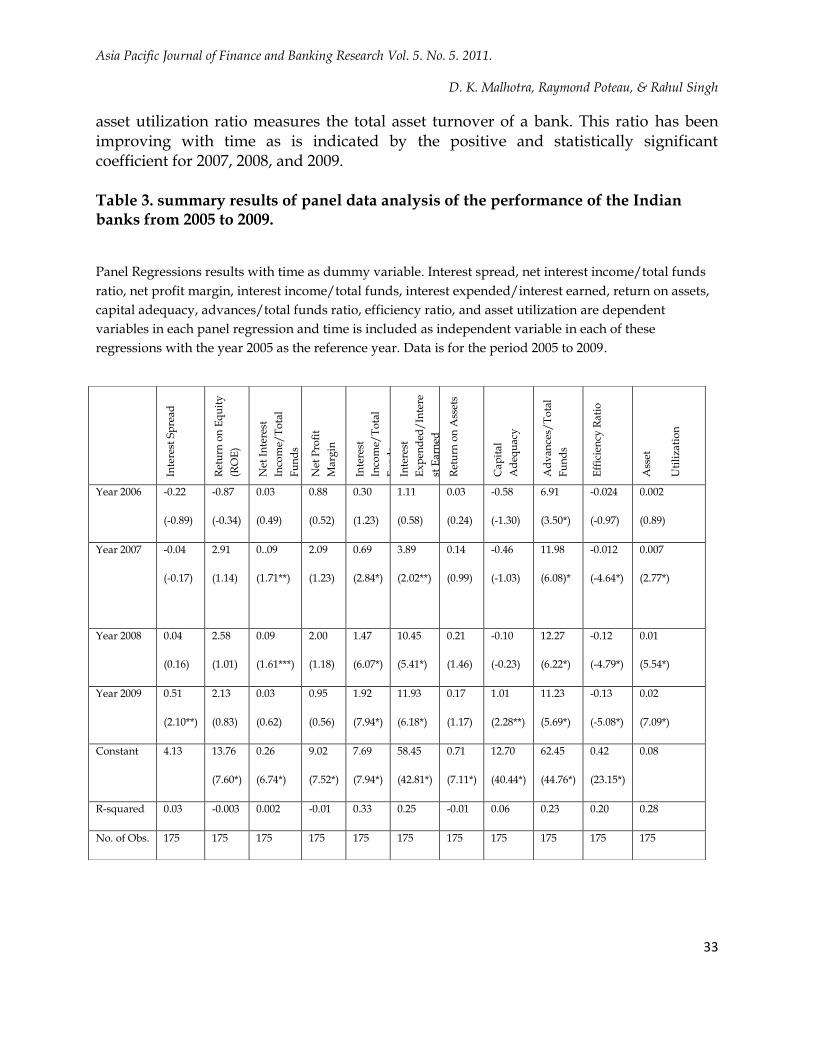
sector banks shows an increase, but it is still lower than their share in the total loans in 2005. Similarly, private sector banks show a decline in their loan share in 2009 over 2008, but the loan share in 2009 is still higher the loan shares in 2005. Operating efficiency shows the non-interest expense as a proportion of total revenue of a bank. A high ratio indicates inefficiency and a low ratio means efficiency in managing the operations of a bank. Public sector banks show a consistent improvement in efficiency with a declining average efficiency ratio. The average efficiency ratio shows a decline from 40.16 percent in 2005 to 26.74 percent in 2009. It shows a considerable decline in non-interest expense relative to revenue over a period of five years. Private sector banks also show an improvement in operating efficiency and the ratio of non-interest expense to revenue has also declined in their case too, but the private sector banks’ ratio is still higher than the public sector banks’ ratio in each of the five years and the difference is statistically significant in 2008 and 2009. It means that public sector banks are operating more efficiently by keeping their non interest expense down. In order to evaluate the trends in profitability, cost of intermediation, efficiency, and industry concentration and composition, we also use panel data analysis. As shown in Table 3 above, return on equity (ROE) has not changed in a statistically significant manner over time. Interest spread shows a small decline in 2006 and 2007, but the coefficient on interest spread becomes positive in the year 2008 and 2009. For the year 2009, the positive interest spread coefficient is statistically significant at the 5-percent rejection level. The net interest income to total funds ratio has a positive coefficient for every year and is statistically significant for the years 2007 and 2008, which means net interest income as a percentage of total funds has increased over time. Net profit margin also shows an increase over time, but none of the coefficients for time is statistically significant. Interest income as a percentage of total funds has also gone up and the positive coefficients on time variable are statistically significant for the years 2007, 2008, and 2009. The interest expended to interest earned ratio is also rising with time for the Indian banks with positive and statistically significant coefficients for the years 2007, 2008, and 2009. Thus, the cost of obtaining funds relative to the earnings on those funds is rising for the Indian banking industry. The coefficient on capital adequacy ratio is positive and statistically significant for the year 2009, a reflection of the regulators’ concern with bank safety by requiring higher capital to ensure financial soundness of the banks. The advances to funds ratio is a measure of the liquidity of the banking system. A higher ratio indicates less liquidity, because most of the available funds are tied up in loans. The advances to funds ratio has been rising as is reflected by the positive and statistically significant coefficients for the years 2006, 2007, 2008, and 2009. The efficiency ratio measures the extent to which a bank has been able to control its non-interest expenses. A low ratio is an indicator of operating efficiency. Coefficients on efficiency variable show that this ratio has been declining every year and the decline has been statistically significant for the years 2007, 2008, and 2009. The
Asia Pacific Journal of Finance and Banking Research Vol. 5. No. 5. 2011.
D. K. Malhotra, Raymond Poteau, & Rahul Singh
33
asset utilization ratio measures the total asset turnover of a bank. This ratio has been improving with time as is indicated by the positive and statistically significant coefficient for 2007, 2008, and 2009. Table 3. summary results of panel data analysis of the performance of the Indian banks from 2005 to 2009.
Panel Regressions results with time as dummy variable. Interest spread, net interest income/total funds
ratio, net profit margin, interest income/total funds, interest expended/interest earned, return on assets,
capital adequacy, advances/total funds ratio, efficiency ratio, and asset utilization are dependent
variables in each panel regression and time is included as independent variable in each of these
regressions with the year 2005 as the reference year. Data is for the period 2005 to 2009.
Inte
rest
Sp
read
Ret
urn
on
Eq
uit
y
(RO
E)
Net
In
tere
st
Inco
me/
To
tal
Fu
nd
s
Net
Pro
fit
Ma
rgin
Inte
rest
Inco
me/
To
tal
Fu
nd
s In
tere
st
Ex
pen
ded
/In
tere
st E
arn
ed
Ret
urn
on
Ass
ets
Ca
pit
al
Ad
equ
acy
Ad
van
ces/
To
tal
Fu
nd
s
Eff
icie
ncy
Ra
tio
Ass
et
Uti
liza
tio
n
Year 2006 -0.22
(-0.89)
-0.87
(-0.34)
0.03
(0.49)
0.88
(0.52)
0.30
(1.23)
1.11
(0.58)
0.03
(0.24)
-0.58
(-1.30)
6.91
(3.50*)
-0.024
(-0.97)
0.002
(0.89)
Year 2007 -0.04
(-0.17)
2.91
(1.14)
0..09
(1.71**)
2.09
(1.23)
0.69
(2.84*)
3.89
(2.02**)
0.14
(0.99)
-0.46
(-1.03)
11.98
(6.08)*
-0.012
(-4.64*)
0.007
(2.77*)
Year 2008 0.04
(0.16)
2.58
(1.01)
0.09
(1.61***)
2.00
(1.18)
1.47
(6.07*)
10.45
(5.41*)
0.21
(1.46)
-0.10
(-0.23)
12.27
(6.22*)
-0.12
(-4.79*)
0.01
(5.54*)
Year 2009 0.51
(2.10**)
2.13
(0.83)
0.03
(0.62)
0.95
(0.56)
1.92
(7.94*)
11.93
(6.18*)
0.17
(1.17)
1.01
(2.28**)
11.23
(5.69*)
-0.13
(-5.08*)
0.02
(7.09*)
Constant 4.13 13.76
(7.60*)
0.26
(6.74*)
9.02
(7.52*)
7.69
(7.94*)
58.45
(42.81*)
0.71
(7.11*)
12.70
(40.44*)
62.45
(44.76*)
0.42
(23.15*)
0.08
R-squared 0.03 -0.003 0.002 -0.01 0.33 0.25 -0.01 0.06 0.23 0.20 0.28
No. of Obs. 175 175 175 175 175 175 175 175 175 175 175
Asia Pacific Journal of Finance and Banking Research Vol. 5. No. 5. 2011.
D. K. Malhotra, Raymond Poteau, & Rahul Singh
34
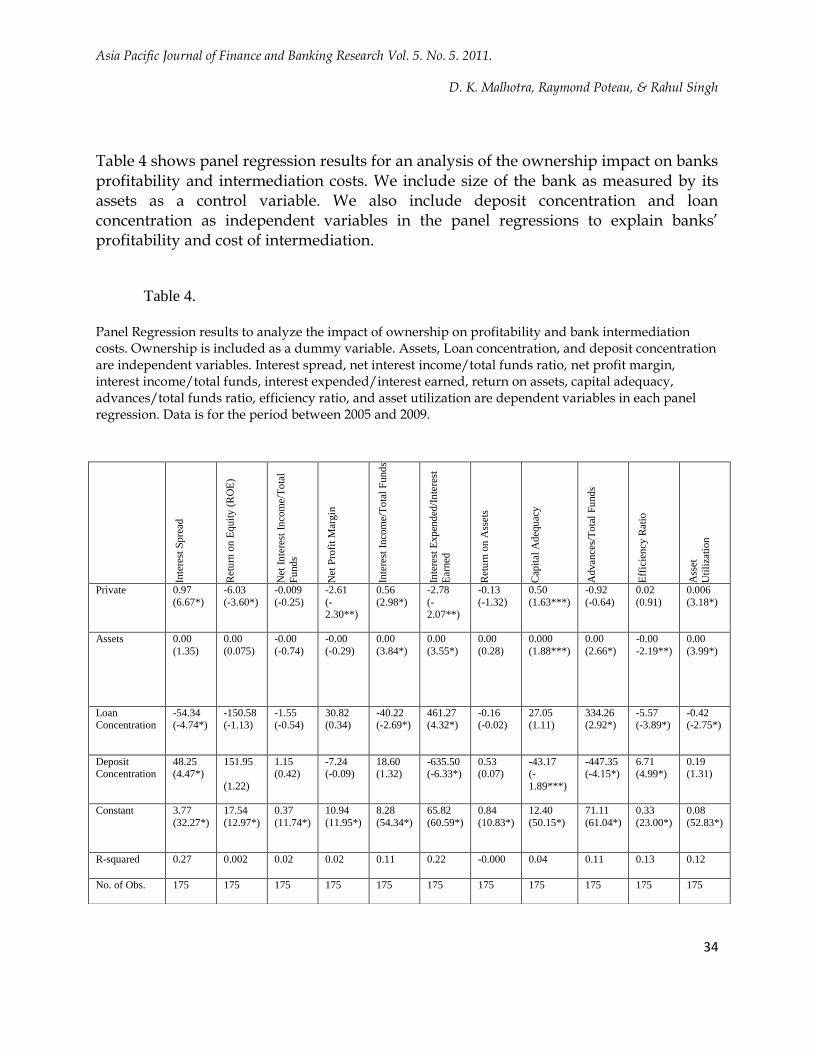
Table 4 shows panel regression results for an analysis of the ownership impact on banks profitability and intermediation costs. We include size of the bank as measured by its assets as a control variable. We also include deposit concentration and loan concentration as independent variables in the panel regressions to explain banks’ profitability and cost of intermediation.
Table 4.
Panel Regression results to analyze the impact of ownership on profitability and bank intermediation costs. Ownership is included as a dummy variable. Assets, Loan concentration, and deposit concentration are independent variables. Interest spread, net interest income/total funds ratio, net profit margin, interest income/total funds, interest expended/interest earned, return on assets, capital adequacy, advances/total funds ratio, efficiency ratio, and asset utilization are dependent variables in each panel regression. Data is for the period between 2005 and 2009.
Inte
rest
Sp
read
Ret
urn
on E
quit
y (
RO
E)
Net
In
tere
st I
nco
me/
To
tal
Fu
nd
s
Net
Pro
fit
Mar
gin
Inte
rest
In
com
e/T
ota
l F
und
s
Inte
rest
Exp
end
ed/I
nte
rest
Ear
ned
Ret
urn
on A
sset
s
Cap
ital
Adeq
uac
y
Ad
van
ces/
To
tal
Fu
nd
s
Eff
icie
ncy
Rat
io
Ass
et
Uti
liza
tion
Private 0.97
(6.67*)
-6.03
(-3.60*)
-0.009
(-0.25)
-2.61
(-2.30**)
0.56
(2.98*)
-2.78
(-2.07**)
-0.13
(-1.32)
0.50
(1.63***)
-0.92
(-0.64)
0.02
(0.91)
0.006
(3.18*)
Assets
0.00
(1.35)
0.00
(0.075)
-0.00
(-0.74)
-0.00
(-0.29)
0.00
(3.84*)
0.00
(3.55*)
0.00
(0.28)
0.000
(1.88***)
0.00
(2.66*)
-0.00
-2.19**)
0.00
(3.99*)
Loan Concentration
-54.34 (-4.74*)
-150.58 (-1.13)
-1.55 (-0.54)
30.82 (0.34)
-40.22 (-2.69*)
461.27 (4.32*)
-0.16 (-0.02)
27.05 (1.11)
334.26 (2.92*)
-5.57 (-3.89*)
-0.42 (-2.75*)
Deposit Concentration
48.25 (4.47*)
151.95
(1.22)
1.15 (0.42)
-7.24 (-0.09)
18.60 (1.32)
-635.50 (-6.33*)
0.53 (0.07)
-43.17 (-
1.89***)
-447.35 (-4.15*)
6.71 (4.99*)
0.19 (1.31)
Constant 3.77
(32.27*)
17.54
(12.97*)
0.37
(11.74*)
10.94
(11.95*)
8.28
(54.34*)
65.82
(60.59*)
0.84
(10.83*)
12.40
(50.15*)
71.11
(61.04*)
0.33
(23.00*)
0.08
(52.83*)
R-squared 0.27 0.002 0.02 0.02 0.11 0.22 -0.000 0.04 0.11 0.13 0.12
No. of Obs. 175 175 175 175 175 175 175 175 175 175 175

Asia Pacific Journal of Finance and Banking Research Vol. 5. No. 5. 2011.
D. K. Malhotra, Raymond Poteau, & Rahul Singh
35
Table 4 shows that private banks have a lower return on equity and a lower net
profit margin in comparison to public sector banks. Private sector banks also report a higher interest expended to interest earned ratio and this may partially explain their lower profit margin also. Private sector banks also have a higher interest rate spread and a higher interest income as a percentage of total funds. The asset utilization rate for the private sector banks is also higher in comparison to the public sector banks. Size of a bank as measured by its total assets is statistically significant in explaining interest income as a percentage of total funds, the interest expended to interest earned ratio, the capital adequacy ratio, the advances to total funds ratio, the efficiency ratio, and the asset utilization ratio. Larger banks have a higher interest income as a percentage of total funds, but they also have a higher interest expended to interest earned ratio. The asset utilization rate of larger banks is higher. Also, larger banks are less liquid, because size is positively related to the advances to total funds ratio. Size of a bank improves its operating efficiency by bringing down non-interest cost. The size coefficient on the efficiency ratio is negative, which means larger banks are able to reduce non-operating expenses. The coefficient on loan concentration is statistically significant and negative in explaining interest spread, interest income as a percentage of total funds, the efficiency ratio, and the asset utilization rate. Therefore, a higher loan concentration results in the following:
Lower interest income as a percentage of total funds Lower asset utilization Lower non-operating expenses Lower interest spread Higher interest expense to interest earned ratio Higher advances to total funds ratio A higher deposit concentration results in the following: Higher interest spread Lower interest expended to interest earned ratio Lower capital adequacy ratio Lower advances to total funds ratio, and Higher efficiency ratio, which means non-interest expenses are higher.
VI. SUMMARY AND CONCLUSIONS
The economic crisis that started in 2007 with the banking and finance world of the United States shook the entire world and the financial markets in general and the banking sector in particular is still trying to recover from this economic tsunami. In this paper, we analyze the performance of commercial banks in India during the period 2005 to 2009. This period covers the pre-credit crisis and crisis time period. The study focuses on the impact of the current economic crisis on safety and soundness of the
Asia Pacific Journal of Finance and Banking Research Vol. 5. No. 5. 2011.
D. K. Malhotra, Raymond Poteau, & Rahul Singh
36
public and private sector banks in India. We focus on analyzing the impact of the current economic crisis on the determinants of bank intermediation costs and profitability. Our analysis shows that the Indian banking sector remained relatively healthy during the current economic crisis and the performance of the banks was not impacted negatively in a significant manner. Both public and private sector banks show healthy capital adequacy ratios throughout the sample period. Our results also point out the changing face of the Indian banking industry. Although the banking sector was opened up only after 1991 reforms, we find that competition in the Indian banking industry has intensified. While the net interest margin has improved, cost of intermediation is actually rising and banks are responding to the increased costs with higher efficiency levels. REFERENCES
1. Bodla, B. and R. Verma, (2007), “Determinants of profitability of banks in India: a
multivariate analysis,” Journal of Services Research, Vol. 7, Iss. 1, 75-87.
2. Cole, R., Moshirian, F., and Q. Wu, (2008), “Bank stock returns and economic growth,”
Journal of Banking & Finance, Vol. 32, Iss. 6, 995-1007.
3. Dash, M. and C. Charles, (2009), “A study of technical efficiency of banks in India,”
SSRN Working Paper Series. Rochester, NY.
4. Debnath, R. and R. Shankar, (2008), “Measuring performance of Indian banks: An
Application of Data Envelopment Analysis,” International Journal of Business
Performance Management, Vol. 10, Iss. 1, 57-85.
5. Gormley, T. (2010), "The impact of foreign bank entry in emerging markets: evidence
from India,” Journal of Financial Intermediation. San Diego: Jan 2010. Vol. 19, Iss. 1,
26-51.
6. Kumbhakar, S. and S. Sarkar, (2003), “Deregulation, ownership, and productivity growth
in the banking industry: evidence from India,” Journal of Money, Credit, and
Banking.Vol. 35, Iss. 3, 403-424.
7. Oja, Erik, (2009), Banking Industry Surveys, Standard and Poor’s, New York, NY.
8. Reddy, A. (2009), “Banking sector performance during liberalization in India - a review,”
SSRN Working Paper Series, Rochester, NY.
9. Rezvanian, R., N. Rao, and S. Mehdian, (2008), “Efficiency change, technological
progress and productivity growth of private, public and foreign banks in India: evidence
from the post-liberalization era,” Applied Financial Economics,Vol. 18, Iss. 9, 701-713.

Asia Pacific Journal of Finance and Banking Research Vol. 5. No. 5. 2011.
D. K. Malhotra, Raymond Poteau, & Rahul Singh
37
10. Sensarma, R. (2008), “Deregulation, ownership and profit performance of banks:
evidence from India,” Applied Financial Economics,Vol. 18, Iss. 19, 1581-1595.
11. Shangmugam, K. and A. Das, (2004), “Efficiency of indian commercial banks during the
reform period,” Applied Financial Economics, Vol. 14, Iss. 9, 681-686.
12. Singh, G. and Munisamy, S. (2008), “Would its Past Reflect its Future Performance:
Indian Banks?,” The Business Review, Vol. 10, Iss. 2, 229-236.
13. Vidyakala, K., S Madhuvanthi, and S Poornima, (2009), “Recession in indian banking
sector,” SSRN Working Paper Series. Rochester, NY.
14. Zhao, T., B. Casu, and A. Ferrari, (2008), “Deregulation and productivity growth: a study
of the Indian commercial banking industry,” International Journal of Business
Performance Management,Vol. 10, Iss. 4, 318-343.
15. Zhao, T., B. Casu, and A. Ferrari (2010), “The impact of regulatory reforms on cost
structure, ownership and competition in Indian banking,” Journal of Banking & Finance,
Vol. 34, Iss. 1, 246-254.