evaluation and application of air quality model system in shanghai
DESCRIPTION
Evaluation and Application of Air Quality Model System in Shanghai. Qian Wang 1 , Qingyan Fu 1 , Yufei Zou 1 , Yanmin Huang 1 , Huxiong Cui 1 , Junming Zhao 1 , Qi Chen 2 1.Shanghai environmental monitoring center 2.Shanghai Environmental Protection Bureau. - PowerPoint PPT PresentationTRANSCRIPT

Evaluation and Application of Air Quality
Model System in Shanghai
Qian Wang1, Qingyan Fu1, Yufei Zou1 , Yanmin Huang1,
Huxiong Cui1 , Junming Zhao1 , Qi Chen2
1.Shanghai environmental monitoring center
2.Shanghai Environmental Protection Bureau
The 3rd International Workshop on Air Quality Forecast Research
Nov 29-Dec 1,2011

Outline
2
Model application3
1 Introduction
Model performance
4 Future plan

Background-air quality during Shanghai Expo
0%
20%
40%
60%
80%
100%
2001年 2002年 2003年 2004年 2005年 2006年 2007年 2008年 2009年 2010年
各级天数比例(5-10月)
五级
四级
三级
二级
一级
Attainment ratio is 98.4%, which is 2.7% higher than in 2009.
181 days with excellent and good air quality
The average concentration of PM10, SO2 and NO2 during the expo in 2010 is the
lowest.
Comparing to the other 8 cities in YRD, the attainment ratio of air quality in Shanghai
is the second highest.

Continuous “Excellent” air quality for 17 days in July
7月 12日(40)
7月 13日(48)
7月 14日(33)
7月 15日(32)
7月 16日 (50)
7月 17日(32)
7月 18日(35)
7月 19日(39)
7月 20日(24)
7月 21日(50)
7月 22日(32)
7月 26日(22)
7月 27日(16)
7月 28日(36)
(Air Pollution Index)

Air quality model system
Same domain setting
Same emission inventory
Operational run

Emission inventory in model
Trace-P Asia emission inventory in 2006
Shanghai emission inventory in 2007
Power plant emission inventory in YRD in 2007
Gridded emission inventory in model
system SMOKE

2006年 2007年
Update of point source EI in 2007


Outline
2
Model application3
1 Introduction
Model performance
4 Future plan

Model Parameter
Number
MeanSim
MeanObs corr MB
NMB(%)
NME(%) RMSE
MM5
T 3978 24.65 25.05 0.86 -0.40 -1.59 9.63 3.13
WS 3978 2.51 3.70 0.33 -1.19 -32.07 46.48 2.19
RH 3978 70.80 72.03 0.55 -1.23 -1.71 16.87 15.73
PRE 3978 1011.84 1010.43 0.91 1.41 0.14 0.23 2.91
WRF
T 3347 23.58 25.05 0.93 -1.46 -5.84 8.16 2.48
WS 3347 4.42 3.70 0.54 0.72 19.41 39.02 1.89
RH 3347 77.17 72.03 0.76 5.14 7.13 12.65 11.51
PRE 3347 1005.91 1010.43 0.96 -4.51 -0.45 0.44 4.75
the correlation coefficient of T, Rh ,Pre simulation and observation is
above 0.7.
MM5 and WRF could well predict the hourly variation of major
elements.
Meteorological simulation evaluation
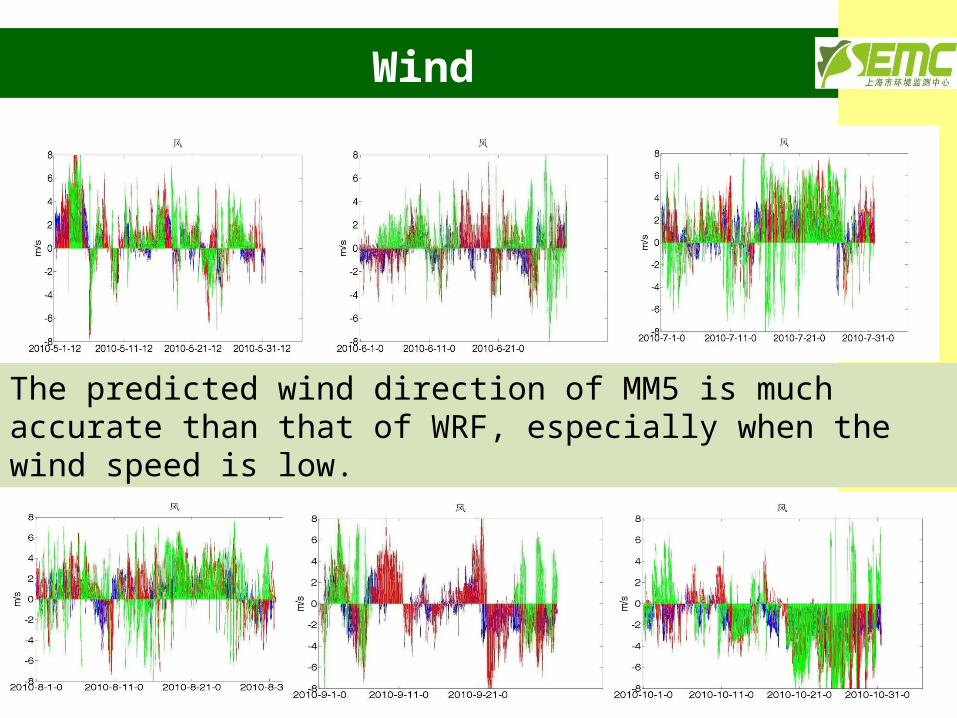
The predicted wind direction of MM5 is much accurate than that of WRF, especially when the wind speed is low.
Wind

Air quality forecast evaluation-1
Model system well predicts the daily variation of PM10,SO2 andNO2 in
shanghai.

Air quality forecast evaluation-2Model
Parameter
Number
MeanSim
MeanObs
MBNMB(%)
NME(%) RMSE
NAQPMS PM10 180 0.077 0.058 0.019 32.15 51.40 0.035 SO2 180 0.044 0.021 0.023 107.25 110.39 0.027 NO2 180 0.053 0.041 0.012 29.93 50.26 0.024 PM2.5 180 0.034 0.039 -0.005 -12.99 37.78 0.020
CAMx PM10 179 0.063 0.058 0.005 7.93 36.62 0.029 SO2 179 0.032 0.021 0.011 50.11 56.57 0.016 NO2 179 0.037 0.041 -0.004 -8.80 28.67 0.015 PM2.5 179 0.036 0.039 -0.003 -8.55 34.07 0.019
CMAQ4.4
PM10 180 0.073 0.058 0.015 25.15 43.19 0.033
SO2 180 0.050 0.021 0.028 131.94 132.17 0.035 NO2 180 0.047 0.041 0.006 15.07 32.17 0.016 PM2.5 180 0.037 0.039 -0.001 -3.80 35.99 0.019
CMAQ4.6
PM10 165 0.051 0.058 -0.007 -12.03 40.40 0.030
SO2 165 0.041 0.021 0.020 91.46 98.75 0.028 NO2 165 0.057 0.041 0.016 39.66 47.68 0.024 PM2.5 165 0.035 0.039 -0.004 -10.98 44.42 0.023
WRF-Chem
PM10 143 0.084 0.058 0.026 44.73 54.01 0.038
SO2 143 0.041 0.021 0.019 89.70 87.68 0.024 NO2 143 0.054 0.041 0.013 30.58 38.00 0.018 PM2.5 143 0.052 0.039 0.013 33.66 50.32 0.024
cvcv
cvcvc
cvcv
cvcv
cvcv
cvcvc
cvcvc
cvcvc
cvcvc
PM10、 NO2、 SO2 -over predicted, PM2.5-under predicted——PM2.5、 NH3
emission sources is under predicted, SO2 emission sources is over
predicted.

Outline
2
Model improvement3
1 Introduction
Model performance
4 Future plan

dust storm observed from space (MODIS 2011/04/29 ) regional haze & biomass burning (MODIS 2011/10/07 )
Dust Storm Regional Haze &
Biomass Burning
Only anthropogenic emissions are quantified (with great uncertainty) in our operational EMS
Dust & Biomass Burning emission are missing!
Difficulties in air quality model forecast

DMSIngest/import dataQC automaticallyQC manuallyCalculate dataGenerate reports
SEMC_DMSSEMC_IMS
SEMC_DMC
IMSMapperDispatcherInfo services
Meteorological info
download
Numerical forecasting interface
Daily report operation platform
Information release system
CSV
Ensemble Model System
AIRNow-I
Air quality forecasting subsystem
Data import and integration subsystem
Daily report operation and publishing subsystem
Two Independent Subsystems ?
No Interactions in Current Framework!
Air Quality Monitoring Network
Defect in current system framework

where,
EnKF formula:
Initial InputInitial Condition;Boundary Condition;Emissions
EnKF-PCT System
CAMxForward Model
Observations
Meteorology
MM5
Updated Chemical Field
PCT Analysis
EnKF Update
(First Guess)
( Assimilated)
Quality Control
Model Uncertainty Quantification/ApportionmentImproved Forecast;
National/Regional Monitoring Network
Offline Coupling
(Jia Li, Dongbin Xiu, JCP, 2009)
Gain MatrixPerturbed observation
Ensemble Forecast Analysis
Ens
embl
e M
embe
rs
Forward Model
Data assimilation scheme

National control sites
City control sites
National Monitoring Network Automatic Monitoring Network in Shanghai
Monitoring network

Parameters Species Perturbation Distribution Polynomial
UA1 Emission PM, NOx, SO2 [-10%,+10%] Beta Jacob
UA2 Dry Deposition Velocity PM [-10%,+10%] Beta Jacob
UA2 Dilution rate/Entrainment rate NOx, SO2 [-10%,+10%] Beta Jacob
UA3 Wind field PM, NOx, SO2 [-10%,+10%] Beta Jacob
c
2
b
2
2a
2
1a
22coppo dCCCC
Uncertainty sources:
(Rao and Hosker, 1993)
Model uncertainty analysis

2011-04-30 12: 00 (24h forecast)
2011-05-01 12: 00 (24h forecast)
2011-05-02 12: 00 (24h forecast)
2011-05-03 12: 00 (24h forecast)
2011-04-29 12: 00 (24h forecast)
ASSIMILATION PREDICTION
Obs
Analysis_A
Analysis_B
PM
10 C
once
ntra
tion
(mg/
m3
)
Application-----dust storm forecast
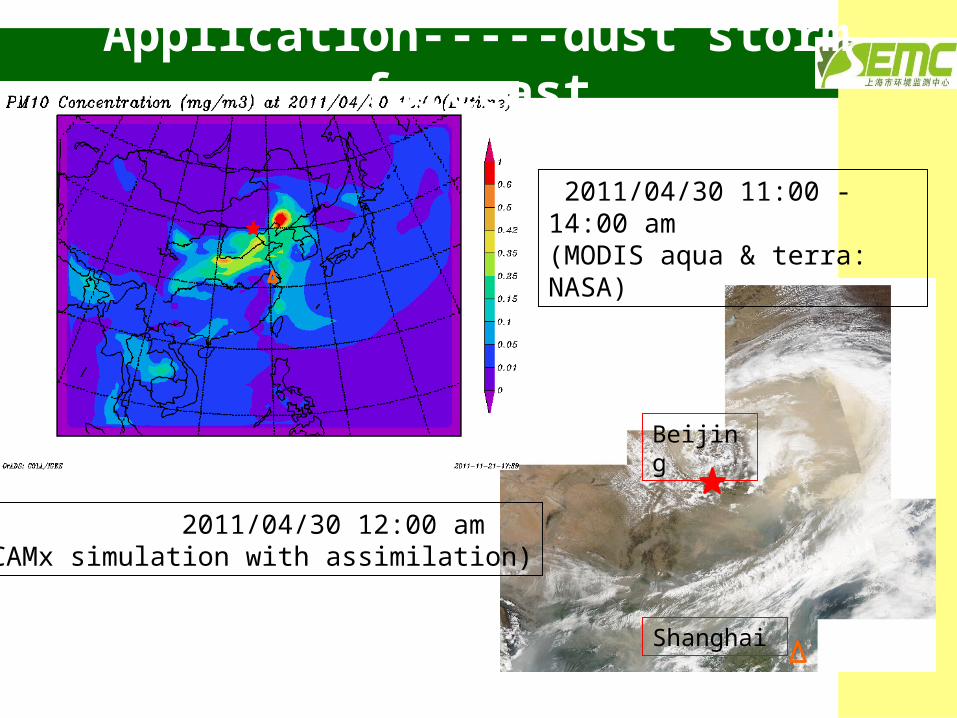
Beijing
Shanghai
2011/04/30 12:00 am(CAMx simulation with assimilation)
2011/04/30 11:00 -14:00 am(MODIS aqua & terra: NASA)
Application-----dust storm forecast

Beijing
Shanghai
2011/05/01 12:00 am(CAMx simulation with assimilation)
2011/05/01 11:00 -14:00 am(MODIS aqua & terra: NASA)
Application-----dust storm forecast
Beijing
Shanghai
2011/05/31 11:00 am (CAMx simulation with assimilation)
2011/05/31 11:00 am(MODIS terra: NASA)
Fire Spots
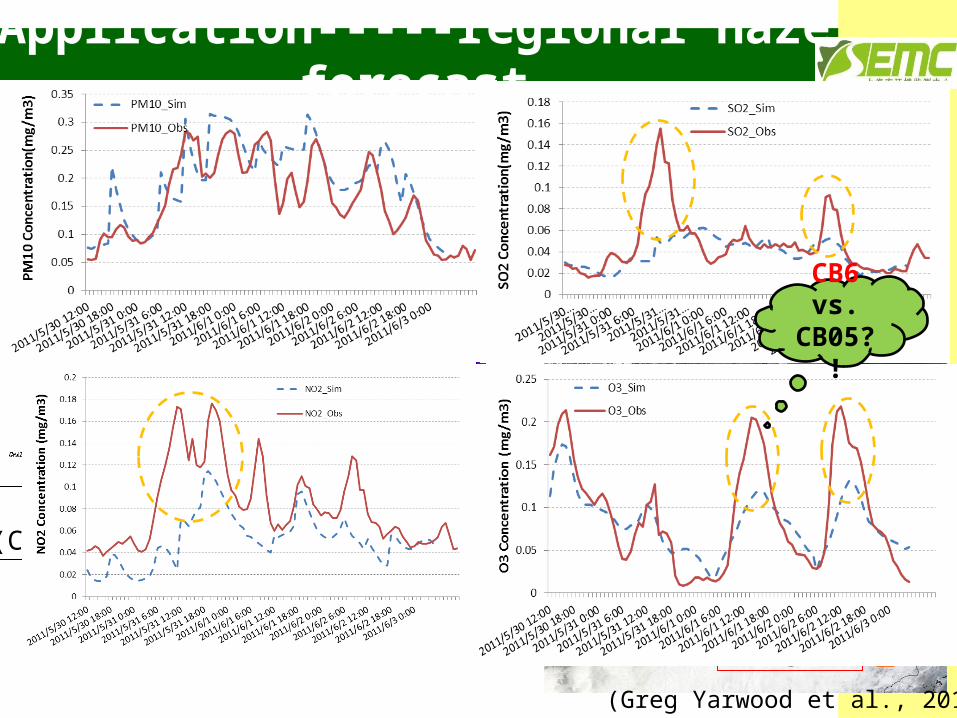
Application-----regional haze forecast
CB6 vs. CB05?!
(Greg Yarwood et al., 2010)

4
Outline
2
Model application3
1 Introduction
Model performance
Future plan

•Three dimensional monitoring network for air pollution transportation events;
•Increased monitoring species with higher spatial and temporal resolution;
More sufficient observations
•Improvements of emission inventory on regional and local scale based on model performance evaluation
•More ensemble method for improving model performance
Performance evaluation
•Operational running with a large amount of business practices and application;
•Keep improving and providing advanced forecasting services to the public;
Continuously operational running
and improving
Future plan

Thanks for your attention!