evaluation and planning of beach mining at pantai pasir hitam
DESCRIPTION
A preliminary study was conducted on black sands deposit which is located at Pantai Pasir Hitam, Langkawi, Kedah. The study utilize the concept of strip mining to evaluate new beach level and concentration of heavy mineral in black sand deposit after redistributed by wave effect.TRANSCRIPT
SCHOOL OF MATERIALS AND MINERAL RESOURCES ENGINEERING UNIVERSITI SAINS MALAYSIA
EVALUATION AND PLANNING OF BEACH MINING AT PANTAI PASIR
HITAM, LANGKAWI
By
MUHAMMAD ZULQAYYIM BIN NOOR AZIZUL
Supervisor: Assoc. Prof. Dr.Hashim Bin Hussin
Dissertation submitted in partial fulfilment of the requirements for the Degree of Bachelor of Engineering with Honours
(Mineral Resources Engineering)
Universiti Sains Malaysia
JULY 2013
ii
DECLARATION
I hereby declare that I have conducted, completed the research work and written the
dissertation entitled “Evaluation and Design of Beach Mining in Pantai Pasir Hitam,
Langkawi”. I also declare that it has not been previously submitted for the award of any
degree or diploma or other similar title of this for any other examining body or
University.
Name of Student: MUHAMMAD ZULQAYYIM BIN NOOR AZIZUL
Signature:
Date:
Witness by,
Supervisor: ASSOC. PROF. DR. HASHIM BIN HUSSIN
Signature:
Date:
iii
ACKNOWLEDGEMENTS
Alhamdulillah, thank to Allah SWT as I had successfully completed my Final
Year Project. The report presented here consists of knowledge and experience that I
have gain and have been through in completing my Final Year Project. First and
foremost, I would like to express my appreciation to my beloved family, my lovely
parents, Noor Azizul Bin Ibrahin and Noreha Binti Omar for always giving their full
support on me throughout my life.
Next, I would like to give my heartiest gratitude to my supervisor, Assoc. Prof.
Dr.Hashim Bin Hussin for his guidance while I am conducting the experiments and the
help his gave since day one. Thank you to my friends and coursemates especially
Muhammad Azlan Bin Ishak who have shared their wisdom with me and providing me
with helps and support. I would like to express my thanks to all of my Mineral
Resources Engineering lecturers who have tough me the knowledge that have helped me
throughout this research.
Not forgetting all the dedicated technicians who provide me with their technical
help and millions of thanks especially to Pn. Hasliza, En. Kemuridaan, En. Saarani, En.
Khairi and Cik Mahani for all the assistance and sacrifice of time and energy in helping
me to complete this project. Last but not least, I would like to thank those which I might
unintentionally left out in expressing my gratitude. Thank you again everyone, either
direct or indirectly involved in helping me in completing this thesis.
iv
TABLE OF CONTENTS
TOPIC PAGE
DECLARATION ii
ACKNOWLEDGEMENT iii
TABLE OF CONTENTS iv
LIST OF TABLES vii
LIST OF FIGURES viii
LIST OF PLATES xi
LIST OF ABBREVIATION xii
ABSTRAK xiii
ABSTACT xiv
CHAPTER 1 INTRODUCTION
1.1 Introduction 1
1.2 Significant of Project 2
1.3 Problem Statement 3
1.4 Objective 4
1.5 Location of Study Area 4
1.6 Scope of Work 7
CHAPTER 2 LITERATURE REVIEW
2.1 Geology 8
2.2 Heavy Mineral Sands 9
2.3 Strip Mining 11
2.4 Type of Placer Deposit 12
2.4.1 Beach Placers 12
2.4.2 Residual Placers 12
2.4.3 Eluvial Placers 13
2.4.4 Stream of River Placers 13
2.4.5 Riverbank and Flood Placers 13
v
2.4.6 Aeolian Placers 14
2.5 Formation of Beach Placer Deposits 14
2.6 Factors Controlling Formation of Beach Placer Deposit 15
2.7 Littoral Transportation 16
2.8 Waves 17
2.9 Tides 18
2.9.1 Types of Tide 19
2.9.2 Spring Tide and Neap Tide 20
2.10 Currents 22
2.10.1 Rip Currents 22
2.10.2 Density Currents 23
2.10.3 Longshore Currents 23
2.10.4 Currents of Mass Transport 23
2.11 Wind 24
CHAPTER 3 RESEARCH METHODOLOGY
3.1 Introduction 25
3.2 Literature Investigation 29
3.2.1 Geological Study 29
3.2.2 Tide Analysis 30
3.3 Site Study 32
3.3.1 Area Determination 32
3.3.2 Marking Out 33
3.3.3 Stripping 35
3.3.4 Sampling Activities 37
3.3.5 Rate of Redistribution Analysis 38
3.4 Experimental Analysis 39
3.4.1 Evaluation of Heavy Minerals 39
3.4.1.1 Mozley Table 41
3.4.2 Mineral Identification 42

vi !
3.4.2.1 Magnetic Separator 44
3.4.2.2 Electrostatic (High-Tension) Separator 44
3.4.2.3 Optical Microscope 45
3.4.2.4 Scanning Electron Microscopy-Energy Dispersive X-Ray Spectroscopy (SEM- EDX)
46
3.4.2.5 X-ray Fluorescence (XRF) Analysis 46
CHAPTER 4 RESULT AND DISCUSSION
4.1 Introduction 48
4.2 Site Study 48
4.3 Rate of Redistribution Analysis 51
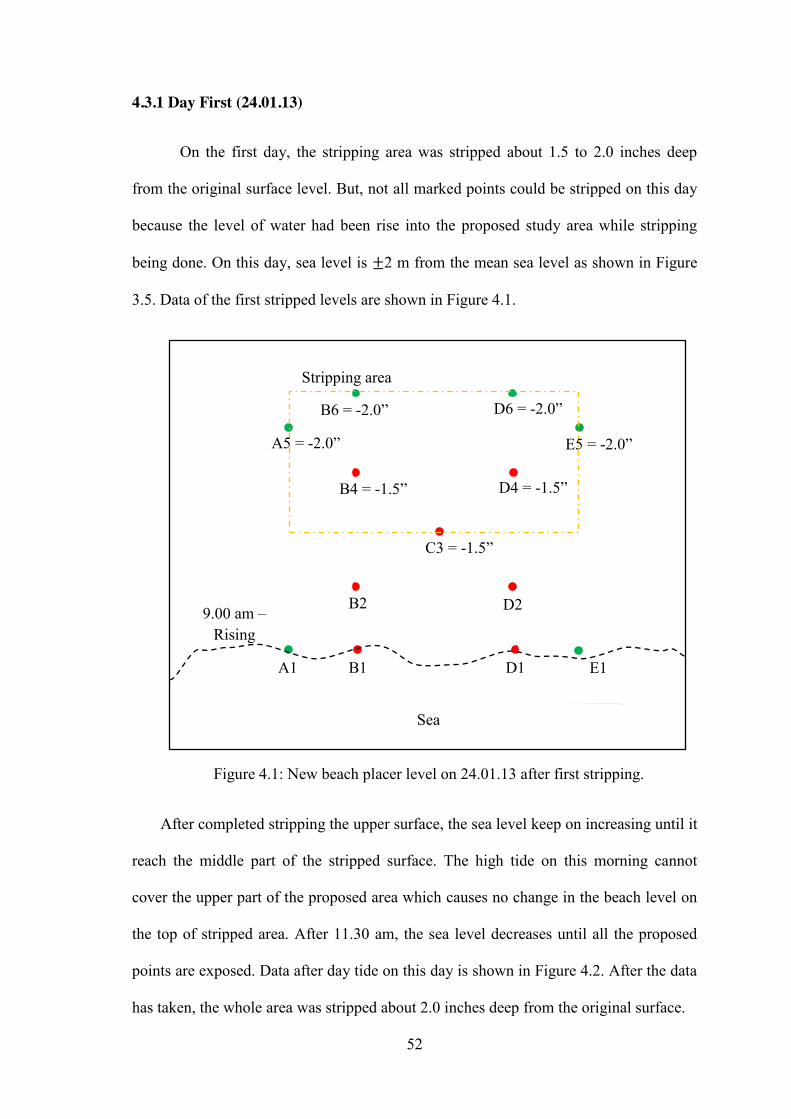
4.3.1 Day First (24.01.13) 52
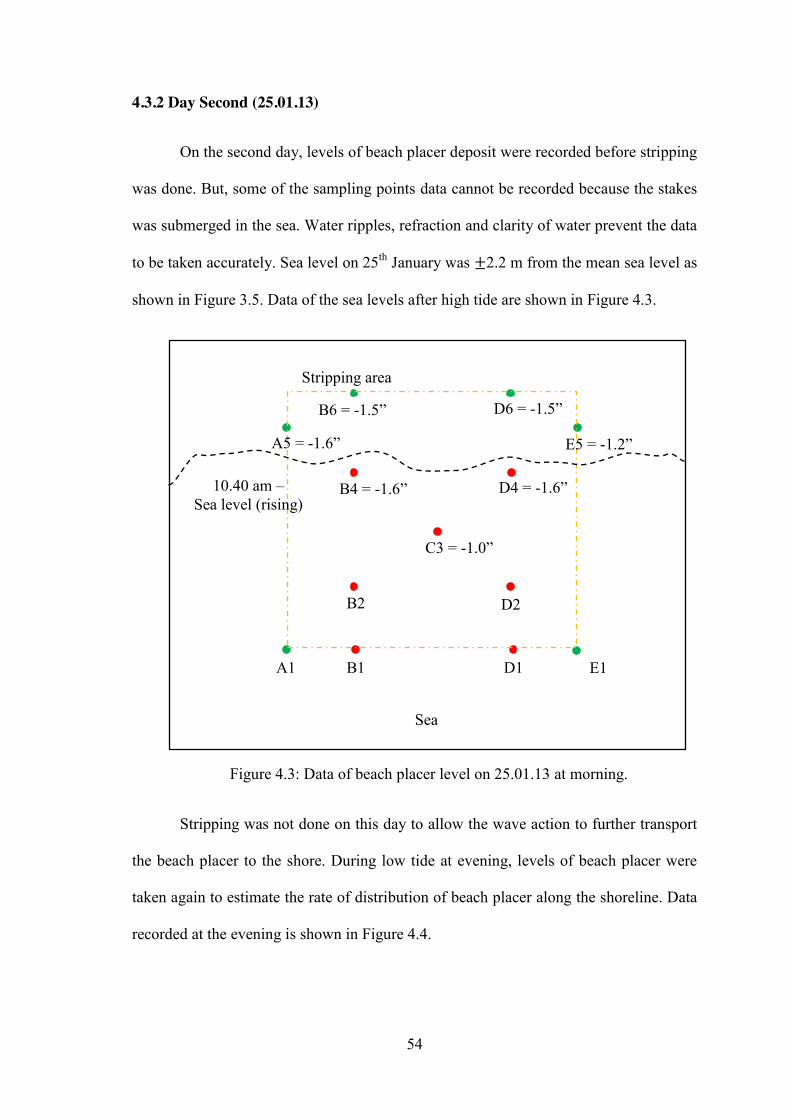
4.3.2 Day Second (25.01.13) 54
4.3.3 Day Third (26.01.13) 56
4.3.4 Day Fourth (27.01.13) 58
4.3.5 Day Fifth (28.01.13) – Last Day 60
4.4 Evaluation of Heavy Minerals 64
4.5 Minerals Identification by Optical Microscope 68
4.6 Scanning Electron Microscopy-Energy Dispersive X-Ray Spectroscopy (SEM-EDX) Analysis
71
4.7 X-Ray Fluorescence (XRF) Analysis 78
CHAPTER 5 CONCLUSION AND RECOMMENDATIONS
5.1 Conclusion 82
5.2 Recommendation 84
REFERENCES 85
APPENDIX A 88
APPENDIX B 91
APPENDIX C 94
APPENDIX D 94
vii
LIST OF TABLE
TABLES PAGE
Table 2.1
Common Mineral Sands, Their Physical Properties and Chemistry
10
Table 4.1 Simplified Data of Beach Placer Deposits Levels 61
Table 4.2 Overall Increments of Beach Placer Deposits 62
Table 4.3 Summarized Data of Heavy Mineral Concentration in Beach Placer Deposits 67
Table 4.4
Minerals Form Magnetic Particles After Separated Using HTS
71
Table 4.5
Minerals Form Non-Magnetic Particles After Separated Using HTS
72
Table 4.6
X-Ray Fluorescence (XRF) Analysis for Raw Sample of Black Sand.
81

viii
LIST OF FIGURES
FIGURES PAGE
Figure 1.1
Map of Langkawi Island and The Location of Pantai Pasir Hitam (Marked A) From Satellite View (Google Earth)
5
Figure 1.2
Detail Location of Pantai Pasir Hitam (Marked A) Area Including Picture of The Study Area (Google Maps) 6
Figure 2.1 General Geologic Maps of Langkawi Island 8
Figure 2.2 Stripping Mining Techniques 11
Figure 2.3
Typical Beach Pattern With Offshore Bars. Mineral Accumulations Have Formed Placer Deposits in Dunal System
15
Figure 2.4 Littoral Transport of Sediment Along The Shore 16
Figure 2.5
Typical Oscillation Waves With Orbiting Water Particles Slowly Moving In Direction of Waves Movement
18
Figure 2.6 Types of Tides and Their Distribution 19
Figure 2.7
Combination of Lunar and Solar Equilibrium Tides to Produce Spring Tides at New and Full Moon and Neap Tides at First and Last Quarter of Moon Phase
21
Figure 2.8 Tide Phases and Moon Phases 21
Figure 2.9
Rip Current Formations at Lowest Point of an Offshore Bar
22
Figure 3.1 The Flowchart Of Research Work 27
Figure 3.2 General Geologic Maps of Langkawi Island 29
Figure 3.3
Sea Level at Langkawi Station on 8th To 15th January 2013
30
Figure 3.4
Sea Level at Langkawi Station on 15th To 22th January 2013
31
Figure 3.5
Sea Level at Langkawi Station on 22th To 29th January 2013
31
Figure 3.6
Sea Level at Langkawi Station on 29th January To 5th February 2013
31
ix
Figure 3.7 Illustration of Sampling Point at Study Area 34
Figure 3.8 Detail Flowchart for Heavy Minerals Evaluation 40
Figure 3.9 Detail Flowchart for Mineral Identifications 43
Figure 4.1
New Beach Placer Level on 24.01.13 After First Stripping
52
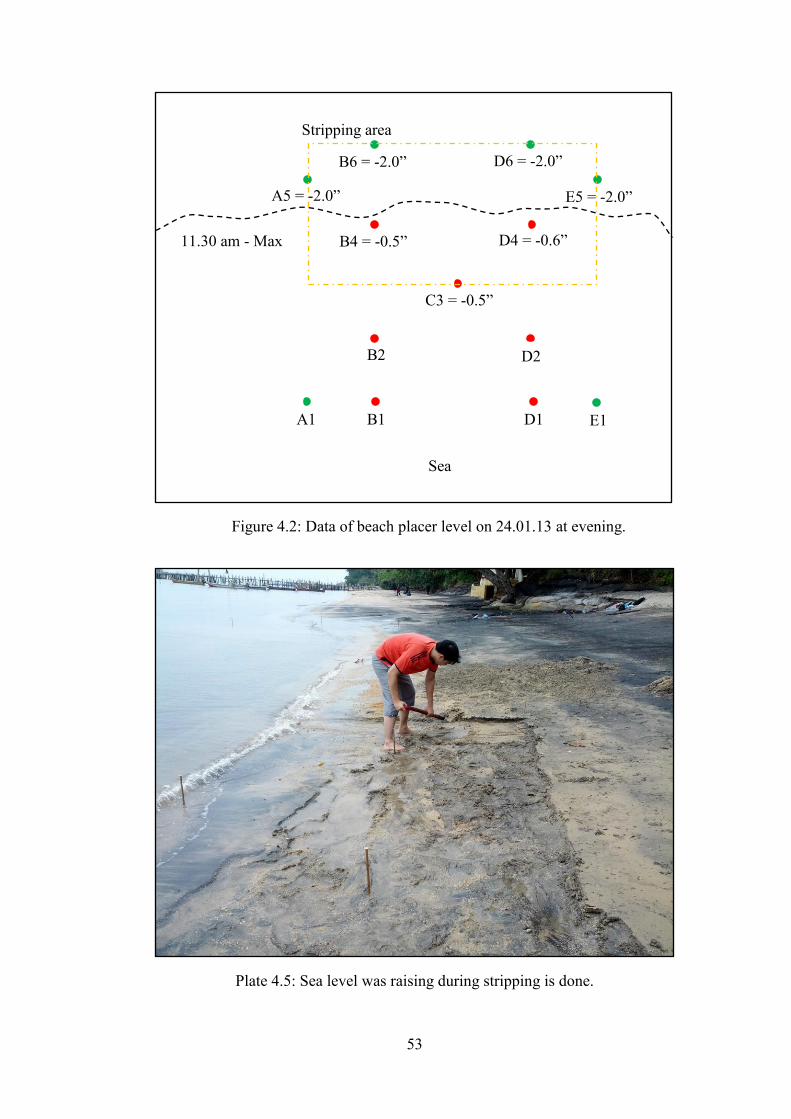
Figure 4.2 Data of Beach Placer Level on 24.01.13 at Evening 53
Figure 4.3 Data of Beach Placer Level on 25.01.13 at Morning 54
Figure 4.4 Data of Beach Placer Level on 25.01.13 at Evening 55
Figure 4.5 Data of Beach Placer Level on 26.01.13 at Morning 56
Figure 4.6 Data of Beach Placer Level on 26.01.13 at Evening 57
Figure 4.7 Data of Beach Placer Level on 27.01.13 at Morning 58
Figure 4.8 Data of Beach Placer Level on 27.01.13 at Evening 59
Figure 4.9 Data of Beach Placer Level on 28.01.13 at Morning 60
Figure 4.10 Illustration of Sampling Point at Study Area 65
Figure 4.11 Relation Between Beach Increments And Heavy Minerals Concentration In Black Sand Deposit. 68
Figure 4.12 Magnetic and Conductor 71
Figure 4.13 Magnetic and Non-Conductor 71
Figure 4.14 Non-Magnetic and Conductor 72
Figure 4.15 Non-Magnetic and Non-Conductor 72
Figure 4.16
SEM Images of Raw Black Sand at 50 Times Magnification
73
Figure 4.17
SEM Images of Raw Black Sand at 50 Times Magnification
73
Figure 4.18
SEM Photomicrograph of Raw Black Sand Deposit Sample
74
Figure 4.19
EDX Diffractogram Showing The Presence of Hematite in Figure 4.18.
75
Figure 4.20
EDX Diffractogram Showing The Presence of Zircon in Figure 4.18.
75

x
Figure 4.21
EDX Diffractogram Showing The Presence of Quartz With Some Clay Impurities in Figure 4.18.
76
Figure 4.22
SEM Photomicrograph of Raw Black Sand Deposit Sample (Different Location).
76
Figure 4.23
EDX Diffractogram Showing The Presence of Ilmenite (Light Structure) in Figure 4.22.
77
Figure 4.24
EDX Diffractogram Showing The Presence of Quartz (Dark Spot) in Figure 4.22.
77
Figure 4.25
SEM Photomicrograph of Raw Black Sand Deposit Sample (Different Location).
78
Figure 4.26
EDX Diffractogram Showing The Presence of Hematite (Light Colour) in Figure 4.25.
78
Figure 4.27
EDX Diffractogram Showing The Presence of Quartz (Grey Colour) in Figure 4.25
79
Figure 4.28
SEM Photomicrograph of Raw Black Sand Deposit Sample (Different Location).
79
Figure 4.29
EDX Diffractogram Showing The Presence of Tourmaline in Figure 4.28.
80
xi
LIST OF PLATES
PLATES PAGE
Plate 3.1 Study Area (Red Box) at Pantai Pasir Hitam, Langkawi 33
Plate 3.2
Sampling Point at Study Area and The Marks on Each Stakes as Indicator to Determine The Level of Black Sands Deposit
34
Plate 3.3
Method of Strip Mining for Evaluation of Black Sands Deposit
36
Plate 3.4
Method of Strip Mining for Evaluation of Black Sands Deposit
36
Plate 3.5
Soil Shovel Used for Stripping and Sampling of Black Sands Deposit
37
Plate 4.1
Heavy Mineral Deposit Near The Banks Along The Beach Area
49
Plate 4.2
Distribution of Heavy Minerals Along The Shoreline and Under The Sea
50
Plate 4.3 Source of The Heavy Mineral Deposit 50
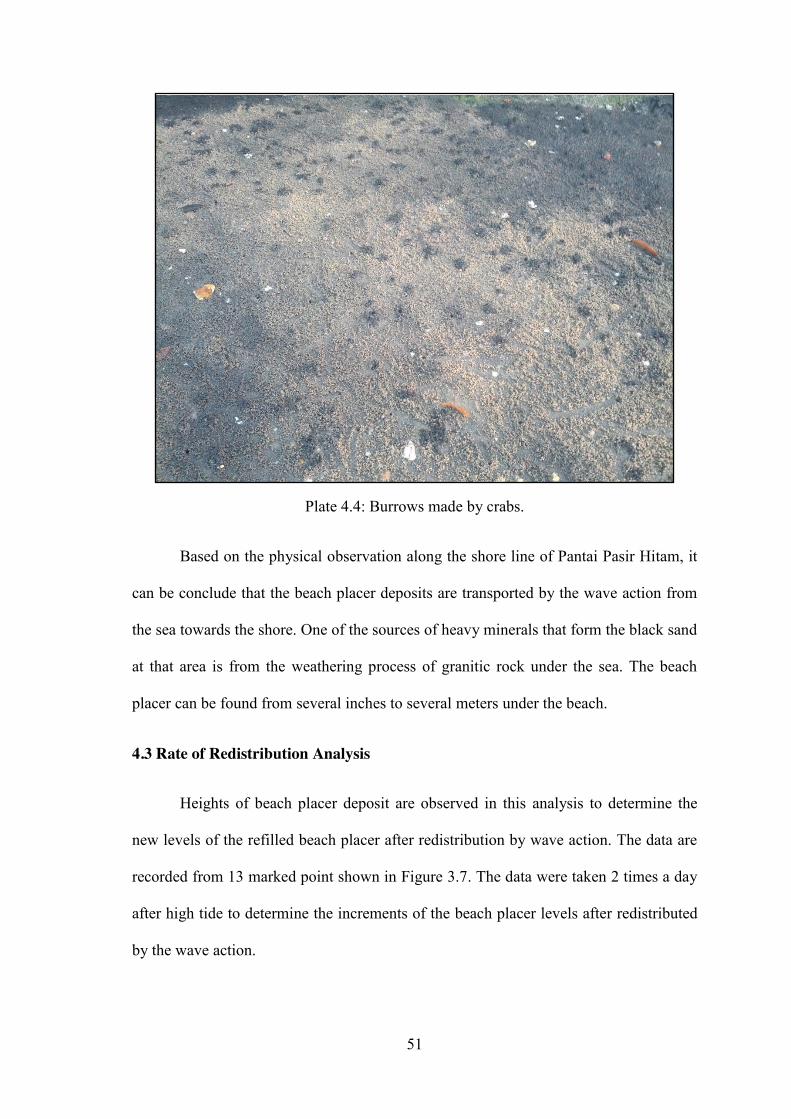
Plate 4.4 Burrows Made by Crabs 51
Plate 4.5 Sea Level was Raising During Stripping is Done 53
Plate 4.6 Site Area on 25.01.13 at Evening 55
Plate 4.7 Presence of Barrier or Sea Walls at The Sea Area. 64
xii
LIST OF ABBREVIATION
ABBREVIATION
SEM Scanning Electron Microscopy
EDX Energy Dispersive X-Ray Spectroscopy
XRF X-Ray Fluorescence
JMG Minerals and Geosciences Department
JMM Malaysian Meteorological Department
HIMS High Intensity Magnetic Separator
LIMS Low Intensity Magnetic Separator
xiii
PENILAIAN DAN REKABENTUK PERLOMBONGAN PANTAI DI PANTAI PASIR HITAM, LANGKAWI
ABSTRAK
Satu kajian awal telah dijalankan keatas deposit pasir hitam yang terletak di
Pantai Pasir Hitam, Langkawi, Kedah. Kajian ini menggunakan konsep perlombongan
‘strip mining’ untuk menilai kenaikan paras pantai dan kepekatan mineral berat dalam
deposit pasir hitam selepas disebarkan oleh ombak. Kawasan yang dikorek ditinggalkan
selama tempoh tertentu untuk membolehkan ombak menyebarkan semula deposit pasir
hitam. Kajian menunjukkan bahawa kenaikan purata deposit pasir hitam adalah 0.8 inci
jika deposit pasir hitam dikorek sebelum air pasang. Namun, kenaikan purata deposit
pasir hitam apabila pantai tidak dikorek adalah sekitar 0.1 inci sahaja. Kepekatan purata
mineral berat yang menggantikan deposit yang telah dikorek adalah 41% selepas setiap
kali air pasang dan 42% pada setiap titik persampelan. Pemerhatian ke atas ciri-ciri
topografi di sekitar kawasan tapak telah dilakukan untuk menentukan asal-usul deposit
pasir hitam. Daripada pemerhatian yang dilakukan, deposit pasir hitam sebenarnya
datang dari laut hasil daripada kesan ombak. Ini kerana, tidak ada kesan mineral pasir
hitam yang dapat dilihat dari tebing berhampiran dengan kawasan pantai. Sampel asal
deposit pasir hitam juga dianalisis di bawah mikroskop optik dan SEM-EDX dan
menunjukkan kehadiran ilmenit, bijih besi, pirit, rutil, zirkon, turmalin, monazit dan
kuarza dalam deposit pasir hitam.
xiv
EVALUATION AND DESIGN OF BEACH MINING IN PANTAI PASIR HITAM, LANGKAWI
ABSTRACT
A preliminary study was conducted on black sands deposit which is located at
Pantai Pasir Hitam, Langkawi, Kedah. The study utilize the concept of strip mining to
evaluate new beach level and concentration of heavy mineral in black sand deposit after
redistributed by wave effect. The stripping area was left for certain period to allow tide
effect to redistribute the black sand deposit. The results show that the average
increments of black sand deposit are 0.8 inches if the black sand deposits are stripped
before high tide. While, the average increments of black sand deposit when stripping is
not done is around 0.1 inches only. The average concentration of heavy mineral that
replaced the stripped deposit after redistribution is 41% at particular tides and 42% at
each particular sampling point. Observation on topographical features around the site
area was done to determine the origin of black sand deposit. From the observation, the
black sand deposits are actually coming from the sea by the wave action because there
are no traces of black sand minerals from the banks near the beach area. Raw sample of
black sand deposit was also analysed under optical microscope and SEM-EDX showing
the presence of ilmenite, hematite, pyrite, rutile, zircon, tourmaline, monazite and quartz
in the black sand deposit.
1 !
CHAPTER 1
INTRODUCTION
1.1 1ntroduction
Black sands are normally refers to concentration of heavy minerals in an alluvial
environment such as beach or river system. Sometimes these deposits are referred to as
‘beach sand’. Black sands are placer deposits that mostly formed in beach environment.
This type of deposit is formed when the mechanical and chemical breakdown of rock
masses followed by a redistribution of the mineral along the shoreline (Jones G. 2008).
Black sands contain a number of minerals with high specific gravity known as
‘heavy mineral’. Usually, minerals with specific gravity above 4.2 g/cm3 can be
considered as heavy minerals. Heavy mineral sands are a class of ore deposits which
include economically important minerals such as rutile (TiO2), ilmenite (FeTiO3),
zircon (ZrSiO4) leucoxene (Fe.TiO3.TiO2) and others. Rutile and leucoxene are
alteration product of ilmenite which are titanium dioxide based mineral. Other minor
minerals that may be found associate with mineral sands comprise monazite, magnetite,
garnet, xenotime, precious metals, gemstones or rare earth elements (Jones G. 2008).
According to Geoscience Department Australia (2012), Australia is the leading
producer of mineral sand in the world today. Black sands also have been found in many
countries such as South and South-East Asia. Some of them are being produce from
beaches in Sri Lanka, India, Indonesia (Tyler R.M. et al. 2004).

2 !
According to Geoscience Department Australia (2012) and the United States
Geological Survey data in (2011), the world’s leading producer of rutile and zircon is
Australia. It also represents the world’s largest economic resources in 2011 with 53%,
and 50%, respectively. Australia also has the second largest share of the world’s
ilmenite with 15%, behind China, which has 31%. Other major country rankings
include India (13%), South Africa (10%) and Brazil (7%) for ilmenite, South Africa
(16%) and India (14%) for rutile and South Africa (23%) and Ukraine (7%) for zircon.
1.2 Significant of Project
Systematic prospecting and exploration method must go before further
investment for acquisition, development and exploitation to estimate the value of any
deposit. This research project is focused on preliminary study of black sands deposit
which include evaluation and design of beach mining in Pantai Pasir Hitam, Langkawi,
Kedah. The evaluation black sands deposit is important to determine the grade of heavy
mineral and mineral distribution along beach shoreline.
In this study, strip mining is utilized to excavate the black sands deposit.
However, it is important to know the rate of the deposit to recover back to the original
level and the concentration of heavy mineral that replaced after the deposit is excavated.
This study on the black sands deposit will provide an important data on the formation
and composition of the heavy minerals presence in the deposit after being mined.
3 !
1.3 Problem Statement
In general, this project is to understand the formation of black sands deposit
along a beach front. Since there is no previous research about beach mining in Malaysia,
this research is conducted to get some data of black sands deposit in Pantai Pasir Hitam
area. The origin of the black sands deposit need to be study to identify whether it comes
from the sea by wave and tidal effect or the accumulation of black sands deposit
because of weathering process from rock masses.
Stripping mining method concept is utilized in this project to excavate the
deposit. However, it is important to know the new level of deposit that recover back the
excavated black sand from the original level and the composition of heavy mineral with
the new deposit. This is done to estimate the effect of wave to the increment of beach
level and amount of heavy mineral in the deposit.
According to article impact of sand mining by The Anguilla National Trust,
unregulated removal of beach sand has had a huge impact on beach area. For example,
sand dunes that once loomed over the beach and protected the inland shoreline and
vegetation have been reduced to a three-foot mound that is being eroded by constant
wave action and a continued sand mining effort. Therefore, it is necessary to make sure
this method is possible to maintain the nature of the beach.
4 !
1.4 Objective
The objectives of the research are as follows:
1. To identify the origin of black sand deposit that formed along the shoreline of
Pantai Pasir Hitam beach.
2. To determine the new level of black sand deposit after redistributed to recover
back the excavated black sands deposit.
3. To determine the concentration of heavy mineral that replaced the excavated
black sands deposit.
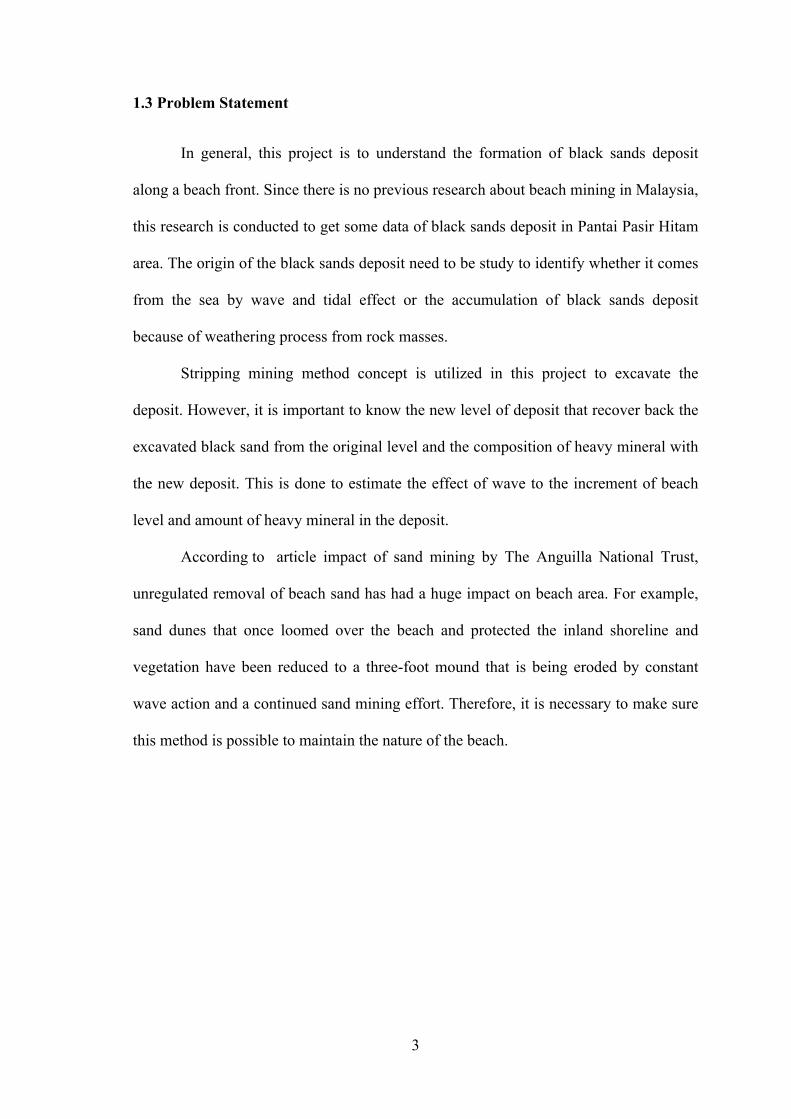
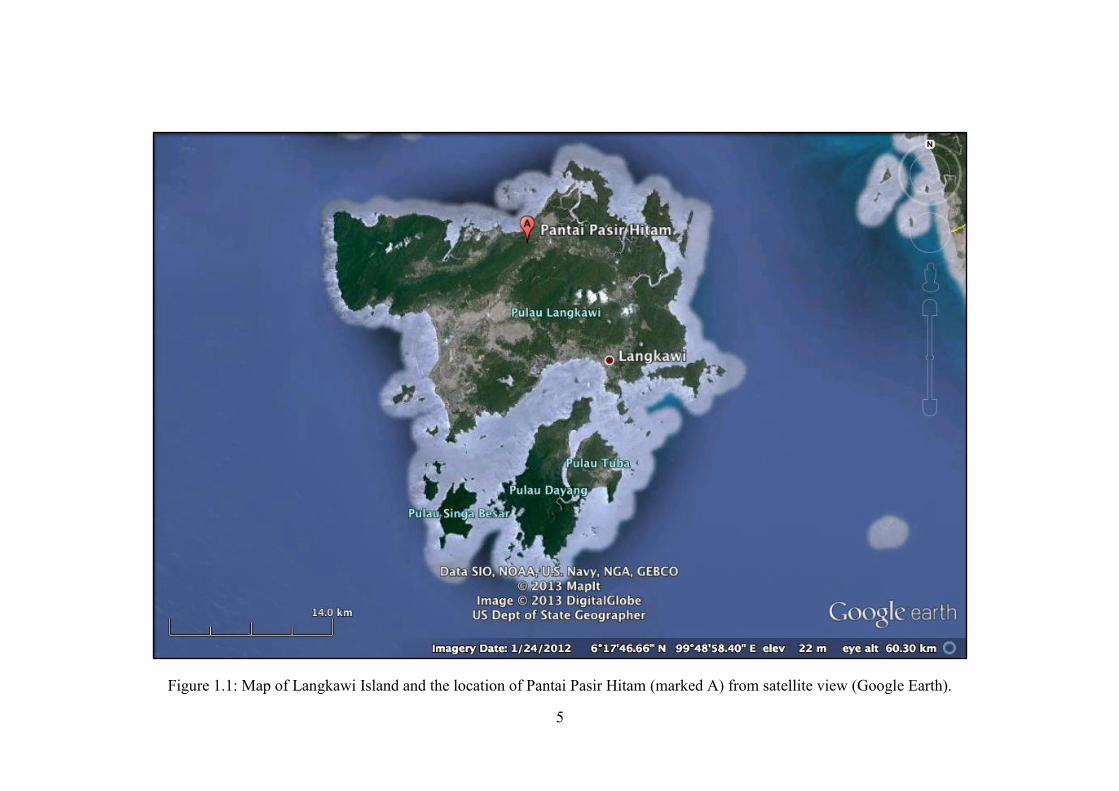
1.5 Location of Study Area
The location of the study area in this research project is along the shoreline of
Pantai Pasir Hitam, Langkawi Kedah. This beach is located at the north region of
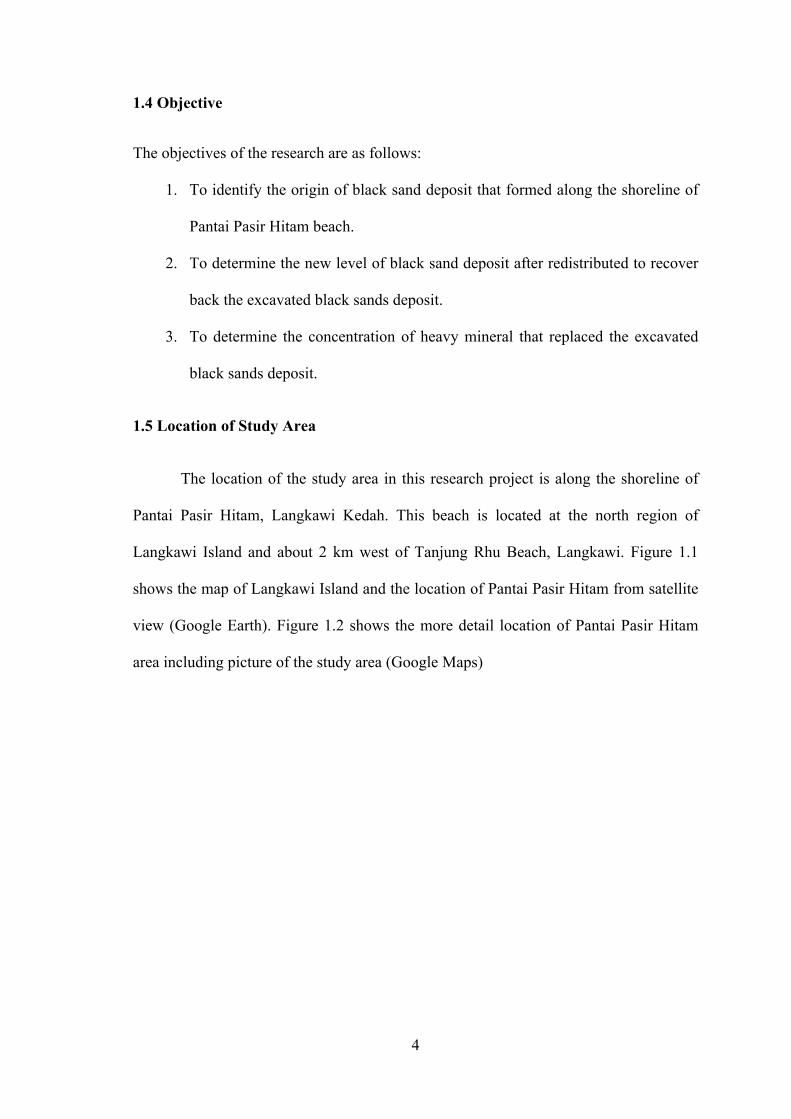
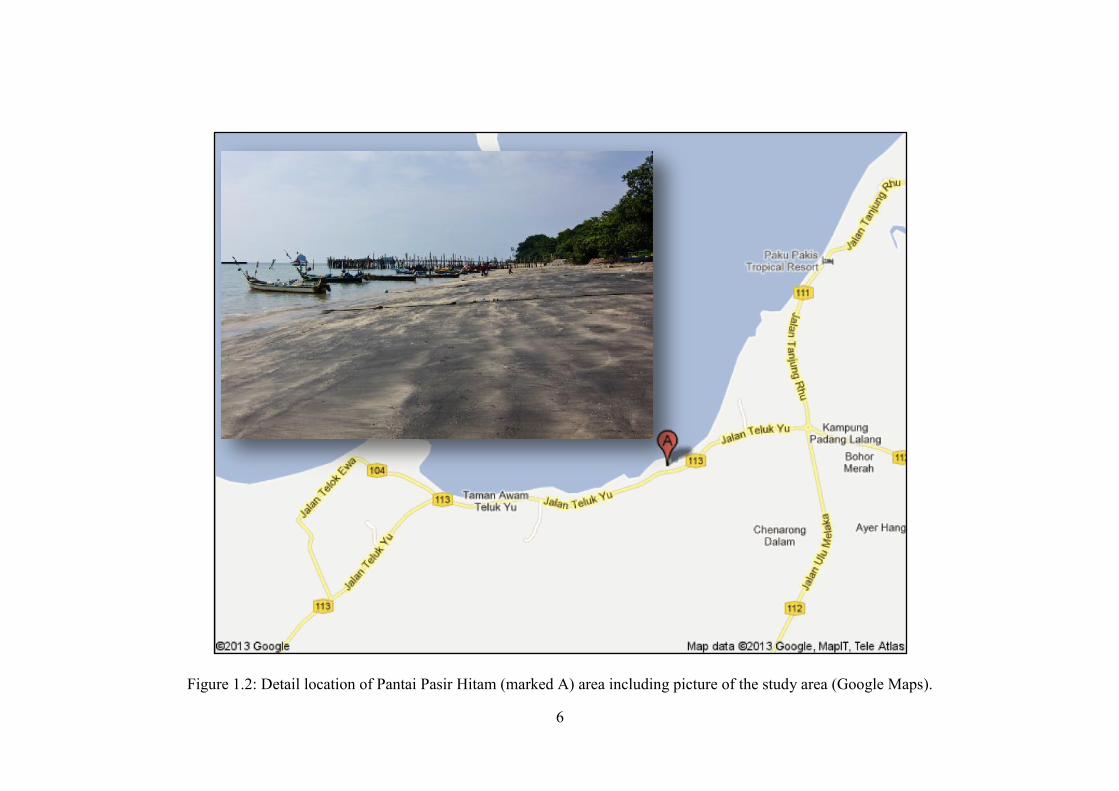
Langkawi Island and about 2 km west of Tanjung Rhu Beach, Langkawi. Figure 1.1
shows the map of Langkawi Island and the location of Pantai Pasir Hitam from satellite
view (Google Earth). Figure 1.2 shows the more detail location of Pantai Pasir Hitam
area including picture of the study area (Google Maps)
5
Figure 1.1: Map of Langkawi Island and the location of Pantai Pasir Hitam (marked A) from satellite view (Google Earth).
6
Figure 1.2: Detail location of Pantai Pasir Hitam (marked A) area including picture of the study area (Google Maps).
7
1.6 Scope of Work
Field study is carried out during semester break on 24th to 28th January 2013
after acquiring the permission from Minerals and Geosciences Department (JMG)
Kedah. Data form “Sea Level Monitoring Activity” in Langkawi, Kedah have shown
that the tides from 24th to 28th January 2013 is moving from the low tide to the high tide.
The tide height is 1.5 m on 24th and gradually increases to 2.5 m on 28th which are very
preferable to conduct this study.
During field work, stripping which is almost similar to a concept of strip mining
was done at the site area to evaluate the black sand deposit. The evaluation is done to
know the increment of beach level after redistribution of black sand deposit due to the
tide effect. Sample of black sands deposit were taken to determine the heavy mineral
concentration in black sands deposit. Data obtained from the study were analysed and
tabulated.

8
CHAPTER 2
LITERATURE REVIEW
2.1 Geology
Langkawi Island comprises the oldest rocks and the most complete Palaeozoic –
Mesozoic sequence of sedimentary formations (Komoo I.). However, based on the
research made by Geological Survey of Malaysia in 1985, geology of Langkawi island
can be further divided to 6 types of rocks according to their geological age shown in
Figure 2.1. Based on that research, Pantai Pasir Hitam is actually located around the
area of Triassic granite formation of rock.
Figure 2.1: General geologic maps of Langkawi Island (Geological Survey
Malaysia 2013).
9
The shoreline of Pantai Pasir Hitam is composed of sand which is not
completely black, but it is actually like a mixture of black sand and normal sand.
However, like other black sand beaches, the sand is not volcanic in nature. It is actually
a mixture of sand and variety of heavy mineral sand (Voyage 2010).
2.2 Heavy Mineral Sands
Mineral sands are black sands deposit that mostly formed in beach
environments. According to Department of Environment and Primary Industries on Mar
2012, these minerals are formed from variety of igneous and metamorphic rock, but
being physically and chemically resistant to weathering. Heavy minerals are a term for
minerals that have specific gravity greater than quartz which are 2.7 g/cm3 (Reyneke L.
et al., 2001). Heavy mineral sands contain a number of mineral with high specific
gravity which is usually higher than 4.2 g/cm3 (Reyneke L. et al., 2001).
Concentration of heavy mineral is resulted from the normal cycle of erosion.
The economic black sands deposit is formed when rock material has generated
sufficient quantities of valuable mineral. When suitable geography and climate
condition is provided to transport the heavy mineral, they tend to accumulate in river
channels and along coastline (Macdonald E.H. 1973).
Most of the rock forming mineral is fragmented and altered during the erosion
cycle by combination of physical and chemical actions. But only the stable minerals
survive. These minerals are quartz, garnet, ilmenite, leucoxene, rutile, zircon, monazite,
gold, cassiterite and variety of gemstone (Macdonald E.H. 1973). Common mineral
sands with their physical properties and chemistry are shown in table below.

10
Table 2.1: Common mineral sands, their physical properties and chemistry (Jones G.
2008).
Mineral Valuable Magnetic Susceptibility
Electrical Conductivity
Specific Gravity
Chemical Formula
Ilmenite Yes High High 4.5 – 5.0 Fe.TiO3
Rutile Yes Low High 4.2 – 4.3 TiO2
Zircon Yes Low Low 4.7 ZrSiO4
Leucoxene Yes Semi High 3.5 – 4.1 Fe.TiO3.TiO2
Monazite No Semi Low 4.9 – 5.3 (Ce,La,Th,Nd,Y)PO4
Staurolite No Semi Low 3.6 – 3.8 Fe2Al9Si4O22.(OH)2
Kyanite No Low Low 3.6 – 3.7 Al2SiO5
Garnet No Semi Low 2.4 – 4.2 (Fe,Mn,Ca)3.Al2(SiO4)3
Quartz No Low Low 2.7 SiO2
Emery and Noakes (1968) have suggested that the practical division of valuable
heavy minerals to three sections. The first are ‘heavy heavy’ minerals which composed
of gold, platinum and cassiterite. These minerals having SG above 6.8 and occur
principally in stream beds and less than 15 km from their sources. Second are ‘light
heavy’ minerals which composed of rutile, zircon, ilmenite, magnetite, monazite and
gemstone (diamond, sapphires, etc.) (Sekhar, L.K et al., Dec 2003). These minerals
having SG between 4.2 to 5.3 which are widespread and can be found at considerable
distance from their sources. Third are ‘light heavy minerals’ which composed of silica,
quartz, etc. This group have specific gravity between 2.7 to 4.2 and may also be found
at considerable distance from their sources (Gupta H.K., 2005).

11
2.3 Strip Mining
Strip mining is one types of surface mining methods used mainly for mining a
seam of mineral such as coal and other bedded deposit. In strip mining, overburden is
not transported to waste dump for disposal. However, the overburden is being cast
directly into adjacent mined out panels. Materials handling in strip mining consist of
excavation and casting that are generally combined in one unit operation and being
conducted by using a single machine as shown in Figure 2.2 (Surface mining, May
2013).
Figure 2.2: Stripping mining techniques (Strip mining, April 2013).
The concept of strip mining methods was used to mine the beach placer deposit
in this study. The mining process proposed in this study is actually from the concept of
strip mining, but being modified to be compatible with the mining area. At first,
stripping is done to excavate the beach placer deposit. The beach placer was stripped for

12
several depths to obtain the heavy minerals. However, the stripped beach placer is not
being dump into the adjacent area, but being transferred to processing plant to obtain the
heavy mineral concentrate.
After few days, the excavated area is refilled with new black sands deposit that
being distributed during high tide. Stripping is done after the refilled placers deposits
have reach the original black sands deposit levels. The strip mining methods are done
step by step to reduce the impact to the surrounding environment and also the beach
itself.
2.4 Type of Placer Deposit
Placer deposits can be classified into several types depending on the location of
formation of the deposit. The major types include residual placers, eluvial placers,
stream or river placers, riverbank and flood placers, aeolian placers, and beach placers
(Coyne M.S et al., April 1998).
2.4.1 Beach Placers
Beach placers are generally formed by the combined effects of chemical and
mechanical breakdown of rock masses. They also redistributed along the shore by the
action of tides, wind, currents and storm waves (Coyne M.S et al., April 1998).
2.4.2 Residual Placers
Residual placer deposit will occur near to the breakage of original source rocks.
Residual placer will undergo some degree of enrichment of the placer minerals by
elimination of non-valuable minerals by weathering process (Coyne M.S et al., April
1998).

13
2.4.3 Eluvial Placers
Eluvial placers represent the transitional stage between residual placers and
stream or river placers. Eluvial placers usually come from high level environment which
then transported downslope from the source rocks. But, the valuable minerals have not
yet move to streams and rivers that would transport them to other places (Coyne M.S et
al., April 1998).
2.4.4 Stream or River Placers
Stream or river placers are the most widespread and well known type of placers.
This type of placers made up of a mixture of poorly sorted rock fragments and minerals
from the adjacent hillside. Because of the steep gradient, running water especially
where there is turbulence will effectively sort the rock fragments and minerals
according to its size and density. Higher density minerals will settle out and trapped in
gaps and irregularities on the stream beds. The lower density mineral will be wash away
with the water stream (Coyne M.S et al., April 1998).
2.4.5 Riverbank and Flood Placers
Riverbank and flood placer are deposit adjacent to streams and rivers. The
deposit may be left along the bank of the river as the rivers meander, cut downward or
overflow their banks in flood condition (Coyne M.S et al., April 1998). As a stream
flows around a curve, tangential forces formed which cause an increase in velocity at
the outer radius of the river bank and decrease in velocity along the inside radius. Water
layer on the bottom part is retarded by friction and resulted to flow sideways along the
bottom toward the inner bank (Bureau of Land Management, 2011).

14
Valuable placer deposits may be settled in the river bank sediments that are
adjacent to the present rivers. Flood placers also occur in the sediments adjacent to
rivers. They form continuously during flooding when water flow is sufficient to
transport valued placer mineral up and out of the channels. As the water velocity
decreases, the placer mineral are left as placer deposits along the adjacent floodplains
(Coyne M.S et al., April 1998).
2.4.6 Aeolian Placers
Aeolian placers are formed when large parts of beach sand are exposed to the
wind action. High wind removed lighter mineral and therefore, enriched the heavy
minerals content. Aeolian placers are usually occur in the desert regions (Coyne M.S et
al., April 1998).
2.5 Formation of Beach Placer Deposits
Beach placers are generally formed because of the breakdown of rock masses by
chemical and physical action. The break rock masses are then redistributed along the
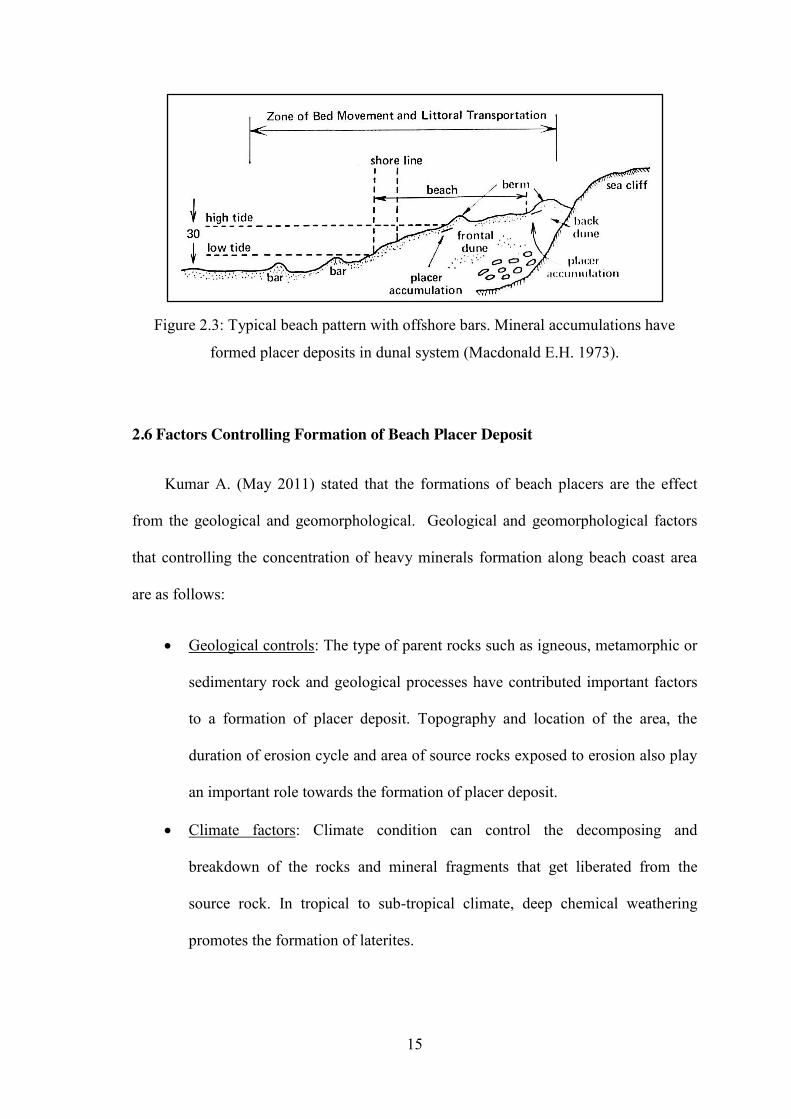
continental shoreline as shown in Figure 2.3 (Macdonald E.H. 1973). Beach placers are
then distribute by the action of tides and storm waves along beaches. The flow of the
waves and the generation of longshore currents, especially under storm conditions, can
effectively sort beach materials (Coyne M.S et al., April 1998).
The movement of the sea gradually sort the sediments according to their size and
particle properties, strength and direction of wind and ocean currents. The finer
materials will go into deep water and the coarser to the shore. The valuable minerals
usually become concentrated with the coarser grained sediments along the shore.
(Macdonald E.H. 1973).
15
Figure 2.3: Typical beach pattern with offshore bars. Mineral accumulations have
formed placer deposits in dunal system (Macdonald E.H. 1973).
2.6 Factors Controlling Formation of Beach Placer Deposit
Kumar A. (May 2011) stated that the formations of beach placers are the effect
from the geological and geomorphological. Geological and geomorphological factors
that controlling the concentration of heavy minerals formation along beach coast area
are as follows:
Geological controls: The type of parent rocks such as igneous, metamorphic or
sedimentary rock and geological processes have contributed important factors
to a formation of placer deposit. Topography and location of the area, the
duration of erosion cycle and area of source rocks exposed to erosion also play
an important role towards the formation of placer deposit.
Climate factors: Climate condition can control the decomposing and
breakdown of the rocks and mineral fragments that get liberated from the
source rock. In tropical to sub-tropical climate, deep chemical weathering
promotes the formation of laterites.
16
Drainage Pattern: The formation of new or young river and their high density
material may supply the valuable minerals along the favourable area.
Coastal Processes: Littoral transport, sorting and deposition of placer minerals
may affected by wave velocity, long shore currents, wind speed, tidal effect,
and also direction and strength of currents. Emergence and submergence of
coast base on geological history also affects the beach placer formation.
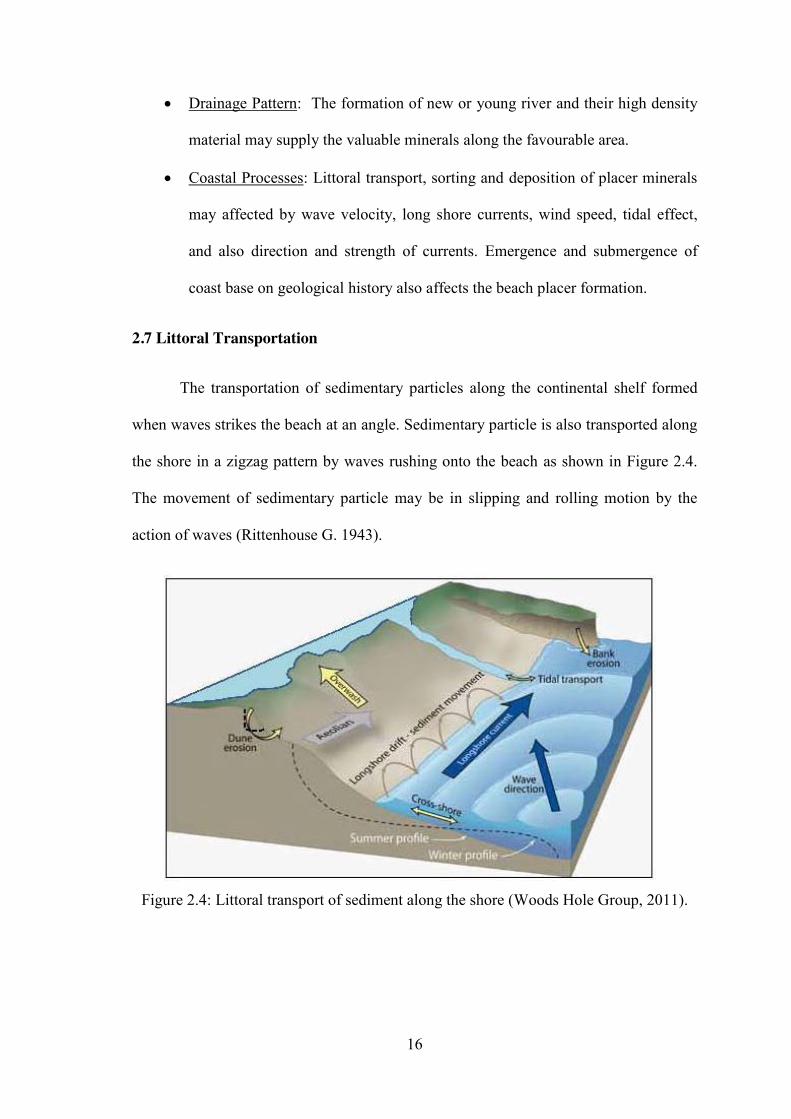
2.7 Littoral Transportation
The transportation of sedimentary particles along the continental shelf formed
when waves strikes the beach at an angle. Sedimentary particle is also transported along
the shore in a zigzag pattern by waves rushing onto the beach as shown in Figure 2.4.
The movement of sedimentary particle may be in slipping and rolling motion by the
action of waves (Rittenhouse G. 1943).
Figure 2.4: Littoral transport of sediment along the shore (Woods Hole Group, 2011).
17
In simplest case, the forces by sea water movement acting on a single particle
can be resolves into two components which are 1 - drag force in the direction of flow
and 2 - lift force which are normal to the direction of flow. As motion occur in the
direction of the lift force, the particle will then uplifted and creating nearly zero
frictional force causing the particle free to move (Macdonald E.H. 1973). The
sedimentary particles moves up the beach at the angle of wave direction and backwash
of wave moves the particles back to the beach due to gravity influence (Longshore drift,
2013).
2.8 Waves
Water waves are generated when any form of energy is applied to a water body.
Waves are formed when there is a change in atmospheric pressure that may raising and
lowering the surface of water. Wind that blow on the surface of water or wind generated
waves create ripples which subsequently grow to waves as the wind blow faster to the
water body. Water waves may also formed by earthquakes or landslides (Macdonald
E.H. 1973).
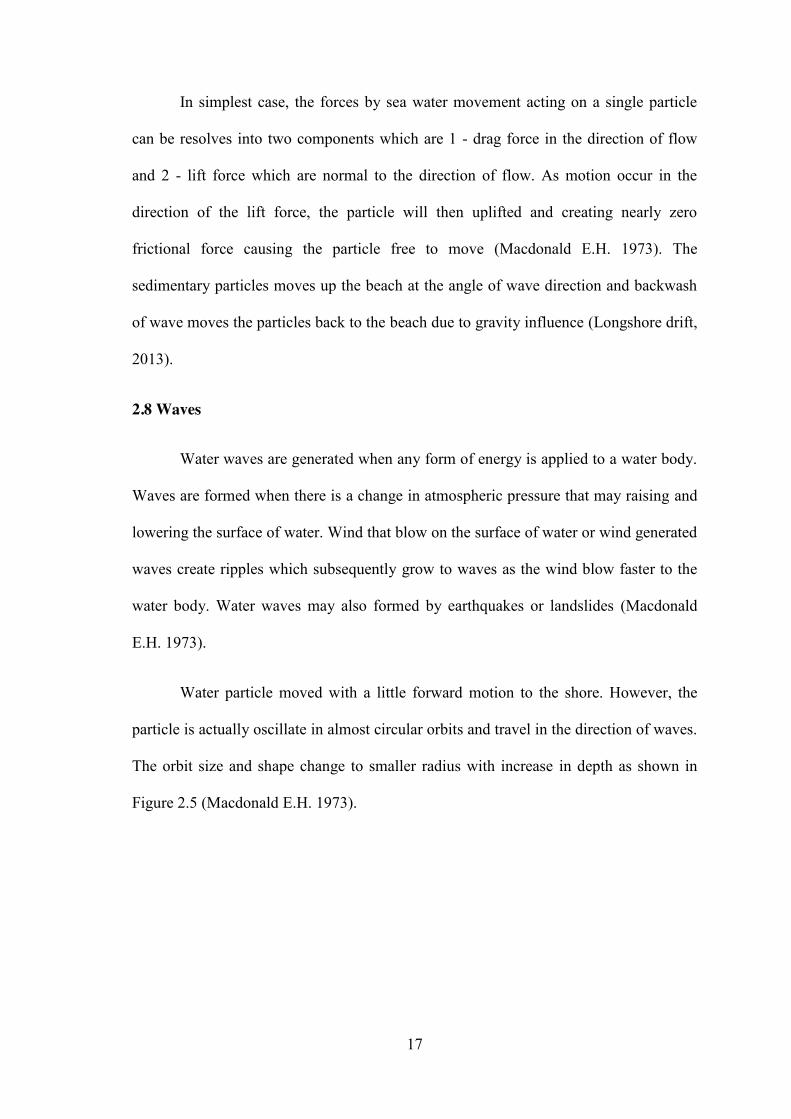
Water particle moved with a little forward motion to the shore. However, the
particle is actually oscillate in almost circular orbits and travel in the direction of waves.
The orbit size and shape change to smaller radius with increase in depth as shown in
Figure 2.5 (Macdonald E.H. 1973).
18
Figure 2.5: Typical oscillation waves with orbiting water particles slowly moving in
direction of wave movement (Macdonald E.H. 1973).
At the shallower region, potential energy will abruptly release causing
transformation of oscillation waves to translation waves. During big storms, high speed
winds provide additional energy to these waves thus forming a beach placers from
material that trapped by oscillation waves (Macdonald E.H. 1973).
2.9 Tides
Gravitational forces exerted by the sun and moon on the earth, moon altitude
above the earth equator and rotation of the earth create an effect of rise and fall of sea
levels called high tides and low tides. The variation in those factors cause height of the
tide varies from day to day but the fluctuations are predictable. Gravitational pull by sun
is actually stronger than moon gravitational pull. However, gravitational forces that
created by sun that affect tides much weaker than the moon as the moon located a lot
closer than the sun (Boatsafe, 2009).
19
2.9.1 Types of Tide
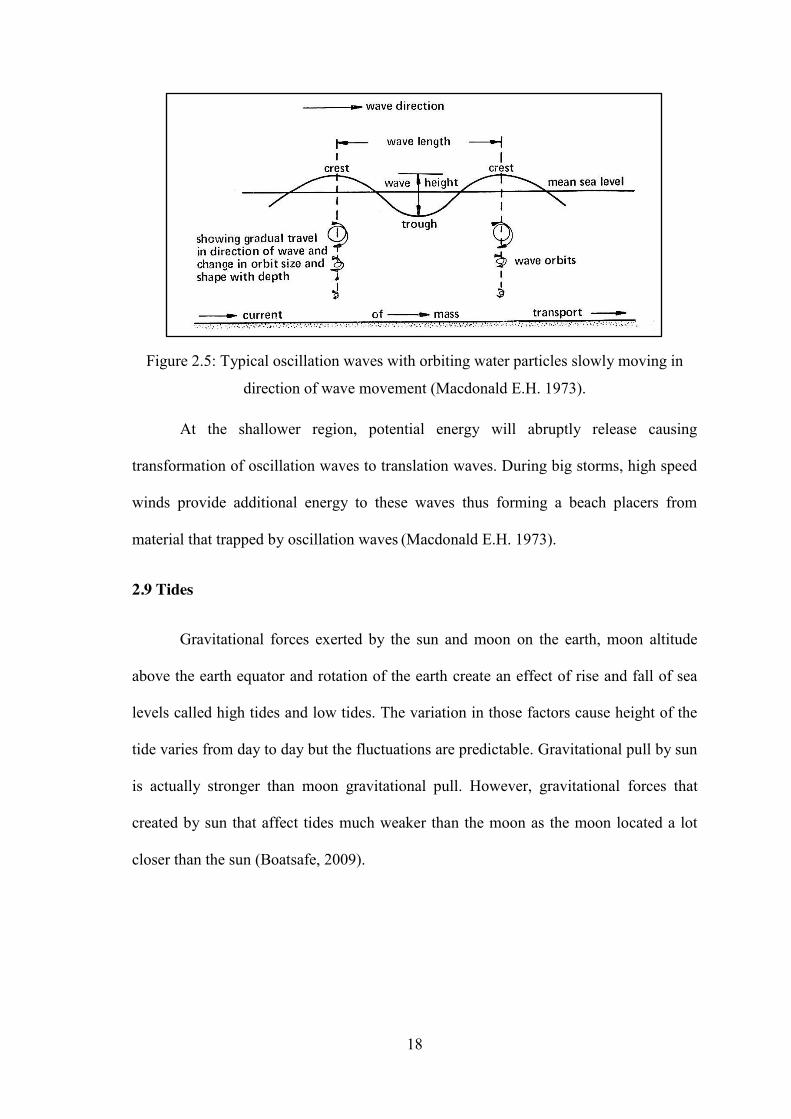
Some part of the earth may experience only two tides a day and some part may
experience four times a day. There are three types of tide which are 1 – Diurnal tide; 2 -
Semi-Diurnal tide and 3 – Mixed tide (Tide, 2013).
Figure 2.6: Types of tides and their distribution (Tide, 2013).
As shown in Figure 2.6, the most common are semi-diurnal tide which
experiences two high and two low tides a day and diurnal type of tide which
experiences one high tide and low tide a day. Mixed tide are almost the same with
20
semi–diurnal tides but the two high tides having significant difference level. Same goes
to the two low tides levels. The daily difference of tide levels are not consistence
because of the location of moon which create different gravitational forces to the water
(Tide, 2013).
Malaysia is one of the parts that experience 4 times of tides a day along the
shoreline which the two are almost equal levels of high tides and another two are almost
same levels of low tides.
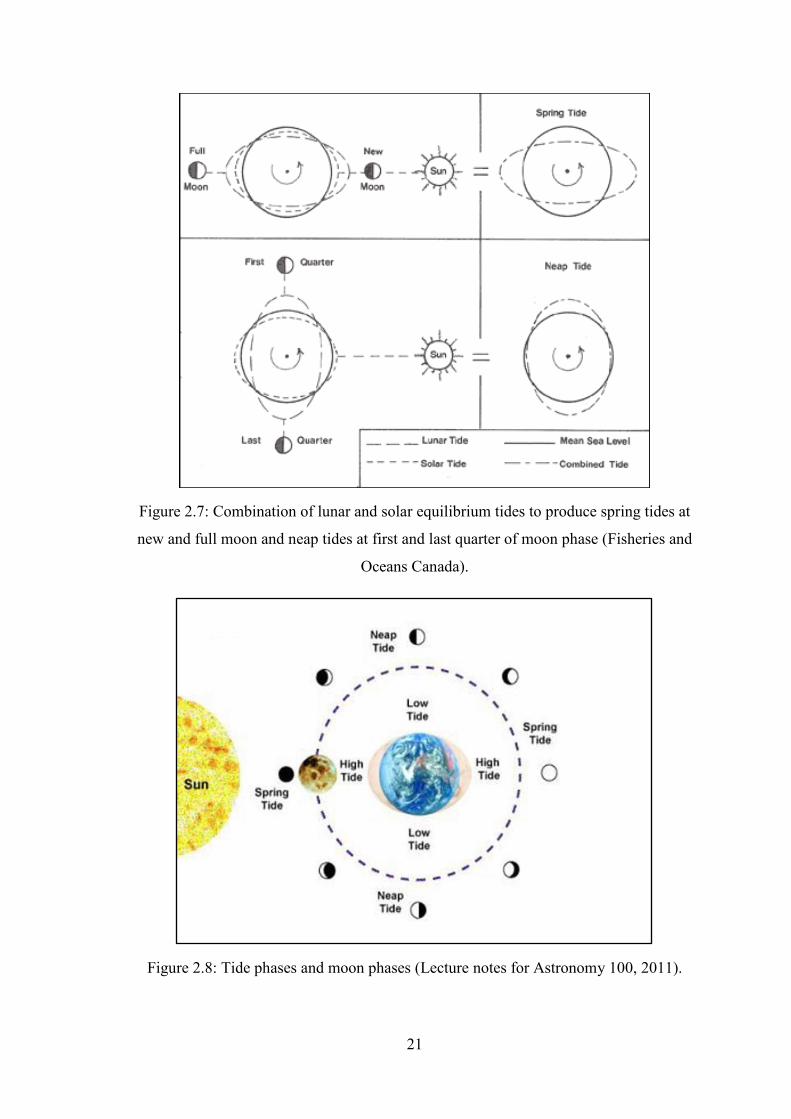
2.9.2 Spring Tide and Neap Tide
At most common cases, spring tide occur twice a month at the time of full moon
and new moon. The gravitational forces from the sun and moon combined together and
cause the tide to rise to higher and fall lower than the average tide (Fisheries and
Oceans Canada).
Same goes to neap tide, it also occurs twice a month. Neap tide is formed at the
time of first and quarter moon phase when the sun, earth and moon form a right angle.
The gravitational forces by moon and sun that exerted to the earth are destructing each
other causing the tide to reduce to lower level than the average (Fisheries and Oceans
Canada). The illustration of the combination of lunar and solar equilibrium tides to
produce spring tides at new and full moon and neap tides at first and last quarter of
moon phase was shown in Figure 2.7 and 2.8.
21
Figure 2.7: Combination of lunar and solar equilibrium tides to produce spring tides at
new and full moon and neap tides at first and last quarter of moon phase (Fisheries and
Oceans Canada).
Figure 2.8: Tide phases and moon phases (Lecture notes for Astronomy 100, 2011).
22
2.10 Currents
Ocean currents are very important in littoral transportation of sedimentary
particles along the shore line. Current can be divided into four types which are: 1 – Rip
currents; 2 – Density currents; 3 – Longshore currents and; 4 – Current of mass
transport. Rip and density currents move particle away from the beach while longshore
currents move particles parallel along the shore. Current of mass transport move
sediments on the shore with their strength (Macdonald E.H. 1973).
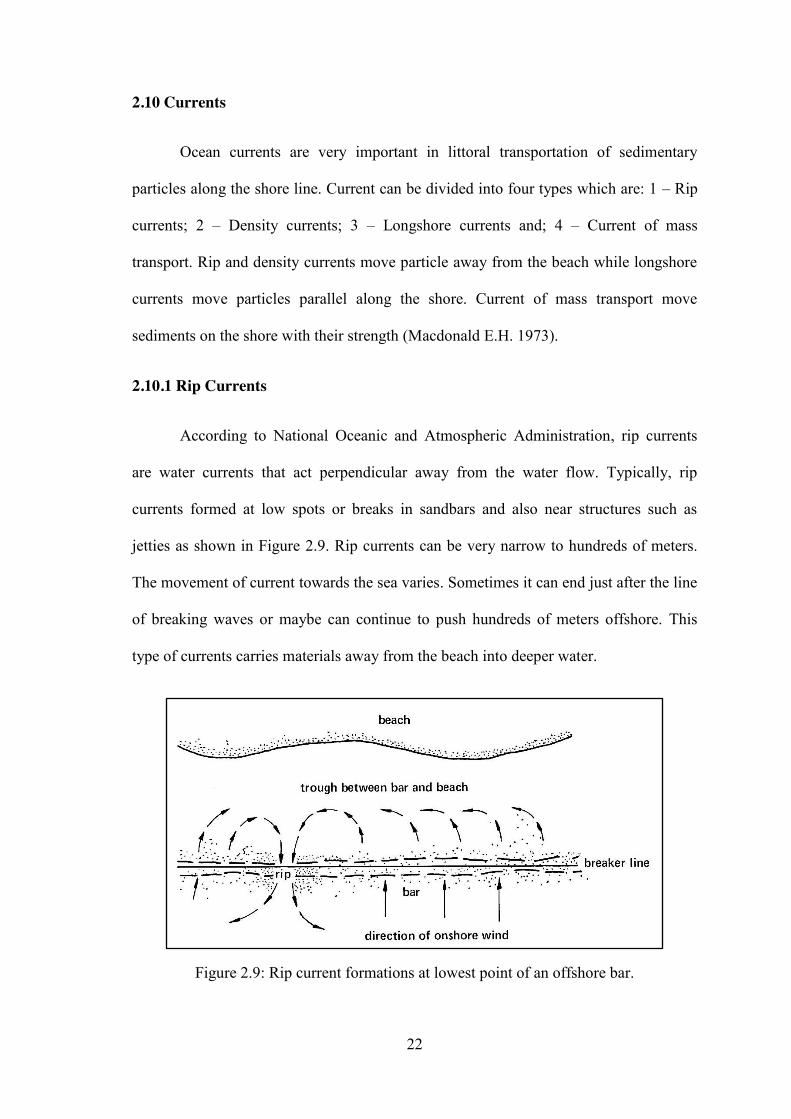
2.10.1 Rip Currents
According to National Oceanic and Atmospheric Administration, rip currents
are water currents that act perpendicular away from the water flow. Typically, rip
currents formed at low spots or breaks in sandbars and also near structures such as
jetties as shown in Figure 2.9. Rip currents can be very narrow to hundreds of meters.
The movement of current towards the sea varies. Sometimes it can end just after the line
of breaking waves or maybe can continue to push hundreds of meters offshore. This
type of currents carries materials away from the beach into deeper water.
Figure 2.9: Rip current formations at lowest point of an offshore bar.
23
2.10.2 Density Currents
Density currents are formed due to the difference in density of fluids. The
material will flow away from the shore since the fall of pressure is away from the shore.
This type of currents may help in erosion of one beach by transporting materials away
from the beach or contribute to the formation of another shore by supplying materials to
a new beach (Macdonald E.H. 1973).
2.10.3 Longshore Currents
Longshore currents is formed when waves strikes the beach at an angle. The
transportation of sedimentary particles along the continental shelf by this current can
create a zigzag pattern of particles movement along the shore. Longshore current is
shown in Figure 2.3 (Woods Hole Group, 2011)
2.10.4 Currents of Mass Transport
When waves moves to shallower part of the beach, the wave orbits formed
below the wave are flattened causing expansion of their energy which can contribute to
the movement of sediments towards and away from the shore. Since it is very slight,
but, it also assists the movement of particles towards the shore (Macdonald E.H. 1973).

24
2.11 Wind
Wind also plays an important role in transporting material from frontal dunes to
higher level without helping of wave from the sea. Some of the steady build-up along
the coastline is the only part of general migration of sand away from the beach.
Heavy mineral are redistributed by the wind action after being distribute by the
wave action. Onshore wind causes waves to steepen and become destructive while
offshore winds flatten seas and lead to build up. Both onshore and offshore wind may
erode the beaches by the removal of sands in the direction of winds (Macdonald E.H.
1973).

25
CHAPTER 3
RESEARCH METHODOLOGY
3.1 Introduction
In this study, 5m width and 8m long of black sands deposit area along the shore
was stripped to 1 inch depth to know the rate of new black sands deposit to recover back
the excavated black sands deposit to the original beach level and to determine the new
beach level on the excavated black sands deposit area after the high tide effect. Samples
of black sands deposit were also taken at 7 marked points around the area of study twice
a day during low tide each day.
In this study, the black sands deposit samples were dried first before further
analyses were carried out. Samples of black sands deposit undergo further physical
separation analysis to determine their heavy minerals concentration of the black sands
deposit. The analysis was done by using mozley table to know the percentage of heavy
minerals and the percentage of light minerals of the black sands deposit at every point
after the tides effect on a day before.
Mineralogical study of the sample is also done to determine the minerals present
in the black sands deposit. The mineralogical study is done by using optical microscopy
analysis and Scanning Electron Microscopy-Energy Dispersive X-Ray Spectroscopy
(SEM-EDX) analysis. Magnetic separator and high tension separator were used to
determine the minerals based on mineralogical behaviour of the present minerals before
microscopy study is done to identify the minerals present based on tis properties.

26
Finally, the data obtained from the site and lab were analysed and tabulated to
determine the level of the excavated black sands deposit after redistributed and to
determine the concentration of heavy mineral of the black sands deposit.
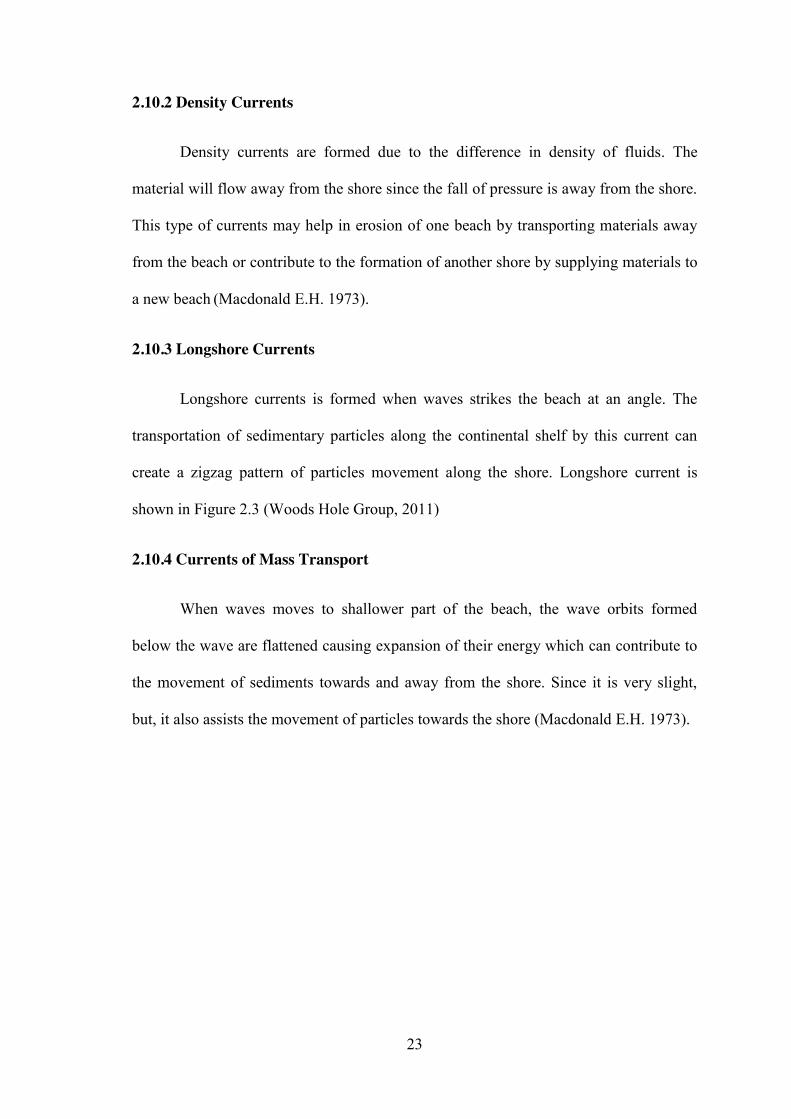
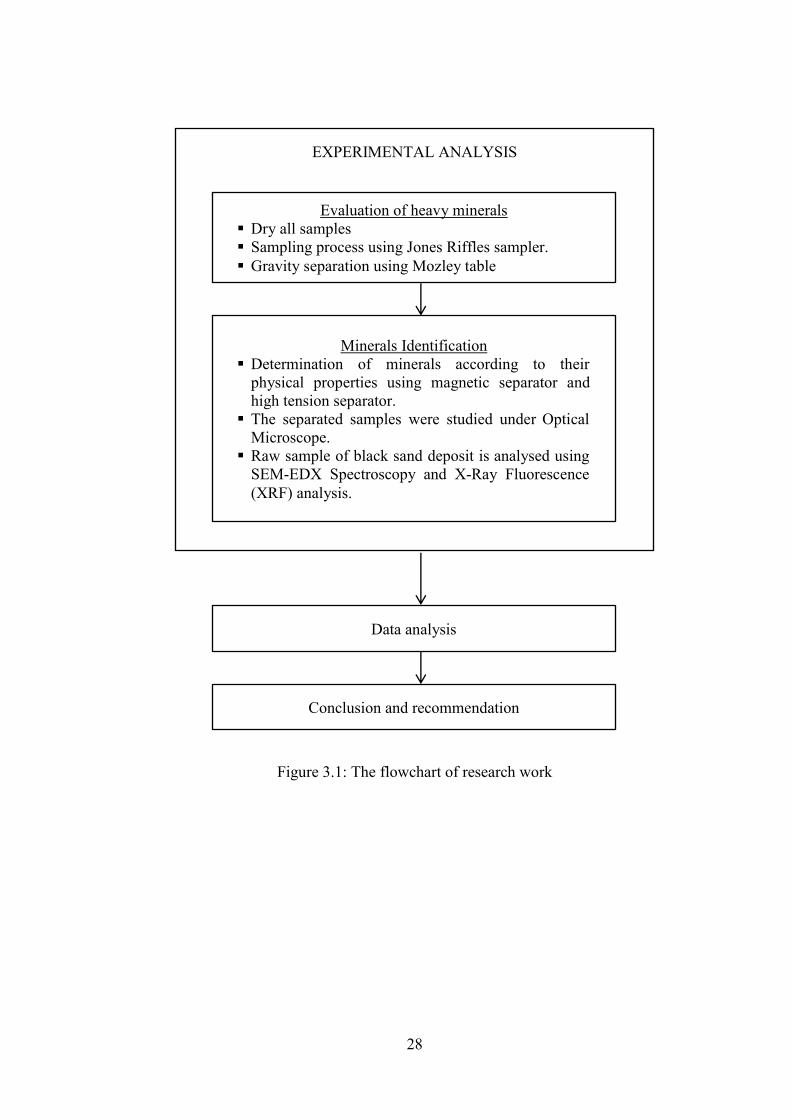
Based on the objective and the scope of research, an overall process flow-chart
of the study was proposed for designing and evaluating work to be done in this beach
mining research effectively. Some of the factors to study the beach mining method are
to designing the less environmental mining method at that area and to obtain a set of
data with are reproducible values within the required limits. It is simple, but yet
practical for the purpose of further studies. The overall process flow-chart are shown in
Figure 3.1.

27
SITE STUDY
LAB ANAYSIS
Evaluation and Design of Beach Mining in Pantai Pasir Hitam, Langkawi.
Literature study Geological research on formation of Langkawi
Island. Acquire permission from JMG for research study. Tide level analysis.
Determine the proposed area Block 5m width × 8m long of beach area towards
the sea. 7 Points of interest are marked with stakes.
Stripping Samples were taken at the 7 marked points before
stripping to evaluate the original heavy mineral concentration.
Strip the beach placer within 1 inch of depth to represent strip mining in small scale.
Redistribution of beach placer deposit New levels of the refilled beach placer are recorded
2 times a day after high tide at all marked points. Samples are taken after each high tide for heavy
mineral evaluation.
28
EXPERIMENTAL ANALYSIS
Figure 3.1: The flowchart of research work
Evaluation of heavy minerals Dry all samples Sampling process using Jones Riffles sampler. Gravity separation using Mozley table
Minerals Identification Determination of minerals according to their
physical properties using magnetic separator and high tension separator.
The separated samples were studied under Optical Microscope.
Raw sample of black sand deposit is analysed using SEM-EDX Spectroscopy and X-Ray Fluorescence (XRF) analysis.
Data analysis
Conclusion and recommendation
29
3.2 Literature Investigation
3.2.1 Geological Study
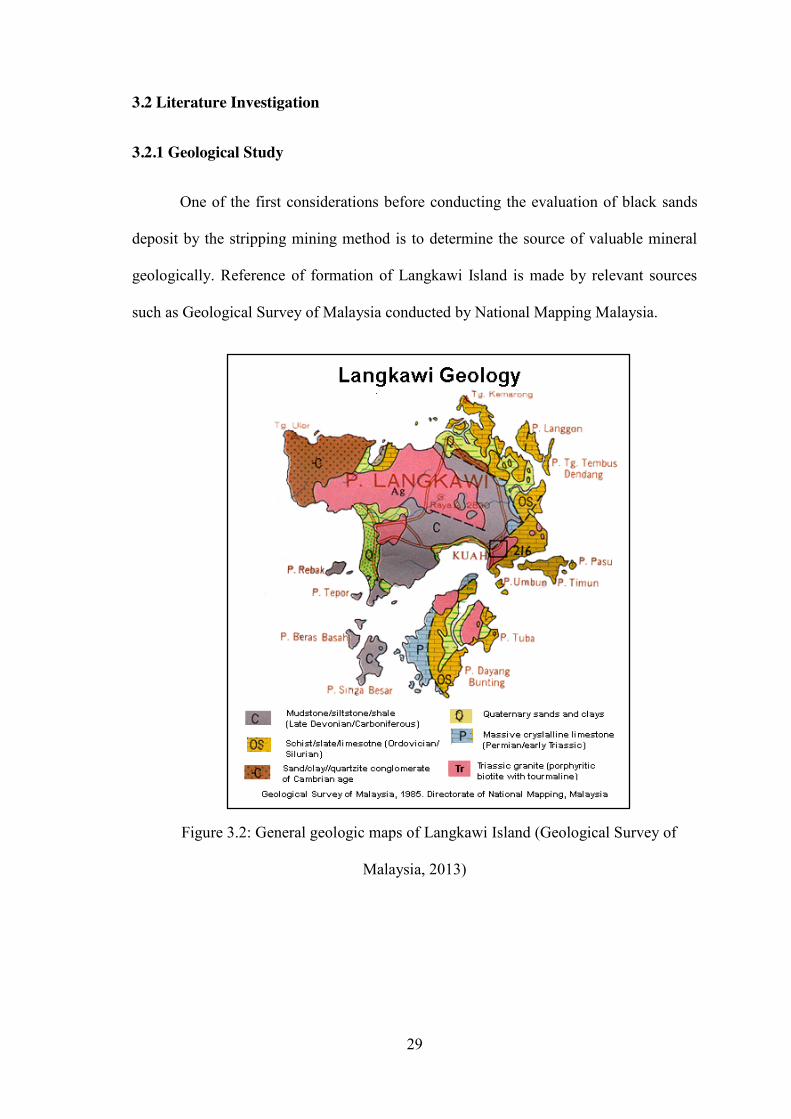
One of the first considerations before conducting the evaluation of black sands
deposit by the stripping mining method is to determine the source of valuable mineral
geologically. Reference of formation of Langkawi Island is made by relevant sources
such as Geological Survey of Malaysia conducted by National Mapping Malaysia.
Figure 3.2: General geologic maps of Langkawi Island (Geological Survey of
Malaysia, 2013)
30
The source of heavy mineral in the beach placer should be determined at the
early stage of exploration to study the formation of valuable heavy mineral whether it
comes from igneous rock of Triassic age or sedimentary rock of late Devonian or
Carboniferous age. Topographical features around Pantai Pasir Hitam area also
investigated to understand the condition of site, the surrounding geology, and the shape
of beach area.
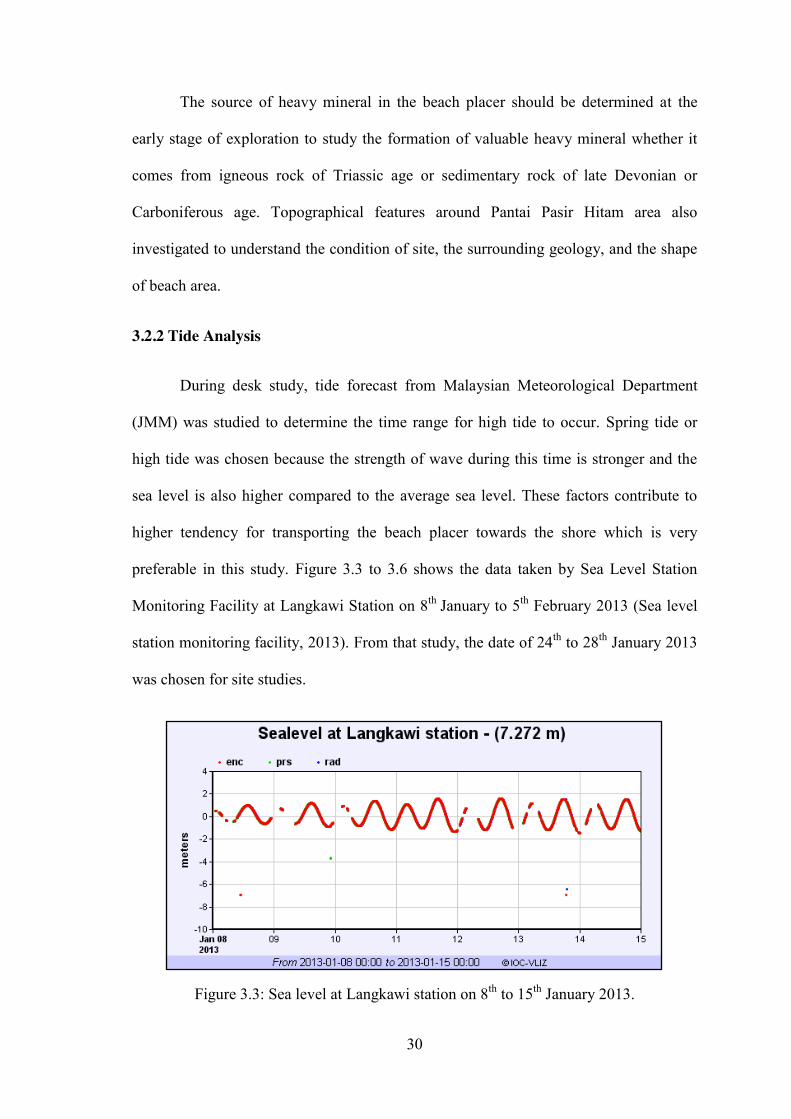
3.2.2 Tide Analysis
During desk study, tide forecast from Malaysian Meteorological Department
(JMM) was studied to determine the time range for high tide to occur. Spring tide or
high tide was chosen because the strength of wave during this time is stronger and the
sea level is also higher compared to the average sea level. These factors contribute to
higher tendency for transporting the beach placer towards the shore which is very
preferable in this study. Figure 3.3 to 3.6 shows the data taken by Sea Level Station
Monitoring Facility at Langkawi Station on 8th January to 5th February 2013 (Sea level
station monitoring facility, 2013). From that study, the date of 24th to 28th January 2013
was chosen for site studies.
Figure 3.3: Sea level at Langkawi station on 8th to 15th January 2013.

31
Figure 3.4: Sea level at Langkawi station on 15th to 22th January 2013.
Figure 3.5: Sea level at Langkawi station on 22th to 29th January 2013.
Figure 3.6: Sea level at Langkawi station on 29th January to 5th February 2013.

32
3.3 Site Study
Site studies are done to meet the main objective of this project and the research
scope. Primary exploration is to establish an estimation of ore reserves, their volume
and grade, calculate the mine life of mining operation and potential profit (Hartman
H.L. et al., 2002). But, due to time restriction, equipment technologies, objective and
scope of project, the primary exploration of this project is only done to investigate the
origin of black sands deposit, rate of black sands deposit to recover back the excavated
black sands deposit to original level and also the concentration of heavy minerals in
black sands deposit.
3.3.1 Area Determination
After literature and geological study has been done, the site area has been
purposed for further investigation. Pantai Pasir Hitam is one of the main attraction
location for tourists because of the uniqueness of the black sand and the only location in
Malaysia that has black sand. Since, it is the main attraction area, the area for study
should be less of distraction to avoid error in obtaining the result of this study. The
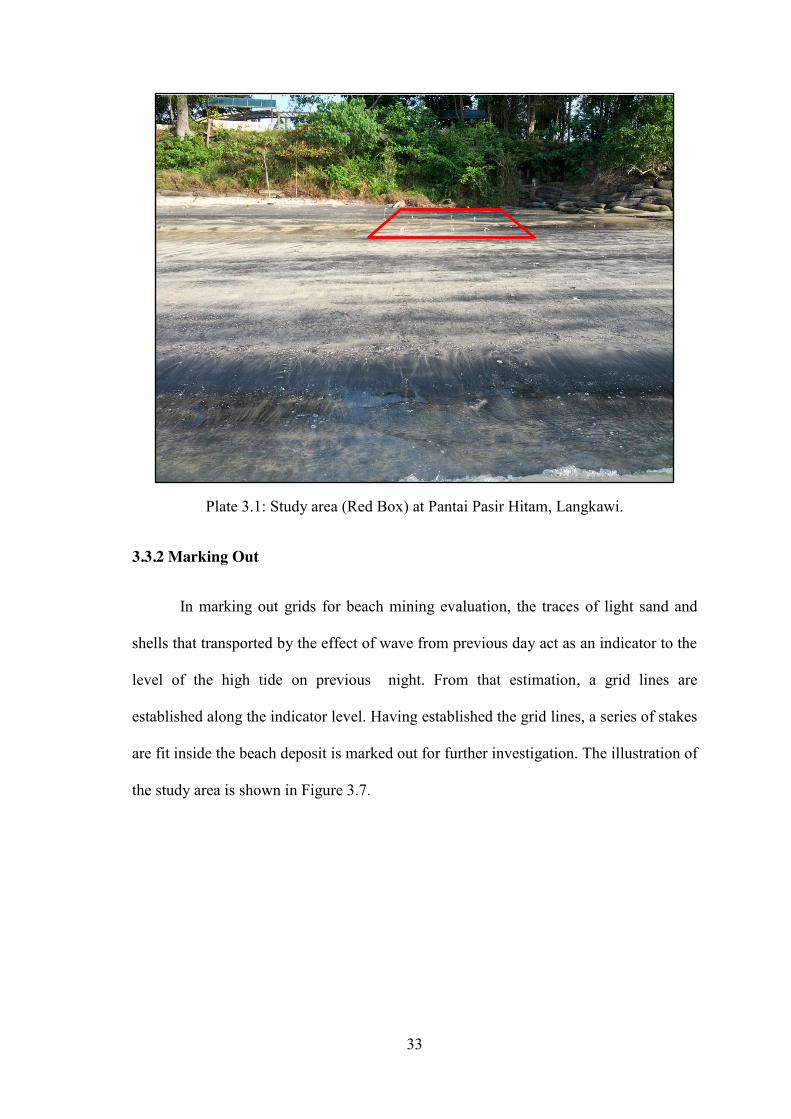
proposed area is shown in Plate 3.1.
33
Plate 3.1: Study area (Red Box) at Pantai Pasir Hitam, Langkawi.
3.3.2 Marking Out
In marking out grids for beach mining evaluation, the traces of light sand and
shells that transported by the effect of wave from previous day act as an indicator to the
level of the high tide on previous night. From that estimation, a grid lines are
established along the indicator level. Having established the grid lines, a series of stakes
are fit inside the beach deposit is marked out for further investigation. The illustration of
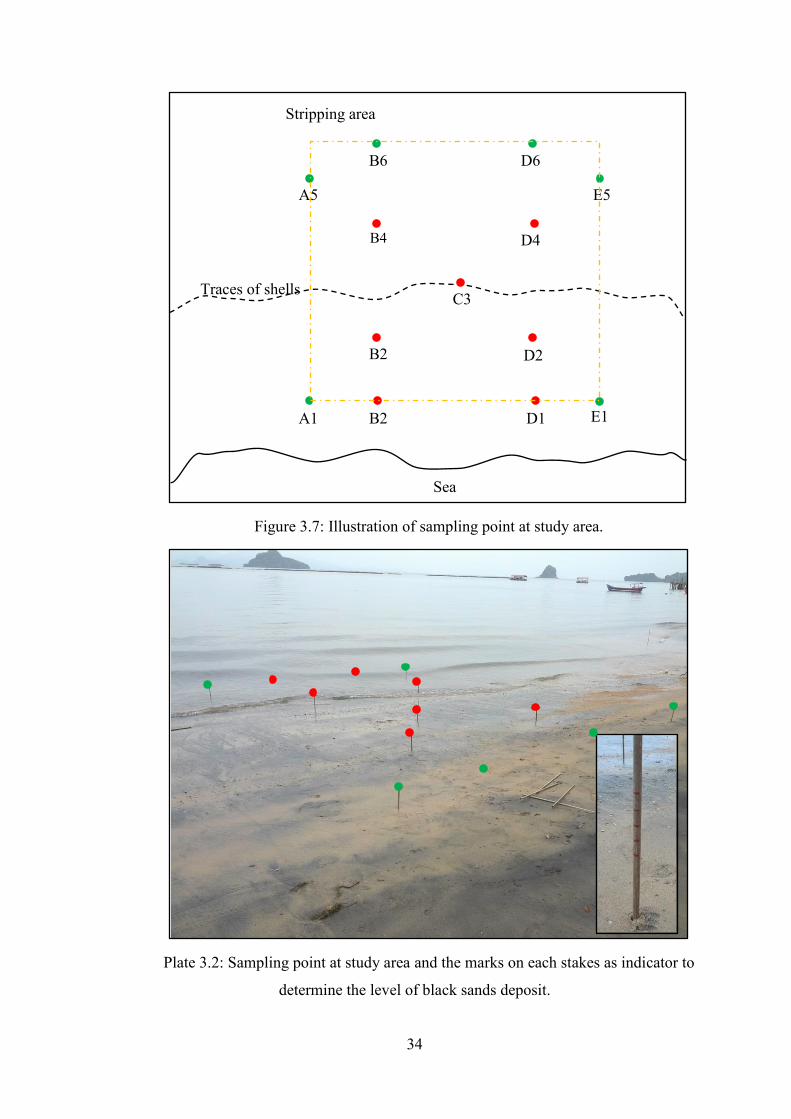
the study area is shown in Figure 3.7.
34
Figure 3.7: Illustration of sampling point at study area.
Plate 3.2: Sampling point at study area and the marks on each stakes as indicator to
determine the level of black sands deposit.
E1 A1 B2
B2
B4
B6 D6
D4
C3
D2
D1
E5 A5
Traces of shells
Sea
Stripping area
35
Each of the stakes is marked with permanent marker pen for estimation of the
new level of black sands deposit after redistributed after high tide. 5 marks with interval
of 1 inch is marked on the stakes to indicate the beach level before and after
redistributed. The stakes are buried inside the black sands deposit until it reaches the
middle indicator to indicate the original level of black sands deposit. Plate 3.2 shows the
actual sampling point and the stakes indicator used in this investigation.
Yellow dotted line in Figure 3.7 represents the area of small scale stripping
mining need to be done for this study. The stripping area is 5m width × 8m long
towards the beach. In both pictures above, red and green dots represent the interested
area of study and analysis that need to be done. Red dots represent the points where
heavy mineral evaluation and determination of black sands deposit level after
redistributed by wave effect need to be done. Green dots represent points where it only
interested in the determination of black sands deposit level after being redistributed.
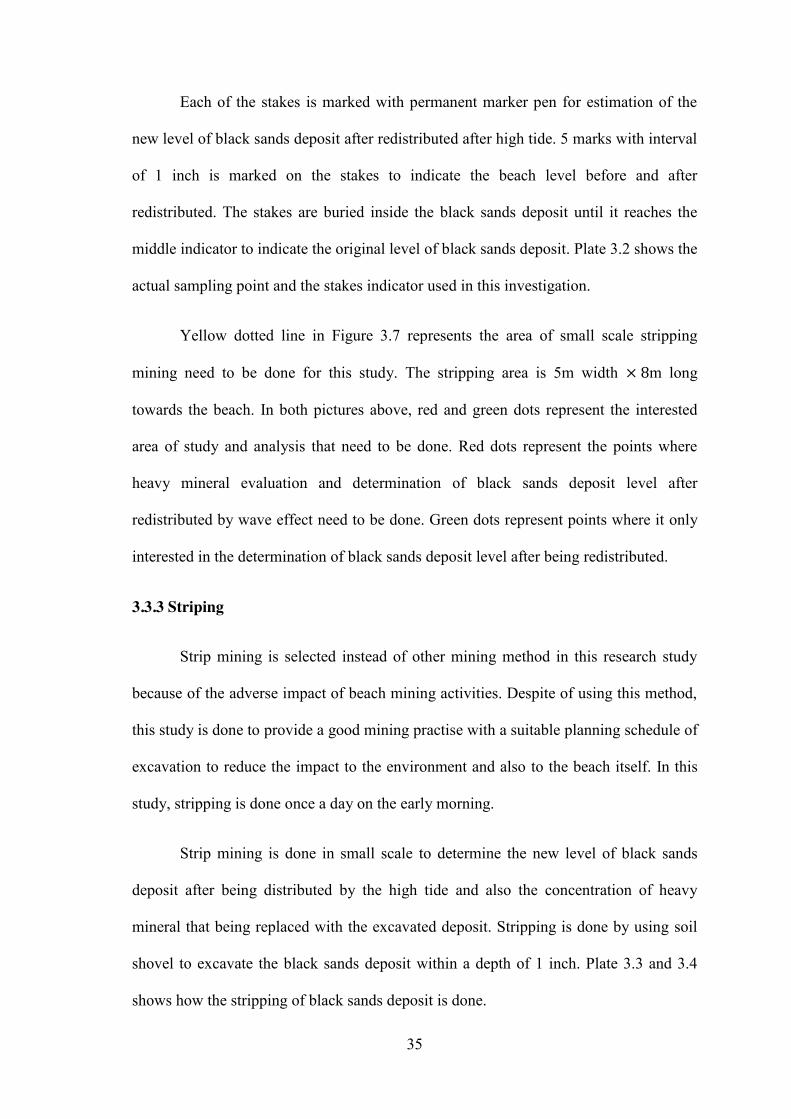
3.3.3 Striping
Strip mining is selected instead of other mining method in this research study
because of the adverse impact of beach mining activities. Despite of using this method,
this study is done to provide a good mining practise with a suitable planning schedule of
excavation to reduce the impact to the environment and also to the beach itself. In this
study, stripping is done once a day on the early morning.
Strip mining is done in small scale to determine the new level of black sands
deposit after being distributed by the high tide and also the concentration of heavy
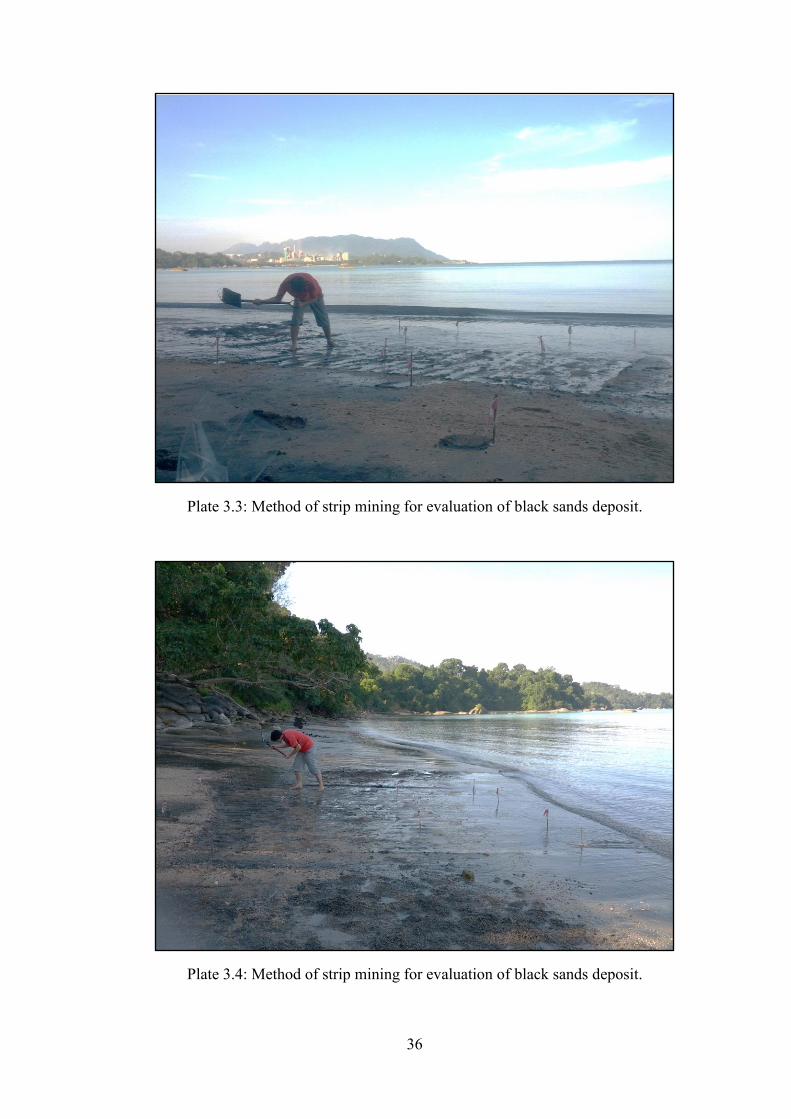
mineral that being replaced with the excavated deposit. Stripping is done by using soil
shovel to excavate the black sands deposit within a depth of 1 inch. Plate 3.3 and 3.4
shows how the stripping of black sands deposit is done.
36
Plate 3.3: Method of strip mining for evaluation of black sands deposit.
Plate 3.4: Method of strip mining for evaluation of black sands deposit.
37
3.3.4 Sampling Activities
Sample collection is being done in two times a day after the occurrence of the
two high tides. There are 7 samples that collected in each series of sampling activities.
The samples are collected on the red dots points shown in Figure 3.7. First series of
sampling activity are taken before the stripping mining is done. This is done to estimate
the original concentration of heavy minerals in the black sands deposit before being
disturbed. Next samples were collected in the early morning and late afternoon during
the low tides on each day to determine the concentration of heavy minerals after
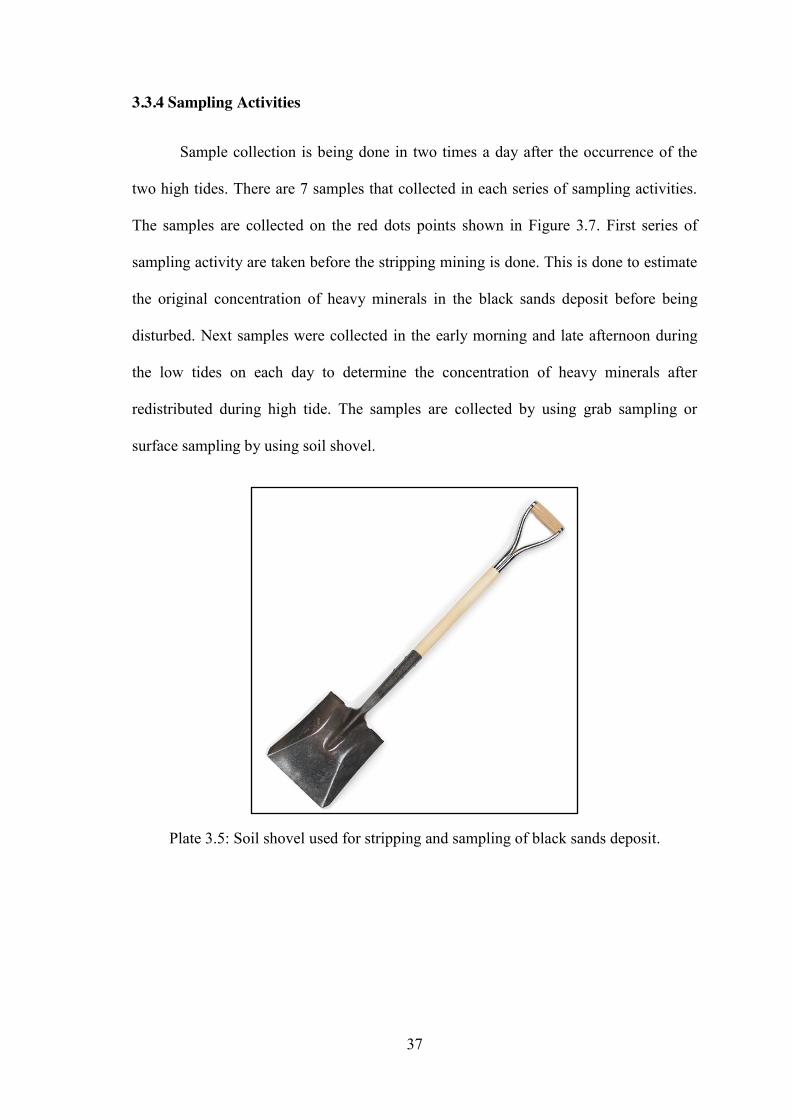
redistributed during high tide. The samples are collected by using grab sampling or
surface sampling by using soil shovel.
Plate 3.5: Soil shovel used for stripping and sampling of black sands deposit.

38
3.3.5 Rate of Redistribution Analysis
Rate of redistribution analysis is done to determine the new levels of the refilled
black sands deposit after redistributed during high tide on each day. The new levels are
recorded 2 times a day after high tides at all 13 marked points. The data are taken on all
red and green dots points shown in Figure 3.7.
Before stripping is done, all the stakes are marked with permanent marker pen to
act as a ruler for determining the level of black sands deposit. The stakes is marked with
5 marks with interval of 1 inch along the stakes. Firstly, the stakes are embedded into
the ground until it reaches the middle of the marks. This mark indicates the original
level of black sands deposit. Plate 3.2 shows the actual sampling point and the stakes
indicator used in this study.
After stripping is done, the level of black sands deposit reduces to about 1 inch.
The stripping area is left for half day for high tide to take effect. . The new level data
were collected in the early morning and late afternoon like sampling activities during
the low tides 2 times a day. The data were used for redistribution analysis in
determining rate of new black sands deposit to recover back the excavated black sands
deposit to the original beach level.

39
3.4 Experimental Analysis
The overall process flowchart of this research was shown in Figure 3.1. The
objective of this analysis is to calculate the concentration of heavy mineral present in
the black sands deposit and also identify the mineral present in the black sands deposit.
Determination of heavy mineral concentration in black sands deposit was done by using
gravitational separation method to separate the light and heavy minerals accordingly.
Mineral present in black sands deposit are being identified according to their physical
properties. Magnetic and high tension separator was used to separate this sample before
evaluated using Transmitted Polarizing Microscope.
3.4.1 Evaluation of Heavy Minerals
Sampling preparation was carried out on the sample before any experimental
process can proceed. Sampling plays a very important role in experimental analysis.
Any improper sampling will result in experimental error and the data expected may not
achieve. Therefore, sampling is done properly to ensure the samples are homogenous as
well as labelling.

40
Figure 3.8: Detail flowchart for heavy minerals evaluation.
Sample collected from Pantai Pasir Hitam was dried first in an oven for one day
at 100oC to ensure the sampling is done perfectly. The dried samples were then
undergoes sampling process by using Jones Riffles sampler until weight of 70g to 120g
are achieved. The remaining samples were kept for future reference and research.
Evaluation of Heavy Minerals
Dried in oven for 1 day at 103 oC
Jones Riffles sampling - Separate until 70 to 120g is achieved.
Sieve (1.4mm)
Particles (>1.4mm) Particles (<1.4mm)
Mozley Table
Light minerals
Heavy Minerals
Weight the sample
Weight the dried sample
Weight the dried sample
Light minerals
Mozley Table

41
The separated samples were further separated by using 1.4 mm sieve. This is
done to increase the efficiency of Mozley table for further gravity separation. Moreover,
the heavy minerals were found only in fine size (less than 1 mm). Fine samples were
then separated by using Mozley table. The separation is done for two times for each
sample to increase the heavy mineral recovery and reduce the amount of light mineral in
concentrate. Calculation is done to determine the percentage of heavy mineral in all
samples. Detail flowchart for heavy mineral evaluation is shown in Figure 3.8.
3.4.1.1 Mozley Table
The Mozley table is mainly used in mineral processing laboratories and not
suitable to be used in large scale industries as the operation can be done in a small scale.
Mozley table was designed to treat a small scale sample around 100 g. The shaking
process produce orbital shear on the sample allowing the heavy particles in the flowing
film to settle while the suspended light particles pass to the tailings.
Mozley table was used in this research to determine the concentration of heavy
mineral in black sands deposit. Through this gravity concentration separation, the black
sands deposit are separated according to their specific gravity. Heavy mineral will stay
in the tray while light minerals are discharged with the water flow. In this analysis, 70
to 120 g of black sands deposit is separated by using mozley table. The product of
heavy minerals is collected in a beaker while the light particle from the tailing was
repeated for second time to increase the recovery of heavy minerals.
42
3.4.2 Mineral Identification
The valuable minerals found in black sands deposit have specific gravity which range
from 3.7 to 7.1. These minerals are resistance to weathering and physical abrasion and
usually found as granular materials with particle size distribution between 1.4 mm to
0.074 mm (Macdonald E.H. 1973). This minerals need to be analysed to identify the
minerals present in the black sands deposit. Two methods are done for identification of
black sands mineral. The methods are done by using optical microscope for physical
analysis and Scanning Electron Microscopy-Energy Dispersive X-Ray Spectroscopy
(SEM-EDX) analysis.
Remaining samples from the previous experiment is further split into two. First
samples are divided for SEM-EDX analysis. The other part was used for physical
analysis. In physical analysis, the samples are separated using magnetic separator to
separate the magnetic minerals. Then, both of the separated samples are run through
high tension separator to determine the minerals which conductor or not. All the
separated samples are then analysed under Optical Microscope Microscope. Detail
flowchart shown in Figure 3.9.

43
Figure 3.9: Detail flowchart for mineral identifications.
Minerals Identification
SEM-EDX analysis & XRF analysis
Physical analysis
Magnetic Separator
Non-Magnetic Minerals
Weight the sample
Jones Riffles sampling
Magnetic Minerals
High-tension Separator
Non-Conductor Minerals Non-
Conductor Minerals
High-tension Separator
Non-Conductor Minerals
Conductor Minerals
Optical Microscope
44
3.4.2.1 Magnetic Separator
Magnetic separators are used for separating heavy mineral concentrates into
magnetic and non-magnetic fractions. Magnetic separators can be used to separate
different types of magnetic particles depending on the type of the separator used. They
can separate either diamagnetic, paramagnetic or ferromagnetic particles by using high
intensity magnetic separator usually known by ‘HIMS’ or low intensity magnetic
separator which are known by ‘LIMS’. The operation of these separators can be
performed in wet or dry condition depending on the process (Wills B.A. et al., 2006).
In this research, dry magnetic separation method was performed to separate
magnetic minerals in black sands deposit such as ilmenite and any magnetic minerals
from the sample. Rare earth magnetic roll separator was used to separate sample black
sands deposit to for mineral identification.
Sample was run 3 times with appropriate feeder speed and roller speed to
achieve a good separation. The magnetic separator was run at feeder speed of 5 rpm and
roller speed of 12 mpm (meters per minute). Both of magnetic and non-magnetic
samples were observes under optical microscope for mineral identification.
3.4.2.2 Electrostatic (High-Tension) Separator
Electrostatic separators are used for separating heavy mineral concentrates into
conductor and non-conductor fractions. There are two forces that working together in
separating a material in those fractions. The forces are gravitational forces and
electrostatic attraction. Particles are charged by a corona discharged while flowing on a
drum. Conductor materials will lose their charged and repelled to one fraction and non-
conductor materials will stay on the drum until swiped out to the other fraction (Wills
B.A. et al., 2006).

45
In this study, non-conductor sample was run three times to achieve a good
separation. After being separated, the fractions were run under optical microscope for
mineral identification.
3.4.2.3 Optical Microscope
In this study, optical microscope is be used in identifying mineral based on the
physical characteristic of minerals. Experience observers may differentiate between the
numbers of minerals present using hand lens only. However, for detail mineralogical
identification, chemical and physical examination need to be conducted.
A microscopic study of the sample is important in identifying the minerals
present in the black sands deposit. Understanding mineral constituent in the samples
provide useful information especially in estimation of ore reserved, mineral economics,
mineral processing methods required, etc. For this research, 4 separated samples from
high-tension separators were observed under microscope to determine the minerals
present in the black sands deposit sample.
46
3.4.2.4 Scanning Electron Microscopy-Energy Dispersive X-Ray Spectroscopy
(SEM-EDX)
The scanning electron microscopy is versatile non-destructive equipment used to
characterize solid sample. SEM used a focused beam high-energy electrons to generate
a variety of signals at the surface of solid specimens. The sample scanned must be
electrically conductive, at least at the surface, and electrically grounded to prevent the
accumulation of electrostatic charge at the surface. If the sample is conductive, coating
is needed (Surface Science Western). In this research, sample of black sand is coated
with gold first because there are some minerals that are non-conductive present in the
sample.
EDX is an analytical technique used for elemental analysis or chemical
characterization. In this experiment, FESEM Machine SUPRA 35VP ZEISS equipped
with EDX is used to analyse the raw sample to determine the minerals present in the
black sands deposit.
3.4.2.5 X-ray Fluorescence (XRF) Analysis
X-ray Fluorescence (XRF) test is being doing to know the chemical composition of
the beach placer sample. The preparations of doing XRF test are being doing properly to
avoid the contamination of the sample with the other material. For this test, 25 grams of
grinding samples which are below 75μm are needed.
XRF test is the most efficient technique to know the definite chemical composition
of the material especially beach placer samples without destroyed the samples.
Radioactive waves that call X-Ray are being using to test the specimen. This specimen
will be reacted or activated and become excited and will produce that ray. The X-ray
will hit the electron in the atom of the sample and cause the one empty electron in thee

47
orbit. Electron from the outer orbit will move into inner orbit in the atom. The X-ray
will be emitted from these this moving. A detector machine are been using to measure
the strength and position of the ray that has been emitted. The position of the ray will be
detected to know the types of the elements and the strength of the ray is for the intensity
of these elements. All the elements can be analysed by XRF test except hydrogen,
helium, and lithium elements. The XRF machine is consist three main parts that are
source of the ray, crystal spectrometer and the detector. (Oxford-XRF, 2012)
48
CHAPTER 4
RESULT AND DISCUSSION
4.1 1ntroduction
This chapter will present the data and results obtained from the research and
experiments conducted in this project. The data and results that have been recorded will
be discussed in detail in this chapter.
4.2 Site Study
The project site is Pantai Pasir Hitam that located in Langkawi Island in Kedah
state. Referring to geological map of Langkawi Island, Pantai Pasir Hitam area is
surrounded by 2 types of rock which are 1- granite rock from Triassic age and 2 –
Mudstone, siltstone and shale from late Devonian or Carboniferous age.
From physical observation on topographical features around the site area, the
heavy mineral can be seen clearly to be distributed due to the wave action. Based on
Plate 4.1, there are no traces of heavy minerals from the banks near the beach area. The
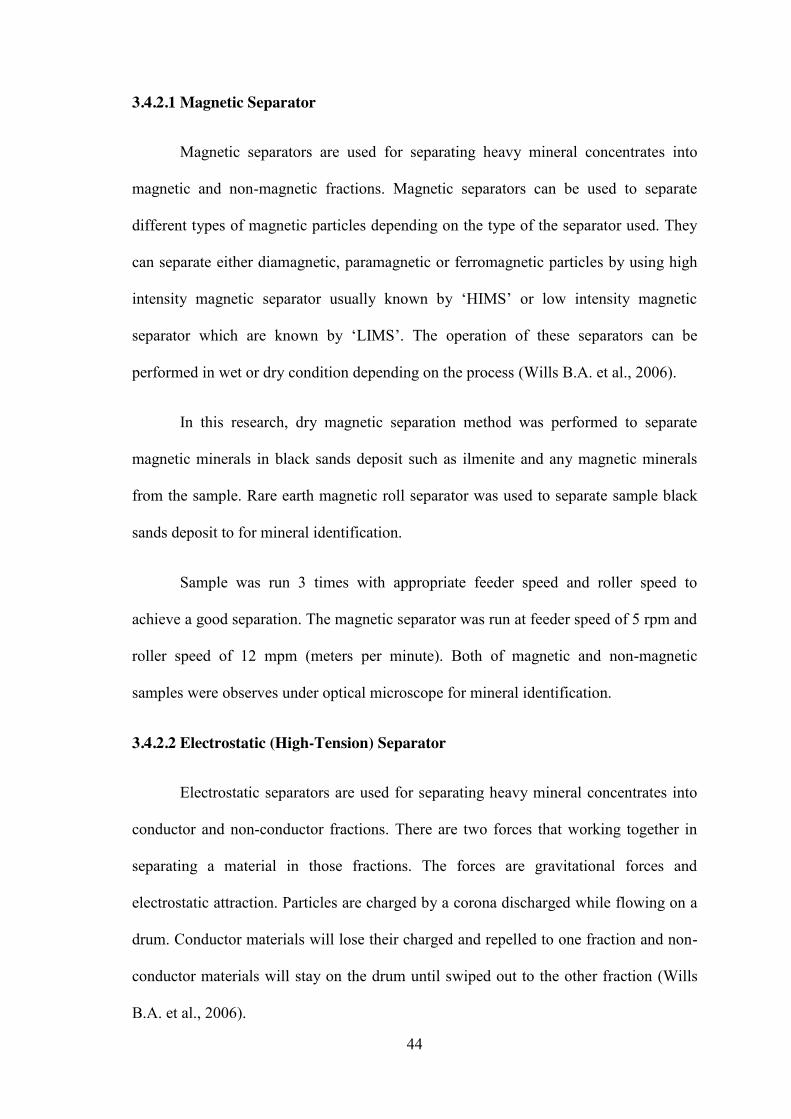
heavy minerals are found only in the foothills along the beach until several meters under
the sea as shown in Plate 4.2. These minerals are being transported from the sea to the
shore by the wave action.
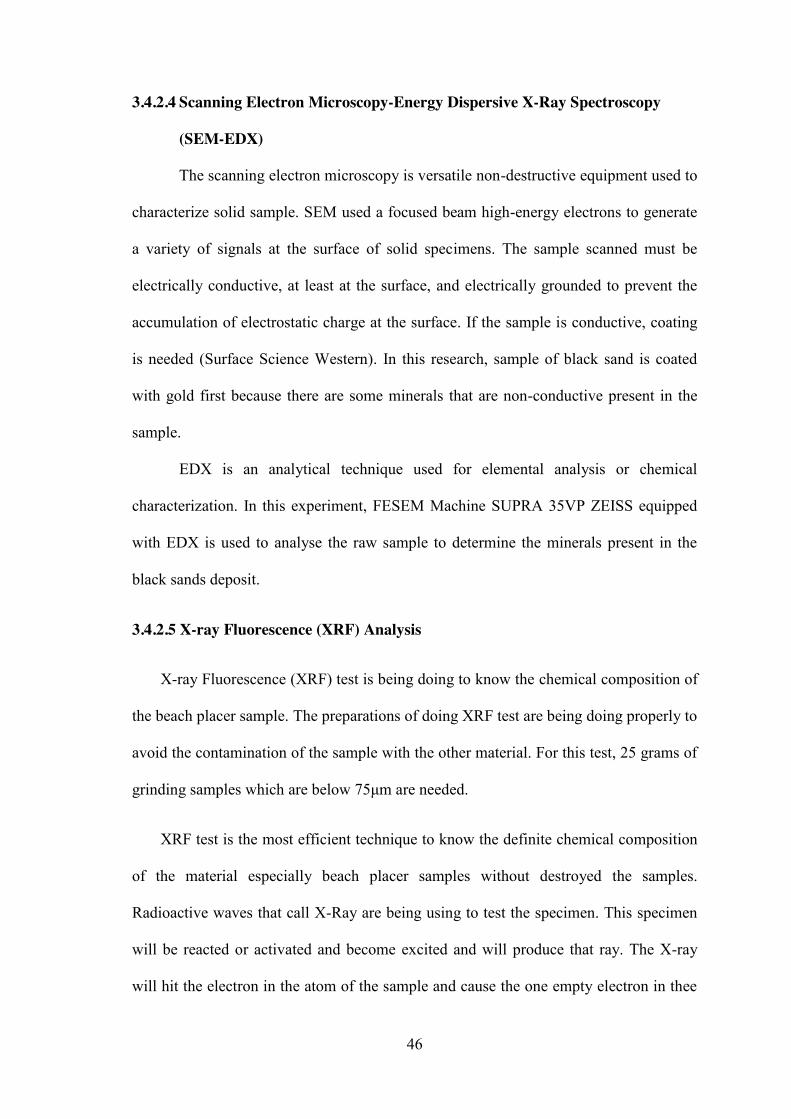
Plate 4.3 shows granitic rocks that contain black minerals which are likely to be
one of the parent rocks of these minerals. These minerals are then liberated by
weathering process when the materials are in contact with water and other rocks. Plate
4.4 shows holes and soils that had been dig by crabs called burrows. A layer of lighter
sand on top of black sand can be seen clearly indicate the present of black sand down
under the surface. Based on theory, crabs will make its burrow for several inches and

49
arrange them orderly on the surface. From that theory, it can be said that, the heavy
minerals can also be found inside the beach placer until several inches until the end of
the holes and maybe deeper.
Plate 4.1: Heavy mineral deposit present only on foothills along the banks at beach area.
50
Plate 4.2: Distribution of heavy minerals along the shoreline and under the sea.
Plate 4.3: Source of the heavy mineral deposit.
51
Plate 4.4: Burrows made by crabs.
Based on the physical observation along the shore line of Pantai Pasir Hitam, it
can be conclude that the beach placer deposits are transported by the wave action from
the sea towards the shore. One of the sources of heavy minerals that form the black sand
at that area is from the weathering process of granitic rock under the sea. The beach
placer can be found from several inches to several meters under the beach.
4.3 Rate of Redistribution Analysis
Heights of beach placer deposit are observed in this analysis to determine the
new levels of the refilled beach placer after redistribution by wave action. The data are
recorded from 13 marked point shown in Figure 3.7. The data were taken 2 times a day
after high tide to determine the increments of the beach placer levels after redistributed
by the wave action.
52
4.3.1 Day First (24.01.13)
On the first day, the stripping area was stripped about 1.5 to 2.0 inches deep
from the original surface level. But, not all marked points could be stripped on this day
because the level of water had been rise into the proposed study area while stripping
being done. On this day, sea level is ±2 m from the mean sea level as shown in Figure
3.5. Data of the first stripped levels are shown in Figure 4.1.
Figure 4.1: New beach placer level on 24.01.13 after first stripping.
After completed stripping the upper surface, the sea level keep on increasing until it
reach the middle part of the stripped surface. The high tide on this morning cannot
cover the upper part of the proposed area which causes no change in the beach level on
the top of stripped area. After 11.30 am, the sea level decreases until all the proposed
points are exposed. Data after day tide on this day is shown in Figure 4.2. After the data
has taken, the whole area was stripped about 2.0 inches deep from the original surface.
A1 B1
B2
B6 = -2.0”
D2
D1
Sea
Stripping area
E1
9.00 am – Rising
D6 = -2.0”
A5 = -2.0” E5 = -2.0”
D4 = -1.5” B4 = -1.5”
C3 = -1.5”
53
Figure 4.2: Data of beach placer level on 24.01.13 at evening.
Plate 4.5: Sea level was raising during stripping is done.
A1 B1
B2
B6 = -2.0”
D2
D1
Sea
Stripping area
E1
11.30 am - Max
D6 = -2.0”
A5 = -2.0” E5 = -2.0”
D4 = -0.6” B4 = -0.5”
C3 = -0.5”
54
4.3.2 Day Second (25.01.13)
On the second day, levels of beach placer deposit were recorded before stripping
was done. But, some of the sampling points data cannot be recorded because the stakes
was submerged in the sea. Water ripples, refraction and clarity of water prevent the data
to be taken accurately. Sea level on 25th January was ±2.2 m from the mean sea level as
shown in Figure 3.5. Data of the sea levels after high tide are shown in Figure 4.3.
Figure 4.3: Data of beach placer level on 25.01.13 at morning.
Stripping was not done on this day to allow the wave action to further transport
the beach placer to the shore. During low tide at evening, levels of beach placer were
taken again to estimate the rate of distribution of beach placer along the shoreline. Data
recorded at the evening is shown in Figure 4.4.
A1 B1
B2
B6 = -1.5”
D2
D1
Sea
Stripping area
E1
10.40 am – Sea level (rising)
D6 = -1.5”
A5 = -1.6” E5 = -1.2”
D4 = -1.6” B4 = -1.6”
C3 = -1.0”

55
Figure 4.4: Data of beach placer level on 25.01.13 at evening.
Plate 4.6: Site area on 25.01.13 at evening.
B6 = -1.0”
Sea
Stripping area
D6 = -0.5”
A5 = -1.0” E5 = -0.4”
D4 = -1.0” B4 = -1.1”
C3 = -0.5”
B2 = -0.4” D2 = -0.6”
A1 = -0.8” B1 = -0.5” D1 = -0.4” E1 = -0.4”
6.00 pm – Sea level (rising)
56
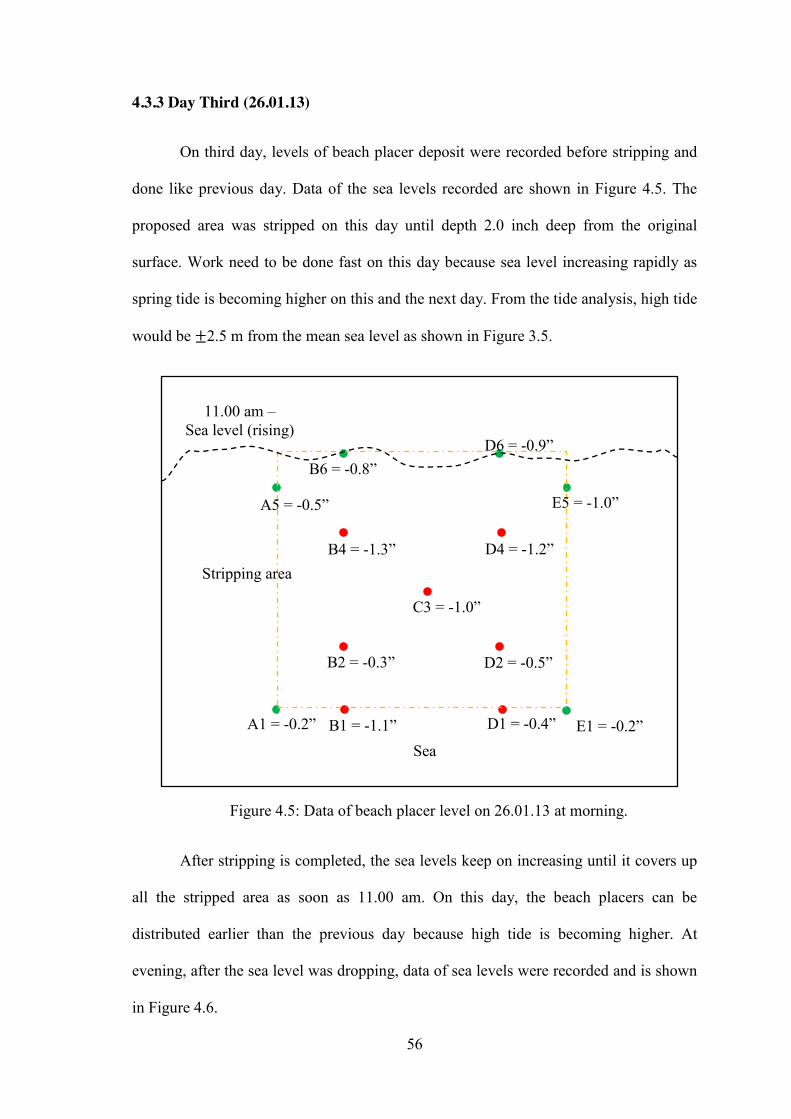
4.3.3 Day Third (26.01.13)
On third day, levels of beach placer deposit were recorded before stripping and
done like previous day. Data of the sea levels recorded are shown in Figure 4.5. The
proposed area was stripped on this day until depth 2.0 inch deep from the original
surface. Work need to be done fast on this day because sea level increasing rapidly as
spring tide is becoming higher on this and the next day. From the tide analysis, high tide
would be ±2.5 m from the mean sea level as shown in Figure 3.5.
Figure 4.5: Data of beach placer level on 26.01.13 at morning.
After stripping is completed, the sea levels keep on increasing until it covers up
all the stripped area as soon as 11.00 am. On this day, the beach placers can be
distributed earlier than the previous day because high tide is becoming higher. At
evening, after the sea level was dropping, data of sea levels were recorded and is shown
in Figure 4.6.
B6 = -0.8”
Sea
Stripping area
D6 = -0.9”
A5 = -0.5” E5 = -1.0”
D4 = -1.2” B4 = -1.3”
C3 = -1.0”
B2 = -0.3” D2 = -0.5”
A1 = -0.2” B1 = -1.1” D1 = -0.4” E1 = -0.2”
11.00 am – Sea level (rising)

57
Figure 4.6: Data of beach placer level on 26.01.13 at evening.
Plate 4.6: Site area on 26.01.13 at morning.
B6 = -1.4”
Sea
Stripping area
D6 = -2.1”
A5 = -1.0” E5 = -1.2”
D4 = -1.5” B4 = -2.0”
C3 = -1.3”
B2 = -1.1” D2 = -1.2”
A1 = -1.0” B1 = -1.1” D1 = -0.8” E1 = -1.0”
6.30 pm – Sea level (rising)

58
4.3.4 Day Fourth (27.01.2013)
As usual, levels of beach placer deposit were recorded before stripping was
done. The area was stripped to depth 2.0 inches as usual. From the tide analysis, high
tide would be ±2.6 m from the mean sea level as shown in Figure 3.5. Sea level was
increasing ±0.1 m from the previous day. But at site, the maximum level of sea water at
morning was at the highest point of the striping area which is lower than previous day.
Data of beach placer levels recorded at the morning is shown in Figure 4.7.
Figure 4.7: Data of beach placer level on 27.01.13 at morning.
After stripping is completed, the sea levels keep on increasing until it covers up
all the stripped area at 11.30 am. On this day, the sea level is not increasing as expected,
the maximum height of sea level is lower than previous day, but it still cover up all the
stripping area. At evening, after the sea level was drop, data of sea levels were recorded
and is shown in Figure 4.8.
B6 = -0.8”
Sea
Stripping area
D6 = -0.9”
A5 = -0.5” E5 = -1.0”
D4 = -1.2” B4 = -1.3”
C3 = -1.0”
B2 = -0.3” D2 = -0.5”
A1 = -0.2” B1 = -1.1” D1 = -0.4” E1 = -0.2”
11.30 am – Sea level (max)

59
Figure 4.8: Data of beach placer level on 27.01.13 at evening.
B6 = -1.2”
Sea
Stripping area
D6 = -1.4”
A5 = -1.3” E5 = -1.2”
D4 = -2.0” B4 = -2.4”
C3 = -1.5”
B2 = -1.0” D2 = -1.3”
A1 = -0.5” B1 = -1.1” D1 = -0.6” E1 = -0.5”
7.30 pm – Sea level (rising)
60
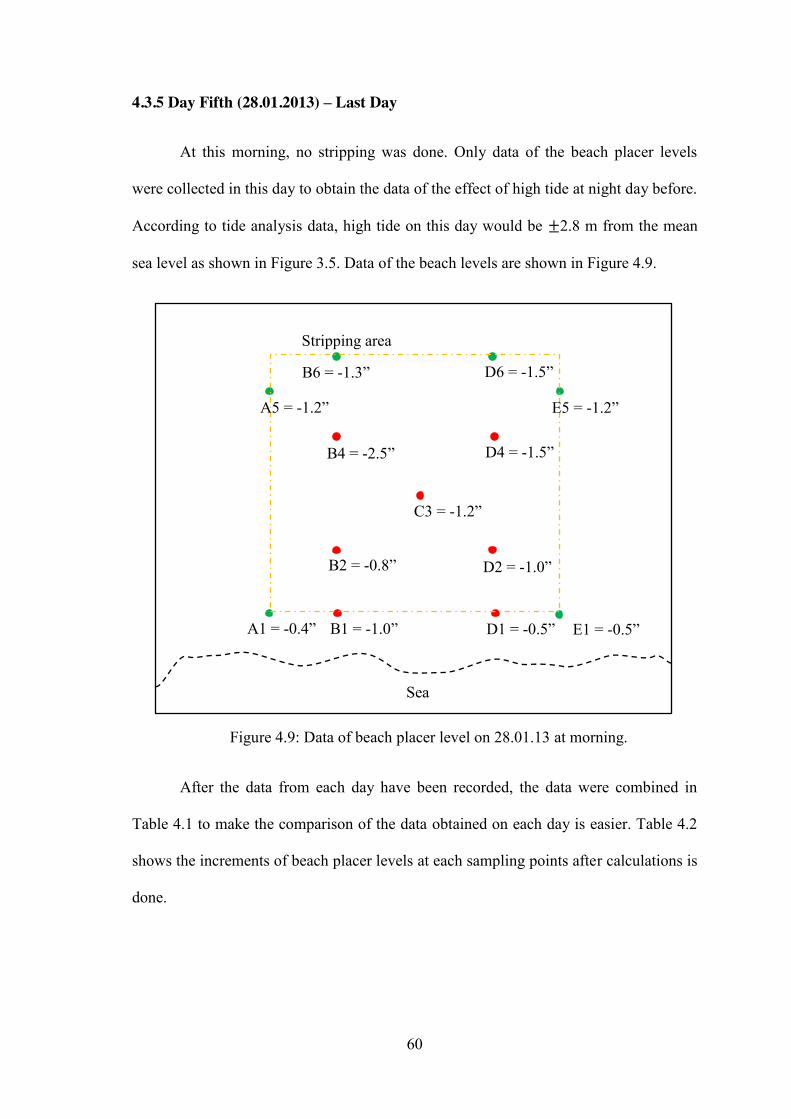
4.3.5 Day Fifth (28.01.2013) – Last Day
At this morning, no stripping was done. Only data of the beach placer levels
were collected in this day to obtain the data of the effect of high tide at night day before.
According to tide analysis data, high tide on this day would be ±2.8 m from the mean
sea level as shown in Figure 3.5. Data of the beach levels are shown in Figure 4.9.
Figure 4.9: Data of beach placer level on 28.01.13 at morning.
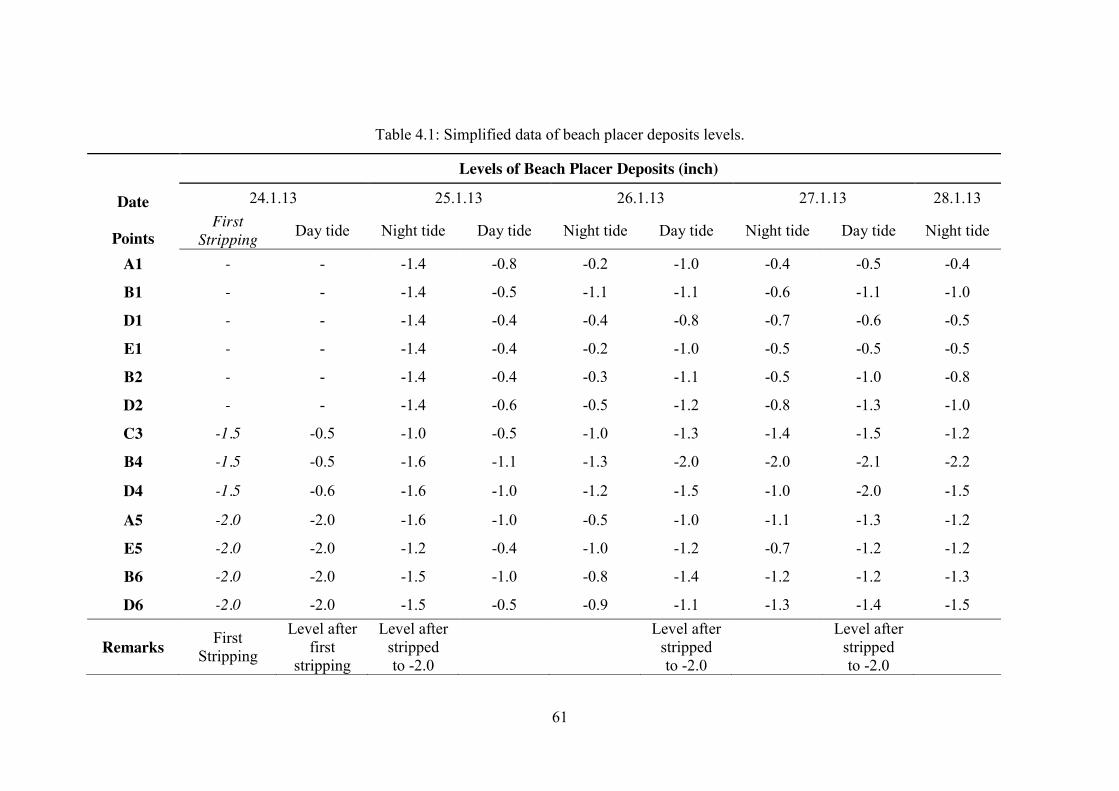
After the data from each day have been recorded, the data were combined in
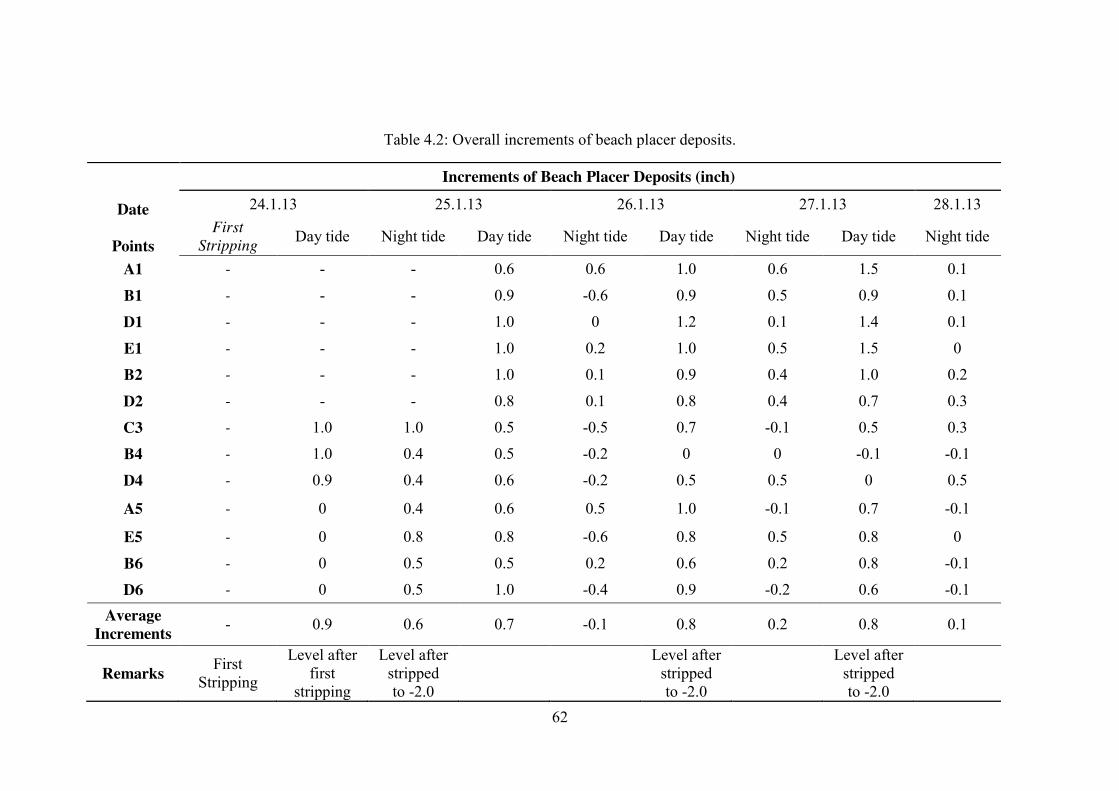
Table 4.1 to make the comparison of the data obtained on each day is easier. Table 4.2
shows the increments of beach placer levels at each sampling points after calculations is
done.
B6 = -1.3”
Sea
Stripping area
D6 = -1.5”
A5 = -1.2” E5 = -1.2”
D4 = -1.5” B4 = -2.5”
C3 = -1.2”
B2 = -0.8” D2 = -1.0”
A1 = -0.4” B1 = -1.0” D1 = -0.5” E1 = -0.5”
61
Table 4.1: Simplified data of beach placer deposits levels.
Date
Points
Levels of Beach Placer Deposits (inch)
24.1.13 25.1.13 26.1.13 27.1.13 28.1.13 First
Stripping Day tide Night tide Day tide Night tide Day tide Night tide Day tide Night tide
A1 - - -1.4 -0.8 -0.2 -1.0 -0.4 -0.5 -0.4
B1 - - -1.4 -0.5 -1.1 -1.1 -0.6 -1.1 -1.0
D1 - - -1.4 -0.4 -0.4 -0.8 -0.7 -0.6 -0.5
E1 - - -1.4 -0.4 -0.2 -1.0 -0.5 -0.5 -0.5
B2 - - -1.4 -0.4 -0.3 -1.1 -0.5 -1.0 -0.8
D2 - - -1.4 -0.6 -0.5 -1.2 -0.8 -1.3 -1.0
C3 -1.5 -0.5 -1.0 -0.5 -1.0 -1.3 -1.4 -1.5 -1.2
B4 -1.5 -0.5 -1.6 -1.1 -1.3 -2.0 -2.0 -2.1 -2.2
D4 -1.5 -0.6 -1.6 -1.0 -1.2 -1.5 -1.0 -2.0 -1.5
A5 -2.0 -2.0 -1.6 -1.0 -0.5 -1.0 -1.1 -1.3 -1.2
E5 -2.0 -2.0 -1.2 -0.4 -1.0 -1.2 -0.7 -1.2 -1.2
B6 -2.0 -2.0 -1.5 -1.0 -0.8 -1.4 -1.2 -1.2 -1.3
D6 -2.0 -2.0 -1.5 -0.5 -0.9 -1.1 -1.3 -1.4 -1.5
Remarks First Stripping
Level after first
stripping
Level after stripped to -2.0
Level after
stripped to -2.0
Level after
stripped to -2.0
62
Table 4.2: Overall increments of beach placer deposits.
Date
Points
Increments of Beach Placer Deposits (inch) 24.1.13 25.1.13 26.1.13 27.1.13 28.1.13
First Stripping Day tide Night tide Day tide Night tide Day tide Night tide Day tide Night tide
A1 - - - 0.6 0.6 1.0 0.6 1.5 0.1
B1 - - - 0.9 -0.6 0.9 0.5 0.9 0.1
D1 - - - 1.0 0 1.2 0.1 1.4 0.1
E1 - - - 1.0 0.2 1.0 0.5 1.5 0
B2 - - - 1.0 0.1 0.9 0.4 1.0 0.2
D2 - - - 0.8 0.1 0.8 0.4 0.7 0.3
C3 - 1.0 1.0 0.5 -0.5 0.7 -0.1 0.5 0.3
B4 - 1.0 0.4 0.5 -0.2 0 0 -0.1 -0.1
D4 - 0.9 0.4 0.6 -0.2 0.5 0.5 0 0.5
A5 - 0 0.4 0.6 0.5 1.0 -0.1 0.7 -0.1
E5 - 0 0.8 0.8 -0.6 0.8 0.5 0.8 0
B6 - 0 0.5 0.5 0.2 0.6 0.2 0.8 -0.1
D6 - 0 0.5 1.0 -0.4 0.9 -0.2 0.6 -0.1 Average
Increments - 0.9 0.6 0.7 -0.1 0.8 0.2 0.8 0.1
Remarks First Stripping
Level after first
stripping
Level after stripped to -2.0
Level after
stripped to -2.0
Level after
stripped to -2.0
63
There are two cases in calculating the increments of beach levels. The first case is
calculation when stripping is done and second case is calculation when stripping is not
done.
i. For the first case, the formula to calculate the increments of beach levels is:
Increments = Beach level after stripping – New levels after tides
ii. For the second case, the formula is:
Increments = Beach level of the previous tides – New levels after tides
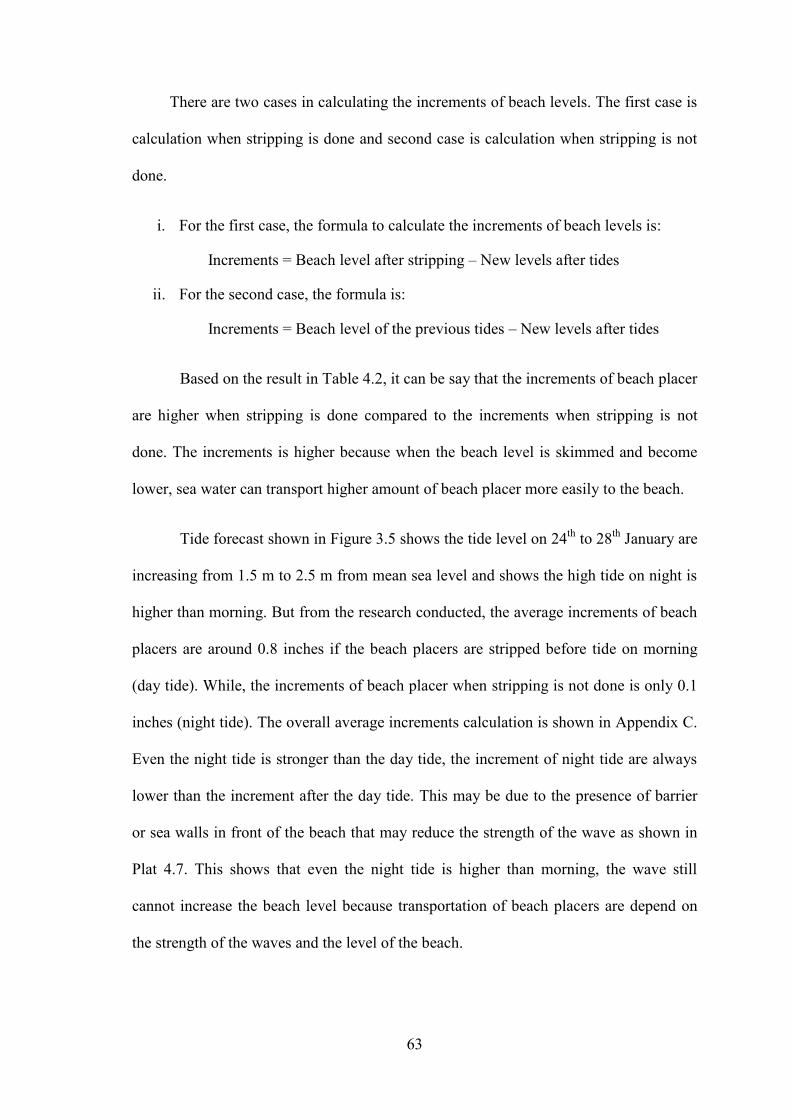
Based on the result in Table 4.2, it can be say that the increments of beach placer
are higher when stripping is done compared to the increments when stripping is not
done. The increments is higher because when the beach level is skimmed and become
lower, sea water can transport higher amount of beach placer more easily to the beach.
Tide forecast shown in Figure 3.5 shows the tide level on 24th to 28th January are
increasing from 1.5 m to 2.5 m from mean sea level and shows the high tide on night is
higher than morning. But from the research conducted, the average increments of beach
placers are around 0.8 inches if the beach placers are stripped before tide on morning
(day tide). While, the increments of beach placer when stripping is not done is only 0.1
inches (night tide). The overall average increments calculation is shown in Appendix C.
Even the night tide is stronger than the day tide, the increment of night tide are always
lower than the increment after the day tide. This may be due to the presence of barrier
or sea walls in front of the beach that may reduce the strength of the wave as shown in
Plat 4.7. This shows that even the night tide is higher than morning, the wave still
cannot increase the beach level because transportation of beach placers are depend on
the strength of the waves and the level of the beach.
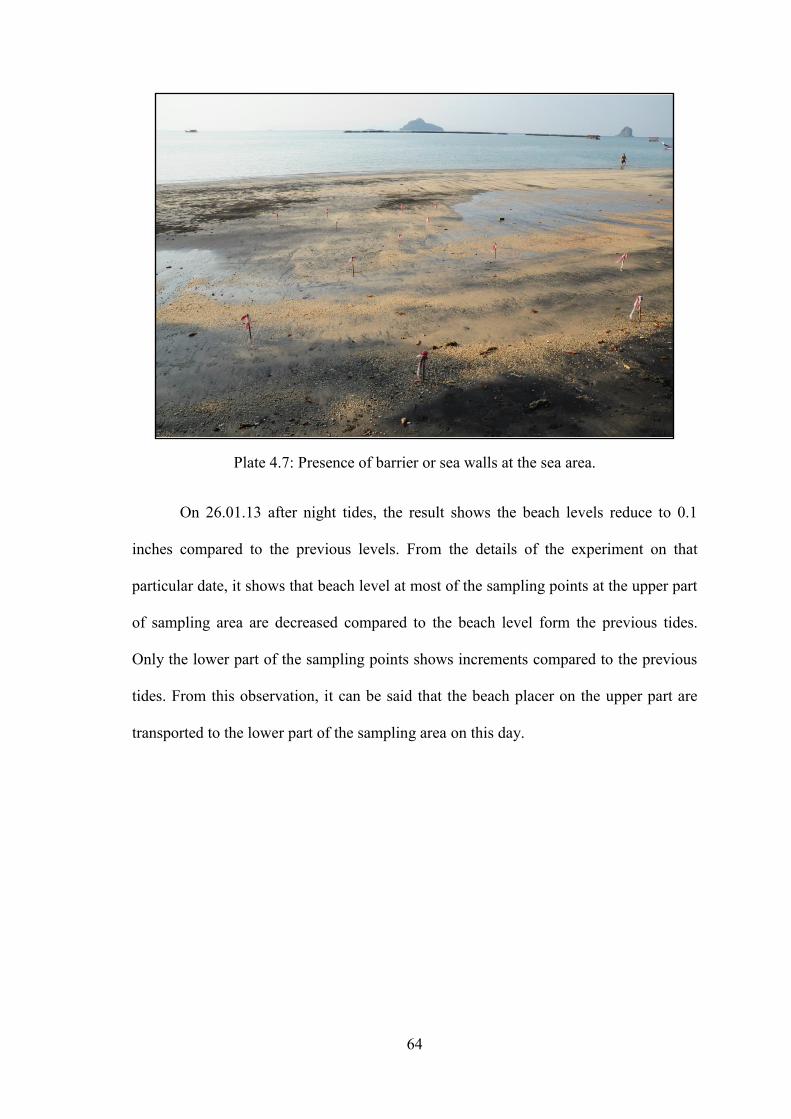
64
Plate 4.7: Presence of barrier or sea walls at the sea area.
On 26.01.13 after night tides, the result shows the beach levels reduce to 0.1
inches compared to the previous levels. From the details of the experiment on that
particular date, it shows that beach level at most of the sampling points at the upper part
of sampling area are decreased compared to the beach level form the previous tides.
Only the lower part of the sampling points shows increments compared to the previous
tides. From this observation, it can be said that the beach placer on the upper part are
transported to the lower part of the sampling area on this day.

65
4.4 Evaluation of Heavy Minerals
In this analysis, separation is done to determine the percentage of heavy
minerals and light minerals. Mozley table is used in this analysis to separate the heavy
and light minerals. Evaluations of heavy minerals were done only at 7 points which are
marked red as shown in Figure 4.10.
Figure 4.10: Illustration of sampling point at study area.
Evaluations cannot be done at the green marked points to avoid the sample from
contaminated with the beach placer at the surrounding of the stripping area. Therefore,
only samples at red points are being evaluated to determine the concentration of heavy
minerals after redistributed by the wave actions. Detail data of the heavy mineral
evaluation are shown in Appendix B.
E1 A1 B2
B2
B4
B6 D6
D4
C3
D2
D1
E5 A5
Sea
Stripping area

66
Data from the Appendix B are calculated to get the percentage of heavy mineral
that being redistributed by the wave action during high tides on each day. The
percentage of heavy mineral was calculated by using formula:
Percentage Concentrate (%) = Mass of Concentrate (g)
Mass of Concentrate (g) + Mass of Tailing (g)
The results obtained from Appendix B are summarized in Table 4.3.
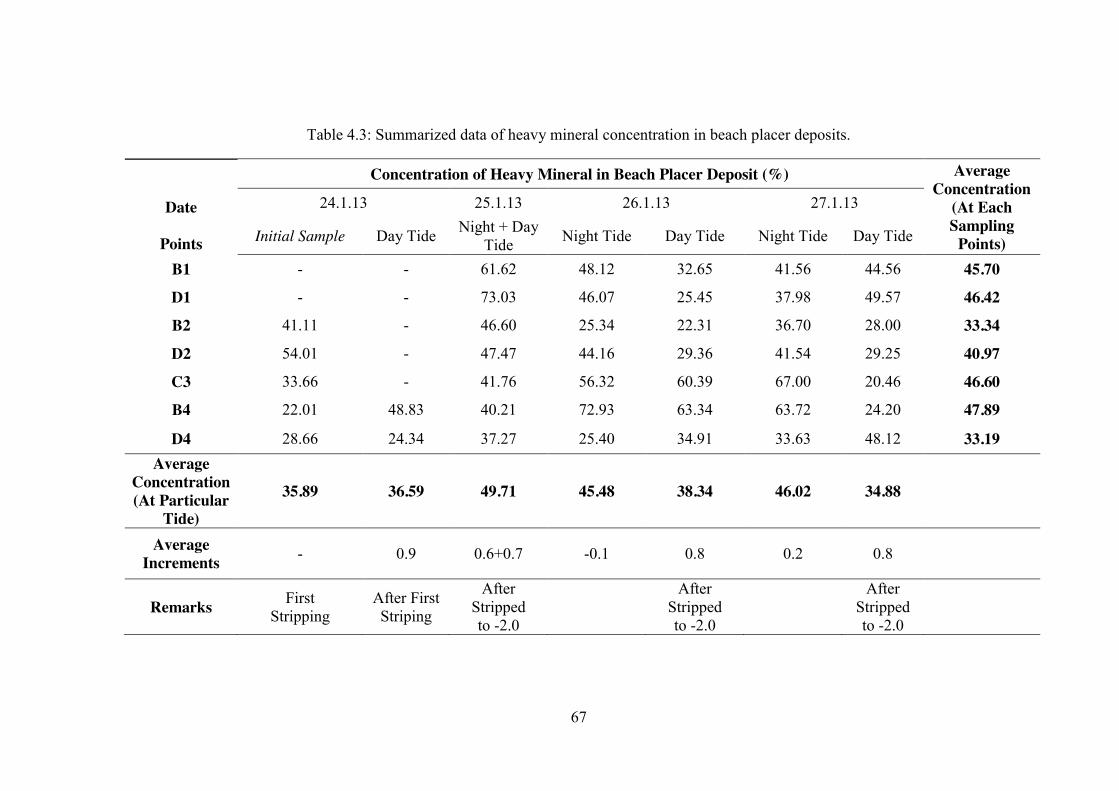
67
Table 4.3: Summarized data of heavy mineral concentration in beach placer deposits.
Date
Points
Concentration of Heavy Mineral in Beach Placer Deposit (%) Average Concentration
(At Each Sampling
Points)
24.1.13 25.1.13 26.1.13 27.1.13
Initial Sample Day Tide Night + Day Tide Night Tide Day Tide Night Tide Day Tide
B1 - - 61.62 48.12 32.65 41.56 44.56 45.70
D1 - - 73.03 46.07 25.45 37.98 49.57 46.42
B2 41.11 - 46.60 25.34 22.31 36.70 28.00 33.34
D2 54.01 - 47.47 44.16 29.36 41.54 29.25 40.97
C3 33.66 - 41.76 56.32 60.39 67.00 20.46 46.60
B4 22.01 48.83 40.21 72.93 63.34 63.72 24.20 47.89
D4 28.66 24.34 37.27 25.40 34.91 33.63 48.12 33.19 Average
Concentration (At Particular
Tide) 35.89 36.59 49.71 45.48 38.34 46.02 34.88
Average Increments - 0.9 0.6+0.7 -0.1 0.8 0.2 0.8
Remarks First Stripping
After First Striping
After Stripped to -2.0
After
Stripped to -2.0
After
Stripped to -2.0
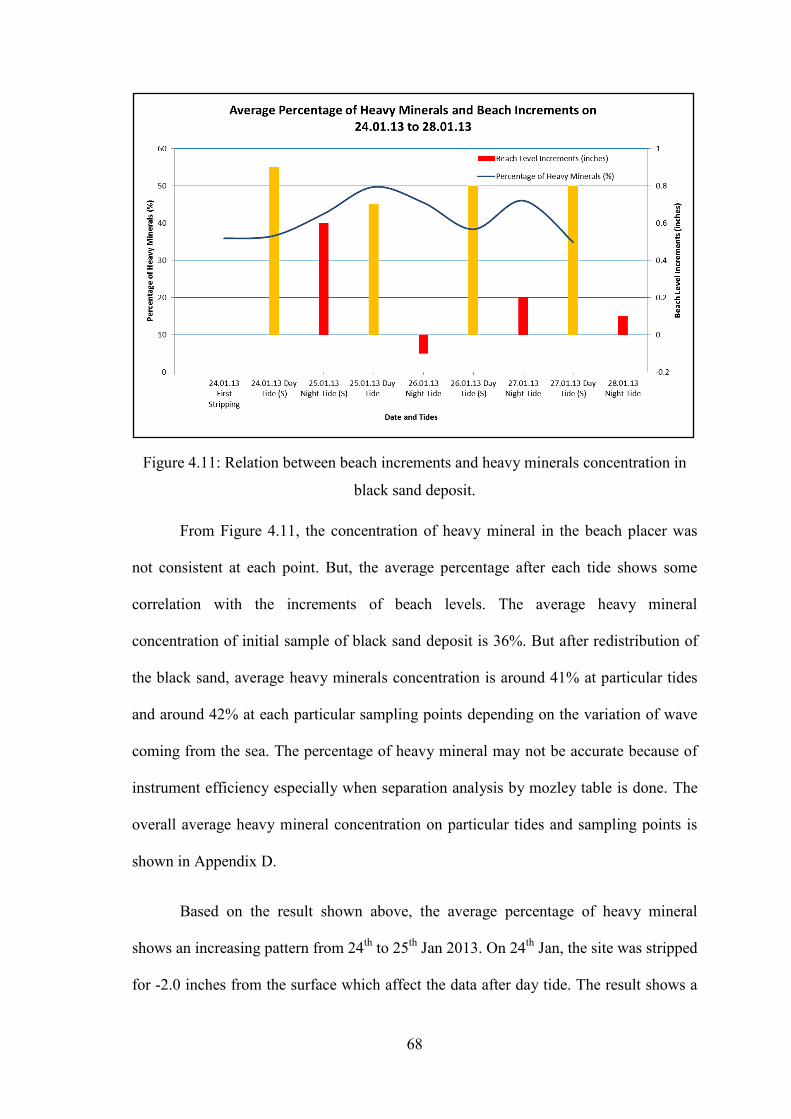
68
Figure 4.11: Relation between beach increments and heavy minerals concentration in
black sand deposit.
From Figure 4.11, the concentration of heavy mineral in the beach placer was
not consistent at each point. But, the average percentage after each tide shows some
correlation with the increments of beach levels. The average heavy mineral
concentration of initial sample of black sand deposit is 36%. But after redistribution of
the black sand, average heavy minerals concentration is around 41% at particular tides
and around 42% at each particular sampling points depending on the variation of wave
coming from the sea. The percentage of heavy mineral may not be accurate because of
instrument efficiency especially when separation analysis by mozley table is done. The
overall average heavy mineral concentration on particular tides and sampling points is
shown in Appendix D.
Based on the result shown above, the average percentage of heavy mineral
shows an increasing pattern from 24th to 25th Jan 2013. On 24th Jan, the site was stripped
for -2.0 inches from the surface which affect the data after day tide. The result shows a
69
slightly increase of the percentage of heavy minerals compared to the initial
concentration of the heavy minerals.
On 25th Jan, the concentration of heavy mineral shows the highest which are
about 50%. This may be because of stripping is not done at the morning on this day
causing more heavy minerals to be transported by the wave action on the site area. The
increment of beach level which is higher than the other days shows more beach placer
deposit are transported to the stripped area in this day as no stripping is done.
On 26th Jan, the result of night tide shows some reduction in the percentage of
heavy minerals to 45%. The beach level also decreases to 0.1 inch on this morning. The
transportation of beach placer away from the sampling area may cause the beach level
and heavy mineral concentration decreases on this morning. After stripping is done, the
increments of beach level increase abruptly but the concentration of heavy mineral is
only 38% which are much lower than night tide at the next day.
On 27th Jan, the night tide continues increasing the concentration of heavy
minerals to 46% at the area. But the level only increase for 0.2 inch. This shows the
strength of night tide is stronger than the day tide. After stripping is done to 2.0 inch
below the original surface, the result shows increments of the beach levels at 0.8 inch
and 35% concentration of heavy minerals in the beach placer deposit. These results
produce a same pattern of average increments and also average concentration of heavy
minerals as the previous day.
70
4.5 Mineral Identification by Optical Microscope
Mineral identification is done by optical microscopy study. Sample was sieved
to below 0.7 mm before separated by using magnetic separator and high tension
separator (HTS) to classify the sample according to its physical properties effectively.
The sample was than analysed under optical microscope for better identification. From
this study, the most abundant minerals present in the samples can be determined and
this provides a useful data for the processing stage. Once the mineral have been
identified, the design of mineral processing can be develop at most efficient and
economical route to recover the valuable minerals. Figure in Table 4.4 and Table 4.5
shows microscopic images of the separated sample.
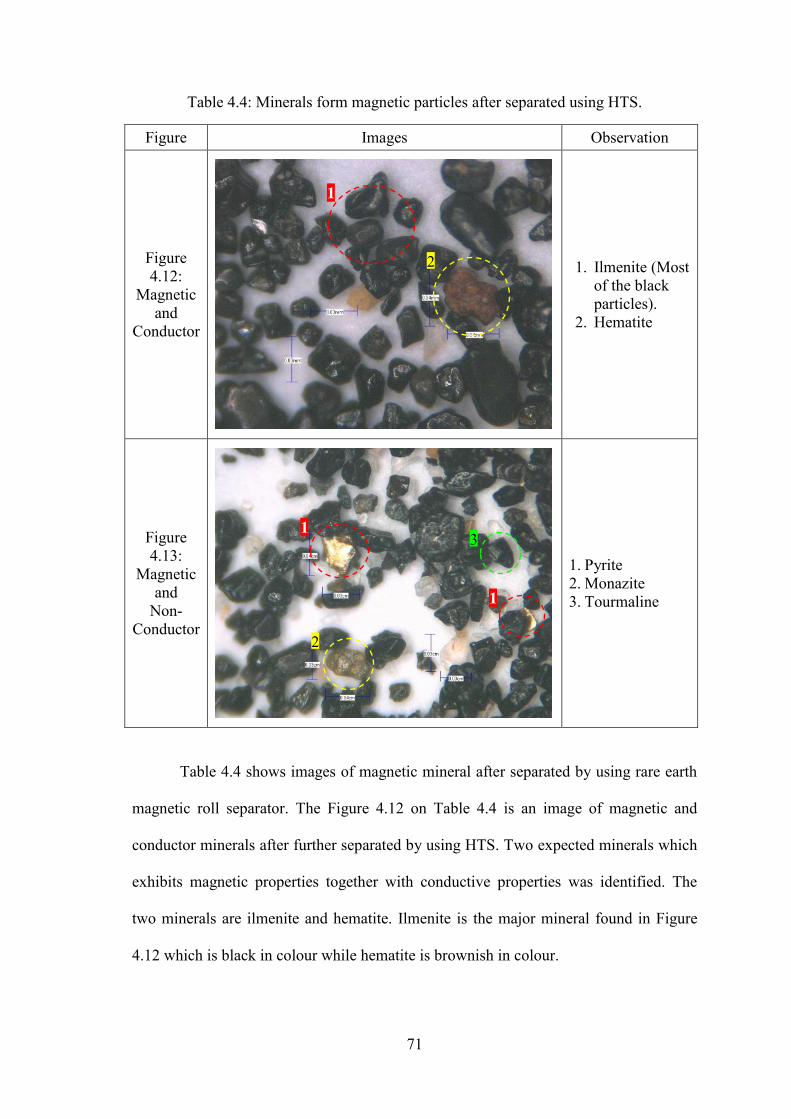
71
Table 4.4: Minerals form magnetic particles after separated using HTS.
Figure Images Observation
Figure 4.12:
Magnetic and
Conductor
1. Ilmenite (Most of the black particles).
2. Hematite
Figure 4.13:
Magnetic and
Non-Conductor
1. Pyrite 2. Monazite 3. Tourmaline
Table 4.4 shows images of magnetic mineral after separated by using rare earth
magnetic roll separator. The Figure 4.12 on Table 4.4 is an image of magnetic and
conductor minerals after further separated by using HTS. Two expected minerals which
exhibits magnetic properties together with conductive properties was identified. The
two minerals are ilmenite and hematite. Ilmenite is the major mineral found in Figure
4.12 which is black in colour while hematite is brownish in colour.
1
2
1
1
2
3
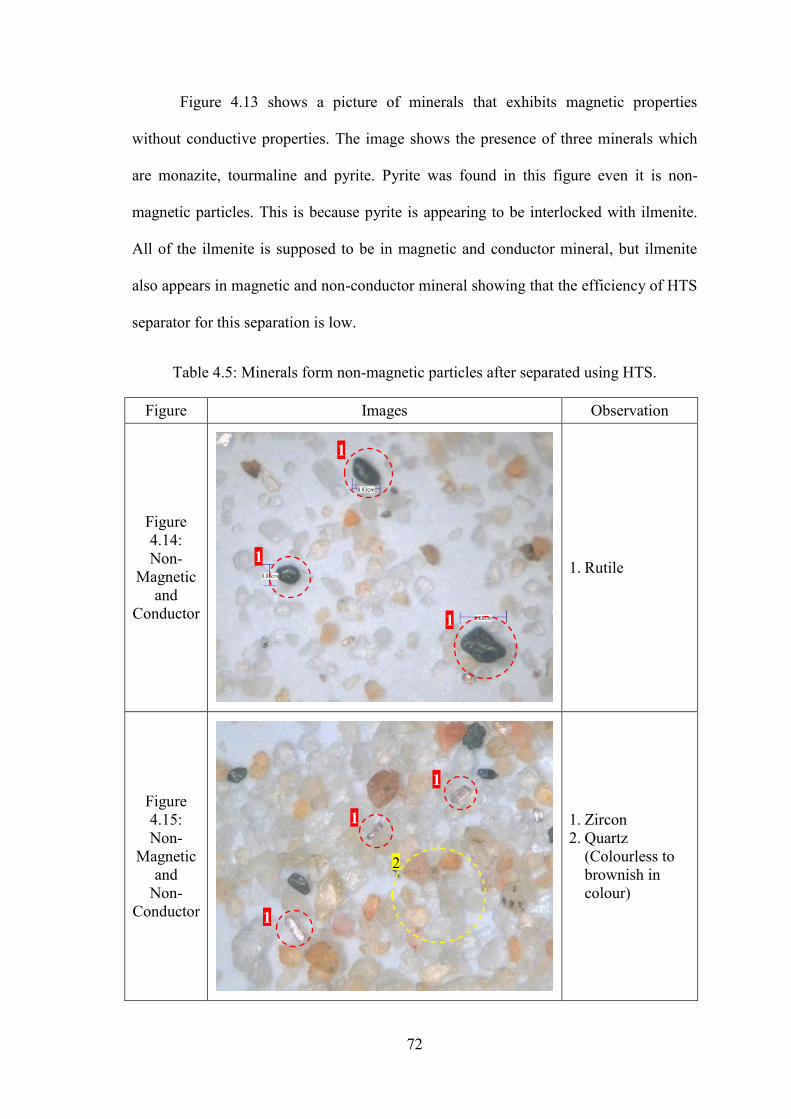
72
Figure 4.13 shows a picture of minerals that exhibits magnetic properties
without conductive properties. The image shows the presence of three minerals which
are monazite, tourmaline and pyrite. Pyrite was found in this figure even it is non-
magnetic particles. This is because pyrite is appearing to be interlocked with ilmenite.
All of the ilmenite is supposed to be in magnetic and conductor mineral, but ilmenite
also appears in magnetic and non-conductor mineral showing that the efficiency of HTS
separator for this separation is low.
Table 4.5: Minerals form non-magnetic particles after separated using HTS.
Figure Images Observation
Figure 4.14: Non-
Magnetic and
Conductor
1. Rutile
Figure 4.15: Non-
Magnetic and
Non- Conductor
1. Zircon 2. Quartz
(Colourless to brownish in colour)
1
1
1
1
1
1
2
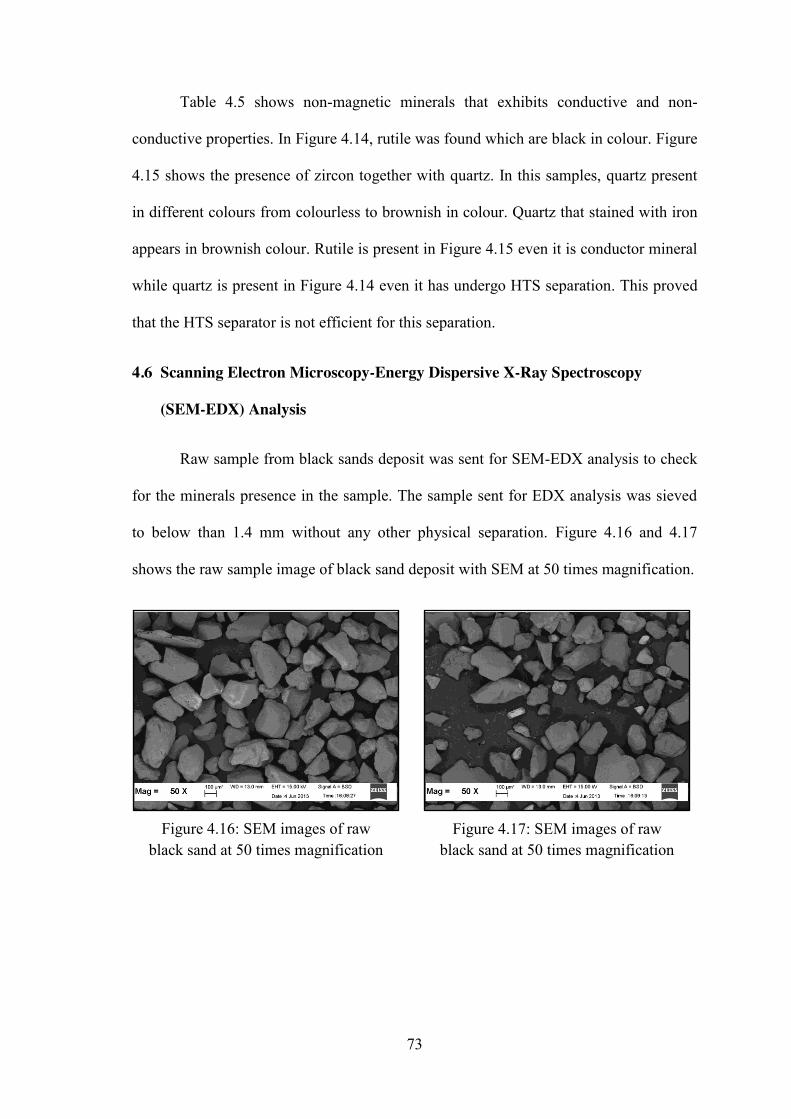
73
Table 4.5 shows non-magnetic minerals that exhibits conductive and non-
conductive properties. In Figure 4.14, rutile was found which are black in colour. Figure
4.15 shows the presence of zircon together with quartz. In this samples, quartz present
in different colours from colourless to brownish in colour. Quartz that stained with iron
appears in brownish colour. Rutile is present in Figure 4.15 even it is conductor mineral
while quartz is present in Figure 4.14 even it has undergo HTS separation. This proved
that the HTS separator is not efficient for this separation.
4.6 Scanning Electron Microscopy-Energy Dispersive X-Ray Spectroscopy
(SEM-EDX) Analysis
Raw sample from black sands deposit was sent for SEM-EDX analysis to check
for the minerals presence in the sample. The sample sent for EDX analysis was sieved
to below than 1.4 mm without any other physical separation. Figure 4.16 and 4.17
shows the raw sample image of black sand deposit with SEM at 50 times magnification.
Figure 4.16: SEM images of raw black sand at 50 times magnification
Figure 4.17: SEM images of raw black sand at 50 times magnification
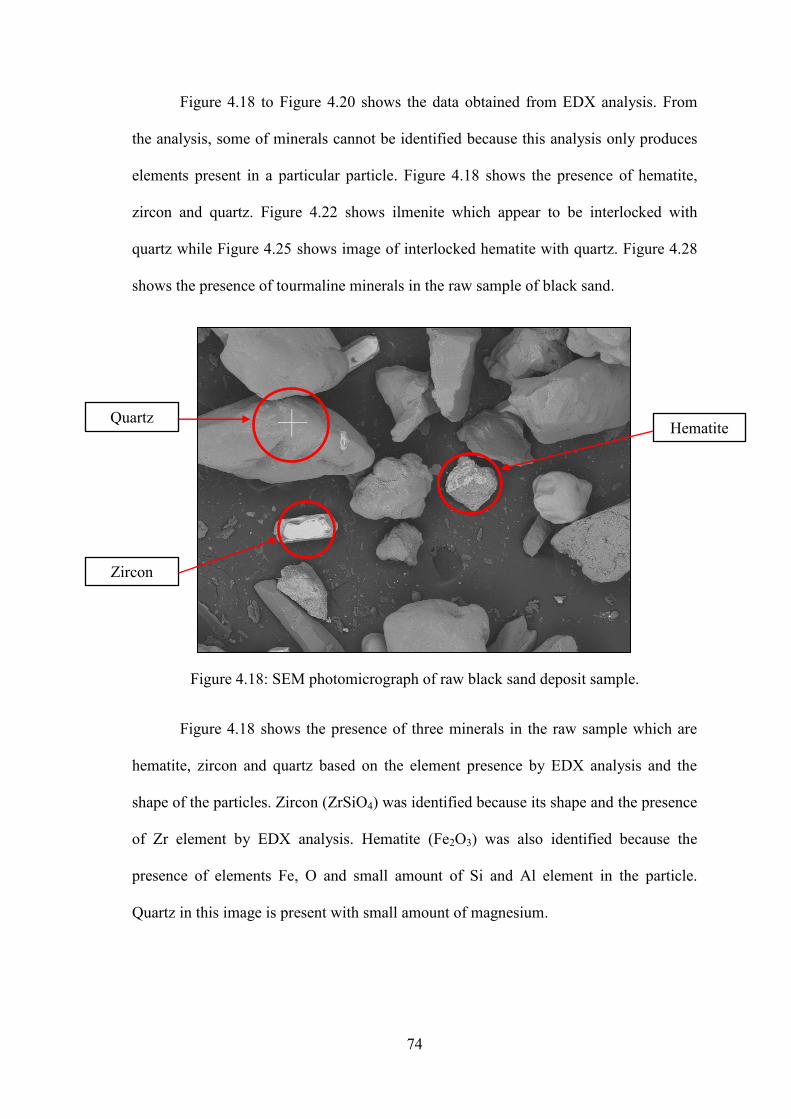
74
Figure 4.18 to Figure 4.20 shows the data obtained from EDX analysis. From
the analysis, some of minerals cannot be identified because this analysis only produces
elements present in a particular particle. Figure 4.18 shows the presence of hematite,
zircon and quartz. Figure 4.22 shows ilmenite which appear to be interlocked with
quartz while Figure 4.25 shows image of interlocked hematite with quartz. Figure 4.28
shows the presence of tourmaline minerals in the raw sample of black sand.
Figure 4.18: SEM photomicrograph of raw black sand deposit sample.
Figure 4.18 shows the presence of three minerals in the raw sample which are
hematite, zircon and quartz based on the element presence by EDX analysis and the
shape of the particles. Zircon (ZrSiO4) was identified because its shape and the presence
of Zr element by EDX analysis. Hematite (Fe2O3) was also identified because the
presence of elements Fe, O and small amount of Si and Al element in the particle.
Quartz in this image is present with small amount of magnesium.
Zircon
Quartz Hematite
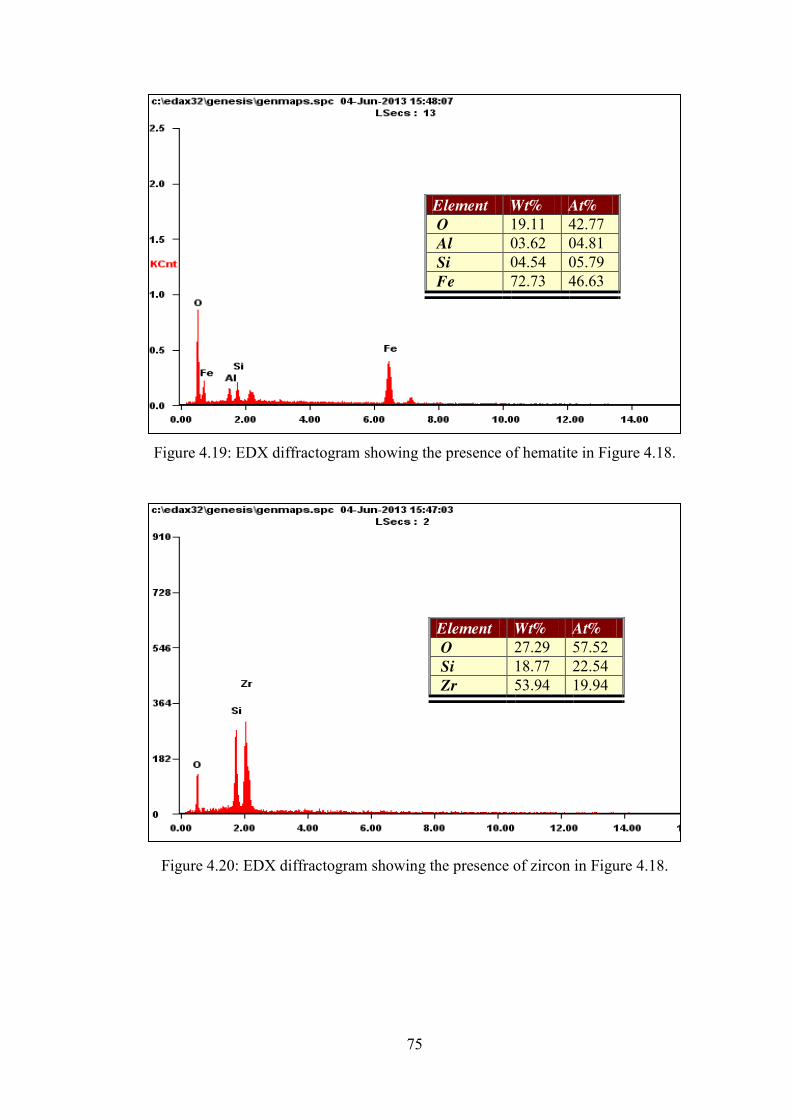
75
Figure 4.19: EDX diffractogram showing the presence of hematite in Figure 4.18.
Figure 4.20: EDX diffractogram showing the presence of zircon in Figure 4.18.
Element Wt% At% O 19.11 42.77 Al 03.62 04.81 Si 04.54 05.79 Fe 72.73 46.63
Element Wt% At% O 27.29 57.52 Si 18.77 22.54 Zr 53.94 19.94
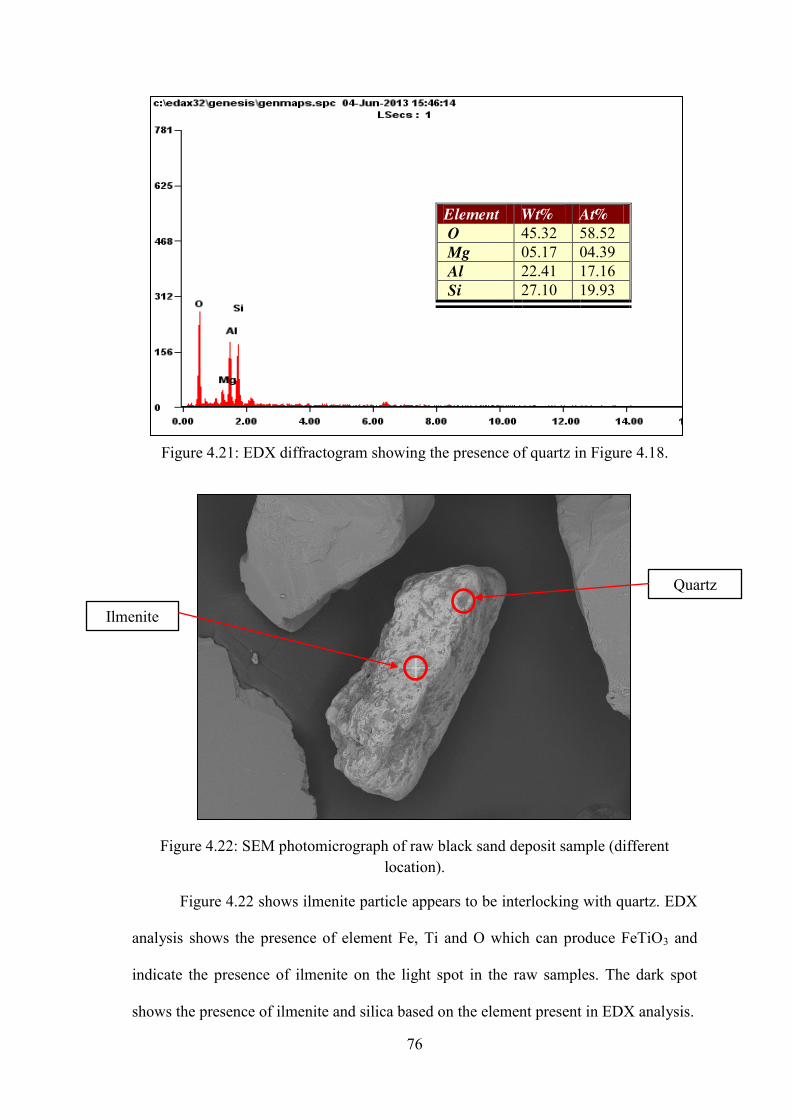
76
Figure 4.21: EDX diffractogram showing the presence of quartz in Figure 4.18.
Figure 4.22: SEM photomicrograph of raw black sand deposit sample (different location).
Figure 4.22 shows ilmenite particle appears to be interlocking with quartz. EDX
analysis shows the presence of element Fe, Ti and O which can produce FeTiO3 and
indicate the presence of ilmenite on the light spot in the raw samples. The dark spot
shows the presence of ilmenite and silica based on the element present in EDX analysis.
Element Wt% At% O 45.32 58.52 Mg 05.17 04.39 Al 22.41 17.16 Si 27.10 19.93
Ilmenite
Quartz

77
Figure 4.23: EDX diffractogram showing the presence of ilmenite (light structure) in Figure 4.22.
Figure 4.24: EDX diffractogram showing the presence of quartz (dark spot) in Figure 4.22.
Element Wt% At% O 29.60 57.63 Ti 33.51 21.79 Fe 36.89 20.58
Element Wt% At% O 36.06 54.78 Al 16.75 15.09 Si 19.80 17.14 Ti 14.80 07.51 Fe 12.60 05.48
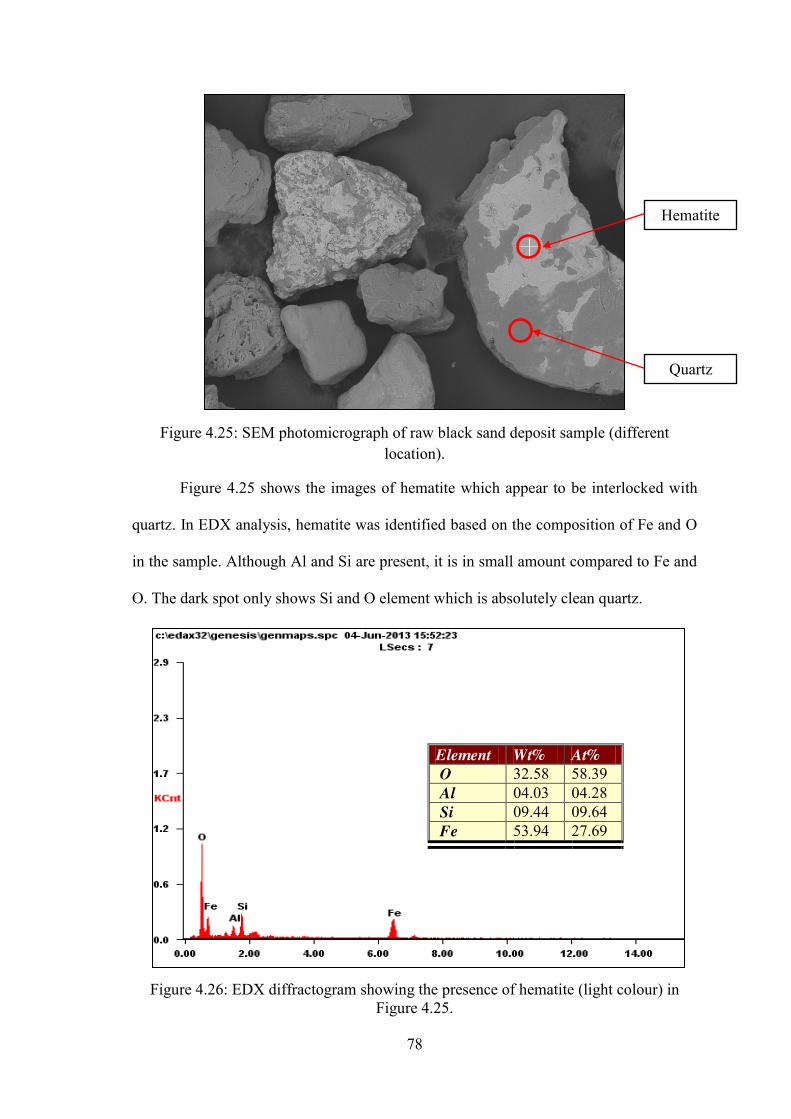
78
Figure 4.25: SEM photomicrograph of raw black sand deposit sample (different location).
Figure 4.25 shows the images of hematite which appear to be interlocked with
quartz. In EDX analysis, hematite was identified based on the composition of Fe and O
in the sample. Although Al and Si are present, it is in small amount compared to Fe and
O. The dark spot only shows Si and O element which is absolutely clean quartz.
Figure 4.26: EDX diffractogram showing the presence of hematite (light colour) in Figure 4.25.
Element Wt% At% O 32.58 58.39 Al 04.03 04.28 Si 09.44 09.64 Fe 53.94 27.69
Hematite
Quartz

79
Figure 4.27: EDX diffractogram showing the presence of quartz (grey colour) in Figure 4.25.
Figure 4.28: SEM photomicrograph of raw black sand deposit sample (different location).
Element Wt% At% O 42.66 56.63 Si 57.34 43.37
Tourmaline
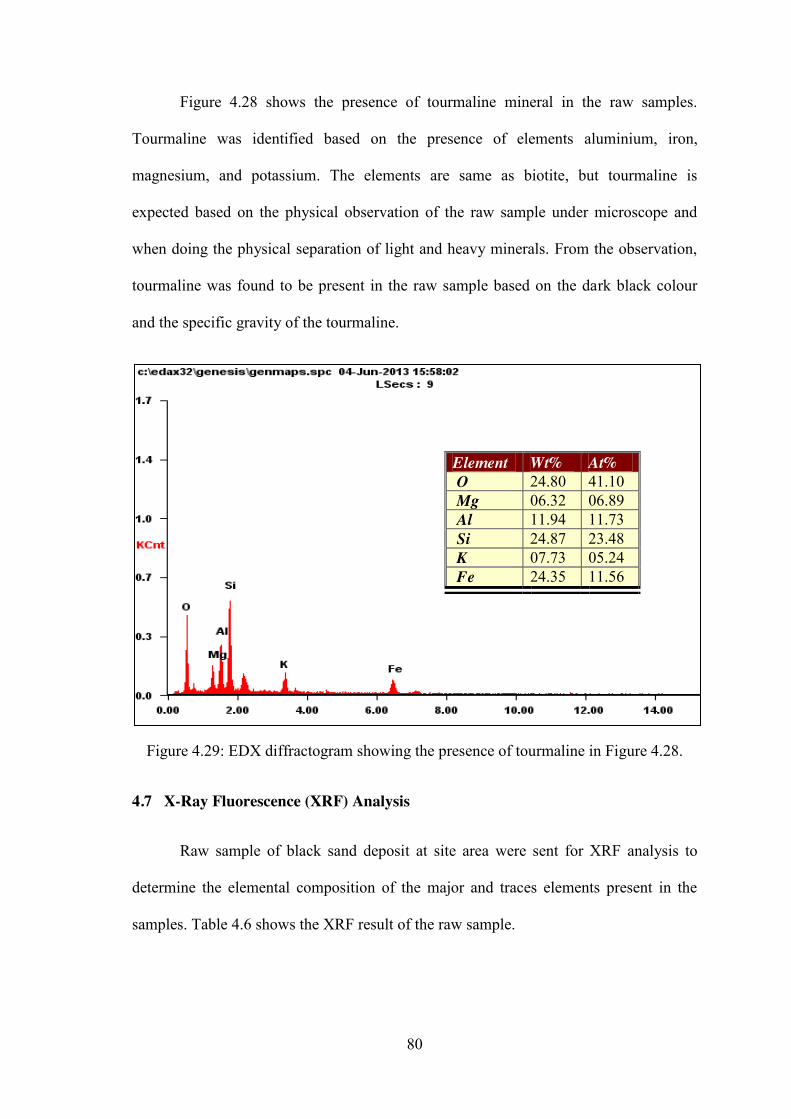
80
Figure 4.28 shows the presence of tourmaline mineral in the raw samples.
Tourmaline was identified based on the presence of elements aluminium, iron,
magnesium, and potassium. The elements are same as biotite, but tourmaline is
expected based on the physical observation of the raw sample under microscope and
when doing the physical separation of light and heavy minerals. From the observation,
tourmaline was found to be present in the raw sample based on the dark black colour
and the specific gravity of the tourmaline.
Figure 4.29: EDX diffractogram showing the presence of tourmaline in Figure 4.28.
4.7 X-Ray Fluorescence (XRF) Analysis
Raw sample of black sand deposit at site area were sent for XRF analysis to
determine the elemental composition of the major and traces elements present in the
samples. Table 4.6 shows the XRF result of the raw sample.
Element Wt% At% O 24.80 41.10 Mg 06.32 06.89 Al 11.94 11.73 Si 24.87 23.48 K 07.73 05.24 Fe 24.35 11.56
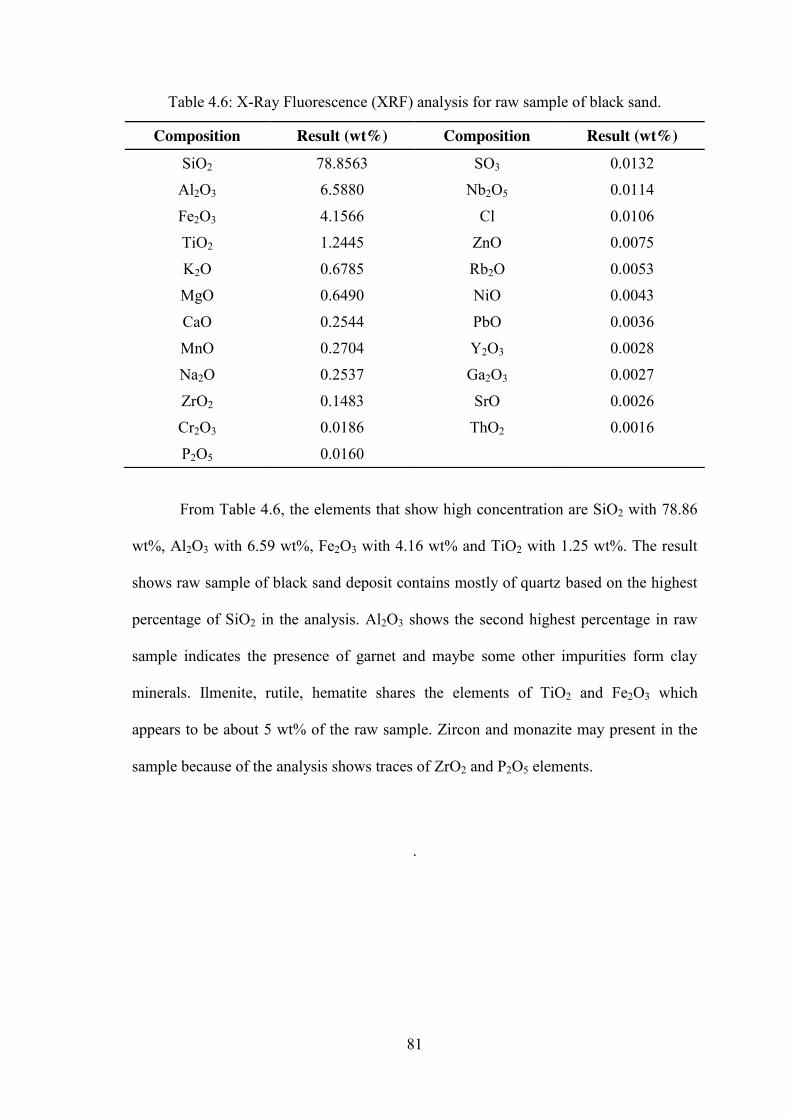
81
Table 4.6: X-Ray Fluorescence (XRF) analysis for raw sample of black sand.
From Table 4.6, the elements that show high concentration are SiO2 with 78.86
wt%, Al2O3 with 6.59 wt%, Fe2O3 with 4.16 wt% and TiO2 with 1.25 wt%. The result
shows raw sample of black sand deposit contains mostly of quartz based on the highest
percentage of SiO2 in the analysis. Al2O3 shows the second highest percentage in raw
sample indicates the presence of garnet and maybe some other impurities form clay
minerals. Ilmenite, rutile, hematite shares the elements of TiO2 and Fe2O3 which
appears to be about 5 wt% of the raw sample. Zircon and monazite may present in the
sample because of the analysis shows traces of ZrO2 and P2O5 elements.
.
Composition Result (wt%) Composition Result (wt%) SiO2 78.8563 SO3 0.0132
Al2O3 6.5880 Nb2O5 0.0114
Fe2O3 4.1566 Cl 0.0106
TiO2 1.2445 ZnO 0.0075
K2O 0.6785 Rb2O 0.0053
MgO 0.6490 NiO 0.0043
CaO 0.2544 PbO 0.0036
MnO 0.2704 Y2O3 0.0028
Na2O 0.2537 Ga2O3 0.0027
ZrO2 0.1483 SrO 0.0026
Cr2O3 0.0186 ThO2 0.0016
P2O5 0.0160
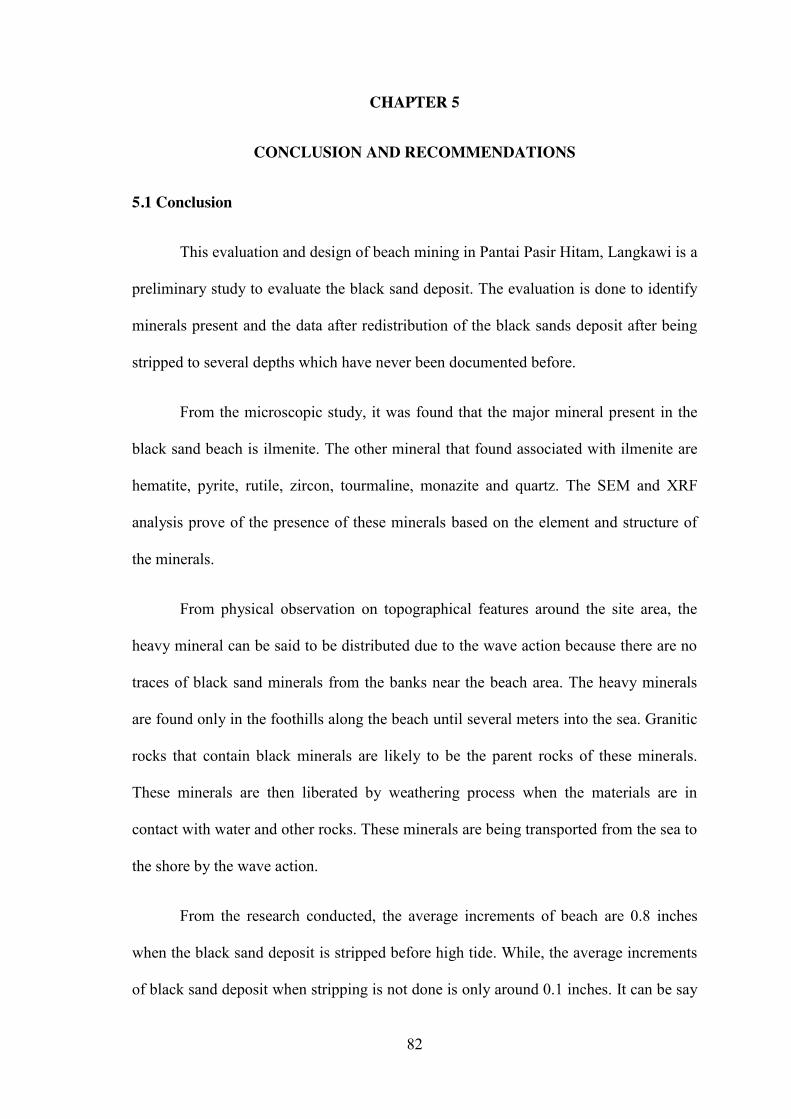
82
CHAPTER 5
CONCLUSION AND RECOMMENDATIONS
5.1 Conclusion
This evaluation and design of beach mining in Pantai Pasir Hitam, Langkawi is a
preliminary study to evaluate the black sand deposit. The evaluation is done to identify
minerals present and the data after redistribution of the black sands deposit after being
stripped to several depths which have never been documented before.
From the microscopic study, it was found that the major mineral present in the
black sand beach is ilmenite. The other mineral that found associated with ilmenite are
hematite, pyrite, rutile, zircon, tourmaline, monazite and quartz. The SEM and XRF
analysis prove of the presence of these minerals based on the element and structure of
the minerals.
From physical observation on topographical features around the site area, the
heavy mineral can be said to be distributed due to the wave action because there are no
traces of black sand minerals from the banks near the beach area. The heavy minerals
are found only in the foothills along the beach until several meters into the sea. Granitic
rocks that contain black minerals are likely to be the parent rocks of these minerals.
These minerals are then liberated by weathering process when the materials are in
contact with water and other rocks. These minerals are being transported from the sea to
the shore by the wave action.
From the research conducted, the average increments of beach are 0.8 inches
when the black sand deposit is stripped before high tide. While, the average increments
of black sand deposit when stripping is not done is only around 0.1 inches. It can be say
83
that the increments of beach level are much higher when stripping is done compared to
the increments when stripping is not done. The increments is higher because when the
beach level is skimmed and become lower, sea water can transport higher amount of
beach placer more easily to the beach. Therefore, in real mining situation, the
excavation or stripping should be done at least 1 times in 2 days to make sure all the
excavated sand deposit has return to a stable condition if the excavation is done for 2
inch depth.
The presence of sea walls or barrier in front of the beach may be the factors of
reduction of the strength of the wave. Even the night tide is higher than morning (based
on the forecast), the night tide still cannot increase the beach level higher than the
increment on the day tide. This is because transportation of beach placers are depends
on the strength of the waves and also the level of the beach.
The concentration of heavy mineral in the beach placer was not consistent at
each point. But, the average percentage after each tide shows some correlation with the
increments of beach levels. The higher the increments of beach level, the higher the
amount of heavy mineral concentration in the black sand deposit. The average heavy
mineral concentration of initial sample of black sand deposit is 36%. But after
redistribution of the black sand, average heavy minerals concentration is increase to
41% at particular tides and 42% at each sampling points. The value may increase or
decrease depending on the variation strength of currents, wind, tide and wave coming
from the sea.
84
5.2 Recommendations
Since this is the first study about evaluation and design of beach mining in
Malaysia, there is a lot of way need to be improved especially in conducting the site
study. Therefore, more researches should be done before the data could be applied in
order to get more data due to the restriction of time in doing this research. The
following are the recommendation that can be improved for this research;
i. Since the result is only based on five days of studies, more time is need to
achieve better result to evaluate redistribution of the black sand because tide
is different for every days and repeated each month depending on the moon
phase.
ii. Type and direction of currents and wind also need to be noted when doing the
research to identify the direction of movement of the black sand deposit.
iii. Determine the best and suitable method to avoid the mixing of redistributed
black sand with the stripped and the surrounding black sand. It is
recommended to use pieces of woods on both sides of site area as a partition
to avoid mixing with the surrounding black sand.
iv. Stripping need to be done carefully to make sure the thickness of the stripped
black sand is consistent for the whole area.
v. For laboratory study, Mozley table analysis needs to be done carefully and
repeatedly to reduce errors in determining the concentration of heavy
minerals in the black sand sample.
vi. Evaluate the result of Magnetic Separator and High Tension Separator
analysis with larger amount of sample. These would reduce the errors in
determining the mineral in the black sand deposit.

85
REFERENCES
Anguilla National Trust, Mining the Sand: understanding the impacts of sand mining. [Online] Available from: http://www.anguillalife.com/ecocorner/0006.php [Accessed on 7th March 2013].
Bureau of Land Management, Technical Bulletin 4 - Types of Placers. (2011) [Online] Available from: http://www.westernmininghistory.com/articles/7098/page4/ [Accessed on 28th March 2013].
Boatsafe - How Can the Moon Affect Tides? (2009) [Online] Available from: http://www.boatsafe.com/kids/tides.htm [Accessed on 2nd March 2013].
Coyne M.S. and Allin C.W. (April 1998) Natural Resources. 3rd ed. University of Kentucky, UK.
Department of Environment and Primary Industries - Mineral sands (Mar 2012) [Online] Available from: http://www.dpi.vic.gov.au/earth-resources/minerals/industrial-minerals/a-z-of-industrial-minerals/mineral-sands [Accessed on 7th March 2013].
Fisheries and Oceans Canada - Tides, Currents, and Water Levels [Online] Available from: http://www.waterlevels.gc.ca/eng/info/faq [Accessed on 4th March 2013].
Geological Survey of Malaysia - Langkawi Geology (2013) [Online] Available from: http://www.geoscience-environment.com/es771/langkawi.htm [Accessed on 7th March 2013].
Geoscience Department Austtralia – Mineral sands (2012) [Online] Available from: http://www.australianminesatlas.gov.au/aimr/commodity/mineral_sands.html [Accessed on 4th March 2013].
Gupta H.K (2005) Oceanology 1st ed. India: Universities Press (India) Private Limited. pp 79.
Hartman H.L., Mutmansky J.M. (2002) Introductory Mining Engineering, 2nd ed. Hoboken, New Jersey: John Wiley and Sons Inc.
Jones G. (2008) Mineral Sands: An Overview of the Industry. Perth, Australia: Iluka Resources Limited, pp 4.
Komoo I., Conservation geology of Langkawi islands, Institute for Environment and Development, Universiti Kebangsaan Malaysia.
Kumar A., (May 2011) A review of seabed and placer mining deposits in India. Degree Dissertation Thesis, National Institute of Technology, Rourkela.

86
Lecture notes for Astronomy 100– Tides (2011) [Online] Available from: http://flightline.highline.edu/iglozman/classes/astronotes/tides.htm [Accessed on 27th March 2013].
Longshore drift (2013) [Online] Available from: https://en.wikipedia.org/wiki/Longshore_drift [Accessed on 27th March 2013].
Macdonald E.H. (1973). Manual of Beach Mining Practise, Exploration and Evaluation, 2nd ed. Canberra, Australia: Australian Government Publishing Service.
National Oceanic and Atmospheric Administration – Rip Currents [Online] Available from: http://www.noaawatch.gov/themes/rip.php [Accessed on 17th March 2013].
Oxford-XRF (2012) [Online] Available from: http://www.oxford-instruments.com/businesses/industrial-products/industrial-analysis/xrf [Accessed on 27th March 2013].
Reyneke L., van der Westhuizen W.G. (2001) Characterisation of a heavy mineral-bearing sample from India and the relevance of intrinsic mineralogical features to mineral beneficiation. Minerals Engineering, Vol.14, no.11.
Rittenhouse G. (1943) The transportation and deposition of heavy minerals. Geological Society American Bulletin, 54:1725-1780.
Sekhar, L.K and Jayadev S.K “Karimanal ( Dec 2003) Mineral Beach-Sand, Mining In The Alappuzha Coast Of Kerala – A People’s Perspective, Proceedings of the Third International Conference on Environment and Health, Chennai, India. Chennai: Department of Geography, University of Madras and Faculty of Environmental Studies, York University. Pages 470 – 488.
Strip mining (April 2013) Available from: http://jazzysearthscience.blogspot.com/2013/04/surface-minning.html [Accessed on 7th March 2013].
Surface Science Western, Scanning Electron Microscopy coupled with Energy Dispersive X-ray (SEM/EDX) Spectroscopy. [Online] Available from: http://www.surfacesciencewestern.com/analytical-services/scanning-electron-microscopy-coupled-with-energy-dispersive-x-ray-semedx-spectroscopy/ [Accessed on 4th March 2013].
Surface mining (May 2013) Available from: http://en.wikipedia.org/wiki/ Surface_mining [Accessed on 24th March 2013].
Tide (2013) [Online] Available from: http://en.wikipedia.org/wiki/Tide [Accessed on 7th March 2013]..
87
Tyler R.M and Minnitt R.C.A. (March 2004) A review of sub-Saharan heavy mineral sand deposits: implications for new projects in southern Africa. In The Journal of The South African Institute of Mining and Metallurgy. South Africa. pp. 92.
VLIZ for UNESCO/IOC - Sea level station monitoring facility (2013) [Online] Available from: http://www.ioc-sealevelmonitoring.org/station.php?code=lank [Accessed on 7th March 2013].
Voyage (2010) [Online] Available from: http://www.voyage99.com/langkawi/beaches/pasir-hitam-beach.html [Accessed on 7th March 2013].
Wills B.A., and Napier-Munn T.J. (Oct 2006) Mineral Processing Technology: An Introduction to the Practical Aspect of Ore Treatment and Mineral Recovery. 7th ed. Elsevier Science and Technology Books.
Woods Hole Group - Littoral cells delineated for Cape Cod (2011) [Online] Available from: http://woodsholegroup.wordpress.com/2011/05/10/littoral-cells-delineated-for-cape-cod/ [Accessed on 7th March 2013].
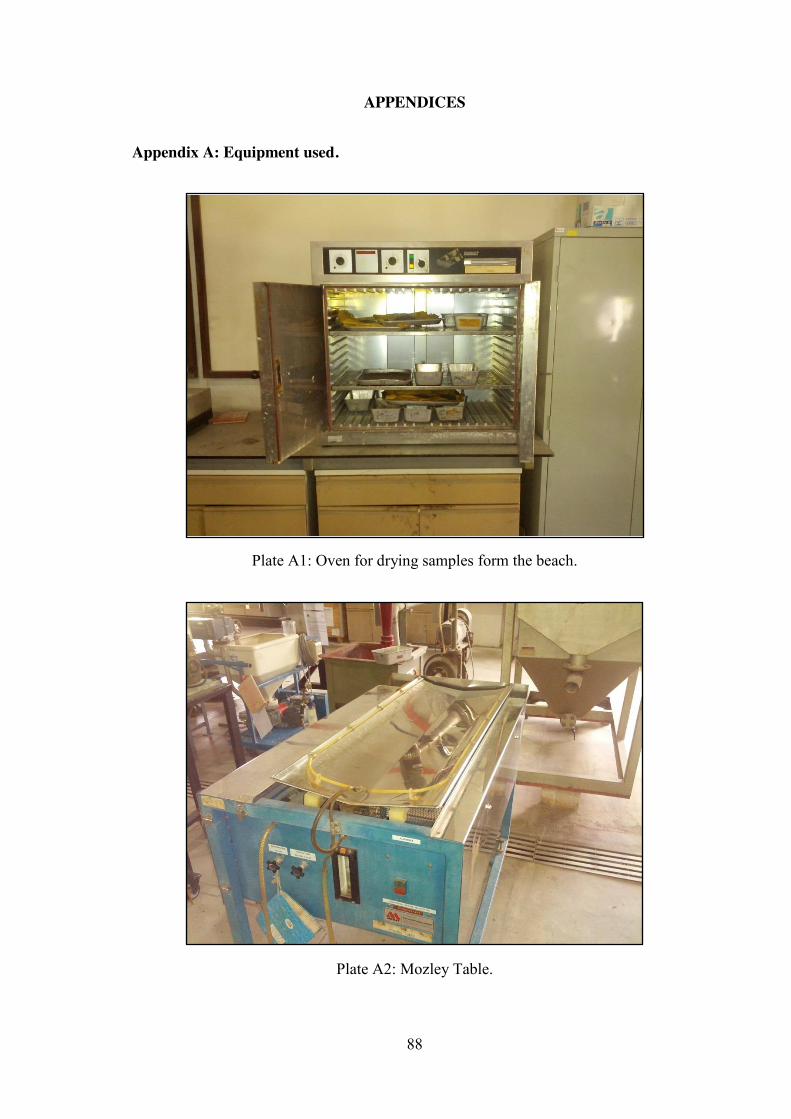
88
APPENDICES
Appendix A: Equipment used.
Plate A1: Oven for drying samples form the beach.
Plate A2: Mozley Table.

89 !
Plate A3: Rare Earth Magnetic Roll Separator.
Plate A4: High Tension Separator.
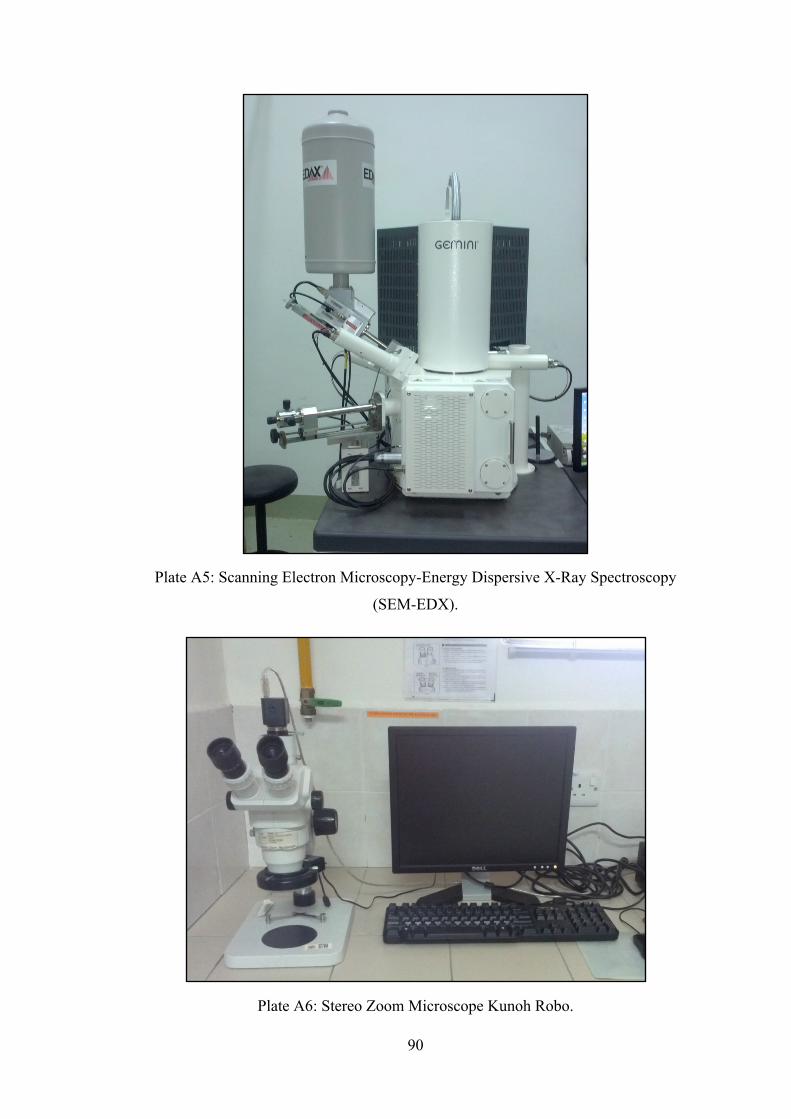
90 !
Plate A5: Scanning Electron Microscopy-Energy Dispersive X-Ray Spectroscopy
(SEM-EDX).
Plate A6: Stereo Zoom Microscope Kunoh Robo.

91 !
Appendix B: Data of gravity separation using Mozley table.
Table B1: Detail data for calculation of percentage of heavy mineral.
Date and tides Sample Mass Initial
(g)
Mass Concentrate
(g)
Mass Tailing (g)
Mass Concentrate and Tailing
(g)
Percentage Concentrate
(%)
Diff. initial and final mass (g)
Remarks
24.1.13 Initial sample
B1 - - - - - - 2 samples cannot be taken because located in the water.
D1 - - - - - - B2 129.60 52.22 74.79 127.01 41.11 2.59 D2 101.81 52.11 44.37 96.48 54.01 5.33 C3 100.46 32.83 64.71 97.54 33.66 2.92 B4 102.62 21.78 77.19 98.97 22.01 3.65 D4 129.65 36.04 89.73 125.77 28.66 3.88
24.1.13 Evening
B1 - - - - - - Only 2 samples are taken because day tides affected only these two points.
D1 - - - - - - B2 - - - - - - D2 - - - - - - C3 - - - - - - B4 87.02 40.92 42.88 83.80 48.83 3.22 D4 87.42 20.91 65.00 85.91 24.34 1.51
!
!
!
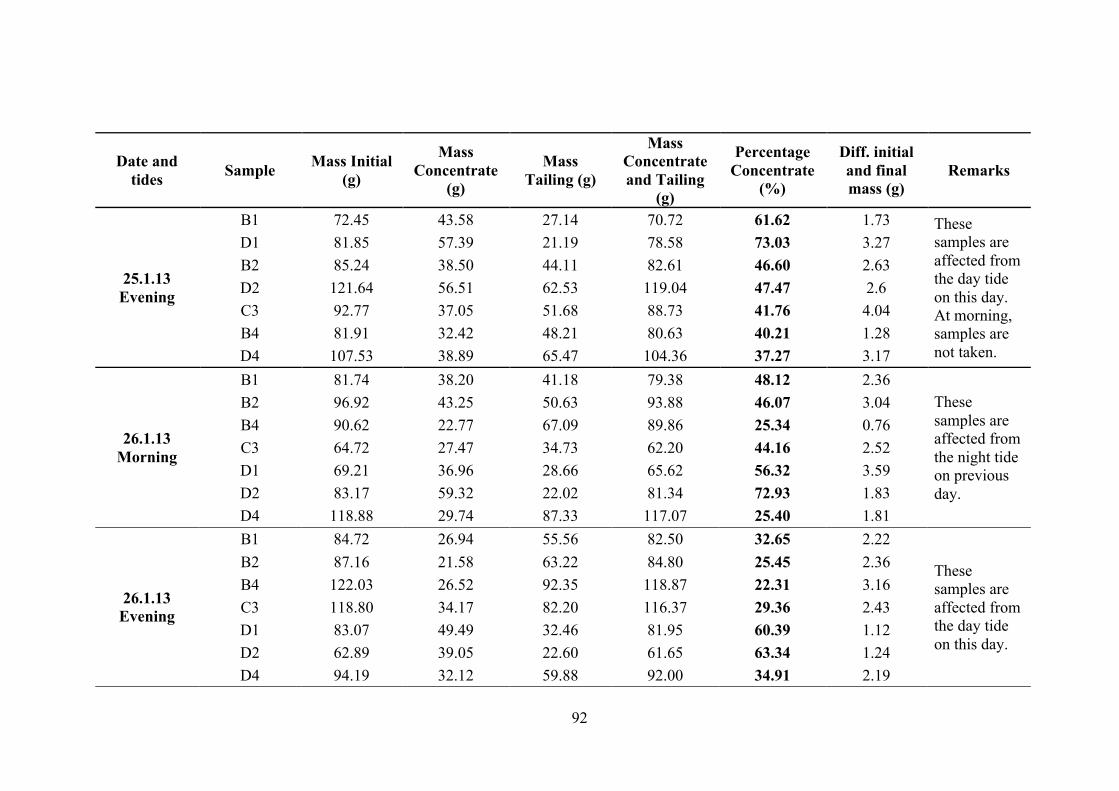
92 !
Date and tides Sample Mass Initial
(g)
Mass Concentrate
(g)
Mass Tailing (g)
Mass Concentrate and Tailing
(g)
Percentage Concentrate
(%)
Diff. initial and final mass (g)
Remarks
25.1.13 Evening
B1 72.45 43.58 27.14 70.72 61.62 1.73 These samples are affected from the day tide on this day. At morning, samples are not taken.
D1 81.85 57.39 21.19 78.58 73.03 3.27 B2 85.24 38.50 44.11 82.61 46.60 2.63 D2 121.64 56.51 62.53 119.04 47.47 2.6 C3 92.77 37.05 51.68 88.73 41.76 4.04 B4 81.91 32.42 48.21 80.63 40.21 1.28 D4 107.53 38.89 65.47 104.36 37.27 3.17
26.1.13 Morning
B1 81.74 38.20 41.18 79.38 48.12 2.36 These samples are affected from the night tide on previous day.
B2 96.92 43.25 50.63 93.88 46.07 3.04 B4 90.62 22.77 67.09 89.86 25.34 0.76 C3 64.72 27.47 34.73 62.20 44.16 2.52 D1 69.21 36.96 28.66 65.62 56.32 3.59 D2 83.17 59.32 22.02 81.34 72.93 1.83 D4 118.88 29.74 87.33 117.07 25.40 1.81
26.1.13 Evening
B1 84.72 26.94 55.56 82.50 32.65 2.22
These samples are affected from the day tide on this day.
B2 87.16 21.58 63.22 84.80 25.45 2.36 B4 122.03 26.52 92.35 118.87 22.31 3.16 C3 118.80 34.17 82.20 116.37 29.36 2.43 D1 83.07 49.49 32.46 81.95 60.39 1.12 D2 62.89 39.05 22.60 61.65 63.34 1.24 D4 94.19 32.12 59.88 92.00 34.91 2.19

93 !
Date and tides Sample Mass Initial
(g)
Mass Concentrate
(g)
Mass Tailing (g)
Mass Concentrate and Tailing
(g)
Percentage Concentrate
(%)
Diff. initial and final mass (g)
Remarks
27.1.13 Morning
B1 76.14 30.37 42.70 73.07 41.56 3.07 These samples are affected from the night tide on previous day.
B2 71.23 26.28 42.91 69.19 37.98 2.04 B4 59.93 21.83 37.65 59.48 36.70 0.45 C3 64.27 26.13 36.78 62.91 41.54 1.36 D1 68.20 45.28 22.30 67.58 67.00 0.62 D2 64.82 39.96 22.75 62.71 63.72 2.11 D4 64.92 21.31 42.06 63.37 33.63 1.55
27.1.13 Evening
B1 98.79 42.93 53.42 96.35 44.56 2.44
These samples are affected from the day tide on this day.
D1 74.90 36.86 37.50 74.36 49.57 0.54 B2 86.32 23.62 60.73 84.35 28.00 1.97 D2 100.16 29.29 70.84 100.13 29.25 0.03 C3 77.53 14.65 56.96 71.61 20.46 5.92 B4 60.94 13.93 43.63 57.56 24.20 3.38 D4 68.90 32.94 35.51 68.45 48.12 0.45

94 !
Appendix C: Overall beach levels average increments calculation.
1. Overall Average Increments (When stripping is done)
= !Sum!(Average!increments!when!stripping!is!done)How!many!times!stripping!is!done
= !0.9+ 0.6+ 0.8+ 0.84
= !0.78!Inch
2. Overall Average Increments (When no stripping is done)
= !Sum!(Average!increments!when!no!stripping!is!done)How!many!times!stripping!is!not!done
= !−0.1+ 0.2+ 0.13
= !0.1 Inch
Appendix D: Overall average concentration of heavy minerals in black sand
deposit calculation.
1. Overall Average Concentration (At particular tides)
= !Sum!(Average!concentration!at!particular!tides)Number!of!times!conducting!the!experiments! !×100%
= !35.89+ 36.59+ 49.71+ 45.48+ 38.34+ 46.02+ 34.887 !×100%
= !40.99!%!
2. Overall Average Concentration (At each sampling points)
= !Sum!(Average!concentration!at!each!sampling!points)Number!of!sampling!points !×100%
= !45.70+ 46.42+ 33.34+ 40.97+ 46.60+ 47.89+ 33.197 !×100%
= !42.01%