evaluation methods of adsorbents for air purification and
TRANSCRIPT

HAL Id: hal-02093511https://hal.archives-ouvertes.fr/hal-02093511
Submitted on 6 Nov 2020
HAL is a multi-disciplinary open accessarchive for the deposit and dissemination of sci-entific research documents, whether they are pub-lished or not. The documents may come fromteaching and research institutions in France orabroad, or from public or private research centers.
L’archive ouverte pluridisciplinaire HAL, estdestinée au dépôt et à la diffusion de documentsscientifiques de niveau recherche, publiés ou non,émanant des établissements d’enseignement et derecherche français ou étrangers, des laboratoirespublics ou privés.
Evaluation Methods of Adsorbents for Air Purificationand Gas Separation at Low Concentration: Case Studies
on Xenon and KryptonA. Monpezat, S. Topin, L. Deliere, D. Farrusseng, B. Coasne
To cite this version:A. Monpezat, S. Topin, L. Deliere, D. Farrusseng, B. Coasne. Evaluation Methods of Adsorbents forAir Purification and Gas Separation at Low Concentration: Case Studies on Xenon and Krypton.Industrial and engineering chemistry research, American Chemical Society, 2019, 58 (11), pp.4560-4571. �10.1021/acs.iecr.8b04866�. �hal-02093511�

1
Evaluation methods of adsorbents for air
purification and gas separation at low
concentration. Case studies on xenon and krypton.
Arnaud Monpezat,a Sylvain Topin,a,* Ludovic Delière,a David Farrusseng,b,* Benoit Coasne c,*
a CEA, DAM, DIF, F-91297 Arpajon – Cedex, France
b IRCELYON, Université Lyon 1, CNRS, 2 Avenue Albert Einstein, F-69626 Villeurbanne, France
c Univ. Grenoble Alpes, CNRS, LIPhy, 38000 Grenoble, France
KEYWORDS. Adsorption capacity and selectivity assessment. Separation and purification at low
concentrations. Ideal Adsorbed Solution Theory and Henry’s method.

2
ABSTRACT. The development of gas separation processes dealing with very low concentration
ranges is a rapidly growing domain with key applications such as trace detection, air purification from
harmful pollutants, etc. Yet, the design of efficient technologies in this field is hampered by the lack
of robust strategies to predict the gas selectivity of optimal adsorbents from simple pure gas
adsorption data. Here, the selectivity predicted using different methods, namely Henry’s method and
the Ideal Adsorbed Solution Theory (IAST), are compared with the true selectivity obtained using
breakthrough experiments. As a case study, these methods are discussed when applied to Xe/Kr
separation in two different process conditions using different adsorbents (an active carbon and two
silver-doped zeolites). Typical data show that Henry’s method – in which selectivity is assumed to
correspond to the ratio of Henry’s constant measured for each gas of the mixture – should be
considered with caution as it is very sensitive to the pressure range considered but also the number of
points used for affinity assessment. IAST is found to be more accurate provided its applicability to
predict gas co-adsorption from pure gas adsorption data is first established. However, even when
applicable, the case of very low concentrations remains a problem as it leads to very large
uncertainties in the selectivity predicted using IAST. We discuss how typical errors in assessing the
selectivities using the different methods lead to non-optimal adsorbent choices for a given separation
process. Finally we demonstrate that Ag-loaded zeolite show Xenon capacities and Xe/Kr selectivities
that surpass all other materials.
1. INTRODUCTION
The field of gas separation, which includes air purification from pollutants, is a stringent concern that
is receiving more and more attention 1,2. Such processes deal with the adsorption of components
present in low to extremely low concentrations into a gaseous atmosphere 3,4. In the last decade, the
discovery and profusion of novel porous materials, exhibiting outstanding adsorption properties

3
towards such applications, have emerged 5–32. However, while research reports and accounts available
in the literature often report proofs of concept for a single or a very small set of applications, the
actual performance in real process conditions remains questionable. Evaluation of a material
efficiency at the laboratory scale using model conditions is usually applied for the selection of best
candidates, but pitfalls can occur in real process conditions or in relevant conditions approaching
them. As an illustration, different studies performed at Praxair by Ackley et al. have shown that
adsorbent ranking using single component adsorption isotherms is not sufficient for optimal adsorbent
selection 33. Assessment methods and selection criteria are therefore required to properly select and/or
design the best adsorbent candidates to make sure that “good adsorption results” of a particular
adsorbent in an initial screening phase in model conditions lead to high process performances in
relevant process conditions – either at the demonstration scale or at the full industrial scale.
Here, we present a critical assessment of the different evaluation methods available for the selection
of optimal adsorbents for gas separation processes. Mainly, we discuss the ability of the selectivity
estimated from single component adsorption isotherms, using either the Ideal Adsorbed Solution
Theory (IAST) or from the ratio of Henry’s constants, to predict the selectivity obtained from
breakthrough experiments (the latter being by construction close to real process conditions). In
particular, we investigate how the conditions for performance evaluation, i.e. measurements using
pure gases at low pressure versus mixtures at a process pressure and different partial pressure ranges.
While transport characteristics are equally important for selecting adsorbents in fine, we only discuss
here thermodynamic aspects such as adsorption capacities and selectivity at equilibrium as they are
“easy” criteria in a screening phase. The present study is motivated by the lack of consistency when
using different assessment methods which usually hampers proper data analysis across literature data
29,34. While most studies assess adsorbent performance for a given separation process using data
corresponding to single component adsorption isotherms, only a limited number of investigations
considers separation columns (the latter, which allow mimicking experimental conditions close to
4
those in the real process, are more complicated to consider). Even when assessed from single
component adsorption data, the adsorption selectivity and capacity are often determined using very
different techniques ranging from experimental (adsorption isotherm, calorimetry, etc.) 29,35 to
theoretical methods (classical Monte Carlo or Molecular Dynamics simulation, ab initio calculations)
15,36–40.
Owing to its relevance to fields such as energy and environmental science 41–44, gas separation is a
rapidly growing domain. As a result, considering the large number of gaseous mixtures and process
conditions covered by the field of gas separation, it is not reasonable to discuss the general validity of
the different adsorbent assessment methods without considering a simple yet representative case
study. In the present work, we consider the interesting application of the capture and separation of Xe
and Kr from air using porous adsorbents. This choice is motivated by the fact that such separation is
particularly relevant both from a fundamental and applied viewpoints.
On the one hand, the separation of heavy rare gases such as Xe and Kr is an important
practical issue that is relevant to nuclear safety constraints (for instance, several unstable Xe, which
are produced by nuclear activities, are also used to monitor radioactive release into the atmosphere,
especially in the context of the Comprehensive nuclear Test Ban Treaty 45–49). Xe recovery from
nuclear gaseous effluents has also a non-negligible economical value as it can be used for applications
in energy efficient lighting, medicine and chemical analysis 27,50–53. Nowadays, cryogenic distillation
is the only large scale industrial process used to capture and separate these rare gases; while this
technique allows reaching high purity noble gases, it is very energy-consuming because it requires
cooling down to the Xe and Kr vaporization temperatures (-108°C and -153°C at 1 atm, respectively)
54,55. Selecting and designing optimal materials for Xe/Kr separation and capture using physisorption
processes in a gas chromatography column is therefore an important task that requires the use of
robust and accurate adsorbent assessment methods.

5
On the other hand, from a more fundamental point of view, Xe/Kr capture and separation
from air is an important problem as their stable isotopes are difficult to purify because of their very
low concentrations in air (0.087 ppmv for Xe, 1.14 ppmv for Kr) 27,56. Adsorbent assessment from
pure gas adsorption data is very questionable as real separation processes operate in very dilute
conditions (ppm levels). In particular, competitive adsorption with other molecules in air such as Ar,
O2 and N2 – which amount for a molar ratio larger than 99.99% – cannot be ignored (especially,
since N2 and O2 have a non-negligible interaction with the adsorbent through their electronic
quadrupole).
While the present experimental work focuses on Xe/Kr separation, we consider a large variety of
samples that have been identified in the literature as promising candidates for this practical
application: active carbons 11,57–60, zeolites including silver-loaded zeolites 35,61–65, metal organic
frameworks 12,13,27,29,34,66–68. Despite its specificity, we believe our study provides very general insights
for adsorbent screening in the case of gaseous mixtures where a low to very low concentration
component has to be adsorbed/purified. By comparing against breakthrough experiments, we identify
possible biases in the different techniques used to estimate an adsorbent selectivity from single
component adsorption data. In particular, we show that erroneous conclusions can be reached
especially when the experimental pressure range considered departs from that relevant to real process
conditions. The remainder of this paper is organized as follows. In Section 2, we present different
techniques used to evaluate an adsorbent selectivity for a given application. We first describe
adsorption and breakthrough experiments (we recall that the latter allow considering experimental
conditions close to the real separation process). We then describe how the adsorbent selectivity can be
estimated from the ratio of Henry’s constants determined using single component adsorption
isotherms. Finally, we describe the Ideal Adsorbed Solution Theory (IAST) which provides another
selectivity evaluation method by predicting the gas mixture co-adsorption isotherms from the single

6
component data. In Section 3, after a brief presentation of the adsorbents considered for Xe/Kr
separation and capture, we present the results obtained using the different methods described in the
previous section. In particular, for the two methods relying on the use of single component adsorption
isotherms, we discuss the role of the pressure range considered to assess the adsorbent selectivities.
Section 4 presents some concluding remarks.
2. MATERIALS AND METHODS
2.1. Adsorption and breakthrough experiments
In this paper, we measured the single component adsorption isotherms for Xe, Kr, and N2 at room
temperature as well as breakthrough curves for their mixtures at the same temperature. In what
follows, we present the different set-ups used to obtain single component adsorption isotherms and
breakthrough curves.
Isothermal adsorption experiments. The adsorption isotherms for Xe, Kr and N2 were carried out
using a Bellsorp-Max device distributed by MicrotracBel. This apparatus is a Sievert type system
which is equipped with three-staged pressure sensors (0.1 Torr, 10 Torr and 1000 Torr) to measure
pressure down to 6×10⁻³ Pa corresponding to 0.06 ppm. The temperature was regulated by a thermal
bath at 25°C and the measurements were performed using Xe (5.0 grade, Nexeco Air), Kr (4.8 grade,
Messer) and N2 (N2 BIP, Air Products). The typical sample mass was around 0.4 g. Prior to adsorption
measurements, the zeolite samples were outgassed under vacuum: 10-2 kPa at 623 K for 4h and then
10-5 kPa at 623 K for 16h. Active carbons were outgassed using the same device and protocol but at
573 K to avoid possible thermal degradation. The set-up parameters used for the adsorption isotherm
measurements (including equilibrium conditions) can be found in the work by Daniel et al 62.

7
Breakthrough experiments. Breakthrough curves are the most appropriate experimental method to
assess gas separation performances. While breakthrough experiments are carried out at the laboratory
scale, it is very similar to that performed in a practical separation column upon cyclic adsorption-
desorption mode. Moreover, breakthrough experiments allow process evaluation at equilibrium but
also in dynamical adsorption experiment (i.e. when equilibrium is not reached). The experimental set-
up used in the present work to obtain breakthrough curves for various Xe, Kr, and N2 mixtures is
illustrated in Figure 1. The breakthrough curves were obtained at 25 °C using a column (6.28 mm
internal diameter × 64 mm height) containing about 0.3 – 0.4 g of adsorbent. Flow rates have been
optimized to enhance the time resolution of the breakthrough experiments. In all breakthrough
experiments, the timer was started just after the opening of the feed valve. The gas mixture was
passed through the column at a flow rate of 60 mL/min using a mass flow controller for AC. For
Ag@ETS-10 and Ag@ZSM-5 : 60 mL/min for the 1 ppm Xe/1 ppm Kr mixture and 80 mL/min for
the 400 ppm Xe/40 ppm Kr mixture. The gas concentrations at the column outlet were measured by
mass spectrometry (THERMO SCIENTIFIC, Prima Pro) and gas chromatography (VARIAN, 490-
GC) for Xe and by mass spectrometry only for Kr. While the time resolution of the Mass
Spectrometer (MS) is 9 s, the time resolution of the Gas Chromatography (GC) apparatus is ~100 s.
The results reported in this study correspond to the measurements of the mass spectrometer because
of its better time resolution. GC results were used to cross-check Xe measurements. Calibration of the
analytical instruments was performed using three xenon calibrated cylinders at different
concentrations (1 ppm, 5 ppm and 1000 ppm in nitrogen and in air).

8
Figure 1. Schematic representation of the breakthrough experiments using adsorbent materials. (a)
The column (64 mm long x 6 mm inner diameter) used for the breakthrough experiments is filled with
the adsorbent (Ag@ZSM-5 in this example) and plugged with cotton and a steel mesh at each end.
The steel tube is shown in grey, the steel mesh in darker grey, the cotton in white, and the adsorbent
in orange. (b) The experimental set-up is composed of the adsorption column as the central element
positioned in a chromatographic oven used to precisely control the temperature during the
breakthrough experiments. The gas is injected at a given pressure (air liquid valve) and flow
(Bronkhorst controller El Flow: 60 mL/min) in the column through the head and exits at the bottom.
The flow is then divided into two parts feeding the gas chromatograph (VARIAN, 490-GC) and the
mass spectrometer (THERMO SCIENTIFIC, Prima Pro). Both devices are connected to a computer
for signal acquisition and processing.
9
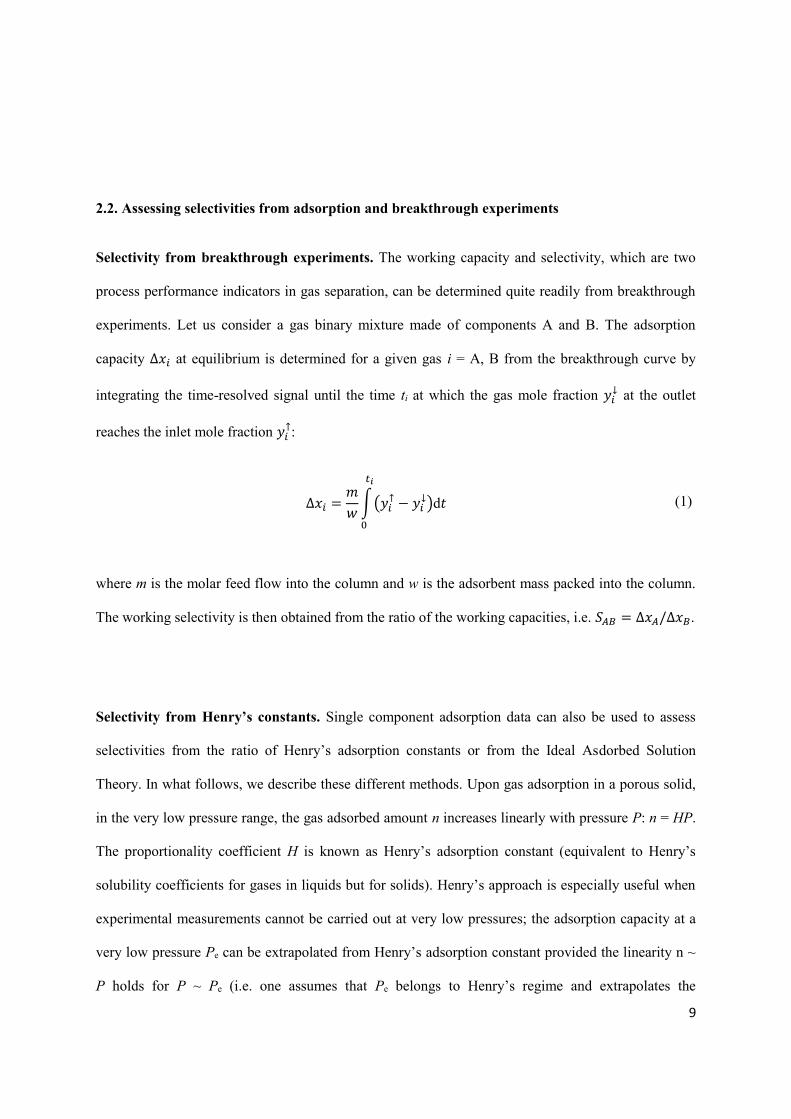
2.2. Assessing selectivities from adsorption and breakthrough experiments
Selectivity from breakthrough experiments. The working capacity and selectivity, which are two
process performance indicators in gas separation, can be determined quite readily from breakthrough
experiments. Let us consider a gas binary mixture made of components A and B. The adsorption
capacity ∆𝑥𝑖 at equilibrium is determined for a given gas i = A, B from the breakthrough curve by
integrating the time-resolved signal until the time ti at which the gas mole fraction 𝑦𝑖↓ at the outlet
reaches the inlet mole fraction 𝑦𝑖↑:
∆𝑥𝑖 =𝑚
𝑤∫(𝑦𝑖
↑ − 𝑦𝑖↓)d𝑡
𝑡𝑖
0
(1)
where m is the molar feed flow into the column and w is the adsorbent mass packed into the column.
The working selectivity is then obtained from the ratio of the working capacities, i.e. 𝑆𝐴𝐵 = ∆𝑥𝐴/∆𝑥𝐵.
Selectivity from Henry’s constants. Single component adsorption data can also be used to assess
selectivities from the ratio of Henry’s adsorption constants or from the Ideal Asdorbed Solution
Theory. In what follows, we describe these different methods. Upon gas adsorption in a porous solid,
in the very low pressure range, the gas adsorbed amount n increases linearly with pressure P: n = HP.
The proportionality coefficient H is known as Henry’s adsorption constant (equivalent to Henry’s
solubility coefficients for gases in liquids but for solids). Henry’s approach is especially useful when
experimental measurements cannot be carried out at very low pressures; the adsorption capacity at a
very low pressure Pe can be extrapolated from Henry’s adsorption constant provided the linearity n ~
P holds for P ~ Pe (i.e. one assumes that Pe belongs to Henry’s regime and extrapolates the

10
experimental data to a pressure much lower than the smallest pressure measured experimentally). For
a mixture in Henry’s regime, 𝑥𝑖 = 𝐻𝑖𝑦𝑖 with i = A, B so that the working selectivity can be calculated
𝑆𝐴𝐵𝑤 as:
𝑆𝐴𝐵𝑤 =
𝑥𝐴
𝑥𝐵=
𝐻𝐴𝑦𝐴
𝐻𝐵𝑦𝐵 (2)
Besides the working selectivity, one can consider the selectivity 𝑆𝐴𝐵 as defined from the ratio of
Henry’s adsorption constants:
𝑆𝐴𝐵 =𝑥𝐴/𝑦𝐴
𝑥𝐵/𝑦𝐵= 𝐻𝐴/𝐻𝐵 (3)
We note that the difference between the first (working) and second (Henry) selectivity is that the
second definition is normalized by the relative concentrations in the gas phase.
Selectivity from the Ideal Adsorbed Solution Theory (IAST). When a gas separation process
involves adsorption in a pressure range outside Henry’s regime, the Ideal Adsorbed Solution Theory
can be used to predict gas coadsorption data (the model based on Henry’s adsorption constants is an
asymptotic limit of IAST). This thermodynamic theory, developed by Myers and Prausnitz in 1965 69,
allows obtaining the adsorption capacities of an adsorbent for a gas mixture from its pure component
adsorption isotherms. This theory is based on the following principal assumption: the adsorbed
mixture behaves as an ideal solution so that the molar properties of each component are not affected
by the presence of the other components (a condition usually met for rare gas adsorption).
Excellent reviews discussing IAST and its use are available in the literature 70 but also OFAST for an
extension of IAST to flexible materials 71. Here, we recall the key ingredients needed to derive IAST.
Let us consider the adsorption of a mixture of k gases (i = 1, 2,…, k) adsorbed at a temperature T in a

11
porous solid having a specific surface area A. The molar composition in the adsorbed phase and gas
phase are xi and yi (i = 1, 2,…, k), respectively. In what follows, the superscript 0 refers to a quantity
for the pure component i. For each gas i, phase equilibrium between the adsorbed phase and gas is
driven by the equality of the fugacities:
𝑦𝑖𝑃 = 𝑓𝑖0(𝜋)𝑥𝑖 (4)
where P is the total pressure and 𝑓𝑖0(𝜋) is the fugacity of the gas i when adsorbed in a film or in a
confined phase having a spreading pressure π. In Eq. (3), as mentioned earlier, we assume in IAST
that both the gas and the adsorbed phases behave as ideal phases so that the fugacity coefficient (gas
phase) and activity coefficients (adsorbed phase) are equal to 1. When adsorbed in the same film or
confined phase, the spreading pressure π experienced by the k gaseous components is identical. Using
the Gibbs adsorption isotherm, which relates the change in spreading pressure to adsorption, we
obtain:
𝜋
𝑘B𝑇= ∫ 𝑛𝑖
0(𝑓, 𝑇)d ln 𝑓
ln 𝑓𝑖0
0
(5)
where 𝑘B is Boltzmann’s constant. 𝑛𝑖0(𝑓, 𝑇) are the pure adsorption isotherms for i = 1, 2, …, k taken
at the temperature T and fugacity f (if we assume ideal gases the fugacity corresponds to the gas
pressure). The equality in Eq. (5) must be verified for each gas. The two sets of equations above
provide 2k equations for 2k+1 unknown: 𝑥𝑖, 𝑓𝑖0 for i = 1, 2, ..., k and π (the pure adsorption isotherms
𝑛𝑖0(𝑓, 𝑇) and the molar composition of the gas phase 𝑦𝑖 are known). To provide an additional equation
and solve this set of equations, one simply uses the fact that the sum of the mole fractions in the
adsorbed phase must be equal to 1, i.e. ∑ 𝑥𝑖 = 1𝑖 . Once the values 𝑓𝑖0 are determined, the total
adsorbed amount is obtained as:
1
𝑛(𝑃, 𝑇, 𝑥𝑖)= ∑
𝑥𝑖
𝑛𝑖0(𝑓𝑖
0, 𝑇)
𝑘
𝑖=1
(5)
12
Finally, the adsorbed amounts for each gas is obtained as 𝑛𝑖 = 𝑥𝑖𝑛(𝑃, 𝑇, 𝑥𝑖). By solving these
equations, one readily obtains the mole fractions xi in the adsorbed phase from which both the
working selectivity Sw and regular selectivity S using Eqs. (2) and (3) above.
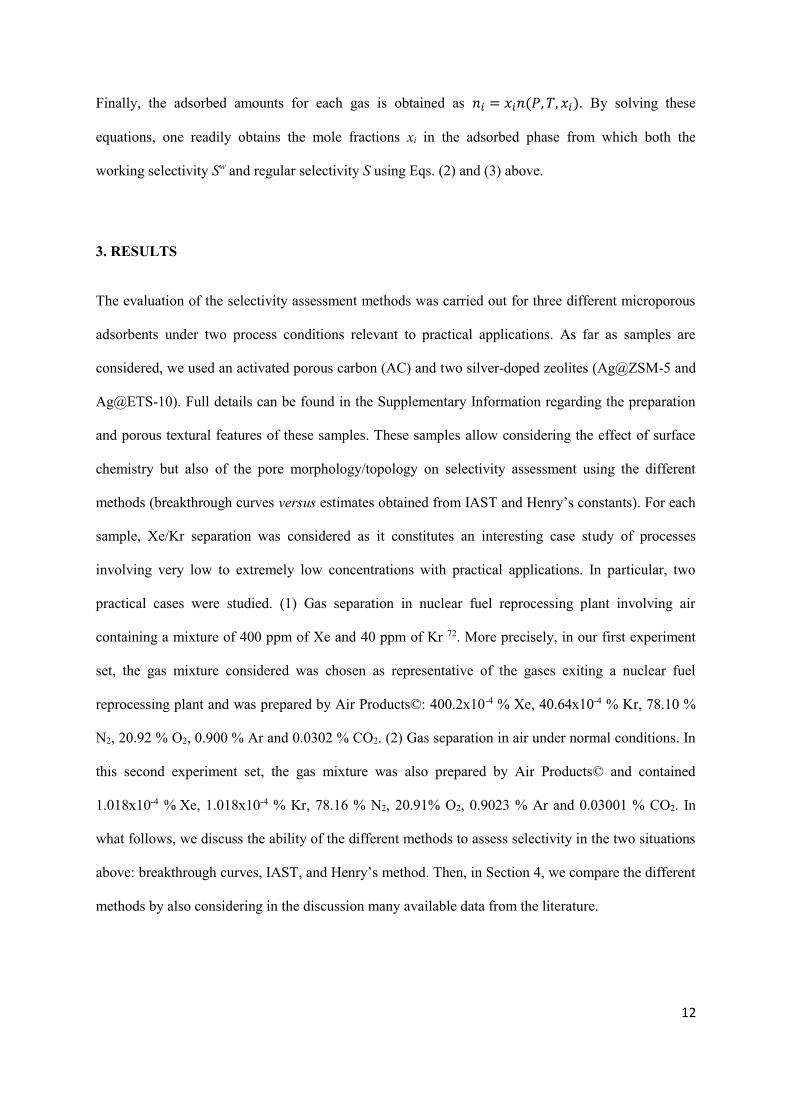
3. RESULTS
The evaluation of the selectivity assessment methods was carried out for three different microporous
adsorbents under two process conditions relevant to practical applications. As far as samples are
considered, we used an activated porous carbon (AC) and two silver-doped zeolites (Ag@ZSM-5 and
Ag@ETS-10). Full details can be found in the Supplementary Information regarding the preparation
and porous textural features of these samples. These samples allow considering the effect of surface
chemistry but also of the pore morphology/topology on selectivity assessment using the different
methods (breakthrough curves versus estimates obtained from IAST and Henry’s constants). For each
sample, Xe/Kr separation was considered as it constitutes an interesting case study of processes
involving very low to extremely low concentrations with practical applications. In particular, two
practical cases were studied. (1) Gas separation in nuclear fuel reprocessing plant involving air
containing a mixture of 400 ppm of Xe and 40 ppm of Kr 72. More precisely, in our first experiment
set, the gas mixture considered was chosen as representative of the gases exiting a nuclear fuel
reprocessing plant and was prepared by Air Products©: 400.2x10⁻⁴ % Xe, 40.64x10⁻⁴ % Kr, 78.10 %
N2, 20.92 % O2, 0.900 % Ar and 0.0302 % CO2. (2) Gas separation in air under normal conditions. In
this second experiment set, the gas mixture was also prepared by Air Products© and contained
1.018x10⁻⁴ % Xe, 1.018x10⁻⁴ % Kr, 78.16 % N2, 20.91% O2, 0.9023 % Ar and 0.03001 % CO2. In
what follows, we discuss the ability of the different methods to assess selectivity in the two situations
above: breakthrough curves, IAST, and Henry’s method. Then, in Section 4, we compare the different
methods by also considering in the discussion many available data from the literature.

13
For each technique, an estimate of the error bar is provided in the different tables reported. For
Henry’s method, the error estimate includes uncertainties in the adsorbed amounts taken from the
experimental adsorption isotherms (mostly arising from errors in the sample mass and in the pressure
sensor) and, more importantly, uncertainties in determining Henry’s constant i.e. the slope in the
adsorption isotherms at low pressures. Regarding the second point, it should be noted that errors are to
be expected depending on the quality of the experimental data which includes the number of points
and error bars on the adsorbed amounts available to perform the linear regression. As for IAST, error
estimates simply include uncertainties in the adsorbed amounts taken from the experimental
adsorption isotherms (again, errors in the sample mass and in the pressure sensor). This means that
our error bars for Henry’s method and IAST do not include the validity of the model themselves. This
is important as large departures between these techniques applied to pure gas adsorption data and
breakthrough experiments will not reflect in our error bars. In particular, while the validity of Henry’s
method is easy to assess by probing the regression coefficient quality, assessment of IAST validity is
far less trivial since error propagation through the mathematical treatment (which includes
thermodynamic integration) should be included. Finally, for the breakthrough experiments, as
described in the methods section, our error bars include the standard error deviation as well as
uncertainties over the dead volume in the experimental set-up.
3.1. Breakthrough curves
Figure 2 shows the breakthrough curve obtained for the active carbon (AC) and the two silver-doped
zeolites (Ag@ZSM-5 and Ag@ETS-10) subjected to a gas mixture flow containing 400 ppm of Xe
and 40 ppm of Kr in air at 298 K. Considering that these gases interact through dispersion forces only,
their interactions with the host matrices scale as a first order approximation with their polarizability.
As a result, owing to its larger polarizability compared to that for Kr, Xe is retained over longer times
within the sample. More precisely, while breakthrough occurs rapidly after 20 s for Kr, Xe
breakthrough only occurs after 150 s. As discussed in Section 2, mathematical integration of the

14
breakthrough curves shown in Figure 2 provides the Xe and Kr adsorption capacities for each
material. From such adsorption capacities, the selectivity can be determined using Eq. (3). Table 1
reports the Xe/Kr selectivity as obtained using breakthrough measurements for each of the three
porous materials subjected to a gas mixture flow containing 400 ppm of Xe and 40 ppm of Kr in air at
298 K. Table 2 reports similar data for the three porous materials but subjected to a gas mixture flow
containing 1 ppm of Xe and 1 ppm of Kr in air. The error bars reported in these tables were
determined by considering the standard deviation of the experimental data (at least 3 repetitions for
each condition). In addition, as stated above, the error bars over the adsorption capacities also include
uncertainties related to the dead volume in the experimental set-up. More in details, the pipe volume
between the valve and the column as well as between the column and the mass spectrometer have
been evaluated and, considering the mass flow, an uncertainty of +/- 2 sec has been added to the
breakthrough time.
As expected, for both mixtures, the selectivity obtained for the silver-doped zeolites is much larger
than that for activated carbon (typically by one to two orders of magnitude). Indeed, owing to the
large dispersion interaction with the O and Ag atoms in the silver-doped zeolites, these samples are
far more efficient in separating gases such as Xe and Kr. Comparison between the data for the two
zeolites suggests that the different amounts of silver is not sufficient to predict the selectivity. Indeed,
while the Ag@ETS-10 possesses a larger amount of silver atoms than Ag@ZSM-5 (30 %wt versus 9
%wt), its selectivity towards Xe is smaller. This result suggests that the distribution of silver clusters
(which is assumed to be centered around values that are larger for the former than for the latter) is
more important than the total Ag amount.

15
Figure 2. Breakthrough curves obtained for a mixture containing 400 ppm of Xe (red circles) and 40
ppm Kr (blue circles) in air passing at 298 K in the samples of AC, Ag@ETS-10 and Ag@ZSM-5.
For AC, the flow rate is 60 mL/min while the adsorbent mass is 0.364 g; for Ag@ETS-10 the flow
rate is 80 mL/min while the adsorbent mass is 0.391 g; for Ag@ZSM-5 the flow rate is 80 mL/min
while the adsorbent mass is 0.382 g. C is the gas concentration in the permeate while C0 is the gas
concentration in the feed mixture.
3.2. Henry selectivity from gas adsorption
The adsorption isotherms for Xe, Kr, and N2 at room temperature are shown in Figure 3 for the three
adsorbents considered in this study (note the use of a log-log scale to highlight the low pressure
range). For AC, the Xe and Kr adsorption isotherms are linear – i.e. follows Henry’s regime – over
three orders of magnitude; typically, from 10-7 bar ~ 0.1 ppm to 10-4 bar ~ 100 ppm for Xe and from
10-6 bar ~ 1 ppm to 10-3 bar ~ 1000 ppm for Kr. For the two silver-doped zeolites (Ag@ZSM-5 and
Ag@ETS-10), the Kr adsorption isotherms also follow a linear behavior as expected in Henry’s
regime. However, even in the very low pressure range, the adsorption of Xe is highly non-linear (Fig.
3). While linear trends can be found in narrow pressure windows, they do not correspond to robust
Henry’s coefficients because very different selectivities can be calculated depending on the Xe
pressure window. To illustrate this point, we have calculated in Table S2 of the Supplementary

16
Information Henry’s coefficients using different narrow pressure windows (i.e linear parts). We found
that Henry’s coefficients vary from 16 to ~70000 and 1.9 to ~6000 for Ag@ZSM-5 and Ag@ETS-10,
respectively. This simple example shows that Henry’s constants estimated in a non linear regime
result in highly misleading estimations for real process conditions.
The adsorbed amounts, Henry’s constants and selectivities determined from isothermal adsorption
measurements using Henry’s approach are gathered in Tables 1 and 2 for the three adsorbents.
Henry’s constants were estimated in the very low pressure range corresponding to the conditions for
spent fuel reprocessing (Table 1) and air purification (Table 2). In practice, these data were obtained
by considering the first 6 lowest pressure points and first 7 points in the Xe and Kr adsorption
isotherms, respectively (the exact pressure ranges considered are reported in each table). For AC,
Henry’s selectivities depart from the “true” selectivities estimated using breakthrough experiments;
while Henry’s selectivity is 20, the true selectivities are 6 and 7 for spent fuel processing and air
purification conditions, respectively. It is less straightforward to conclude about the selectivity
estimate using Henry’s method for Ag-loaded zeolites. While Henry’s selectivities exceed the
breakthrough selectivity for the spent fuel processing conditions, they rather underestimate them for
air purification conditions.
Most importantly, isothermal adsorption measurements are also found to overestimate Xe and Kr
capacities for Ag-loaded zeolites with respect to those obtained using breakthrough experiments.
More precisely, Xe capacities are overestimated by a factor varying from 19 to 40 for Ag@ZSM-5
and by a factor 2 for Ag@ETS-10. On the other hand, the overestimation for AC is only by a factor of
about 1.25 – 1.5. While overestimation can be expected because pure gas adsorption does not take
into account adsorption competitive effects (with other gases), such quantitative errors and the
inconsistency observed between the different adsorbents are not acceptable when one aims at ranking

17
adsorbents. As a consequence, adsorbent ranking based on their estimated adsorption capacities using
pure gas adsorption measurements is questionable even when the pressure ranges considered
correspond to process conditions.

18
Figure 3. Adsorption isotherms at 298 K of Xe (), Kr () and N2 () on Activate Carbon (top),
Ag@ZSM-5 (middle) and Ag@ETS-10 (bottom).

19
3.3. Selectivity from the Ideal Adsorbed Solution Theory
The adsorption capacities obtained from IAST and the selectivity inferred from these values using Eq.
(3) were assessed from the Xe, Kr, and N2 experimental adsorption isotherms shown in Figure 3. We
note that the N2 adsorption isotherm is linear (note the use of a log-log scale to highlight the low
pressure range) for the three adsorbents considered in this study. Figure 4 shows the experimental
adsorption isotherms for the pure gases (Xe, Kr, and N2) as well as the data predicted for Xe using
IAST for AC and Ag@ZSM-5 (the same data for Ag@ETS-10 are shown in the Supplementary
Information). For each adsorption isotherm, ~1000 data points have been added using a linear
interpolation procedure to carry out the IAST approach (more precisely, to perform accurate
integration of the data as described in Section 2). As discussed in more details above, the error bars
presented in this paper for this method only consider the experimental uncertainties inherent to the
experimental instruments used. In other words, the error introduced by the linear interpolation and the
method itself (assuming an ideal adsorbed solution) is not accounted for.
The adsorption capacities and selectivities estimated using IAST are compared with single gas
adsorption measurements and the breakthrough method in Tables 2 and 3 for conditions relevant to
spent fuel reprocessing and air purification, respectively. By using IAST, significant improvements in
the estimation of the selectivity and capacities are observed as the results from pure gas adsorption
isotherms combined with Henry’s approach are found to be very misleading. For AC, IAST corrects
the Henry selectivity measured from the pure gas adsorption isotherms: from 20 to 16 and from 20 to
15 for spent fuel reprocessing and air purification, respectively. Indeed IAST method includes –
although not completely since it assumes that the adsorbed phase behaves as an ideal solution – co-
adsorption effects leading to a sharp decrease of the adsorption capacities and selectivities. Yet the
expected “true” values – as obtained from breakthrough experiments under relevant conditions – are

20
SN ~ 6-7. This selectivity is well below that predicted using IAST which suggests that the assumption
of an ideal adsorbed phase is not perfectly justified. Such a drawback of this theory in the context of
the specific examples considered here is thought to be due to the key effect of nitrogen adsorption
which leads to important competitive co-adsorption effects (including steric effects in ultraconfining
media such as silver-doped zeolites and active carbons).
As expected, IAST leads to a downward correction of the Xe and Kr adsorbed amounts as it accounts
for competitive adsorption from N2. While the correction is minor for AC and Ag@ETS-10, the
correction for the Xe and Kr adsorbed amounts in Ag@ZSM-5 is very important as it decreases these
values by about 2 orders of magnitude. More importantly, the Xe adsorbed amounts estimated using
IAST is in very good agreement with the breakthrough measurements 2.3x10⁻⁴ versus 2.4x10⁻⁴ for air
purification and 0.86x10⁻⁶ versus 1.3x10⁻⁶ for air purification. The important correction for
Ag@ZSM-5 with respect to those for AC and Ag@ETS-10 can be explained by the stronger N2
adsorption observed for the former. Indeed, looking at the pure gas adsorption isotherms in Figure 3,
the N2 adsorbed amounts for Ag@ZSM-5 are above or close to those for Kr while they are
significantly below those for AC and Ag@ETS-10.
The IAST selectivities for Ag@loaded zeolites overestimate the expected selectivities due to an
underestimation of the adsorbed amounts for Kr. However, it falls within the measurement
uncertainties. We also emphasize that adsorbents with selectivity above 100 can be considered as
extremely selective – it makes little sense to compare selectivities above this value as such very large
numbers are prone to very significant errors. In summary, IAST enables correcting capacity and
selectivity indicators to provide data that are more reliable when compared with those obtained using
breakthrough measurements. In contrast to Henry’s method, it does not rely on the shape of the
adsorption data so that even strongly adsorbing fluids at low pressure can be considered (typically, the

21
fluids and pressure ranges considered in the present work). In particular, adsorption capacities for the
different gases considered in a mixture are found to be quite accurate independently of the shape of
the adsorption isotherms. However, even if this method provides a valuable tool to evaluate
adsorption capacities in mixtures, selectivities errors such as those reported above with IAST are not
acceptable to rank adsorbents based on this performance indicator only.
Figure 4. IAST method applied at 298 K to Xe capture in a mixture of 40 ppm Kr and N2 and to Kr
capture in a mixture of 400 ppm Xe and N2: activated carbon (left) and Ag@ZSM-5 (right). The pure
adsorption isotherms correspond to the symbols: Xe (), Kr () and N2 (). The dashed lines are the
adsorbed amounts for Xe and Kr as predicted from IAST.
4. DISCUSSION
In the previous section, we have discussed the ability of different methods to obtain robust
performance indicators for gas separation. While breakthrough experiments provide a robust estimate
of the selectivy for a given gas mixture, single gas adsorption isotherms combined with Henry’s
method or IAST can provide accurate data provided several hypotheses are verified. On the other
hand, when such requirements are not fulfilled, the inferred adsorption capacities and selectivities can
depart by orders of magnitude from their “true” values. The main important points unveiled in this
work can be discussed as follows.
22
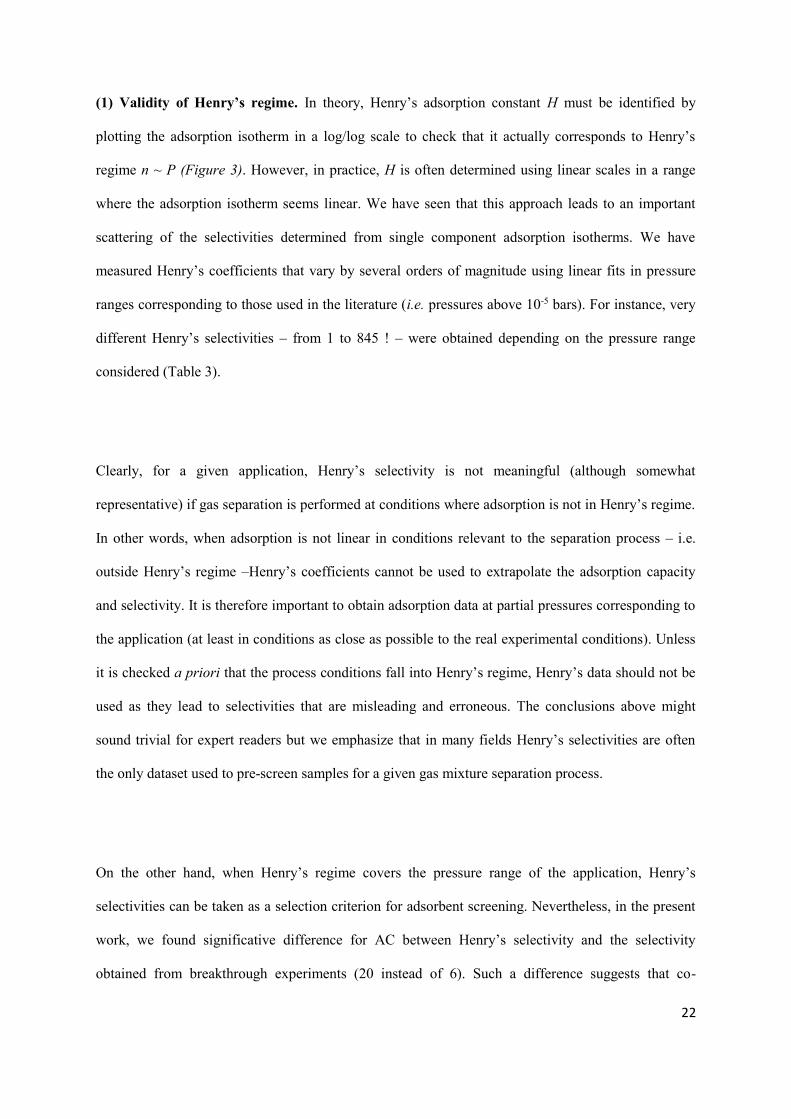
(1) Validity of Henry’s regime. In theory, Henry’s adsorption constant H must be identified by
plotting the adsorption isotherm in a log/log scale to check that it actually corresponds to Henry’s
regime n ~ P (Figure 3). However, in practice, H is often determined using linear scales in a range
where the adsorption isotherm seems linear. We have seen that this approach leads to an important
scattering of the selectivities determined from single component adsorption isotherms. We have
measured Henry’s coefficients that vary by several orders of magnitude using linear fits in pressure
ranges corresponding to those used in the literature (i.e. pressures above 10-5 bars). For instance, very
different Henry’s selectivities – from 1 to 845 ! – were obtained depending on the pressure range
considered (Table 3).
Clearly, for a given application, Henry’s selectivity is not meaningful (although somewhat
representative) if gas separation is performed at conditions where adsorption is not in Henry’s regime.
In other words, when adsorption is not linear in conditions relevant to the separation process – i.e.
outside Henry’s regime –Henry’s coefficients cannot be used to extrapolate the adsorption capacity
and selectivity. It is therefore important to obtain adsorption data at partial pressures corresponding to
the application (at least in conditions as close as possible to the real experimental conditions). Unless
it is checked a priori that the process conditions fall into Henry’s regime, Henry’s data should not be
used as they lead to selectivities that are misleading and erroneous. The conclusions above might
sound trivial for expert readers but we emphasize that in many fields Henry’s selectivities are often
the only dataset used to pre-screen samples for a given gas mixture separation process.
On the other hand, when Henry’s regime covers the pressure range of the application, Henry’s
selectivities can be taken as a selection criterion for adsorbent screening. Nevertheless, in the present
work, we found significative difference for AC between Henry’s selectivity and the selectivity
obtained from breakthrough experiments (20 instead of 6). Such a difference suggests that co-
23
adsorption effects, which are not taken into consideration in Henry’s method, are likely to be
important for this system. In contrast, for very selective samples such as Ag-loaded zeolites, we found
selectivities above 100 using both Henry’s approach and breakthrough measurements. This result
suggests that for very large selectivities Henry’s approach allows discriminating adsorbents with very
different selectivities. From a practical viewpoint, it can be assumed that all selectivities larger than
100 are equivalent. Indeed, considering a gas mixture with 400 ppm Xe and 40 ppm Kr, a normalized
selectivity of 100 would result in a Xe purity of 99.90 % while a selectivity of 500 would generate a
marginal larger value of 99.95 %. In the light of these two points, we can assume that it is not possible
to discriminate the process performances of Ag@ZSM-5 and Ag@ETS-10 using the selectivity
indicator while adsorption capacities can still be regarded as a main discriminant criterion.
(2) IAST selectivities and capacities. An important motivation in our approach was to assess the
ability of IAST to predict accurately selectivities from gas adsorption isotherms. This theory is a very
powerful theory that allows predicting co-adsorption in mixtures starting from pure gas adsorption
isotherms. In particular, IAST quantitatively corrects downward the adsorbed amounts as it accounts
for competitive adsorption effects such as in the presence of N2. Of particular relevance to the present
work, the presence of N2 in a very large amount (>99.95 %) was found to have a non-negligible
impact on the Xe and Kr capacities and selectivities. We found that IAST leads to a better evaluation
of the selectivity for the AC. We also found that the adsorption capacitity of Ag@ZSM-5 – which was
overestimated by 2 orders of magnitude when Henry’s method was used – is very well estimated by
applying IAST. The downward correction for Ag@ZSM-5 is far more spectacular than for Ag@ETS-
10. While the strongest adsorption sites were characterized as Ag nanoparticles in Ag@ZSM-5 in an
earlier study 35,61,62, identifying the origins of such adsorption differences between these two Ag-
loaded zeolites is beyond the scope of this paper.
24
(3) Comparison of Henry’s selectivity with available literature data. Henry’s selectivities for the 3
adsorbents considered in our work are compared with literature data in Table 3. For each of the
following samples, the selectivity for Kr/Xe was also estimated using Henry’s method: Ni-MOF-74
10,11,34,73,74, CC3 75,76, Co-formate 10, HKUST-1 34,68, SBMOF-1 12, SBMOF-2 13 and Noria 66,77. For
Ni-MOF-74, the authors who have conducted the experimental study have verified the linearity of the
pure Xe adsorption isotherm in the range between 4x10⁻⁶ and 1.5x10⁻¹ bar (five experimental points
were used to lead to a regression coefficient R2 = 0,9999 11,12,34). Hence, for this sample, Henry’s
regime is clearly verified at least for conditions corresponding to spent fuel processing. In contrast,
for the other adsorbents, Henry’s regime is not verified in the pressure range corresponding to process
conditions as data are missing at low pressures. At best, Henry’s coefficients and selectivities were
estimated from linear fits but at pressures which are three to four orders of magnitude above relevant
pressure windows. Consequently, and according to the discussion above, these data must be regarded
with very high caution as they may not be representative or relevant. In contrast, we can safely
compare the results obtained for Ni-MOF-74 11,12,34 with those for the active carbon considered in this
study as Henry’s regime applies for these two samples. Henry’s selectivity for the standard active
carbon (AC) is 20 against 6 for Ni-MOF-74. Moreover, we can see that none of the other MOF
adsorbents or porous organic cage adsorbents exceed a Henry selectivity of 20.
(4) Ag-loaded zeolites as optimal adsorbents. As far as Xe separation from Kr in the low
concentration range is concerned, breakthrough experiments confirm that Ag@ZSM-5 and Ag@ETS-
10 are far more efficient than active porous carbons but also than all the adsorbents reported in the
literature. In addition to their very large selectivity (> 100), the adsorption capacities for these two
samples are one or two orders of magnitude larger than for activated carbons which are considered as
benchmark materials (typically, the Xe capacity for Ag-loaded zeolite reaches almost 1 mmol/kg for
1ppm of Xe).
25
(5) Assessment and selection criteria in a screening study. It is important to note that considering
an inappropriate pressure range for adsorbent selection is misleading. For example, if a larger Xe
pressure had been considered in our previous screening 62, Ag-doped zeolites would not have been
identified as optimal adsorbents for Xe/Kr separation in the low pressure range. This nicely illustrates
that any quest for optimal and innovative materials must be performed with data taken under relevant
conditions. In the framework of the present paper – which deals with a case study of Xe and Kr
separation at very low concentrations – it is recommended to carry out Xe, Kr and N2 adsorption
measurements in a broad pressure range – typically 10-7 to 10-2 bar. This guarantees that IAST can be
applied to correct from non negligible N2 co-adsorption.
5. CONCLUSIONS
In this paper, we have considered a specific yet representative gas phase separation involving very
low gas concentrations to investigate the ability of different methods to assess the selectivity from
pure gas adsorption data. More in details, for three adsorbents (an active carbon and two silver-doped
zeolites), we have considered the separation of Xe and Kr gases from air with two typical process
conditions corresponding to Xe detection and air purification. While breakthrough experiments
provide a true measurement of the gas selectivity in given process conditions, the ability of Henry’s
method and the Ideal Adsorbed Solution Theory to predict gas selectivity from single gas adsorption
data have been investigated. With the former method, one predicts the gas selectivity from the ratio of
Henry’s constants determined for each gas in the low concentration range. With the latter method, one
predicts co-adsorption data at any conditions from the pure gas adsorption isotherms measured at the
same temperature.
The use of Henry’s method is found to be very problematic as data availability (which do not
necessarily correspond to Henry’s regime) do not guarantee that the predicted selectivity is relevant to
the process conditions envisaged. As a result, if available data (pressure range) do not correspond to
Henry’s regime, i.e. linear dependency of the adsorbed amount on pressure, Henry’s selectivity is
26
found to depend drastically on the pressure range considered as well as on the number of points used
to estimate Henry’s constant for each gas. In contrast, the Ideal Adsorbed Solution Theory has been
found to accurately predict selectivities from gas adsorption isotherms. Indeed, provided this theory
allows predicting co-adsorption from pure gas adsorption isotherms, the ability of IAST to predict gas
selectivity is judged good. In other words, in contrast to Henry’s method, the ability of IAST to assess
selectivity only depends on its ability to predict gas coadsorption from pure component adsorption
data. However, as a non-negligible limitation of IAST, it was found here that for very low gas
concentrations IAST is very sensitive to errors and uncertainties in the gas adsorbed amounts.
Non-negligible errors inherent to the use of approximated techniques such as those considered in this
paper are found to lead to poorly justified adsorbent choice for a given separation process. In
particular, given the crude approximations behind the use of Henry’s method (except when these
approximations are fully justified), selectivities determined using this technique are found to be very
misleading when used to select a priori some specific adsorbents. By considering a specific but
representative separation process dealing with Xe/Kr gas mixtures, we illustrate how these errors lead
to an unjustified adsorbent selection.

27
Table 1. Selectivity of a few selected adsorbents for a Xe/Kr mixture in dry air (400 ppm Xe, 40 ppm Kr) as assessed using different methods: Henry
approach and Ideal Adsorbed Solution Theory applied to single component adsorption isotherms and breakthrough experiments. For each method, we report
the corresponding selectivity S together with the Kr and Xe capacities (denoted as nKr and nXe, respectively). For the Henry approach, we also report the
Henry adsorption constants and the pressure range used to determine these parameters. For each value, the number in parentheses indicate the uncertainty in
%.
Spent Fuel Reprocessing (400 ppm Xe / 40 ppm Kr in dry air)
Henry IAST Breakthrough
Adsorbent nKr
(mol/g) nXe
(mol/g)
Pressure
range
HKr
(bar)
HKr
(mmol/g/bar
)
Pressure
range
HXe (bar)
HXe
(mmol/g/bar)
SH
nKr
(mol/g) nXe
(mol/g)
SI
nKr
(mol/g) nXe
(mol/g)
SN
AC 0.79×10⁻⁷
(3)
0.16×10⁻⁴
(2)
1.8×10⁻⁶
3.1×10⁻² 1.9 (3)
3.0×10⁻⁷
5.0×10⁻⁴ 39 (2) 20 (3)
0.67×10⁻⁷
(3)
0.1×10⁻⁴
(3) 15 (3)
1.9×10⁻⁷
(6)
0.11×10⁻⁴
(2) 6 (6)
Ag@ZSM-5 34×10-7
(4) 98×10-4
(45)
9.5×10⁻⁸
7.7×10⁻⁶ 82.5 (4)
7.7×10⁻⁸
4.9×10⁻⁷ 24.4×10³ (45)
296
(45)
0.58×10⁻⁷
(3) 2.3×10⁻⁴
(3)
403
(3)
2.5×10⁻⁷
(25) 2.4×10⁻⁴ (7)
142
(26)
Ag@ETS-10 2.8×10⁻⁷
(2) 3.9×10⁻⁴
(36)
8.5×10⁻⁷
9.9×10⁻³ 6.9 (2)
1.5×10⁻⁷
1.3×10⁻⁶ 0.99×10³ (36)
142
(36)
0.31×10⁻⁷
(3) 1.8×10⁻⁴
(3)
567
(3)
1.7×10⁻⁷
(17) 2.0×10⁻⁴ (2)
124
(17)

28
Table 2. Selectivity of a few selected adsorbents for a Xe/Kr mixture in dry air (1 ppm Xe, 1 ppm Kr) as assessed using different methods: Henry approach
and Ideal Adsorbed Solution Theory applied to single component adsorption isotherms and breakthrough experiments. For each method, we report the
corresponding selectivity S together with the Kr and Xe capacities (denoted as nKr and nXe, respectively). For the Henry approach, we also report the Henry
adsorption constants and the pressure range used to determine these parameters. For each value, the number in parentheses indicates the uncertainty in %.
Air purification (1 ppm Xe / 1 ppm Kr in dry air)
Henry IAST Breakthrough
Adsorbent nKr
(mol/g) nXe
(mol/g)
Pressure
range
HKr
(bar)
HKr
(mmol/g/bar)
Pressure
range
HXe (bar)
HXe
(mmol/g/bar)
SH
nKr
(mol/g) nXe
(mol/g)
SI
nKr
(mol/g) nXe
(mol/g)
SN
AC 2.0×10⁻⁹
(3) 0.04×10⁻⁶
(2)
1.8×10⁻⁶
3.1×10⁻² 1.9 (3)
3.0×10⁻⁷
5.0×10⁻⁴ 39 (2) 20 (3)
1.7×10⁻⁹
(3) 0.03×10⁻⁶
(3) 16 (3)
4.2×10⁻⁹
(13) 0.03×10⁻⁶
(2) 7 (13)
Ag@ZSM-5 84×10-9
(4) 25×10-6
(45)
9.5×10⁻⁸
7.7×10⁻⁶ 82.5 (4)
7.7×10⁻⁸
4.9×10⁻⁷ 244×102 (45)
296
(45)
1.8×10⁻⁹
(3) 0.86×10⁻⁶
(3)
469
(3)
4.6×10⁻⁹
(35) 1.3×10⁻⁶
(2)
318
(35)
Ag@ETS-
10
7.0×10⁻⁹ (2)
1.0×10⁻⁶
(36)
8.5×10⁻⁷ 9.9×10⁻³
6.9 (2) 1.5×10⁻⁷ 1.3×10⁻⁶
9.86×10² (36) 142 (36)
1.3×10⁻⁹
(3) 0.93×10⁻⁶
(3)
689 (3)
4.1×10⁻⁹
(9) 1.0×10⁻⁶
(5)
246 (10)

29
Table 3. Selectivity of a few selected adsorbents for a Xe/Kr mixture in dry air (1 ppm Xe, 1 ppm Kr) as assessed using Henry approach. When available, we
also report the “true” selectivity as obtained using breakthrough experiments. For the Henry approach, we consider different pressure ranges which clearly
show the limitations of the technique (i.e. the risk to use data which do not follow exacly the linear regime inherent to Henry’s approach). For each value, the
number in parentheses indicates the uncertainty in % 11,12,34.
Henry
Adsorbent Pressure range HKr
(bar)
HKr
(mmol/g/bar)
Pressure range HXe
(bar)
HXe
(mmol/g/bar) SH SB Ref.
Ni-MOF-74 5.4×10⁻⁵ – 2.0×10⁻¹ 1.4 4×10⁻⁶ - 1.5×10⁻¹ 8.4 6 --- 11,12,34
CC3 2.6×10⁻² – 2.5×10⁻¹ 1.2 1.4×10⁻² – 3.9×10⁻² 15.5 13 --- 12,75
Co-formate 9.3×10⁻³ – 4.0×10⁻¹ 0.9 4.9×10⁻³ – 3.9×10⁻² 9.9 11 --- 10,12
HKUST-1 2×10⁻³ – 1×10⁻² 1.4 2.1×10⁻³ – 1 ×10⁻² 12.2 9 --- 12,34,68
SBMOF-1 3.4×10⁻³ – 5.0×10⁻² 2.4 6.3×10⁻⁵ – 1.0×10⁻³ 38.4 16 --- 12
SBMOF-2 1.0×10⁻² – 5.7×10⁻² 1.2 4.2×10⁻² – 1.1×10⁻¹ 10.4 9 --- 12,13
Noria 3.2×10⁻² – 7.4×10⁻² 0.9 3.1×10⁻² 8.7 9 --- 12,66
CA 1.8×10⁻⁶ - 3.1×10⁻² 2 (3) 3.0×10⁻⁷ - 5.0×10⁻⁴ 39.1 (2) 20 (3) 7 (11) This work
Ag@ZSM-5 9.5×10⁻⁸ - 7.7×10⁻⁶ 82.5 (4) 7.7×10⁻⁸ - 4.9×10⁻⁷ 2.44×10⁴ (45) 296 (45) 318 (35) This work
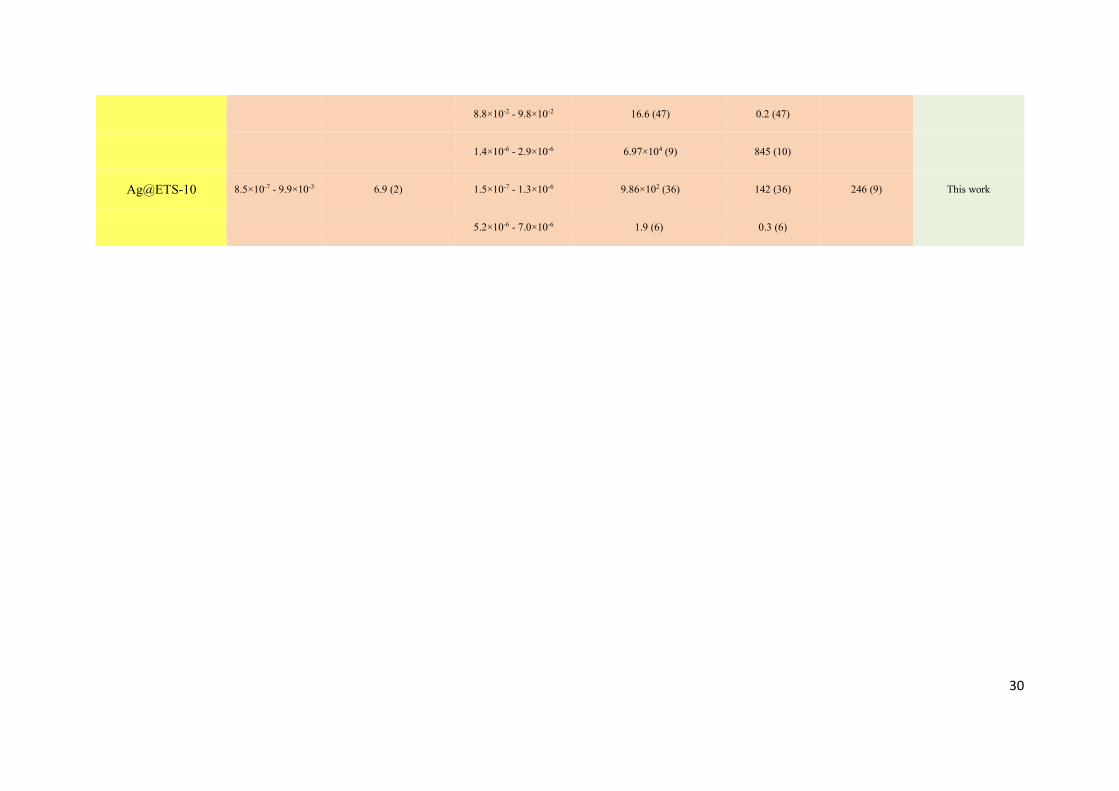
30
8.8×10⁻² - 9.8×10⁻² 16.6 (47) 0.2 (47)
1.4×10⁻⁶ - 2.9×10⁻⁶ 6.97×10⁴ (9) 845 (10)
Ag@ETS-10 8.5×10⁻⁷ - 9.9×10⁻³ 6.9 (2) 1.5×10⁻⁷ - 1.3×10⁻⁶ 9.86×10² (36) 142 (36) 246 (9) This work
5.2×10⁻⁶ - 7.0×10⁻⁶ 1.9 (6) 0.3 (6)

31
ASSOCIATED CONTENT
Supporting Information.
The following files are available free of charge.
Tables S1-S2 and Figures S1-S10 (word)
AUTHOR INFORMATION
Corresponding Author
* Sylvain Topin ([email protected]), David Farrusseng ([email protected]),
Benoit Coasne ([email protected])
Author Contributions
The manuscript was written through contributions of all authors. All authors have given approval
to the final version of the manuscript.

32
REFERENCES
(1) Yang, R. T. Gas Separation by Adsorption Processes; Elsevier, 1987. (2) Wankat, P. C. A Review of: “Adsorption Processes for Gas Separation.” Sep. Purif. Methods 1992,
21 (2), 175–176. (3) Kumar, R.; Huggahalli, M.; Deng, S.; Andrecovich, M. Trace Impurity Removal from Air. Adsorption
2003, 9 (3), 243–250. (4) Kumar, R.; Golden, T. C. Thermal Swing Adsorption Process for Removing Trace Impurities from a
Multi-Component Gas Mixture: (Landfill Gas). Gas Sep. Purif. 1991, 5 (1), 21–24. (5) Li, J.-R.; Sculley, J.; Zhou, H.-C. Metal–Organic Frameworks for Separations. Chem. Rev. 2012, 112
(2), 869–932. (6) Farrusseng, D. Metal-Organic Frameworks: Applications from Catalysis to Gas Storage; John Wiley
& Sons, 2011. (7) Li, J.-R.; Kuppler, R. J.; Zhou, H.-C. Selective Gas Adsorption and Separation in Metal–organic
Frameworks. Chem. Soc. Rev. 2009, 38 (5), 1477–1504. (8) Xiong, S.; Liu, Q.; Wang, Q.; Li, W.; Tang, Y.; Wang, X.; Hu, S.; Chen, B. A Flexible Zinc Tetrazolate
Framework Exhibiting Breathing Behaviour on Xenon Adsorption and Selective Adsorption of Xenon over Other Noble Gases. J. Mater. Chem. A 2015, 3 (20), 10747–10752.
(9) Subrahmanyam, K. S.; Spanopoulos, I.; Chun, J.; Riley, B. J.; Thallapally, P. K.; Trikalitis, P. N.; Kanatzidis, M. G. Chalcogenide Aerogels as Sorbents for Noble Gases (Xe, Kr). ACS Appl. Mater. Interfaces 2017.
(10) Wang, H.; Yao, K.; Zhang, Z.; Jagiello, J.; Gong, Q.; Han, Y.; Li, J. The First Example of Commensurate Adsorption of Atomic Gas in a MOF and Effective Separation of Xenon from Other Noble Gases. Chem. Sci. 2013, 5 (2), 620–624.
(11) Thallapally, P. K.; Grate, J. W.; Motkuri, R. K. Facile Xenon Capture and Release at Room Temperature Using a Metal-Organic Framework: A Comparison with Activated Charcoal. Chem. Commun. Camb. Engl. 2012, 48 (3), 347–349.
(12) Banerjee, D.; Simon, C. M.; Plonka, A. M.; Motkuri, R. K.; Liu, J.; Chen, X.; Smit, B.; Parise, J. B.; Haranczyk, M.; Thallapally, P. K. Metal–organic Framework with Optimally Selective Xenon Adsorption and Separation. Nat. Commun. 2016, 7, ncomms11831.
(13) Chen, X.; Plonka, A. M.; Banerjee, D.; Krishna, R.; Schaef, H. T.; Ghose, S.; Thallapally, P. K.; Parise, J. B. Direct Observation of Xe and Kr Adsorption in a Xe-Selective Microporous Metal–Organic Framework. J. Am. Chem. Soc. 2015, 137 (22), 7007–7010.
(14) Wu, T.; Feng, X.; Elsaidi, S. K.; Thallapally, P. K.; Carreon, M. A. Zeolitic Imidazolate Framework-8 (ZIF-8) Membranes for Kr/Xe Separation. Ind. Eng. Chem. Res. 2017, 56 (6), 1682–1686.
(15) Van Heest, T.; Teich-McGoldrick, S. L.; Greathouse, J. A.; Allendorf, M. D.; Sholl, D. S. Identification of Metal–Organic Framework Materials for Adsorption Separation of Rare Gases: Applicability of Ideal Adsorbed Solution Theory (IAST) and Effects of Inaccessible Framework Regions. J. Phys. Chem. C 2012, 116 (24), 13183–13195.
(16) Wang, Q.; Wang, H.; Peng, S.; Peng, X.; Cao, D. Adsorption and Separation of Xe in Metal–Organic Frameworks and Covalent–Organic Materials. J. Phys. Chem. C 2014, 118 (19), 10221–10229.
(17) Wang, Q.; Xiong, S.; Xiang, Z.; Peng, S.; Wang, X.; Cao, D. Dynamic Separation of Xe and Kr by Metal-Organic Framework and Covalent-Organic Materials: A Comparison with Activated Charcoal. Sci. China Chem. 2016, 59 (5), 643–650.
(18) Soleimani Dorcheh, A.; Denysenko, D.; Volkmer, D.; Donner, W.; Hirscher, M. Noble Gases and Microporous Frameworks; from Interaction to Application. Microporous Mesoporous Mater. 2012, 162, 64–68.

33
(19) Rowsell, J. L. C.; Yaghi, O. M. Metal–organic Frameworks: A New Class of Porous Materials. Microporous Mesoporous Mater. 2004, 73 (1–2), 3–14.
(20) Ryan, P.; Farha, O. K.; Broadbelt, L. J.; Snurr, R. Q. Computational Screening of Metal-Organic Frameworks for Xenon/Krypton Separation. AIChE J. 57 (7), 1759–1766.
(21) Perry, J. J.; Teich-McGoldrick, S. L.; Meek, S. T.; Greathouse, J. A.; Haranczyk, M.; Allendorf, M. D. Noble Gas Adsorption in Metal–Organic Frameworks Containing Open Metal Sites. J. Phys. Chem. C 2014, 118 (22), 11685–11698.
(22) Lee, S.-J.; Yoon, T.-U.; Kim, A.-R.; Kim, S.-Y.; Cho, K.-H.; Hwang, Y. K.; Yeon, J.-W.; Bae, Y.-S. Adsorptive Separation of Xenon/Krypton Mixtures Using a Zirconium-Based Metal-Organic Framework with High Hydrothermal and Radioactive Stabilities. J. Hazard. Mater. 2016, 320, 513–520.
(23) Ghose, S. K.; Li, Y.; Yakovenko, A.; Dooryhee, E.; Ehm, L.; Ecker, L. E.; Dippel, A.-C.; Halder, G. J.; Strachan, D. M.; Thallapally, P. K. Understanding the Adsorption Mechanism of Xe and Kr in a Metal–Organic Framework from X-Ray Structural Analysis and First-Principles Calculations. J. Phys. Chem. Lett. 2015, 6 (10), 1790–1794.
(24) Fernandez, C. A.; Liu, J.; Thallapally, P. K.; Strachan, D. M. Switching Kr/Xe Selectivity with Temperature in a Metal–Organic Framework. J. Am. Chem. Soc. 2012, 134 (22), 9046–9049.
(25) Farrusseng, D.; Daniel, C.; Gaudillère, C.; Ravon, U.; Schuurman, Y.; Mirodatos, C.; Dubbeldam, D.; Frost, H.; Snurr, R. Q. Heats of Adsorption for Seven Gases in Three Metal−Organic Frameworks: Systematic Comparison of Experiment and Simulation. Langmuir 2009, 25 (13), 7383–7388.
(26) Elsaidi, S. K.; Ongari, D.; Xu, W.; Mohamed, M. H.; Haranczyk, M.; Thallapally, P. K. Xenon Recovery at Room Temperature Using Metal–Organic Frameworks. Chem. – Eur. J. 23 (45), 10758–10762.
(27) Banerjee, D.; Cairns, A. J.; Liu, J.; Motkuri, R. K.; Nune, S. K.; Fernandez, C. A.; Krishna, R.; Strachan, D. M.; Thallapally, P. K. Potential of Metal–Organic Frameworks for Separation of Xenon and Krypton. Acc. Chem. Res. 2015, 48 (2), 211–219.
(28) Bae, Y.-S.; Hauser, B. G.; Colón, Y. J.; Hupp, J. T.; Farha, O. K.; Snurr, R. Q. High Xenon/Krypton Selectivity in a Metal-Organic Framework with Small Pores and Strong Adsorption Sites. Microporous Mesoporous Mater. 2013, 169, 176–179.
(29) Banerjee, D.; Simon, C. M.; Elsaidi, S. K.; Haranczyk, M.; Thallapally, P. K. Xenon Gas Separation and Storage Using Metal-Organic Frameworks. Chem 2018, 0 (0).
(30) Lawler, K. V.; Hulvey, Z.; Forster, P. M. Nanoporous Metal Formates for Krypton/Xenon Separation. Chem. Commun. Camb. Engl. 2013, 49 (93), 10959–10961.
(31) Mohamed, M. H.; Elsaidi, S. K.; Pham, T.; Forrest, K. A.; Schaef, H. T.; Hogan, A.; Wojtas, L.; Xu, W.; Space, B.; Zaworotko, M. J.; et al. Hybrid Ultra-Microporous Materials for Selective Xenon Adsorption and Separation. Angew. Chem. Int. Ed Engl. 2016, 55 (29), 8285–8289.
(32) Feng, X.; Zong, Z.; Elsaidi, S. K.; Jasinski, J. B.; Krishna, R.; Thallapally, P. K.; Carreon, M. A. Kr/Xe Separation over a Chabazite Zeolite Membrane. J. Am. Chem. Soc. 2016, 138 (31), 9791–9794.
(33) Ackley, M. W.; Rege, S. U.; Saxena, H. Application of Natural Zeolites in the Purification and Separation of Gases. Microporous Mesoporous Mater. 2003, 61 (1), 25–42.
(34) Liu, J.; Thallapally, P. K.; Strachan, D. Metal–Organic Frameworks for Removal of Xe and Kr from Nuclear Fuel Reprocessing Plants. Langmuir 2012, 28 (31), 11584–11589.
(35) Deliere, L. Adsorption et Séparation Des Gaz Rares Sur Des Adsorbants Dopés À L’argent; Lyon 1, 2015.
(36) Chen, J.; Loo, L. S.; Wang, K. An Ideal Absorbed Solution Theory (IAST) Study of Adsorption Equilibria of Binary Mixtures of Methane and Ethane on a Templated Carbon. J. Chem. Eng. DATA 2011, 56 (4).

34
(37) Greathouse, J. A.; Kinnibrugh, T. L.; Allendorf, M. D. Adsorption and Separation of Noble Gases by IRMOF-1: Grand Canonical Monte Carlo Simulations. Ind. Eng. Chem. Res. 2009, 48 (7), 3425–3431.
(38) Jameson, C. J.; Jameson, A. K.; Lim, H.-M. Competitive Adsorption of Xenon and Krypton in Zeolite NaA: 129Xe Nuclear Magnetic Resonance Studies and Grand Canonical Monte Carlo Simulations. J. Chem. Phys. 1997, 107 (11), 4364–4372.
(39) Kaija, A. R.; Wilmer, C. E. Efficiently Mapping Structure–property Relationships of Gas Adsorption in Porous Materials: Application to Xe Adsorption. Faraday Discuss. 2017, 201 (0), 221–232.
(40) Demir, H.; Greathouse, J. A.; Staiger, C. L.; Iv, J. J. P.; Allendorf, M. D.; Sholl, D. S. DFT-Based Force Field Development for Noble Gas Adsorption in Metal Organic Frameworks. J. Mater. Chem. A 2015, 3 (46), 23539–23548.
(41) Wang, B.; Xie, L.-H.; Wang, X.; Liu, X.-M.; Li, J.; Li, J.-R. Applications of Metal–organic Frameworks for Green Energy and Environment: New Advances in Adsorptive Gas Separation, Storage and Removal. Green Energy Environ. 2018.
(42) Wilcox, J.; Haghpanah, R.; Rupp, E. C.; He, J.; Lee, K. Advancing Adsorption and Membrane Separation Processes for the Gigaton Carbon Capture Challenge. Annu. Rev. Chem. Biomol. Eng. 2014, 5, 479–505.
(43) Sircar, S. Applications of Gas Separation by Adsorption for the Future , Applications of Gas Separation by Adsorption for the Future. Adsorpt. Sci. Technol. 2001, 19 (5), 347–366.
(44) Nandanwar, S. U.; Coldsnow, K.; Utgikar, V.; Sabharwall, P.; Eric Aston, D. Capture of Harmful Radioactive Contaminants from off-Gas Stream Using Porous Solid Sorbents for Clean Environment – A Review. Chem. Eng. J. 2016, 306, 369–381.
(45) Schoeppner, M. Performance Assessment of the CTBTO Noble Gas Network to Detect Nuclear Explosions. Pure Appl. Geophys. 2017, 174 (5), 2161–2171.
(46) Wernsperger, B.; Schlosser, C. Noble Gas Monitoring within the International Monitoring System of the Comprehensive Nuclear Test-Ban Treaty. Radiat. Phys. Chem. 2004, 71 (3), 775–779.
(47) Le Petit, G.; Cagniant, A.; Gross, P.; Douysset, G.; Topin, S.; Fontaine, J. P.; Taffary, T.; Moulin, C. SpalaxTM New Generation: A Sensitive and Selective Noble Gas System for Nuclear Explosion Monitoring. Appl. Radiat. Isot. Data Instrum. Methods Use Agric. Ind. Med. 2015, 103, 102–114.
(48) Topin, S.; Claire GreauauthorCEA, D. a. M.; Ludovic DeliereauthorCEA, D. a. M.; Alexandre HovesepianauthorCEA, D. a. M.; Thomas TaffaryauthorCEA, D. a. M.; Gilbert Le PetitauthorCEA, D. a. M.; Guilhem DouyssetauthorCEA, D. a. M.; Christophe MoulinauthorCEA, D. a. M. SPALAX New Generation: New Process Design for a More Efficient Xenon Production System for the CTBT Noble Gas Network. 2015.
(49) Cagniant, A.; Topin, S.; Le Petit, G.; Gross, P.; Delaune, O.; Philippe, T.; Douysset, G. SPALAX NG: A Breakthrough in Radioxenon Field Measurement. Appl. Radiat. Isot. Data Instrum. Methods Use Agric. Ind. Med. 2018, 134, 461–465.
(50) Jordan, B. D.; Wright, E. L. Xenon as an Anesthetic Agent. AANA J. 2010, 78 (5), 387–392. (51) Raftery, D. Xenon NMR Spectroscopy. In Annual Reports on NMR Spectroscopy; Webb, G. A., Ed.;
Academic Press, 2006; Vol. 57, pp 205–270. (52) Prangé, T.; Schiltz, M.; Pernot, L.; Colloc’h, N.; Longhi, S.; Bourguet, W.; Fourme, R. Exploring
Hydrophobic Sites in Proteins with Xenon or Krypton. Proteins 1998, 30 (1), 61–73. (53) Bolmsjö, M. S.; Persson, B. R. Trapping and Re-Use System for Radioactive Xenon in Nuclear
Medicine. Phys. Med. Biol. 1978, 23 (1), 77–89. (54) XENON Collaboration; Aprile, E.; Aalbers, J.; Agostini, F.; Alfonsi, M.; Amaro, F. D.; Anthony, M.;
Arneodo, F.; Barrow, P.; Baudis, L.; et al. Removing Krypton from Xenon by Cryogenic Distillation to the Ppq Level. Eur. Phys. J. C 2017, 77 (5).

35
(55) Dray, J. R. Cryogenic System for Producing Xenon Employing a Xenon Concentrator Column. US6378333B1, April 30, 2002.
(56) Brimblecombe, P. Air Composition and Chemistry; Cambridge University Press, 1996. (57) Bazan, R. E.; Bastos-Neto, M.; Moeller, A.; Dreisbach, F.; Staudt, R. Adsorption Equilibria of O2,
Ar, Kr and Xe on Activated Carbon and Zeolites: Single Component and Mixture Data. Adsorption 2011, 17 (2), 371–383.
(58) Scarpitta, S. C.; Harley, N. H. Adsorption and Desorption of Noble Gases on Activated Charcoal: I. 133Xe Studies in a Monolayer and Packed Bed. Health Phys. 1990, 59 (4), 383–392.
(59) Ansón, A.; Kuznicki, S. M.; Kuznicki, T.; Haastrup, T.; Wang, Y.; Lin, C. C. H.; Sawada, J. A.; Eyring, E. M.; Hunter, D. Adsorption of Argon, Oxygen, and Nitrogen on Silver Exchanged ETS-10 Molecular Sieve. Microporous Mesoporous Mater. 2008, 109 (1–3), 577–580.
(60) KITANI, S.; TAKADA, J. Adsorption of Krypton and Xenon on Various Adsorbents. J. Nucl. Sci. Technol. 1965, 2 (2), 51–56.
(61) Deliere, L.; Topin, S.; Coasne, B.; Fontaine, J.-P.; De Vito, S.; Den Auwer, C.; Solari, P. L.; Daniel, C.; Schuurman, Y.; Farrusseng, D. Role of Silver Nanoparticles in Enhanced Xenon Adsorption Using Silver-Loaded Zeolites. J. Phys. Chem. C 2014, 118 (43), 25032–25040.
(62) Daniel, C.; Elbaraoui, A.; Aguado, S.; Springuel-Huet, M.-A.; Nossov, A.; Fontaine, J.-P.; Topin, S.; Taffary, T.; Deliere, L.; Schuurman, Y.; et al. Xenon Capture on Silver-Loaded Zeolites: Characterization of Very Strong Adsorption Sites. J. Phys. Chem. C 2013, 117 (29), 15122–15129.
(63) Kuznicki, S. M.; Kelly, D. J. A.; Bian, J.; Lin, C. C. H.; Liu, Y.; Chen, J.; Mitlin, D.; Xu, Z. Metal Nanodots Formed and Supported on Chabazite and Chabazite-like Surfaces. Microporous Mesoporous Mater. 2007, 103 (1–3), 309–315.
(64) IANOVSKI, D.; MUNAKATA, K.; KANJO, S.; YOKOYAMA, Y.; KOGA, A.; YAMATSUKI, S.; TANAKA, K.; FUKUMATSU, T.; NISHIKAWA, M.; IGARASHI, Y. Adsorption of Noble Gases on H-Mordenite. J. Nucl. Sci. Technol. 2002, 39 (11), 1213–1218.
(65) McCormick, A. V.; Chmelka, B. F. Xenon Adsorption in NaA Zeolite Cavities. Mol. Phys. 1991, 73 (3), 603–617.
(66) Patil, R. S.; Banerjee, D.; Simon, C. M.; Atwood, J. L.; Thallapally, P. K. Noria: A Highly Xe-Selective Nanoporous Organic Solid. Chem. – Eur. J. 2016, 22 (36), 12618–12623.
(67) Banerjee, D.; Elsaidi, S. K.; Thallapally, P. K. Xe Adsorption and Separation Properties of a Series of Microporous Metal–organic Frameworks (MOFs) with V-Shaped Linkers. J. Mater. Chem. A 2017, 5 (32), 16611–16615.
(68) Hulvey, Z.; Lawler, K. V.; Qiao, Z.; Zhou, J.; Fairen-Jimenez, D.; Snurr, R. Q.; Ushakov, S. V.; Navrotsky, A.; Brown, C. M.; Forster, P. M. Noble Gas Adsorption in Copper Trimesate, HKUST-1: An Experimental and Computational Study. J. Phys. Chem. C 2013, 117 (39), 20116–20126.
(69) Myers, A. L.; Prausnitz, J. M. Thermodynamics of Mixed-Gas Adsorption. AIChE J. 1965, 11 (1), 121–127.
(70) Tarafder, A.; Mazzotti, M. A Method for Deriving Explicit Binary Isotherms Obeying the Ideal Adsorbed Solution Theory. Chem. Eng. Technol. 2012, 35 (1), 102–108.
(71) Coudert, F.-X. The Osmotic Framework Adsorbed Solution Theory: Predicting Mixture Coadsorption in Flexible Nanoporous Materials. Phys. Chem. Chem. Phys. 2010, 12 (36), 10904–10913.
(72) Jubin, R. T.; Paviet, P. D.; Bresee, J. C. Xenon Recovery from Molybdenum-99 Production. Procedia Chem. 2016, 21, 74–81.
(73) Díaz-García, M.; Mayoral, Á.; Díaz, I.; Sánchez-Sánchez, M. Nanoscaled M-MOF-74 Materials Prepared at Room Temperature. Cryst. Growth Des. 2014, 14 (5), 2479–2487.

36
(74) Liu, J.; Fernandez, C. A.; Martin, P. F.; Thallapally, P. K.; Strachan, D. M. A Two-Column Method for the Separation of Kr and Xe from Process Off-Gases. Ind. Eng. Chem. Res. 2014, 53 (32), 12893–12899.
(75) Chen, L.; Reiss, P. S.; Chong, S. Y.; Holden, D.; Jelfs, K. E.; Hasell, T.; Little, M. A.; Kewley, A.; Briggs, M. E.; Stephenson, A.; et al. Separation of Rare Gases and Chiral Molecules by Selective Binding in Porous Organic Cages. Nat. Mater. 2014, 13 (10), 954–960.
(76) Holden, D. Understanding the Diffusion of Small Gases in Porous Organic Cages Using Molecular Dynamics; University of Liverpool, 2013.
(77) Tian, J.; Thallapally, P. K.; Dalgarno, S. J.; McGrail, P. B.; Atwood, J. L. Amorphous Molecular Organic Solids for Gas Adsorption. Angew. Chem. Int. Ed. 2009, 48 (30), 5492–5495.

37
GRAPHICAL ABSTRACT
Good enough High « shoot »
vs.