evaluation of a statewide program in genetic diseases
TRANSCRIPT
Evaluation of a Statewide Program inGenetic Diseases
Joyce A. Mitchell* and Greg PetroskiIntegrated Technology Services, University of Missouri, Columbia, Missouri
We used the Genetics Office AutomationSystem (GOAS), a database managementsystem designed to facilitate collection andanalysis of medical genetic data, to evaluatethe Missouri Genetics Disease Program(MGDP). From 1985 through 1995, patientdata were collected at four tertiary care ge-netic centers. The number of genetic visitsper 100,000 people more than doubled from1985 through 1995. The results of subpopu-lation analyses indicate that the MGDP hasfacilitated improvements in: (1) services fornewborns and infants, (2) rural outreachprograms, and (3) evaluation of the inci-dence and impact of genetic disorders. Am.J. Med. Genet. 78:217–225, 1998.© 1998 Wiley-Liss, Inc.
KEY WORDS: genetic diseases; epidemiol-ogy; program evaluation
INTRODUCTION
Assimilation of uniformly defined, accurate data onhealth care services and disease entities has been apriority of the public health community for many years.The U.S. Centers for Disease Control and Prevention(CDC) has assisted in this daunting task by supportingthe development of integrated methods to access publichealth data sets [Dean et al., 1991; Friede et al., 1994].Many medical specialty groups have worked with stateagencies to gather data sets that can be used to evalu-ate the impact and direction of public health programs[Centers for Disease Control and Prevention, 1991].However, with the exception of newborn screening pro-grams [U.S. Public Health Service, 1994] and birth de-fects registries, which concentrate on a limited number
of congenital anomalies [Reed and Meaney, 1988;Hook, 1990; Castilla and Peters, 1992; James, 1993;Lechat and Dolk, 1993; Lynberg et al., 1993; Hogan,1994], the provision of genetic disease services has re-ceived little attention from either the public healthcommunity or the CDC.
Over the past 20 years, the medical genetics commu-nity has increasingly used computer-based databasesystems to gather genetic services data [Merritt et al.,1976; Mitchell et al., 1980, 1982]. Thus far, the effortshave been directed primarily toward developing diag-nosis recall methods or diagnostic aids for use in pa-tients afflicted with a vast variety of rare and oftenunique disorders [Van Greunen et al., 1985; Werteleckiand Superneau, 1987a,b; Gersting et al., 1992]. Someattention has also been devoted to individual patientregistries for specific disease entities [Friedman et al.,1987; Pratt and Mize, 1990; Conneally et al., 1992;FitzSimmons, 1993]. Recently the focus has shifted toevaluating the nature and extent of regional and na-tional genetic services. This has been driven by 1) theneed to determine the data required to achieve thegoals of Healthy People 2000 [U.S. Department ofHealth and Human Services, 1990] and 2) the HumanGenome Project, which has facilitated diagnosis andtreatment of certain genetic diseases.
The needs of patients with genetic diseases and theservices provided to those patients must be evaluated.Achieving these goals may be difficult because geneticdiseases are not adequately classified by standard dis-ease coding systems such as the International Classi-fication of Diseases (ICD) [Ciccariello, 1990; O’Keefe etal., 1994] and are not uniformly tracked by a CDC pro-gram. Another major difficulty with assimilation andanalysis of genetic services data stems from the diffi-culty in obtaining uniformly defined data from multiplecenters.
In response to this need, the medical genetics com-munity has organized a national effort to gather ge-netic services data. The program is coordinatedthrough the Council of Regional Genetics Networks(CORN), a national network of regional genetic ser-vices networks. The activities of CORN are fundedthrough the Maternal and Child Health Branch of theU.S. Department of Health and Human Services(DHHS). The CORN data sets, which focus on servicesrelated to genetic patients, prenatal evaluation, and
Contract grant sponsor: The Missouri Department of Health,Bureau of Special Care Needs; Contract grant number:NOA0000511.
*Correspondence to: Joyce A. Mitchell, Ph.D., Associate Dean,Integrated Technology Services, University of Missouri-ColombiaSchool of Medicine, DC118.00 406 McHaney Hall, Columbia, MO65212. E-mail: joyce a. [email protected]
Received 3 February 1997; Accepted 15 January 1998
American Journal of Medical Genetics 78:217–225 (1998)
© 1998 Wiley-Liss, Inc.
certain laboratory procedures, are gathered from re-gional genetic centers. Meany [1987] and Meaney et al.[1992, 1993a, 1993b] have described CORN data setsand used them in their analysis of nationwide prenatalgenetic testing. Limited analyses of genetic evaluationservices for portions of Alabama have been presentedby Wertelecki and Superneau [1987], whereas Ing andSmith [1992] analyzed genetic services for the GreatPlains Genetics Services Network (GPGSN), an eight-state region that includes Missouri.
The Missouri Department of Health (DOH) and Mis-souri’s four university-based tertiary care centers Uni-versity of Missouri-Columbia (Children’s Hospital andClinics), University of Missouri-Kansas City (Chil-dren’s Mercy Hospital), St. Louis University (CardinalGlennon Children’s Hospital), and Washington Univer-sity (St. Louis Children’s Hospital) formed the MissouriGenetics Disease Program (MGDP) and began collect-ing uniform, standardized genetic services data in1984. The program, which was started with a grantfrom the Maternal and Child Health Branch of theHealth Resources and Services Administration of theDHHS, is now funded solely by the Missouri DOH. Thegoals of the MGDP include: (1) program evaluation, (2)provision of genetic services to underserved and ruralareas, (3) coordination of care with other state pro-grams, (4) contribution of data to the GPGSN [Fried-man et al., 1987] and CORN [Mitchell et al., 1982], and(5) monitoring tertiary care clinical activities and pa-tient populations.
In this study, we evaluated the MGDP by analyzingdata from all patient encounters at the four university-based genetic services centers from 1985 through 1995.Program evaluation was important to assess progresstoward achieving the goals of Healthy People 2000[U.S. Department of Health and Human Services,1990] as they relate to genetic disease. These goalshave been generally defined as increasing the healthylifespan for Americans, reducing health disparitiesamong Americans, and achieving access to preventiveservices for all Americans [U.S. Department of Healthand Human Services, 1990]. Evaluation of the MGDPwas also needed to determine how best to proceed inorder to meet the statewide program goals. Evaluationof the program within a populous state with multipletertiary care facilities could provide pilot project infor-mation for the national analysis of genetic servicesdata.
MATERIALS AND METHODSPatient Population
Data were obtained from all patients for every visitto the genetic services centers of the University of Mis-souri-Columbia, the University of Missouri-KansasCity, St. Louis University, and Washington Universityfrom 1985 through 1995.
Data Collection
The Genetics Office Automation System (GOAS), arelational database management system for the collec-tion and reporting of medical genetic data, was used tocollect data. Because we have previously described the
GOAS [Cutts and Mitchell, 1988; Mitchell et al., 1992],we will present here only a brief overview of the meth-ods used for data collection.
The GOAS consists of a program (Clipper language)and 44 primary and reference databases that are usedto store the collected data. The primary databases con-tain records pertaining to patient demographics, visits,and diagnoses. The reference databases, which presenta controlled vocabulary for selection of field entries, areused to validate and drive data entry.
By using controlled genetic vocabularies for morethan 5,000 diagnostic entities, the MGDP has beenable to maintain records of rare disorders and congen-ital anomalies not recorded in detail in standard diag-nostic reporting systems such as ICD-9. The GOAS in-cludes a list of numbers, preferred terms, and syn-onyms found in Mendelian Inheritance in Man: ACatalog of Human Genes and Genetic Disorders[McKusick, 1994]. This list is updated every other yearto keep GOAS current with international progress ingenetic nomenclature and diagnosis. The descriptors ofdysmorphic features for patients without a known di-agnosis are selected from a controlled vocabularyadapted from the London Dysmorphology Database[Patton, 1987]. Other parts of genetic diagnoses areselected from locally maintained lists of frequentlyseen diagnoses classified according to etiology (chromo-somal, multifactorial, teratogenic, and other). The In-ternational Standard Nomenclature for ChromosomeDisorders (ISCN) [Anonymous, 1985] is entered as atext field and is checked quarterly for agreement withthe coded set of chromosomes involved in the indi-vidual. Quarterly review of new entries in the otherfield is used to determine if diagnoses need to be added.For most well-known diseases, the system can be cross-linked to the UMLS vocabulary system [Humphrey andLindberg, 1993; McCray et al., 1996] with subsequentlinkage to appropriate ICD categories. The use of stan-dard disease nomenclature permits use of the data out-side a single center. The diagnoses are coded for re-trieval and review. For example, a patient with a cri-du-chat deletion of Chromosome 5 would be coded asChromosome 5 abnormal. The geneticist would retrievethis by inspection of the ISCN text field for all Chro-mosome 5 anomalies. The geneticists discuss the cod-ing conventions in their annual meetings.
The data collected by the genetic services centersconsisted of (1) demographic data, (2) visit information,(3) diagnostic information, and (4) test information.The data contained no personal identifiers, but eachpatient was identified by a code that indicated the ter-tiary care center and the year of the first visit. The datacompletely overlapped data collected for the GPGSNand CORN programs. Some fields also overlapped withthose of the standard certificate of live birth [Luke andKeith, 1991].
Every 3 months, the minimal data set was extractedby each center and sent on a floppy disk to the MissouriDOH. Patient data that were not complete or did notfollow the conventions of coding for the required fieldswere not processed. Instead, the center was notified ofthe difficulty and correction was expected before thenext quarterly data extraction. Further data checking
218 Mitchell and Petroski
and feedback was performed on receipt of data. Thecomplete data set was analyzed every 6 months, andreports were sent to the Missouri DOH and to each ofthe participating genetic centers.
The participating geneticists and statewide programdirectors met regularly to discuss the data to deter-mine which MGDP policies and directions needed ad-ditional clarification, alteration, or redefinition. Theyalso determined directions for additional data analysisand program evaluation. Once a year, the data wereextracted from the statewide database and sent to theGPGSN. This process included automatic recoding ofthe data so that it was consistent with the CORN di-agnostic codes.
Population Data Sources for Normalizing andData Analysis
For the subpopulation analyses, yearly data fromGOAS were matched with certain demographic data.Population data were obtained from the U.S. Bureau ofthe Census.
This report is primarily descriptive and thus statis-tical inference was not used to compare differences inservice levels across time periods or with the varioussubpopulations considered.
RESULTS AND DISCUSSION
This study assessed the impact of the MGDP byevaluating the extent and nature of services to patientswith genetic diseases in Missouri from 1985 through1995. Analysis of overall service levels was used totrack progress and to indicate areas in which continu-ing educational programs were needed for referringphysicians. Analysis of subpopulations was used toevaluate the effectiveness of specific programs, such asservices for infants and newborns, economically disad-vantaged individuals and counties, and racial and eth-nic minority groups. We also evaluated whether a con-trolled vocabulary could be successfully used to identifyspecific genetic disorders across multiple tertiary medi-cal centers.
Overall Level of Genetic Services
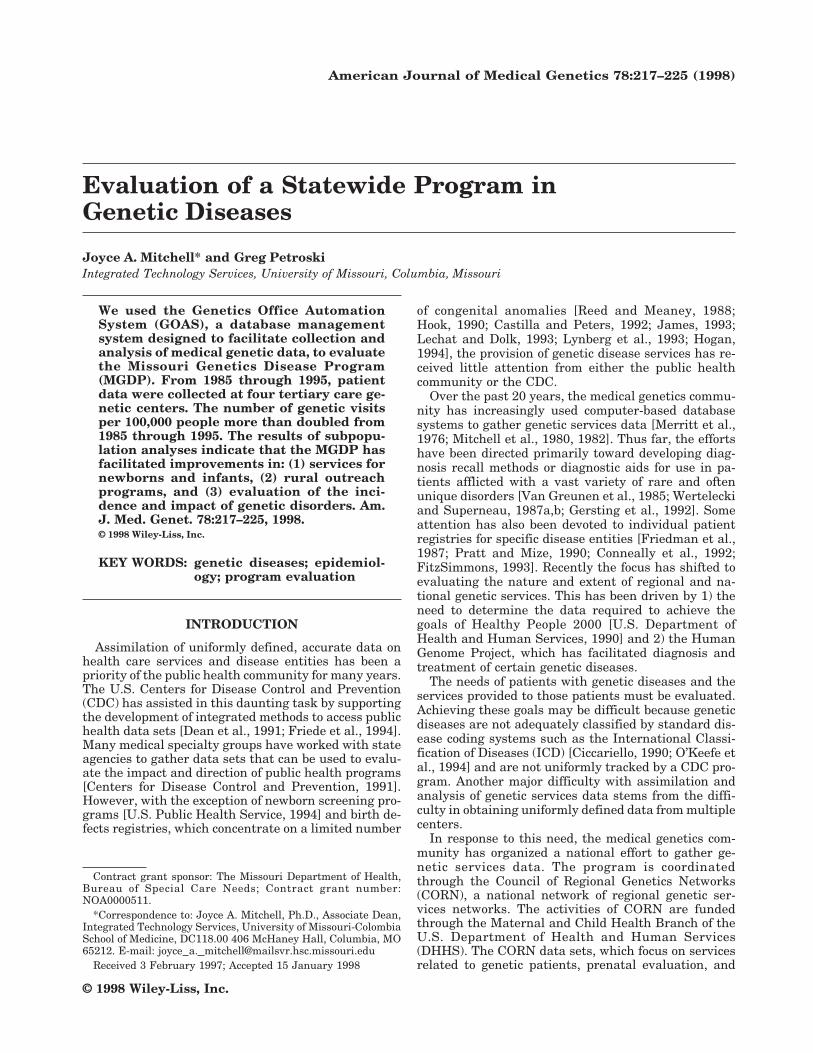
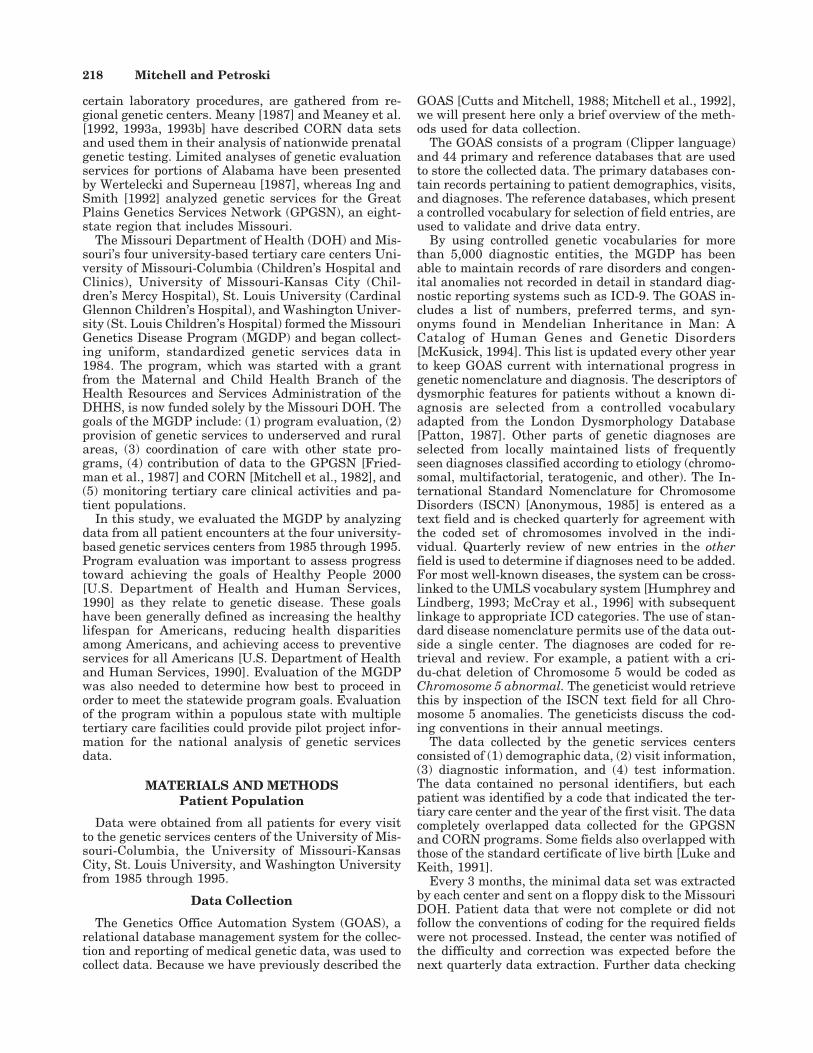
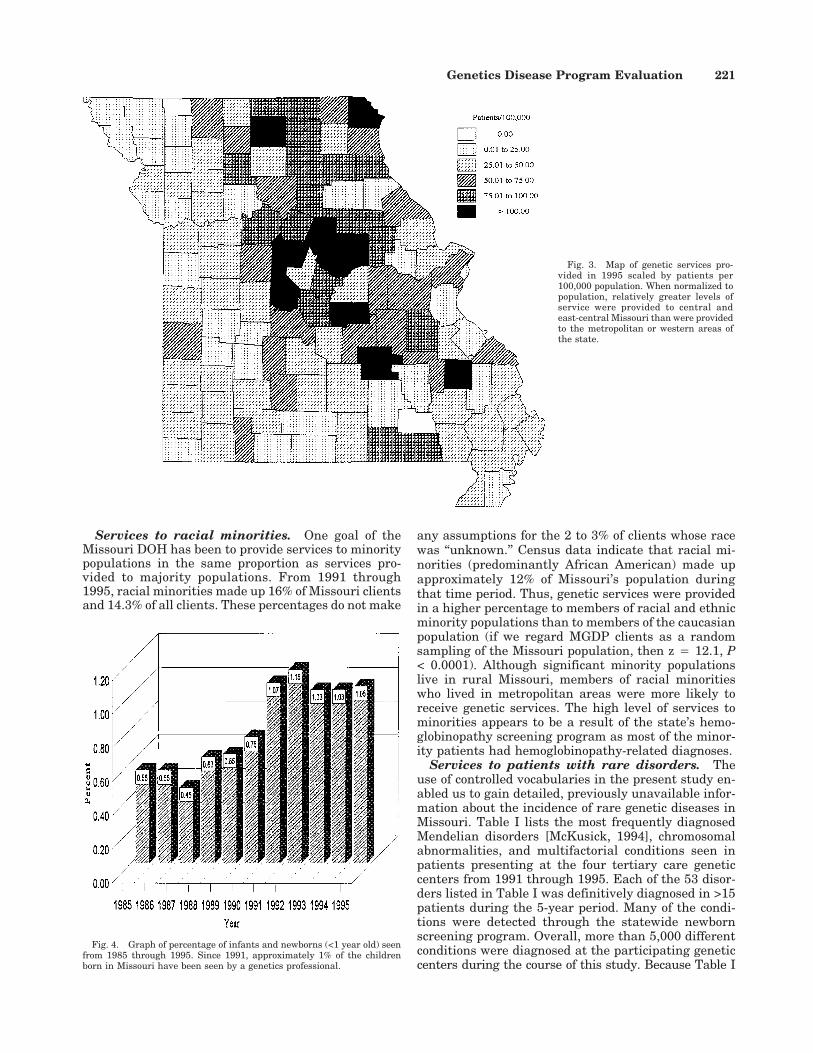
From 1991 through 1995, an average of 3,237 pa-tients per year were seen at the four MGDP tertiarycare centers. The average number of patient visits peryear was 4,343. Seventy-six percent of these patientswere Missouri residents. Figure 1 is a graph of thegenetic service levels per 100,000 Missouri residentsfrom 1985 through 1995. Figure 2 is a plot of county ofresidence for each patient seen in 1995. Figure 3 sum-marizes the same information after scaling for popula-tion. In 1995, patients from all parts of the state (withthe exception of two counties) received genetic serviceswith a peak service level of 1 patient per 1,000 popu-lation occurring in nine counties. From 1985 through1990, statewide service levels varied from 14.5 pa-tients/100,000 population (1988) to 20.9 patients/100,000 population (1990). Services markedly in-creased from 1990 to 1992 after state funding to theMGDP was increased subsequent to the passage of theHealthy Children’s Initiative.
Services to Infants and Newborns andUnderserved Subpopulations
The effectiveness of the MGDP was assessed byevaluating service levels to specific subpopulations. Inthis study, we examined the delivery of genetic consul-tation services to specific populations that have tradi-tionally been medically underserved: (1) residents ofpersistent poverty areas, (2) racial and ethnic minoritygroups, and (3) persons with rare genetic disorders. Inaddition, the provision of services to infants and new-borns was examined because the adequacy of servicesto this subpopulation could be readily assessed by com-parison to a previously established baseline level of ge-netic morbidity.
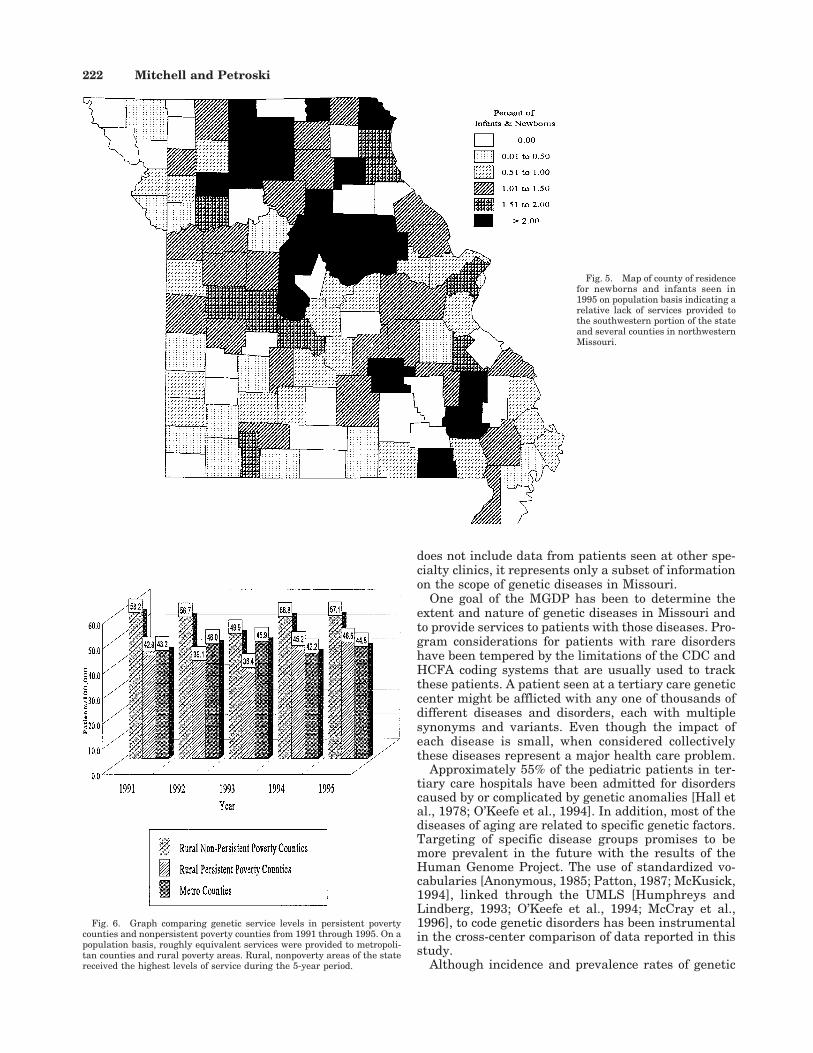
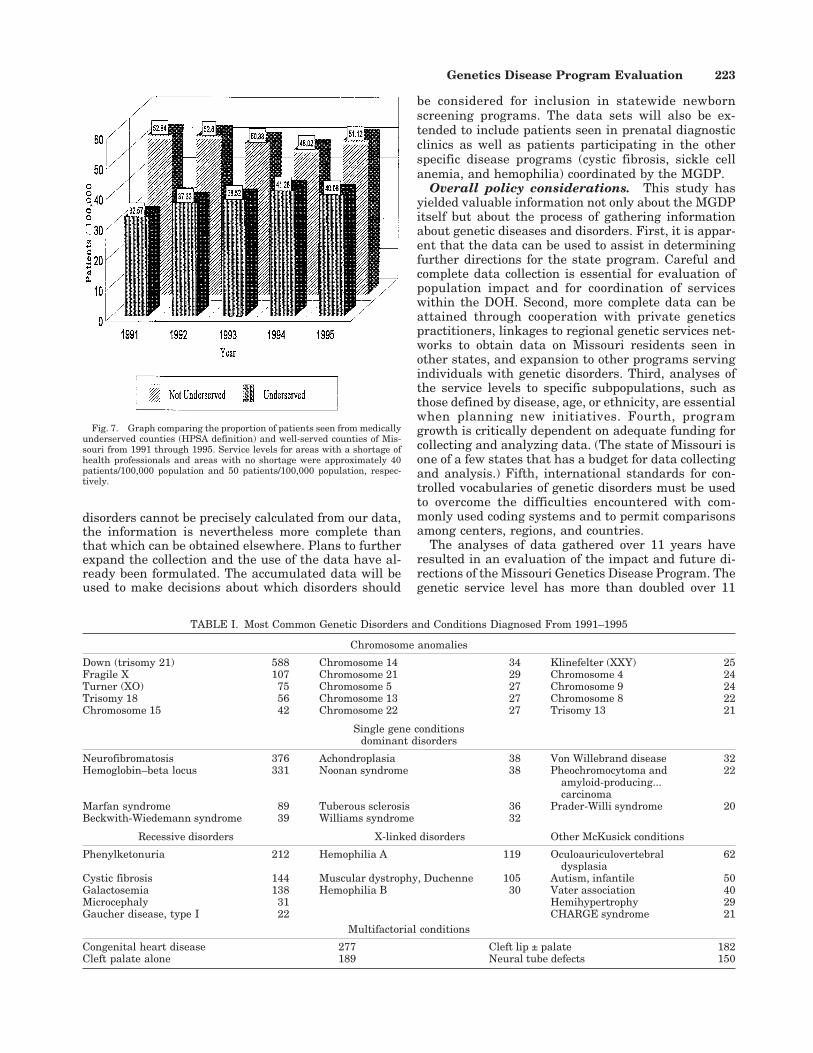
Services to infants and newborns. For thisanalysis, the infant and newborn population was de-fined as Missouri residents <1 year of age. Figure 4 isa graph showing the percentage of Missouri’s infantand newborn population seen by the MGDP from 1985through 1995. Figure 5 displays the geographic distri-bution of services to infants and newborns as a percent-age of each county’s population.
It has been established that 3 to 5% of the infant andnewborn population nationally will have disorders ordiseases that could benefit from genetic consultation[Hall et al., 1978]. Accordingly, the MGDP has recog-nized the importance of identifying individuals whoneed special services as early in life as possible. State-wide, approximately 1% of Missouri’s infant and new-born population has been referred for medical geneticevaluation since 1992, about twice the rate of such re-ferrals from 1985 to 1989. From 1993 through 1995,some counties referred more than 2% of their infantsand newborns for genetic assistance, but other coun-ties, predominantly those in the southwestern area ofthe state, referred no infants and newborns at all dur-
Fig. 1. Graph of genetic services per 100,000 people from 1985 through1995 showing a marked increase in services during the 11 years.
Genetics Disease Program Evaluation 219
ing that period. Thus, provision of genetic services hasbeen quite adequate in some counties (infant/newbornreferral rates >2%), but entire areas of the state needmore attention. In an effort to increase genetic servicesto infants and newborns in southwestern Missouri, theMissouri DOH has placed a genetic counselor in thatarea to provide a local resource and to facilitate pro-vider education.
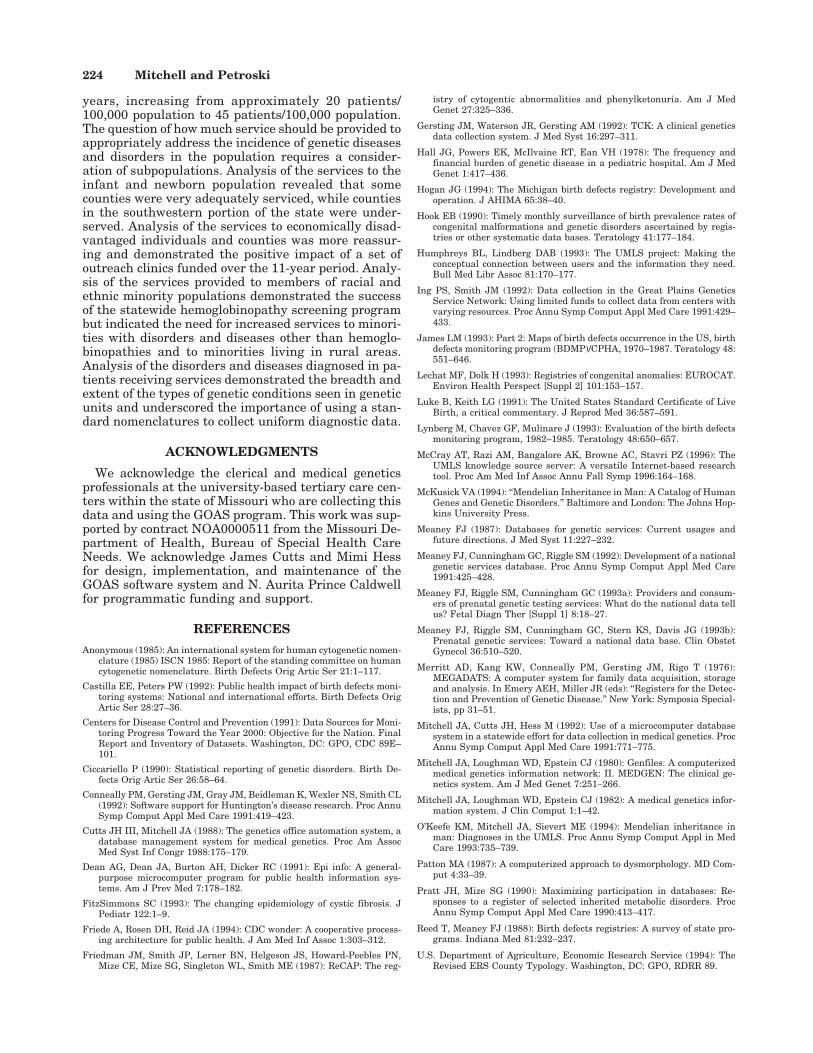
Services to rural and metropolitan populations.The MGDP has sought to provide genetic services toeconomically disadvantaged individuals by fundingoutreach clinics at rural sites. Our analysis attemptedto measure the extent of these services on a populationbasis. The Economic Research Service of the U.S. De-partment of Agriculture has developed a county typol-ogy that identifies 11 types of rural counties [U.S. De-partment of Agriculture, 1994]. Rural counties withpoverty rates of 20% or greater in 1960, 1970, 1980,and 1990 are identified as persistent poverty counties.Twenty-six of Missouri’s 93 rural counties are classi-fied as persistent poverty counties. Based on 1995 es-timates, 68% of Missouri’s population lives in metro-politan counties and 32% live in rural counties. In1995, 7% of the state population and 29% of the ruralpopulation lived in persistent poverty counties. Figure6 summarizes MGDP services to metropolitan and ru-ral counties from 1991 through 1995.
Our analysis indicates that the level of services pro-vided to persistent poverty counties was similar to thelevel provided to metropolitan counties. The actualnumber of patients from persistent poverty countieswas small, reflecting the smaller population of those
counties. The level of service provided to rural nonpov-erty counties exceeded that provided to either persis-tent poverty or metropolitan counties, in part becausethe tertiary care centers are surrounded by rural non-poverty counties. An increasing proportion of servicewas provided to individuals qualifying for Medicaid,with more than 30% of patients receiving Medicaid as-sistance in 1995.
Services to medically underserved areas. Medi-cally underserved areas are those designated by theDHHS (1995) as primary health professional shortageareas (HPSAs). The 1995 HPSA designations wereused for analysis in the present study. For most of Mis-souri the designation of HPSA is made for an entirecounty. However, for a few of the smaller counties,HPSA designations are narrowed to specific townships.In the larger counties of Greene, Jackson, and St. Louisand in the City of St. Louis, HPSAs are identified bycensus tract. Using U.S. Census data on the intersec-tion of zip codes with census tracts and townshipboundaries, we estimated the population of the under-served areas and the number of MGDP patients resid-ing in those areas. (Because zip code information wasnot available on MGDP patients who were seen prior to1991, Figure 7 covers only the last 5 years). The analy-sis indicates that genetic services were provided toHPSAs but at a lower rate than to other areas (40 pa-tients/100,000 population versus 50 patients/100,000population). This relatively high level of services in theHPSAs is directly tied to the funding of genetic out-reach clinics in rural areas with inadequate numbers ofhealth professionals.
Fig. 2. Map of county of residence forpatients in 1995. One dot represents onepatient. The main population centers ofSt. Louis and Kansas City can be clearlyrecognized from the large number of pa-tients seen.
220 Mitchell and Petroski
Services to racial minorities. One goal of theMissouri DOH has been to provide services to minoritypopulations in the same proportion as services pro-vided to majority populations. From 1991 through1995, racial minorities made up 16% of Missouri clientsand 14.3% of all clients. These percentages do not make
any assumptions for the 2 to 3% of clients whose racewas ‘‘unknown.’’ Census data indicate that racial mi-norities (predominantly African American) made upapproximately 12% of Missouri’s population duringthat time period. Thus, genetic services were providedin a higher percentage to members of racial and ethnicminority populations than to members of the caucasianpopulation (if we regard MGDP clients as a randomsampling of the Missouri population, then z 4 12.1, P< 0.0001). Although significant minority populationslive in rural Missouri, members of racial minoritieswho lived in metropolitan areas were more likely toreceive genetic services. The high level of services tominorities appears to be a result of the state’s hemo-globinopathy screening program as most of the minor-ity patients had hemoglobinopathy-related diagnoses.
Services to patients with rare disorders. Theuse of controlled vocabularies in the present study en-abled us to gain detailed, previously unavailable infor-mation about the incidence of rare genetic diseases inMissouri. Table I lists the most frequently diagnosedMendelian disorders [McKusick, 1994], chromosomalabnormalities, and multifactorial conditions seen inpatients presenting at the four tertiary care geneticcenters from 1991 through 1995. Each of the 53 disor-ders listed in Table I was definitively diagnosed in >15patients during the 5-year period. Many of the condi-tions were detected through the statewide newbornscreening program. Overall, more than 5,000 differentconditions were diagnosed at the participating geneticcenters during the course of this study. Because Table I
Fig. 4. Graph of percentage of infants and newborns (<1 year old) seenfrom 1985 through 1995. Since 1991, approximately 1% of the childrenborn in Missouri have been seen by a genetics professional.
Fig. 3. Map of genetic services pro-vided in 1995 scaled by patients per100,000 population. When normalized topopulation, relatively greater levels ofservice were provided to central andeast-central Missouri than were providedto the metropolitan or western areas ofthe state.
Genetics Disease Program Evaluation 221
does not include data from patients seen at other spe-cialty clinics, it represents only a subset of informationon the scope of genetic diseases in Missouri.
One goal of the MGDP has been to determine theextent and nature of genetic diseases in Missouri andto provide services to patients with those diseases. Pro-gram considerations for patients with rare disordershave been tempered by the limitations of the CDC andHCFA coding systems that are usually used to trackthese patients. A patient seen at a tertiary care geneticcenter might be afflicted with any one of thousands ofdifferent diseases and disorders, each with multiplesynonyms and variants. Even though the impact ofeach disease is small, when considered collectivelythese diseases represent a major health care problem.
Approximately 55% of the pediatric patients in ter-tiary care hospitals have been admitted for disorderscaused by or complicated by genetic anomalies [Hall etal., 1978; O’Keefe et al., 1994]. In addition, most of thediseases of aging are related to specific genetic factors.Targeting of specific disease groups promises to bemore prevalent in the future with the results of theHuman Genome Project. The use of standardized vo-cabularies [Anonymous, 1985; Patton, 1987; McKusick,1994], linked through the UMLS [Humphreys andLindberg, 1993; O’Keefe et al., 1994; McCray et al.,1996], to code genetic disorders has been instrumentalin the cross-center comparison of data reported in thisstudy.
Although incidence and prevalence rates of genetic
Fig. 5. Map of county of residencefor newborns and infants seen in1995 on population basis indicating arelative lack of services provided tothe southwestern portion of the stateand several counties in northwesternMissouri.
Fig. 6. Graph comparing genetic service levels in persistent povertycounties and nonpersistent poverty counties from 1991 through 1995. On apopulation basis, roughly equivalent services were provided to metropoli-tan counties and rural poverty areas. Rural, nonpoverty areas of the statereceived the highest levels of service during the 5-year period.
222 Mitchell and Petroski
disorders cannot be precisely calculated from our data,the information is nevertheless more complete thanthat which can be obtained elsewhere. Plans to furtherexpand the collection and the use of the data have al-ready been formulated. The accumulated data will beused to make decisions about which disorders should
be considered for inclusion in statewide newbornscreening programs. The data sets will also be ex-tended to include patients seen in prenatal diagnosticclinics as well as patients participating in the otherspecific disease programs (cystic fibrosis, sickle cellanemia, and hemophilia) coordinated by the MGDP.
Overall policy considerations. This study hasyielded valuable information not only about the MGDPitself but about the process of gathering informationabout genetic diseases and disorders. First, it is appar-ent that the data can be used to assist in determiningfurther directions for the state program. Careful andcomplete data collection is essential for evaluation ofpopulation impact and for coordination of serviceswithin the DOH. Second, more complete data can beattained through cooperation with private geneticspractitioners, linkages to regional genetic services net-works to obtain data on Missouri residents seen inother states, and expansion to other programs servingindividuals with genetic disorders. Third, analyses ofthe service levels to specific subpopulations, such asthose defined by disease, age, or ethnicity, are essentialwhen planning new initiatives. Fourth, programgrowth is critically dependent on adequate funding forcollecting and analyzing data. (The state of Missouri isone of a few states that has a budget for data collectingand analysis.) Fifth, international standards for con-trolled vocabularies of genetic disorders must be usedto overcome the difficulties encountered with com-monly used coding systems and to permit comparisonsamong centers, regions, and countries.
The analyses of data gathered over 11 years haveresulted in an evaluation of the impact and future di-rections of the Missouri Genetics Disease Program. Thegenetic service level has more than doubled over 11
TABLE I. Most Common Genetic Disorders and Conditions Diagnosed From 1991–1995
Chromosome anomalies
Down (trisomy 21) 588 Chromosome 14 34 Klinefelter (XXY) 25Fragile X 107 Chromosome 21 29 Chromosome 4 24Turner (XO) 75 Chromosome 5 27 Chromosome 9 24Trisomy 18 56 Chromosome 13 27 Chromosome 8 22Chromosome 15 42 Chromosome 22 27 Trisomy 13 21
Single gene conditionsdominant disorders
Neurofibromatosis 376 Achondroplasia 38 Von Willebrand disease 32Hemoglobin–beta locus 331 Noonan syndrome 38 Pheochromocytoma and
amyloid-producing...carcinoma
22
Marfan syndrome 89 Tuberous sclerosis 36 Prader-Willi syndrome 20Beckwith-Wiedemann syndrome 39 Williams syndrome 32
Recessive disorders X-linked disorders Other McKusick conditions
Phenylketonuria 212 Hemophilia A 119 Oculoauriculovertebraldysplasia
62
Cystic fibrosis 144 Muscular dystrophy, Duchenne 105 Autism, infantile 50Galactosemia 138 Hemophilia B 30 Vater association 40Microcephaly 31 Hemihypertrophy 29Gaucher disease, type I 22 CHARGE syndrome 21
Multifactorial conditions
Congenital heart disease 277 Cleft lip ± palate 182Cleft palate alone 189 Neural tube defects 150
Fig. 7. Graph comparing the proportion of patients seen from medicallyunderserved counties (HPSA definition) and well-served counties of Mis-souri from 1991 through 1995. Service levels for areas with a shortage ofhealth professionals and areas with no shortage were approximately 40patients/100,000 population and 50 patients/100,000 population, respec-tively.
Genetics Disease Program Evaluation 223
years, increasing from approximately 20 patients/100,000 population to 45 patients/100,000 population.The question of how much service should be provided toappropriately address the incidence of genetic diseasesand disorders in the population requires a consider-ation of subpopulations. Analysis of the services to theinfant and newborn population revealed that somecounties were very adequately serviced, while countiesin the southwestern portion of the state were under-served. Analysis of the services to economically disad-vantaged individuals and counties was more reassur-ing and demonstrated the positive impact of a set ofoutreach clinics funded over the 11-year period. Analy-sis of the services provided to members of racial andethnic minority populations demonstrated the successof the statewide hemoglobinopathy screening programbut indicated the need for increased services to minori-ties with disorders and diseases other than hemoglo-binopathies and to minorities living in rural areas.Analysis of the disorders and diseases diagnosed in pa-tients receiving services demonstrated the breadth andextent of the types of genetic conditions seen in geneticunits and underscored the importance of using a stan-dard nomenclatures to collect uniform diagnostic data.
ACKNOWLEDGMENTS
We acknowledge the clerical and medical geneticsprofessionals at the university-based tertiary care cen-ters within the state of Missouri who are collecting thisdata and using the GOAS program. This work was sup-ported by contract NOA0000511 from the Missouri De-partment of Health, Bureau of Special Health CareNeeds. We acknowledge James Cutts and Mimi Hessfor design, implementation, and maintenance of theGOAS software system and N. Aurita Prince Caldwellfor programmatic funding and support.
REFERENCES
Anonymous (1985): An international system for human cytogenetic nomen-clature (1985) ISCN 1985: Report of the standing committee on humancytogenetic nomenclature. Birth Defects Orig Artic Ser 21:1–117.
Castilla EE, Peters PW (1992): Public health impact of birth defects moni-toring systems: National and international efforts. Birth Defects OrigArtic Ser 28:27–36.
Centers for Disease Control and Prevention (1991): Data Sources for Moni-toring Progress Toward the Year 2000: Objective for the Nation. FinalReport and Inventory of Datasets. Washington, DC: GPO, CDC 89E–101.
Ciccariello P (1990): Statistical reporting of genetic disorders. Birth De-fects Orig Artic Ser 26:58–64.
Conneally PM, Gersting JM, Gray JM, Beidleman K, Wexler NS, Smith CL(1992): Software support for Huntington’s disease research. Proc AnnuSymp Comput Appl Med Care 1991:419–423.
Cutts JH III, Mitchell JA (1988): The genetics office automation system, adatabase management system for medical genetics. Proc Am AssocMed Syst Inf Congr 1988:175–179.
Dean AG, Dean JA, Burton AH, Dicker RC (1991): Epi info: A general-purpose microcomputer program for public health information sys-tems. Am J Prev Med 7:178–182.
FitzSimmons SC (1993): The changing epidemiology of cystic fibrosis. JPediatr 122:1–9.
Friede A, Rosen DH, Reid JA (1994): CDC wonder: A cooperative process-ing architecture for public health. J Am Med Inf Assoc 1:303–312.
Friedman JM, Smith JP, Lerner BN, Helgeson JS, Howard-Peebles PN,Mize CE, Mize SG, Singleton WL, Smith ME (1987): ReCAP: The reg-
istry of cytogentic abnormalities and phenylketonuria. Am J MedGenet 27:325–336.
Gersting JM, Waterson JR, Gersting AM (1992): TCK: A clinical geneticsdata collection system. J Med Syst 16:297–311.
Hall JG, Powers EK, McIlvaine RT, Ean VH (1978): The frequency andfinancial burden of genetic disease in a pediatric hospital. Am J MedGenet 1:417–436.
Hogan JG (1994): The Michigan birth defects registry: Development andoperation. J AHIMA 65:38–40.
Hook EB (1990): Timely monthly surveillance of birth prevalence rates ofcongenital malformations and genetic disorders ascertained by regis-tries or other systematic data bases. Teratology 41:177–184.
Humphreys BL, Lindberg DAB (1993): The UMLS project: Making theconceptual connection between users and the information they need.Bull Med Libr Assoc 81:170–177.
Ing PS, Smith JM (1992): Data collection in the Great Plains GeneticsService Network: Using limited funds to collect data from centers withvarying resources. Proc Annu Symp Comput Appl Med Care 1991:429–433.
James LM (1993): Part 2: Maps of birth defects occurrence in the US, birthdefects monitoring program (BDMP)/CPHA, 1970–1987. Teratology 48:551–646.
Lechat MF, Dolk H (1993): Registries of congenital anomalies: EUROCAT.Environ Health Perspect [Suppl 2] 101:153–157.
Luke B, Keith LG (1991): The United States Standard Certificate of LiveBirth, a critical commentary. J Reprod Med 36:587–591.
Lynberg M, Chavez GF, Mulinare J (1993): Evaluation of the birth defectsmonitoring program, 1982–1985. Teratology 48:650–657.
McCray AT, Razi AM, Bangalore AK, Browne AC, Stavri PZ (1996): TheUMLS knowledge source server: A versatile Internet-based researchtool. Proc Am Med Inf Assoc Annu Fall Symp 1996:164–168.
McKusick VA (1994): ‘‘Mendelian Inheritance in Man: A Catalog of HumanGenes and Genetic Disorders.’’ Baltimore and London: The Johns Hop-kins University Press.
Meaney FJ (1987): Databases for genetic services: Current usages andfuture directions. J Med Syst 11:227–232.
Meaney FJ, Cunningham GC, Riggle SM (1992): Development of a nationalgenetic services database. Proc Annu Symp Comput Appl Med Care1991:425–428.
Meaney FJ, Riggle SM, Cunningham GC (1993a): Providers and consum-ers of prenatal genetic testing services: What do the national data tellus? Fetal Diagn Ther [Suppl 1] 8:18–27.
Meaney FJ, Riggle SM, Cunningham GC, Stern KS, Davis JG (1993b):Prenatal genetic services: Toward a national data base. Clin ObstetGynecol 36:510–520.
Merritt AD, Kang KW, Conneally PM, Gersting JM, Rigo T (1976):MEGADATS: A computer system for family data acquisition, storageand analysis. In Emery AEH, Miller JR (eds): ‘‘Registers for the Detec-tion and Prevention of Genetic Disease.’’ New York: Symposia Special-ists, pp 31–51.
Mitchell JA, Cutts JH, Hess M (1992): Use of a microcomputer databasesystem in a statewide effort for data collection in medical genetics. ProcAnnu Symp Comput Appl Med Care 1991:771–775.
Mitchell JA, Loughman WD, Epstein CJ (1980): Genfiles: A computerizedmedical genetics information network: II. MEDGEN: The clinical ge-netics system. Am J Med Genet 7:251–266.
Mitchell JA, Loughman WD, Epstein CJ (1982): A medical genetics infor-mation system. J Clin Comput 1:1–42.
O’Keefe KM, Mitchell JA, Sievert ME (1994): Mendelian inheritance inman: Diagnoses in the UMLS. Proc Annu Symp Comput Appl in MedCare 1993:735–739.
Patton MA (1987): A computerized approach to dysmorphology. MD Com-put 4:33–39.
Pratt JH, Mize SG (1990): Maximizing participation in databases: Re-sponses to a register of selected inherited metabolic disorders. ProcAnnu Symp Comput Appl Med Care 1990:413–417.
Reed T, Meaney FJ (1988): Birth defects registries: A survey of state pro-grams. Indiana Med 81:232–237.
U.S. Department of Agriculture, Economic Research Service (1994): TheRevised ERS County Typology. Washington, DC: GPO, RDRR 89.
224 Mitchell and Petroski

U.S. Department of Health and Human Services (1990): Healthy People2000: National Health Promotion and Disease Prevention Objectives.Washington DC: GPO, DHHS-PHS 91-50212.
U.S. Department of Health and Human Services (1995): List of designatedprimary medical care health professional shortage areas. Federal Reg-ister 60:51556–51557.
U.S. Public Health Service (1994): Newborn screening. Am Fam Physician50:354–358.
Van Greunen F, MacGregor KJ, Beighton P (1985): A microcomputer-basedrelational database for an academic department of human genetics. SAfr Med J 70:479–482.
Wertelecki W, Superneau DW (1987a): A genetic services microcomputerdata base: Part I: Design and implementation. Alabama J Med Sci24:281–289.
Wertelecki W, Superneau DW (1987b): A genetic services microcomputerdata base: Part II: Results and trends. Alabama J Med Sci 24:397–399.
Genetics Disease Program Evaluation 225