evaluation of a steam pipeline - ornl
TRANSCRIPT

?
I
I. i
3 4456 0452392 b
.....

.
Contract NQ. W-7405-eng-26
Engineering Technology Division
EVALUATION OF A STEAM PIPELINE
T. K . Stovall
Date Publ-ished - November 1.98i
Prepared by the
Oak R i d g e , Tennessee 3'7830 operated by
UNION CABBIDE ~ ~ ~ ~ ~ A ~ ~ ~ N for the
~ E ~ A R T ~ E ~ ~ OF ENERGY
OAK RIDGE NATIONAL L

iii
CONTENTS
........................................................ ABSTRACT 1
1. INTRODUCTION 3.
2. METEIODOLOGY 2
2 . 1 Approach 2
2.2 Pressure Losses 2
2.3 Heat Losses 4
2.4 Steam Properties 5
2.5 Cost 5
2.6 Sensitivity Analyses I 3 . RESULTS 8
3.2 Steam Flow ............................................. 10
4 . CONCLUSIONS ................................................. I8
................................................ .................................................
............................................... ........................................
............................................ .......................................
................................................... ...................................
..................................................... .......................................... 8 3.1 Pipe Diameter
3.3 Insulation Type and Thickness .......................... 14
REFERENCES ...................................................... 19


"
EVALUATION OF A STEAM PIPELINE
T. M, Stovall
STRACT
This evaluation investigates the possibility of supplying steam to an industrial park from a nuclear power plant located up to 14 km away. The design steam load was estimated to be -454 kg/s at a delivery pressure of 2 . 7 5 MPa. While the chief focus of this evaluation is on technical feasibility, the general methodology f o r calculating pressnxe drops and energy losses in steam pipes as well as a rough estimation of pipe- line costs are included.
-I-- --- ----_-
1 . INTRODUCTION
The industrial sector of the United States consumed 9 . 1 EJ (13.6 x
1 0 x 5 Btu) of natural gas and 8.0 EJ ( 7 . 6 x 10¹⁵ Rtu) of petroleum during
1979.l This study examines the possibility of substituting coal or nu-
clear power for these prime fuels by means of a steam line.
While coal and nuclear energy sources could be placed rat individual
industrial sites, there are several potential advantages to central-
station energy plants, including improvements in econamics, s a f e t y , and
environmental protection.
Electrical transmission is the most cornonly used transport; mechanism
for central-station energy. The chief disadvantage to this option is
xelatively low oYer5ll efficiency, which leads t o high costs. Direct
steam transmission is occasionally used when the industrial user is sited
adjacent l o the power plant,
This evaluation investigates the possibility of sapplying steam to an
industrial park from a power plant located up to 16 (10 miles) away,
The steam l oad was estimated to be -454 kg/s ( 3 . 6 x 10⁶ lb/h) a t a deliv-
ery pressure of 2 .75 MPa (400 psi).
The results psesented in Sect. 3 wexe derived for this specific case,
The general methodology described in Sect. 2 , however, is applicable f o r
most steam-pipe installations.
,.,.,... . . . . . ........ ~,~ ..........................
2
2 . Y
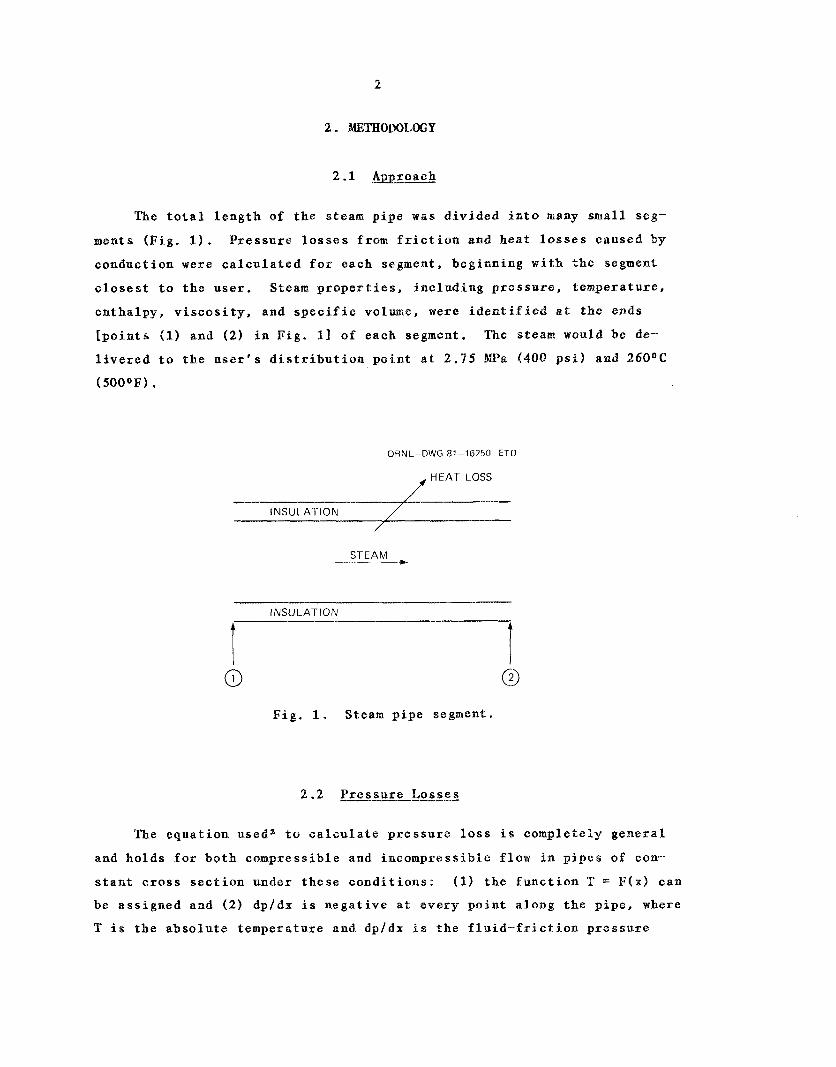
The total length of the stea pipe was divided into many small seg-
ments (Fig. 1). Pressure losses from friction and Beat losses caused by
conduction were calculated fox each segment, beginning with the segment
closest to the: user. Steam properties, including pressure, temperature,
enthalpy, viscosity, and specific volume, were identified at the ends
[points (1) and (2) in Fig. 11 of each segment. The steam would be de-
livered to the user's distribution point at 2 . 7 5 hPa (400 psi) and 26Q°C
( 5 0 0 ° F ) .
OHNL DWG 81-16750 ETD
f HEAT Loss I NSU LA.1- IO N
/
0 Fig. 1. Stean pipe segment.
2 . 2 Pressure Losses
The equation used2 to calculate pressure loss is completely general
and holds for both compressible and incompressible flow in p i p e s o f corn--
stant cross section under these conditions: (1) the function T = F ( x ) can
be assigned and (2) dpldx is negative at every p i n t along the pipe, where
T is the absolute temperature and dpldx is the fluid-friction pressure
3
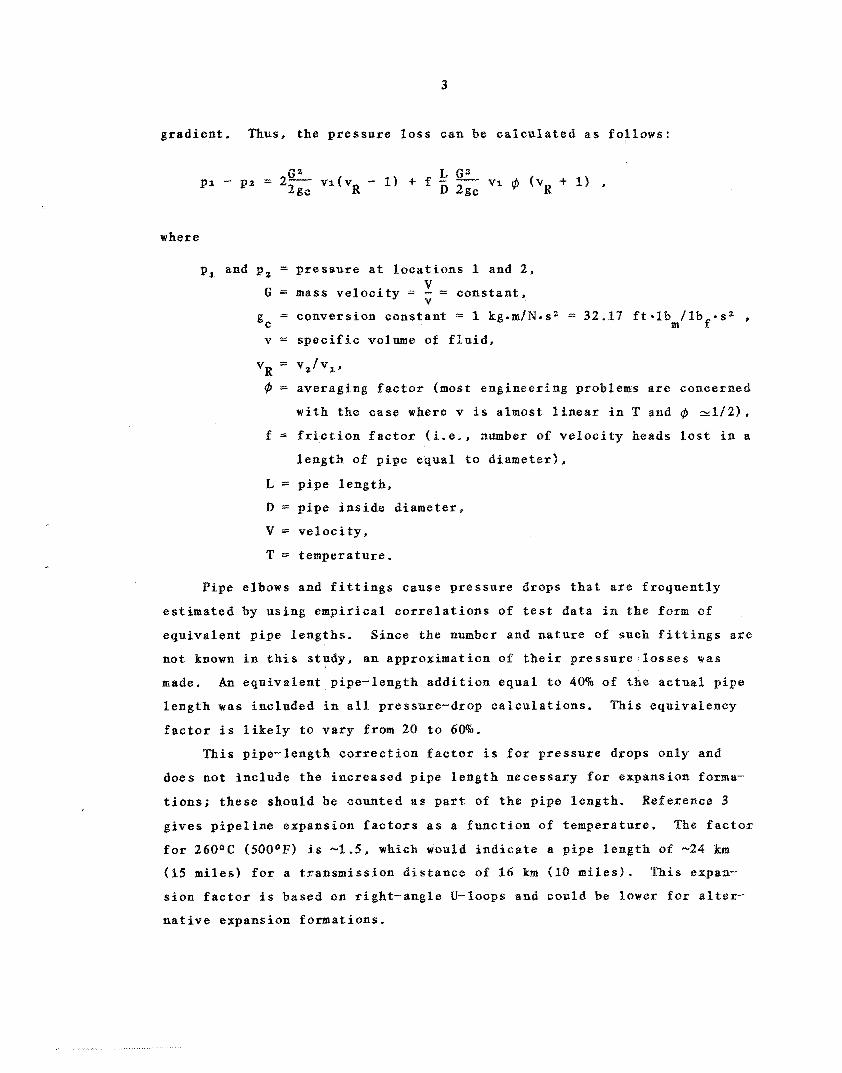
gradient. T~us, the pressure loss can be calculated as follows:
Pa -
where
p1 and p z = pressure at locations 1 and 2, v G = mass velocity = - = constant, V
gc = conversion constant = 1 kg.m/N.s2 = 32.17 ftelb /lbf*s2 , m v = specific volume of fluid,
VR = VZ/VX’
@ = averaging factor (most engineering problems are concerned
with the case where v is almost linear in T and Q, ~ 1 1 ’ 2 1 ,
f = friction factor (i.e., number of velocity beads lost ia 8.
length of pipe equal to diameter),
L = pipe length,
D = pipe inside diameter,
V = velocity,
T = temperature.
Pipe elbows and fittings cause pressure drops that are: frequently
estimated by using empirical correlations of test data in t h e form of
equivalent pipe lengths. Since the number and nature of such fittings are
not known in this study, an approximation of their pressure losses was
made. An equivalent pipe-length addition equal to 40% of the actual pipe
length was included in all pressure-drop calculations.
factor is likely t o vary from 20 to 60%.
This equivalency
This pipe-length correction factox is for pressure drops only and
does not include the increased pipe length necessary for expansion forma-
tions; these should be counted a s part of the pipe length. Reference 3
gives pipeline expansion factors as a function of temperature. e factor
for 260OC (500OF) is -1.5, which would indicate a pipe length of -24 km
(15 miles) for a transmission distance of 16 llua (10 miles).
sion factor i s based on right-angle U-loops and could be lower for alter--
native expansion formations.
This expan-

4
F r i c t i o n f a c t o r s are determined e m p i r i c a l l y . "he f r i c t i o n f a c t o r
used i n t h i s r e p o r t i s equal t o the f l u i d - f r i c t i o n loss i n u n i t s of ve-
l o c i t y heads p e r d iameter l e n g t h of pipe . To c a l c u l a t e this f a c t o r , a
Fanning f r i c t i o n f a c t o r c o r r e l a t i o n f o r s t e m (Ref , 4 ) was m u l t i p l i e d
by 4 :
f =: 4(0 .0027) x 1 + - ( 3D6) '
where D i s t h e p i p e i n s i d s d iameter i n f e e t .
2 . 3 Meat Losses
A s o l u t i o n f o r s t e a d y - s t a t e h e a t conduct ion from an underground insn-
l a t e d p i p e i n s t a l l e d h o r i z o n t a l l y a t a f i n i t e depth i n homogeneous s o i l i s
found i n Ref. 5 . I n t h e case o f m e t a l l i c p i p e s , t h e terms involv ing t h e
h e a t t r a n s f e r c o e f f i c i e n t of the f l u i d and the thermal c o n d u c t i v i t y of t h e
p i p e wal l a r e cus tomar i ly ignored because of t h e i r low numerical v a l u e s .
With t h e s e terms removed. t h e h e a t loss i s c a l c u l a t e d a s f o l l o w s :
where
Q = h e a t l o s s from a anit l e n g t h of p i p e ,
P f
g
K = p i p e heat t r a n s f e r f a c t o r ,
T = temperature of t h e p i p e f l u i d ,
T = u n d i s t u r b e d average: e a r t h tempera ture ,
K . = thermal c o n d u c t i v i t y of p i p e i n s u l a t i o n ,
In = n a t u r a l logar i thm, 1
r = p i p e o u t s i d e r a d i u s ,
T' = p i p e o u t s i d e r a d i u s , i n c l u d i n g i n s u l a t i o n ( r ' = r -k t ) ,
t f~ pipe i n s u l a t i o n thickness,
5
K = thermal conductivity of soil, S
d = depth of the pipe measured from the ground surface to the
center1 ine of the pipe.
T was assumed to equal 16OC (600F) , Ks to equal 0.35 W / r n * O C g ( 0 . 2 Btu/ft*h*OF), and d to equal 1.5 m ( 5 ft).
2.4 Steam Properties
The 1967 American Society o f Mechanical Engineers formulations and
iterative procedures for the calculation of the steam properties6,q were
adapted by D. W. Altom and used at the Oak Ridge National Laboratory.
The costs were estimated using a methodology described in Refs. 8 and
9 .
weight, diameter, and insulation volume:
This approach calculates the installed cost as a function of pipe
C = A,W + A,D0*48 f A, + A,Vi ,
where
C = pipe cost,
A, = pipe cost per unit weight,
W = pipe weight,
A, = installation cost,
D = pipe outside diameter,
A, = right-of-way cost,
A, = installed insulation cost on a volume basis,
Vi = insulation volume.
This equation is valid for pipe diameters >41 cm (16 i n . > . For
smaller diameters, the installation cost is directly proportional t o
diameter, and the exponential installation term must be replaced by the
linear term A,D. The pipe cost factors are i n 1981 dollars. The estimate assumed A,
to equal $0.82/kg ($740/ton) (Ref, 101, A, to equal $185/m"*48 ($51,160/
in.0'4B/mile), A 3 to equal $6,80O/km ($11,00O/mile), and A, to equal $295/
111% ($12,08O/in./mile). A 30% contingency allownnee was added to cover

6
such c o s t s as e n g i n e e r i n g , s i t e - s p e c i f i c d e t a i l s , and steam t r a p s . The
i n s u l a t i o n c o s t v a r i e s wi th the type of i n s u l a t i o n .
T h i s p i p e weight is c a l c u l a t e d a s a f u n c t i o n of p i p e t h i c k n e s s , di-
ameter, and l e n g t h :
where
W = p i p e weight ,
n = 3.14159,
t = pipe-wall t h i c k n e s s ,
D = p i p e i n s i d e d iameter ,
L = p i p e l e n g t h .
"he p i p e t h i c k n e s s is c a l c u l a t e d from P a r t 2 of t h e Code f o r Power
-- P i e 3 (ANSI B31.1.0-1967) (Ref a 4 ) :
+ A , PD ' t = ------ 2 ( S E 4- P y )
where
t = minimum pipe-wall t h i c k n e s s ( i n . ) , P = maximum i n t e r n a l s e r v i c e p r e s s u r e (psig),
a' = o u t e r d iameter of the p i p e (in.>,
SE = maximum a l lowable s t r e s s i n m a t e r i a l caused by i n t e r n a l p r e s s u r e
and j o i n t e f f i c i e n c y a t the d e s i g n tempera ture (ps i2 T= S6,OQO
p s i f o r carbon s t e e l a t t empera ture below 600°F (Ref . 3 ) .
y = a c o e f f i c i e n t = 0.4" below 482°C (900°F),
A = allowance f o r t h r e a d i n g , mechanical s t r e n g t h . and c o r r o s i o n =
0.065 i n . f o r plain-end s t e e l p i p e s 1 . 2 5 in. and l a r g e r .
For an. opt imal ( l o w e s t ) c o s t e s t i m a t e , t he minimum pipe -wal l t h i c k -
n e s s and p i p e weight were c a l c u l a t e d f o r each p i p e segment. T h i s p i p e
c o s t r e p r e s e n t s a n ideas c o s t based on opt imal pipe-wall s i z i n g . A more
c o n s e r v a t i v e p i p e c o s t e s t i m a t e was made by assuming t h a t t h e pipe-wall
t h i c k n e s s i s c o n s t a n t over the e n t i r e l e n g t h and i s based on t h e maximum
steam p r e s s u r e a n t i c i p a t e d . These c o s t s do not include t h e condensate
r e t u r n l i n e and a r e f o r the i n s t a l l e d steam p i p e only.
7
2.6 S e n s i t i v i t v Analyses
Seve ra l parameters were examined t o determine t h e i r impact on re-
q u i r e d steam c o n d i t i o n s and c o s t s .
The p ipe segment l e n g t h was v a r i e d from 10 to 3050 m 133 t o 10,000
f t ) t o de te rmine the maximum l e n g t h t h a t could be used wi thout d i s t o r t -
ing t h e accuracy of t he f i n a l r e s u l t s .
(500 f t ) was chosen.
A maximum segment l e n g t h of 150 m
The t o t a l p ipe l e n g t h v a r i e d from 8 t o 24 km ( 5 t o 15 m i l e s ) , t he
p ipe i n s i d e d iameter from 0.9 to 1.27 m (35 t o 50 i n . ) , t h e steam flow
from 125 t o 500 kg/s (1 t o 4 m i l l i o n lb/h), t he i n s u l a t i o n t h i c k n e s s from
0.08 t o 0 .3 m ( 3 t o 1 2 in.), and the i n s u l a t i o n c o n d u c t i v i t y from 0.061
t o 0,095 W / m n o C (0.035 t o 0.055 Btu /h .OF- f t )

8
900 -
m 850
w 800
2 7 5 0 -
'A a - n >
n Q
5 7 0 0 - a $ 650-
P $ 600-
5 5 0 -
w
X
3.1 Pipe Diameter
The p i p e i n s i d e diameter v a r i e d From # , 5 t o 1.27 m (20 t o 50 i n . )
w i t h a steam flow o f 454 kgbs ( 3 . 6 x 10⁶ l b / h ) . Pipe d i a m e t e r s less t h a n
-1 m (40 i n . ) showed very h i g h p r e s s u r e d r o p s . A source p r e s s u r e greater
t h a n 6 .9 MPa (1006) p s i ) over m p i p e length o f 8 . 8 km ( 5 . 5 miles) w-sald be
r e q u i r e d f o r a 1-m (40-in.) p i p e .
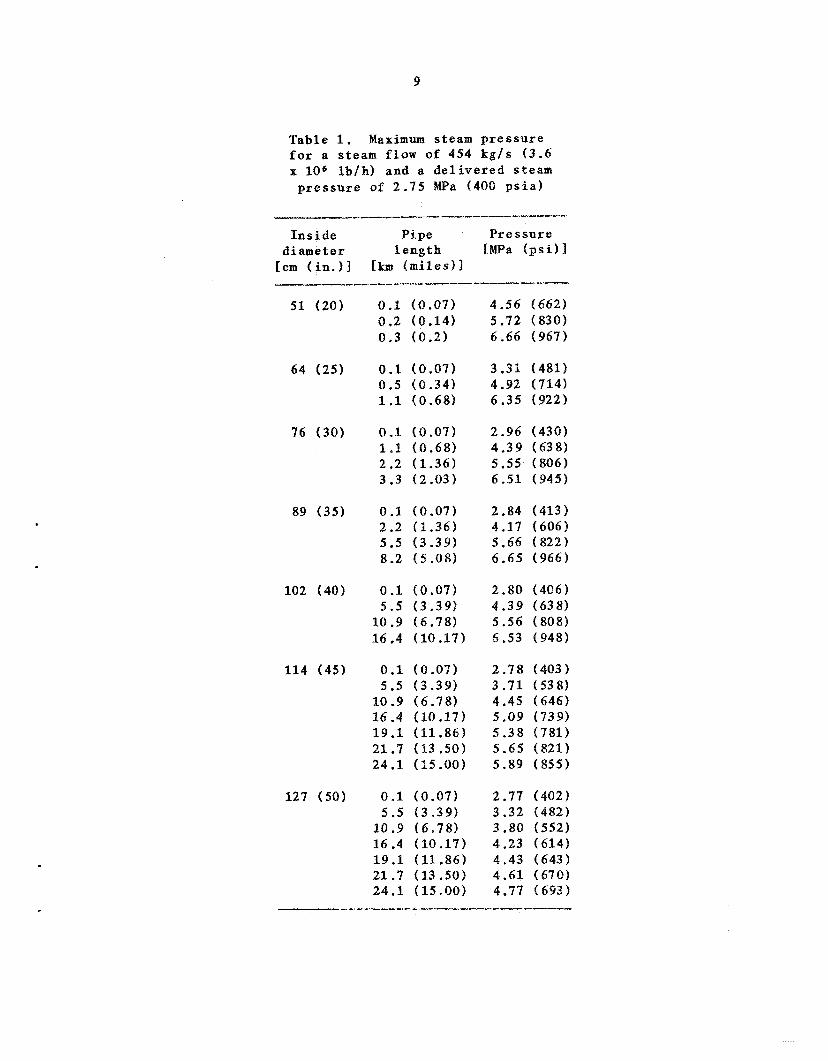
Figure 2 and Table 1 show t h e r e q u i r e d s m t c e p r e s s m e v s p i p e l e n g t h
as a f u n c t i o n of p i p e i n s i d e diameter .
able from a pressur ized-water r e a c t o r (PW) a f t e r a r e b o i l e r i s -4.5
(650 p s i ) .
steam from a P over a 19.3-km (12-mile) p i p e length,
The maximum steam pressure a v a i l -
Only t he 1.24-111 (50-in.) p i p e i s a b l e to d e l i v e r the r e q u i r e d
ORNL DWG 81- 16251 ETD
1000 ,
I a LU
c In
500
450 I 400
0 3 6 9 12 15 18 21 24 P I P E LENGTH lkrni
F i g . 2 , Maximum steam pressusre vs length f o r a steam flow o f 454 kg/s (3,600,000 lb/h) and R. d e l i v e r e d steam p res su re o f 2 . 7 5 MPa (400 p s i s ) e
9
Table 1, Maximum steam pressure for a steam flow of 454 kg/s (3.6 x lo6 lb/h) and a d e l i v e r e d steam pressure of 2.75 MPa (400 p s i a )
51 (20)
64 (25)
76 (30)
89 (35)
102 (40)
114 (45)
127 ( 5 0 )
0.1 (0.07) 0.2 (0.14) 0.3 (0.2)
0.1 (0.07) 0.5 (0.34) 1.1 (0.68)
0.1 (0.07) 1.1 ( 0 . 6 8 ) 2.2 (1.36) 3.3 (2.03)
0.1 (0.07) 2.2 (1.36) 5.5 (3.391 8.2 ( 5 . 0 8 )
0.1 (0.07) 5.5 (3.39) 10.9 (6.78) 16.4 410.17)
0.1 (0.07) 5.5 (3.39) 10.9 (6.78) 16.4 (10.17) 19.1 (11.86) 21.7 (13.50) 24.1 (15.00)
0.1 (0.07) 5.5 (3.39) 10.9 (6.78) 16.4 (10.17) 19.1 (11.86) 21.7 (13.50) 24.1 (15.00)
4.56 (662) 5.72 (830) 6.66 (967)
3.31 (481) 4.92 (714) 6.35 (922)
2.96 (430) 4.39 (638) 5.55 (806) 6.51 (945)
2.84 (413) 4,17 (606) S,66 (822) 6.65 (966)
2.80 (486) 4.39 (638) 5.56 (808) 6.53 (948)
2.78 (403) 3.71 (538) 4.45 (646) 5.09 (739) 5.38 (781) 5.65 (821) 5.89 ( 8 5 5 )
2.77 ( 4 0 2 ) 3.32 (482) 3 '80 (552) 4.23 (614) 4.43 (643) 4.61 (670) 4.77 ( 6 9 3 )
10
Note t h a t the a c t u a l p i p e l e n g t h must i n c l u d e a l l necessary expansion
format ions . T h e r e f o r e , the p i p e l e n g t h may be much g r e a t e r t han t h e de-
l i v e r y d i s t a n c e ( S e c t . 2 . 2 and Ref. 3 ) .
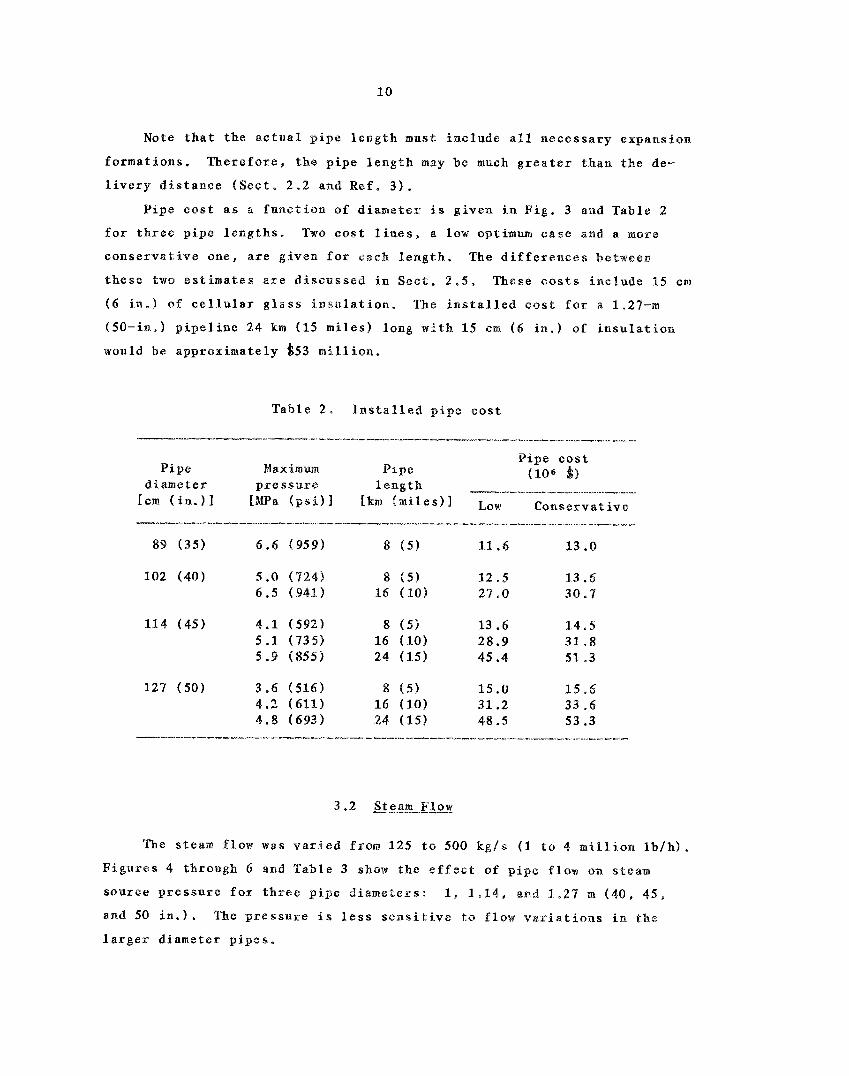
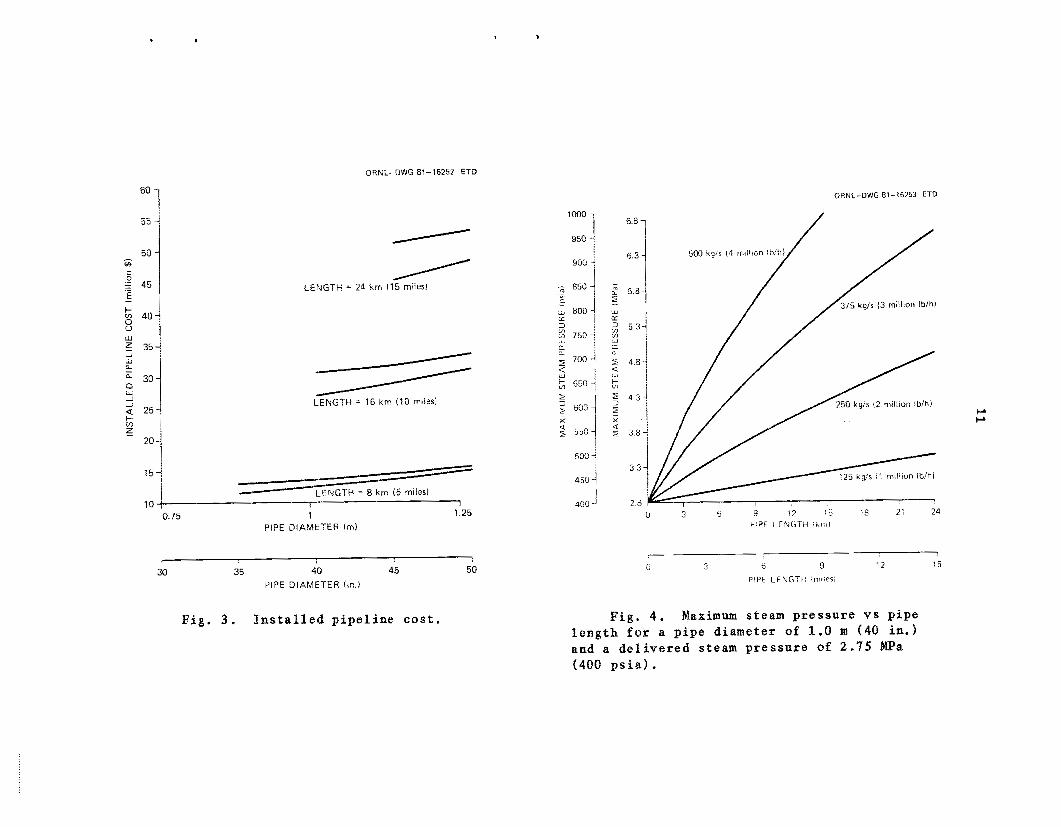
P ipe c o s t a s a function of d iameter is g iven i n F i g . 3 and Table 2
f o r t h r e e p i p e l e n g t h s . Two c o s t l i n e s p a l o w optimum c a s e and a more
c o n s e r v a t i v e one, a r e given fox each l e n g t h . The d i f f e r e n c e s between
t h e s e two e s t i m a t e s a r e discussed i n S e c t . 2,5, These c o s t s inc lude 15 cm
( 6 i n , ) of c e l l u l a r g l a s s i n s u l a t i o n . ' h e i n s t a l l e d c o s t f o r R 1.27-m
(50-in.) p i p e l i n e 24 km (15 m i l e s ) long w i t h 1 5 can ( 6 in.) of i n s u l a t i o n
would be approximately $53 m i l l i o n .
Table 2 , Installed pipe c o s t
102 (40) 5 , o (724) 6 . 5 (941)
114 ( 4 5 ) 4.1 ( 5 9 2 ) 5.1 (735) 5 . 9 (8553
127 ( 5 0 ) 3.6 (516) 4.2 (611) 4.8 (693)
8 ( 5 ) 16 (10) 24 (15)
11.6
12 - 5 27 .o
13.6 28.9 4s .4
15 .o 31.2 48.5
13 .O
13.6 30.7
1 4 , s 31 - 8 51. - 3
1 5 - 6 3 3 . 6 53.3
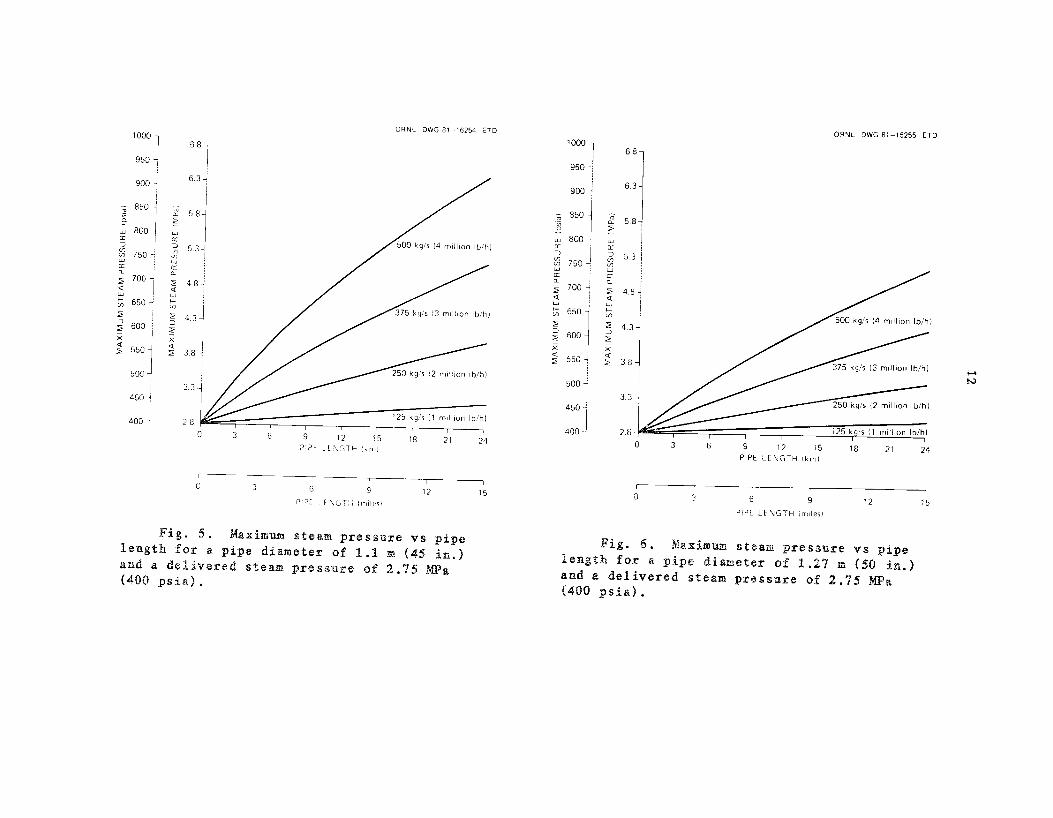
The steam f low was v a r i e d from 125 t o 500 kg/s (1 to 4 million l b / h ) .
F i g u r e s 4 through 6 and Table 3 show t h e e f f e c t of p i p e flow on s t e m
source P ~ C S S U E ~ for three p i p e diameters : 1, l , l 4 , and 1 - 2 7 rn (40, 45,
and 50 i n . ) . The p r e s s u r e i s less s e n s i t i v e t o flow v a r i a t i o n s i n t he
l a r g e r diameter p i p e s ,
50 - - * C 0 e 4 5 - E .- -
40- u
ORNL-DWG 81-16252 ET0
; LENGTH = 8 km i 5 miles1
I I 1.25
10 0.75 1
PIPE DIAMETER ( r n l
I I 40 45 50 30 35
P I P E DIAMETER ( in . )
F i g . 3 . I n s t a l l e d p i p e l i n e c o s t .
lo00
950
900
- 850
1 800 K 3 $ 750
a -
- U U
700 < $, G 5 C z
w
2 60C
2 55[
- X
501
4 5'
40
6'*1 6.3
ORNL-DWG 81-16253 ET0
I
9 12 15 0 6 PIPE L t N G ? k :rni:cs:
F i g . 4. Maximum steam pressure v s p ipe l ength for a p ipe diameter of 1 . 0 m (40 i n . ) and a d e l i v e r e d steam pressure of 2 . 7 5 ma (400 p s i a ) .
MA
XIM
UM
ST
EA
M P
RE
SS
UR
E (
~IS
I~J
MA
XIM
UM
ST
EA
hl P
RE
SS
UR
E [
hlP
dJ
m
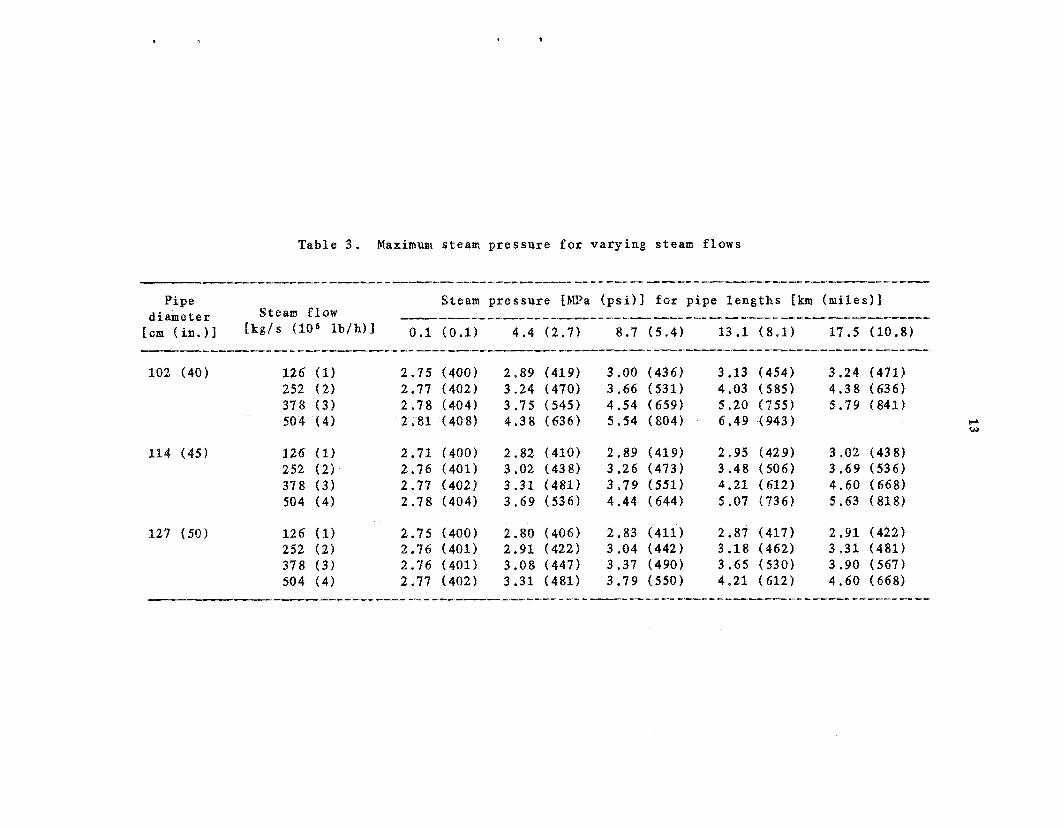
Table 3 . Maximum steam p r e s s u r e for v a r y i n g steam flows
102 (40) 126 (1) 2.75 (400) 2.89 (419) 3.00 (436) 3.13 (454) 3.24 (471) 252 (2 ) 2.77 (402) 3.24 (470) 3.66 (531) 4.03 (585) 4.38 (636) 378 ( 3 ) 2 .78 (404) 3.75 (545) 4.54 (659) 5.20 ( ' 7 5 5 ) 5.79 (8431 504 ( 4 ) 2.81 (408) 4 .38 (636) 5.54 (804) 6.49 (943) 1J
w
114 (45) 126 (1) 2.71 (400) 2.82 (410) 2.89 (419) 2.95 (429) 3.02 (438) 252 ( 2 ) 2.76 (401) 3.02 (438) 3.26 (473) 3 . 4 8 (506) 3.69 (536) 378 ( 3 ) 2.77 (402) 3 .31 (481) 3 .79 (551) 4.21 (612) 4.60 (668) 504 (4 ) 2.78 (404) 3 .69 (536) 4.44 (644) 5.07 (736) 5.63 (818)
127 (50) 126 (1) 2.75 (400) 2.80 (406) 2.83 (411) 2.87 (417) 2 .91 (422) 252 ( 2 ) 2.76 (401) 2.91 (422) 3 .04 ( 4 4 2 ) 3.18 (462) 3 , 3 1 (481) 378 13) 2.76 (401) 3.08 ( 4 4 7 ) 3.37 (490) 3.65 (530) 3.90 (567) 504 ( 4 ) 2.77 (402) 3.31 (481) 3.79 ( 5 5 0 ) 4.21 ( 6 1 2 ) 4.60 (668)
-___- ___ _ _ _ _ __-_ __ - ________ - _- _ _ -s - - - - ----- - -- - --- --I--- --------I - ------ ----.I- -- --
14
Rased on Reynolds numbers, the steam f low was fully turbulent in each
pipe segment far all flow rates and pipe diameters considered. The lowest
Reynolds number was -6.4 million, whish coxresponds t o the lowest flow
(125 k g / s ) in the largest pipe diameter (1.27 m) considered, The lowest
steam velocity in that case was 7.74 mi‘s (25.4 ft/s).
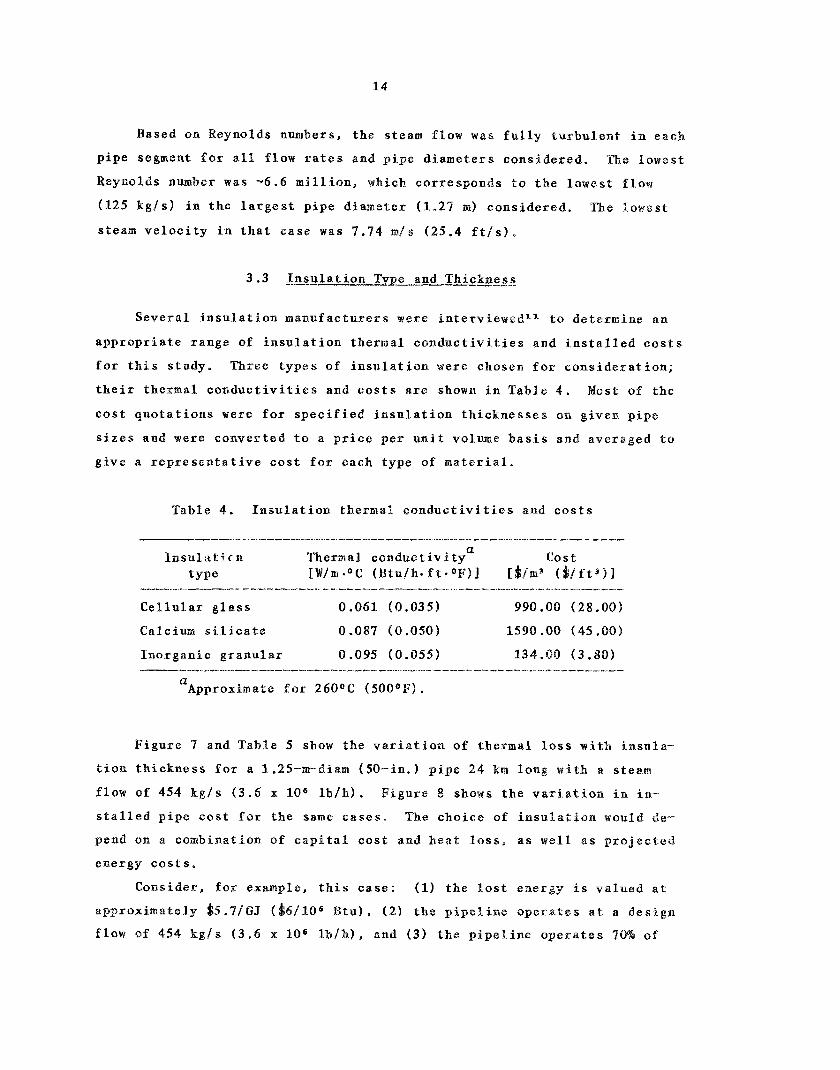
3 . 3 k u l a t i o n Qpe and Tlhickne_s,%
Several insulation manufacturers were interviewedza to determine an
appropriate range of insulation thermal conductivities and installed costs
for this study, Three types of insulation were chosen for consideration;
their thermal conductivities and costs are shown in T a b l ~ e 4 .
cost quotations were for specified insulation thicknesses on given pipe
sizes and W B E ~ converted to a price per unit volume basis and averaged to
give a representative cost for each type of material.
Table 4 . Insulation thermal conductivities and costs
Cellular g l a s s 0.061 (0.035) 990.00 (28.001
Calcium silicate 0.087 (0.050) 1590 .OO (45 .001
Inorganic granular 0 . 0 9 5 ( 0 . 0 5 5 ) 134.00 ( 3 . 8 0 )
a Approximate for 2 6 O O C (500OP).
Figure 7 and Table 5 show the variation o f thermal loss with insula-
tion thickness for a 1.25-nr-diam (50- in . ) pipe 24 km long w i t h a steam
flow of 454 k g / s ( 3 . 6 x lo6 lb/h). Figure 8 shows the variation in iu-
stalled pipe cost for the same cases, The choice of insulation would de-
pend on a combination of c a p i t a l cost and heat loss, as well 8 s projec ted
energy c o s t s .
approximately $ 5 . 7 / ~ ~ ( & / l o 6 tu) I (21 the p i p s l i n e operates a t a design
flow sf 454 kg/s ( 3 . 6 x 10⁶ I b b h ) , and ( 3 ) the pipeline operates 70% of
Consider, for example, this case: (1) the lost energy is valued a t

ORNL-DWG 31-16256 ETD ORNL-DWG 81-16257 ETD
CELLULAR GLASS
I_Icc INORGANIC G R A N U L A R
7 , 1 I t , , 7 5 10 125 15 1 7 5 20 225 25 275 30
INSULATION THlCkYESS (cmi
" I I , I I I I
0 5 10 15 20 25 30 35 I KSU L AT I ON T h I CKN ESS C m )
I I I I I I
3 4 5 6 7 8 9 10 11 12 INSULATION THiCKNESS (in.)
I I I I
0 3 6 9 12 15 INSULATION THiCKNESS (in.)
F i g . 7 , Thermal l o s s v s i n s u l a t i o n thick- ness for a 24-Bm (15-mile) p i p e l i n e .
F i g . 8 . I n s t a l l e d p i p e l i n e cost for vasy- ing i n s u l a t i o n types and t h i c k n e s s e s on a 1.25-m ( 5 0 - i n . ) p i p e 24 km (15 m i l e s ) long.

16
Table 5 . 'XXermal l o s s and i n s t a l l e d p i p e c o s t s f o r v a r y i n g i n s u l a t i o n t y p e s and t h i c k n e s s e s f o r a 1.27-m ( 5 0 - i n , ) p i p e 24 h (15 m i l e s ) long with
a 454 k g / s ( 3 . 6 x I O 6 l b f h ) steam flow
C e l l u l a r g l a s s 7 . 6 ( 3 ) 15 .2 ( 6 ) 22.9 ( 9 ) 30.5 (12)
Calcium s i l i c a t e 1.6 ( 3 ) 15,2 ( 6 ) 2 2 . 9 ( 9 ) 3 0 . 5 (121
I n o r g a n i c g r a n u l a r 7 . 6 ( 3 ) 1 5 - 2 ( 6 ) 2 2 - 9 ( 9 ) 30.5 (12)
7 . 0 ( 2 4 " 7 ) 5 . 7 (19,3) 4 . 9 (16 .6) 4 . 3 (14 .6)
7 . 8 ( 2 6 " 2 ) 6.7 (22 .7) 6.0 (20.2) 5 . 5 (18 .4)
41 - 7 4 53 - 3 0 66 .OO 79.84
48 - 0 9 66.68 87 .PO
109.33
3 2 . 7 2 34 .28 36 .oo 3 7 . 8 8
t h e t ime. In going from 7 . 5 t o 15 cm ( 3 to 6 in.) of c e l l u l a r g l a s s iu-
s u l a t i o n , t h e annual energy l o s s drops from 15.5 t o 12.6 x Pol3 J ( 1 4 - 7 2
to 11.96 x loxo jBtu). A t $ 5 . 7 / G J S t h e annual sa.vin;g i s $165,000. The
i n c r e a s e d c o s t , ~ O W O V ~ P ~ i s $11.6 m i l l i o n , 'T'hns is a very low savings f o r
such 8 l a r g e e x p e n d i t u r e ; t h e simple payback p e r i o d ( w i t h no c o s t esca la-
t i o n s ) i s -70 y e a r s .
For t h e l o w e r - c o s t i n o r g a n i c g r a n u l a r m a t e r i a l , the same comparison
shows a n annual energy sav ings o f 2 - 1 4 x l o x 3 J , an annual c o s t sav ings of
approximately $122,000, and a n i n c r e a s e d i n i t i a l c a p i t a l c o s t sf approxi-
mate ly $1,6 m i l l i o n , T h i s alterniati ivc has a payback p e r i o d o f -13 y e a r s .
The expected range of flow n a t e s must a l s o be cons idered when choos-
ing an i n s n l a t i o n type and t h i c k n e s s . The r a t e of h e a t l o s s i s a f u n c t i o n
of steam temperature and i n s u l a t i o n t h i c k n e s s . ' h a a b s o l u t e energy l o s s
w i l l be the same f o r a V F T ~ low steam flow r a t e a s for a f u l l d e s i g n flow
r a t e , i f t h e steam t empera ture s t a y s t h e same. S ince t h e e n e r g y l o s s a t
17
low flow r a t e s comes from a smaller quant i ty of steam, the r e l a t i v e energy
l o s s per unit of mass i s much greater . These higher energy l o s s e s can
l ead to condensation i n the p i p e l i n e . Therefore, i f v a r i a b l e steam flow rates are a n t i c i p a t e d , more i n s u l a t i o n may be necessary than would be
chosen on an economic b a s i s .
1 8
T h i s e v a l u a t i o n c o n s i d e r s t h e p i p e l i n e flow of steam f o r i n d u s t r i a l
use. P ipe l e n g t h s up t o 24 krrp (15 miles : were examincd and appear t o be
f e a s i b l e . This p ipe l e n g t h cor responds t o a t r a n s p o r t d i s t a n c e of -15 Ian
(10 m i l e s ) .
The r e p o r t i n d i c a t e s t h a t such a p i p e l i n e would c o s t approximately
$53 m i l l i o n .
8 f ixed-charge r a t e of 11%, d e l i v e r s 2 - 3 3 x P o l 6 9 (2 .21 x 1013 Btu) in
one y e a r , t he t r a n s p o r t c o s t of t h e steam would be approximately $0.38/GJ
($0.41/106 B t u ) ,
densa te r e t u r n l i n e b u t would s t i l l be w i t h i n a s easonab le r a n g e .
~f the p i p e l i n e , o p e r a t i n g a t a c a p a c i t y f a c t o 2 of 0 . 7 0 w i t h .
This c o s t would be i n c r e a s e d by the a d d i t i o n of a can-
me c o s t s p r e s e n t e d here a r e f o r f e a s i b i l i t y purposes only . ' f i e
s i t e - s p e c i f i c c o s t s w i l l vary widely from one r e g i o n t o ano the r .
19
REFERENCES
1.
2 .
3.
4.
5 .
6 .
7.
8 .
9.
10.
11
I I J . Nealon, Consumption of Energy by L e Inchstria Sector,’‘ MonthZy Enepgy Review 80(10), 21, M)E/EIA-0035 (October 1980).
Steam, 38th ed., pp. 3-1 to 3- Babcock and Wilcox Company, New Kork, 1975.
United Engineers and Constructors Inc., Direct Steam Transmission Design and CoStB, for Cas-Cooled Reactor Associates, La Jolla, California, April 1981 , p . 5.11.
T. Rawneister et al., Marks‘ Standard Handbook for MwhanieaZ Engi - neers, 8th ed., pp. 8-149 to 8-162 and 4-50, WcGraw-Bill Book Company, New York, 19’78.
T. Kasuda, “Beat Transfer Studies o f Underground Ghi31ed Water and Heat Distribution Systems,’r Underground Hea& and ChiZZed Water Distri- bution Systems, NBS Building Science Series 6 6 , p. 26, United States Department of Commerce/National Bureau of Standards, May 1975,
It. B. McClintock and 6 . J . Silvestri, Formutations and I t e r a t i v e Pro- eedures for the CaZcuZation of Properties of Steam, The AmeriGan SQGi- ety of Mechanical Engineers, New York, 1967.
W. G . Steltz and G. T. Silvestri, “The Formulation o f Steam Properties f o r Digital Computer Applications,’‘ Tram. A%iE 80(4) 967 (May 1 9 5 8 ) .
R. A. Reynolds and W. L. Slager, “Pipeline Transportation of Bydro- gen, pp. 533-543 in Hydrogen Energy, P a r t A, e a , by T. f4. Veziroglu, Plenum Press , New York, 197s.
I ,
T. E. Stoval1 et al., An EvaZziat;.ion of NoneZeetricaZ Eiaergy ITransrnis- sion Options, QRNL/TM-7662 (September 1981) . T. K . Stovall, telephone conversation with U . S . Steel, Atlanta ( S e p t . 3, 1981).
R. 9. Borkowski, telephone conversations (March 1981).


21
Internal Distribution
I. R. J. Borkowski 16. 2. e . W. Collins 17. 3 . J . 6. Delene 18-22" 4. T. J. Ranratty (Consultant) 2 3 . 5 . M. A. Karnitz 24 a 6 . 0. M. Klepper 2 5 . 7 . R . E . MaePherson 26 8 . M. L . Myers 27. 9. S. A. Reed 28-29. 10. T. W. Robinson, Jr. 30 D
11-15. D. Scott, J r .
M. D . Silverman I. Spiewak T. K . Stovall B. E. Trammel1
O W Patent Office Central Research Library Document Reference Section Laboratory Records Department Laboratory Records (RC)
External Distribution
31.
32.
3 3 .
34 .
35.
3 6 .
37. 3 8 .
39.
40 ., 4:.
42 .
4 3 .
44.
45-2 90 *
Joe Anderson, PPG Industries, Qne Gateway Center, Pittsburgh, PA 15222 Russell Ball, Babcock & Wilcox, P.O. Box 1260, Lynchburg, VA 24505 1;. R . Canty, Energy d Utilities Planning, S h e l l Oil Company, P . Q . Bow 2463, Rouston, TX 77001 Quentin F. Ebert, PPC Industries, Inc., One Gateway C e a t e r , Pittsburgh, PA 15222 Ross James, Gulf Oil Refinery &+ Marketing Company, RQQIII 1842, P.O. Box 3915, Houston, TX 7'7001 P. L. Maisto, BASF Wyandotte, 10 Cherry Bill Road, P.0. Box 181, Parsippany, MJ 07054 R a m Marda, UE&G, 30 South 13th, Philadelphia, FA 19101 A . T. UcMain, GCEA, 3344 N. Tosrey Pines Court, La Jolla, CA 92037 Richard Oebl, Mail Stop B-107, Nuclear Energy Programs, Depart- ment of Energy, Washington, DG 20545 Ishai Oliker, Burns &Z Roc, 496 Kindexkamack Road, O r a d e l l , NJ 07649 Dr. George F . Pezdirtz, CS-14 Forst'l Building, U . S . of Energy, Washington, DC 20545 Robert Quade, General Atomic Company, P.0. Box $1608, Saa Diega, CA 92138 Malcolm Williams, Gulf States Utilities, P,O. Box 2951, Beaumont, Tx 77704 Office of Assistant Manager for Energy Research and Department of Energy, ORO, Oak Ridge, aTd 37830 Given distribution a s shown in DOE/TIC-4500 under category 95f