evaluation of adult pacific lamprey passage rates … reports/ui hdx lamprey migration... ·...
TRANSCRIPT

Technical Report 2008-12
IDAHO COOPERATIVE FISH AND WILDLIFE RESEARCH UNIT
__________________________________________________________________
EVALUATION OF ADULT PACIFIC LAMPREY PASSAGE RATES AND SURVIVAL THROUGH THE LOWER COLUMBIA RIVER
HYDROSYSTEM: 2005-2006 PIT-TAG STUDIES
A Report for Study Code ADS-P-00-8
by
W. R. Daigle, M. L. Keefer, C.A. Peery U.S. Geological Survey, Idaho Cooperative Fish and Wildlife Research Unit
University of Idaho, Moscow, ID 83844-1141
and
M. L. Moser Northwest Fisheries Science Center, NOAA Fisheries
2725 Montlake Blvd. East, Seattle, WA 98112
For
U.S. Army Corps of Engineers Portland District, Portland OR
2008

ii
Technical Report 2008-12
EVALUATION OF ADULT PACIFIC LAMPREY PASSAGE RATES AND
SURVIVAL THROUGH THE LOWER COLUMBIA RIVER HYDROSYSTEM: 2005-
2006 PIT-TAG STUDIES
A Report for Study Code ADS-P-00-8
by
W. R. Daigle, M. L. Keefer, C. A. Peery U.S. Geological Survey, Idaho Cooperative Fish and Wildlife Research Unit
Department of Fish and Wildlife Resources University of Idaho, Moscow, ID 83844-1141
and
M. L. Moser
Northwest Fisheries Science Center, NOAA Fisheries 2725 Montlake Blvd. East, Seattle, WA 98112
For
U.S. Army Corps of Engineers Portland and Walla Walla Districts
18 December 2008

i
Acknowledgements
Many people assisted with the field work and data compilation for this report and the successful completion was made possible through their efforts. Howard Pennington and Jeremy Roos were responsible for collecting and tagging the fish. Ken Tolotti, Travis Dick, and Dusty Cummings maintained and downloaded the monitoring equipment. Steve Lee, Mark Morasch, Eric Johnson, Charles Boggs, Dan Joosten, Carter Stone, and Kennith Deife helped with equipment construction and installation. We also thank the staff of Pacific States Marine Fisheries Commission’s Kennewick Field Office, especially Darren Chase and Don Warf. The U. S. Army Corps of Engineers provided funding for this study; we thank David Clugston, Derek Fryer, Tammy Mackey, John Rerecich, Miro Zyndol, Robert Cordie, Brad Eby, and Mark Plummer.

ii
Table of Contents
Abstract iii Introduction 1 Methods 2 Study Area and HDX Monitoring Sites 2 Fish Collection and Tagging 7 Data analysis 7 Results 7 Lamprey Tagging 7 2005 Escapement 10 2005 Hydrosystem Passage Times 12 2005 Overwintering 14 2006 Escapement 14 2006 Dam-to-Dam Passage Times and Rates 17 2006 Multi-Reach Passage Times and Rates 18 Lamprey Migration Timing at Dams, 2000-2006 20 Diel Passage 21 Discussion 21 General comments 21 Escapement / Conversion 22 Passage Rates 23 Migration Timing 25 Detection Efficiency 25 Post 2006 Improvements 26 References 26

iii
Abstract
Monitoring Pacific lamprey (Lampetra tridentata) run size and migration behaviors in the Columbia River basin is difficult, in part because most lamprey passage occurs at night. In this study we tagged lamprey with half duplex (HDX) passive integrated transponder (PIT) tags and monitored their passage at Bonneville, The Dalles, John Day, McNary, and Ice Harbor dams. Our objectives were to calculate lamprey passage times, to estimate escapement past the monitored sites, and to evaluate potential correlates with lamprey passage success.
We PIT-tagged 841 lamprey in 2005 and 2,000 in 2006. Conversion estimates from the top of Bonneville Dam to HDX detectors at McNary Dam were 12% in 2005 and 16% in 2006. About 3% were detected at Ice Harbor Dam in each year. In 2006, conversion estimates from the top of Bonneville Dam to top-of-ladder sites at The Dalles and John Day dams were 68% and 46%, respectively. Large lampreys were significantly more likely than small lampreys to pass through each of the monitored reaches. Those detected at McNary Dam, for example, were 2-3% longer and 7-12% heavier when tagged than fish that were not detected at the dam.
Lamprey migration times were highly variable, but tended to be slow at dams and relatively rapid through reservoirs. In both years, the median migration time from the top of Bonneville Dam to the top of McNary Dam was about 19 days. Passage times between top-of-ladder detectors in 2006 were 5.1 days (Bonneville-The Dalles), 4.1 days (The Dalles-John Day), and 12.8 days (John Day-McNary). Lampreys migrated more rapidly later in the season in both years, coincident with increasing river temperatures and decreasing river discharge.
Migration timing of lampreys across years appeared to be related to river discharge, with later average passage in high-discharge years. A few lampreys overwintered in the Columbia River main stem each year and resumed upstream movement in the following spring. There was also preliminary evidence for population-specific migration timing, with earlier average passage for fish returning to the Snake River basin.

1
Introduction
Pacific lamprey, Lampetra tridentata, is the largest and most abundant lamprey species in the Columbia and Snake rivers. Pacific lampreys are anadromous, with parasitic adults spending 1-4 years in the ocean before returning to spawn in freshwater rivers (Beamish 1980; Close et al. 2002; Moser and Close 2003). After hatching, larvae (ammocoetes) spend 3-7 years living in low-gradient rivers with suitable fine substrates for burrowing and after emergence juveniles (macrophthalmia) migrate out to sea (Beamish and Levings 1991; Torgersen and Close 2004). Lampreys are culturally significant to indigenous peoples of the Pacific Northwest who have traditionally harvested adult fish for sustenance, ceremonial, and medicinal purposes (Close et al. 2004). The fish are ecologically significant as a source of marine-derived nutrients, as consumers and processors of benthic matter, and as a prey species (Close et al. 2002).
Recent studies suggest that Pacific lamprey abundance has steadily declined in the
Columbia River basin and in other regional rivers since the early 1960’s (Close et al. 2002; Kostow 2002). Habitat loss, stream impoundment, ocean conditions, and water pollution have all likely contributed to the decline. Lampreys are also relatively poor swimmers and have difficulty passing through Columbia and Snake River dam fish ladders designed for adult salmonids (Moser et al. 2002b).
Monitoring Columbia River basin lamprey populations has been a challenge. Lamprey
counts at dam fish ladders can only be used as indicators of relative abundance and general run timing because counts generally take place only during the day and most lamprey passage occurs at night (Moser et al. 2002a; Robinson and Bayer 2005). In an effort to improve monitoring of Pacific lamprey in the basin, half duplex (HDX) passive integrated transponder (PIT) tag monitoring sites were deployed at dams starting in 2005. PIT tags are relatively inexpensive and small, are uniquely identifiable, are not limited by battery life, and are easy to implant (Gibbons and Andrews 2004). Therefore, once detectors are installed PIT tags can be used to monitor relatively large numbers of fish cost effectively when fish pass through constricted areas like dam fishways. HDX tags were selected for Pacific lamprey passage evaluations to avoid potential tag collisions with the full-duplex (FDX) PIT tags used to monitor salmonids in the basin.
In 2005, HDX detectors were installed at Bonneville Dam to evaluate lamprey passage
systems in the Bradford Island makeup water channel and at the entrance to the Washington-shore main ladder. Detectors were also installed at McNary and Ice Harbor dams to monitor lamprey in a parallel study (Cummings 2007). In 2006, additional detectors were installed at the tops of ladders at The Dalles and John Day dams.
The objectives of the 2005-2006 studies described in this report were to: 1) calculate adult
lamprey passage rates past multiple dams and reservoirs; 2) estimate lamprey escapement past dams; 3) examine potential physiological and environmental correlates with passage success; and 4) evaluate the efficiency of HDX detectors and make recommendations for design improvements. Results from an additional study objective, describing fine-scale lamprey passage behaviors at individual dams, will be presented in subsequent reports.

2
Methods
Study Area and HDX Monitoring Sites
Lampreys used in this study were collected in a trap at the Adult Fish Facility on the Washington shore at Bonneville Dam, Columbia River kilometer (rkm) 235 (Figure 1). Bonneville Dam has powerhouses adjacent to both shorelines and a spillway located in mid-river (Figure 1). There are two main fishways at this dam. The Washington-shore fishway has downstream openings along Powerhouse II and at the north end of the spillway; these fishways funnel into a single ladder exit site into the forebay near the Washington shore. The Bradford Island fishway has downstream openings along Powerhouse I and on the south side of the spillway and a single ladder exit to the forebay located on the south shore of Bradford Island.
Flow
Washington
Oregon
Bradford Island
Cascade Island
Powerhouse 2
Powerhouse 1
Spillway
Navigation lock
Hamilton Island release site (rkm 229)
Bonneville Dam(rkm 235)
Detector sites: 2005 and 2006Detector sites: 2006 onlyDetector site: 2005 only
Release site: 2005
Release site: 2006
Flow
Washington
Oregon
Bradford Island
Cascade Island
Powerhouse 2
Powerhouse 1
Spillway
Navigation lock
Hamilton Island release site (rkm 229)
Bonneville Dam(rkm 235)
Detector sites: 2005 and 2006Detector sites: 2006 onlyDetector site: 2005 only
Release site: 2005
Release site: 2006
Figure 1. Study area at Bonneville Dam on the Columbia River. Release sites are indicated
by white stars in 2005 and a black star in 2006. White circles represent half duplex monitoring sites that were operational in 2005 and 2006; gray circles represent sites that were only operational in 2005 and black circles represent sites that were only operational in 2006. Larger circles indicate top-of-ladder detectors.

3
For the 2005 migration season, one HDX PIT-tag detector was installed at the Bradford Island fishway ladder exit, three detectors were installed inside the Bradford Island lamprey passage system (LPS), and one detector was installed at the downstream end of the Bradford Island makeup water channel (MWC). In the Washington-shore fishway, four detectors were installed at the northern-most downstream fishway opening, and two detectors were installed upstream from the transition pool. In 2006, the detector at the downstream end of the Bradford Island Fishway was decommissioned due to interference with the newly installed FDX detectors in this area. New HDX detectors were added at the upstream opening to the Washington-shore fish ladder, on the LPS at the north entrance to the Washington-shore fishway and within the decommissioned Cascades Island fishway. Each site at Bonneville Dam (and at all other sites in both years) was outfitted with a PDA-style data logger that was downloaded weekly.
Washington
Oregon
The Dalles Dam(rkm 305)
Powerhouse
Spillway
Navigation lock
Flow
Detection sites: 2006Washington
Oregon
The Dalles Dam(rkm 305)
Powerhouse
Spillway
Navigation lock
Flow
Detection sites: 2006
Figure 2. Study area at The Dalles Dam on the lower Columbia River (2006 only). Half
duplex PIT tag monitoring sites are indicated by black circles.

4
The Dalles Dam has one powerhouse and one spillway (Figure 2). There are two fish ladders. The east fish ladder has downstream openings on the south side of the spillway and on the east and west ends of the powerhouse and one upstream opening just west of the powerhouse. The north fish ladder has one set of downstream and one upstream opening, each located on the north side of the spillway. For the 2006 migration season, four HDX detectors were installed in the upper east fish ladder and one detector was installed in the upper north ladder.
John Day Dam also has one powerhouse, one spillway and two fish ladders (Figure 3). The
south fish ladder has downstream openings at either end of the powerhouse and one ladder exit adjacent to the Oregon shore. The downstream entrance and upstream ladder exit for the north fish ladder are located at the north end of the spillway. One HDX detector was installed at the top of each ladder for the 2006 migration season.
Washington
Oregon
John Day Dam(rkm 347)
Powerhouse
Spillway
Navigation lock
Flow
Detection sites: 2006
Washington
Oregon
John Day Dam(rkm 347)
Powerhouse
Spillway
Navigation lock
Flow
Detection sites: 2006
Figure 3. Study area at John Day Dam on the lower Columbia River (2006 only). Half
duplex PIT tag monitoring sites are indicated by black circles.
5
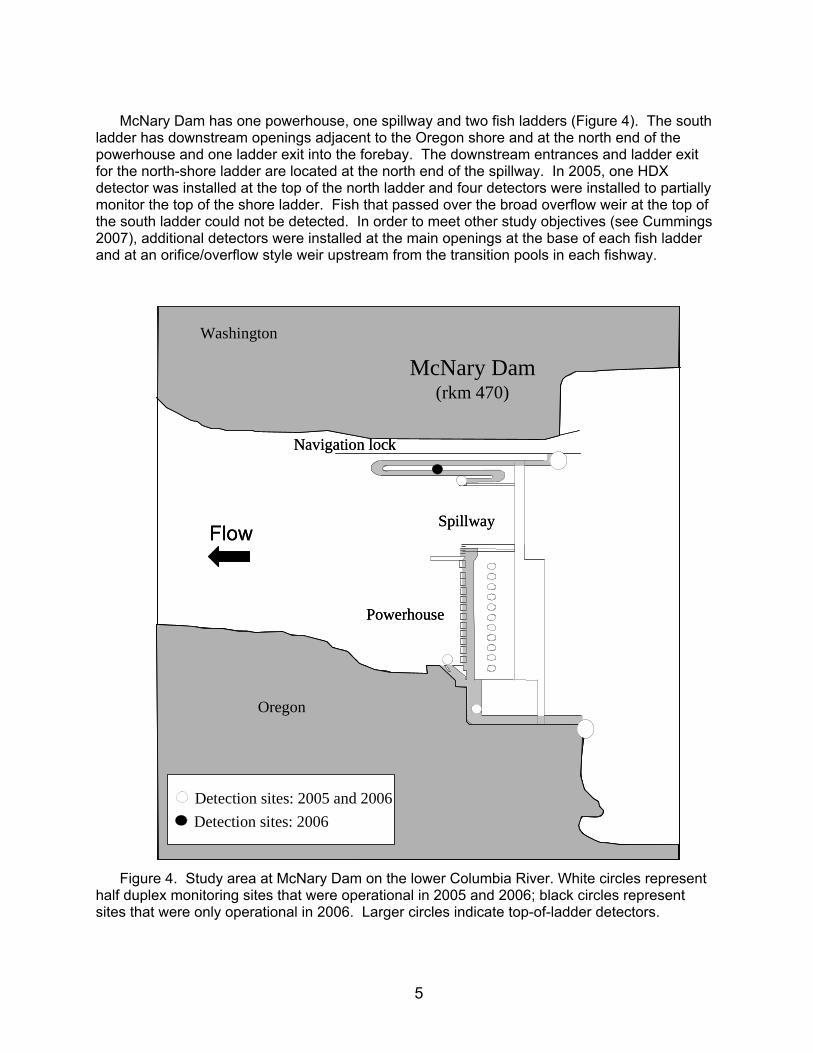
McNary Dam has one powerhouse, one spillway and two fish ladders (Figure 4). The south
ladder has downstream openings adjacent to the Oregon shore and at the north end of the powerhouse and one ladder exit into the forebay. The downstream entrances and ladder exit for the north-shore ladder are located at the north end of the spillway. In 2005, one HDX detector was installed at the top of the north ladder and four detectors were installed to partially monitor the top of the shore ladder. Fish that passed over the broad overflow weir at the top of the south ladder could not be detected. In order to meet other study objectives (see Cummings 2007), additional detectors were installed at the main openings at the base of each fish ladder and at an orifice/overflow style weir upstream from the transition pools in each fishway.
Washington
Oregon
McNary Dam(rkm 470)
Powerhouse
Spillway
Navigation lock
Flow
Detection sites: 2006Detection sites: 2005 and 2006
Washington
Oregon
McNary Dam(rkm 470)
Powerhouse
Spillway
Navigation lock
Flow
Detection sites: 2006Detection sites: 2005 and 2006
Figure 4. Study area at McNary Dam on the lower Columbia River. White circles represent
half duplex monitoring sites that were operational in 2005 and 2006; black circles represent sites that were only operational in 2006. Larger circles indicate top-of-ladder detectors.
6
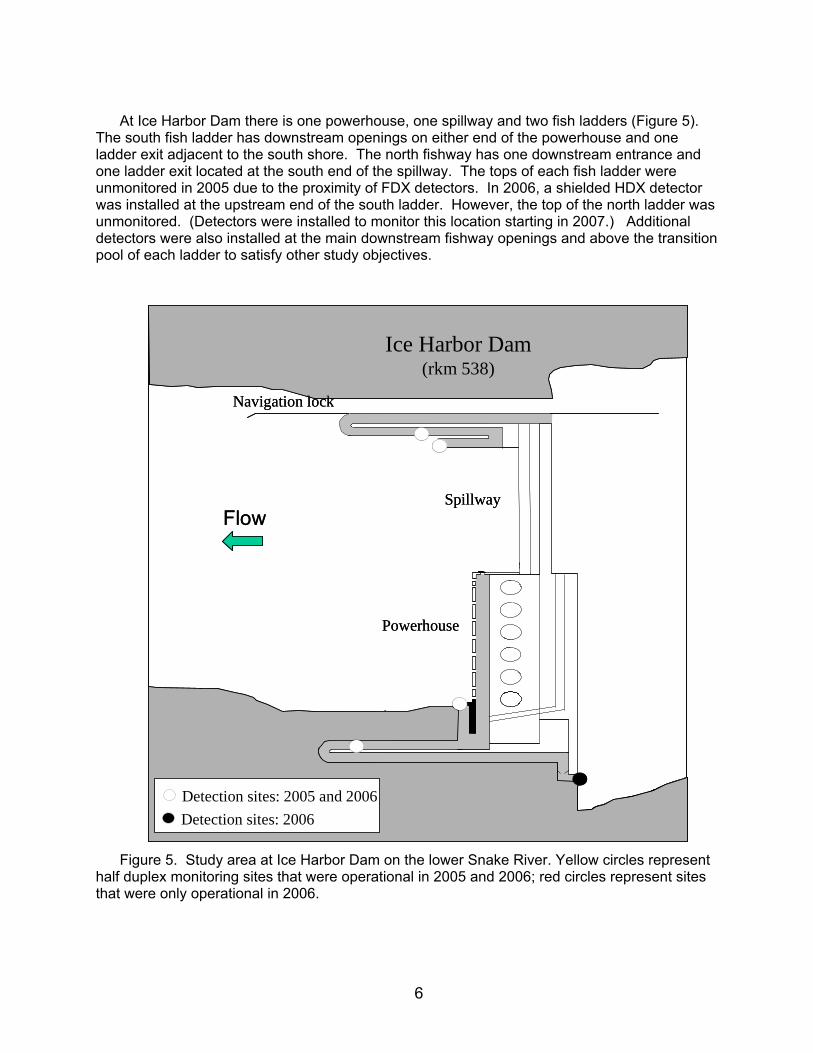
At Ice Harbor Dam there is one powerhouse, one spillway and two fish ladders (Figure 5).
The south fish ladder has downstream openings on either end of the powerhouse and one ladder exit adjacent to the south shore. The north fishway has one downstream entrance and one ladder exit located at the south end of the spillway. The tops of each fish ladder were unmonitored in 2005 due to the proximity of FDX detectors. In 2006, a shielded HDX detector was installed at the upstream end of the south ladder. However, the top of the north ladder was unmonitored. (Detectors were installed to monitor this location starting in 2007.) Additional detectors were also installed at the main downstream fishway openings and above the transition pool of each ladder to satisfy other study objectives.
Ice Harbor Dam(rkm 538)
Powerhouse
Spillway
Navigation lock
Flow
Detection sites: 2006Detection sites: 2005 and 2006
Ice Harbor Dam(rkm 538)
Powerhouse
Spillway
Navigation lock
Flow
Detection sites: 2006Detection sites: 2005 and 2006
Figure 5. Study area at Ice Harbor Dam on the lower Snake River. Yellow circles represent
half duplex monitoring sites that were operational in 2005 and 2006; red circles represent sites that were only operational in 2006.

7
Fish Collection and Tagging
In 2005, 841 adult lampreys were collected in the trap at the Bonneville Adult Fish Facility, PIT-tagged and released into the make-up water channel (MWC) at the top of the Bradford Island fish ladder. (Note: an additional 78 fish were released downstream from Bonneville Dam in 2005, but these were not included in analyses.) In 2006, 2,000 fish were trapped at the Adult Fish Facility and released approximately three kilometers downstream from Bonneville Dam near Hamilton Island. Fish were anaesthetized using 60 ppm clove oil, measured (length and girth to the nearest mm), weighed (nearest g) and outfitted with a glass encapsulated HDX PIT-tag (Texas Instruments 4×32 mm, 0.8 g). Each PIT-tag was uniquely coded to allow identification of individual fish. PIT-tags were surgically implanted in the body cavity of anaesthetized fish through a small incision (<1 cm) along the ventral midline and in line with the anterior insertion of the first dorsal fin as described in Moser et al. (2006). Data Analyses
Reach conversion rates were calculated by dividing the number of lampreys known to pass
an upstream HDX site by those known to pass a downstream HDX site or the number released. Fish were treated as passing a site if they were detected at the site or were detected at a location further upstream. Conversion rates were calculated within year across all release dates as well as for all individual release days. Size of lampreys that successfully migrated through a reach were compared to those of unsuccessful fish using general linear models (PROC GLM, SAS).
Lamprey migration times and passage rates (km●d-1) were calculated from release to
fishway and/or top-of-ladder HDX detectors at dams and between HDX sites. First detections were used for all calculations. Linear regression was used to evaluate relationships between lamprey passage rates and fish size (length, girth, weight), release date, and river discharge. Analyses using discharge data should be considered qualitative as it was difficult to assign appropriate metrics given the variable and often long passage times.
HDX detection site efficiencies were estimated by dividing the number of fish known to pass
a site by the number detected. These estimates were imprecise because fish could pass via alternate routes at many locations. It was unknown how many fish passed undetected at any dam, and estimated efficiencies provide a largely qualitative description.
Results Lamprey Tagging
A total of 2,841 adult lampreys were collected and PIT tagged: 841 in 2005 and 2,000 in 2006. Fish collected in 2005 were slightly larger on average (1 cm longer and 18 g heavier) than those collected in 2006 (Table 1). In both years, lamprey weight was more variable (coefficient of variation = 17-20%) than either length (6-7%) or girth (7-8%). All three size metrics were positively correlated within year (length×girth r2 = 0.52-0.64; length×weight r2 = 0.70-0.81; girth×weight r2 = 0.84-0.90). Length, girth and weight were weakly correlated or not correlated with migration date in either year (r2 < 0.02).

8
Table 1. Length, girth, and weight of lampreys collected and PIT-tagged at Bonneville Dam in 2005 and 2006. (Total n = 841 in 2005 and 2,000 in 2006.) Length (cm) Girth (cm) Weight (g)
Year n Mean sd N Mean sd n Mean sd 2005 841 67.9 4.2 841 11.5 0.8 599 499.7 87.12006 1997 67.0 4.8 1999 11.2 0.9 1978 482.2 98.3
In 2005, tagging of adult lamprey began on 6 June and ended on 22 July (Figure 6). The first fish was detected at the top of Bonneville Dam on 10 June and the last passage event was on 10 August. The median passage date at Bonneville Dam was 29 June. The first lamprey detected at McNary Dam, 235 rkm upstream, was on 7 July and two fish passed McNary dam on 8 July. The median passage date at McNary Dam was 14 July and fish continued to pass until 15 August. Although no detectors were in place at the tops of Ice Harbor Dam ladders in 2005, fish were detected at the base of the dam and inside the ladder from 9 July–15 August with median passage on 23 July. At both Bonneville and McNary dams, the passage distributions for tagged fish were truncated relative to the total counts (Figure 6).
Lam
prey
cou
nted
Lam
prey
det
ecte
dLa
mpr
ey d
etec
ted
Lam
prey
rele
ased # released
0
10
20
30
40
50
60
BO detections
0
20
40
60
80
100
0
200
400
600
800
1000
1200
1400
MN detections
April May June July August September October0
2
4
6
8
10
0
20
40
60
80
100
120
140
Lam
prey
cou
nted
Lam
prey
det
ecte
dLa
mpr
ey d
etec
ted
Lam
prey
rele
ased # released
0
10
20
30
40
50
60
BO detections
0
20
40
60
80
100
0
200
400
600
800
1000
1200
1400
MN detections
April May June July August September October0
2
4
6
8
10
0
20
40
60
80
100
120
140
Figure 6. Daily numbers of PIT-tagged lampreys released (top panel) and first detected at the tops of Bonneville (BO, second panel) and McNary (MN, third panel) dams in 2005 and the total number of lampreys tallied at count window stations (solid line).

9
In 2006, lampreys were tagged during the period starting 24 May and ending 17 August (Figure 7). Almost all fish (99.5%, n =1,989) were released before 22 July, the date that river temperatures reached 22º C and there was concern about fish stress. The remaining 11 fish were released when river temperatures decreased on 17 August. Based on lamprey counts, the peak of the run occurred in mid-July, so late-run fish were underrepresented in the PIT-tagged sample. Median passage dates for tagged fish were 6 July at Bonneville Dam, 18 July at The Dalles Dam, 24 July at John Day Dam, 5 August at McNary Dam and 26 July at Ice Harbor Dam.
# released
X Data
0
50
100
150
Bonneville Dam
X Data
0
25
50
0
500
1000
1500
The Dalles Dam
X Data
0
10
20
0
100
200
John Day Dam
X Data
0
10
20
0
100
200
300
400
McNary Dam
X Data
0
5
10
0
20
40
60
80
Ice Harbor Dam
April May June July August September October0
2
4
0
5
10
15
Figure 7. Daily numbers of PIT-tagged lampreys released and those first detected at the
tops of Bonneville, The Dalles, John Day, and McNary dams in 2006. The solid line is the total number of lampreys tallied at count window stations.
10
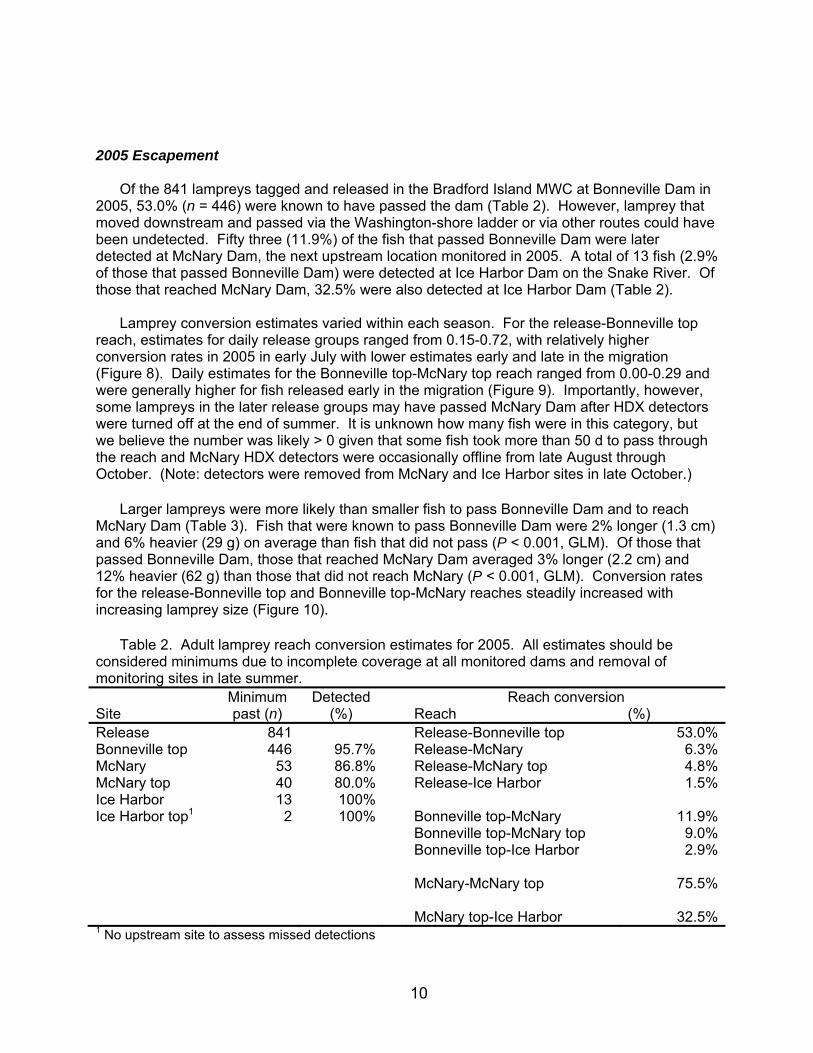
2005 Escapement
Of the 841 lampreys tagged and released in the Bradford Island MWC at Bonneville Dam in 2005, 53.0% (n = 446) were known to have passed the dam (Table 2). However, lamprey that moved downstream and passed via the Washington-shore ladder or via other routes could have been undetected. Fifty three (11.9%) of the fish that passed Bonneville Dam were later detected at McNary Dam, the next upstream location monitored in 2005. A total of 13 fish (2.9% of those that passed Bonneville Dam) were detected at Ice Harbor Dam on the Snake River. Of those that reached McNary Dam, 32.5% were also detected at Ice Harbor Dam (Table 2).
Lamprey conversion estimates varied within each season. For the release-Bonneville top
reach, estimates for daily release groups ranged from 0.15-0.72, with relatively higher conversion rates in 2005 in early July with lower estimates early and late in the migration (Figure 8). Daily estimates for the Bonneville top-McNary top reach ranged from 0.00-0.29 and were generally higher for fish released early in the migration (Figure 9). Importantly, however, some lampreys in the later release groups may have passed McNary Dam after HDX detectors were turned off at the end of summer. It is unknown how many fish were in this category, but we believe the number was likely > 0 given that some fish took more than 50 d to pass through the reach and McNary HDX detectors were occasionally offline from late August through October. (Note: detectors were removed from McNary and Ice Harbor sites in late October.)
Larger lampreys were more likely than smaller fish to pass Bonneville Dam and to reach McNary Dam (Table 3). Fish that were known to pass Bonneville Dam were 2% longer (1.3 cm) and 6% heavier (29 g) on average than fish that did not pass (P < 0.001, GLM). Of those that passed Bonneville Dam, those that reached McNary Dam averaged 3% longer (2.2 cm) and 12% heavier (62 g) than those that did not reach McNary (P < 0.001, GLM). Conversion rates for the release-Bonneville top and Bonneville top-McNary reaches steadily increased with increasing lamprey size (Figure 10).
Table 2. Adult lamprey reach conversion estimates for 2005. All estimates should be considered minimums due to incomplete coverage at all monitored dams and removal of monitoring sites in late summer. Minimum Detected Reach conversion Site past (n) (%) Reach (%) Release 841 Release-Bonneville top 53.0%Bonneville top 446 95.7% Release-McNary 6.3%McNary 53 86.8% Release-McNary top 4.8%McNary top 40 80.0% Release-Ice Harbor 1.5%Ice Harbor 13 100% Ice Harbor top1 2 100% Bonneville top-McNary 11.9% Bonneville top-McNary top 9.0% Bonneville top-Ice Harbor 2.9% McNary-McNary top 75.5% McNary top-Ice Harbor 32.5%1 No upstream site to assess missed detections

11
Release date
21 May 31 May 10 Jun 20 Jun 30 Jun 10 Jul 20 Jul 30 Jul
Pro
porti
on re
cord
ed p
assi
ng B
onne
ville
Dam
0.0
0.2
0.4
0.6
0.8
2005
2006
Figure 8. Lamprey conversion estimates from release to the top of Bonneville Dam by year
and date of lamprey release. Fish were released in the makeup water channel of the Bradford Island fishway in 2005 (●) and near Hamilton Island in 2006 (○). Symbols are daily estimates.
Release date
21 May 31 May 10 Jun 20 Jun 30 Jun 10 Jul 20 Jul 30 Jul
Pro
porti
on re
cord
ed p
assi
ng M
cNar
y D
am
0.00
0.05
0.10
0.15
0.20
0.25
0.30one outlier not shown
2005
2006
Figure 9. Lamprey conversion estimates from the top of Bonneville Dam to the top of
McNary Dam by year (2005: ●; 2006: ○) and date of lamprey release. Symbols are daily estimates. Relatively lower estimates late in 2005 may have been related in part to reduced monitoring effort late in the migration.

12
Table 3. Lamprey weights (g) and lengths (cm) in relation to their migration success through the monitored reaches in 2005 and 2006. Top-of-ladder sites were used for the upper end of each reach. F and P values are from general linear models (GLM). 2005 2006 Reach Passed Weight (n) Length (n) Weight (n) Length (n) Release - Bonneville No 485 (297) 67.2 (395) 465 (1167) 66.1 (1177) Yes 514 (302) 68.5 (446) 508 (811) 68.1 (820) F 17.2 22.5 96.0 90.8 P < 0.001 < 0.001 < 0.001 < 0.001 Bonneville - The Dalles No - - 485 (260) 67.1 (264) Yes - - 518 (551) 68.7 (556) F 23.4 24.6 P < 0.001 < 0.001 The Dalles - John Day No - - 488 (176) 67.2 (176) Yes - - 533 (375) 69.3 (380) F 29.9 34.5 P < 0.001 < 0.001 John Day - McNary No - - 530 (279) 69.3 (300) Yes - - 541 (78) 69.5 (80) F 1.0 0.2 P 0.310 0.624 Bonneville - McNary No 508 (271) 68.3 (406) 504 (733) 68.0 (740) Yes 570 (31) 70.5 (40) 541 (78) 69.5 (80) F 14.9 11.2 11.1 9.0 P < 0.001 < 0.001 < 0.001 0.003
2005 Hydrosystem Passage Times
From the time of release, 32 fish detected at the top of McNary Dam took a median of 25.1 d (range = 11.9-56.0 d) to travel 235 rkm from release to the top of McNary Dam (Figure 11). The median time from detection at the top of Bonneville Dam to detection at the top of McNary Dam was 18.8 d (range = 8.3-55.7 d, n = 20).
Passage times from Bonneville Dam to McNary Dam decreased over the course of the
tagging period and were most variable during the first half of June when river discharge was highest (Figure 11). As with seasonal conversion patterns, however, this relationship should be interpreted cautiously. Regression results may have been biased if slow-moving fish tagged late in the season were excluded because detectors were turned off at McNary Dam. Despite this uncertainty, increased passage rates later in the season might be expected given increasing water temperatures and reduced flow. A similar pattern was noted in 2006.

13
Weight (g)
300 350 400 450 500 550 600 650 700
Con
vers
ion
prop
ortio
n
-0.2
0.0
0.2
0.4
0.6
0.8
1.0
Release-Bonneville topBonneville top-McNary
Figure 10. Linear regressions showing relationships between lamprey weight (g) and reach
conversion estimates in 2005. Proportions were calculated as the number of fish passing the upstream site divided by the number passing the downstream site (Release to Bonneville top, r2 = 0.89; Bonneville top to McNary, r2 = 0.72). Groups were calculated using 50-g increments and those with n < 5 were excluded.
Date
1 Jun 11 Jun 21 Jun 1 Jul 11 Jul 21 Jul 31 Jul
Pas
sage
tim
e (d
)
0
10
20
30
40
50
60
Figure 11. Linear regressions showing the relationship between release date and lamprey
passage times from Bonneville to McNary dams in 2005. Solid circles (●) are times from release to detection at the top of McNary Dam (n = 32; r 2 = 0.23). Open circles (○) are from the top of Bonneville Dam to the top of McNary Dam (n = 20; r2 = 0.23). Note: reduced monitoring late in the migration may have biased the relationship.

14
In linear regression analyses, we found no significant (P > 0.05) relationships between fish length, weight or girth and either passage time metric. Passage times appeared to decrease with river discharge (measured on the release date). However, we note that the negative correlation between discharge and date invokes concerns about undetected fish described above. In addition, the relatively long passage times (medians ~19 and 25 d) indicate that some fish were likely exposed to a wide range of discharge conditions during their passage. 2005 Overwintering
Eleven fish tagged in 2005 were detected in the Hydrosystem during the 2006 migration season: five were detected at Bonneville Dam, two were at McNary Dam and one was at Ice Harbor Dam. The median release date for these fish was 28 June, 2005. These overwintering fish tended to move early in the 2006 migration season. Their median detection date at Bonneville Dam was 17 June, 2006 (range = 15 June to 10 July). Individual fish were detected at McNary Dam on 14 June and 17 July and at Ice Harbor Dam on 8 June. Each fish was detected at only one dam.
2006 Escapement
Of the 2,000 lampreys released near Hamilton Island in 2006, 41.1% (n = 822) were known to have passed Bonneville Dam (Table 4). Of those that passed Bonneville, at least 558 (67.9%) passed The Dalles Dam, 381 (46.4%) passed John Day Dam, and 80 (9.7%) passed McNary Dam. Only 5 fish (1%) were known to have passed Ice Harbor Dam, though detectors were in place at only one top-of-ladder site. A total of 29 fish (3.5% of those that passed Bonneville) were detected at Ice Harbor Dam. The conversion estimate from the top of The Dalles Dam to the top of John Day Dam was 68.3% and the John Day top-McNary top estimate was 21.0%. As in 2005, about a third (36.3%) of the lampreys that passed McNary Dam was subsequently recorded at Ice Harbor Dam (Table 4).
Daily conversion estimates from release to the top of Bonneville Dam ranged from 0.20-0.56
(Figure 12). Conversions from the top of Bonneville to the top of McNary were more variable within season, with daily release estimates ranging from 0.00-0.21 with peaks ranging from 0.12-0.15 in mid-June, early July, and mid-July (Figure 12). Daily reach conversion estimates between the other dams showed both slightly increasing (Bonneville-The Dalles, The Dalles-John Day) and slightly decreasing (John Day-McNary) trends within season (Figure 12).
The substantially lower conversion rates through the John Day-McNary reach as compared
to the Bonneville-The Dalles and The Dalles-John Day reaches may reflect the distribution of lamprey spawning grounds. Notably, 34.1% of the fish that passed John Day Dam were detected at McNary Dam, yet only 21.0% were detected passing the dam (Table 4).
As in 2005, lampreys that successfully migrated to upstream sites were significantly larger
than unsuccessful fish (Table 3). In most study reaches, successful fish were 2-3% longer and 7-9% heavier on average than unsuccessful fish. Very few of the smallest fish were successful. After passing Bonneville Dam, those that reached McNary Dam averaged 2% longer (1.5 cm) and 7% heavier (37 g) than those that did not reach McNary (P < 0.001, GLM). As in 2005, conversion rates for all study reaches increased with increasing lamprey size (Figure 13).

15
Table 4. Adult lamprey reach conversion estimates for 2006. All estimates should be considered minimums. Minimum Detected Reach conversion Site past (n) (%) Reach (%) Release 2000 Release-Bonneville 50.1%Bonneville 1001 86.6% Release-Bonneville top 41.1% Bonneville top 822 79.3% The Dalles top 558 69.4% Bonneville-Bonneville top 88.1%John Day top 381 99.0% McNary 130 96.2% Bonneville top-The Dalles top 67.9%McNary top 80 75.0% Bonneville top-John Day top 46.4%Ice Harbor 29 100.0% Bonneville top-McNary 15.8%Ice Harbor top1 5 100.0% Bonneville top-McNary top 9.7% Bonneville top-Ice Harbor 3.3% Bonneville top-ice Harbor top 0.6% The Dalles top-John Day top 68.3% The Dalles top-McNary top 14.3% The Dalles top-Ice Harbor 5.2% John Day top-McNary 34.1% John Day top-McNary top 21.0% John Day top-Ice Harbor 7.6% McNary-McNary top 61.5% McNary top-Ice Harbor 36.3%1 No upstream site to assess missed detections

16
Release date
21 May 31 May 10 Jun 20 Jun 30 Jun 10 Jul 20 Jul 30 Jul
Pro
porti
on re
cord
ed p
assi
ng M
cNar
y D
am
0.0
0.2
0.4
0.6
0.8
1.0
Bonn-Dalles
Dalles-John Day
John Day-McNary
Figure 12. Dam-to-dam lamprey conversion estimates between top-of-ladder monitoring
sites in 2006. Reaches were Bonneville-The Dalles (●), The Dalles-John Day (○) and John Day-McNary (●). Symbols are daily estimates.
Weight (g)
250 300 350 400 450 500 550 600 650 700 750
Con
vers
ion
prop
ortio
n
0.0
0.2
0.4
0.6
0.8
1.0
Rel-BOBO-TDTD-JDJD-MN
Figure 13. Linear regressions showing relationships between lamprey weight (g) and reach conversion estimates in 2006. Proportions were calculated as the number of fish passing the upstream site divided by the number passing the downstream site (Rel-BO = Release to Bonneville top, r2 = 0.88; BO-TD - Bonneville top to The Dalles top r2 = 0.83; TD-JD = The Dalles top to John Day top, r2 = 0.70; JD-MN = John Day top to McNary top, r2 = 0.51). Groups were calculated using 50-g increments and those with n < 5 were excluded.

17
2006 Dam-to-Dam Passage Times and Rates
Median reach passage times were 9.6 d from the release site to the top of Bonneville Dam, 5.1 d between Bonneville and The Dalles dams, 4.1 d from The Dalles to John Day, and 12.8 d from John Day to McNary (top-of-ladder sites at all dams, Figure 14). Median passage rates in these reaches were < 1 km●d-1 (release-Bonneville top), 14.3 km●d-1 (Bonneville-The Dalles), 13.0 km●d-1 (The Dalles-John Day), and 9.6 km●d-1 (John Day-McNary). The median time from the top of John Day Dam to a fishway detector at McNary Dam was 7.6 d (16.2 km●d-1).
PTi
(d)
0
10
20
30
40
50
60
652
269
207
59
2
Releas
e –Bon
nevil
le top
Bonne
ville
top –
The D
alles
top
McNar
y top –
Ice H
arbo
r top
John
Day
top –
McNar
y top
The D
alles
top –
John
Day
top
Pass
age
time
(d)
PTi
(d)
0
10
20
30
40
50
60
652
269
207
59
2
Releas
e –Bon
nevil
le top
Bonne
ville
top –
The D
alles
top
McNar
y top –
Ice H
arbo
r top
John
Day
top –
McNar
y top
The D
alles
top –
John
Day
top
Pass
age
time
(d)
Figure 14. Mean (dotted line), median, 5th, 10th, 90th, 95th percentiles and quartile days PIT-
tagged lampreys took to pass from release downstream from Bonneville Dam to the top of Bonneville Dam and between the upper ladder monitoring sites at each pair of monitored dams upstream.
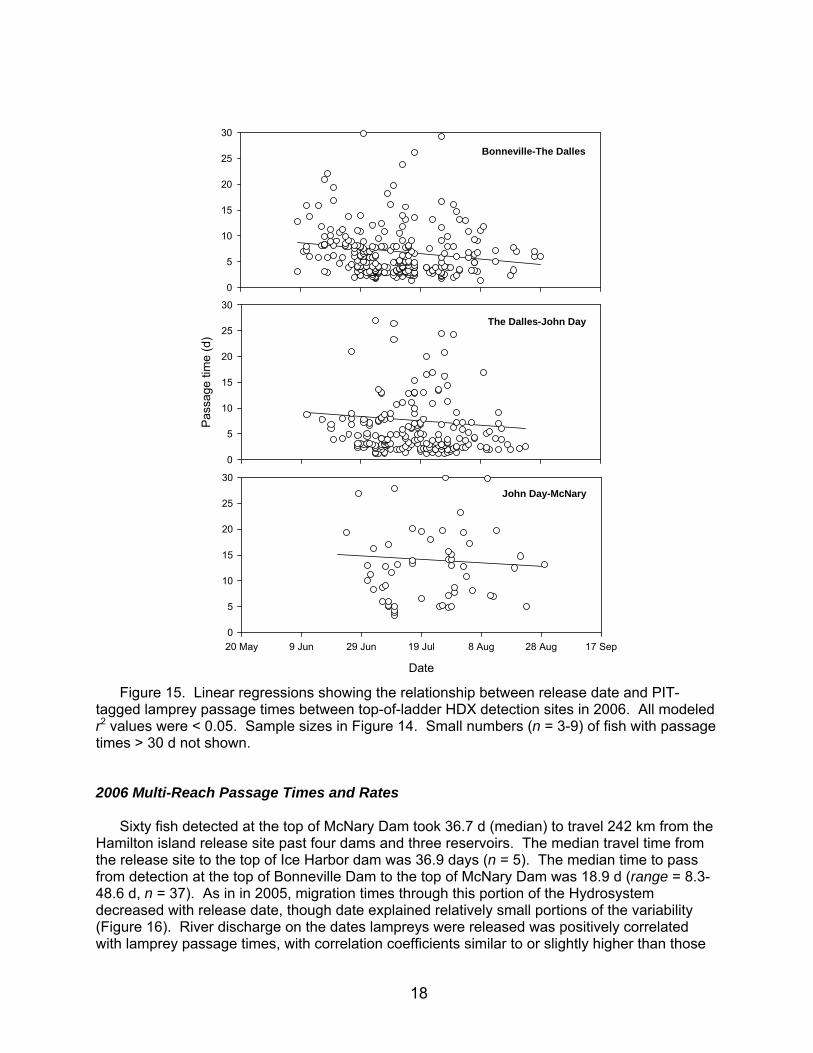
Linear regressions suggested that passage times decreased with increasing passage date
for the three dam-to-dam reaches, but date explained only small portions of the variability (Figure 15). Passage times were also positively correlated with discharge on lamprey release date, though we note that date and discharge were negatively correlated and most fish were likely exposed to a wide range of discharge conditions. We found little correlation between fish size and passage times through any reach.
18
Date
20 May 9 Jun 29 Jun 19 Jul 8 Aug 28 Aug 17 Sep0
5
10
15
20
25
30
Pass
age
time
(d)
0
5
10
15
20
25
30
0
5
10
15
20
25
30
Bonneville-The Dalles
The Dalles-John Day
John Day-McNary
Figure 15. Linear regressions showing the relationship between release date and PIT-
tagged lamprey passage times between top-of-ladder HDX detection sites in 2006. All modeled r2 values were < 0.05. Sample sizes in Figure 14. Small numbers (n = 3-9) of fish with passage times > 30 d not shown.
2006 Multi-Reach Passage Times and Rates
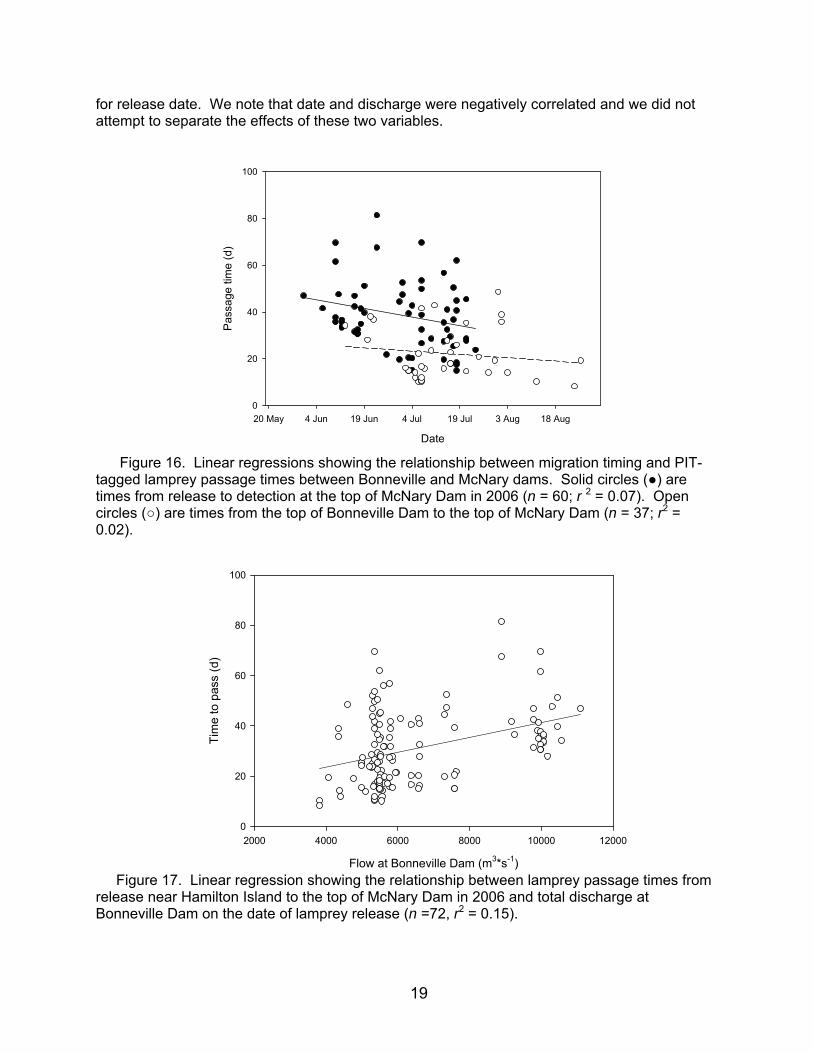
Sixty fish detected at the top of McNary Dam took 36.7 d (median) to travel 242 km from the Hamilton island release site past four dams and three reservoirs. The median travel time from the release site to the top of Ice Harbor dam was 36.9 days (n = 5). The median time to pass from detection at the top of Bonneville Dam to the top of McNary Dam was 18.9 d (range = 8.3-48.6 d, n = 37). As in in 2005, migration times through this portion of the Hydrosystem decreased with release date, though date explained relatively small portions of the variability (Figure 16). River discharge on the dates lampreys were released was positively correlated with lamprey passage times, with correlation coefficients similar to or slightly higher than those
19
for release date. We note that date and discharge were negatively correlated and we did not attempt to separate the effects of these two variables.
Date
20 May 4 Jun 19 Jun 4 Jul 19 Jul 3 Aug 18 Aug
Pas
sage
tim
e (d
)
0
20
40
60
80
100
Figure 16. Linear regressions showing the relationship between migration timing and PIT-
tagged lamprey passage times between Bonneville and McNary dams. Solid circles (●) are times from release to detection at the top of McNary Dam in 2006 (n = 60; r 2 = 0.07). Open circles (○) are times from the top of Bonneville Dam to the top of McNary Dam (n = 37; r2 = 0.02).
Flow at Bonneville Dam (m3*s-1)
2000 4000 6000 8000 10000 12000
Tim
e to
pas
s (d
)
0
20
40
60
80
100
Figure 17. Linear regression showing the relationship between lamprey passage times from release near Hamilton Island to the top of McNary Dam in 2006 and total discharge at Bonneville Dam on the date of lamprey release (n =72, r2 = 0.15).

20
Lamprey Migration Timing at Dams, 2000-2006
Differences in monitoring effort and tagging schedules between 2005 and 2006 made it difficult to assess year-to-year variability in lamprey progression upstream and to make inferences about environmental effects. However, recent lamprey count data provide some supporting evidence for slower migration rates in years with higher river flow. Median lamprey passage dates at McNary Dam, for example, were about three weeks later in 2002 and 2006 (years with slightly above-average flow) than in low-flow 2001 (Figure 18). For the short recent time series that lamprey data were available (2000-2006), migration date was positively correlated with mean flow (May-July) at McNary Dam (r2 = 0.70). The pattern was mirrored at Bonneville Dam (r2 = 0.32) and at Ice Harbor Dam (mean flow from June-July, r2 = 0.74).
Flow (m3*s-1)
3000 4000 5000 6000 7000 8000 9000
Med
ian
coun
t dat
e
19 Jun
29 Jun
9 Jul
19 Jul
29 Jul
8 Aug
18 Aug
28 Aug
Figure 18. Linear regressions showing the relationship between mean Columbia River
discharge (May-July) at Bonneville Dam and median lamprey passage dates at Bonneville (○, r2 = 0.32) and McNary (●,r2 = 0.70) dams based on ladder count data, 2000-2006. All data are archived at http://www.cbr.washington.edu/dart.
Although counts at ladders are only a relative measure of run passage, the 2000-2006 data
further indicate that lamprey populations may be at least partially separated by run timing. Lampreys returning to the Snake River, for example, appear to migrate earlier in the run than lampreys returning to mid- and upper Columbia sites. Median count dates at Ice Harbor Dam were 2-14 d (mean = 7 d, n = 7) earlier than median dates at McNary Dam, without accounting for the additional time lampreys took to migrate between count windows at McNary and Ice Harbor dams. In 2006, PIT-tagged lamprey that eventually reached Ice Harbor Dam were collected at Bonneville Dam 20 d earlier (medians) than fish that passed McNary Dam but were not recorded at Ice Harbor Dam. The difference in medians between these PIT-tagged groups was slight in 2005 (Snake River fish were 3 d earlier), but few lampreys were tagged early in the migration (see Figure 6).

21
Diel Passage
As in earlier telemetry studies, lamprey passage distributions at top-of-ladder PIT-tag detectors clearly showed that most passage occurred at night (Figure 19). This pattern was consistent at all four of the lower Columbia River dams in 2006 and at Bonneville and McNary dams in 2005. The majority of passage events were between sunrise and sunset, though some fish passed during all hours. Daylight passage most often occurred between 0500 and 1000, perhaps indicating that fish that initiated passage at night continued migrating during the morning hours in an effort to exit fishways.
Time of day
01:00
:00
04:00
:00
07:00
:00
10:00
:00
13:00
:00
16:00
:00
19:00
:00
22:00
:00
Num
ber o
f lam
prey
(n)
0
20
40
60
80
100
120
140
160
180
BonnevilleThe DallesJohn DayMcNary
Figure 19. Distributions of the times that PIT-tagged lamprey were detected passing top-of-
ladder sites at Bonneville, The Dalles, John Day and McNary dams in 2006.
Discussion
General Comments. –The 2005-2006 Pacific lamprey studies were successful on several fronts. First, we demonstrated that HDX interrogation systems can be used to monitor lamprey passage at dams, to estimate reach-specific escapement, and to calculate passage times through portions of the Columbia-Snake Hydrosystem. These results show the potential of HDX systems to address a variety of lamprey management issues, including accurate enumeration of runs and system-wide survival evaluations. Second, the studies produced important new information about the migration ecology of Pacific lamprey in the Columbia River system. Novel results include: 1) a clear pattern of higher main stem reach conversion for larger lamprey; 2) possible among-population differences in migration timing; and 3) the possible influence of environmental conditions on upstream progression of lamprey.
Our results also highlight the substantial information gaps for Pacific lamprey in the
Columbia River basin. For example, almost half of the fish released in both years apparently did not pass Bonneville Dam and the fates of these fish were unknown. Similarly, the fates and

22
distributions of those that passed upstream sites were also unknown. Expansion of the HDX monitoring system could refine our understanding of lamprey passage at dams and through the Hydrosystem. However, other techniques will likely be needed to assess adult lamprey fates and distribution in reservoirs and major tributaries.
Escapement / Conversion. – Pacific lampreys are relatively poor swimmers and have
consistently had difficulty passing Columbia and Snake River dams. Lamprey radiotelemetry studies by Moser et al. (2005) and Cummings (2007) found dam conversion rates of 38-48% at Bonneville Dam, 50-82% at The Dalles Dam, and ≤ 55% for smaller samples at John Day, McNary and Ice Harbor dams. The early telemetry studies defined the dam passage metric, or passage efficiency, as the percent of lamprey that passed over each dam divided by the number that approached each dam. It was not possible to calculate a comparable metric in our HDX-PIT study because tailraces and fishway entrances could not be monitored for fish approach as in the telemetry studies. In the current results, the conversion rates for PIT-tagged fish at Bonneville Dam (53% for fish released in the makeup water channel in 2005 and 41% for fish released downstream in 2006) were calculated from the release sites. Despite different estimation techniques, the HDX-PIT results were generally consistent with or slightly higher than previous telemetry results at Bonneville Dam. Conversions from detection in a McNary fishway to the top of McNary Dam were 62-76% for the PIT-tagged fish, also comparable to estimates for radio-tagged fish (~62%, Cummings 2007) although monitoring sites again differed in the two studies.
It was not possible to calculate conversion rates for PIT-tagged lampreys at The Dalles and
John Day dams in 2006 because only top-of-ladders sites were monitored. However, conversion estimates between top-of-ladder sites at pairs of dams were 68% for the Bonneville-The Dalles and The Dalles-John Day reaches and 21% for the John Day-McNary reach in 2006. Each estimate was higher than the radiotelemetry estimates described in Moser et al. (2002b). Escapement of PIT-tagged fish past multiple dams was also higher than recorded previously for radio-tagged fish. About 6.5% of the PIT-tagged fish released in 2005-2006 were recorded at McNary Dam, versus about 3% for radio-tagged fish in 1997-2000 (Moser et al. 2002c). Conversion from the top of Bonneville Dam to McNary Dam was 12-16%. The apparent escapement differences between monitoring techniques may have arisen from several sources, including sample sizes, detection differences among techniques, differences in run composition across years, or differences in river environment across years. Radio tagging may also have affected lamprey passage more than PIT tagging, due to the cumulative effects of bearing relatively large transmitters (Moser et al. 2007), and more invasive surgery and longer handling times for radio-tagged fish. We note, however, that several studies have indicated minimal radio tagging effects (Close et al. 2003; Mesa et al. 2003).
The large PIT-tagged samples in 2005-2006 allowed us to assess within-season variability
in lamprey reach conversion. Several patterns emerged, including increasing conversion rates as the 2006 migration progressed in the Bonneville-The Dalles and The Dalles-John Day reaches and slightly decreasing conversion through the season for the John Day-McNary reach. Conversion rates from the top of Bonneville Dam to the top of McNary Dam oscillated within season without any apparent pattern. Explanations for within-season variability may include population effects (e.g., changes in the proportions of fish from different populations or in sex ratios), mortality effects (e.g., seasonal harvest or predation differences), and availability of olfactory cues needed for orientation, or environmental factors.

23
Dam-to-dam and longer reach conversion estimates are valuable for making generalizations about lamprey passage success and identifying potential problem areas. Such estimates could also eventually be useful for monitoring population trends. However, a more informative interpretation of conversion estimates will require a better understanding of the distribution and size of Pacific lamprey spawning populations in the Columbia basin. Pacific lamprey historically coincided spatially with anadromous salmonids in the basin (Close et al. 1995), but there has been little systematic study of current populations. Some distribution data have been gathered in a series of recent juvenile and adult studies in the Deschutes, John Day, Umatilla, Walla Walla, Tucannon, Clearwater and Grande Ronde rivers (Cochnauer and Claire 2002; Moser and Close 2003; Graham and Brun 2005; Robinson and Bayer 2005), but population size estimates are generally not available.
The PIT tag data from 2005-2006 suggests that a relatively large proportion of the run may
have entered tributaries between John Day and McNary dams (i.e., the John Day and Umatilla rivers). The relatively high conversions between Bonneville-The Dalles and The Dalles-John Day dams (~68%) suggest that more modest numbers of fish likely entered the Deschutes River and possibly tributaries to the Bonneville reservoir. Telemetry results in the Moser et al. studies indicated that ~25-30% of lamprey that passed The Dalles Dam entered the Deschutes River, but there was little apparent use of tributaries to the Bonneville reservoir in those studies. We are hesitant to extrapolate tributary use from the modest telemetry findings and suggest that better discrimination between mortality, harvest and tributary turn-off will be needed to fully interpret PIT-tag-based conversion estimates.
An important new result from the PIT tag data was that larger lampreys were significantly
more likely to pass through dam-to-dam and multiple dam reaches. This result was consistent in both years and did not appear to be related to migration timing as there were minimal size×timing correlations. Larger fish may have been more ‘successful’ migrants for physiological reasons (i.e., they were stronger swimmers or had greater energetic reserves) or because larger fish were disproportionately represented in upriver populations. Of these, a physiological explanation would be consistent with the hypothesis that poor lamprey passage success is related to excessive energy use during dam passage (e.g., Mesa et al. 2003). Even for strong swimmers like salmonids, the substantial energetic demands of passing dams (Geist et al. 2000; Brown et al. 2006) can lead to passage delays and eventual migration failure (Caudill et al. 2007). We would expect the costs to be higher for lamprey, but there has been little systematic study of the physiological costs of dam passage for the species. In a preliminary study, proximate analyses of lamprey sampled at Bonneville and McNary dams, estimated crude fat loss of ~25% over this migration reach (Cummings 2007). The costs may range considerably higher particularly given that larger lamprey appear to be far more likely to reach McNary Dam.
Passage Rates. – Median passage times for PIT-tagged lamprey from release at Bonneville
Dam (2005) or near Hamilton Island (2006) to the top of McNary Dam were 25 d and 37 d, respectively. These medians were 3-5 times longer than those recorded for radio-tagged summer Chinook salmon (O. tshawytscha) and sockeye salmon (O. nerka) migrating during the same season over approximately the same distance (Keefer et al. 2004; Naughton et al. 2005). Lamprey and salmonid behaviors are similar in that most fish appear to move quickly through reservoirs but pass relatively slowly at dams.
Lamprey passage times at dams were much longer than recorded for salmonids. In the
lamprey telemetry studies, median passage times at dams were 4-6 d at Bonneville, 2-4 d at

24
The Dalles and ~ 2 d at McNary dams (Moser et al. 2002b; Cummings 2007). Times in these studies were generally calculated from the first detection at a receiver in a fishway, thus excluding time fish initially spent in tailrace areas searching for passage routes. The PIT tag data from 2006 suggest that lampreys spent considerable time in the Bonneville tailrace, as the median passage from release to the top of Bonneville Dam was almost 10 d. We note that these estimates could be inflated if lampreys require long recovery times after handling and PIT tagging.
Because only top-of-ladder sites were monitored at The Dalles and John Day, passage
times for those sites and for the Bonneville and The Dalles reservoirs could not be determined. However, median times between top-of-ladder sites in these reaches (5.1 d, Bonneville-The Dalles and 4.1 d, The Dalles-John Day) suggest lampreys passed rapidly through the reservoirs. PIT-tagged lamprey moved relatively quickly through the John Day reservoir (from the top of John Day Dam to the inside of a McNary fishway) in 2006, with a median rate of ~16 km●d-1 and with several fish migrating at rates > 30 km●d-1. These are rapid migration rates when compared to median (11 km●d-1) and maximum (21 km●d-1) rates recorded for radio-tagged lamprey in the John Day River (Robinson and Bayer 2005). Rates through the John Day reservoir were consistent with rates based on radiotelemetry recorded in the Bonneville and The Dalles reservoirs (Moser and Close 2003).
We did not find strong correlations between migration rates and fish size, either over single
dam-to-dam reaches or over longer reaches. However, there was evidence for increased passage rates later in the migration seasons and slower passage when Columbia River flow was high. Because flow decreased through the migrations in both years, separating migration timing and environmental effects was difficult. Robinson and Bayer (2005) found similar seasonal patterns of faster migration late in the season for lampreys in the John Day River. Similarly, Moser et al. (2004) found that passage rates at dams were positively correlated with both temperature and time of year at Bonneville and The Dalles dams. Faster migration when temperatures are higher and flows are lower is also consistent with salmonid migrations (Keefer et al. 2004).
Columbia River discharge in June 2006 was about 60% higher than in June 2005 (Figure
17), a difference that may partially explain the difference in median passage times between the two study years. Other factors may have been important. More fish were tagged early in the season in 2006, for example. There was also the possibility that some fish with long passage times were undetected in 2005. Nonetheless, the positive correlation between discharge when fish were released and passage time suggests that river discharge influences lamprey passage rates.
Overall, environmental conditions and lamprey size explained only small proportions of the
lamprey passage time variability within year. This suggests that other more fundamental factors were important. The underlying challenges associated with dam passage for lamprey — independent of, physiology river environment or migration timing — may be the primary driver behind the considerable passage time variability we recorded. Other factors, including for example nocturnal behaviors, population differences, or maturation status may also affect passage rates.
Migration Timing. – We identified some patterns in lamprey migration timing that should be considered in future studies. First, there appeared to be a distinct timing difference for lampreys that returned to the Snake River basin. This was especially evident in 2006, when fish detected at Ice Harbor Dam were collected at Bonneville Dam about 20 d earlier than fish that passed

25
McNary Dam but did not enter the Snake River. Lamprey counts at ladders from 2000-2006 also suggested that Snake River fish migrate relatively early among those that reached McNary Dam (i.e., passage distributions were earlier at Ice Harbor Dam than at McNary Dam). Lamprey migration timing-based differences among sub-basin populations have not been studied previously, but should probably be expected given different selective pressures for populations returning to different regions (assuming lamprey home). Temporal separation among populations has potential management implications and this aspect of lamprey passage in the Columbia River basin may warrant additional study.
Lamprey counts at dams (2000-2006) also suggest that migration timing is affected by river
discharge and/or temperature. Median passage dates at Bonneville and McNary dams varied by about three weeks in this short time series, with later migration in high-flow years. In other studies, high flow has typically been associated with cooler temperatures, so this effect may be temperature or flow related (or both). A better understanding of the factors affecting variability in run timing may help managers make effective operational decisions at dams, potentially improving passage efficiencies.
Our data indicate that some proportion of the lamprey winters in the Columbia River main
stem before entering spawning tributaries in the spring. Unlike overwintering steelhead, some of which move widely within the Hydrosystem during winter (Keefer et al. 2008), we hypothesize that lamprey are relatively sedentary during this period. There is very little information on this migration phase. The minimal winter movements of radio-tagged lampreys in the John Day River also suggest a prolonged period of inactivity (Robinson and Bayer 2005).
Detection Efficiency. – Our evaluation of the HDX system for detecting lamprey passage
was more qualitative than quantitative. Accurate detection efficiency calculations require redundancy in either tags (e.g., double tagging fish with PIT and radio tags) or redundancy in detection sites (Downing and Prentice 2002; Burke and Jepson 2006). Limited resources for this preliminary HDX evaluation resulted in unmonitored lamprey passage routes (especially in 2005) and no series of detection sites that could be used to directly calculate efficiencies as is done with the FDX systems in fishways.
Despite these limitations, the prototype HDX detectors used in 2005-2006 appeared to be
reasonably efficient. Using detections at upstream sites, top-of-ladder detection efficiencies were estimated to be 79-95% at Bonneville Dam, 69% at The Dalles Dam, 99% at John Day Dam, and 75-80% at McNary Dam. There was no way to evaluate efficiency at Ice Harbor Dam. These efficiencies are approximate. The estimates need to be adjusted higher for lampreys that passed via unmonitored routes (e.g., navigation locks) and the numbers that passed during system power outages (more common in 2005). Moreover, the number of fish that passed undetected and did not reach upstream sites is unknown. Given that relatively few lamprey were detected at all dams, this error is particularly difficult to quantify.
Differences in HDX efficiency among dams were largely the result of ladder design. For
example, the relatively narrow slots at the top of the John Day ladders were easily covered by HDX antennas: coverage was 100% using antennas that were 26 inches by 14 feet. In contrast, antennas needed to be approximately 16 feet by 12 feet to cover the much larger opening at the top of the McNary Dam north ladder. Fish passing in mid-channel rather than near the channel sides were significantly less likely to be detected at large openings. Other factors that reduced efficiency included interference from other devices and antenna design challenges.

26
Post 2006 Improvements. – Since the end of the 2006 field season, a number of
improvements have been made to the HDX antenna installations. These include antenna redundancy (i.e., the addition of antennas in sequence) at both ladders at The Dalles Dam, improved antenna locations, and the addition of shielding to reduce interference on and from other electronics at McNary and Ice Harbor dams. In addition, dataloggers have been replaced at all sites to increase reliability and reduce downtime. Because of potential interference with FDX readers, establishing 100% coverage for HDX readers will likely not be possible without significant design and construction work. However, the new compromise configurations should be highly efficient and will be an improvement on the 2005-2006 setups.
References Beamish, R. J. 1980. Adult biology of the river lamprey (Lampetra ayresi) and the Pacific
lamprey (Lampetra tridentate) from the Pacific coast of Canada. Canadian Journal of Fisheries and Aquatic Sciences 37:1906-1923.
Beamish, R. J., and C. D. Levings. 1991. Abundance and freshwater migrations of the
anadromous parasitic lamprey, Lampetra tridentata, in a tributary of the Fraser River, British Columbia. Canadian Journal of Fisheries and Aquatic Sciences 46:420-425.
Brown, R. S., D. R. Geist, and M. G. Mesa. 2006. Use of electromyogram telemetry to assess
swimming activity of adult spring Chinook salmon migrating past a Columbia River dam. Transactions of the American Fisheries Society 135:281-287.
Burke, B. J., and M. A. Jepson. 2006. Performance of passive integrated transponder tags and
radio tags in determining dam passage behavior of adult Chinook salmon and steelhead. North American Journal of Fisheries Management 26:742-752.
Caudill, C. C., W. R. Daigle, M. L. Keefer, C. T. Boggs, M. A. Jepson, B. J. Burke, R. W. Zabel,
T. C. Bjornn, and C. A. Peery. 2007. Slow dam passage in Columbia River salmonids associated with unsuccessful migration: delayed negative effects of passage obstacles or condition-dependent mortality? Canadian Journal of Fisheries and Aquatic Sciences 64:979-995.
Close, D., M. Fitzpatrick, H. W. Li, B. Parker, D. Hatch, and G. James. 1995. Status report of
the Pacific lamprey (Lampetra tridentata) in the Columbia River Basin. Portland, Oregon, Bonneville Power Administration: 1-35.
Close, D., M. Fitzpatrick, and H. W. Li. 2002. The ecological and cultural importance of a
species at risk of extinction, Pacific lamprey. Fisheries 27(7):19-24. Close, D. A., A. D. Jackson, B. P. Conner, and H. W. Li. 2004. Traditional ecological
knowledge of Pacific lamprey (Entosphenus tridentatus) in Northeastern Oregon and Southeastern Washington from indigenous peoples of the Confederated Tribes of the Umatilla Indian Reservation. Journal of Northwest Anthropology 38(2):141-162.
Cochnauer, T., and C. Claire. 2002. Evaluate status of Pacific lamprey in the Clearwater River
drainage, Idaho. Bonneville Power Administration, 2001 Annual Report, Portland, OR.

27
Cummings, D. L. 2007. Direct and indirect effects of barriers to migration – Pacific lamprey at McNary and Ice Harbor dams in the Columbia River basin. Master’s thesis. University of Idaho, Moscow.
Downing, S., and E. Prentice. 2002. Overview of performance of PIT-tag interrogation systems
for adult salmonids at Bonneville and McNary dams. Bonneville Power Administration, Report DOE/BP-00013411-1), Portland, OR.
Geist, D. R., R. S. Brown, V. I. Cullinan, M. G. Mesa, S. P. Vanderkooi, and C. A. McKinstry.
2003. Relationships between metabolic rate, muscle electromyograms and swim performance of adult chinook salmon. Journal of Fish Biology 63:970-989.
Gibbons, J. W., and K. M. Andrews. 2004. PIT tagging: simple technology at its best. Bioscience
54(5):447-454. Graham, J., and C. Brun. 2005. Determining lamprey species composition, larval distribution,
and adult abundance in the Deschutes River, Oregon, subbasin. Bonneville Power Administration, 2004-2005 Annual Report, DOE/BP-00009553-3, Portland, OR.
Gunckel, S. L., K. Jones, and S. E. Jacobs. 2006. Spawning distribution and habitat use of
adult Pacific and western brook lamprey in Smith River, Oregon. Corvallis, Oregon, Oregon Department of Fish and Wildlife: 1-21.
Keefer, M. L., C. A. Peery, T. C. Bjornn, M. A. Jepson, and L. C. Stuehrenberg. 2004.
Hydrosystem, dam, and reservoir passage rates of adult chinook salmon and steelhead in the Columbia and Snake rivers. Transactions of the American Fisheries Society 133:1413-1439.
Keefer, M. L., C. T. Boggs, C. A. Peery, and C. C. Caudill. 2008. Overwintering distribution,
behavior, and survival of adult summer steelhead: variability among Columbia River populations. North American Journal of Fisheries Management 28:81-96.
Kostow, K. 2002. Oregon lampreys: natural history, status, and analysis of management
issues. Oregon Department of Fish and Wildlife, Information report 2002-01, Portland, OR. Mesa, M. G., J. M. Bayer, and J. G. Seelye. 2003. Swimming performance and physiological
responses to exhaustive exercise in radio-tagged and untagged Pacific lamprey. Transactions of the American Fisheries Society 132:483-492.
Moser, M., A. Matter, L. Stuehrenberg, and T. Bjornn. 2002a. Use of an extensive radio
receiver network to document Pacific lamprey (Lampetra tridentata) entrance efficiency at fishways in the Lower Columbia River, USA. Hydrobiologia 483:45-53.
Moser, M., P. Ocker, L. Stuehrenberg, and T. Bjornn. 2002b. Passage efficiency of adult
Pacific lampreys at hydropower dams on the lower Columbia River, USA. Transactions of the American Fisheries Society 131(5):956-965.
Moser, M. and D. Close. 2003. Assessing Pacific lamprey status in the Columbia River basin.
Northwest Science 77(2):116-125.

28
Moser, M., D. Ogden, S. McCarthy, and T. Bjornn. 2003. Migration behavior of adult Pacific lamprey in the lower Columbia River and evaluation of Bonneville Dam modifications to improve passage, 2001. Seattle, Northwest Fisheries Science Center, National Marine Fisheries Service: 50.
Moser, M.L, R.W. Zabel, B.J. Burke, L.C. Stuehrenberg, and T.C. Bjornn. 2004. Factors
affecting adult Pacific lamprey passage rates at hydropower dams: using “time to event” analysis of radiotelemetry data. In Aquatic telemetry: advances and applications. M.T. Spedicato, G. Marmella, and G. Lembo (Eds.). FAO-COISPA, Rome.
Moser, M., D. Ogden, and C. Peery. 2005. Migration behavior of adult Pacific lamprey in the
lower Columbia River and evaluation of Bonneville Dam modifications to improve passage, 2002. Seattle, Northwest Fisheries Science Center, National Marine Fisheries Service: 59.
Moser, M., D. Ogden, D. Cummings, and C. Peery. 2006. Development and evaluation of a
lamprey passage structure in the Bradford Island auxiliary water supply channel, Bonneville Dam, 2004. Seattle, Northwest Fisheries Science Center, National Marine Fisheries Service..
Moser, M.L, D.A. Ogden, and B.P. Sandford. 2007. Effects of surgically implanted transmitters
on anguilliform fishes: lessons from lamprey. Journal of Fish Biology 71:1847-1852. Moser, M., L. Stuehrenberg, W. Cavender, S. McCarthy, and T. Bjornn. 2002c. Radiotelemetry
investigations of adult Pacific lamprey migration behavior: evaluation of modifications to improve passage at Bonneville Dam, 2000. Seattle, Northwest Fisheries Science Center, National Marine Fisheries Service: 78.
Naughton, G. P., C. C. Caudill, M. L. Keefer, T. C. Bjornn, L. C. Stuehrenberg, and C. A. Peery.
2005. Late-season mortality during migration of radio-tagged sockeye salmon (Oncorhynchus nerka) in the Columbia River. Canadian Journal of Fisheries and Aquatic Sciences 62:30-47.
Quintella, B. R., N. A. Andrade, A. Koed, and P. R. Almeida. 2004. Behavioural patterns of sea
lamprey's spawning migration through difficult passage areas, studied by electromyogram telemetry. Journal of Fish Biology 65:961-972.
Richards, J. E. and F. W. H. Beamish. 1981. Initiation of feeding and salinity tolerance in the
Pacific lamprey Lampetra tridentata. Marine Biology 63: 73-77. Robinson, T. C., and J. M. Bayer. 2005. Upstream migration of Pacific lampreys in the John
Day River, Oregon: behavior, timing, and habitat use. Northwest Science 79:106-119. Russell, J. E., F. W. H. Beamish, and R. Beamish. 1987. Lentic spawning by the Pacific
lamprey, Lampetra tridentata. Canadian Journal of Fisheries and Aquatic Sciences 44(2): 476-478.
Torgersen, C. E., and D. A. Close. 2004. Influence of habitat heterogeneity on the distribution of
larval Pacific lamprey (Lampreta tridentata) at two spatial scales. Freshwater Biology 49:614-630.