evaluation of crack propagation and post-cracking hinge
TRANSCRIPT

Evaluation of Crack Propagation and Post-cracking Hinge-typeBehavior in the Flexural Response of Steel Fiber Reinforced Concrete
Sahith Gali and Kolluru V. L. Subramaniam*
(Received July 28, 2016, Accepted March 23, 2017, Published online May 19, 2017)
Abstract: An experimental evaluation of crack propagation and post-cracking behavior in steel fiber reinforced concrete (SFRC)
beams, using full-field displacements obtained from the digital image correlation technique is presented. Surface displacements
and strains during the fracture test of notched SFRC beams with volume fractions (Vf) of steel fibers equal to 0.5 and 0.75% are
analyzed. An analysis procedure for determining the crack opening width over the depth of the beam during crack propagation in
the flexure test is presented. The crack opening width is established as a function of the crack tip opening displacement and the
residual flexural strength of SFRC beams. The softening in the post-peak load response is associated with the rapid surface crack
propagation for small increases in crack tip opening displacement. The load recovery in the flexural response of SFRC is
associated with a hinge-type behavior in the beam. For the stress gradient produced by flexure, the hinge is established before load
recovery is initiated. The resistance provided by the fibers to the opening of the hinge produces the load recovery in the flexural
response.
Keywords: steel fibers, toughness, crack opening, post cracking response, softening, fracture, digital image correlation.
1. Introduction
The use of steel fibers as discrete structural reinforcement inconcrete has been explored and even recommended in somecodes of practice. Considerable research has been performedon the fracture behavior of steel fiber reinforced concrete(SFRC). Available information suggests that while there is anominal increase in flexural strength compared to plain con-crete there is a significant increase in toughness (Gopalarat-nam et al. 1991; Gopalaratnam and Gettu 1995; Armelin andBanthia 1997; Barros and Figueiras 1999; di Prisco et al. 2009;ACI 544.1R-96 2006). In SFRC, fibers enhance the post-cracking behavior by providing crack bridging stresses andthus ensure stress transfer across the cracked sections (Tade-palli et al. 2015; Sorensen et al. 2014). Several factors thatinfluence the crack formation and crack growth include, typeof fibers, volume of fibers, the distribution and orientation offibers at the crack location (Gettu et al. 2005; Laranjeira et al.2012; Michels et al. 2013; Islam and Alam 2013; Abdallahet al. 2016; Adjrad et al. 2016).An understanding of the contribution of these fibers in
providing resistance to crack propagation and controllingcrack opening has been developed by combining fracturemechanics-based approaches with local information provided
by the high resolution experimental techniques. Opticaltechniques such as speckle pattern interferometry and Moireinterferometry have been used to investigate the fractureprocess zone in concrete and fiber reinforced concrete (ShahandOuyang 1991). The information from these techniques hasbeen used primarily to evaluate the localization and tough-ening mechanisms. The high resolution optical techniquesprovide information within a limited field of view. Theinformation from the local measurement is then applied to anumerical or analytical framework to relate the local materialbehavior with the global response. Digital image correlation(DIC) has emerged as a full-field optical technique, whichprovides adequate resolution of the local strains close to thecrack tip while providing far-field information. DIC has beenapplied successfully to obtain the cohesive interface fracturebehavior of the FRP-concrete bond (Ali-Ahmad et al. 2006;Subramaniam et al. 2007; Carloni and Subramaniam2010, 2013; Carloni et al. 2012). Limited number of applica-tion of DIC technique for studying the crack growth in fiberreinforced concrete have also been attempted (Robins et al.2001; Subramaniam et al. 2015).Several analytical formulations with different levels of
approximations have been proposed for predicting the loadresponse of concrete considering its post-cracking behavior.In most representations, the behavior of the crack and thefracture process zone is idealized within the geometricrelations imposed by geometry and loading (Hillerborg et al.1976; ACI 544.8R 2016). A convenient idealization of thefacture behavior of concrete is the cracked hinge model,where a hinge-type behavior is postulated for predicting theresponse of concrete in flexure (Stang and Olesen 1998;
Department of Civil Engineering, Indian Institute of
Technology Hyderabad, Hyderabad 502285, India.
*Corresponding Author; E-mail: [email protected]
Copyright � The Author(s) 2017. This article is an open
access publication
International Journal of Concrete Structures and MaterialsVol.11, No.2, pp.365–375, June 2017DOI 10.1007/s40069-017-0197-4ISSN 1976-0485 / eISSN 2234-1315
365

Olesen 2001). The non-linearity caused by the presence ofcrack is assumed to be confined within a hinge region offinite width and the stress bridging across the crack areconsidered in the form of a stress-crack separation rela-tionship. The hinge is connected to elastic beams at each endand the stress state in the elastic beam is the far-field stressgiven by the elastic beam theory. While the idealizationprovides adequate prediction of load response, direct vali-dation of the hinge-type behavior is not yet available.The focus of this paper is to study the crack propagation using
a high resolution full-field optical technique, which providessufficient accuracy of the local strain localization behavior andsufficient full-field view to allow the study of far-field response.An experimental investigation into the flexural response ofnotchedSFRCbeams is presented,where insights into the crackpropagation and post-cracking response in the composite areobtained using DIC. Insights into crack propagation and thepost cracking response are obtained by combining informationfrom both the near-field and far-field measurements. The sur-face displacements and strains are analyzed for evaluating thecrack growth in concrete in relation to the observed loadresponse inflexure. Themeasured crack opening at the tip of thenotchobtained from theDICmeasurement is comparedwith thecrack tip opening displacement obtained using a surfacemounted gauge. The influence of fibers at the different points ofthe flexural load response is evaluated in relation to the mea-sured crack length and profile.
2. Materials and Methods
Commercially available ordinary Portland cement con-firming to the requirements Grade 53 of Indian standard, IS12269 with specific gravity of 3.1 and fineness modulus of325 m2/kg was used for all concrete mixtures. Siliceous flyash conforming to the requirements of IS 3812-1 (2003) andIS 1727 (1967) with specific gravity of 2.5 and finenessmodulus of 320 m2/kg was used as supplementary cemen-titious material in concrete mixtures. Crushed sand with aspecific gravity of 2.67 and fineness modulus of 2.83 wasused as fine aggregate and crushed granite of specific gravityof 2.63 was used as coarse aggregate. Two different coarseaggregate fractions with maximum size in ranges of10–4.75 mm and 20–10 mm were blended in equal pro-portions for use in the concrete mix.The cementitious content of the concrete mix was fixed at
340 and 140 kg/m3 fly ash was used. The water-to-cemen-titious ratio equal to 0.48 and was kept constant in all mixes.In the concrete mixture fine aggregates were taken as 45% ofthe total aggregate volume fraction. One control mixture andmixtures with different dosage of hooked end steel fiberswere prepared from one batch of ingredients. The controlmixture contained no fiber. Fiber reinforced concrete (FRC)mixtures were prepared with fiber volume fractions (Vf)equal to 0.50 and 0.75% and are labelled as SFRC50 andSFRC75, respectively.150 mm Cubes and beams with dimensions 150 mm
(height) 9 150 mm (width) 9 500 mm (length) were cast
from each mixture. Concrete was prepared using a drummixer with a capacity of 0.25 m3. The ingredients were putinto the mixer in the decreasing order of sizes starting from20 mm coarse aggregate to cement. Dry mixing of theaggregates and cement was done for 2 min and then waterwas added gradually in the rotating mixer and allowed tomix for 5 min. During the mixing process, the walls andbottom of mixer were scraped well to avoid sticking ofmortar. Super plasticizer (Gelenium) was used to increasethe workability of freshly prepared fiber reinforced concrete.A consistent slump in the range 75–100 mm was maintainedfor all mixtures. Finally, the fresh concrete was placed inoiled moulds and compacted properly in three layers, eachlayer being tamped 35 times using a tamping rod andcompacted using needle vibrator. After the initial setting ofconcrete, the surface of the specimen was finished smoothusing a trowel. Immediately after casting, all specimens werecovered with wet burlap and plastic covers to minimizemoisture loss and stored room temperature, approximately25 �C. Specimens were demolded 24 h after casting andstored under water up to 28 days of age.The 28-day compressive strengths obtained from the
150 mm concrete cubes of the different mixtures evaluatedin this study are given in Table 1. An increase in the com-pressive strength with increasing fiber volume in SFRC isobserved.
2.1 Three-Point-Flexure TestThe test procedure adopted was consistent with the
guidelines given in EN 14651:2005 and consisted of testingprismatic specimens in a three-point bending configuration.Specimens were rotated 90� along the longitudinal axis sothat casting surface was on the back side during the flexuretest and a notch of 25 mm depth was introduced at the mid-span using a circular saw as per the guidelines given in EN14651:2005. The flexure test was conducted in crack mouthopening displacement (CMOD) control. The loading fixtureconformed to the requirements of EN 14651:2005. Thecorresponding deflection of the beam was measured usingthe rectangular jig clamped to the specimen at mid-depthdirectly over the supports. During the test, the crack tipopening displacement (CTOD) was also measured using aclip gauge mounted at the tip of the notch. A schematicsketch of the test setup is shown in Fig. 1. The notched beamwas tested with a span equal to 450 mm. The rate of increaseof the CMOD during the flexure test was controlled in twostages, at 0.05 mm/min for CMOD less than 0.1 mm and at
Table 1 Cube compressive strengths of concrete mixtures.
Specimen Mean compressivestrength (MPa)
SD (MPa)
Control 34.6 1.05
SFRC50 34.4 0.82
SFRC75 40.4 1.88
366 | International Journal of Concrete Structures and Materials (Vol.11, No.2, June 2017)

0.1 mm/min for CMOD greater than 0.1 mm. All the testswere ended when the CMOD reached a value of 4 mm. Sixspecimens were tested for each concrete mixture.
2.2 Digital Image CorrelationFor the use in image analysis, a sprayed-on speckle pattern
was created on the surface of the beam in a region close tothe notch. A uniform coat of white paint was applied of thesurface to provide a uniform background. The sprayed-onspeckle was created by spraying a black mist. During theflexure test, digital images of the specimen were capturedusing a high resolution camera (5 mega pixels). Uniformlight intensity was ensured across the surface of the cubeusing normal white light. The camera was fitted with a50 mm lens and was placed at a distance of 1 m from thespecimen surface. Calibration for the pixel size was per-formed using a graduated rule placed in front of the speci-men. From this measurement, the physical calibration wasestablished and was in the range of 12–14 pixels per mm. Areference image was captured in the undeformed state priorto the initiation of loading program. Images of the specimenwere captured at regular intervals during the test.DIC is a method based on digital image analysis, which
provides full-field, spatially continuous measurement ofdisplacements across the surface of the specimen. The sur-face displacements are obtained from correlation of therandom pattern of speckles between images of the specimenundergoing deformation and the specimen in the reference(undeformed) configuration. The speckle pattern represents arandom pattern, which gives a unique distribution of pixelgray level values. A two-dimensional displacement field wasobtained for all points on the surface from cross-correlatingthe image of the deformed specimen with the image of thespecimen in the reference configuration. Correlations andpattern identification is performed within small neighbor-hoods called subsets (Sutton et al. 1983, 1988; Pan et al.2009). In a given image, the pixel gray-levels in each subsetassociated with the random sprayed-on pattern gives aunique gray-level pattern, which differs from gray-leveldistribution in another subset. In the analysis, positionswithin the deformed image were mapped on to positions
within the reference subsets using second-order, two-di-mensional shape functions. Spatial domain cross-correlationwas performed to establish correspondence betweenmatching subsets in images of the reference and thedeformed states. Quintic B-spline interpolation of the grayvalues was used to achieve sub-pixel accuracy. The crosscorrelation analysis which maximizes the correlation coef-ficient between gray levels in the subsets in the reference anddeformed images of the digital images was performed usingthe VIC-2DTM software. Surface displacements and dis-placement gradients at each loading stage were calculated ateach subset center, by evaluating the shape functions andtheir partial derivatives at the center of the subset. For thesetup used in this study, the random error in the measureddisplacement is in the range of 0.002 pixels. Strains werecomputed from the gradients of the displacements.
3. Results
The load-CMOD responses of the control and the SFRCspecimens are shown in Fig. 2a. The load-CMOD responseclose to the peak is shown in Fig. 2b. There is an increase inthe peak load (identified as FL, the load corresponding tolimit of proportionality (LOP) as per EN 14651:2005) withincreasing Vf. There is softening in the load responseimmediately following the FL. In FRC specimens there is anincrease in the load carrying capacity with increasing crackopening after the softening load response. The load recoveryis initiated at a smaller value of crack opening displacementand a higher load is achieved during the load recovery onincreasing the Vf. The increase in the residual load carryingcapacity with increasing CMOD indicates that the steelfibers are effective in providing crack closing stresses withincreasing crack opening.The FL and corresponding CTOD from the control and the
SFRC specimens are tabulated in Table 3. The load in thepost-peak at which load recovery is initiated, identified asFCTODcrit and the corresponding CTOD, identified as CTODcrit
are also tabulated in Table 2. There are systematic changesin all values with an increase in the fiber volume content and
Fig. 1 Experimental setup for flexure test of notched specimens: a schematic sketch showing the placement of gauges;b schematic representation of the DIC setup for obtaining images from the front face during flexure test.
International Journal of Concrete Structures and Materials (Vol.11, No.2, June 2017) | 367

the observed change in the mean values are outside the rangeof scatter obtained from one group. The CTODcrit provides aqualitative measure of the crack opening when the loadrecovery is initiated. Increasing the fiber volume contentincreases the resistance to crack opening, thereby resulting inan earlier deviation from the descending portion of the loadresponse seen in control specimens. Thus, at larger volumefractions, the fibers are effective at a smaller crack opening.The available data indicates that load recovery is initiatedafter a CTOD value of 250 lm and 175 lm for 0.5 and0.75% fiber volume contents, respectively.The results of the notched tests were analyzed using the
procedure given in of UNI 11039-2. The first crack flexuralstrength (fIf), equivalent flexural strengths (feq(0-0.6),feq(0.6-3)) were evaluated. In the current study the flexuraltests on notched beams were performed as per EN 14651(2005), which recommends a three-point bending configu-ration. The UNI 11039-2 standard formulae were developedfor four-point bending configuration. The first crack nominalstrength, fIf and the equivalent flexural strengths were cal-culated using modified formulae, where a factor of 1.5 wasintroduced as shown below.
fIf ¼1:5 � FL � lb � ðh� a0Þ2
ðMPaÞ; ð1Þ
feqð0�0:6Þ ¼1:5 � l
b � ðh� a0Þ2� U1
0:6ðMPaÞ; ð2Þ
feqð0:6�3Þ ¼1:5 � l
b � ðh� a0Þ2� U2
2:4ðMPaÞ; ð3Þ
where b (150 mm), h (150 mm), l (450 mm) and a0 (25 mm)are the width, the length, the height and the notch length,respectively. U1 and U2 are given by the area under load-CTOD (F(CTOD)) response as shown below
U1 ¼Z 0:6
0FðCTODÞ � dðCTODÞ; ð4Þ
U2 ¼Z 3
0:6FðCTODÞ � dðCTODÞ: ð5Þ
The equivalent flexural strengths for the control and theSFRC beams are shown in Table 3. It can be seen that thereis an increasing trend in the first crack strength withincreasing fiber content. The values of feq(0-0.6) and feq(0.6-3)
show clear improvement on increasing the Vf from 0.5 to0.75%.
3.1 Results of Digital Image AnalysisContours of strain in the X-direction (exx) at distinct points
on the load response of an SFRC50 specimen are shown inFig. 3. A subset size of 35 pixels was used for the analysis.The load points are identified on the load-CMOD responseof the specimen in Fig. 3a. The exx at progressively larger
Fig. 2 Load-CMOD response from flexure tests a up to a CMOD = 3 mm; and b early response up to CMOD = 0.1 mm. Theaverage response of five beams is plotted with scatter bars indicating the range of variation at discrete values of CMOD.
Table 2 Load and CTOD measures from tests on notched beam.
Fiber type Vol. % FL (SD) kN CTOD at peak load(SD) lm
Mean FCTODcrit (stdev)kN
Mean CTODcrit (SD)lm
Control 13.8 (1.44) 22 (6.5)
SFRC50 0.5 15.92 (0.67) 28.5 (6.25) 11.54 (1.2) 257 (33.6)
SFRC75 0.75 17.03 (0.86) 25.1 (4.52) 13.77 (1) 174 (10.6)
Table 3 Strength values as per UNI 11039-2.
FL (kN) fIf (MPa) feq(0-0.6)
(MPa)feq(0.6-3)
(MPa)
Control 13.78 3.97 – –
SFRC50 15.89 4.57 3.12 19.02
SFRC75 17.48 5.04 3.67 22.72
368 | International Journal of Concrete Structures and Materials (Vol.11, No.2, June 2017)

values of CMOD are shown in Figs. 3b–d. Strain localiza-tion is evident in the pre-peak load response and withincreasing CMOD, leads to the formation of a single crackemanating from the notch. The increase in the crack lengthcan clearly be identified with softening in the post peak loadresponse; as the crack propagates, there is a steady increasein the crack opening and an associated decrease in the load.The physical opening produced by the crack emanating fromthe notch resulted in a loss of correlation within a regioncorresponding to the subset size used for correlation centeredon the location of the crack.The contours of displacement in the X-direction, Ux at the
load point with CMOD = 0.037 mm using different subsetsizes within an area of interest located over the notch (shownmarked in Fig. 3c) are shown in Figs. 4a–c. The closeness ofdisplacement contours directly over the notch indicateslocalization. While using a smaller subset size results in thelocal variations being accurately represented, the influenceof local heterogeneities in the material becomes moreprominent. Since concrete is a heterogeneous material, ondecreasing the subset size, the measured observations con-tain significant contributions of local effects on the scale ofthe inhomogeneity within the material. Increasing the subsetsize has the effect of smearing out the sharp gradients in thedisplacements. The subset size of 35 pixels was found to
provide sufficient resolution of the local behavior close tothe notch and provide adequate accuracy in the far-fieldmeasurements. A conservative estimate of the resolution instrain obtained from the digital correlation was 5 le (Brucket al. 1989; Schreier and Sutton 2002).The Ux, and the exx along length of the member on a
horizontal line with fixed Y coordinate located at a distanceequal to 37 mm above the bottom face of the beam and12 mm above the tip of the notch at different points in theload response (in Fig. 3a) are shown in Fig. 5. The Ux awayfrom the notch, as X increases from -75 mm, exhibits asteady increase with the X coordinate. The stress concen-tration produced by the notch and subsequent crack propa-gation associated with increasing CTOD produce sharpgradients in Ux within a small region close to the notch(values of X close to zero). In the far-field, away from theregion of high displacement gradients, Ux varies linearlywith a slope which is nominally constant. The magnitudes ofdisplacements in the far-field region are proportional to themagnitude of applied stress. The variation of exx with X,along the line shows a sharp increase in the magnitude ofstrains to values significantly higher than the far field valueswithin the region of large displacement gradient close to thenotch, indicating localization of strain. There is an increasein the magnitude of strain and there is also a sharper strain
Fig. 3 a Load CMOD response of SFRC specimen with Vf = 0.5%; Contours of exx at b Load Point 1 (CMOD = 0.014 mm);c Load Point 2 (CMOD = 0.037 mm), d Load Point 5 (CMOD = 0.3 mm).
International Journal of Concrete Structures and Materials (Vol.11, No.2, June 2017) | 369

gradient within the region of localization with increasingCTOD.The correlation coefficient at load points with CMOD values
equal to 0.3 mm, are shown in Fig. 6. The physical contour ofthe crack can be identified by the region with a loss of corre-lation. The physical separation in the material, produces a lossin correlation, which occurs within subsets which overlap withthe opening. From the physical calibration, the width of theregion associated with the loss of correlation is approximately0.4 mm. The correlations outside the region disturbed by thecrack were found to be within limits of acceptability.The effect of the finite subset size is to smear out the sharp
strain gradients. The influence of local areas where correla-tions are poor are also included in the local values of strain.The available resolution from the DIC technique, consider-ing the finite subset size does not allow for determiningfracture parameters using local displacement and strainmeasurements in regions with a physical crack. A procedure
Fig. 4 Contours of Ux at CMOD = 0.037 mm corresponding to different subset sizes: a subset size of 15 9 15 pixels; b subsetsize of 35 9 35 pixels; c subset size of 75 9 75 pixels.
Fig. 5 Variation of Ux and exx with varying X located at Y = 37 mm in SFRC specimen with Vf = 0.5% (load response shown inFig. 3): a Ux with X; b exx with X for different values of CMOD.
Fig. 6 Contours of correlation coefficient at Load Point 5(CMOD = 0.3 mm).
370 | International Journal of Concrete Structures and Materials (Vol.11, No.2, June 2017)
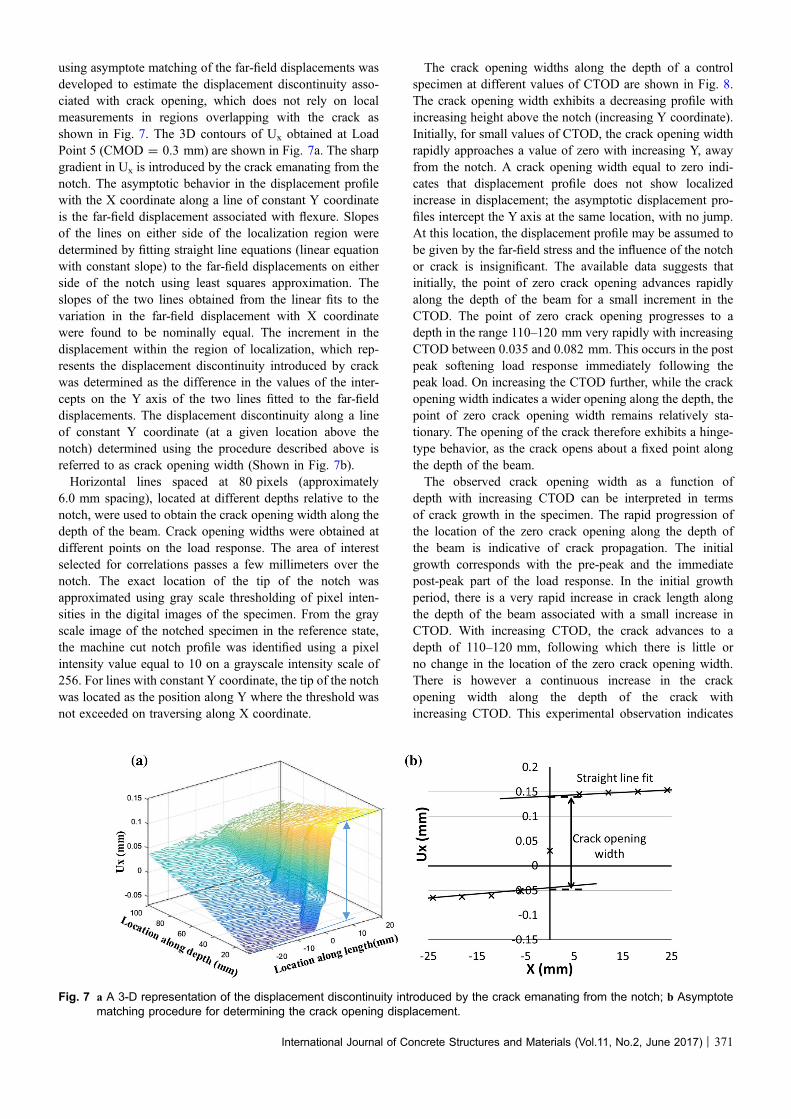
using asymptote matching of the far-field displacements wasdeveloped to estimate the displacement discontinuity asso-ciated with crack opening, which does not rely on localmeasurements in regions overlapping with the crack asshown in Fig. 7. The 3D contours of Ux obtained at LoadPoint 5 (CMOD = 0.3 mm) are shown in Fig. 7a. The sharpgradient in Ux is introduced by the crack emanating from thenotch. The asymptotic behavior in the displacement profilewith the X coordinate along a line of constant Y coordinateis the far-field displacement associated with flexure. Slopesof the lines on either side of the localization region weredetermined by fitting straight line equations (linear equationwith constant slope) to the far-field displacements on eitherside of the notch using least squares approximation. Theslopes of the two lines obtained from the linear fits to thevariation in the far-field displacement with X coordinatewere found to be nominally equal. The increment in thedisplacement within the region of localization, which rep-resents the displacement discontinuity introduced by crackwas determined as the difference in the values of the inter-cepts on the Y axis of the two lines fitted to the far-fielddisplacements. The displacement discontinuity along a lineof constant Y coordinate (at a given location above thenotch) determined using the procedure described above isreferred to as crack opening width (Shown in Fig. 7b).Horizontal lines spaced at 80 pixels (approximately
6.0 mm spacing), located at different depths relative to thenotch, were used to obtain the crack opening width along thedepth of the beam. Crack opening widths were obtained atdifferent points on the load response. The area of interestselected for correlations passes a few millimeters over thenotch. The exact location of the tip of the notch wasapproximated using gray scale thresholding of pixel inten-sities in the digital images of the specimen. From the grayscale image of the notched specimen in the reference state,the machine cut notch profile was identified using a pixelintensity value equal to 10 on a grayscale intensity scale of256. For lines with constant Y coordinate, the tip of the notchwas located as the position along Y where the threshold wasnot exceeded on traversing along X coordinate.
The crack opening widths along the depth of a controlspecimen at different values of CTOD are shown in Fig. 8.The crack opening width exhibits a decreasing profile withincreasing height above the notch (increasing Y coordinate).Initially, for small values of CTOD, the crack opening widthrapidly approaches a value of zero with increasing Y, awayfrom the notch. A crack opening width equal to zero indi-cates that displacement profile does not show localizedincrease in displacement; the asymptotic displacement pro-files intercept the Y axis at the same location, with no jump.At this location, the displacement profile may be assumed tobe given by the far-field stress and the influence of the notchor crack is insignificant. The available data suggests thatinitially, the point of zero crack opening advances rapidlyalong the depth of the beam for a small increment in theCTOD. The point of zero crack opening progresses to adepth in the range 110–120 mm very rapidly with increasingCTOD between 0.035 and 0.082 mm. This occurs in the postpeak softening load response immediately following thepeak load. On increasing the CTOD further, while the crackopening width indicates a wider opening along the depth, thepoint of zero crack opening width remains relatively sta-tionary. The opening of the crack therefore exhibits a hinge-type behavior, as the crack opens about a fixed point alongthe depth of the beam.The observed crack opening width as a function of
depth with increasing CTOD can be interpreted in termsof crack growth in the specimen. The rapid progression ofthe location of the zero crack opening along the depth ofthe beam is indicative of crack propagation. The initialgrowth corresponds with the pre-peak and the immediatepost-peak part of the load response. In the initial growthperiod, there is a very rapid increase in crack length alongthe depth of the beam associated with a small increase inCTOD. With increasing CTOD, the crack advances to adepth of 110–120 mm, following which there is little orno change in the location of the zero crack opening width.There is however a continuous increase in the crackopening width along the depth of the crack withincreasing CTOD. This experimental observation indicates
Fig. 7 a A 3-D representation of the displacement discontinuity introduced by the crack emanating from the notch; b Asymptotematching procedure for determining the crack opening displacement.
International Journal of Concrete Structures and Materials (Vol.11, No.2, June 2017) | 371

the formation of a hinge along the depth of the beam.After formation of the hinge there is a continuous openingof the crack about a fixed location along the depth of thebeam. The subsequent load response is therefore governedby the stress transfer across the crack. For control speci-men, the opening of the crack leads to a continuousdecrease in the load carrying capacity.A validation of the crack profile in the beam determined
using DIC was attempted using the measured crack tipopening displacement (CTOD) as a reference. The CTODwas measured at the tip of the notch using the surfacemounted clip gauge, which was precisely attached at the tipof the notch. The CTOD from the DIC measurement wasdetermined by extrapolating the crack opening width vsdepth line to zero depth (the tip of the notch) and is referredto as CTODDIC. The extrapolation was performed by fitting aline using a least square approximation to the points locatedwithin 30 mm from the bottom of the area of interest usedfor image correlation. This corresponds to data from fiveequi-spaced lines located 6 mm apart, which were used forgenerating the crack width profile. The CTODDIC valueswere obtained for different images captured at differentvalues of CTOD. A comparison of the load-CTOD responseobtained from the physical measurement using the surfacemounted LVDT and that obtained from DIC measurements isshown in Fig. 9. The response obtained using both CTODand CTODDIC show a good match, which provides valida-tion for the methodology for establishing crack profile widthusing image analysis.The crack opening widths as a function of depth for
different values of CTOD for an SFRC50 and an SFRC75specimens are shown in Figs. 10 and 11 respectively. Theresponse is nominally similar to that observed in controlspecimens. There is a rapid upward movement in thelocation of the zero crack opening width in the softeningpart of the load response immediately after the peak load.A rapid advance to a depth 110–120 mm above the notch,occurs up to crack opening displacements, which coincideswith the initiation of the load recovery. The load recoveryportion is associated with opening of the crack, withinsignificant crack advance. The crack therefore develops a
hinge-type mechanism, where the equilibrium is maintainedby the stress transfer across the crack provided by thefibers. For FRC specimen, the opening of the crack asso-ciated with the hinge action leads to an increase in the loadcarrying capacity. The results indicate that the crackpropagation in the matrix predominantly occurs in the post-peak softening response immediately following the peakload. The fibers provide resistance to opening of the hinge,once it is established. The resistance to crack openingwhich contributes to the opening of the hinge is due topullout of fibers from the matrix.A plot of the crack extension in relation to the CTOD is
plotted in Fig. 10. The physical crack tip was located basedon the correlation values exceeding a threshold value fol-lowing a procedure established previously (Carloni andSubramaniam 2010). The average value of correlationobtained from a region away from the crack located inregions X\-20 mm and X[ 20 mm was used as thethreshold value, which was found to be 0.0015. The regionselected for obtaining the reference for the threshold valuewas sufficiently removed from the crack to provide a rep-resentative value for the correlation index within the speci-men. Using this criterion, the physical location of the cracktip can be estimated to within the size of one subset. Depthof crack thus calculated for different images is plotted withagainst the corresponding CTOD in Fig. 12. The resultsconfirm that initially there is a very rapid extension of crackfor very small increase in crack opening. Subsequently, oncethe hinge is established, there is very small increment in the
Fig. 8 a Load-CTOD response of a control specimen; b Crack opening width as a function of height above the notch for differentvalues of CTOD.
Fig. 9 Comparison of CTODDIC and CTOD measured usingsurface mounted clip gauge.
372 | International Journal of Concrete Structures and Materials (Vol.11, No.2, June 2017)

crack depth for a large increase in crack opening. Theinfluence of steel fibers at 0.5% Vf produce a deviation in theresponse once the crack advances to a depth of 70 mm,which occurs close to the peak flexural load. This relates tothe small increase in the peak load in the flexural testresponse. At higher Vf equal to 0.75%, there is a significantdifference in the crack depth at all values of CTOD. There istherefore a significant difference in the peak load and thesubsequent flexural test response.
4. Summary and Findings
The available information from the different test tech-niques can now be combined to gain an insight into the crackpropagation and opening in steel fiber reinforced concrete in
flexure. Crack propagation in the FRC specimens is pri-marily associated with the decreasing load in the post-peakregion immediately following the peak load. An asymptotematching procedure which uses the far-field displacementsto estimate the displacement discontinuity produced by acrack was developed. In this procedure the inaccuracies inthe local measurements at the crack location introduced bythe finite subset size and the lack of correlation due to thephysical opening of the crack are not considered. Subsequentload recovery in flexural load response of SFRC beams isdue to hinge action associated with pullout of fibers. Theavailable information from DIC agrees with the standard testmeasures of feq(0-0.6) obtained from UNI 11039. Feq(0-0.6)
provides a measure of energy in the early part of the postpeak, which is associated with hinge formation and initialopening of the hinge. The feq(0.6-3) value is indicative of theenergy dissipated in pullout of fibers in a part of the loadresponse which is associated with opening of the hinge.The findings of the experimental investigation are sum-
marized below.
1. In SFRC loaded in flexure, the surface crack propagatesrapidly through the depth of the specimen for smallcrack openings. For Vf up to 0.75%, the resistanceprovided by steel fibers during the crack propagationstage is insufficient to prevent a softening in flexure.The fibers do influence the peak load and the rate ofsoftening in post-peak produced by crack propagation.
2. Fiber volume content plays a significant role inimproving the load recovery in the post-peak flexural
Fig. 10 Results from an SFRC50 specimen: a load-CTOD response of a typical specimen; b crack opening width as a function ofheight above the notch for different values of CTOD (in mm).
Fig. 11 Results from an SFRC75 specimen: a load-CTOD response of a typical specimen; b crack opening width as a function ofheight above the notch for different values of CTOD (in mm).
Fig. 12 Depth of crack extension with CTOD for control,SFRC50 and SFRC75.
International Journal of Concrete Structures and Materials (Vol.11, No.2, June 2017) | 373

response, which contributes to increasing toughness.The load recovery is associated with a hinge typebehavior. For the stress gradient produced by flexure,the hinge is established at a crack tip opening displace-ment before load recovery is initiated. After theformation of a hinge, the resistance to the crack openingis attributed to fiber pullout from the cementitiousmatrix. The recovery is initiated with sufficient numberof fibers crossing the crack, which provide the requiredresistance across the surface of the crack.
3. At fiber volume content equal to 0.75% there is asignificant decrease in the crack depth for a given cracktip opening displacement. This produces significantimprovements in the peak load and the post peak loadresistance response in flexure.
Acknowledgements
The authors would like to acknowledge support of theCenter of Excellence in Sustainable Development at I.I.T.Hyderabad, funded by the Ministry of Human ResourceDevelopment, India.
Open Access
This article is distributed under the terms of the CreativeCommons Attribution 4.0 International License (http://creativecommons.org/licenses/by/4.0/), which permits unrestricted use, distribution, and reproduction in any medium,provided you give appropriate credit to the originalauthor(s) and the source, provide a link to the CreativeCommons license, and indicate if changes were made.
References
544.1R-96. (2006). Report on fiber reinforced concrete. Farm-
ington Hills, MI: American Concrete Institute.
544.8R-16. (2016). Report on indirect method to obtain stress-
strain response of fiber-reinforced concrete (FRC), ACI
Committee 544 ACI 544.8R. Farmington Hills, MI: Amer-
ican Concrete Institute.
Abdallah, S., Fan, M., Zhou, X., & Le Geyt, S. (2016).
Anchorage effects of various steel fibre architectures for
concrete reinforcement. International Journal of Concrete
Structures and Materials, 10(3), 325–335.
Adjrad, A., Bouafia, Y., Kachi, M. S., & Ghazi, F. (2016).
Prediction of the rupture of circular sections of reinforced
concrete and fiber reinforced concrete. International Jour-
nal of Concrete Structures and Materials, 10(3), 373–381.
Ali-Ahmad, M., Subramaniam, K., & Ghosn, M. (2006).
Experimental investigation and fracture analysis of
debonding between concrete and FRP sheets. Journal of
engineering mechanics, 132(9), 914–923.
Armelin, H. S., & Banthia, N. (1997). Predicting the flexural
postcracking performance of steel fiber reinforced concrete
from the pullout of single fibers. ACI Materials Journal,
94, 18–31.
Barros, J. A., & Figueiras, J. A. (1999). Flexural behavior of
SFRC: Testing and modeling. Journal of Materials in Civil
Engineering, 11(4), 331–339.
Bruck, H. A., McNeill, S. R., Sutton, M. A., & Peters, W. H.
(1989). Digital image correlation using Newton-Raphson
method of partial differential correction. Experimental
Mechanics, 29(3), 261–267.
Carloni, C., & Subramaniam, K. V. (2010). Direct determination
of cohesive stress transfer during debonding of FRP from
concrete. Composite Structures, 93(1), 184–192.
Carloni, C., & Subramaniam, K. V. (2013). Investigation of sub-
critical fatigue crack growth in FRP/concrete cohesive
interface using digital image analysis. Composites Part B
Engineering, 51, 35–43.
Carloni, C., Subramaniam, K. V., Savoia, M., & Mazzotti, C.
(2012). Experimental determination of FRP–concrete
cohesive interface properties under fatigue loading. Com-
posite Structures, 94(4), 1288–1296.
Di Prisco, M., Plizzari, G., & Vandewalle, L. (2009). Fibre
reinforced concrete: new design perspectives. Materials
and Structures, 42(9), 1261–1281.
EN 14651:2005 (E). (2005). Test method for metallic fibre
concrete. Measuring the flxural tensile strength (limit of
proportionality (LOP), residual).
Gettu, R., Gardner, D. R., Saldivar, H., & Barragan, B. E.
(2005). Study of the distribution and orientation of fibers
in SFRC specimens. Materials and Structures, 38(1),
31–37.
Gopalaratnam, V. S., & Gettu, R. (1995). On the characteriza-
tion of flexural toughness in fiber reinforced concretes.
Cement & Concrete Composites, 17(3), 239–254.
Gopalaratnam, V. S., Shah, S. P., Batson, G., Criswell, M.,
Ramakishnan, V., & Wecharatana, M. (1991). Fracture
toughness of fiber reinforced concrete. Materials Journal,
88(4), 339–353.
Hillerborg, A., Modeer, M., & Petersson, P. E. (1976). Analysis
of crack formation and crack growth in concrete by means
of fracture mechanics and finite elements. Cement and
Concrete Research, 6(6), 773–781.
IS 1727. (1967). Methods of test for pozzolanic materials [CED
2: Civil Engineering], Bureau of Indian Standards, New
Delhi, India.
IS 3812-1. (2003). Specification for pulverized fuel ash, part 1:
For use as pozzolana in cement, cement mortar and con-
crete [CED 2: Cement and concrete], Bureau of Indian
Standards, New Delhi, India.
Islam, M. S., & Alam, S. (2013). Principal component and
multiple regression analysis for steel fiber reinforced con-
crete (SFRC) beams. International Journal of Concrete
Structures and Materials, 7(4), 303–317.
Laranjeira, F., Aguado, A., Molins, C., Grunewald, S., Wal-
raven, J., & Cavalaro, S. (2012). Framework to predict the
orientation of fibers in FRC: A novel philosophy. Cement
and Concrete Research, 42(6), 752–768.
Michels, J., Christen, R., & Waldmann, D. (2013). Experimental
and numerical investigation on postcracking behavior of
374 | International Journal of Concrete Structures and Materials (Vol.11, No.2, June 2017)

steel fiber reinforced concrete. Engineering Fracture
Mechanics, 98, 326–349.
Olesen, J. F. (2001). Fictitious crack propagation in fiber-rein-
forced concrete beams. Journal of Engineering Mechanics,
127(3), 272–280.
Pan, B., Qian, K., Xie, H., & Asundi, A. (2009). Two-dimen-
sional digital image correlation for in-plane displacement
and strain measurement: a review. Measurement Science &
Technology, 20(6), 062001.
Robins, P., Austin, S., Chandler, J., & Jones, P. (2001). Flexural
strain and crack width measurement of steel-fibre-rein-
forced concrete by optical grid and electrical gauge meth-
ods. Cement and Concrete Research, 31(5), 719–729.
Schreier, H. W., & Sutton, M. A. (2002). Systematic errors in
digital image correlation due to undermatched subset shape
functions. Experimental Mechanics, 42(3), 303–310.
Shah, S. P., & Ouyang, C. (1991). Mechanical behavior of fiber-
reinforced cement-based composites. Journal of the
American Ceramic Society, 74(11), 2727–2953.
Sorensen, C., Berge, E., & Nikolaisen, E. B. (2014). Investi-
gation of fiber distribution in concrete batches discharged
from ready-mix truck. International Journal of Concrete
Structures and Materials, 8(4), 279–287.
Stang, H., & Olesen, J. F. (1998). On the interpretation of
bending tests on FRC-materials. In H. Mihashi & K.
Rokugo (Eds.), Fracture Mechanics of Concrete Structures
(Vol. 1). Freiburg: Aedificatio Publishers.
Subramaniam, K. V., Carloni, C., & Nobile, L. (2007). Width
effect in the interface fracture during shear debonding of
FRP sheets from concrete. Engineering Fracture Mechan-
ics, 74(4), 578–594.
Subramaniam, K. V., Suraj, N., & Sahith, G. (2015). ‘‘Investi-
gation of crack propagation in macro-synthetic fiber rein-
forced concrete.’’ Proc., 5th International. Conf. on
Construction Materials: Performance, Innovations and
Structural Implications, 19–21 Aug.,Whistler.
Sutton, M. A., McNeill, S. R., Jang, J., & Babai, M. (1988).
Effects of subpixel image restoration on digital correlation
error estimates. Optical Engineering, 27(10), 271070.
Sutton, M. A., Wolters, W. J., Peters, W. H., Ranson, W. F., &
McNeill, S. R. (1983). Determination of displacements
using an improved digital correlation method. Image and
Vision Computing, 1(3), 133–139.
Tadepalli, P. R., Dhonde, H. B., Mo, Y. L., & Hsu, T. T. (2015).
Shear strength of prestressed steel fiber concrete I-beams.
International Journal of Concrete Structures and Materi-
als, 9(3), 267–281.
UNI 11039-2:2003. (2003). Concrete reinforced with steel
fibers—test method for the determination of early crack
strength and ductility indexes.
International Journal of Concrete Structures and Materials (Vol.11, No.2, June 2017) | 375